Article

Evaluation of Groundwater Quality and Contamination Using the Groundwater Pollution Index (GPI), Nitrate Pollution Index (NPI), and GIS

by
Hefdhallah S. Al-Aizari
1,*,
Fatima Aslaou
2,
Ali R. Al-Aizari
3,
Abdel-Basit Al-Odayni
4 and
Abdul-Jaleel M. Al-Aizari
5
1
Laboratory of Organic Chemistry, Catalysis and Environmental Unit, Department of Chemistry, Faculty of Science, Ibn Tofail University, Kenitra 14000, Morocco
2
Research Team on Health and Nutrition of Mother and Child, Faculty of Medicine and Pharmacy, Mohammed V University, Rabat 10500, Morocco
3
Institute of Surface-Earth System Science, School of Earth System, Tianjin University, Tianjin 300072, China
4
Department of Restorative Dental Science, College of Dentistry, King Saud University, P.O. Box 60169, Riyadh 11545, Saudi Arabia
5
Department of Chemistry, College of Science, King Saud University, Riyadh 11451, Saudi Arabia
*
Author to whom correspondence should be addressed.
Water 2023, 15(20), 3701; https://doi.org/10.3390/w15203701
Submission received: 15 September 2023 / Revised: 20 October 2023 / Accepted: 21 October 2023 / Published: 23 October 2023

Abstract

:
Groundwater is an essential and indispensable resource, meeting dire needs for drinking and irrigation purposes. The aim of this study is to assess the suitability of groundwater quality for drinking purposes. This evaluation will be conducted using the Groundwater Pollution Index (GPI), the nitrate pollution index (NPI), and the geographic information system (GIS) in Sidi Slimane, Morocco. In this study, a comprehensive collection of 20 samples was obtained from various locations for analysis and evaluation. Hadrochemical facies of this study area showed that out of 20 samples, 90% belonged to a type (Na+-K+-Cl-SO42−), while only 10% fell into a category (Ca2+-Mg2+-Cl-SO42−). The Groundwater Pollution Index values ranged from 0.7 to 10.8, with an average of 7.03; about 60% of the groundwater samples analyzed in this study area were classified as highly polluted and unsuitable for drinking purposes. Nitrate index values ranged from −0.9 to 10.5. Approximately 80% of the sampled sites require treatment before consumption. According to the Nitrate Pollution Index (NPI), it is essential to regularly monitor 16 well sites to prevent nitrate contamination resulting from human activities, including waste disposal in open areas and sewage infiltration. This study recommends raising farmers’ awareness of the use of slow-release natural fertilizers made from nitrogen rather than nitrogen-based fertilizers, reducing waste disposal by residents, and maintaining an appropriate sewage network to minimize sewage flow leakage. This study plays a vital role in identifying the polluted areas and highlighting the need to take appropriate measures to control the sources of pollution in this study area in order to protect water resources and ensure the provision of safe water to the local population.

1. Introduction

The availability of clean drinking water plays an important role in the advancement of civilization, ensuring human survival, and meeting the various requirements of humans, animals, and plants. Groundwater is generally of high quality, but interaction with geological formations and soil minerals can affect its quality [1,2,3,4].
In many parts of Morocco, groundwater is a major source of drinking water for agricultural and industrial purposes, and therefore the quality of the water is deteriorating day by day due to population increases, human activities, growth, increased demand, etc. The deterioration of groundwater (GW) quality as a result of seawater intrusion (SWI) poses a significant water security challenge in regions with limited water resources [1].
In regions with a semi-arid climate, the combination of population growth and economic activities poses a significant threat to groundwater resources. This threat is marked by a noticeable decline in water quality and a reduction in groundwater levels, which in turn endanger various forms of life [2]. Groundwater serves as a crucial component of the water supply system, serving the purposes of drinking, irrigation, and industrial usage in arid and semi-arid areas worldwide.
Due to inadequate rainfall and the amplified effects of climate change, numerous arid and semi-arid regions in North Africa find themselves with limited reserves of surface water. Consequently, groundwater has emerged as the primary and, often, the sole source of freshwater available for consumption, industrial processes, and agricultural activities in these regions. This growing reliance on groundwater has intensified due to the expanding population and the escalating demand for water for human needs. This situation has given rise to a host of challenges, as highlighted by researchers globally [3]. In Morocco, specifically, groundwater assumes a pivotal role in supplying drinking water and supporting irrigation. It has made a substantial contribution to the country’s economic growth and has served as a significant catalyst for its socio-economic development, health, and hygiene standards. Morocco’s geographical location places it in a semi-arid region with an arid climate transition. This study area, located in the western region of Morocco, is known for its flourishing agricultural abundance. Despite being located in a semi-arid region, it has a beautiful natural environment. However, the problems of population growth, urbanization, and human impact on nature pose a major threat to sustainable development in this region [5,6]. The region has natural wealth, arable land, and significant water resources, as well as varied ecosystems. The soil is diverse, with a high water retention capacity and humidity provided by the ocean mass [7]. The region also has groundwater resources at different depths, which allow it to meet irrigation needs that are potentially important assets for its socio-economic development. According to the Ministry of the Interior 2015 record [8], the main ones can be listed below: (i) the Gharb basin with an area of 390 km2, with 126 Mm3/year of renewable resources and a relatively balanced water balance, the one of hydrogeological interest on a regional scale characterized by a significant recharge by precipitation water; (ii) the Maâmora basin with an area of around 4000 km2 that constitutes a large reservoir of water of 134 Mm3/year of renewable resources; (iii) the Témara basin with a potential input of 17 Mm3/year, which covers an area of 350 km2 the depths relative to the ground oscillate between 10 m in the West and 30 m in the East; (iv) the Shoul Basin that is considered a natural extension of the Maâmora Basin, which covers an area of 200 km2 with potential contribution of 7.5 M m3/year and water depth varies between 20 and 60 m.
The water resources of the region’s aquifer are in continuous decline because of the withdrawals linked to irrigation. Pollution, soil erosion, and solid transport constitute the main constraints that stand in the way of the rational management and sustainable development of water resources in Morocco [9]. Rainfall contributions throughout the territory are estimated at 150 billion m3. The useful rain represents only 29 billion m3. The mobilizable hydraulic potential, under current technical and economic conditions, is estimated at 20 billion m3 of which 16 billion are from surface water and 4 billion are from groundwater [10].
The parameters for assessing the overall quality of groundwater differ from those of surface water and are specific to physicochemical, organic, and bacteriological pollution [11]. Water sources are facing significant pollution issues resulting from the discharge of urban and industrial wastewater, as well as the extensive use of fertilizers and pesticides. This pollution ranges from moderate to severe, posing a threat to the quality and sustainability of both surface water and groundwater resources [12]. The agricultural sector puts many pressures on the environment. Among them are the overexploitation of water resources and the deterioration of the quality of the soil and groundwater due to the use of pesticides, insecticides, rodenticides, fungicides, and herbicides that reduce biodiversity and food availability for certain links in the food chain [13].
According to the campaign carried out by the Sebo Aquifer Agency in 2007 on the quality of the groundwater, it was found that 45% of the stations covered by measurement in the Mamora were of low quality due to the high levels of nitrates, which exceed the maximum permissible value of 50 mg/L [14]. In a study conducted by El Khodrani et al. [6] in 2016, the focus was on examining the physico-chemical quality of groundwater in the rural commune of Sfafaa, located in Sidi Slimane, Gharb, Morocco, and noticed that more than 70.6% of the water is highly to extremely saline, especially in the upstream and downstream parts of the province. A concerning level of contamination by nitrates was observed in some zones [6]. Globally, elevated NO3 levels pose a significant concern in numerous aquifers; making them a primary threat to groundwater resources; particularly in areas with irrigation [4,5]. Consequently, safeguarding water resources from NO3 contamination becomes paramount, especially in arid and semi-arid regions where water resources are both scarce and heavily utilized [6,7]. Indeed, various studies have shown that excessive groundwater extraction and the application of nitrogen-based fertilizers contribute to groundwater pollution and heighten the risks to human health [8,9].
The objective of this study is to evaluate the appropriateness of groundwater in the designated study area for drinking purposes. This assessment is conducted using indicators such as the Groundwater Pollution Index, the Nitrate Pollution Index, and the utilization of Geographic Information System technology.

2. Materials and Methods
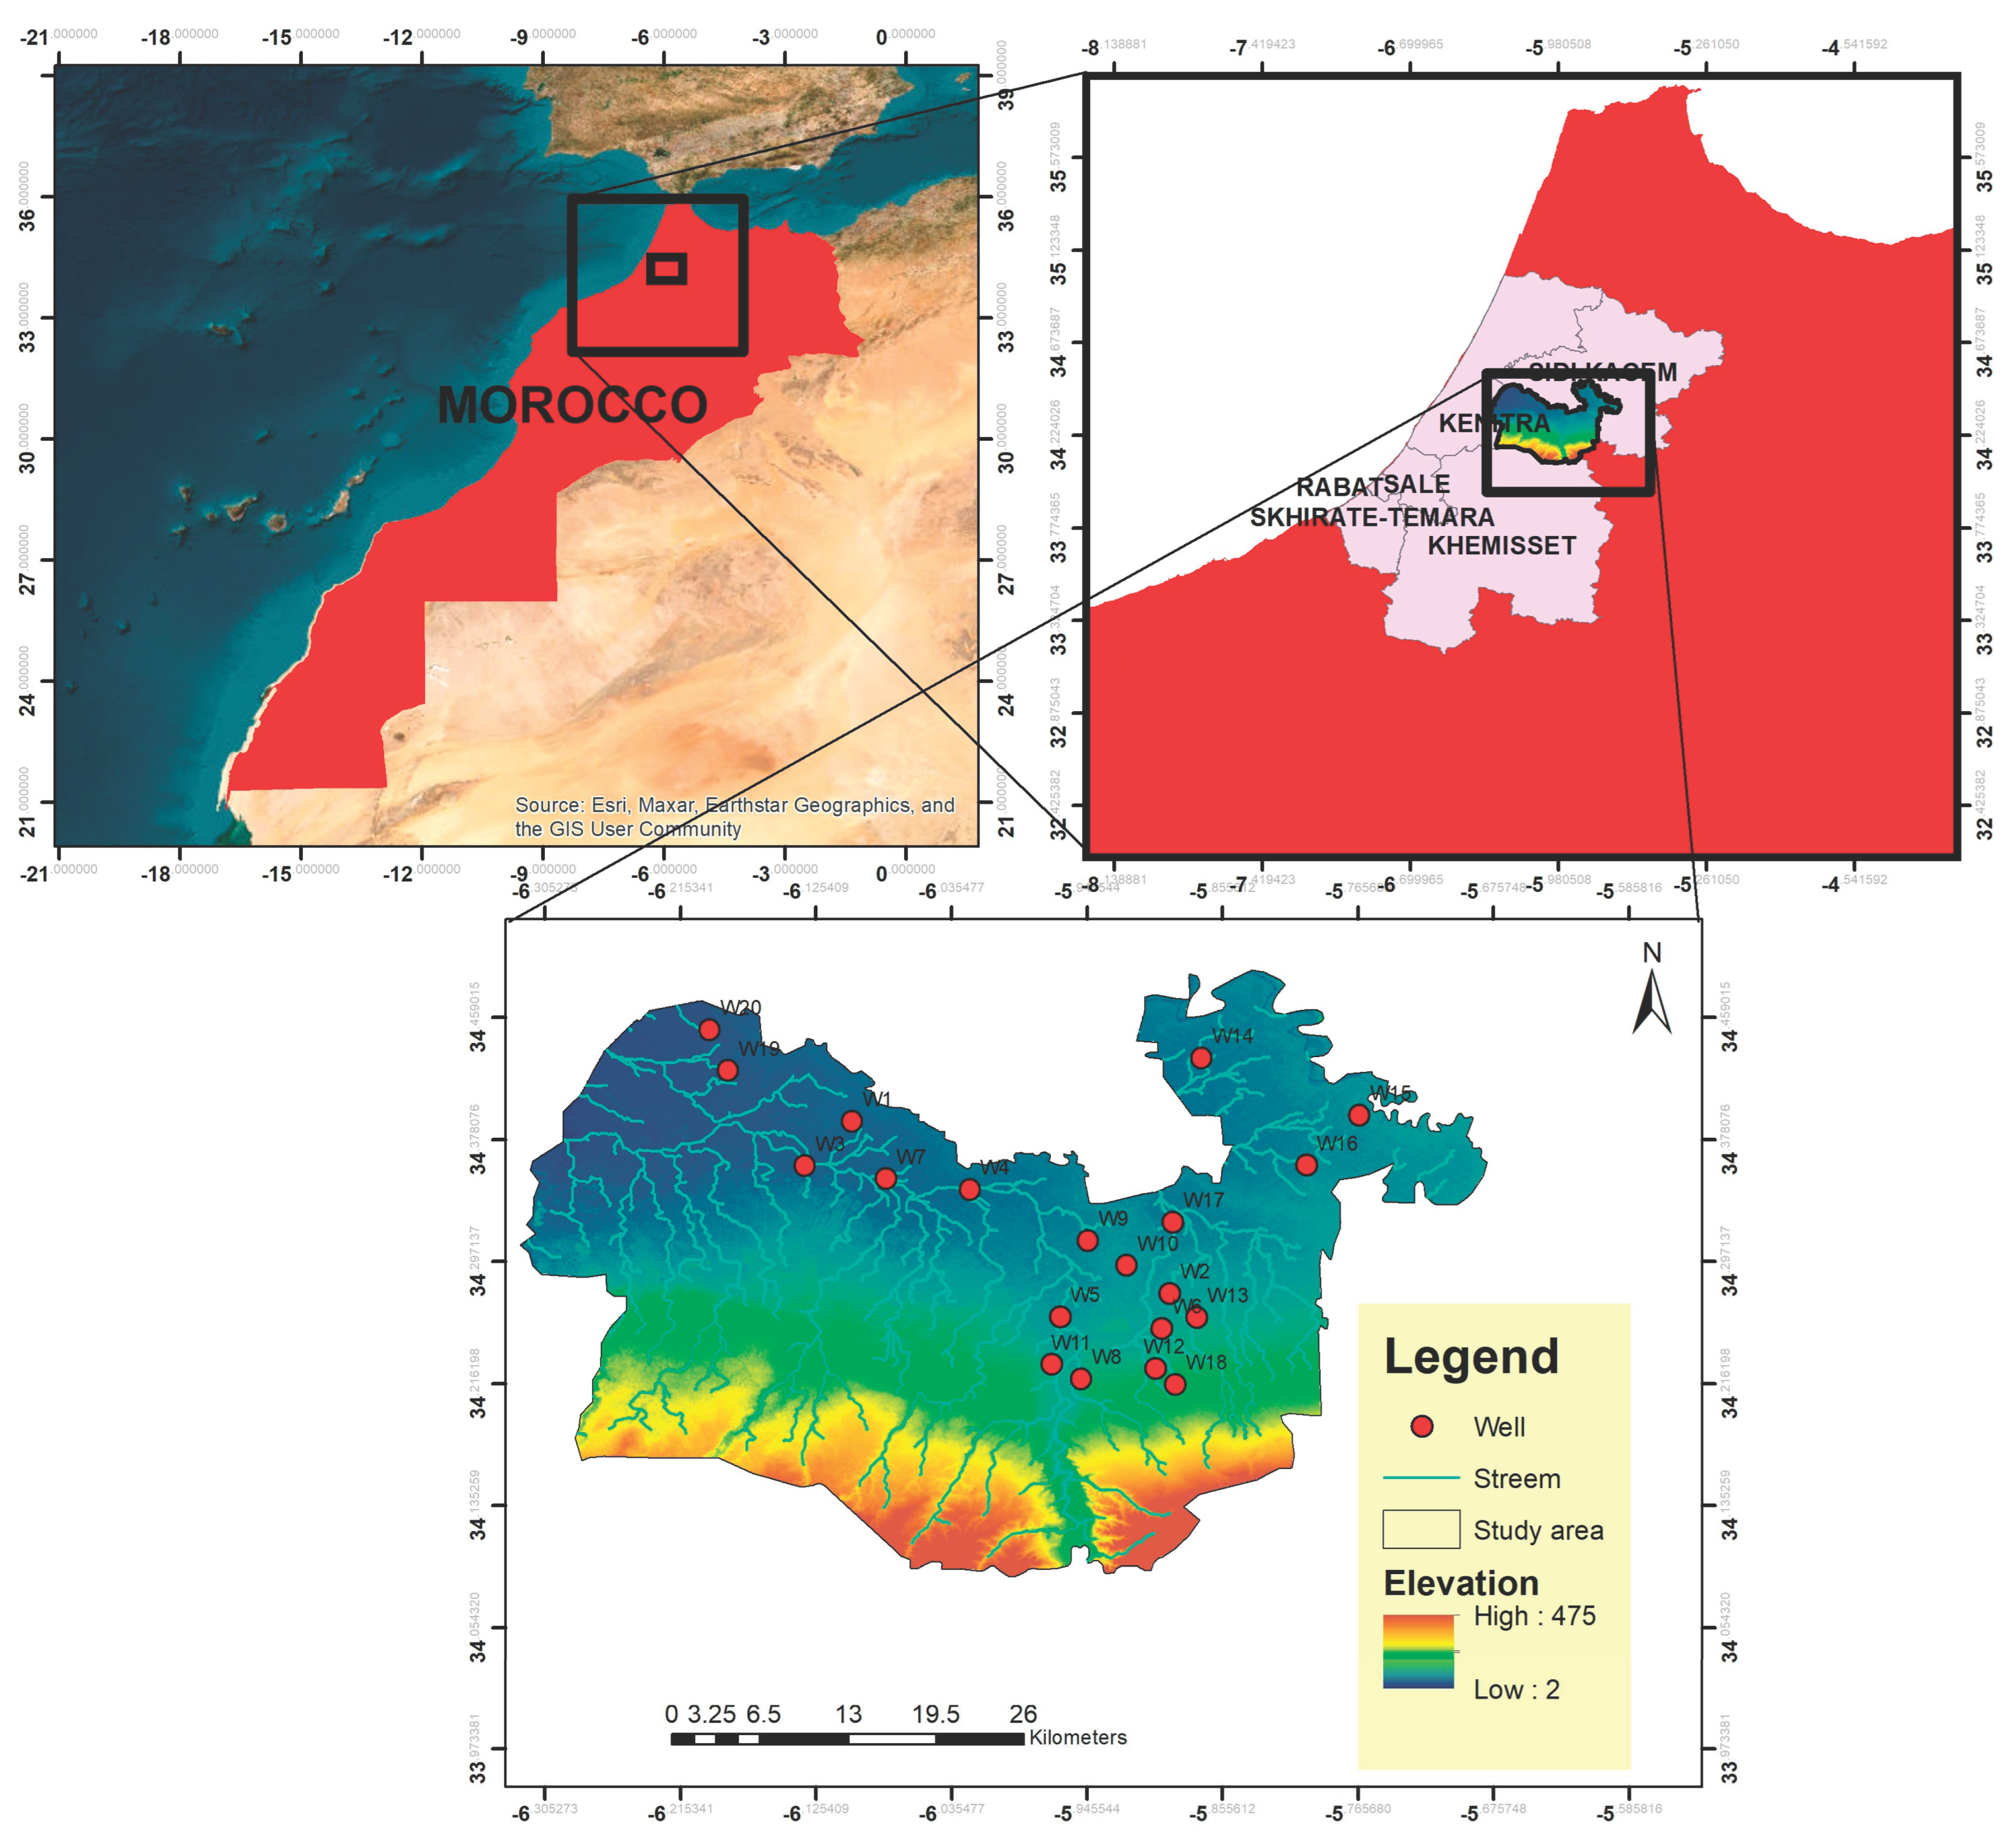
2.1. Study Area

This study area is situated in the northwestern region of the Kingdom of Morocco, specifically within the Rabat-Salé Kenitra region. It is depicted in Figure 1. This area encompasses a land area of 1517 km2 and is predominantly characterized by a semi-arid climate. The level of elevation above sea level differs from place to place in this area, and the maximum height is about 475 m (Figure 2). The general trend of surface water movement in the area (hydrology of this region) is towards the northwest, as shown in Map Figure 1 [8].
The Sidi Salsman region, located in the western Rharb pre-Rifean zone, exhibits distinct geological units: Mamora Basin: notable for Cretaceous deposits with thin limestone layers and marls resting on the Paleozoic basement. Paleozoic Block: A northern extension of the Moroccan Meseta, marked by strong folding and granitoid intrusions. Contains the “Kecbia” graben with 500–1000 m of Triassic deposits. Pre-Rifean Ridges: Located at the Hercynian Meseta border, showcasing varied deposits includes Cambrian sedimentary sequences in the Rharb-Mamora basement linked to granitoids. The Mio-Pliocene marine formations suggest an open deposition environment. Locally, east of the Beht River, find Lower Jurassic bioclastic sandstones and Upper Cretaceous sediments near Kenitra resting on Paleozoic or Triassic layers. Cretaceous deposits are also observed in the northern allochthonous complex [10,11].

2.2. Field and Laboratory Methods

A total of twenty well samples were carefully collected from diverse locations within the Sidi Slimane region. The procedures of the standards were followed, and the water samples were collected using clean and dry polyethylene bottles after a 10 min pumping process. These samples were then transported in portable coolers, maintaining a constant low temperature of 4 °C, to the laboratory. The physicochemical parameters of the groundwater samples were assessed using the methods specified in the American Public Health Association’s Standard Methods for the Examination of Water and Wastewater [15]. The physical parameters, pH and EC, were assessed using a pH meter (WTW Inolab) for pH measurements, and the measurement of electrical conductivity (EC) was conducted using the Thermo ORION 3 STAR conductivity meter. The chemical analyses encompassed the following elements: Calcium (Ca2+) and magnesium (Mg2+) concentrations were determined utilizing a complex meter with EDTA titration. Sodium (Na+) and potassium (K+) concentrations were ascertained through flame photometry using the JENWAY PFP7 instrument. Carbonate (CO32−) and bicarbonate (HCO3) levels were assessed by subjecting the sample to a solution of 0.02 N sulfuric acid along with phenolphthalein and bromocresol green indicator. Chloride (Cl−) concentrations were determined by titration with silver nitrate in the presence of a potassium chromate solution, while sulfate (SO42−) levels were examined using a spectrocolorimeter (V-1100). Nitrate (NO3) was analyzed through distillation using a distillation apparatus, specifically the VELP SCIENTIFICA UOK148.

2.2.1. Pollution Index of Groundwater (PIG)

The Groundwater Pollution Index (PIG), developed by Subba Rao in 2012, is a methodology used to assess groundwater quality. It evaluates the effect of specific variables on the overall quality of groundwater [16]. The PIG technique has been used effectively in monitoring drinking water quality in various locations, as evidenced by studies by Subba Rao et al. in 2018 and 2019. The calculation of the groundwater pollution index includes five steps [16,17].
Step 1:
Assigning Relative Weight (RW)
The first step involves assigning a relative weight (RW) to all parameters analyzed in this study. RW is based on two main factors: the importance of the parameter in determining the overall quality of groundwater and its relative impact on human health. In Subba Rao’s study, a scale of 1 to 5 was used, with the lower end being 1 for potassium (K+), which has the least effect, and RW 2 being assigned (Ca2+), (Mg2+), and (HCO3), while WR 4 is for EC pH and (Na+) and 5 for variables such as (NO3), (SO42−), and (Cl) (Table 1).
Step 2:
Calculating Weight Parameter (WP)
To determine the weight parameter (WP) for each individual parameter, the calculation consists of dividing the RW value of that specific parameter by the sum of all the RW values.
WP   = RW / RW
SC   = C n / WQS
GPI   = WP × SC
GPI   = GPI
Step 3:
Calculating of Concentration (SC)
The calculation for the status of concentration (SC) involves dividing the concentration (Cin) of each water quality parameter by its corresponding limit set by the drinking water quality standard (WQS). These standards are determined by organizations like the World Health Organization. (WHO, 2011).
Step 4:
Calculating of (PIG)
The groundwater pollution index (GPI) is calculated by multiplying the weight parameter (WP) by the status of concentration (SC) for each parameter.
Step 5:
Calculating (PIG) Quality
The groundwater pollution index is calculated by summing up the GPI values for all the parameters analyzed in each water sample.
According to Subba Rao (2012) [18], for the GPI classification of water, there are five categories (Table 2). Samples with GPI values < 1.0 are considered insignificant in terms of pollution. GPI values between 1.0 and 1.5 indicate low pollution, while values ranging from 1.5 to 2.0 indicate moderate pollution, GPI values from 2.0 to 2.5 indicate high pollution, and GPI values > 2.5 indicate very high pollution.
Table 1. Parameters were analyzed along with their respective values (RW), (WP), and WHO (2011) [19].
ParameterRWWPWHO (2011)
pH40.10256417
TH40.1025641300
EC40.1025641500
K+10.0256410312
Ca2+20.0512820575
Mg2+20.0512820545
Na+40.1025641200
SO42−50.12820513250
Cl50.12820513250
NO350.1282051350
Sum291
Units of all parameters (mg/L); RW: Relative Weight; WP: Weight Parameter.

2.2.2. Nitrate Pollution Index (NPI)

This is a very important indicator for determining water pollution with nitrates in polluted water resulting from human activities. It provides an indication of the level of nitrate pollution based on the nitrate concentration in wells compared to a health advisory value [20]. The formula to calculate the NPI is given in Equation (5).
NPI = C s HAV HAV
where NPI is the nitrate pollution index, Cs is the nitrate concentration in the well (mg/L), and HAV is the health advisory of nitrate for drinking water (mg/L), taken as 20 mg/L.
The calculation of Gibbs Ratio 1, Gibbs Ratio 2, Chloro-Alkaline Index (CAI), CAII, and Saturation Index (SI) was carried out using the equations given in Table 3 (Equations (6)–(10)).
In order to prepare and draw maps and the spatial distribution of the results, the Geographic Information Systems program (version 10.8.3) was used.

3. Results and Discussion

Table 4 displays the various parameters and their corresponding statistical descriptions that were utilized to assess the appropriateness of groundwater for irrigation purposes in the Sidi Slimane area.

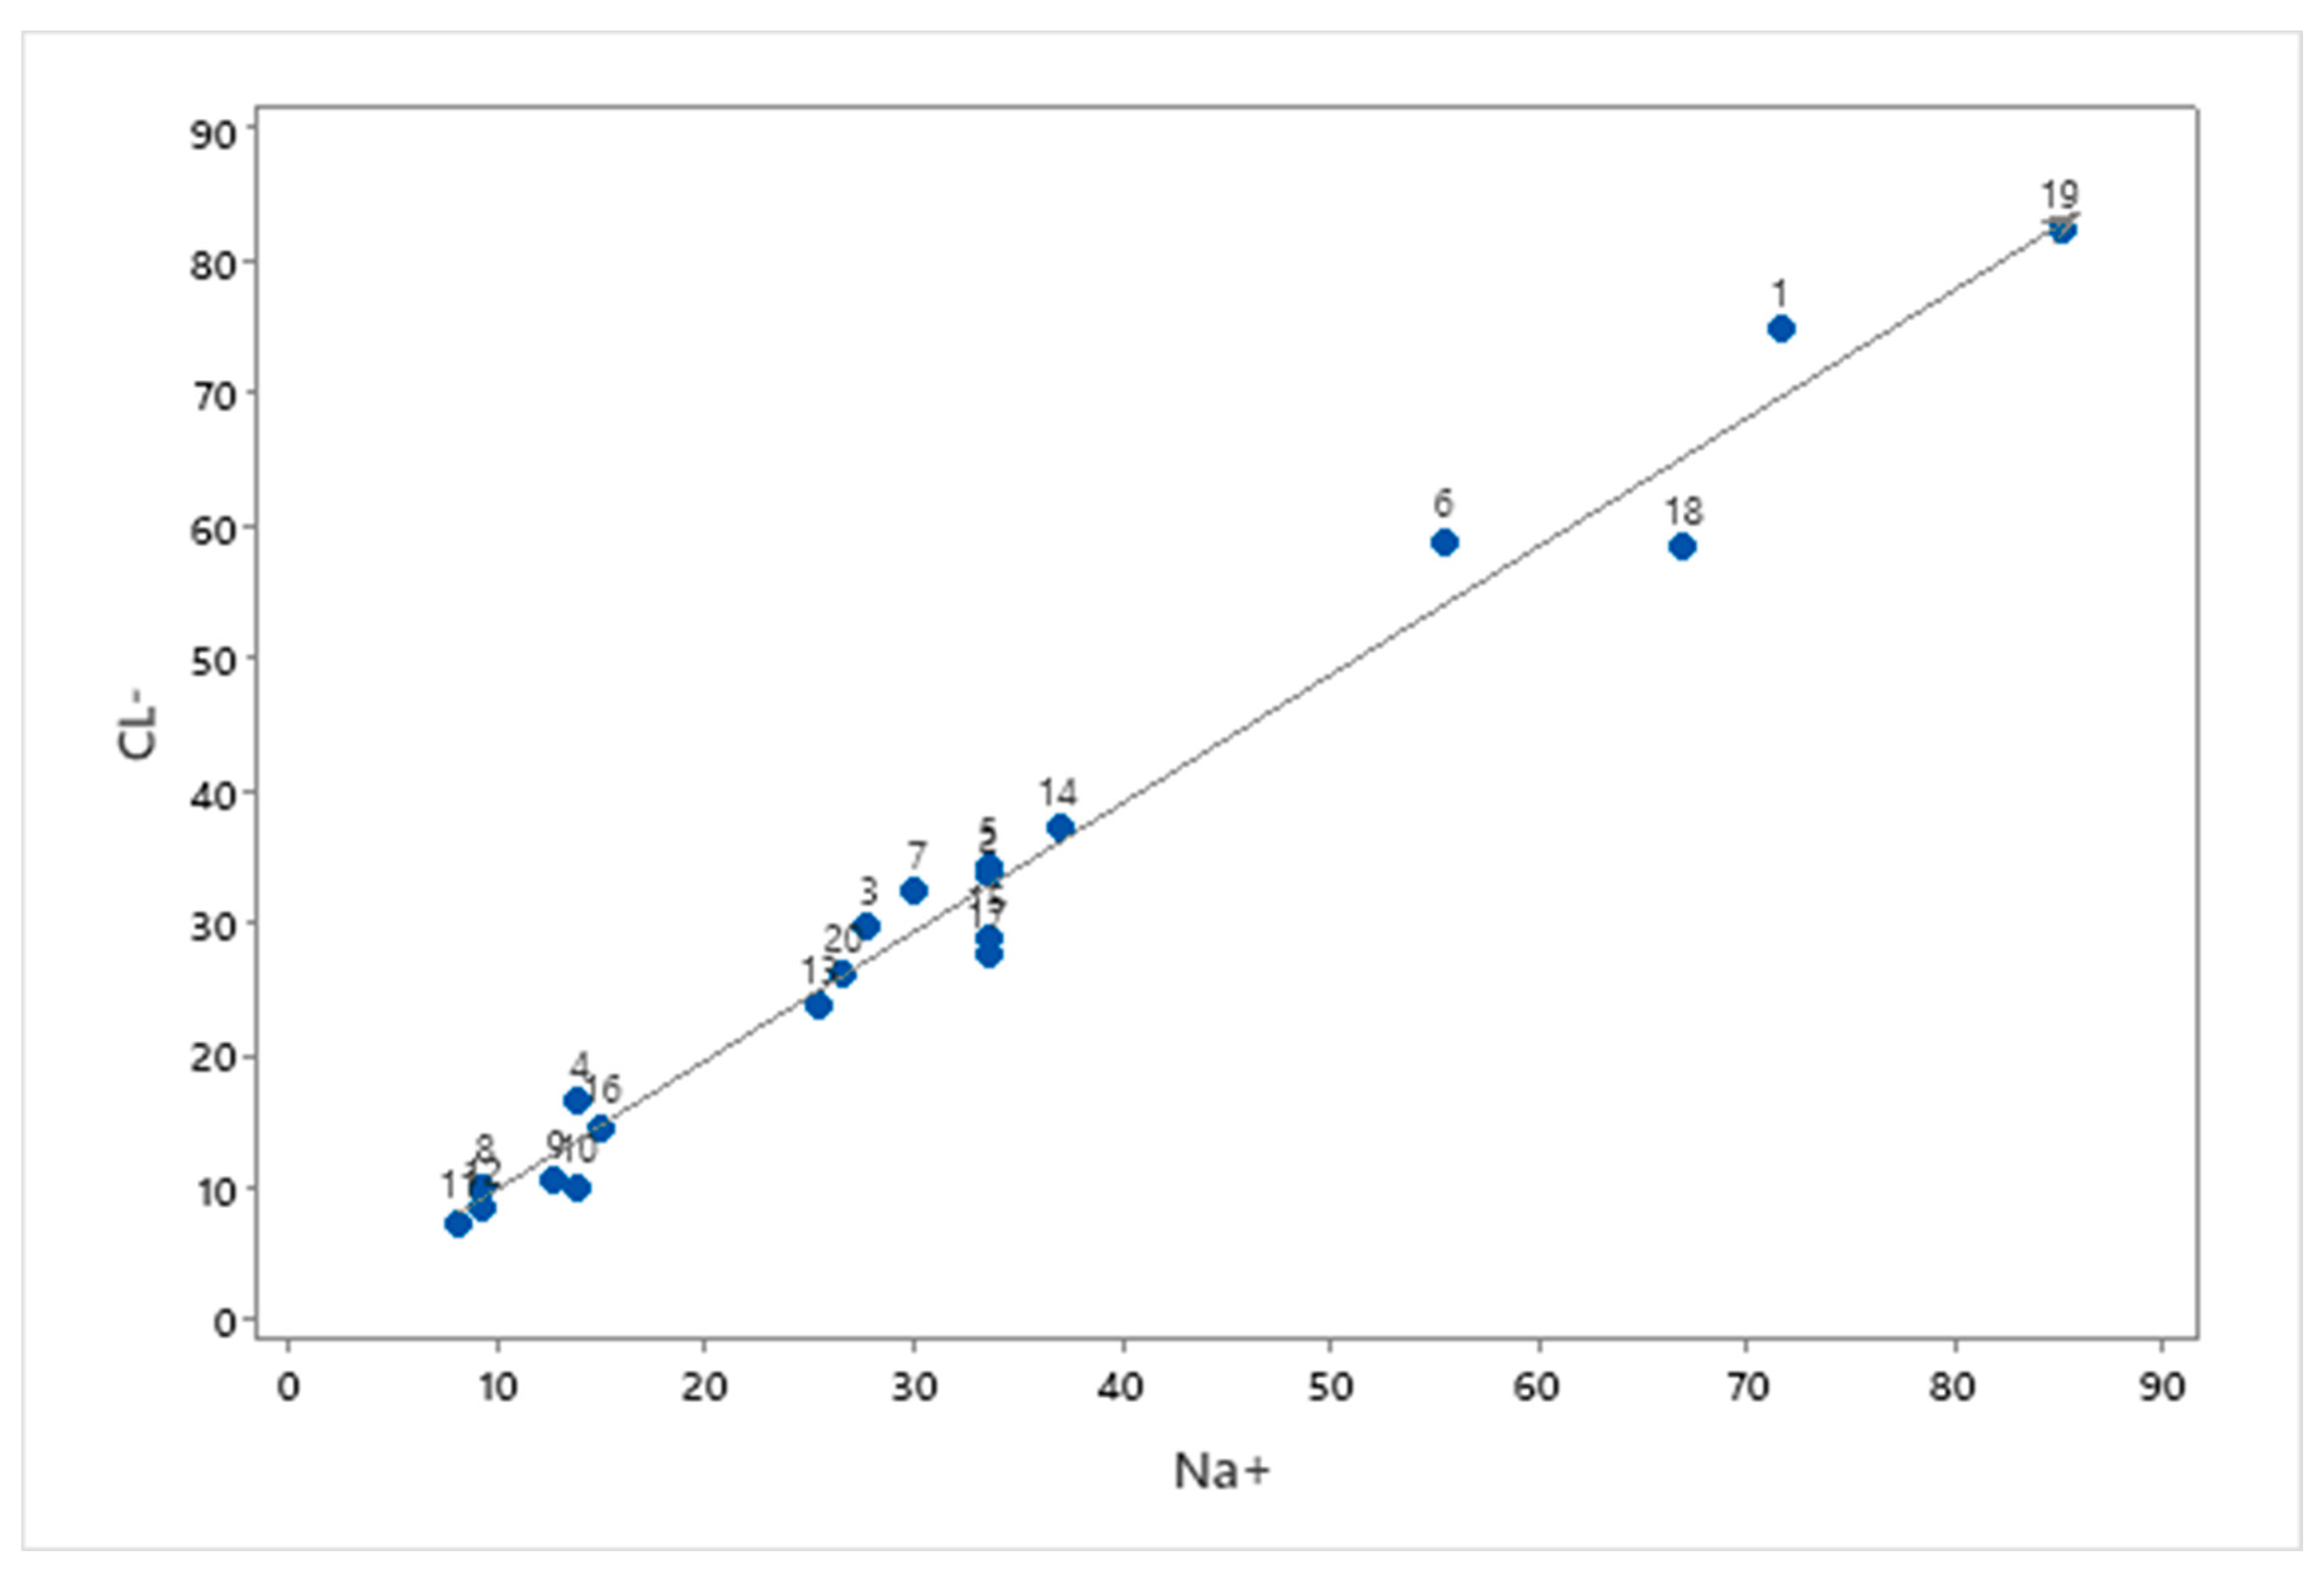
3.1. Groundwater Chemistry

Figure 2 shows that the chemical composition of the samples studied in this study area indicates that sodium is dominant in cations and chlorine is dominant in anions. This indicates the effect of the sea or salt water on the water source. The order of availability of ions in the wells is depicted in the figures below.

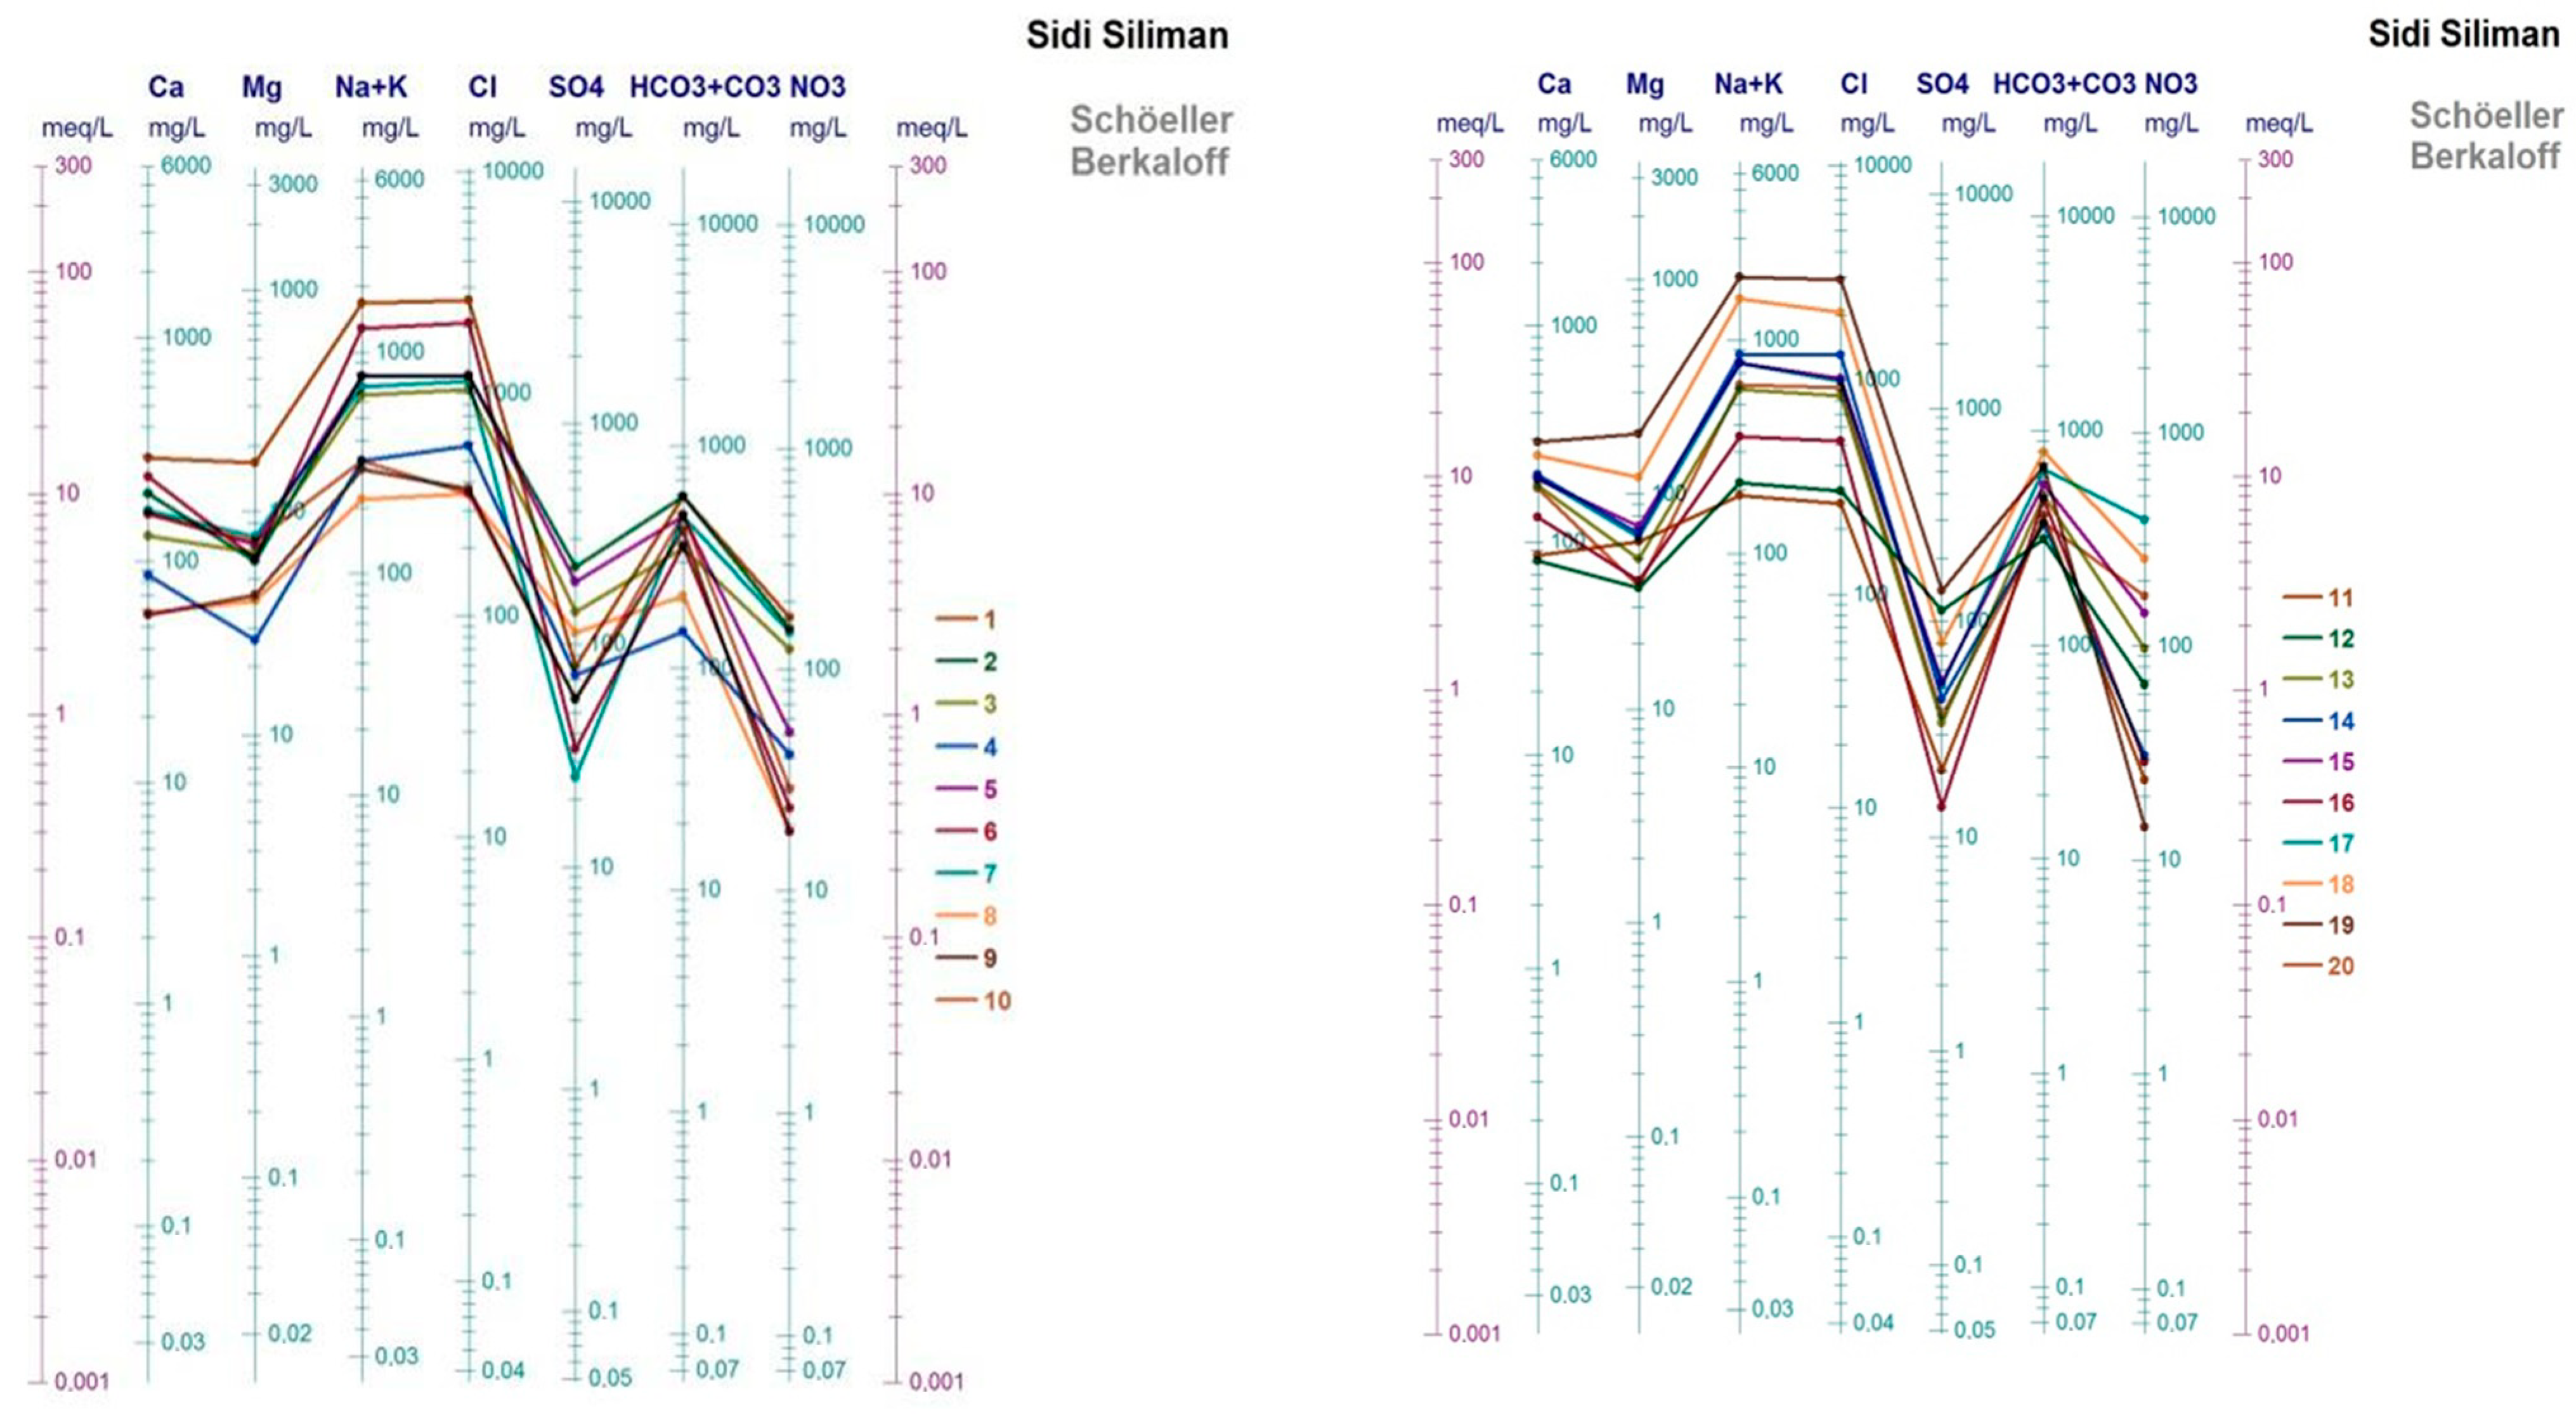
3.2. Hydrochemical Facies

The results of hydrochemical facies in Figure 3 indicate that out of 20 samples, 90% of them belong to the (Na+-K+-Cl-SO42−) type, while only 10% fall into the (Ca2+-Mg2+-Cl-SO42−) category. This suggests the absence of both permanent and temporary water hardness (class 1 and 5) in the groundwater of the Sidi Slimane region.

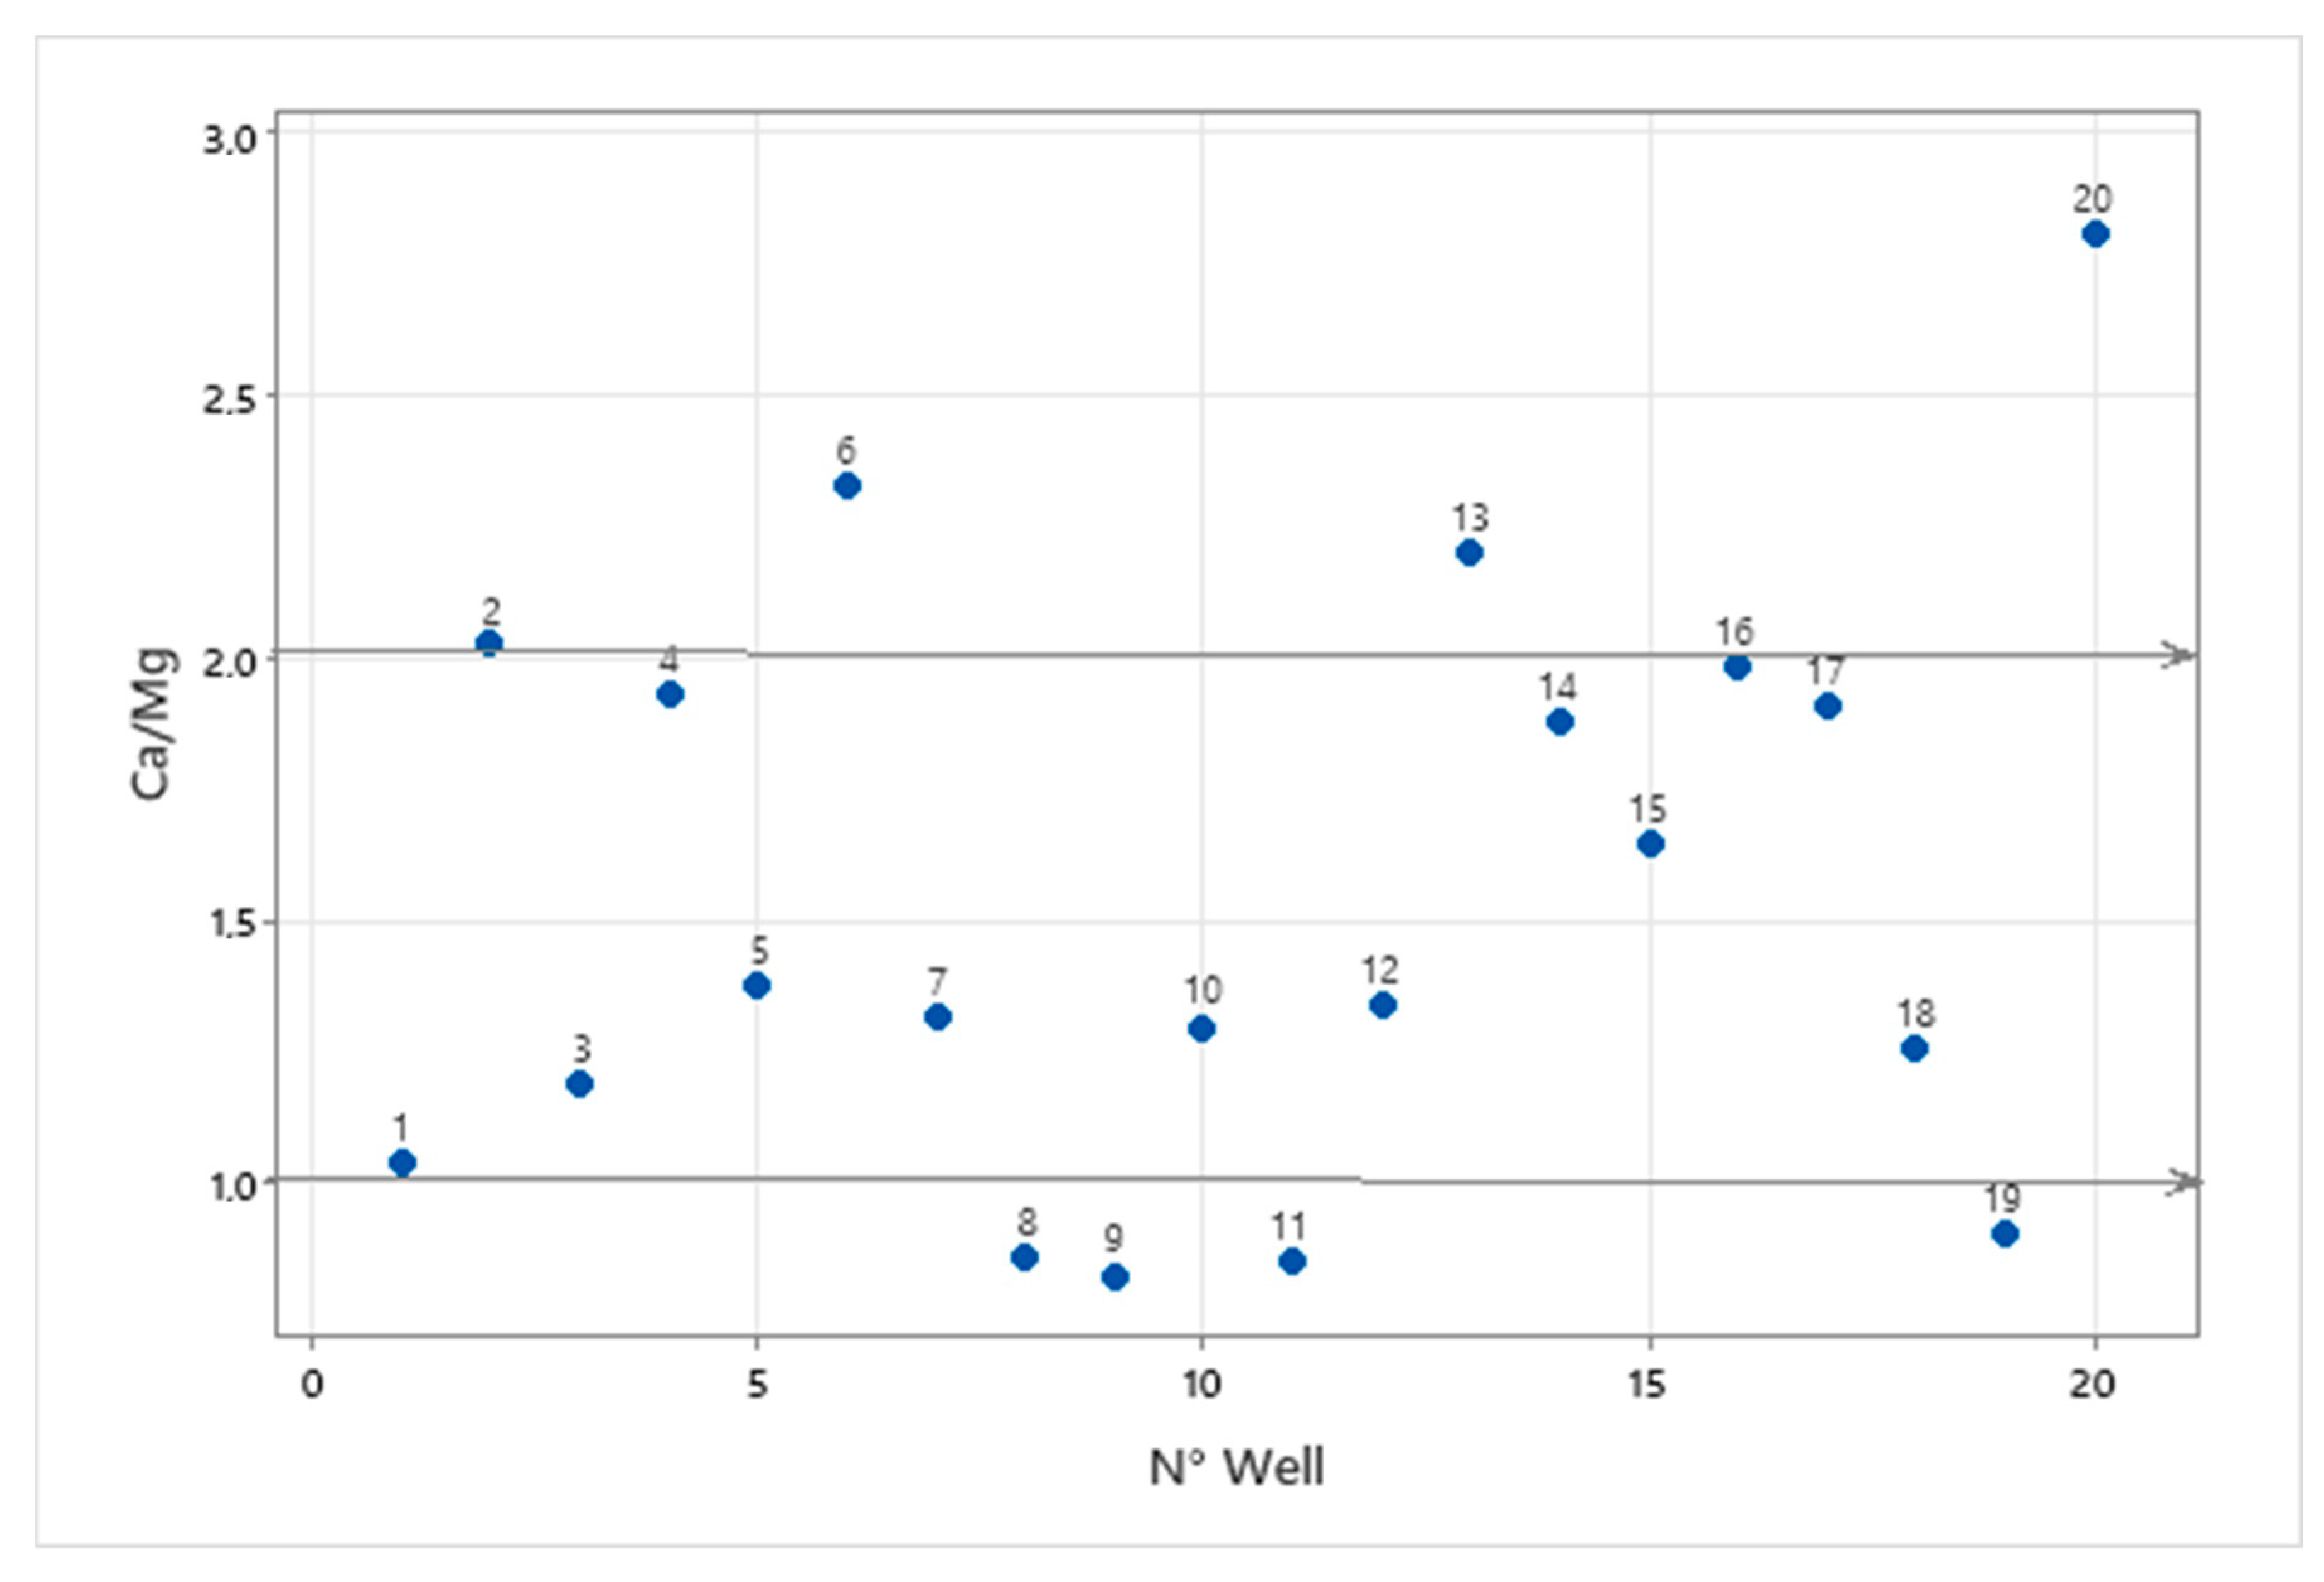
3.3. Water-Rock Interaction

To understand and characterize the effects of rock-water interaction, precipitation, and evaporation, use a Gibbs diagram to plot the chemical data of groundwater samples [21]. In this study area, Gibbs diagrams (Figure 4) showed that the majority of water samples fall into the dominant rock category, and the rest of the samples fall into the evaporation zone. This indicates the groundwater is affected by the chemical weathering of rocks.
The processes of mineral weathering and cation exchange during water-rock interaction can be traced by analyzing cation concentrations and ratios [24]. The relation between ((Ca2+ + Mg2+) and (SO42− + HCO3) meq/L) can provide information about the minerals that contribute to well mineralization. This is because the concentrations of these ions in groundwater are primarily controlled by the dissolution of minerals in the aquifer. The scatter plot for (Ca2+ + Mg2+) and (SO42− + HCO3) shown in Figure 5 revealed that the majority of the sample points lie below the equilibrium line, with two points above the line. It is shown that silicate weathering is the main contributor to bicarbonate ions in the studied waters. On the other hand, the two dots above the line indicate carbonate weathering as a contributing source.
The Ca2+/Mg2+ ratio in groundwater can provide insights into the dissolution of different types of rocks. According to Mayo & Loucks (1995) [25], the ratio of Ca2+/Mg2+ being less than 1 may indicate a more dominant contribution from the dissolution of dolomite, whereas a higher ratio may indicate a greater contribution from calcite dissociation. Additionally, a Ca2+/Mg2+ ratio greater than 2 may suggest the dissolution of silicate minerals into the groundwater [25]. The Ca2+/Mg2+ ratio in groundwater can provide information about the dissolution of minerals. A ratio between 1 and 2, which was observed in 65% of the samples (Figure 6), indicates the dissolution of calcite. A higher ratio than 2, observed in 15% of the samples, suggests the contribution of silicate minerals to the groundwater through the dissolution of calcium and magnesium. Additionally, 4 samples (around 2.94%) had a Ca2+/Mg2+ ratio < 1, which shows the dissolution of dolomite.
Figure 7 shows that some samples in the dataset cluster along the 1:1 decay line of halite, indicating that these samples are of halite decay origin. However, there are some groundwater samples located below and above the aquiline that show a clear dominance of a sodium ion over a chloride ion. This suggests that the source of these ions is something other than the dissolution of halite. In addition, some samples show the dominance of chloride over sodium ions. This may be due to the removal of Na from the groundwater system through reverse ion exchange processes. However, if some groundwater samples do not show this relative abundance, it could indicate a different source of ions or a different hydrogeological process. For example, reverse ion exchange processes could remove Na from the groundwater system and change the relative abundance of ions [26].

3.4. Base Ion Exchange in Groundwater Chemistry

Schoeller proposed in 1977 the chloralkaline indices, which indicate a set of parameters used to assess the chemical composition and origin of water samples. These indices help to characterize and evaluate the hydrogeochemical processes occurring in the aquifer system [22]. The calculated values for CAI-1 and CAI-II ranged between 0.39 and 0.18, −0.1284 and 0.1231, with a mean of −0.05 and −0.0194, respectively. From Figure 8, it is evident from Figure 9 that 60% of the samples were found to have positive indices for CAI-I and CAI-II, which represent the contribution of the reverse ion exchange process. Time and about 40% of the groundwater points in the positive indices of CAI-I and CAI-II, that is, there is a control of the anion exchange process, which reveals the dominance of the anion exchange process on the chemistry of groundwater compared to the cation exchange process in this study logic. That is, the results of the positive ion exchange process are the most widespread in the study areas.

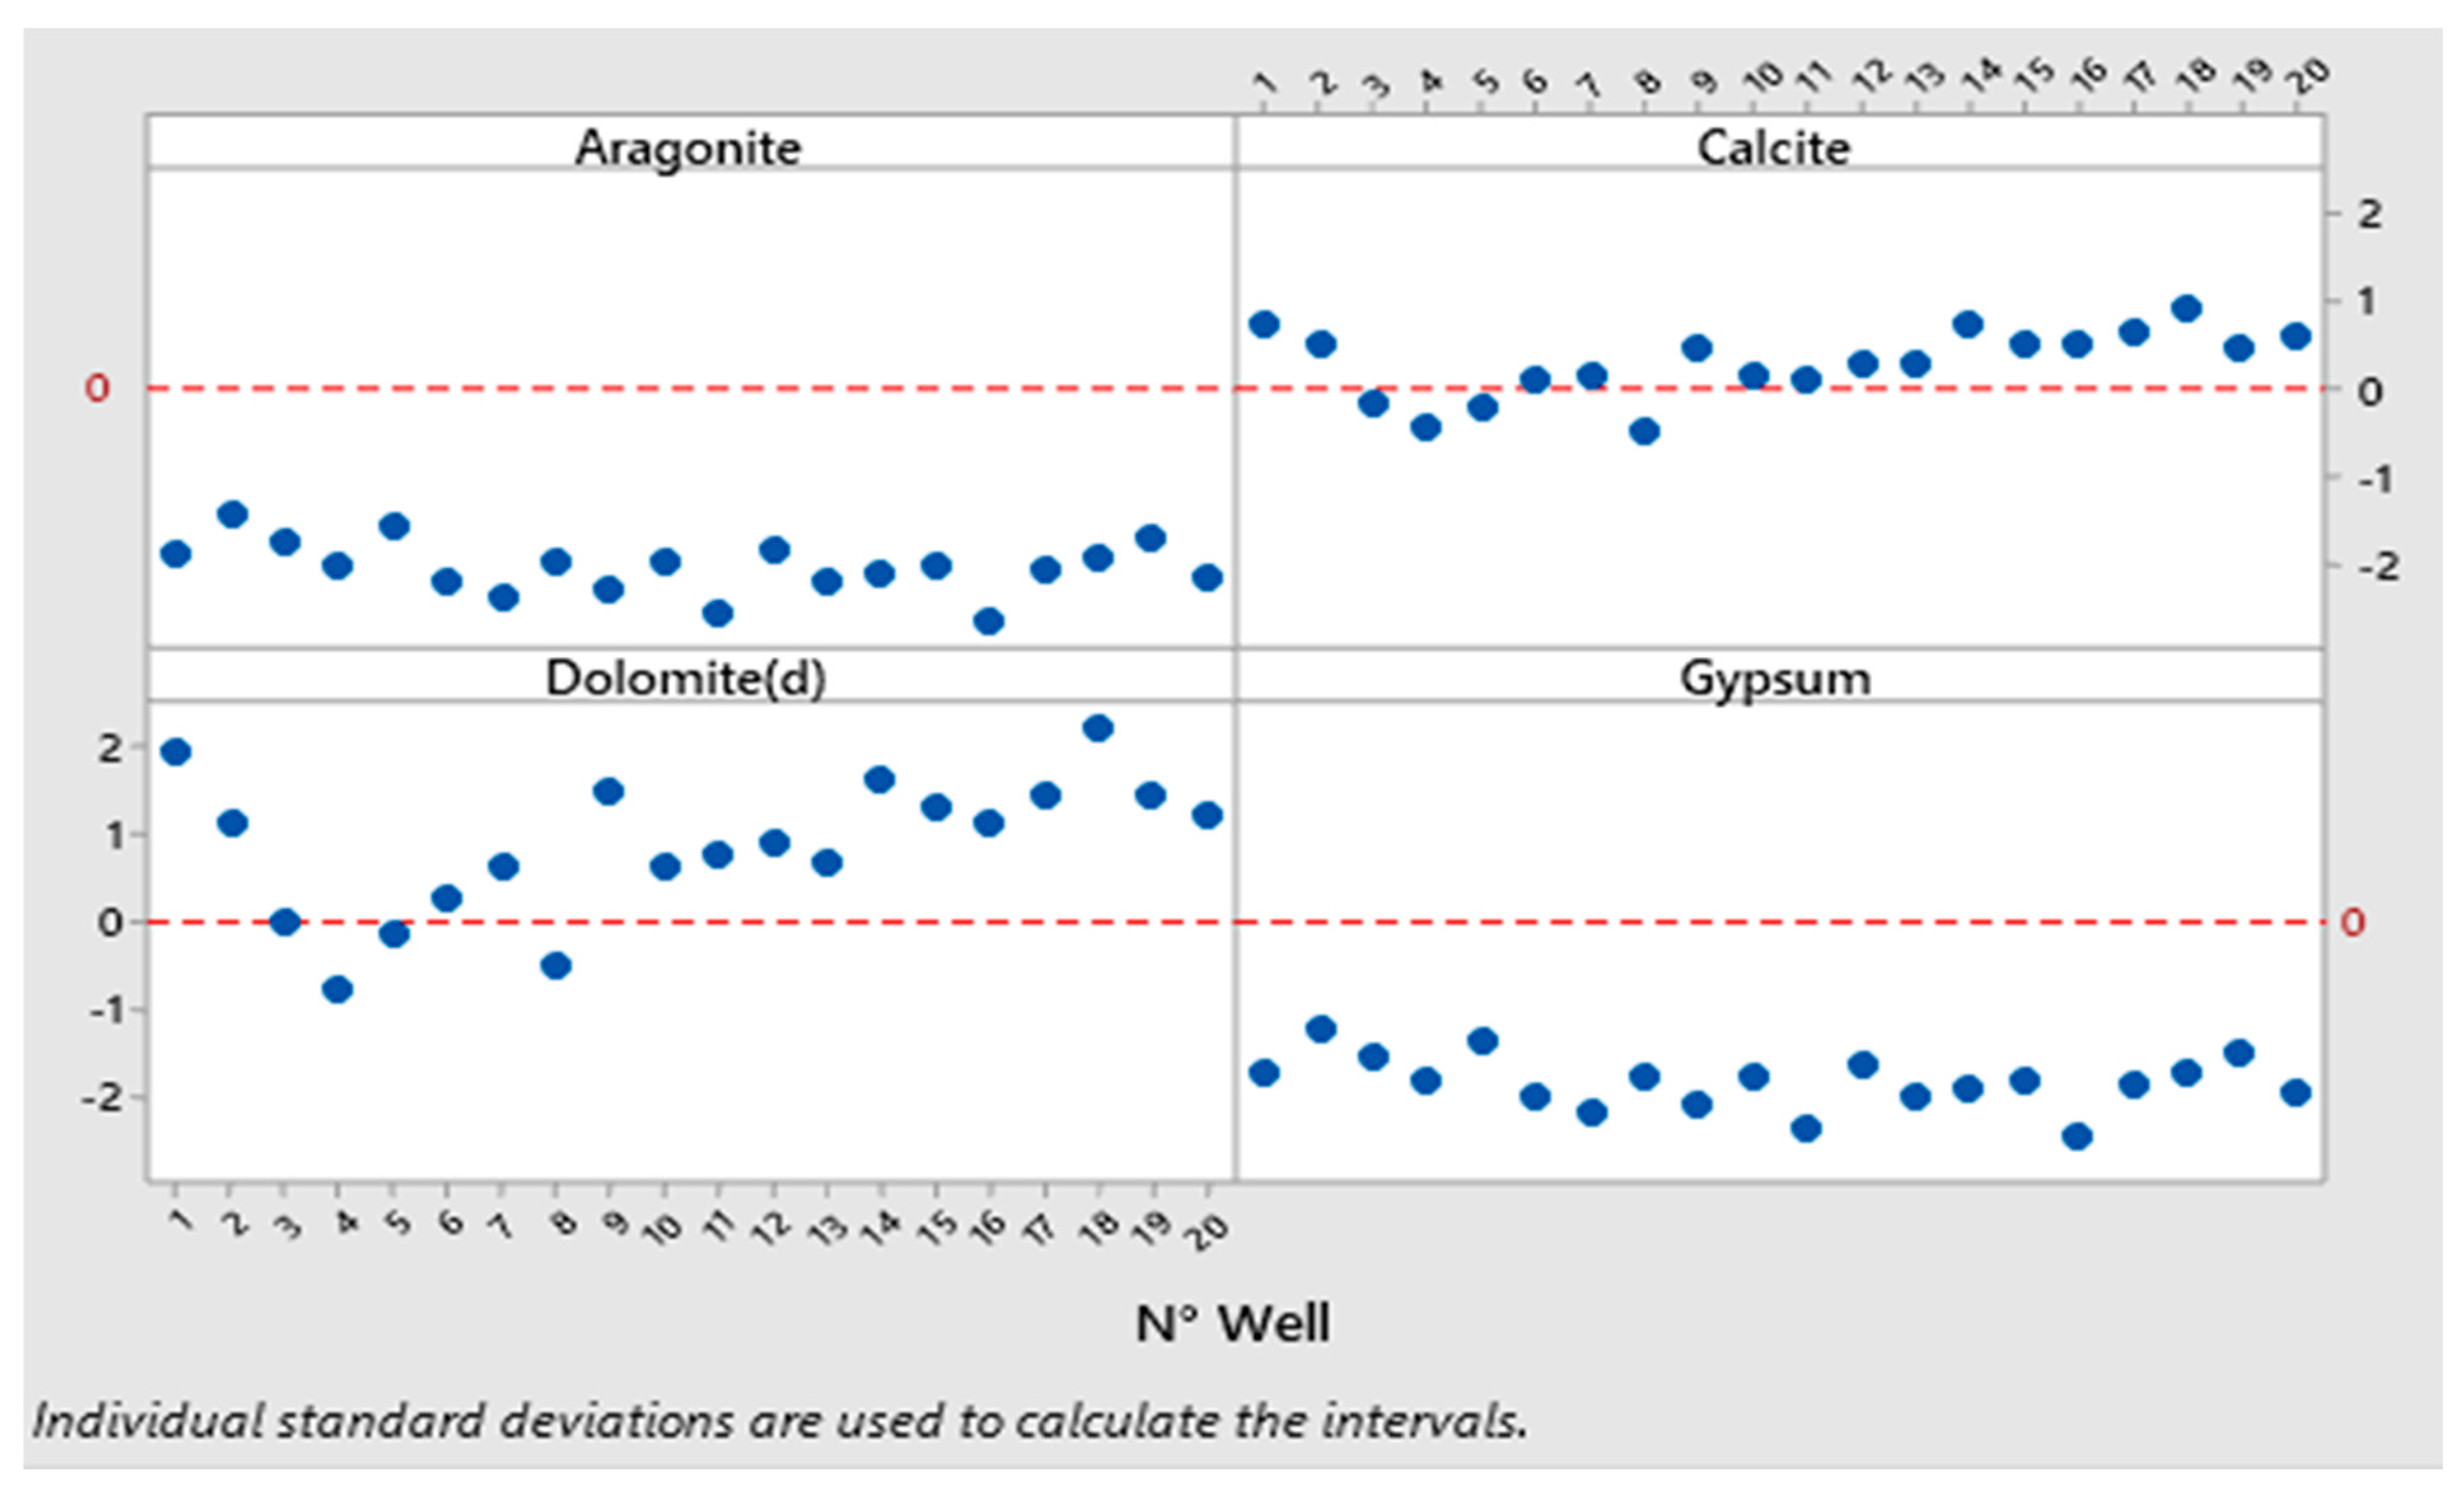
3.5. Saturation Indices of Groundwater

Based on measured calcium and magnesium concentrations in water and alkalinity, saturation indices relative to gypsum, anhydrite, calcite, dolomite, and aragonite were calculated by the diagram software [23]. Figure 9 illustrates the saturation indices of samples concerning various mineral phases. The results indicate that the aquifer is oversaturated with respect to calcite and dolomite, while it is undersaturated with respect to aragonite and gypsum.

3.6. Groundwater Pollution Index

The Groundwater Pollution Index (GPI) value gives a single value that reflects the total groundwater pollution rate. It takes into account the impact of multiple chemical variables on groundwater quality [16]. The GPI value accurately represents the level of well contamination. The results indicate that 20% of the wells fall under the category of “Low Pollution”, and a total of 4 wells are suitable for drinking. Approximately 15% of the wells are categorized as “Moderate Pollution”, 10% as “High Pollution”, and 55% of wells fall into the “Very High Pollution” category, with a total of wells (Table 5).
Overall, the GPI suggests that the overall well samples in this study area are not suitable for drinking purposes. The spatial distribution of the GPI indicates that most of the well samples in this study area have contamination levels ranging from high to very high (Figure 10), indicating that the water cannot be directly recommended for drinking in this area.

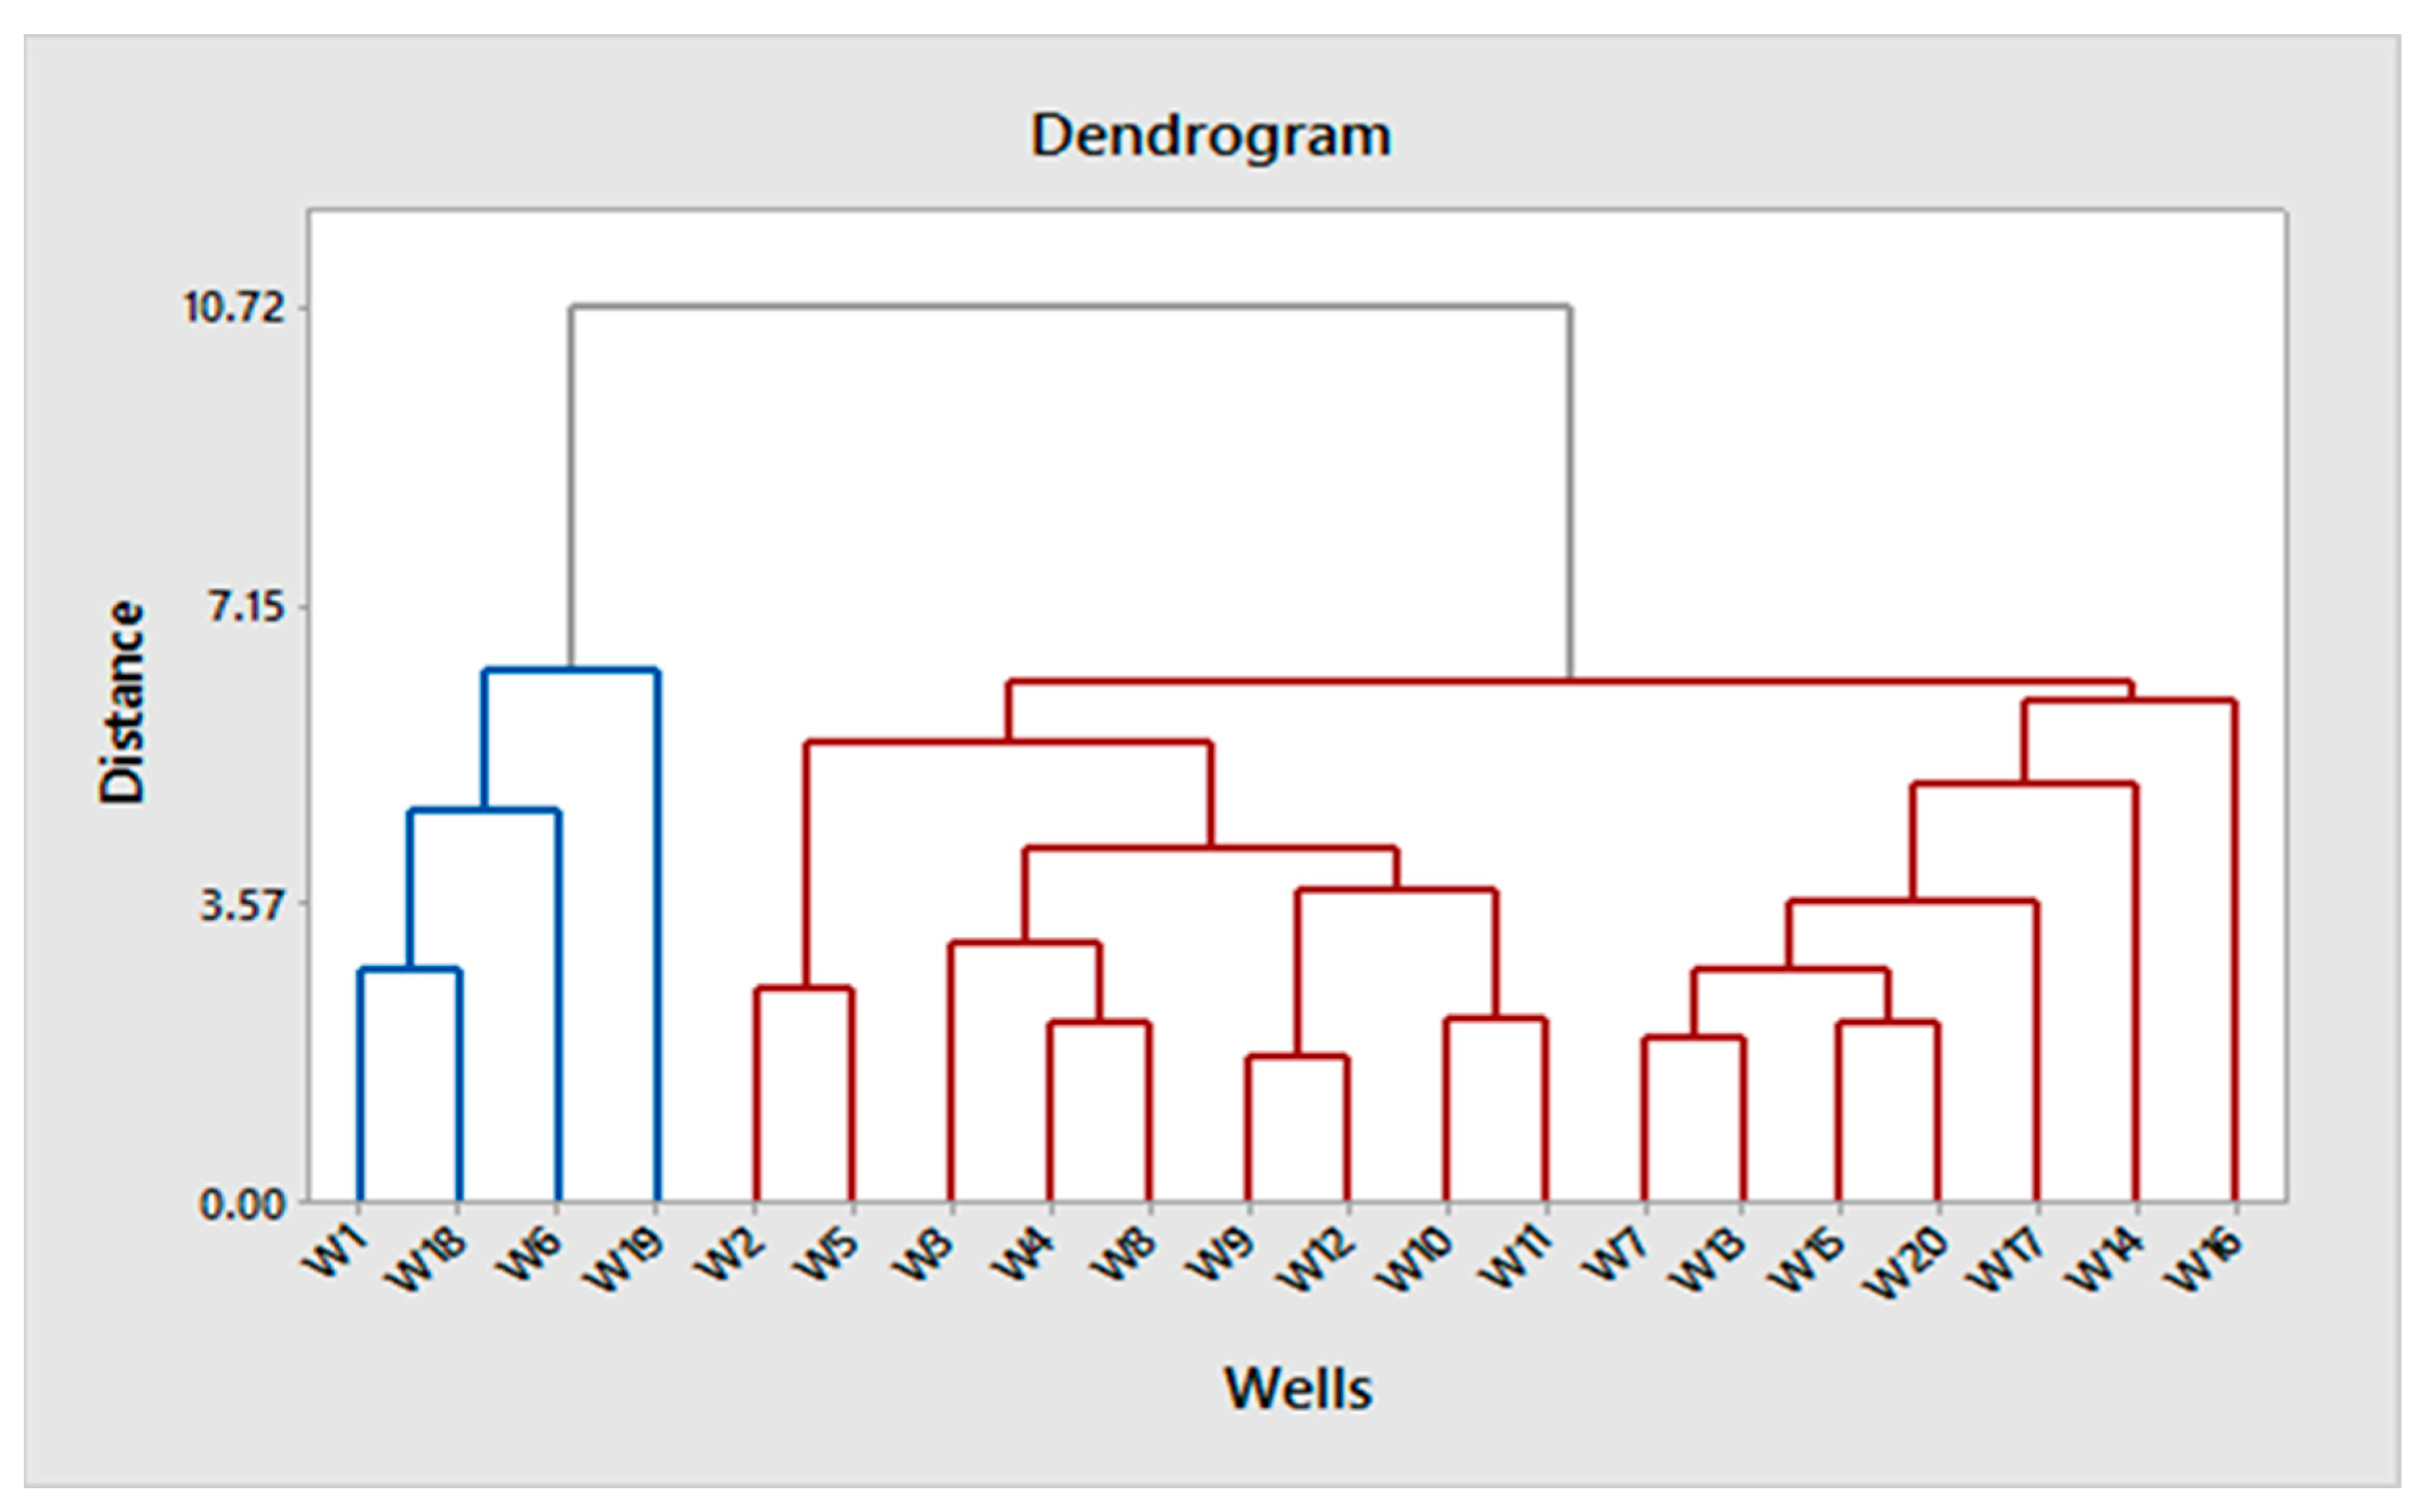
3.7. Classification Ascendant Hierarchies (CAH)

Hierarchical cluster analysis refers to a statistical method to characterize a dataset in groups according to their similarities. The dendrogram (Figure 11) shows the binding of the 20 wells according to the similarity of the chemical properties of groundwater. Wells 1, 18, 6, and 19 are grouped into one category; wells 2, 5, 3, 4, 8, 9, 12, 10, and 11 are grouped together; and the rest of the wells fall into another category, indicating the convergence of the groundwater quality of wells in each category.

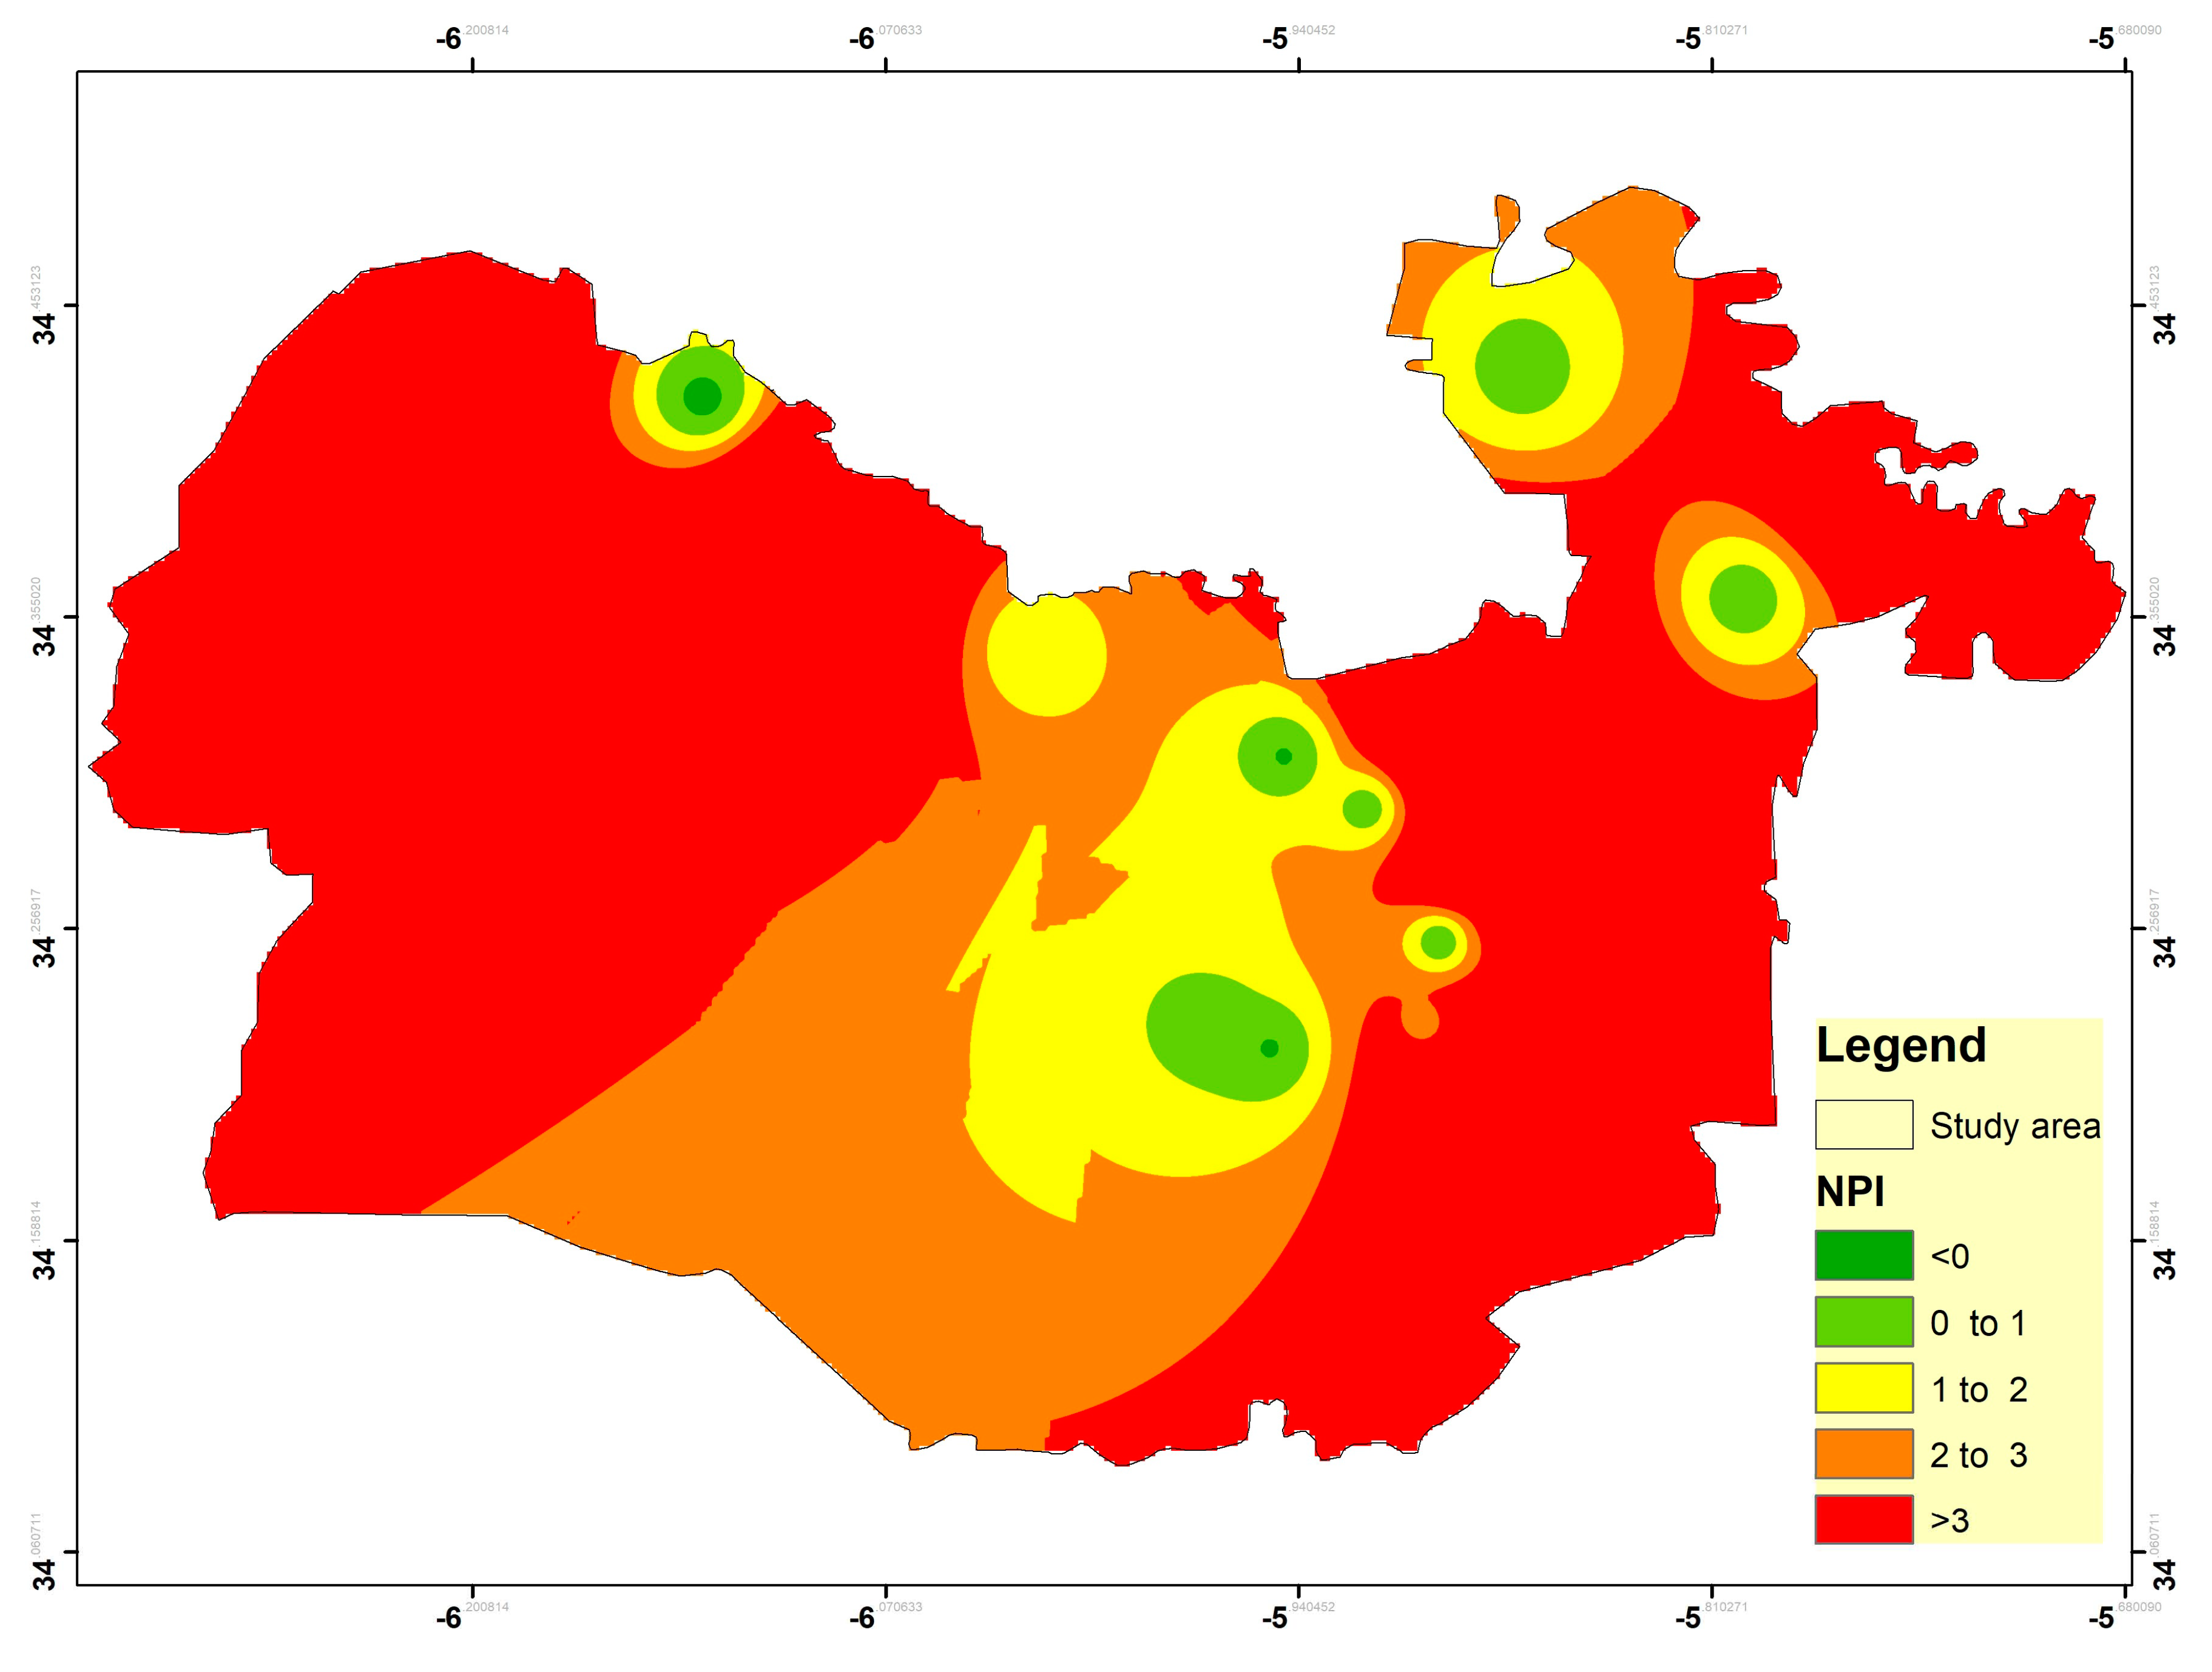
3.8. Nitrate Pollution Index (NPI)

The Nitrate Pollutants Index is an indicator for assessing water pollution caused by high nitrate concentration [20]. In this study area, the NPI values range from −0.287 to 18.344, with an average NPI of 3.97. About 10% of well locations have no pollution, 15% have low pollution, 25% have moderate pollution, and 50% of well sample locations have high to very high pollution due to the higher concentration of nitrate in well samples (Table 6 and Figure 12).
Figure 12 shows that most of the wells in this study area are contaminated with nitrates. In this study area, the sources of nitrate contamination are categorized into two distinct types: point sources and diffuse sources. Point sources include waste dumping yards, open landfills, uncovered septic tanks, and livestock confinement, all of which constitute the main contributors to nitrate contamination in the study area. On the other hand, diffuse sources of nitrate contamination are attributed to the use of organic nitrogen fertilizers, excessive synthetic fertilizer application, overuse of pesticides, and persistent sewage system leakages. An elevated concentration of nitrate in groundwater has significant implications for human health, with infants and children being particularly susceptible to a condition known as methemoglobinemia. Additionally, it can have adverse environmental effects, such as promoting the proliferation of aquatic plants and algae, ultimately leading to eutrophication in lakes.

4. Conclusions

The quality of groundwater is a critical factor in assessing the well-being and progress of human communities; it is a vital source for both domestic and agricultural purposes throughout Morocco. The current study centered on assessing groundwater quality in relation to both natural and anthropogenic contamination. This research and methodology contribute to enhancing our comprehension of groundwater hydrochemistry in arid and semi-arid regions globally. This study included 20 groundwater samples from different locations to assess their characteristics. The results revealed the use of chemical reaction schemes for rocks: out of 20 samples, 90% belong to the (Na+-K+-Cl-SO42−) type, while only 10% fall into the (Ca2+-Mg2+-Cl-SO42−) category. The Groundwater Pollution Index values ranged from 0.7 to 10.8, with an average of 7.03; about 60% of the groundwater samples analyzed in this study area were classified as highly polluted and unsuitable for drinking purposes. Nitrate Index values ranged from −0.9 to 10.5. Approximately 80% of the sampled sites require treatment before consumption. According to the Nitrate Pollution Index (NPI), it is essential to regularly monitor 16 well sites to prevent nitrate contamination resulting from human activities, including waste disposal in open areas and sewage infiltration. This study recommends raising farmers’ awareness of the use of slow-release natural fertilizers made from nitrogen rather than nitrogen-based fertilizers, reducing waste disposal by residents, and maintaining an appropriate sewage network to minimize sewage flow leakage.

Author Contributions

Conceptualization, H.S.A.-A. and F.A.; methodology, H.S.A.-A. and A.R.A.-A.; software, F.A; validation, A.-B.A.-O. and A.R.A.-A. and A.-J.M.A.-A.; formal analysis, H.S.A.-A.; investigation, H.S.A.-A. and F.A.; data curation, H.S.A.-A.; writing—original draft preparation, A.R.A.-A. and A.-B.A.-O.; writing—review and editing, H.S.A.-A. and A.-B.A.-O.; visualization, H.S.A.-A.; supervision, H.S.A.-A. All authors have read and agreed to the published version of the manuscript.

Funding

This research received no external funding.

Data Availability Statement

The data that support the findings of this study are available on reasonable request from the corresponding authors.

Acknowledgments

The authors would like to extend their sincere appreciation to the Research Supporting Project number (RSPD2023R703), King Saud University, Riyadh, Saudi Arabia.

Conflicts of Interest

The authors declare no conflict of interest.

References

  1. Ayers, R.S.; Westcot, D.W. Water Quality for Agriculture; Food and Agriculture Organization of the United Nations: Rome, Italy, 1985; Volume 29. [Google Scholar]
  2. Boyd, C.E. Water Quality: An introduction; Springer Nature: Berlin/Heidelberg, Germany, 2019. [Google Scholar]
  3. Bhat, M.A.; Wani, S.A.; Singh, V.K.; Sahoo, J.; Tomar, D.; Sanswal, R. An overview of the assessment of groundwater quality for irrigation. J. Agri. Sci. Food Res. 2018, 9, 209. [Google Scholar]
  4. Tanvir Rahman, M.A.; Saadat, A.; Islam, M.S.; Al-Mansur, M.A.; Ahmed, S. Groundwater characterization and selection of suitable water type for irrigation in the western region of Bangladesh. Appl. Water Sci. 2017, 7, 233–243. [Google Scholar] [CrossRef]
  5. Piperno, D.R. The origins of plant cultivation and domestication in the New World tropics: Patterns, process, and new developments. Curr. Anthropol. 2011, 52, S453–S470. [Google Scholar] [CrossRef]
  6. El Khodrani, N.; Zouahri, A.; Arfaoui, A.; Iaaich, H.; El Oumlouki, K.; Yahyaoui, A.; Fekhaoui, M. Study of physico-chemical quality of groundwater in the rural commune of SFAFAA (Sidi Slimane Gharb, Morocco). J. Mater. Environ. Sci. 2016, 7, 2852–2860. [Google Scholar]
  7. Aitsi, S.; Ettaki, J.; Doumi, K.; Chabli, A.; Belghyti, D. Hydrogeochemical Study of the Hamma My Yacoube, Sidi Slimane–Morocco. In Proceedings of the International Conference on Smart City Applications, Safranbolu, Turkey, 27–29 October 2021; pp. 657–670. [Google Scholar]
  8. Darwesh, N.; Naser, R.S.; Al-Qawati, M.; Raweh, S.; El Kharrim, K.; Belghyti, D. Groundwater Quality in Sidi Slimane, Morocco. J. Health Pollut. 2020, 10, 200309. [Google Scholar] [CrossRef] [PubMed]
  9. Alibou, J. Impacts des changements climatiques sur les ressources en eau et les zones humides du Maroc. In Proceedings of the Table Ronde Régionale en Méditerranée, Athènes, Greece, 10–11 December 2002; pp. 1–39. [Google Scholar]
  10. Laouina, A. Conservation des eaux et des sols au Maroc: Prise en compte de la diversité géographique. Norois 2010, 214, 85–99. [Google Scholar] [CrossRef]
  11. Das, N.; Mondal, P.; Ghosh, R.; Sutradhar, S. Groundwater quality assessment using multivariate statistical technique and hydro-chemical facies in Birbhum District, West Bengal, India. SN Appl. Sci. 2019, 1, 825. [Google Scholar] [CrossRef]
  12. Ghimire, M.; Regmi, T.; Kayastha, S.P.; Bhuiyan, C. Groundwater quality and community health risk in Lalitpur Metropolitan City, Nepal–a geospatial analysis. Geocarto Int. 2023, 38, 2168069. [Google Scholar] [CrossRef]
  13. Vaseashta, A.; Maftei, C. Water Safety, Security and Sustainability; Springer: Berlin/Heidelberg, Germany, 2021. [Google Scholar]
  14. Hilton, J. Towards a management and regulatory strategy for phosphoric acid and phosphogypsum as co-products. In Naturally Occurring Radioactive Material (NORM V); IAEA: Vienna, Austria, 2008; pp. 281–295. [Google Scholar]
  15. Apha, A. Standard Methods for the Examination of Water and Wastewater; American Public Health Association/American Water Works Association/Water Environment Federation: Washington, DC, USA, 2005; Volume 21, pp. 258–259. [Google Scholar]
  16. Subba Rao, N. Hydrogeology: Problems with Solutions Andhra Pradesh, India. Environ. Geol. 2017, 49, 413–429. [Google Scholar] [CrossRef]
  17. Subba Rao, N. Groundwater quality from a part of Prakasam district, Andhra Pradesh, India. Appl. Water Sci. 2018, 8, 30. [Google Scholar] [CrossRef]
  18. Subba Rao, N. PIG: A numerical index for dissemination of groundwater contamination zones. Hydrol. Process. 2012, 26, 3344–3350. [Google Scholar] [CrossRef]
  19. WHO, G. Guidelines for Drinking-Water Quality; World Health Organization: Geneva, Switzerland, 2011; Volume 216, pp. 303–304.
  20. Obeidat, M.M.; Awawdeh, M.; Al-Rub, F.A.; Al-Ajlouni, A. An Innovative Nitrate Pollution Index and Multivariate Statistical Investigations of Groundwater Chemical Quality of Umm Rijam Aquifer (B4), North Yarmouk River Basin, Jordan. In Water Quality Monitoring and Assessment; Vouddouris, K., Voutsa, D., Eds.; InTech: Rijeka, Croatia, 2012; pp. 169–188. [Google Scholar]
  21. Gibbs, R.J. Mechanisms controlling world water chemistry. Science 1970, 170, 1088–1090. [Google Scholar] [CrossRef] [PubMed]
  22. Schoeller, H. Geochemistry of Groundwater. Groundwater Studies, an International Guide for Research and Practice; UNESCO: Paris, France, 1977; pp. 1–18. [Google Scholar]
  23. Larson, T.E.; Buswell, A.M.; Ludwig, H.F.; Langelier, W. Calcium carbonate saturation index and alkalinity interpretations [with discussion]. J. Am. Water Work. Assoc. 1942, 34, 1667–1684. [Google Scholar] [CrossRef]
  24. Han, D.; Liang, X.; Jin, M.; Currell, M.J.; Han, Y.; Song, X. Hydrogeochemical indicators of groundwater flow systems in the Yangwu River alluvial fan, Xinzhou Basin, Shanxi, China. Environ. Manag. 2009, 44, 243–255. [Google Scholar] [CrossRef] [PubMed]
  25. Mayo, A.L.; Loucks, M.D. Solute and isotopic geochemistry and ground water flow in the central Wasatch Range, Utah. J. Hydrol. 1995, 172, 31–59. [Google Scholar] [CrossRef]
  26. Yechieli, Y.; Wood, W.W. Hydrogeologic processes in saline systems: Playas, sabkhas, and saline lakes. Earth Sci. Rev. 2002, 58, 343–365. [Google Scholar] [CrossRef]
Figure 1. Location of this study samples.
Water 15 03701 g001
Figure 2. Order the availability of ions of groundwater in this study area.
Water 15 03701 g002
Figure 3. Hydrochemical facies.
Water 15 03701 g003
Figure 4. Plots showing dominant cations (a) and inions (b) as sources of groundwater chemistry.
Water 15 03701 g004
Figure 5. Relationships between (HCO3 + SO42−) and (Ca2+/Mg2+). Numbers refer to the studied wells.
Water 15 03701 g005
Figure 6. The ratio of Ca2+/Mg2+ in groundwater of wells numbered 1–20.
Water 15 03701 g006
Figure 7. Relationships between (Cl and Na+). Numbers refer to the studied wells, defined above.
Water 15 03701 g007
Figure 8. Base-ion exchange. Circles refer to well number 1–20.
Water 15 03701 g008
Figure 9. Saturation index. Wells numbers (1–20) are points of wells (left) and top (right) of the x-axis.
Water 15 03701 g009
Figure 10. Disruption temporal map of pollution index of groundwater.
Water 15 03701 g010
Figure 11. Classification Ascendant Hierarchies. Wells (w1–w20): Group 1 (red lines, right) and Group 2 (blue lines, left).
Water 15 03701 g011
Figure 12. Disruption temporal map of pollution index of nitrate.
Water 15 03701 g012
Table 2. Categories of NPI [20].
NPI ValueNPI Interpretation
less than 0clean (unpolluted)
from 0 to 1low pollution
from 1 to 2moderate pollution
from 2 to 3high pollution
bigger than 3very high pollution
Table 3. Mathematical equations to calculate the groundwater quality parameters.
NameEquationEquation No.Ref.
Gibbs Ratio 1 G 1 = Cl ( Cl +   HCO 3 ) (6)[21]
Gibbs Ratio 2 G 2 = ( Cl +   HCO 3 ) ( Na + +   K + +   Ca 2 + ) (7)[21]
CAI
(Chloro-Alkaline Index)
CAI = ( Cl ( Na + + K + ) ) ( Cl ) (8)[22]
CAII CAII = ( Cl ( Na + + K + ) ) ( HCO 3 + HSO 4 + CO 3 2 ) (9)[22]
Saturation Index (SI) SI = log   ( IAP KT ) (10)[23]
Table 4. Statistical summary of the different parameters.
VariableMinimumMaximumMeanStandard Deviation
PH6.747.857.31650.28
EC154017,55049153772
TDS100111,40831952452
TH3121524715332.7
Ca2+2.8414.58.3733.525
Mg2+2.2216.025.9273.548
Na+8.0885.1932.0922.03
K+0.060.30.15250.0703
HCO32.3813.17.5682.599
NO30.236.241.6041.557
Cl7.4682.531.3121.86
SO42−0.294.661.6471.21
Table 5. The category of the groundwater pollution index (GPI) for this study area.
Pollution CategoryPercentage of WellsNumber of Wells
Clean or Insignificant Pollution (IP)--
Low Pollution (LP)20%4
Moderate Pollution (MP)15%3
High Pollution (HP)10%2
Very High Pollution (VHP)55%11
Table 6. The category of the nitrate pollution index (NPI) for this study area.
NPI ValueNPI InterpretationNo%
<0Clean (unpolluted)210
0–1Low pollution315
1–2Moderate pollution525
2–3High pollution15
>3Very significant pollution945
Disclaimer/Publisher’s Note: The statements, opinions and data contained in all publications are solely those of the individual author(s) and contributor(s) and not of MDPI and/or the editor(s). MDPI and/or the editor(s) disclaim responsibility for any injury to people or property resulting from any ideas, methods, instructions or products referred to in the content.

