Article

Facilitating Wastewater Purification through Progressive Thawing by Microwave: Responses of Microbial Communities

1
College of Soil & Water Conservation and Engineering, Northwest A&F University, Yangling 712100, China
2
College of Water Resources and Architectural Engineering, Northwest A&F University, Yangling 712100, China
3
Key Laboratory of Agricultural Soil and Water Engineering in Arid and Semiarid Areas, Ministry of Education, Northwest A&F University, Yangling 712100, China
4
Department of Hydraulic Engineering, Tongji University, Shanghai 200092, China
*
Author to whom correspondence should be addressed.
These authors contributed equally to this work.
Water 2023, 15(20), 3664; https://doi.org/10.3390/w15203664
Submission received: 30 August 2023 / Revised: 12 October 2023 / Accepted: 16 October 2023 / Published: 19 October 2023

Abstract

:
Freeze–thaw has been proved to be a simple, cost-effective, and highly efficient manner to purify wastewater. However, it remains unclear how microbial compositions and functions in meltwater differentiate over progressive thawing and how such differences affect the end product water quality. In this study, wastewater was frozen, progressively thawed via microwave and collected at five intervals: 5 min, 3 min, 3 min, 3 min, and 3 min (termed as T1~T5). It only took 8 min of microwave and 38.8% of total water to remove more than 75% of the dissolved salt and typical pathogenic microbes, and merely 11 min to reach a removal rate greater than 90%. The Shannon index indicated that the α diversity of bacterial and fungal communities significantly reduced from T1 to T5, and the NMDS dissimilarities also illustrated significantly different β diversity between T1 and T2 and T3, T4, and T5. The OTU-based bacterial and fungal co-occurrence networks developed from T1, T5, and CK were significantly different from each other and clustered in distinct modules. Microbial functional profiles further showed that the meltwater preferentially discharged at T1 selectively removed pathogenic and symbiotic fungi and bacterial subsets associated with endocrine diseases, carbohydrate metabolism, and aging. Yet, other microbial subsets tended to be selectively enriched in the end product at T5, such as saprotrophic fungi and bacterial subsets related to drug resistance, infectious diseases, cancers, and xenobiotics’ biodegradation and metabolism. Overall, the fast thawing facilitated by microwave and in turn the efficient removal of brines from ice crystals offered a new approach to overcome the prolonged time cost required by natural thawing. Selective discharge and enrichment of microbial subsets during progressive thawing alarmingly calls for in-depth investigations on the temporal fluxes of microbes when attempting to reuse wastewater in the regions suitable to apply freeze–thaw protocols.

1. Introduction

Wastewater is a vital alternative irrigation source and is currently used for approximately 36 million ha of croplands in the world, but 80% of wastewater undergoes little or no treatment [1]. Discharge of untreated wastewater would transport and disseminate concentrated microbes, antibiotics and heavy metals to farmland, and it poses unpredictable threats to fruits, vegetables, animals, and consequently to human health [2]. It is therefore required to adequately treat wastewater before irrigation to ensure long-term safe and sustainable use [3]. Various wastewater treatment technologies are available, but most of them require high-energy or bio-chemical input. For the regions advantaged with seasonal low temperature, freeze–thaw has been proved to be a simple, cost-effective, and highly efficient manner to purify wastewater, remove toxic or pharmaceutically active compounds and heavy metals, and reduce microbial density level [4,5,6,7,8]. Nevertheless, given the complex compositions of microorganisms entrapped in the brine pockets [1,2,9], it remains unknown how microbial communities would be perturbed or shifted during progressive thawing. This largely impedes our understanding of the potential impacts of reusing treated wastewater on the recipient water body or irrigation field.
In theory, due to the small dimensions of ice crystal lattice and high intolerance towards impurities, freezing ice cannot accommodate salt ions or organic compounds, and thus it tends to reject the impurities into the unfrozen water [10,11]. Hence, freezing–thawing can separate the ice residues with low salinity and contaminants from the concentrated brine and impurities preferentially yielded with liquid stream [12]. The purification efficiency of freeze–thaw to remove concentrated organic matter from natural wastewater can reach 95% or nearly 100% [10]. Chu et al. also observed that the number of bacteria in sludge decreased by 67% after freezing [13]. However, previous studies primarily focused on how typical pathogenic microbes (such as Escherichia coli) were inactivated, injured, or killed during freezing [14]. For instance, Gao et al. reported that approximately 98% of the Escherichia coli frozen at –5 °C were killed with only one freeze–thaw cycle [14]. In fact, there are a great number of microorganisms that can survive freezing [13,15,16] and concentrate in the brine pockets numerated inside the ice blocks. Considering the individual morphology of the microbes and their distinct ability to be motile or form endospores or capsules [5,16], it is also unclear which subsets of the microbes can be preferentially drained from the brine pockets with melted stream, or how efficiently they can be separated from the highly porous ice residues. This requires quantitative investigations to distinguish the selectivity of salts, nutrients, and microbes during freeze purification, and their different separation efficiency from ice crystal upon thawing so as to help develop post-freezing protocol to achieve reusable water quality from wastewater.
Merely relying on natural thawing to purify wastewater often requires hours and days to form adequate drainage channels to complete the purification process [17,18]. Microwaving has been proven to be an efficient manner to facilitate thawing [10] due to the distinctly greater dielectric constant of the brine pockets than the ice crystals. The high-frequency electromagnetic field produced by microwave can selectively heat and expand the brine pockets to accelerate the formation of free-flowing drainage channels [11] and thus facilitate the discharge of impurities from wastewater. In this way, microwaves can improve the dewaterability of ice blocks by shortening the days and hours of separation of brine and ice crystals into minutes [19,20]. Therefore, in this study, we employed microwave equipment to melt ice blocks frozen from wastewater and separately collected the liquid water yielded over progressive thawing. The bacterial and fungal community compositions, diversity, and the relative and collective abundances of selected functional microbes were compared among the five thawing intervals. We hypothesized that (1) impurities and microbes can be largely removed at first stage of thawing and that (2) the microbial compositions and functions were not equally responsive to progressive thawing.

2. Materials and Methods

2.1. Wastewater Collection and Purification by Freeze–Thaw

The wastewater was collected from Huayu Wastewater Treatment Plant in Yangling, Shaanxi, China after preliminary and primary treatment, and the branches, leaves, fast-settling particles, and grease were removed. After collection, the wastewater sample was stored in a plastic tank at 4 °C. The wastewater was frozen for 24 h at −15 °C with a refrigerator (FCD-215SEA, Haier, Qingdao, China), and then stepwise thawed with a microwave equipment (Mi-231E, 2450 MHz, 800W; Midea, Guangdong, China). To be compatible with the size of the microwave, as well to improve the water yield rate, the wastewater was frozen and thawed by every 2 L. The thawed liquid was collected at five microwaving intervals: 5 min, 3 min, 3 min, 3 min, and 3 min, which hereafter are termed T1, T2, T3, T4, and T5 (Figure 1). Given the fact that the liquid discharged during the first interval was highly concentrated with impurities, we prolonged the first interval to improve the removal efficiency, and the remaining intervals were set equally at 3 min to obtain the comparable amount of liquid discharge. In total, 32 replicates of 2 L wastewater were frozen, microwave-thawed, and collected. For a reference, 2 L of sewage water was frozen and thawed at an ambient temperature, and it took approximately 14.5 h to achieve complete melting.
For each replicate at each time interval, the water volume was recorded, and the water temperature and electricity conductivity (EC) were measured using a conductivity meter (DDS-307A, REX, Shanghai, China). The 32 replicates were then mixed according to the five microwaving intervals to form 5 composite samples for microbial analysis. Meanwhile, EC and soil microbial analyses were also conducted for the unfrozen wastewater (CK) with five replicates as controls. During the entire microwave treatment, the temperature of the melted water was no higher than 25 °C, theoretically excluding the potential thermal effects of microwave radiation [21,22]. Overall, the water recovery rate was on average above 97.5%.
Apart from turbidity and dissolved salt, the species Escherichia coli was selected as a pathogenic bacterium of general concern, and its removal rate at each thawing interval was also estimated. Other pathogenic microbes that are often included in water-quality regulations, such as Salmonella, Leptospira, and Vibrio, were hardly detected in the wastewater investigated in this study. Virus, protozoa, and helminths are out of the scope of this study. To be specific, the removal rates of dissolved salt, Escherichia coli (E. coli), and top-abundant OTUs at the five thawing intervals were calculated by Equation (1) as follows:
R i = C i × V i i = 1 5 C i × V i × 100 %
where Ri is abbreviated for the removal rate of the dissolved salt, E. coli, or each top-abundant OTU at the thawing interval i; Ci represents the concentration of the dissolved salt, or the relative abundance of E. coli or each top-abundant OTU at the thawing interval i; and Vi denotes the volume of the liquid yielded at the thawing interval i.

2.2. Microbial DAN Extraction, Sequencing and Bioinformatics Analysis

The bacterial and fungal communities in the liquid yielded at each thawing interval were compared with that in the unfrozen CK. In brief, the DNA from each filtered sample was extracted using the FastDNA® Spin Kit (MP Biomedicals, Cleveland, OH, USA), then diluted with 50 μL sterilized water, and the concentration was determined using a NanoDrop Spectrophotometer. With Thermo Scientific® Phusion High-Fidelity PCR Master Mix (New England Biolabs, Hitchin, UK), the hypervariable V4 region of the 16S rRNA gene from bacterial DNA samples was amplified with the 515F (5′-CCTAYGGGRBGCASCAG-3′) and 806R (5′-GGACTACNNGGGTATCTAAT-3′) primers, and the fungal ITS1 genes were amplified with 1737F (5′-GGAAGTAAAAGTCGTAACAAGG-3′) and 2043R (5′-GCTGCGTTCTTCATCGATGC-3′) primers. To represent the richness of the microbial community, the operational taxonomic units (OTUs) were clustered from sequences with ≥97% similarity.
The Shannon index and non-metric multi-dimensional scaling (NMDS) based on Bray–Curtis dissimilarities were employed to represent the α and β diversity of the soil bacterial and fungi communities at each thawing interval. The bacterial and fungal co-occurrence networks were developed from the normalized relative abundance counts per million, and the positive and significant correlations (p > 0.8 and p < 0.05) were visualized after Spearman correlations. The co-occurrence networks were clustered via fast greedy optimization of modularity, and the vertices were placed using the Fruchterman and Reingold layout [23]. Yet, given the overwhelming dataset, we merely marked the significantly different OTUs among T1, T5, and CK in the co-occurrence networks to represent the progressive microbial community shifts over thawing. Furthermore, network modules were also marked in each co-occurrence network to identify the bacterial and fungal subsets with greater density of edges within the thawing intervals than among them. The cumulative relative abundances of T1, T5, and CK in the top-3 densely clustered modules were counted and compared.
To examine the removal selectivity of different microbial species over thawing, the variations in the relative abundance of the top-10 abundant bacterial OTUs (bOTUs) and fungal OTUs (fOTUs), and their removal rates were compared among different intervals. Furthermore, the functional profiles of the bacteria obtained from KEGG metagenomic datasets were correlated with those predicted from the 16S rRNA data using Tax4Fun. Based on the relative abundance of genes with different pathways annotated by KEGG (Supplementary File S1), 16 functions with the most abundant genes, or of general concern, were selected, and their cumulative relative abundances were compared among the five thawing intervals. These 16 selected functions included the following: cellular community of prokaryotes; cell motility; signal transduction; membrane transport; translation; replication and repair; infectious diseases; endocrine and metabolic diseases; drug resistance; cancers; xenobiotics biodegradation and metabolism; lipid metabolism; carbohydrate metabolism; amino acid metabolism; endocrine system; and aging. The fungal functional profiles were assigned using FUNGuild based on the OTU tables. The cumulative relative abundances of pathogenic, saprotrophic, and symbiotic fungi were compared among the five thawing intervals.

2.3. Statistical Analysis and Plotting

The differences among the five thawing intervals and the unfrozen CK were compared using the LSD test at a significance level of 0.05. All the statistical analyses and plotting were performed using R studio (Version 1.3.1093). Major R packages applied in this study included the following: “agricolae”; “ape”; “BiocManager”; “edgeR”; “Hmisc”; “igraph”; “lattice”; “permute”; “picante”; “scriplot”; and “vegan”.

3. Results

3.1. Purifications of Selected Materials over Progressive Thawing

Before the freeze–thaw treatment, the raw wastewater was fairly contaminated (Table 1), with high turbidity at an average of 12.6 NTU and an electrical conductivity average of 804.7 μS cm−1. Total anion was as high as 447.8 mg L−1, whilst the total cation was 185.9 mg L−1. After progressive thawing, the melted water gradually became less contaminated (Figure 1). The water samples yielded at the first microwaving interval T1 were apparently yellowish in color, with more turbidity and visible flocs, whilst the end product at the last interval T5 was crystally clear (Figure 1).
Over the five thawing intervals, variations in the volume, temperature, turbidity, EC, and reduction rate of dissolved salt and E. Coli are listed in Table 2. The volume of the discharged water ranged from 302.5 mL to 463.5 mL, whilst the temperature of the discharged water was as low as 6.7 °C at the first interval T1 and stabilized around 20.2~20.6 °C after T3. The turbidity was evidently reduced from 21.2 NTU at T1 down to 3.1 at T5, so was the EC, significantly from 1795.5 μS cm−1 at T1 down to 66.1 μS cm−1 at T5. The removal rate of dissolved salt and E. Coli, respectively, reached 53.1% and 40.4% at T1 and cumulatively reached 90.8% and 89.8% after T3 (Table 2).

3.2. Bacterial and Fungal Compositions and Diversity across the Five Thawing Intervals

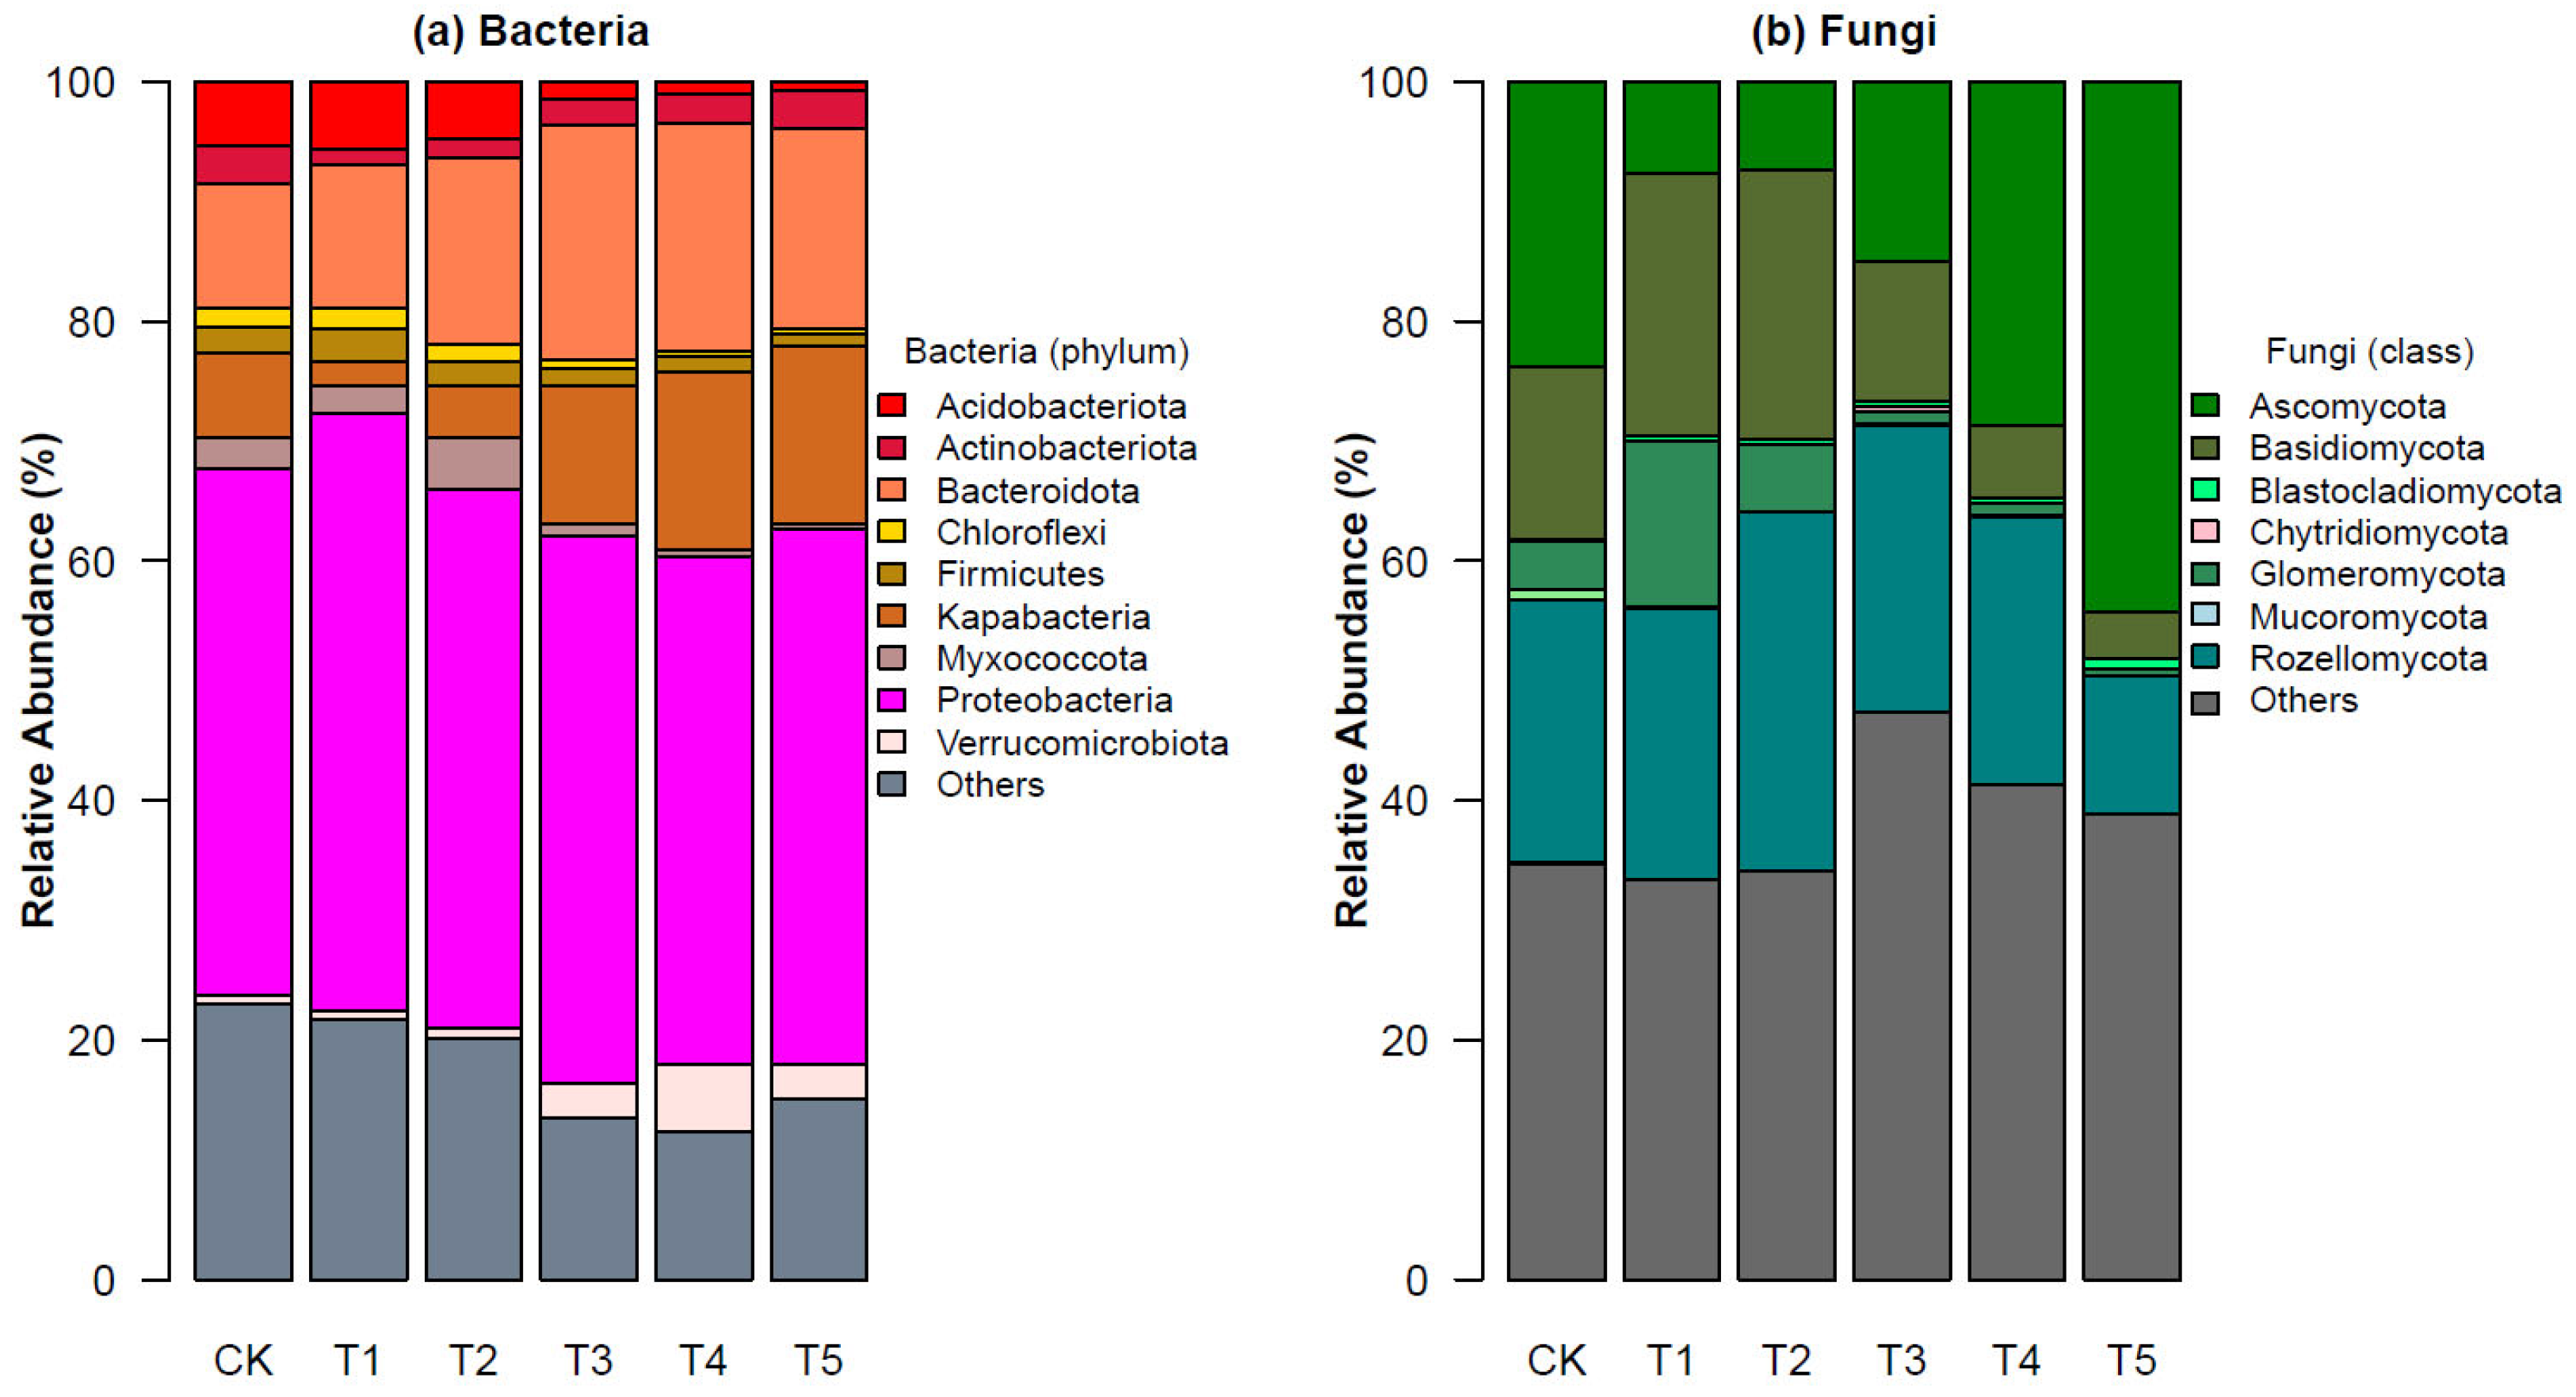
The relative abundance of the top 10 bacterial phylum illustrates that all the water samples were predominated by phyla Proteobacteria (42.31% to 49.86%), Bacteroidota (10.39% to 19.63%) and Kapabacteria (2.02% to 14.86%) (Figure 2a). The differences between the treated intervals (T1 to T5) and untreated CK were significant (p < 0.05). To be specific, the relative abundance of the phyla Kapabacteria increased from 2.02% in the T1 to 14.81% at T5, which was significantly different from the 7.02% in the CK. The relative abundance of the phyla Bacteroidota appeared to first increase with thawing intervals from 11.94% in the T1 to 19.63% at T3, and then reduce to 16.72% at T5. Meanwhile, the relative abundance of the phyla Myxococcota in the CK was 2.60% and that was evidently reduced from 2.38% in the T1 to 0.46% at T5 (Figure 2a). The relative abundances of the top 10 fungal classes showed even more evident variations among the intervals (Figure 2b). The relative abundance of the class Ascomycota was 23.74% in the CK, but it noticeably increased from merely 7.66% at T1 to 44.19% at T5. Meanwhile, the relative abundance of the class Basidiomycota in CK was 14.51% but decreased from 21.96% in the T1 to 3.90% at T5. The class Glomeromycota also tended to decrease with the thawing intervals, from 13.87% in the T1 to 0.61% at T5. Similarly, the relative abundance of the class Rozellomycota reduced from 22.62% at T1 to 11.53% at T5 (Figure 2b).
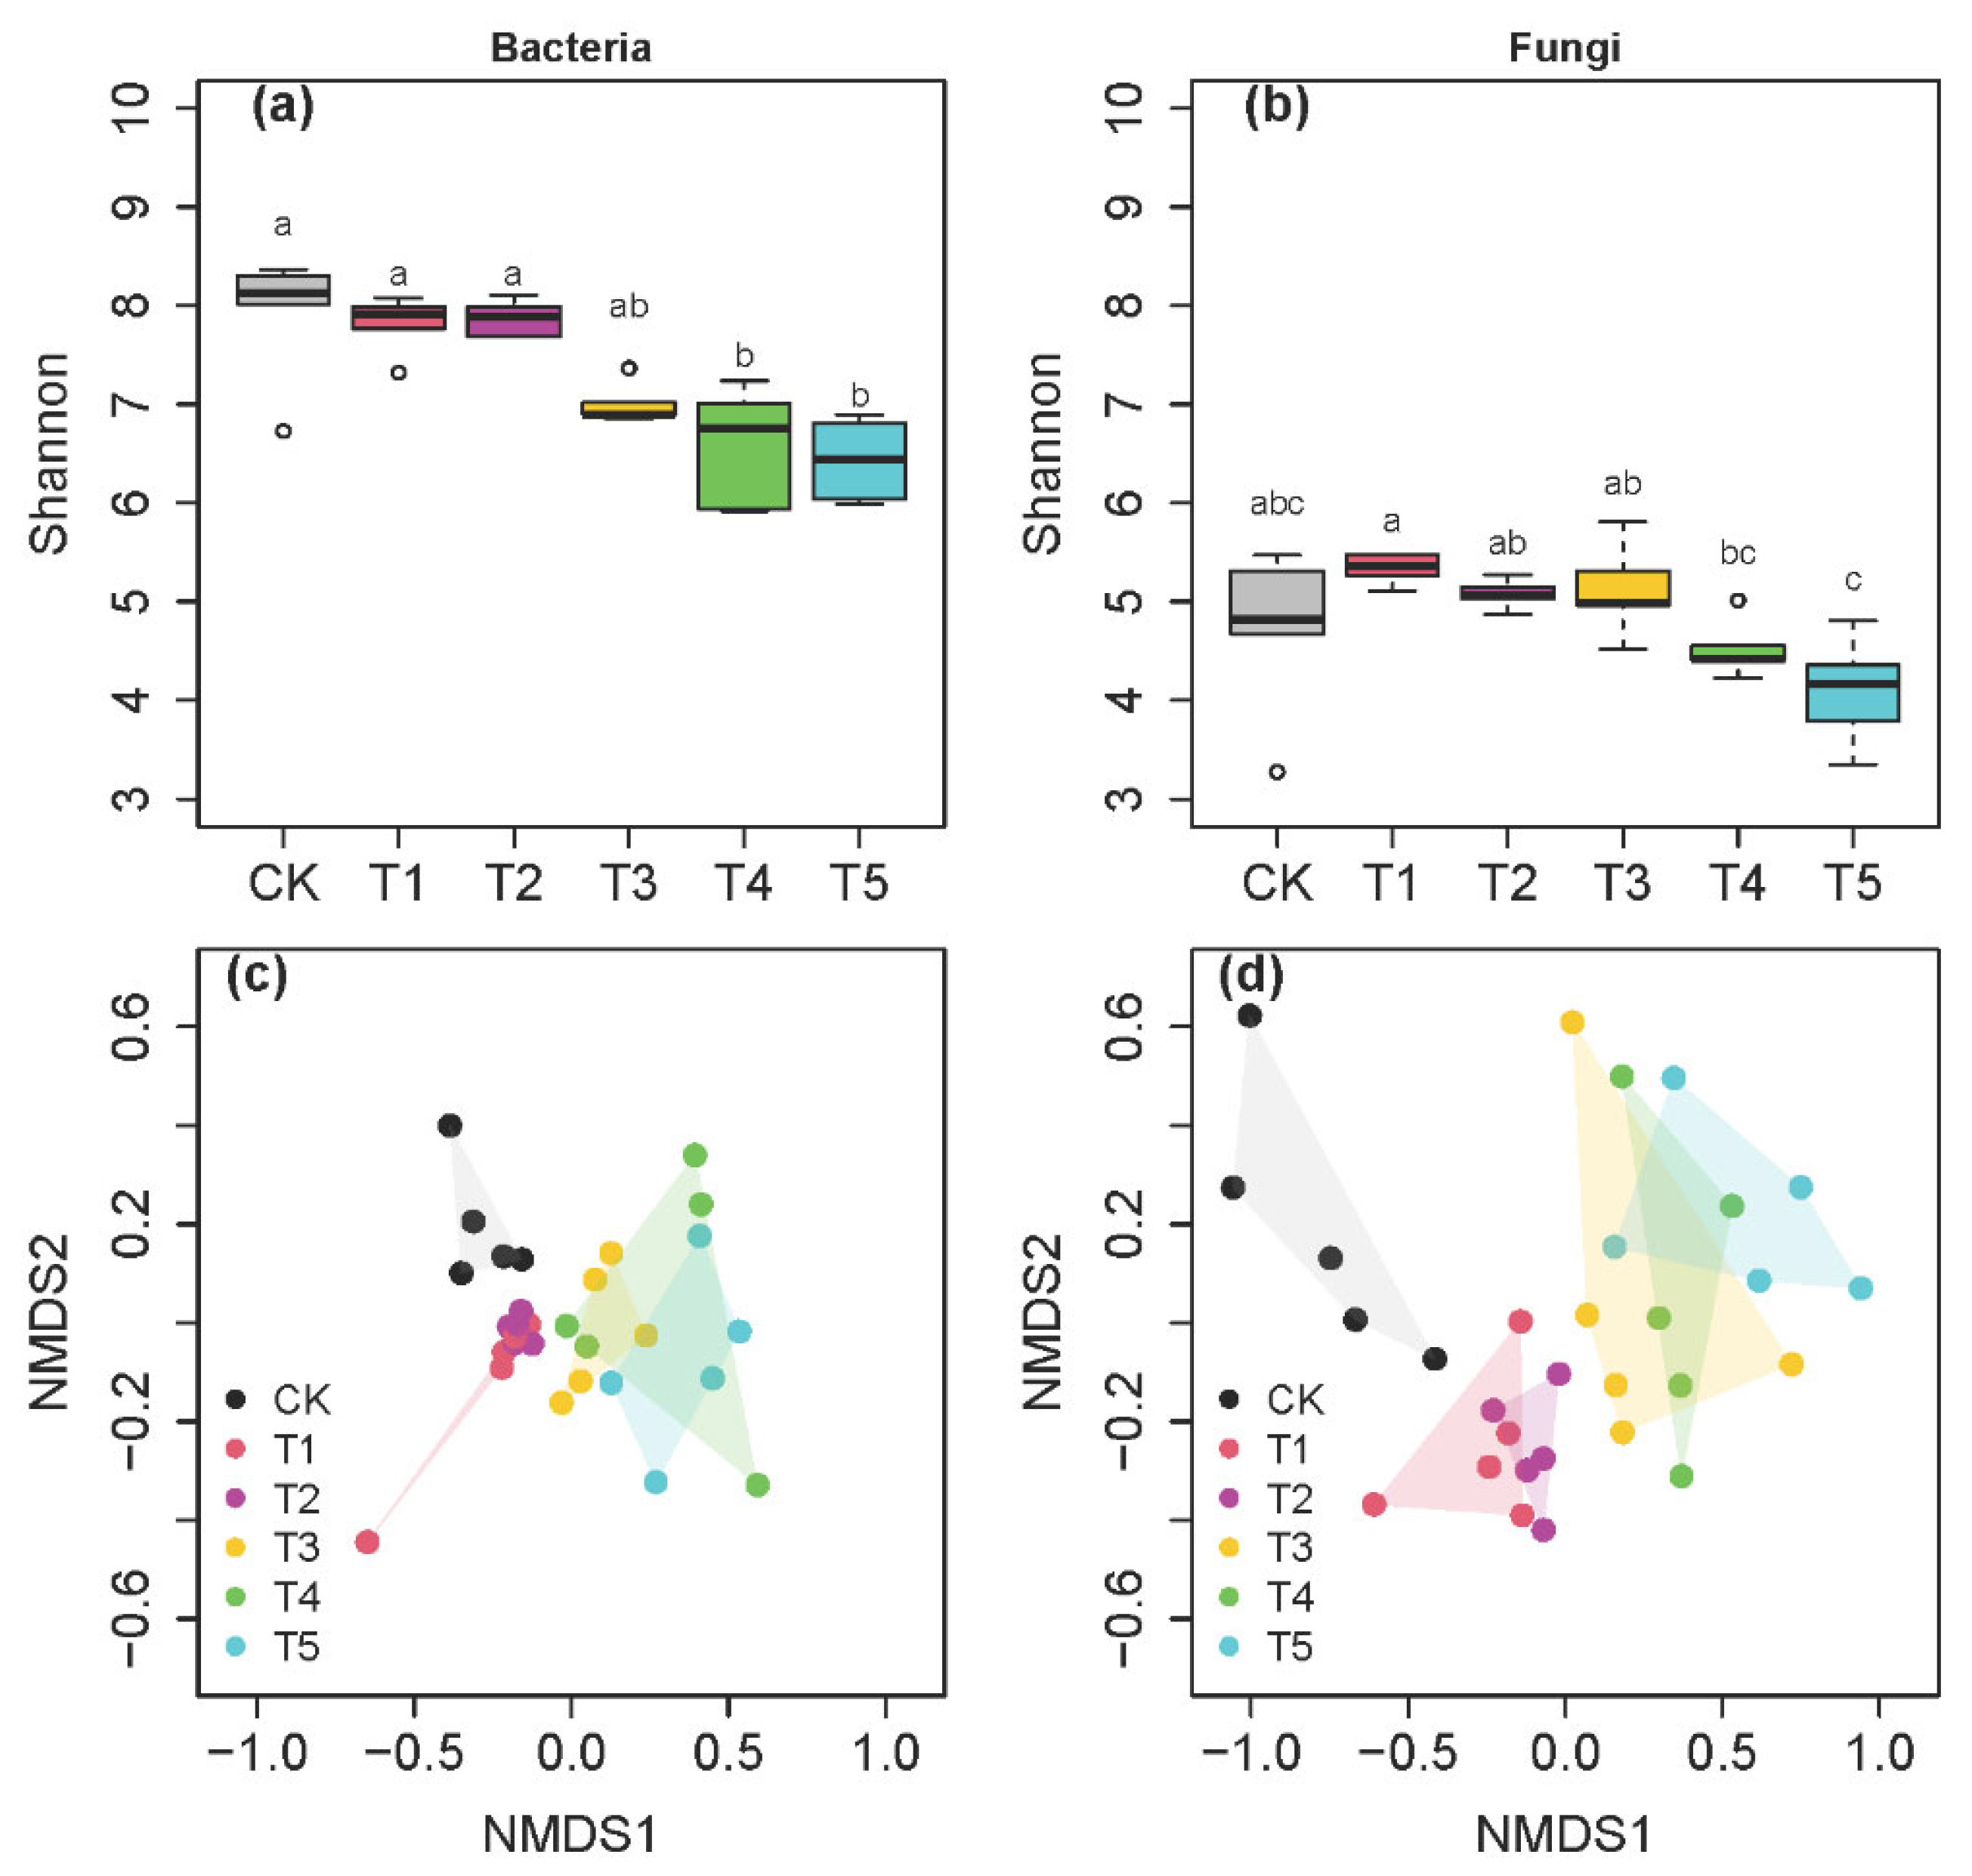
The bacterial Shannon index declined from 7.8 at T1 to 6.43 at T5, and the differences were significant between the liquid thawed first (T1–T2) and the liquid thawed last (T4–T5) (Figure 3a). The Shannon index of the fungi appeared to follow a similar declining pattern, from 5.33 at T1, to 5.12 at T3, and to 4.09 at T5 (Figure 3b). Consistent with the variations in the Shannon index, the NMDS dissimilarities of the bacteria and fungi also tended to have three significantly different groups (Figure 3c,d): CK, T1-T2, and T3-T4-T5 (Figure 3c,d). Only the ordination hulls based on the NMDS of the bacteria and fungi in the water at the T1 and T2 were significantly smaller than random hulls by permutation tests (p < 0.05).

3.3. OTU-Based Co-Occurrence Networks

The OTU-based bacterial and fungal co-occurrence networks developed from T1, T5, and CK were illustrated in Figure 4. The bacteria discharged at T1, T5, and CK were significantly different from each other and clustered in distinct modules (Figure 4a). Module 5, module 1, and module 4 were the top-three best connected modules, respectively, predominated by the bOTUs from T5, T1, and CK (Figure 4c). The cumulative relative abundances of the bOTUs from T5 in module 5 reached 820%, whilst that from T1 topped at 628% in module 1, and those from CK were on average 17% in module 4 (Figure 4c). For the fungal co-occurrence network, the top-three best connected modules were module 4, module 2, and module 15, which were predominantly clustered by fOTUs from CK, T1, and T5 (Figure 4b). The relative abundances of fOTUs from T1 were as great as 856% on average in module 4, whereas those from CK accumulated to 434% in module 2 and those from T5 were on average 533% in module 15 (Figure 4d).

3.4. Removal and Enrichment of the Top-Abundant Microbes at the Five Thawing Intervals

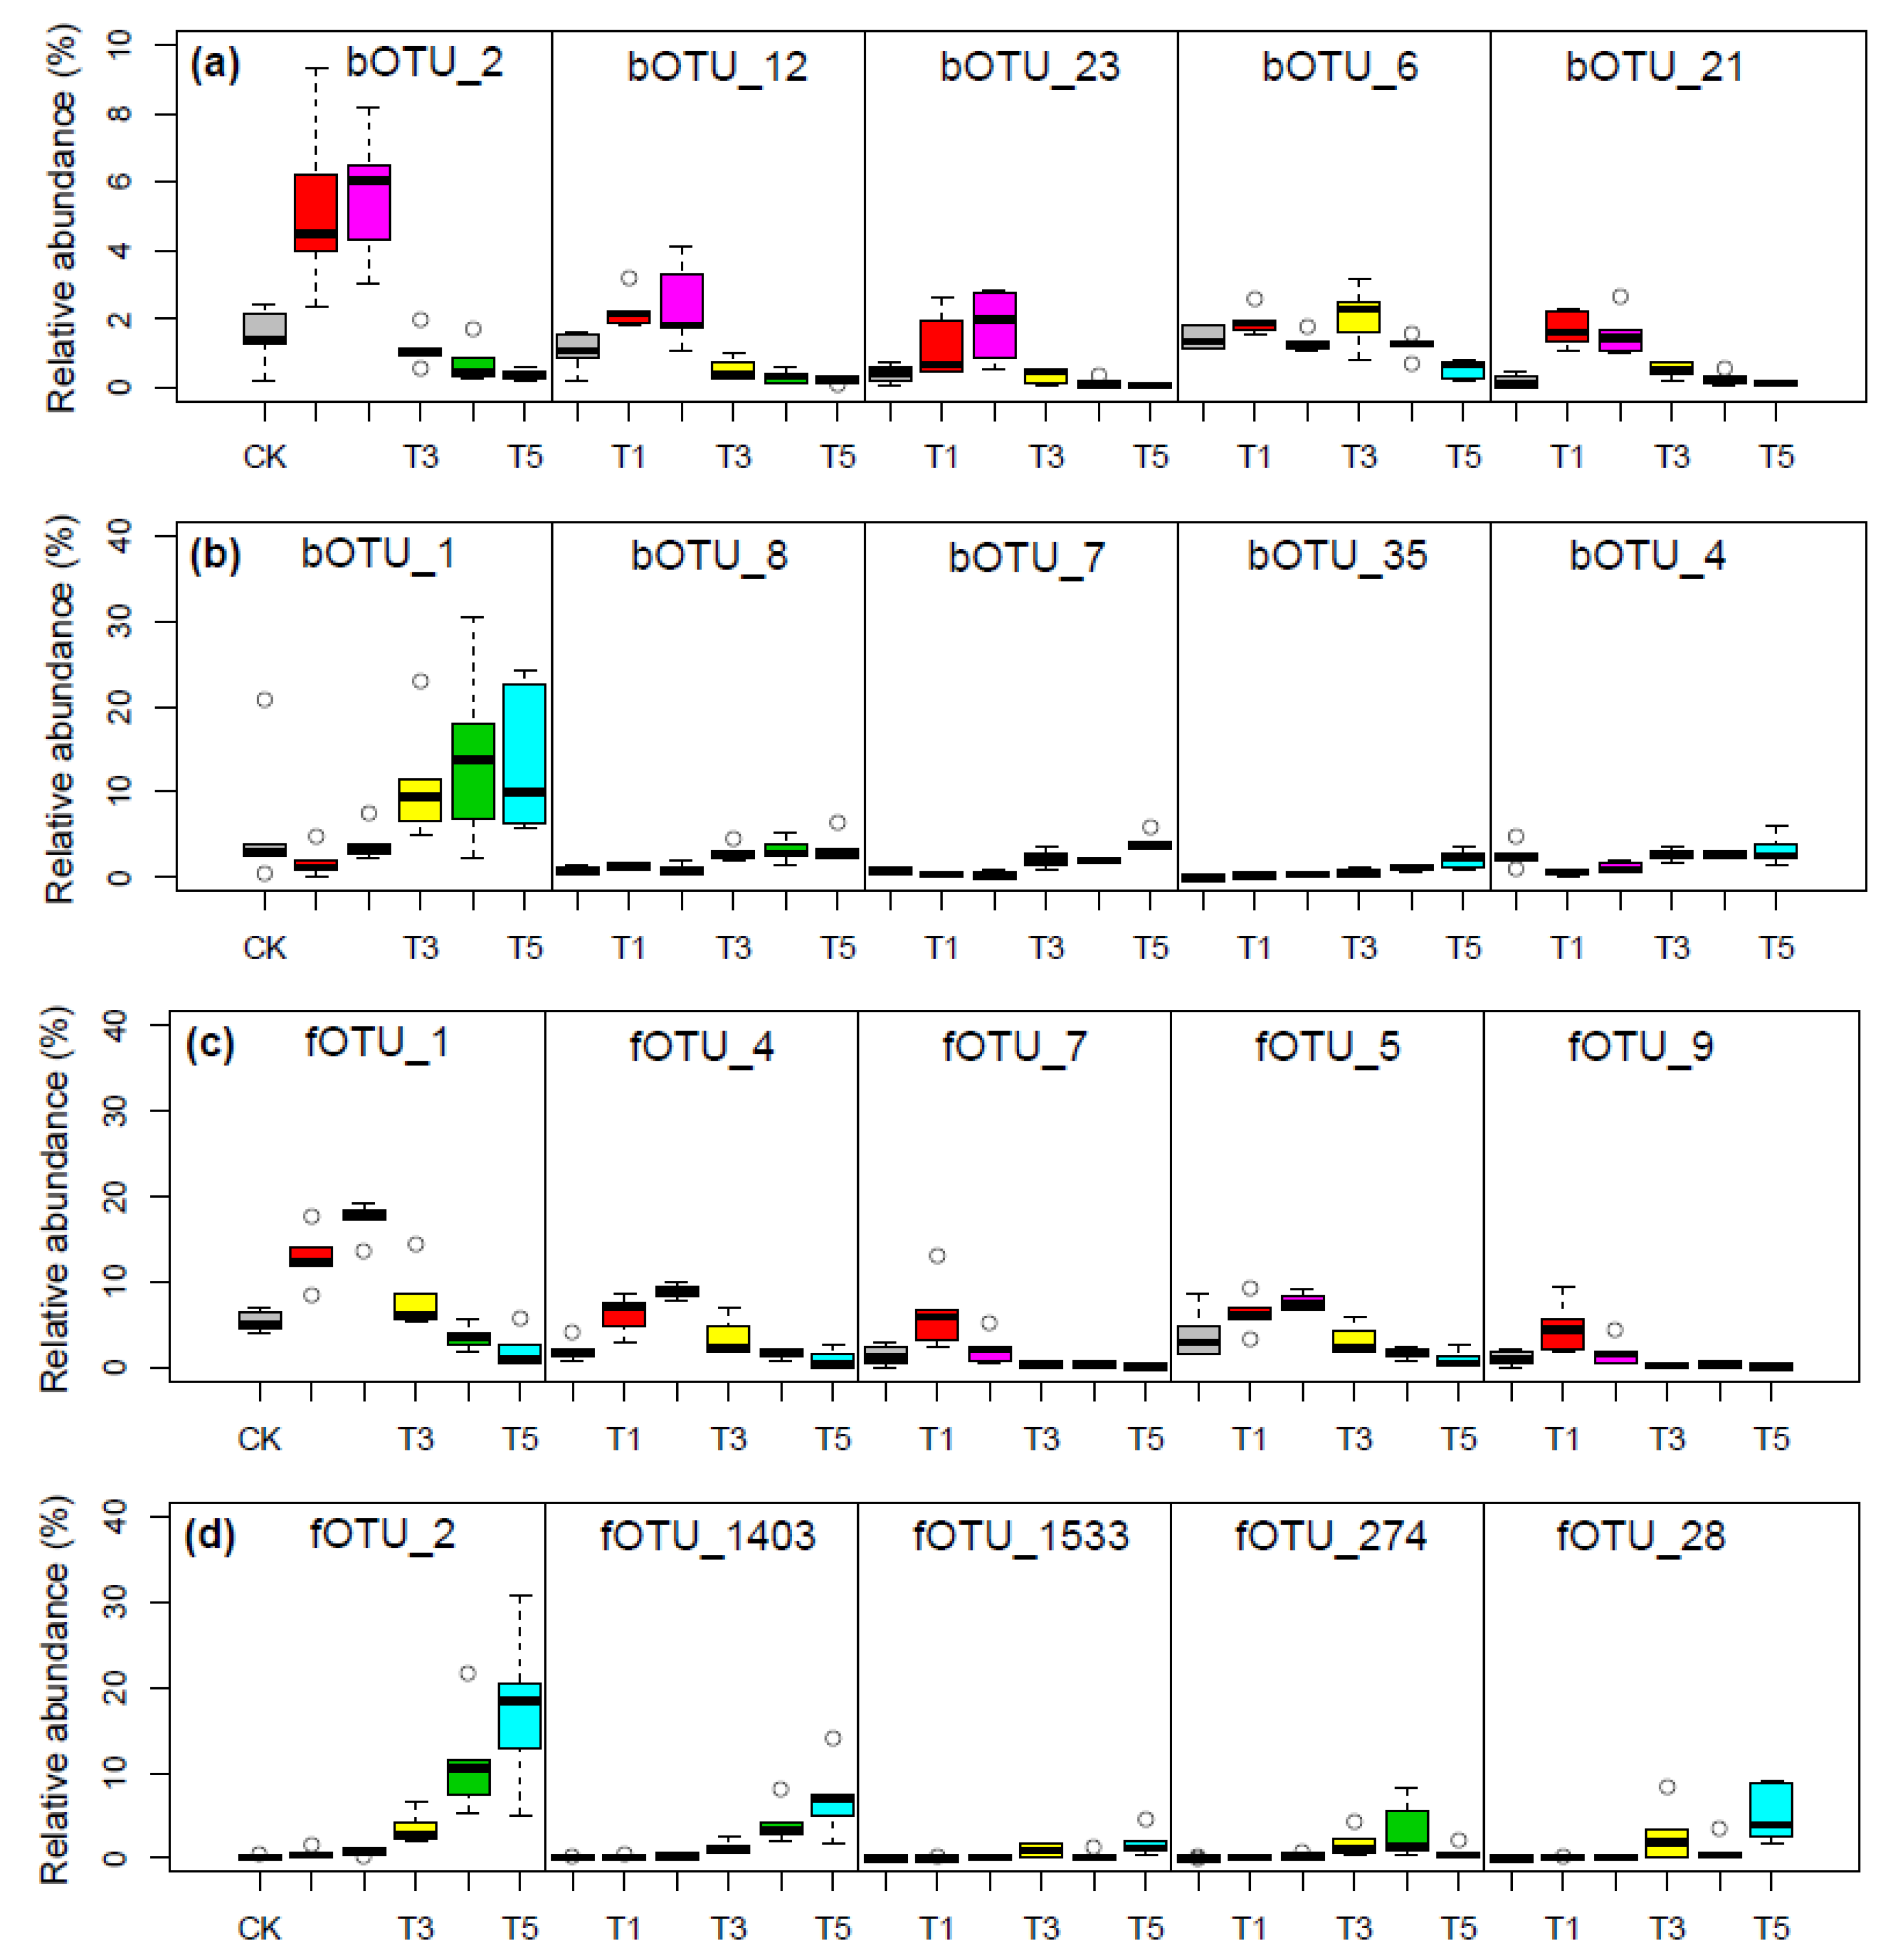
The relative abundances of the top-abundant bOTUs, including bOTU_2, bOTU_12, bOTU_23, bOTU_6, and bOTU_21 (for their taxonomy, please refer to Supplementary File S2), appeared to decrease from T1 to T5 (Figure 5a). Such a declining trend was most evident for bOTU_2, from 4.3% at T1 to 0.4% at T5 (Figure 5a). Proportionally, 33.68~50.38% of these bOTUs was removed with the liquid discharged at the first thawing interval T1, and their removal rates gradually declined as the microwaving proceeded (Table 3). On the contrary, the relative abundances of bOTU_1, bOTU_8, bOTU_7, bOTU_35, and bOTU_4 (for their taxonomy, please refer to Supplementary File S2) tended to increase from T1 to T5 (Figure 5b). The increasing pattern was most noticeable for bOTU_1, from 1% at T1 to 9.8% at T5 (Figure 5b). In total, the liquid water discharged at T1 merely removed less than 3% of them, and 30–50% subsets remained in the ice residues at T5 (Table 3).
Similar patterns were also observed for the top-abundant fungi, where fOTU_1, fOTU_4, fOTU_7, fOTU_5, and fOTU_9 (for their taxonomy, please refer to Supplementary File S2) declined from 5~13% at T1 to less than 1% at T5 (Figure 5c). Up to 76.30% of these fOTUs (e.g., fOTU_7) were removed at T1, leaving less than 5.77% in the ice residues remaining at T5 (Table 3). Meanwhile, the fOTU_2, fOTU_1403, fOTU_1533, fOTU_274, and fOTU_28 (for their taxonomy, please refer to Supplementary File S2) became enriched with the thawing intervals (Figure 5d). For fOTU_2, its relative abundance increased from 1% at T1 to 18% at T5 (Figure 5d). The first thawing interval only discharged less than 4.27% of them, with up to 67.84% (e.g., fOTU_28) being stored in the ice residues melted at T5 (Table 3).

3.5. Cumulative Relative Abundances of Microbes with Different Functions

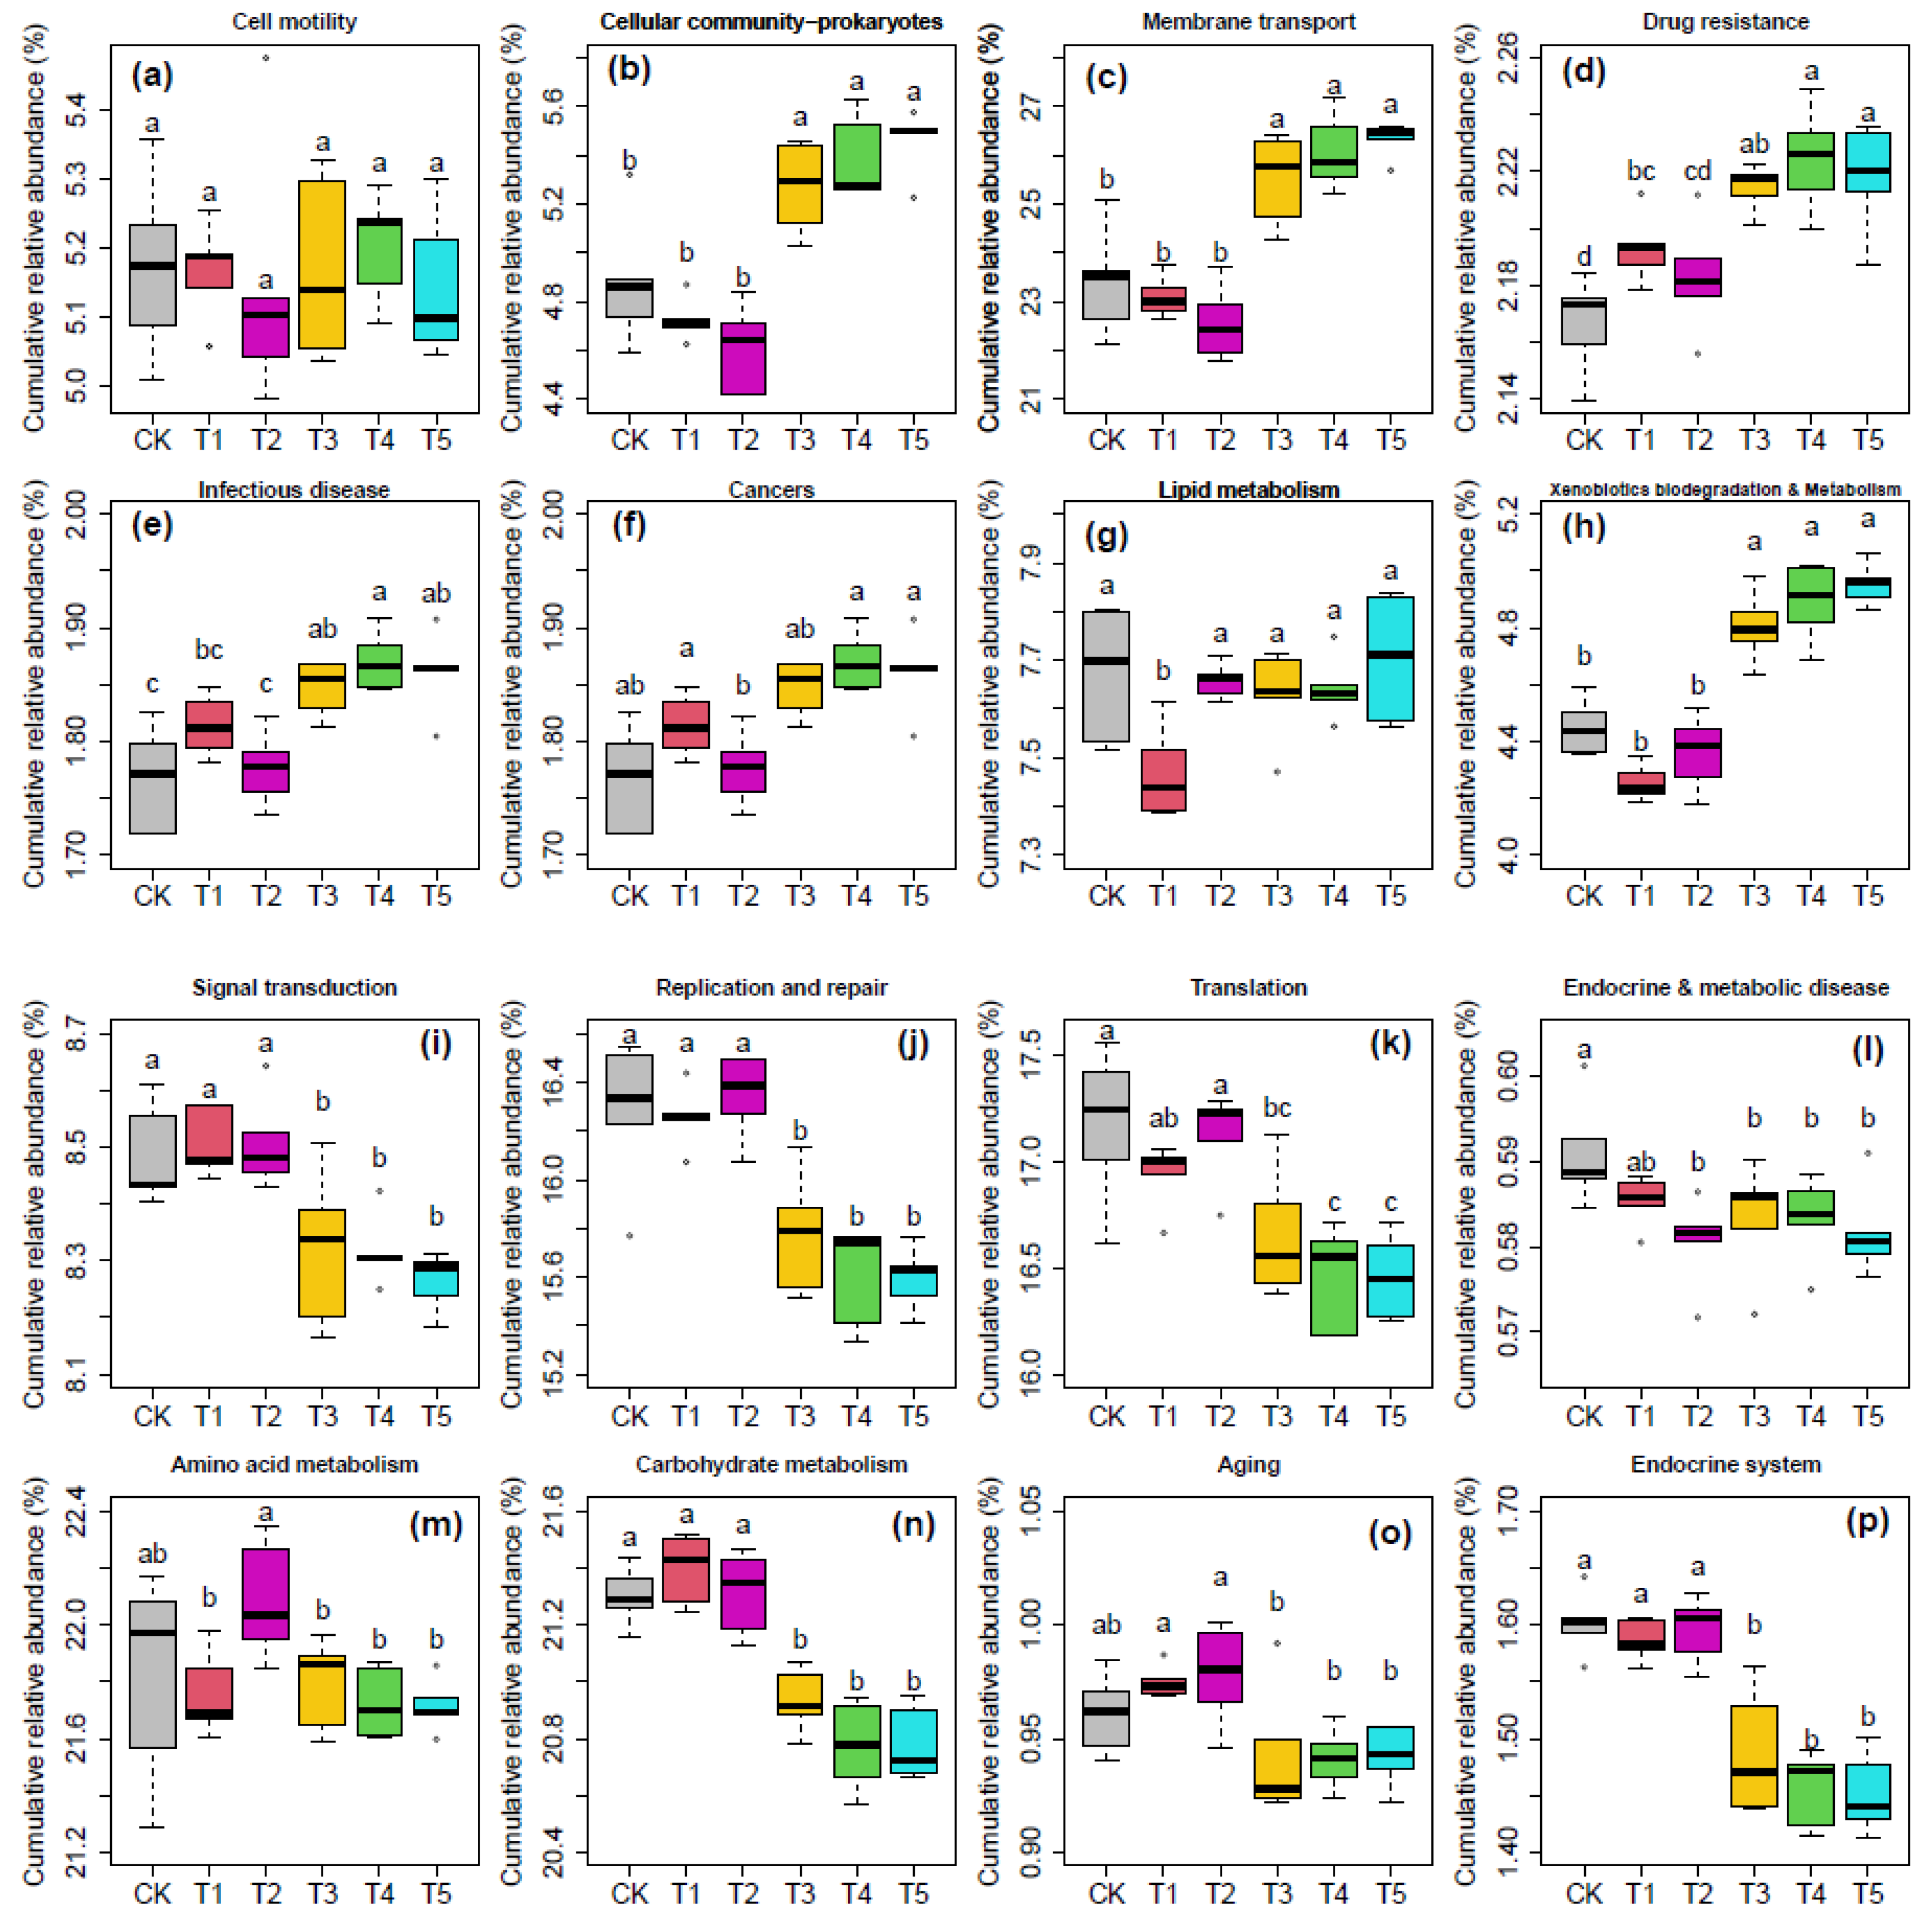
The unfrozen wastewater CK was in general rich in bacteria with functions of environmental information processing (e.g., on average 23.39% with membrane transport, Figure 6c), genetic information processing (e.g., 16.28% with replication and repair, Figure 6j; 17.17% with translation, Figure 6k), and metabolism (e.g., 21.82% with amino acid metabolism, Figure 6m; and 21.30% with carbohydrate metabolism, Figure 6n). Across the five microwaving intervals, the relative bacterial abundances at the first two intervals T1 and T2 were in general significantly different from that in the last three intervals T3, T4, and T5 (p < 0.05, Figure 6). Specifically, the bacteria with the following functions were significantly depleted at the last two intervals T4 and T5 (p < 0.05): signal transduction (down to 8.26%, Figure 6i); replication and repair (down to 15.59%, Figure 6j); translation (down to 16.46%, Figure 6k); endocrine diseases (down to 0.58%, Figure 6p); carbohydrate metabolism (down to 20.78%, Figure 6n); aging (down to 0.94%, Figure 6o); and endocrine system (down to 1.45%, Figure 6p). On the contrary, the bacteria with the following functions were significantly enriched at the last two intervals T4 and T5 (p < 0.05): cellular community of prokaryotes (up to 5.46%, Figure 6b); membrane transport (up to 26.33%, Figure 6c); drug resistance (up to 2.22%, Figure 6d); infectious diseases (up to 1.86%, Figure 6e); cancers (up to 1.86%, Figure 6f); and xenobiotics biodegradation and metabolism (up to 4.98%, Figure 6h).
In the unfrozen wastewater CK, on average, 9.89% of the fungi was associated with saprotrophic function (Figure 7b), 6.95% was symbiotic (Figure 7c), and less than 1% was pathogenic (Figure 7a). After frozen and microwave thawing, the relative abundances of the pathogenic fungi ranged between 0.65% and 4.45% at T1 and T2, and then gradually declined to 0.56% at T5 (Figure 7a). Yet, the differences of pathogenic fungi among the five microwaving intervals were not significant (p > 0.05). The relative abundances of the saprotrophic fungi at T1 were comparable with that in the unfrozen CK (10.51% vs. 9.89%), but then significantly increased from 4.88% at T2 to 27.94% at T5 on average (Figure 7b). The relative abundances of symbiotic fungi were significantly enriched to 14.46% at T1, and then gradually declined to a significantly lower abundance of 0.75% at T5 (Figure 7c).

4. Discussion

4.1. Microwave Can Facilitate Wastewater Freeze–Thaw Purification Process

The feasibility of using freeze–thaw to remove impurities and help purify wastewater have been intelligibly illustrated by the significantly reduced turbidity, EC, and microbial richness in the end product water yielded at T5 (Figure 1, Table 1 and Table 2). Meanwhile, the advantages of using microwave to facilitate the freeze–thaw purification process has been clearly demonstrated by the evidently improved purification efficiency; it only took 8 min (two thawing intervals) and 38.8% water to remove more than 75% of the total dissolved salt, and merely 11 min to reach the removal efficiency greater than 90% (Table 2). Specifically, during the freezing, because impurities such as particles, flocs, salt, and microbes cannot enter the ice crystal lattice, they were rejected into the unfrozen water as the ice front advanced from the outer colder zone to the inner warmer zone. Consequently, this formed numerous brine pockets with concentrated EC and a higher density of flocs and microbes, fingering into the bulk ice. As the microwave started to thaw the ice block, because the brine pockets full of impurities had a much greater dielectric constant than the ice, they were preferentially heated by the high-frequency electromagnetic field. The thermally expanded brine pockets were then gradually connected to form drainage channels. Over the first thawing interval T1, the readily passible drainage channels, primarily connected from larger-sized brine pockets full of coarse particles and concentrated salts, were purged out of the ice residues first, yielding turbid liquid (turbidity as high as 21.2 NTU) with visible flocs and more than two-folded EC (1795.47 μS cm−1 at T1 vs. 804.67 μS cm−1 of CK, Figure 1, Table 2). As the microwave thawing proceeded, more drainage channels were formed from the minor brine pockets, and progressively discharged the remaining impurities that were previously encapsulated. Meanwhile, the ice crystals started to thaw into pure water, accompanied with the gradually decreasing brine concentration drained from the pockets, resulted in declining patterns for the turbidity and EC at T2 and T3 (Figure 1, Table 2). At the last two thawing intervals T4 and T5, since all the visible impurities and more than 90% of the dissolved salt had been removed at previous intervals, the liquid water melted from the remaining ice residues was freshly clean, with turbidity as low as 3.1 NTU and a significantly lower EC of merely 66.09 μS cm−1 (Figure 1, Table 2).
By separately comparing the liquid yielded at different thawing intervals, this study offered a good opportunity to capture the progressive removal of impurities over different thawing stages. The significantly great removal efficiency at T1 and T2 (up to 75% for dissolved salt and 71% for E. coli) further highlights that the early thawing stage is essentially critical when applying freeze–thaw to purify wastewater. The significantly improved time efficiency observed in this study, from 14.5 h of natural thawing to minutes of microwaving, is in good line with the reports by Tang and his colleagues [19,20], who successfully applied microwaving to speed up the desalting cycle of seawater to a desalination rate up to 93%. However, it must be acknowledged that even though the temperature of liquid water discharged at each microwave interval was no higher than 25 °C (Table 2), there might be localized overheating, especially in or around the brine pockets. This might have lethal or selectively inhibiting impacts on microbial compositions and their adaptability regimes to the stressed conditions at different microwave intervals [22]. Future studies should examine the absolute abundances of individual microbial subsets so as to further quantify whether or how much the high-frequency electromagnetic field produced by microwaving affects bacterial or fungal communities and functions. Prolonged microwave and thus hot or even boiling conditions may further help to eliminate pathogenic microbes more efficiently [21].

4.2. Unequal Responses of Different Microbial Subsets to Freezing and Progressive Thawing

The significantly reduced abundance of E. coli (from 0.84% at T1 to 0.07% T5, Table 2) indicated that most of the harmful bacteria can be effectively removed by the freeze–thaw process. The significantly different α and β diversity (Figure 3) and the distinguished clusters of T1, T5, and CK identified in the bacterial and fungal co-occurrence networks (Figure 4) clearly demonstrate that the bacterial and fungal communities were sensitive to stepwise thawing and discharge. On the one hand, the overlapped modules and the shared OTUs between T1 and CK (marked by purple in Figure 4a,b) collectively indicate that the removal of microbes by freeze–thaw was selective. On the other hand, the distantly separated bacterial module 5 (predominated by T5 in Figure 4a) and fungal module 3 (predominated by T5 in Figure 4b) illustrate that the bacterial and fungal communities compartmentalized in the end product yielded at last were distinctly different from the original wastewater. We propose that individual microbes may associate differently with flocs, brine, or porous ice residues; thus, they were selectively rejected from the ice front during freezing and then preferentially discharged at different rates during progressive thawing.
Specifically, after being rejected from the freezing ice crystals, some microbes likely coated on or embedded in the major impurities concentrated in the larger-sized brine pockets. They were more like hitchhikers, apt to be preferentially discharged with the free-flowing channels formed by the selective microwave heating at the first thawing interval T1. For instance, the bacteria Ferruginibacter from the family Chitinophagaceae (Figure 5a) has been proved to be enriched as salinity increased and associated with syntrophic denitrification metabolisms [24], which likely contributed to the collectively enriched abundance of functional bacteria in amino acid and carbohydrate metabolism (Figure 6m,n). The symbiotic features of the fungal genus Glomus (fOTU_9 in Figure 5c) [25], and the tendency of the chitin-lacking Rozellomycota (fOTU_4 in Figure 5c) to be phagotrophic parasites [26], may collectively contribute to the enriched cumulative relative abundance of symbiotic fungi at T1 and T2 (Figure 7c). The efficient removal of bacteria and fungi at the first two intervals T1 and T2 is in good line with previous studies, which have repeatedly proved the advantages of freeze–thaw in reducing microbial density levels and removing pathogenic microorganisms from wastewater [5,14,15,27].
Some other microbial subsets, after being rejected from the freezing ice crystals, were likely closely attached to or entrapped on the porous surface of the ice front, and thus were more difficult to be freely discharged with the liquid water. In particular, some bacterial species of the family Sphingomonadaceae can degrade xenobiotic and recalcitrant (poly)aromatic compounds [28], which might contribute to the collective enrichment of microbes with the function of xenobiotics’ biodegradation and metabolism predicted by the KEGG metagenomic datasets (Figure 6h). The bacterial genus Legionella (fOTU_5, Figure 5b) was closely related to respiratory disease and can cause Pontiac fever in the elderly and smokers [29], which may collectively contribute to the collective enrichment of the microbes with a function of human disease (Figure 7). If discharging such end products to a local waterbody, even with limited absolute density, it is likely to cause unpredictable risks to irrigation sources, plants, animals, and eventually to human health.

4.3. Implications and Limitations

By concentrating 75% of dissolved salts, microbes and other impurities into a disproportionally low volume of water (i.e., merely 38.8% of the total amount), freeze–thaw significantly reduced the total volume of highly polluted wastewater by more than 60%. In this way, only the 38.8% waste stream was highly concentrated with chemical and microbial pollutants and thus required targeted treatments (e.g., repeated freeze–thaw or bio-digestion). This, to a large extent, helped to save facilities and economic costs. Therefore, for the mid-to-high-latitude regions, natural freeze–thaw can be used as a labor-saving pre-treatment to help reduce the total volume of wastewater. Depending on the final usage of the end product (e.g., as an irrigation source or for livestock consumption), the freeze–thaw procedures can be reduced or reinforced, to optimize a most time- and cost-efficient purification plan. For instance, for irrigation purposes, one round of freeze–thaw can easily remove a majority of the impurities by collecting the preferentially discharged meltwater and leaving the ice residues to freely thaw into reasonably clean water with the least energy costs. Yet, for heavily polluted water (e.g., from industrial or mining operation) or stricter requirements for the end product quality (e.g., potable water), freeze–thaw can be applied as a pre-treatment, in which the conditioned wastewater with less contamination can be further processed with targeted bio-digestion. Repeated freeze–thaw cycles can also be applied to the previously discharged brine to obtain higher dewaterability and less but more concentrated brine to be discarded as residues. Where microwave is applicable, the purification efficiency can be further facilitated. For instance, with the microwave equipment employed in this study (total volume of ca. 25 L), it only took 8 min and 106 Wh (384 kJ) to remove 75% of the impurities from a 2 L wastewater sample at a unit energy cost of 53 Wh L−1 (198 kJ L−1). Given the spacious volume size of the microwave equipment, the unit energy cost can be further reduced by simply placing a larger-sized wastewater sample. Therefore, although promising, a full life cycle assessment on cumulative energy cost is required before promoting the freeze–thaw approach, especially if integrated with microwave. It also warrants future studies to develop advanced technologies that can be applied at a large scale with reasonable energy and economic costs.
Apart from the freeze–thaw treatment as intentionally applied in this study, natural freeze–thaw events can also differentiate water, salt, nutrients, and microbes in rivers, snowpack, glaciers, wetlands, and seasonally thawing soils [30,31]. The distinguishably low solubility in ice and in turn the unequal discharge rates change the distribution and migration patterns of different organic or inorganic components across the upper and lower layer of soil or ice, as well in runoff over spring [32,33]. Therefore, over such freeze–thaw events in the natural field, the preferential melting and discharging rates during progressive thawing would also cause the selective transport and mass movement of microbes over fractionated temporal and spatial scales. Depending on the composition and functions of microbial subsets progressively discharged, the temporal pulses of elements and microbes released from seasonally frozen rivers and wetlands would further pose non-negligible impacts on downstream waterbodies.

5. Conclusions

Ice blocks frozen from natural wastewater were progressively thawed using microwave equipment, and the discharged water was collected at five predetermined intervals. Within 8 min of microwave thawing, about 75% of the impurities, dissolved salt, and pathogenic E. coli. Were removed by discharging 38.8% of the total water volume at the first two thawing intervals, and merely 11 min were needed to reach a removal rate greater than 90%. In the end product, after 20 min of microwave thawing, there remained less than 2% of the total dissolved salt and about 4.36% of the pathogenic E. coli. The bacterial and fungal compositions, diversity, modularity, and predicted functions were significantly different among the five progressive thawing intervals (p < 0.05), suggesting that the microbes were also sensitive to progressive thawing and discharge. Overall, by separately comparing the liquid yielded at different thawing intervals, this study offered a good opportunity to capture the progressive microbial community shifts over different thawing stages. On the one hand, the efficient reduction in impurities and the selective removal of pathogenic microbes with the liquid water preferentially discharged at the beginning of the thawing stage demonstrate the feasibility of using freeze–thaw to purify wastewater. On the other hand, the selective enrichment of some potentially harmful microbial subsets in the end product alarm the unpredictable environmental risks if discharging such an end product to a local waterbody without further treatment, such as targeted bio-digestion. In future studies, absolute microbial density levels should be investigated in depth to overcome the potential bias represented by the relative abundances of individual OTUs to better identify the variations in microbial enrichment or depletion among progressive thawing stages.

Supplementary Materials

The following supporting information can be downloaded at: https://www.mdpi.com/article/10.3390/w15203664/s1, File S1: KEGG Genes Stat; File S2: top abundant OTUs.

Author Contributions

Conceptualization, X.L. and Y.H.; methodology, X.L.; software, Y.H.; validation, S.J. and B.Y.; formal analysis, Y.H.; investigation, X.L. and Y.H.; resources, J.C.; writing—original draft preparation, Y.H.; writing—review and editing, X.L. and S.J.; visualization, Y.H.; supervision, B.Y.; project administration, J.C.; funding acquisition, Y.H. and X.L. All authors have read and agreed to the published version of the manuscript.

Funding

This study was financially supported by the National Natural Science Foundation of China (52279049), the West Light Foundation of the Chinese Academy of Sciences (XAB2020YN03), and the Fundamental Research Funds for the Central Universities (Northwest A&F University, 2452020338).

Data Availability Statement

The data presented in this study are available on request from the corresponding author. The data are not publicly available due to regulations of the wastewater treatment plant.

Conflicts of Interest

The authors declare no conflict of interest.

References

  1. Thebo, A.L.; Drechsel, P.; Lambin, E.F.; Nelson, K.L. A Global, Spatially-Explicit Assessment of Irrigated Croplands Influenced by Urban Wastewater Flows. Environ. Res. Lett. 2017, 12, 74008. [Google Scholar] [CrossRef]
  2. Zhu, Y.; Gillings, M.; Simonet, P.; Stekel, D.; Banwart, C.H. Microbial Mass Movements. Science 2017, 357, 1099–1100. [Google Scholar] [CrossRef] [PubMed]
  3. Singh, A. A Review of Wastewater Irrigation: Environmental Implications. Resour. Conserv. Recycl. 2021, 168, 105454. [Google Scholar] [CrossRef]
  4. Chen, L.C.; Chian, C.Y.; Yen, P.S.; Chu, C.P.; Lee, D.J. High-Speed Sludge Freezing. Water Res. 2001, 35, 3502–3507. [Google Scholar] [CrossRef] [PubMed]
  5. Chu, C. Reduction of Microbial Density Level in Wastewater Activated Sludge via Freezing and Thawing. Water Res. 1999, 33, 3532–3535. [Google Scholar] [CrossRef]
  6. Gao, W.; Shao, Y. Freeze Concentration for Removal of Pharmaceutically Active Compounds in Water. Desalination 2009, 249, 398–402. [Google Scholar] [CrossRef]
  7. Melak, F.; Du Laing, G.; Ambelu, A.; Alemayehu, E. Application of Freeze Desalination for Chromium (VI) Removal from Water. Desalination 2016, 377, 23–27. [Google Scholar] [CrossRef]
  8. Mtombeni, T.; Maree, J.P.; Zvinowanda, C.M.; Asante, J.K.O.; Oosthuizen, F.S.; Louw, W.J. Evaluation of the Performance of a New Freeze Desalination Technology. Int. J. Environ. Sci. Technol. 2013, 10, 545–550. [Google Scholar] [CrossRef]
  9. Tao, T.; Peng, X.F.; Lee, D.J. Interaction between Wastewater-Sludge Floc and Moving Ice Front. Chem. Eng. Sci. 2006, 61, 5369–5376. [Google Scholar] [CrossRef]
  10. John, M.; Häkkinen, A.; Louhi-Kultanen, M. Purification Efficiency of Natural Freeze Crystallization for Urban Wastewaters. Cold Reg. Sci. Technol. 2020, 170, 102953. [Google Scholar] [CrossRef]
  11. Vrbka, L.; Jungwirth, P. Brine Rejection from Freezing Salt Solutions: A Molecular Dynamics Study. Phys. Rev. Lett. 2005, 95, 148501. [Google Scholar] [CrossRef]
  12. Khawaji, A.D.; Kutubkhanah, I.K.; Wie, J.-M. Advances in Seawater Desalination Technologies. Desalination 2008, 221, 47–69. [Google Scholar] [CrossRef]
  13. Parker, L.V.; Yushak, M.L.; Martel, C.J.; Reynolds, C.M. Bacterial Survival in Snow Made from Wastewater; Cold Regions Research & Engineering Laboratory, US Army Corps of Engineers: Minneapolis, MN, USA, 2000; pp. 1–15. [Google Scholar]
  14. Gao, W.; Smith, D.W.; Li, Y. Natural Freezing as a Wastewater Treatment Method: E. Coli Inactivation Capacity. Water Res. 2006, 40, 2321–2326. [Google Scholar] [CrossRef]
  15. Gao, W.; Smith, D.W.; Li, Y. Effects of Freezing on the Survival of Escherichia Coli and Bacillus and Response to UV and Chlorine After Freezing. Water Environ. Res. 2007, 79, 507–513. [Google Scholar] [CrossRef]
  16. Parker, L.V.; Martel, C.J. Long-Term Survival of Enteric Microorganisms in Frozen Wastewater; Engineer Research and Development Center, US Army Corps of Engineers: Minneapolis, MN, USA, 2002; pp. 1–56. [Google Scholar]
  17. Gu, W.; Lin, Y.; Xu, Y.; Yuan, S.; Tao, J.; Li, L.; Liu, C. Sea Ice Desalination under the Force of Gravity in Low Temperature Environments. Desalination 2012, 295, 11–15. [Google Scholar] [CrossRef]
  18. Xie, L.; Ma, J.; Cheng, F.; Li, P.; Liu, J.; Chen, W.; Wang, S. Study on Sea Ice Desalination Technology. Desalination 2009, 245, 146–154. [Google Scholar] [CrossRef]
  19. Tang, W.; Shi, P.; Wang, J.; Zhang, H. Sea Ice Centrifugal Desalination Based on Microwave Heating. Desalination 2019, 449, 1–5. [Google Scholar] [CrossRef]
  20. Tang, W.; Tao, J.; Wang, J.; Liu, C.; Zhang, H. Sea Ice Desalination under Gravity Using Microwave Heating. Desalination 2018, 430, 159–164. [Google Scholar] [CrossRef]
  21. Liu, Y.; Kumblathan, T.; Uppal, G.K.; Zhou, A.; Moe, B.; Hrudey, S.E.; Li, X.-F. A Hidden Risk: Survival and Resuscitation of Escherichia Coli O157:H7 in the Viable but Nonculturable State after Boiling or Microwaving. Water Res. 2020, 183, 116102. [Google Scholar] [CrossRef]
  22. Zieliński, M.; Ciesielski, S.; Cydzik-Kwiatkowska, A.; Turek, J.; Dębowski, M. Influence of Microwave Radiation on Bacterial Community Structure in Biofilm. Process Biochem. 2007, 42, 1250–1253. [Google Scholar] [CrossRef]
  23. Hartman, K.; van der Heijden, M.G.A.; Wittwer, R.A.; Banerjee, S.; Walser, J.-C.; Schlaeppi, K. Cropping Practices Manipulate Abundance Patterns of Root and Soil Microbiome Members Paving the Way to Smart Farming. Microbiome 2018, 6, 14. [Google Scholar] [CrossRef]
  24. Rodriguez-Sanchez, A.; Leyva-Diaz, J.C.; Gonzalez-Lopez, J.; Poyatos, J.M. Membrane Bioreactor and Hybrid Moving Bed Biofilm Reactor-Membrane Bioreactor for the Treatment of Variable Salinity Wastewater: Influence of Biomass Concentration and Hydraulic Retention Time. Chem. Eng. J. 2018, 336, 102–111. [Google Scholar] [CrossRef]
  25. Rodrigues, K.M.; Rodrigues, B.F. Chapter 27—Glomus. In Beneficial Microbes in Agro-Ecology; Amaresan, N., Senthil Kumar, M., Annapurna, K., Kumar, K., Sankaranarayanan, A., Eds.; Academic Press: Cambridge, MA, USA, 2020; pp. 561–569. ISBN 978-0-12-823414-3. [Google Scholar]
  26. Powell, M.J.; Letcher, P.M.; James, T.Y. Ultrastructural Characterization of the Host–Parasite Interface between Allomyces Anomalus (Blastocladiomycota) and Rozella Allomycis (Cryptomycota). Fungal Biol. 2017, 121, 561–572. [Google Scholar] [CrossRef] [PubMed]
  27. Dilek Sanin, F.; Aarne Vesilind, P.; James Martel, C. Pathogen Reduction Capabilities of Freeze/Thaw Sludge Conditioning. Water Res. 1994, 28, 2393–2398. [Google Scholar] [CrossRef]
  28. Rosenberg, E.; DeLong, E.F.; Lory, S.; Stackebrandt, E.; Thompson, F. (Eds.) The Prokaryotes: Alphaproteobacteria and Betaproteobacteria; Springer: Berlin/Heidelberg, Germany, 2014; ISBN 978-3-642-30196-4. [Google Scholar]
  29. Bartram, J. (Ed.) Legionella and the Prevention of Legionellosis; World Health Organization: Geneva, Switzerland, 2007; ISBN 978-92-4-156297-3. [Google Scholar]
  30. Shen, Q.; Wang, X.; Qu, F.; Xiao, Z.; Zhang, X.; Zhang, S. Responses of Soil Total Phosphorus to Freeze and Thaw Cycles in a Mollisol Watershed. Geoderma 2020, 376, 114571. [Google Scholar] [CrossRef]
  31. Yergeau, E.; Kowalchuk, G.A. Responses of Antarctic Soil Microbial Communities and Associated Functions to Temperature and Freeze–Thaw Cycle Frequency. Environ. Microbiol. 2008, 10, 2223–2235. [Google Scholar] [CrossRef]
  32. Zhou, Y.; Hiller, C.; Andersson, S.; Jakobsson, E.; Zhou, L.; Hawkes, J.A.; Kothawala, D.N.; Tranvik, L. Selective Exclusion of Aromatic Organic Carbon During Lake Ice Formation. Geophys. Res. Lett. 2023, 50, e2022GL101414. [Google Scholar] [CrossRef]
  33. Fujii, K.; Hayakawa, C. Fluxes of Dissolved Organic Matter and Nitrate and Their Contribution to Soil Acidification across Changing Permafrost Landscapes in Northwestern Canada. Geoderma 2023, 430, 116306. [Google Scholar] [CrossRef]
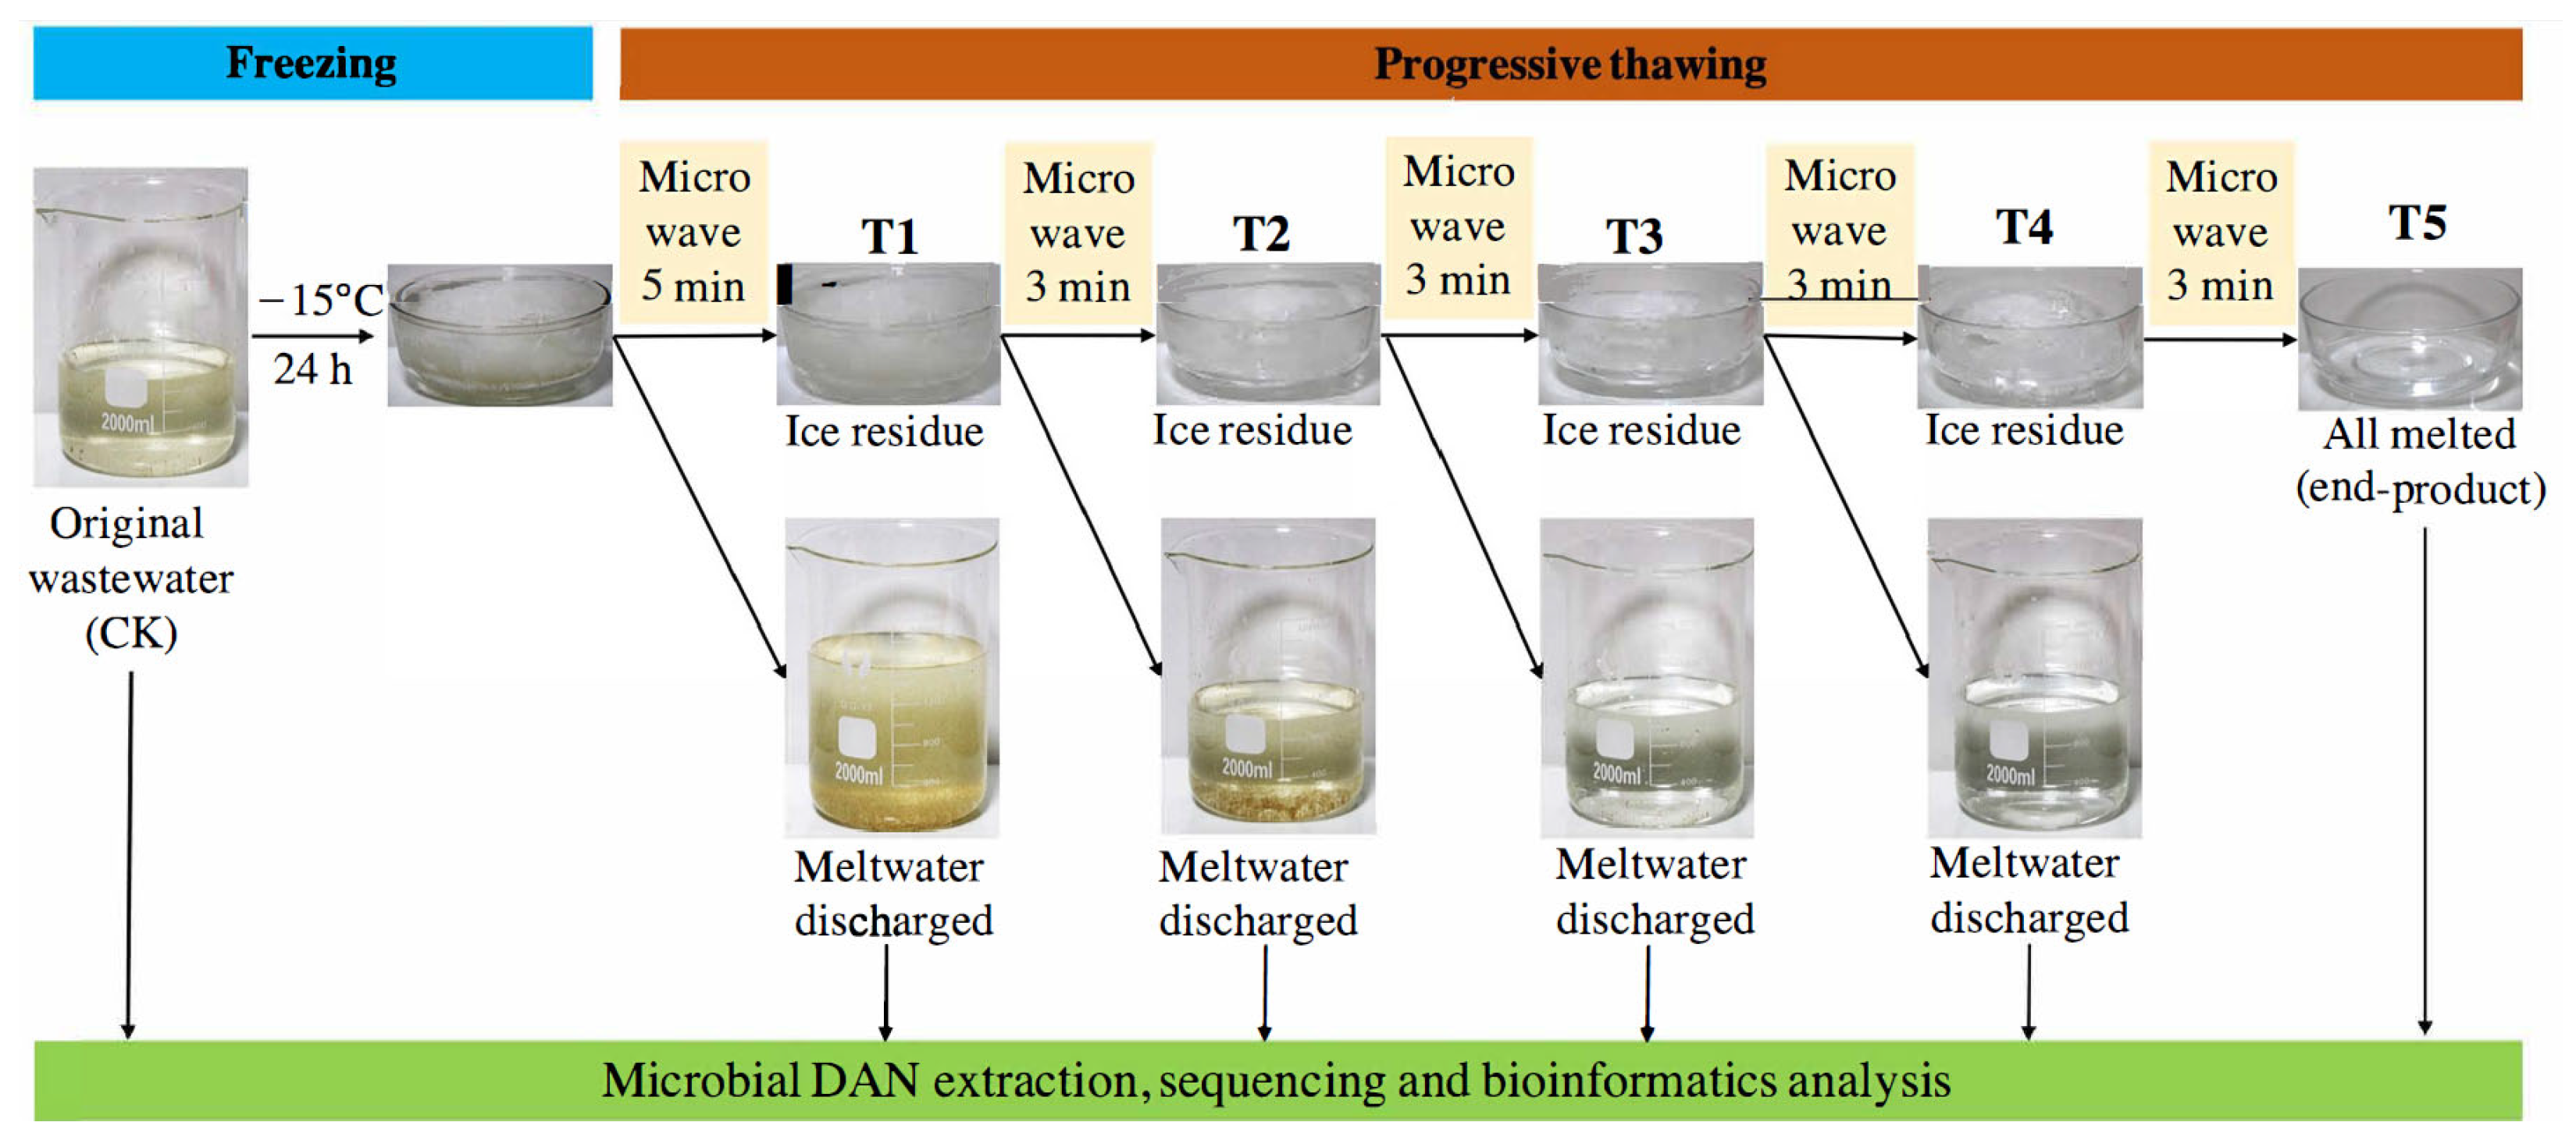
Figure 1. Schematic of the experimental design. Note: the volume in the CK was merely a fifth of the total amount frozen.
Water 15 03664 g001
Figure 2. Relative abundance of bacteria (a) at phylum level and fungi (b) at class level in the unfrozen wastewater (CK) and the liquid progressively yielded at five thawing intervals (T1~T5).
Water 15 03664 g002
Figure 3. Shannon index of bacteria (a) and fungi (b) and their NMDS dissimilarities (c,d) in the unfrozen wastewater (CK) and the liquid progressively yielded at five thawing intervals (T1~T5). Different lowercase letters denote the significant differences among the five thawing intervals (n = 5, p < 0.05).
Water 15 03664 g003
Figure 4. Subfigures (a,b) show the co-occurrence networks developed from the significantly different bacterial and fungal OTUs among T1, T5, and CK (p < 0.05). Subfigures (c,d) show the cumulative relative abundances of the bOTUs and fOTUs of T1, T5, and CK in the top-three best clustered modules (n = 5).
Water 15 03664 g004
Figure 5. Variations in the top-abundant bacteria (a,b) and fungi (c,d) across the five thawing intervals (T1~T5). n = 5. Different colors correspond with the CK, T1, T2, T3, T5 and T5 on the X-axis, and the open circles mark the outliers.
Water 15 03664 g005
Figure 6. Cumulative relative abundances of bacteria associated with different functions in the unfrozen wastewater (CK) and the liquid progressively yielded at five thawing intervals (T1~T5). The functions were selected based on the relative abundance of genes with different pathway annotated by KEGG (Supplementary File S1). Different colors correspond with the CK, T1, T2, T3, T5 and T5 on the X-axis, and the open circles mark the outliers. Different lowercases denote the significant differences among the five thawing intervals (n = 5, p < 0.05).
Water 15 03664 g006
Figure 7. Cumulative relative abundances of pathogenic (a), saprotrophic (b), and symbiotic (c) fungi in the unfrozen wastewater (CK) and the liquid progressively yielded at five thawing intervals (T1~T5). Different colors correspond with the CK, T1, T2, T3, T5 and T5 on the X-axis, and the open circles mark the outliers. Different lowercases denote the significant differences among the five thawing intervals (n = 5, p < 0.05).
Water 15 03664 g007
Table 1. Selected properties of the wastewater investigated in this study. n = 3.
pHTurbidity
(NTU)
Alkalinity
(CaCO3 mg L−1)
Total Cation
(mg L−1)
Total Anion
(mg L−1)
Electrical Conductivity
(μS cm−1)
Relative abundance of Escherichia coli
(%)
7.6 ± 0.112.6 ± 0.4182.6 ± 1.2185.9 ± 6.1447.8 ± 5.7804.7 ± 4.20.22
Table 2. Distribution of volume, electrical conductivity, temperature, and removal rates of dissolved salt and E. coli at each thawing interval. n = 32.
T1T2T3T4T5
Interval (min)53333
Volume (mL)463.5 ± 53.9 a302.5 ± 38.7 c359.4 ± 21.7 b376.4 ± 22.3 b448.7 ± 82.1 a
Temperature (°C)6.7 ± 4.7 b19.3 ± 5.6 a20.6 ± 3.4 a20.4 ± 3.2 a20.2 ± 8.2 a
Turbidity (NTU)21.2 ± 2.317.1 ± 1.810 ± 1.38.67 ± 1.03.1 ± 0.2
Electrical Conductivity (μS cm−1)1795.5 ± 182.6 a1163.4 ± 267.4 b676.8 ± 122.5 c294.6 ± 72.3 d66.1 ± 19.6 e
Removal rate of dissolved salt (%)53.1 ± 6.7 a22.1 ± 4.2 b15.6 ± 3.4 c7.1 ± 2.0 d1.99 ± 0.9 e
Removal rate of E. coli (%)40.4 ± 32.630.9 ± 31.318.5 ± 18.85.9 ± 5.84.4 ± 4.1
Note: the different superscripts indicate the significant differences among the five thawing intervals (p < 0.05).
Table 3. Removal rates of the top-abundant bacteria and fungi across the five microwaving intervals (T1~T5). The OTUs are consistent with that in Figure 5.
Removal Rates (%)
Bacteria T1T2T3T4T5
bOTU_247.60 ± 11.6834.26 ± 8.237.83 ± 2.096.63 ± 7.143.68 ± 2.47
bOTU_1249.63 ± 7.2832.38 ± 8.128.01 ± 2.875.71 ± 5.004.27 ± 1.68
bOTU_2341.03 ± 13.6141.01 ± 10.078.15 ± 4.427.50 ± 11.822.31 ± 1.99
bOTU_633.68 ± 6.0215.26 ± 4.3126.48 ± 9.4616.65 ± 1.427.94 ± 6.54
bOTU_2150.38 ± 13.5530.04 ± 9.3811.09 ± 3.205.29 ± 3.653.20 ± 1.61
bOTU_15.90 ± 4.867.97 ± 2.9423.58 ± 6.3128.62 ± 10.0733.92 ± 7.55
bOTU_812.44 ± 3.667.73 ± 3.6722.91 ± 7.2725.45 ± 7.8731.47 ± 9.23
bOTU_74.70 ± 1.653.28 ± 2.0620.60 ± 7.6921.39 ± 3.9250.03 ± 7.10
bOTU_356.13 ± 3.615.50 ± 2.6113.82 ± 4.9125.01 ± 9.2949.54 ± 13.85
bOTU_47.24 ± 3.678.55 ± 3.3923.09 ± 2.1127.54 ± 9.2533.58 ± 10.68
FungifOTU_136.52 ± 8.0432.24 ± 5.2417.53 ± 8.678.12 ± 3.085.58 ± 5.51
fOTU_436.14 ± 11.3234.79 ± 5.8416.13 ± 11.017.94 ± 2.395.00 ± 4.49
fOTU_776.30 ± 10.9516.34 ± 8.863.05 ± 2.682.52 ± 2.131.79 ± 2.28
fOTU_538.48 ± 10.2031.29 ± 5.9016.12 ± 9.478.34 ± 2.615.77 ± 4.71
fOTU_976.15 ± 11.1116.56 ± 9.142.57 ± 1.842.73 ± 2.401.99 ± 2.74
fOTU_22.31 ± 2.431.60 ± 0.789.46 ± 4.7834.02 ± 22.4752.61 ± 20.52
fOTU_14032.22 ± 2.691.55 ± 0.779.55 ± 5.9533.58 ± 23.4953.10 ± 21.50
fOTU_15332.34 ± 2.442.02 ± 1.6127.01 ± 23.688.40 ± 6.9360.22 ± 24.59
fOTU_2744.27 ± 1.746.12 ± 5.3131.42 ± 18.6742.10 ± 30.8216.09 ± 15.20
fOTU_281.78 ± 1.941.15 ± 0.7622.10 ± 19.647.13 ± 7.6767.84 ± 21.42
Disclaimer/Publisher’s Note: The statements, opinions and data contained in all publications are solely those of the individual author(s) and contributor(s) and not of MDPI and/or the editor(s). MDPI and/or the editor(s) disclaim responsibility for any injury to people or property resulting from any ideas, methods, instructions or products referred to in the content.