Article

Three-Dimensional Numerical Analysis and Operational Optimization of High-Efficiency Sedimentation Tank

1
State Key Laboratory of High-Efficiency Flexible Coal Power Generation and Carbon Capture Utilization and Storage, Xi’an TPRI Water-Management and Environmental Protection Co., Ltd., Xi’an 710032, China
2
School of Materials Science and Engineering, Xi’an University of Science and Technology, Xi’an 710054, China
*
Authors to whom correspondence should be addressed.
Water 2023, 15(20), 3656; https://doi.org/10.3390/w15203656
Submission received: 12 September 2023 / Revised: 7 October 2023 / Accepted: 11 October 2023 / Published: 18 October 2023

Abstract

:
The high-efficiency sedimentation tank has a wide range of application prospects in industrial wastewater treatment due to its small footprint, strong resistance to shock loads, and high efficiency. However, the complex flow field distribution inside significantly affects the treatment performance of the high-efficiency tank. In this study, a three-dimensional geometric model of the high-efficiency sedimentation tank was constructed based on an engineering prototype. The corresponding solid–liquid two-phase, whole-process computational fluid dynamics (CFD) model for the high-efficiency sedimentation tank was established using the realizable k-ε turbulent model and the multiple reference frame (MRF) method. The internal structures of the flocculation zone, plug-flow zone, and clarification zone were optimized, and then the influence of operational process conditions on the flocculation treatment performance was investigated. The results indicate that, for the given engineering model, the average turbulent kinetic energy k in the flocculation zone exhibits a trend that initially increases and then decreases with the increase in the diameter and height of the draft tube. The optimal hydraulic conditions for the flocculation zone are achieved when the diameter of the draft tube is 2.5 m and the height is 3.5 m. The average turbulent kinetic energy dissipation rate in the plug-flow/clarification zone tends to decrease first and then increase as the height of the water tunnel and water-retaining weir increases. The optimal hydraulic conditions for the plug-flow and clarification zones are achieved when the height of the water tunnel is 1.0 m and the height of the water-retaining weir is 1.6 m. Under optimal operating conditions (dosage of dense media particles: 40 mg/L, stirring rate: 30 rpm, and inlet velocity: 0.72 m/s), satisfactory overall hydraulic conditions can be achieved throughout the entire high-efficiency sedimentation tank. Comparisons between a high-efficiency settling tank and a conventional clarifier for the treatment of circulating water sewage in a practical implementation reveals that the ballasted high-efficiency settling tank has advantages in terms of high hydraulic loading, high removal efficiency of hardness, small footprint, and low doses of flocculant. This research will provide reference values for the design and operation optimization of high-efficiency sedimentation tanks.

1. Introduction

Owing to its small land footprint and high efficiency, high-efficiency sedimentation tanks are widely used in water or wastewater treatment [1,2,3,4]. For instance, the high-efficiency sedimentation system has been proven to be an efficient and promising technique for the treatment of urban stormwater runoff during the monsoon seasons by virtue of its stable suspended solids removal performance and more compact process compared to conventional flocculation [5]. The high-efficiency sedimentation tank is primarily made up of the mixing zone and the settling zone, both of which possess complex structures [6]. The geometric configuration of a high-efficiency sedimentation tank will influence its flow field distribution and further affect the efficiency of the flocculation and sedimentation process. Therefore, the optimization of the structural design is an important approach to achieve better wastewater treatment effects for the high-efficiency sedimentation tank [7]. In addition, various areas of the high-efficiency sedimentation tank play different functional roles. In the mixing zone (coagulation/flocculation), the flocs should be allowed to grow up and gain enough kinetic energy to cross the overflow wall into the settling zone, while a lower hydraulic shear force is highly desirable for the settling zone to prevent the destruction of the floc structure and achieve good separation efficiency [8]. So, the required hydraulic characteristics differ greatly in different zones of high-efficiency sedimentation tanks. In summary, the geometric structure and operational condition are the two key issues for a high-efficiency sedimentation tank [9,10].
The current design of water treatment reactors and the selection of operating parameters mainly depend on the experience of wastewater engineers [11]. Although the semiempirical experimental method has provided helpful support for water treatment engineering, it is very difficult to provide detailed information about hydrodynamics in the high-efficiency sedimentation tank due to the complex characteristics of flow field distribution [8,12,13]. Thanks to the rapid development of computer technologies, the computational fluid dynamics (CFD) method provides a powerful tool to analyze flow fields in water and wastewater treatment facilities [14,15,16]. For example, Patziger et al. [17] investigated the effect of inlet geometry on the efficiency of the sludge return using a FLUENT-based novel mass transport model. They found that a reasonable alteration of the inlet structure could enhance the stabilities of the sludge–water interface and reduce the transferred sludge mass by approximately 20%. Xu et al. [12] investigated the effects of height/width of the under-through channel on the flow field of a high-rate clarifier by utilizing a two-phase liquid–solid CFD model. It was found that the flow field could be more affected by the height of the under-through channel than its width, and solids’ sedimentation concentration at the bottom of the mixing zone was reduced with the decrease in the height of the under-through channel. Zhang et al. [18] explored the uneven flow phenomenon in a high-efficiency clarifier based on CFD, and it was shown that the uneven distribution of water flow would be suppressed by lengthening the baffles and adding 45° baffles in the high-efficiency clarifier. In summary, CFD has become an efficient and cost-effective tool for the design and optimization of water treatment equipment [19,20,21,22].
While significant progress has been made in analyzing water and wastewater treatment processes with the aid of CFD, previous studies mainly focus on specific regions of the high-efficiency sedimentation tank rather than the overall process [12]. Moreover, few researchers pay attention to the effects of dosage of ballast media and inlet velocity on the clarification performance of high-efficiency sedimentation tanks in the CFD simulations. Therefore, this work aims to discover the distributions of the flow field in the full-scale high-efficiency sedimentation tank by the solid–liquid two-phase CFD model, in which an attempt is made to optimize the geometrical configuration and operating conditions of the sedimentation tank. The flow velocity, turbulent kinetic energy, and rate of turbulent kinetic energy dissipation are used as hydrodynamic indicators to evaluate the flocculation/sedimentation performance [23,24]. Finally, a comparison between a high-efficiency settling tank and a conventional mechanically accelerated clarifier was conducted to illustrate the advantages of the high-efficiency settling tank.

2. Calculation Model and Methods

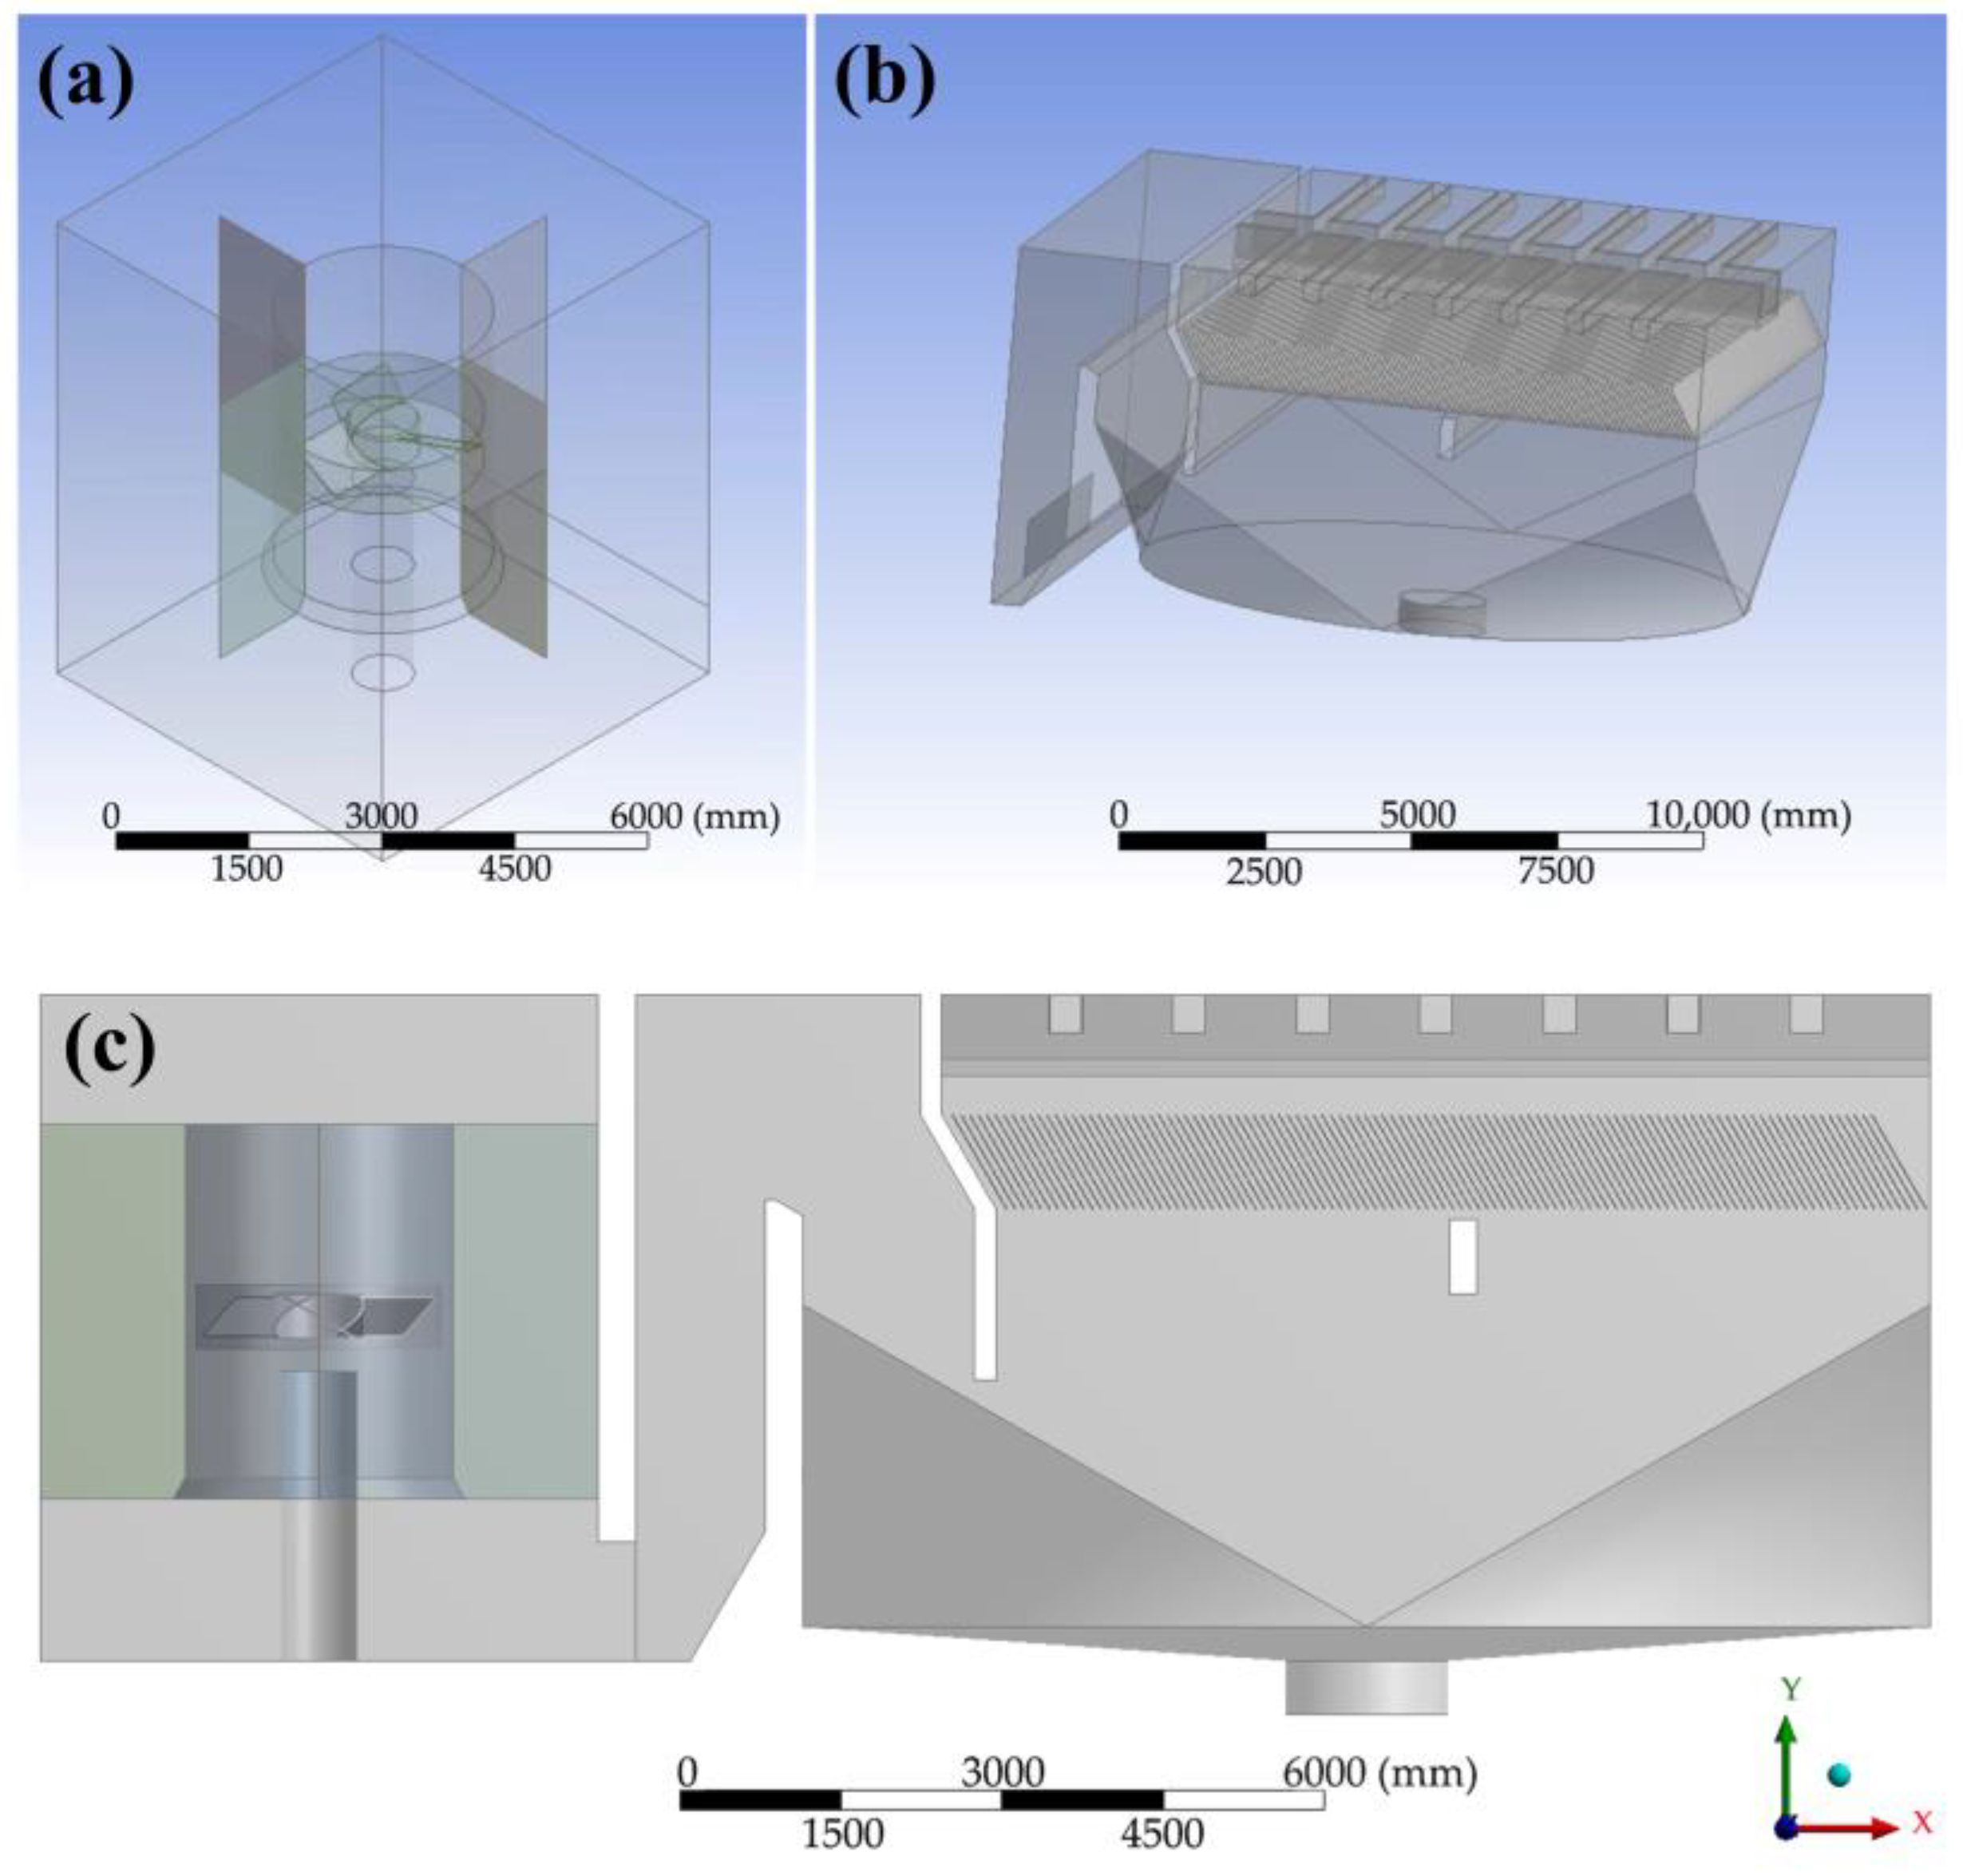
2.1. Geometric Model

The three-dimensional model of the high-efficiency sedimentation tank was constructed at a scale of 1:1 with the engineering prototype using ANSYS Design Modeler (Figure 1). It consisted of a flocculation zone and a plug-flow/clarification zone. The center bottom of the flocculation zone is equipped with a 700 mm diameter cylindrical water inlet, the top of which is 1200 mm longer than the lower edge of the draft tube. In the flocculation zone, the diameter and the height of the draft tube were tuned for hydrodynamic optimization. For the flow/clarification zone, the height of the water tunnel and the water-retaining weir were important geometrical parameters in engineering design. Furthermore, the operation conditions (dosage of heavy medium particles, stirring rate, and inlet velocity) were optimized. Three velocities for inlet (0.72, 0.79, and 0.86 m/s) and three stirring speeds (25, 30, and 35 rpm) were employed in this study.

2.2. Boundary Conditions and Grid Settings

CFD simulations were carried out by commercial software ANSYS Fluent 12.1. The basic control equations used in the simulation consist of the realizable k-ε turbulent model (dispersed), the continuity equation, and the conservation of momentum equation [6]. The velocity and the pressure (1 bar) boundary were set for the inlet and the outlet, respectively. The wall function method is used in the near-wall region, with the stirring paddle and stirring shaft walls defined as moving walls and the other walls as fixed walls. The flow in the rotating region is at the same speed as the stirring paddle, and the interface between the rotating and stationary regions is connected using Interface. The free liquid surface is set to a symmetric boundary condition with no shear. The Phase-Coupled SIMPLE algorithm is used to solve for the turbulent kinetic energy and turbulent kinetic energy dissipation rate in a first-order windward format with a convergence criterion of 10−3.
The unstructured grid is used for the flocculation zone of the high-efficiency sedimentation tank. The multiple reference frame method (MRF), dividing the model into the rotation zone containing the stirring paddle and the stationary zone except for the stirring paddle, was employed to model the stirring process. The rotation zone was considered to be the grid encryption. The total number of grids in the current model is 2,833,212, with a mesh aspect ratio of 40.3, a mean mesh skewness of 0.28, an orthogonal quality of 0.023, and an overall mesh score of 0.8. Those parameters indicate that the current calculation meets the accuracy requirement of engineering design.

3. Results and Discussion

3.1. Optimization of the Flocculation Zone

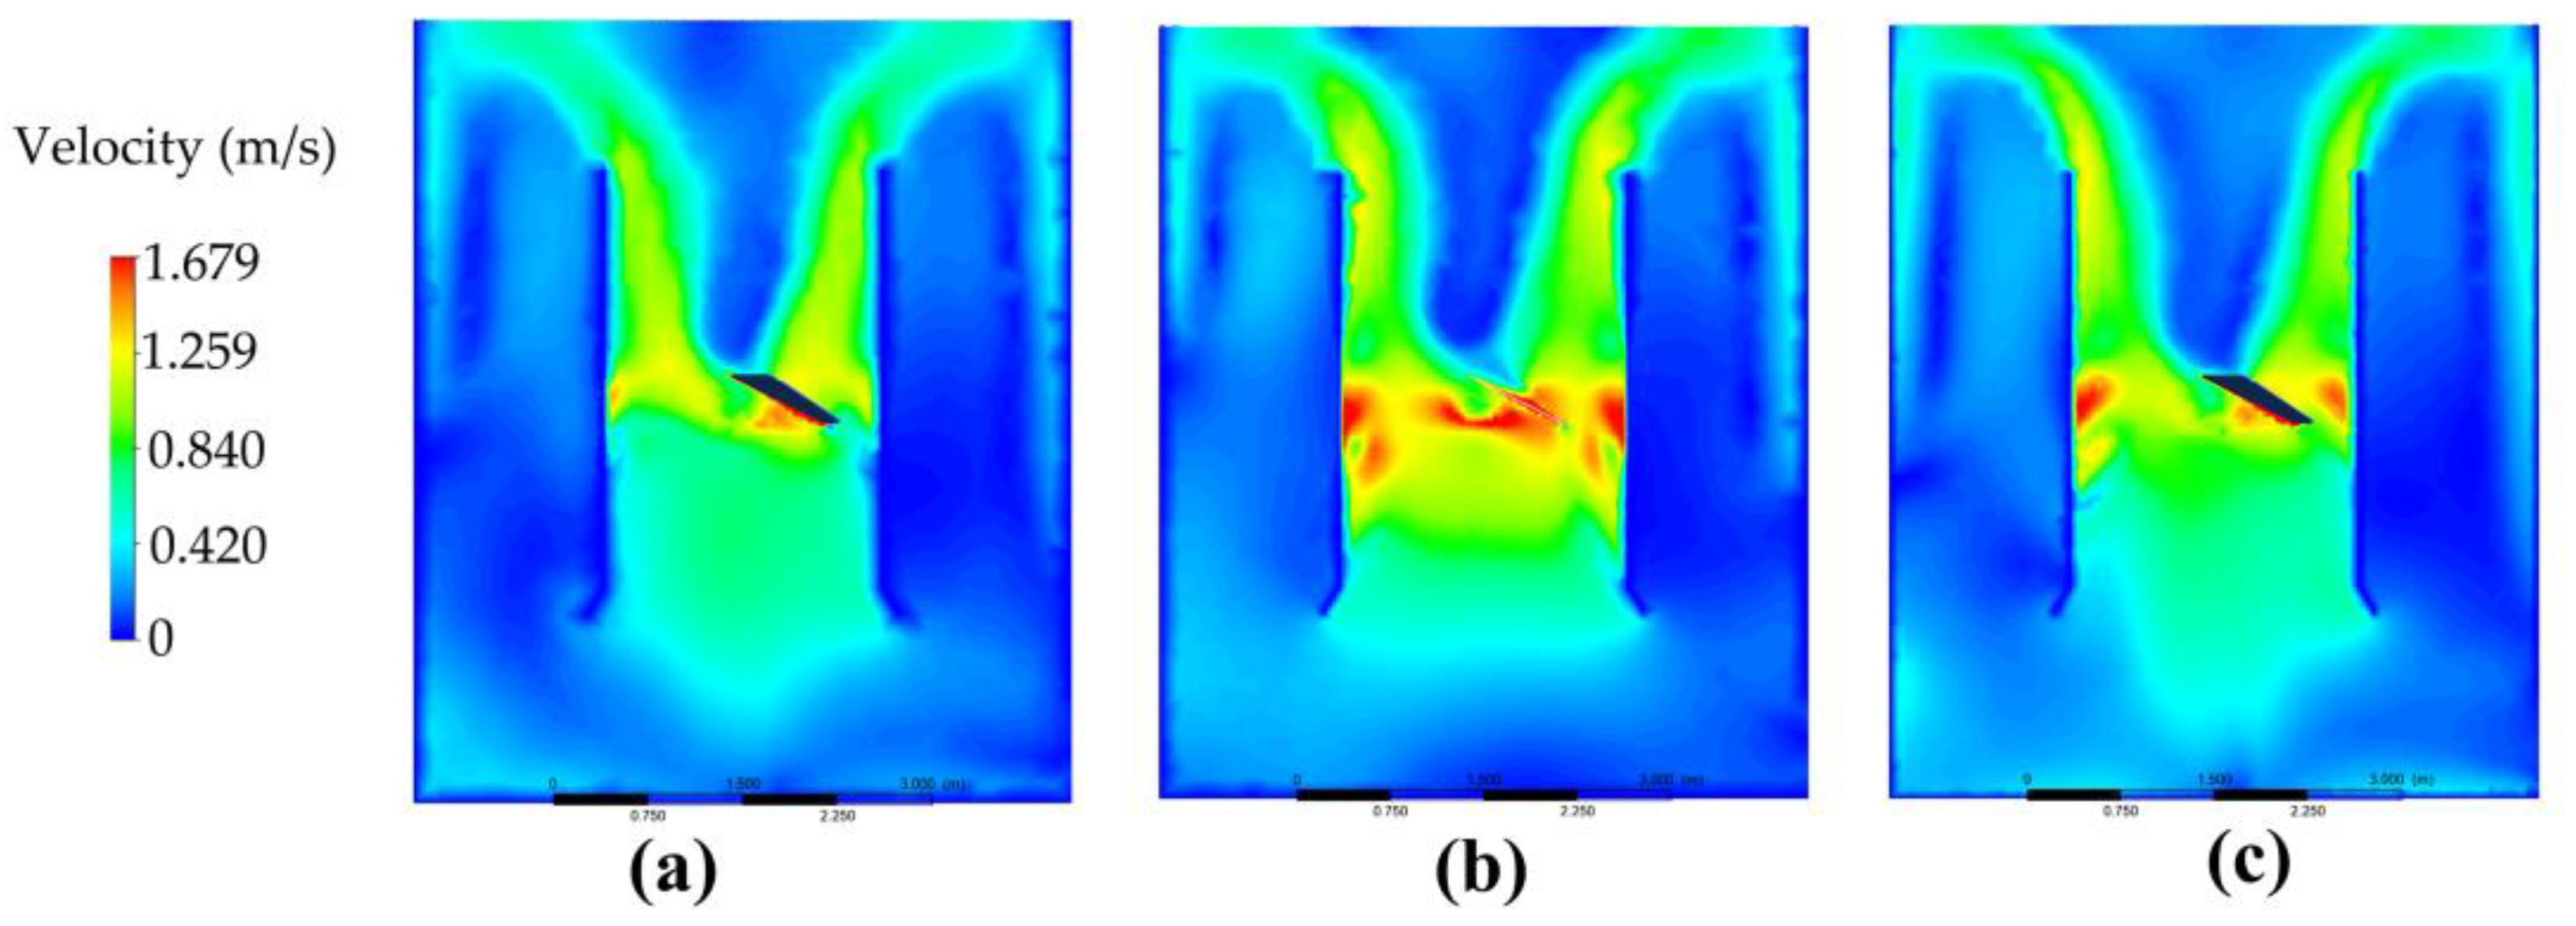
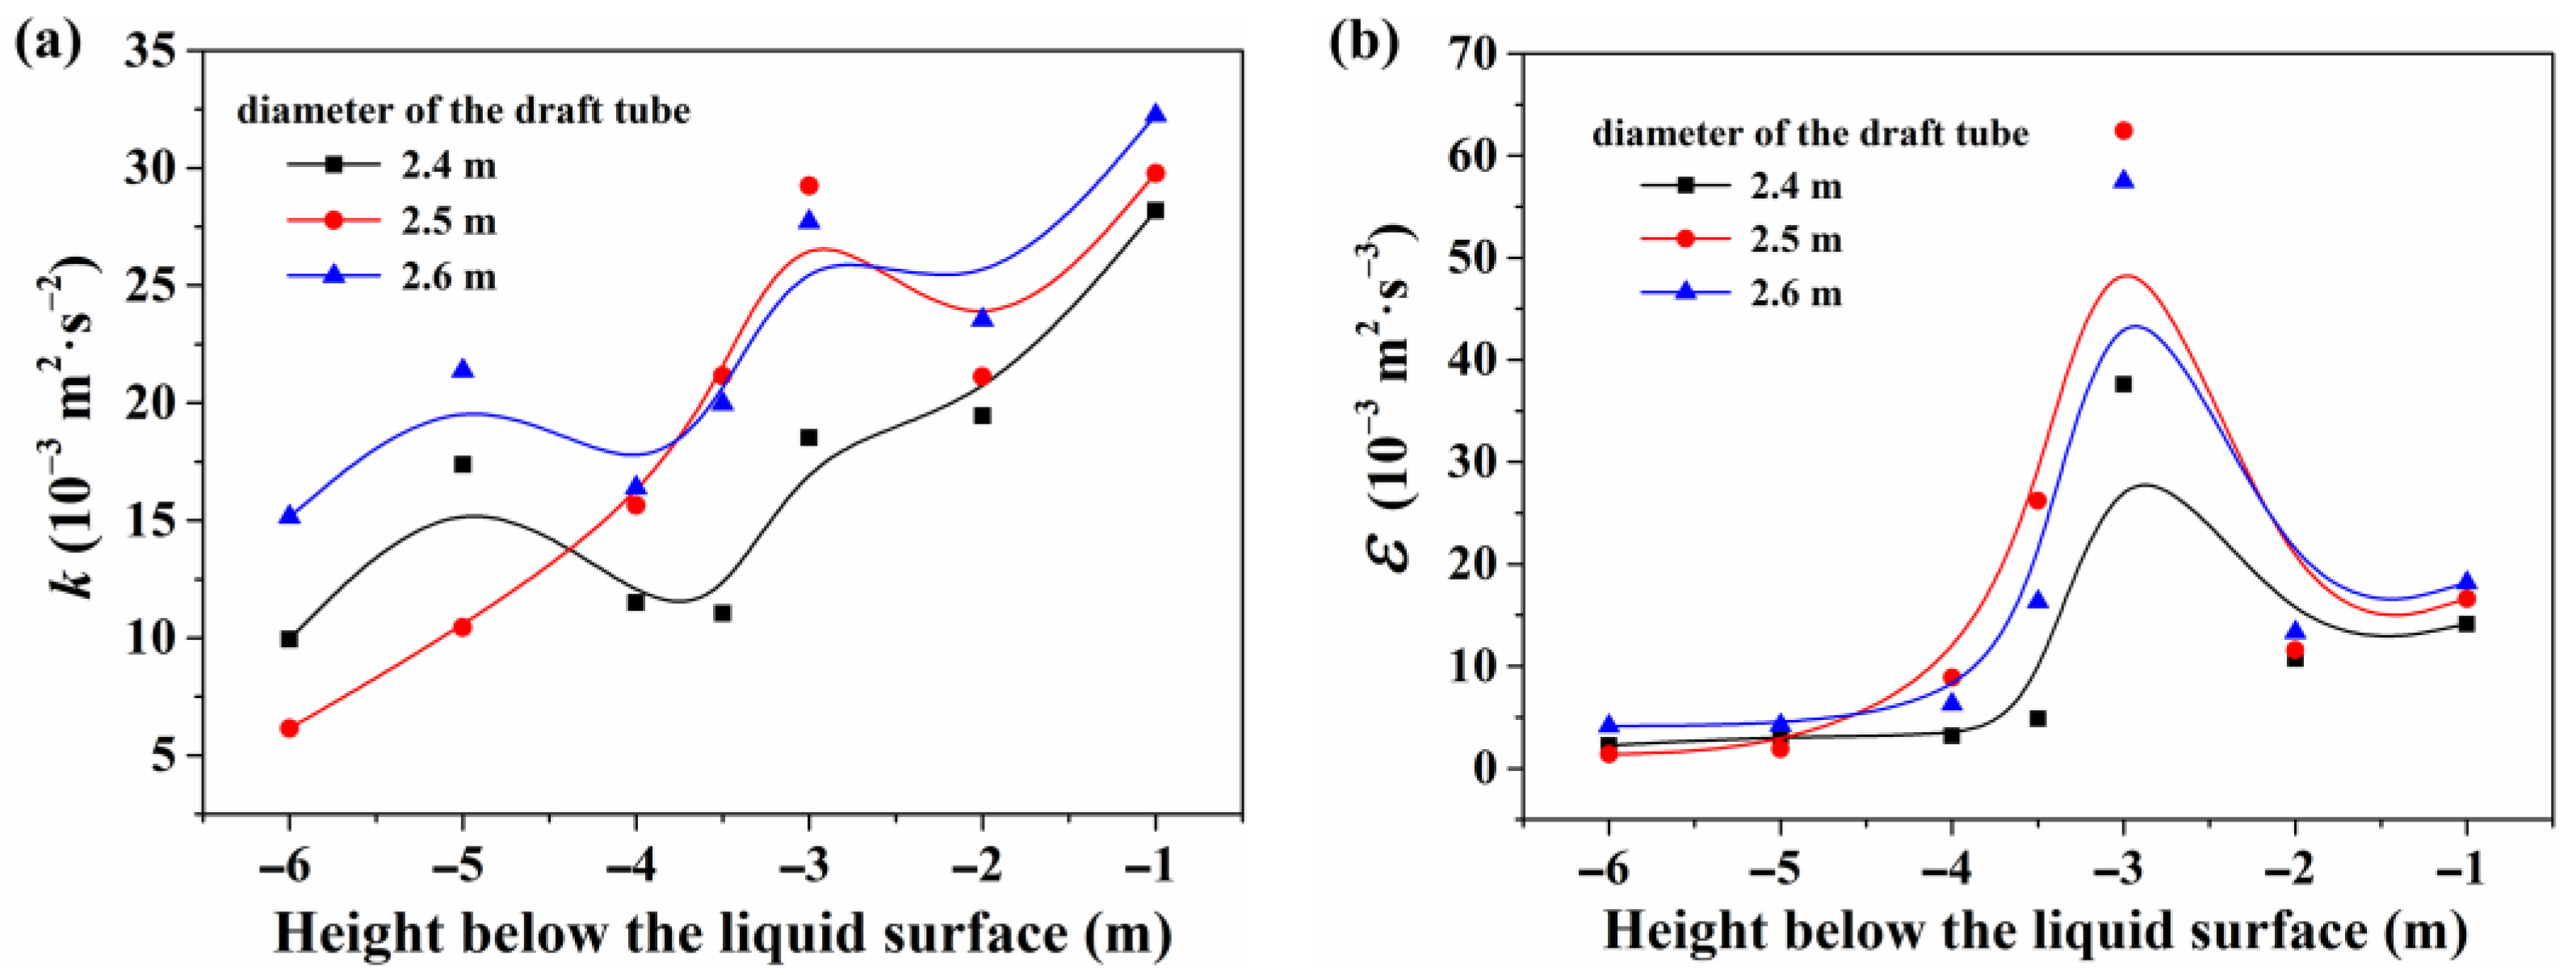
3.1.1. Diameter of the Draft Tube

As an important component of a high-efficiency sedimentation tank, the draft tube can tune the flow regime and improve mixing. The water is mixed by the stirring paddles in the draft tube to form a large number of vortices, which enhances mixing efficiency by creating a full circulation flow [25].
Based on the engineering design experience, different diameters (2.4, 2.5, and 2.6 m) of draft tubes were chosen in current numerical simulations. Figure 2 shows the velocity distribution of the turbulent flow field in a draft tube along the YZ cross-section. The overall distribution of water flow velocity, except that in the region near the stirring paddle, is similar for different sizes of draft tubes. Fast water flow can be observed near the stirring paddle when the draft tube diameter is 2.5 m (Figure 2b).
The turbulent kinetic energy and the dissipation rate in the flocculation zone (YZ cross-section) of different draft tubes are shown in Table 1. It can be seen that the turbulent kinetic energy reaches the peak value when the diameter of the draft tube is 2.5 m. Also, the dissipation rate of this model is large. The efficiency of collision will increase as the turbulent kinetic energy of the particle phase is dissipated in the flocculation zone, resulting in fast floc growth.
Further, the turbulent kinetic energy and the dissipation rate in the XZ cross-section (perpendicular to the height of the high-efficiency sedimentation tank) were analyzed in Figure 3. The top of the liquid surface in the flocculation zone was selected as the reference, and the cross-sections with heights of −1.0 m, −2.0 m, −3.0 m, −3.5 m, −4.0 m, −5.0 m, and −6.0 m were intercepted as typical cross-sections. It can be seen that there is a higher turbulent kinetic energy and the largest dissipation rate near the stirring paddle (which is located at −3.0 m). The dissipation rate at the bottom and top of the flocculation zone is relatively small.
The visual distribution of the turbulent kinetic energy and the dissipation rate are shown in Figures S1 and S2, respectively. The results show that the kinetic energy and the dissipation rate are relatively large in the cross-section near the stirring paddle (−3.0 m) for the draft tube with a diameter of 2.5 m. The kinetics of flocculation show that collision frequency is related to the degree of fluid turbulence in a positive way. The higher the rate of energy dissipation, the higher the collision frequency [26]. Because flocculation is an ongoing process in which flocs grow gradually, the shear intensity should be gradually altered to respond to the flocculation requirements in order to optimize the flocculation conditions [27]. At an early stage of flocculation, strong hydraulic disturbance is helpful for the collision-induced particle aggregation, which will enhance the chances of adhesion between particles to grow to large flocs. At the late stage of flocculation, the water flow disturbance should be reduced to prevent the generated flocs from breaking. Consequently, the largest dissipation rate near the stirring paddle will facilitate the early floc growth in the flocculation zone. At the same time, the dissipation rate at the top and bottom of the flocculation zone is small, which brings weak flow interruption and can protect the formed flocs from being broken. Based on the current discussion, a draft tube with a diameter of 2.5 m should be chosen in future designs.

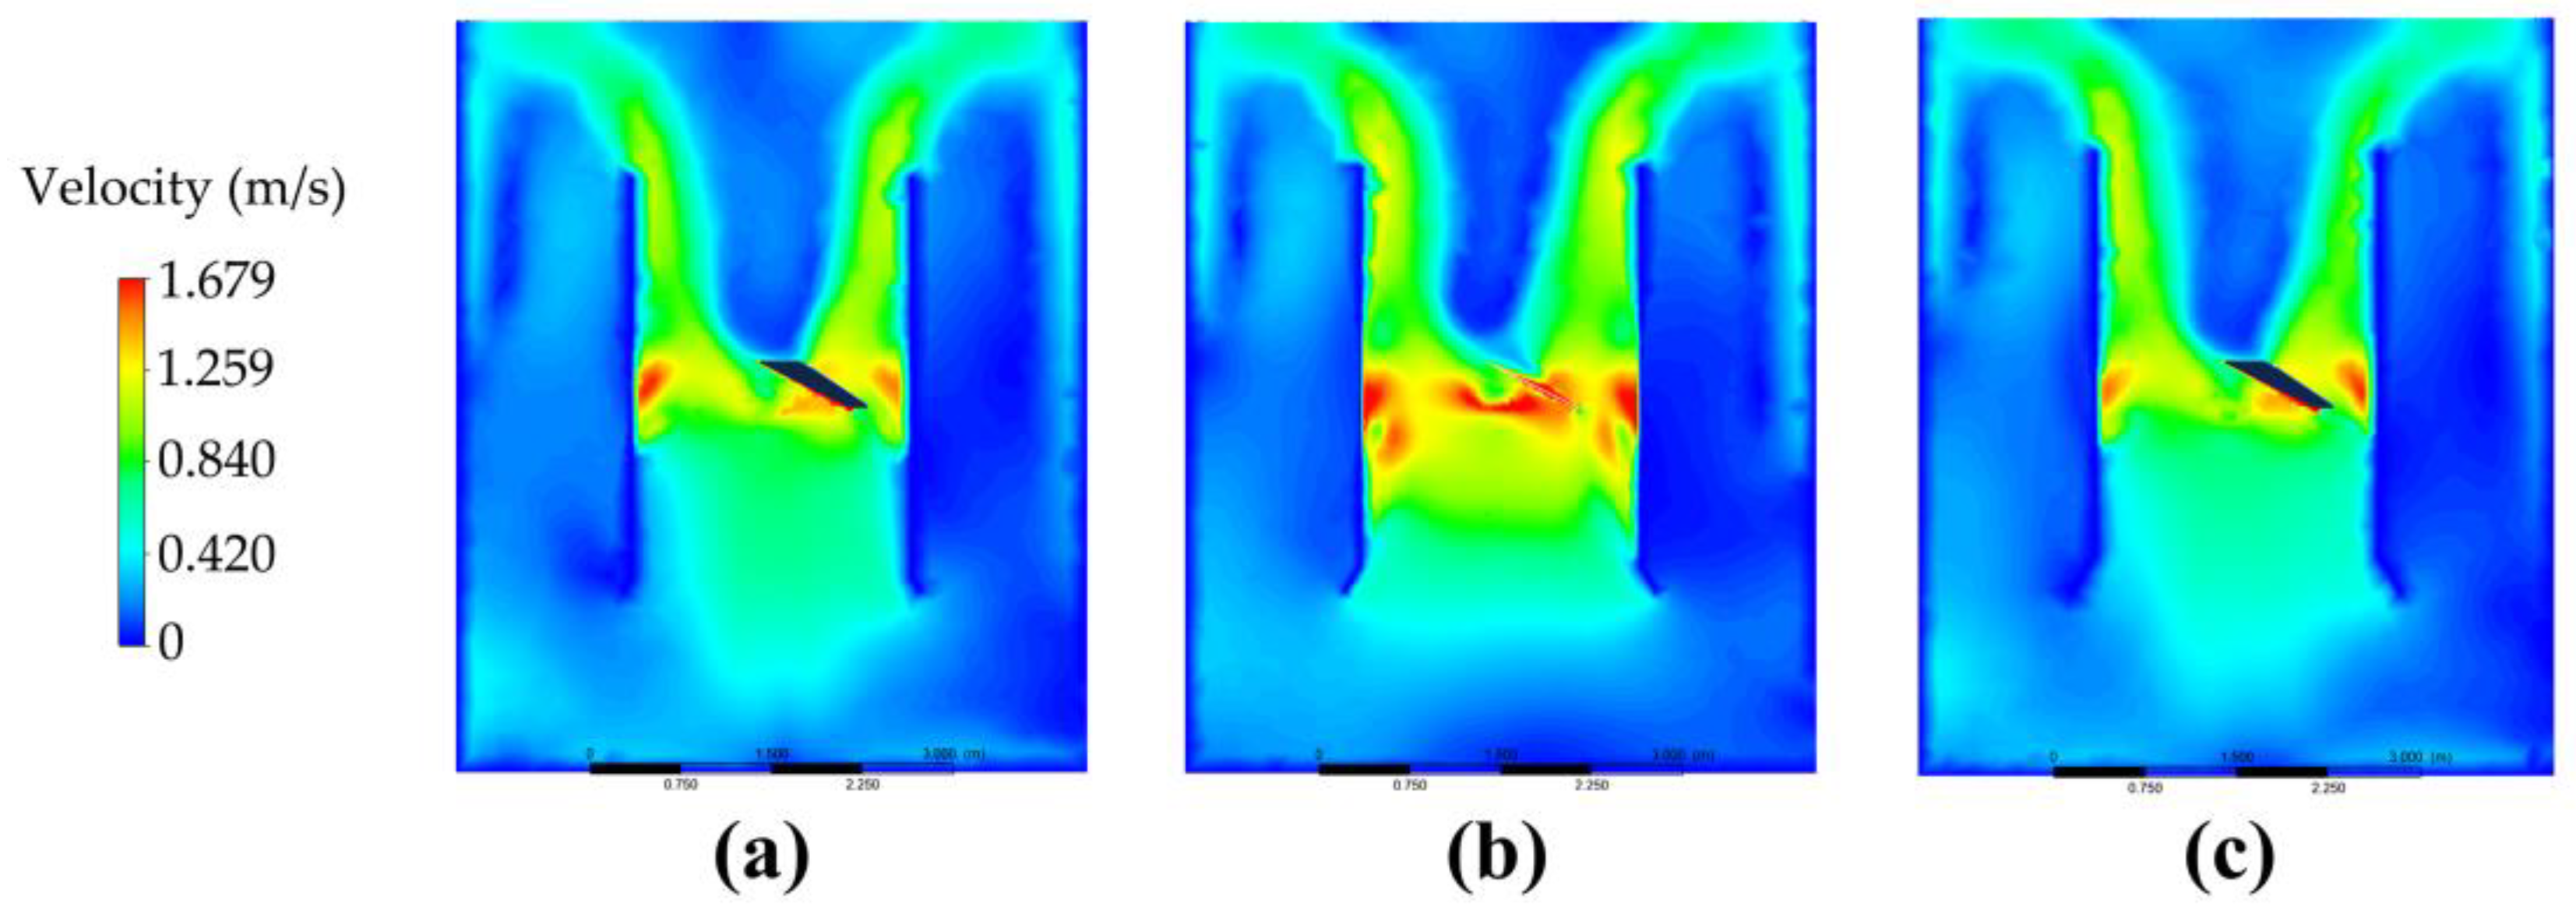
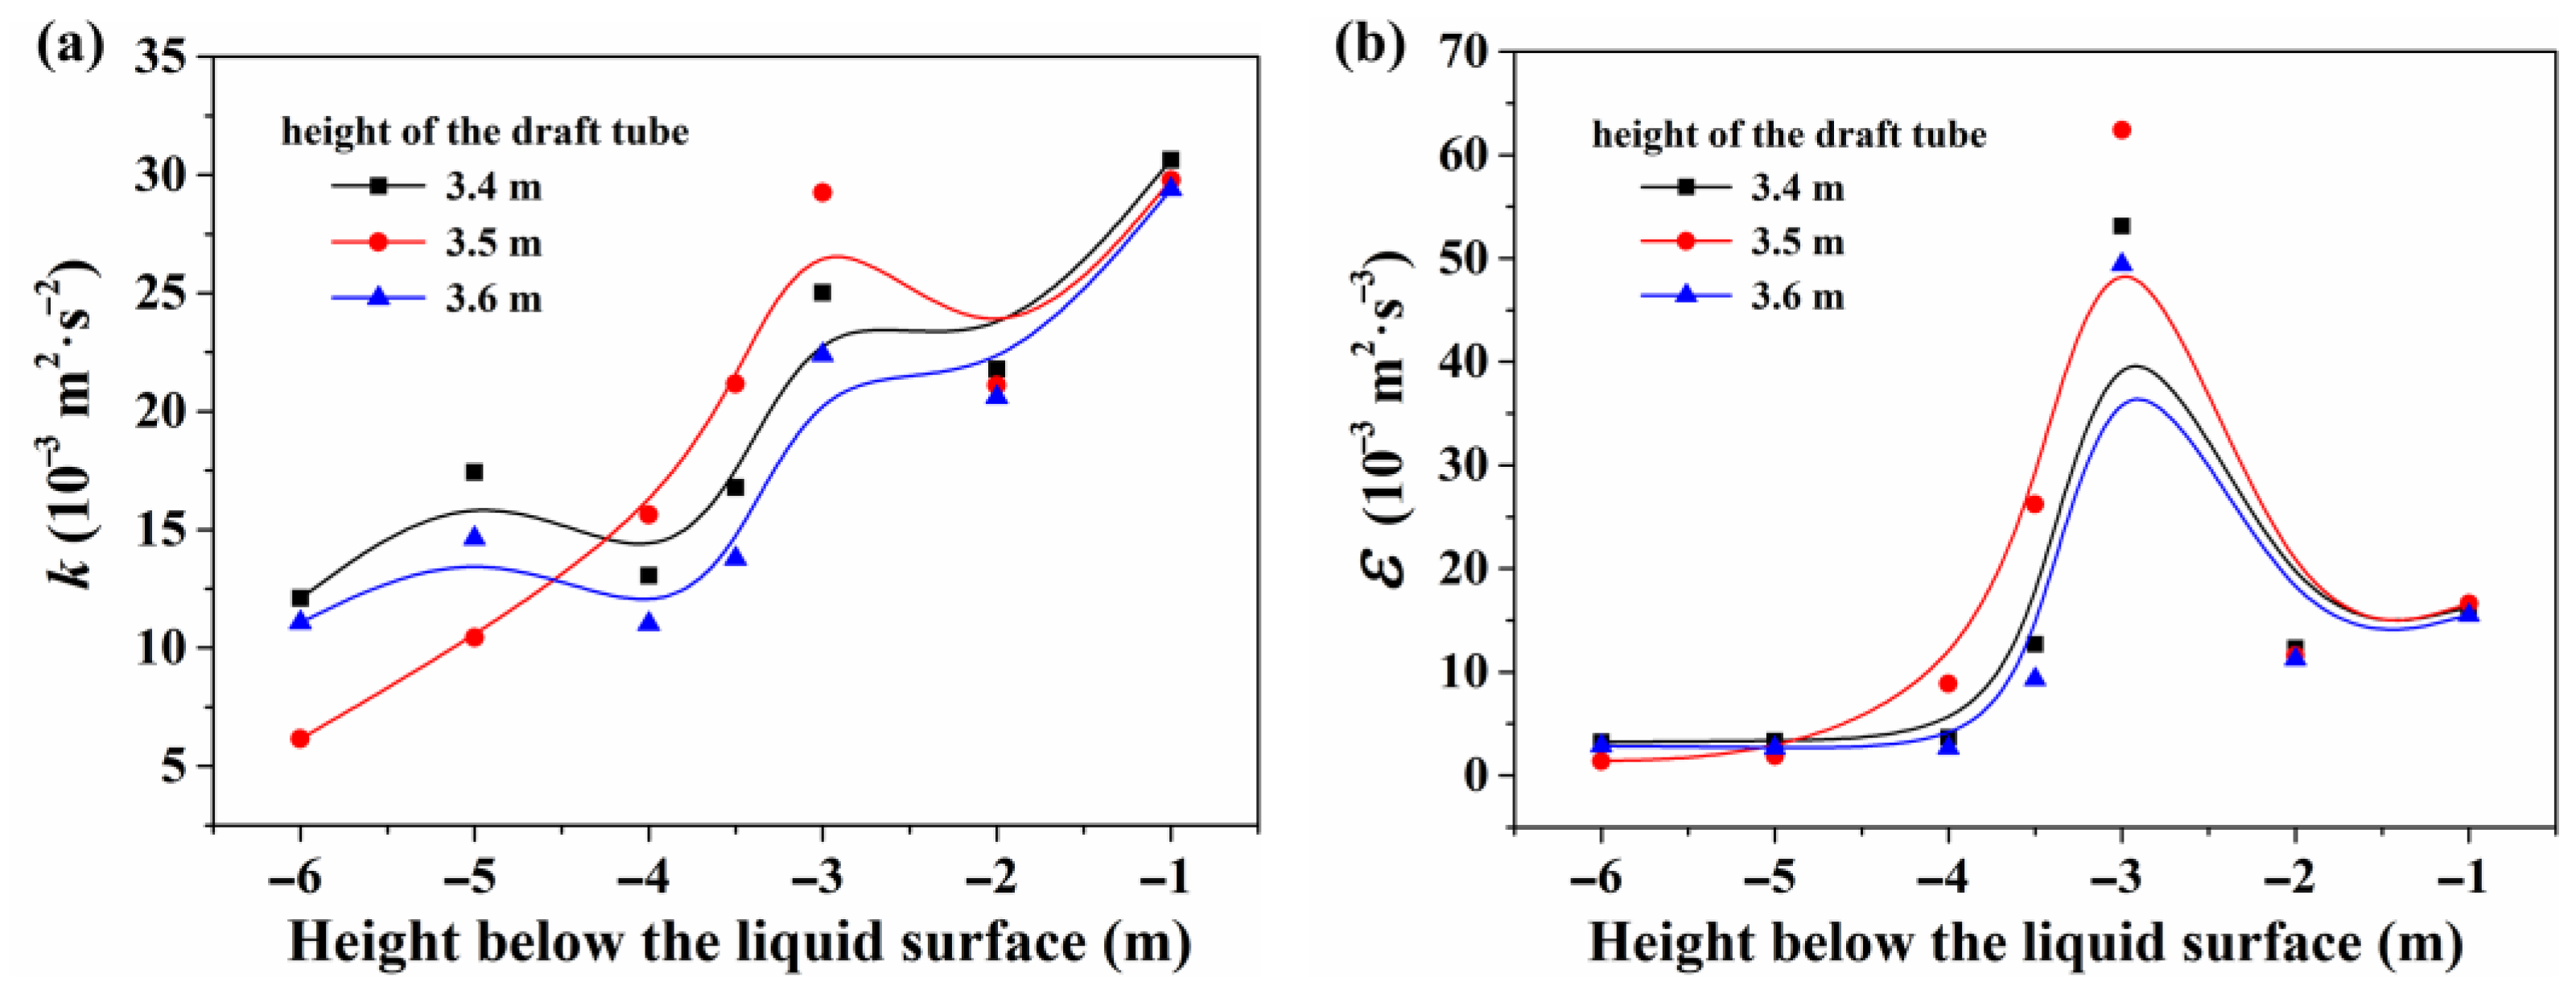
3.1.2. Height of the Draft Tube

A reasonable height of the draft tube helps to allow more fluid to enter the draft tube, performing strong mixing in the flocculation zone. The height (3.4, 3.5, and 3.6 m) of the draft tube was investigated in this study. The flow velocity distribution along the YZ cross-section is shown in Figure 4. When the heigh of the draft tube is 3.5 m, the fluid near the stirring paddle moves fast, indicating strong mixing and greater circulatory capacities.
The height of the draft tube has an important influence on the hydraulic conditions of flocculation. When the height of the draft tube is too low, the flow velocity above the draft tube is small and the rate of interparticle collision is weakened, resulting in lower turbulence levels. And when the height of the draft tube is too high, less fluid can be lifted up to form circulation flow fields around the draft tube, leading to insufficient collision and low mixing energy. Therefore, an appropriate height of the draft tube should be provided to ensure sufficient turbulent kinetic energy. As can be seen from Table 2, both the turbulent kinetic energy and the dissipation rate reach peak values when the height of the draft tube is 3.5 m (YZ cross-section). At this height, the turbulent intensity of the water flow within the flocculation zone can lead to intense collision among colloidal particles and optimal flocculation effectiveness. In the XZ cross-section, the average values of the turbulent kinetic energy and the dissipation rate are shown in Figure 5. Higher turbulent kinetic energy and dissipation rate can be obtained near the agitator (Y = −3.0 m to −3.5 m), compared to those at the bottom and top of the liquid.
The visual distribution of the turbulent kinetic energy and the dissipation rate (Figures S3 and S4) also support the above analysis. When the height of the draft tube is 3.5 m, the region near the stirring paddle within the flocculation zone exhibits a strong disturbance. Then, the hydraulic conditions throughout the entire mixing and flocculation zone are optimal, resulting in the best flocculation performance.

3.2. Optimization of the Plug-Flow/Clarification Zone

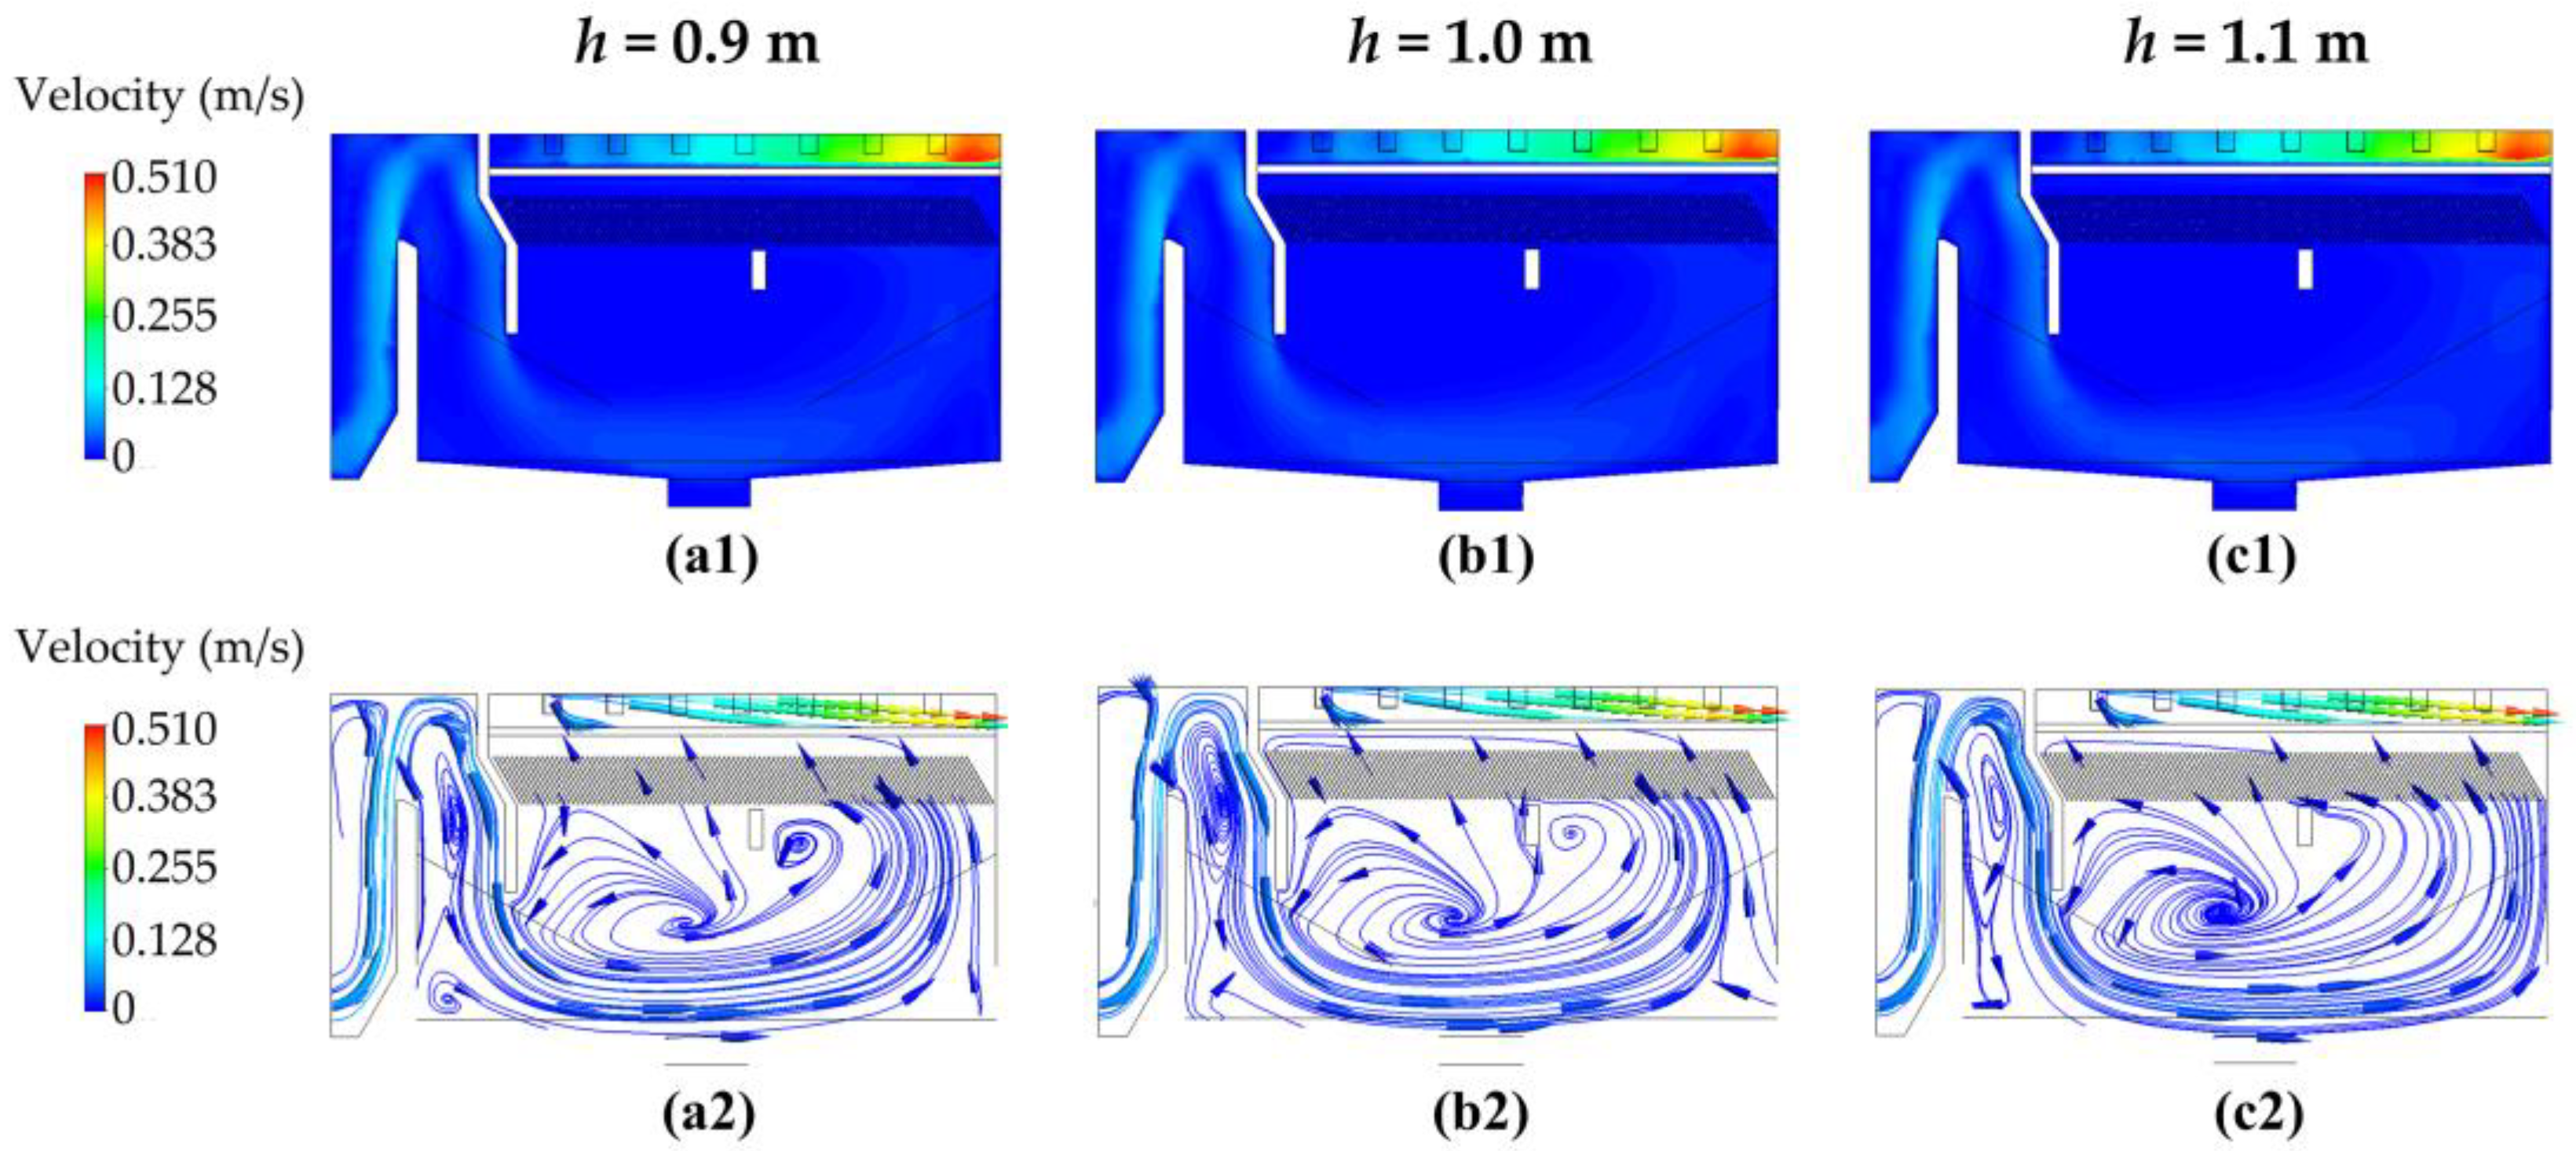
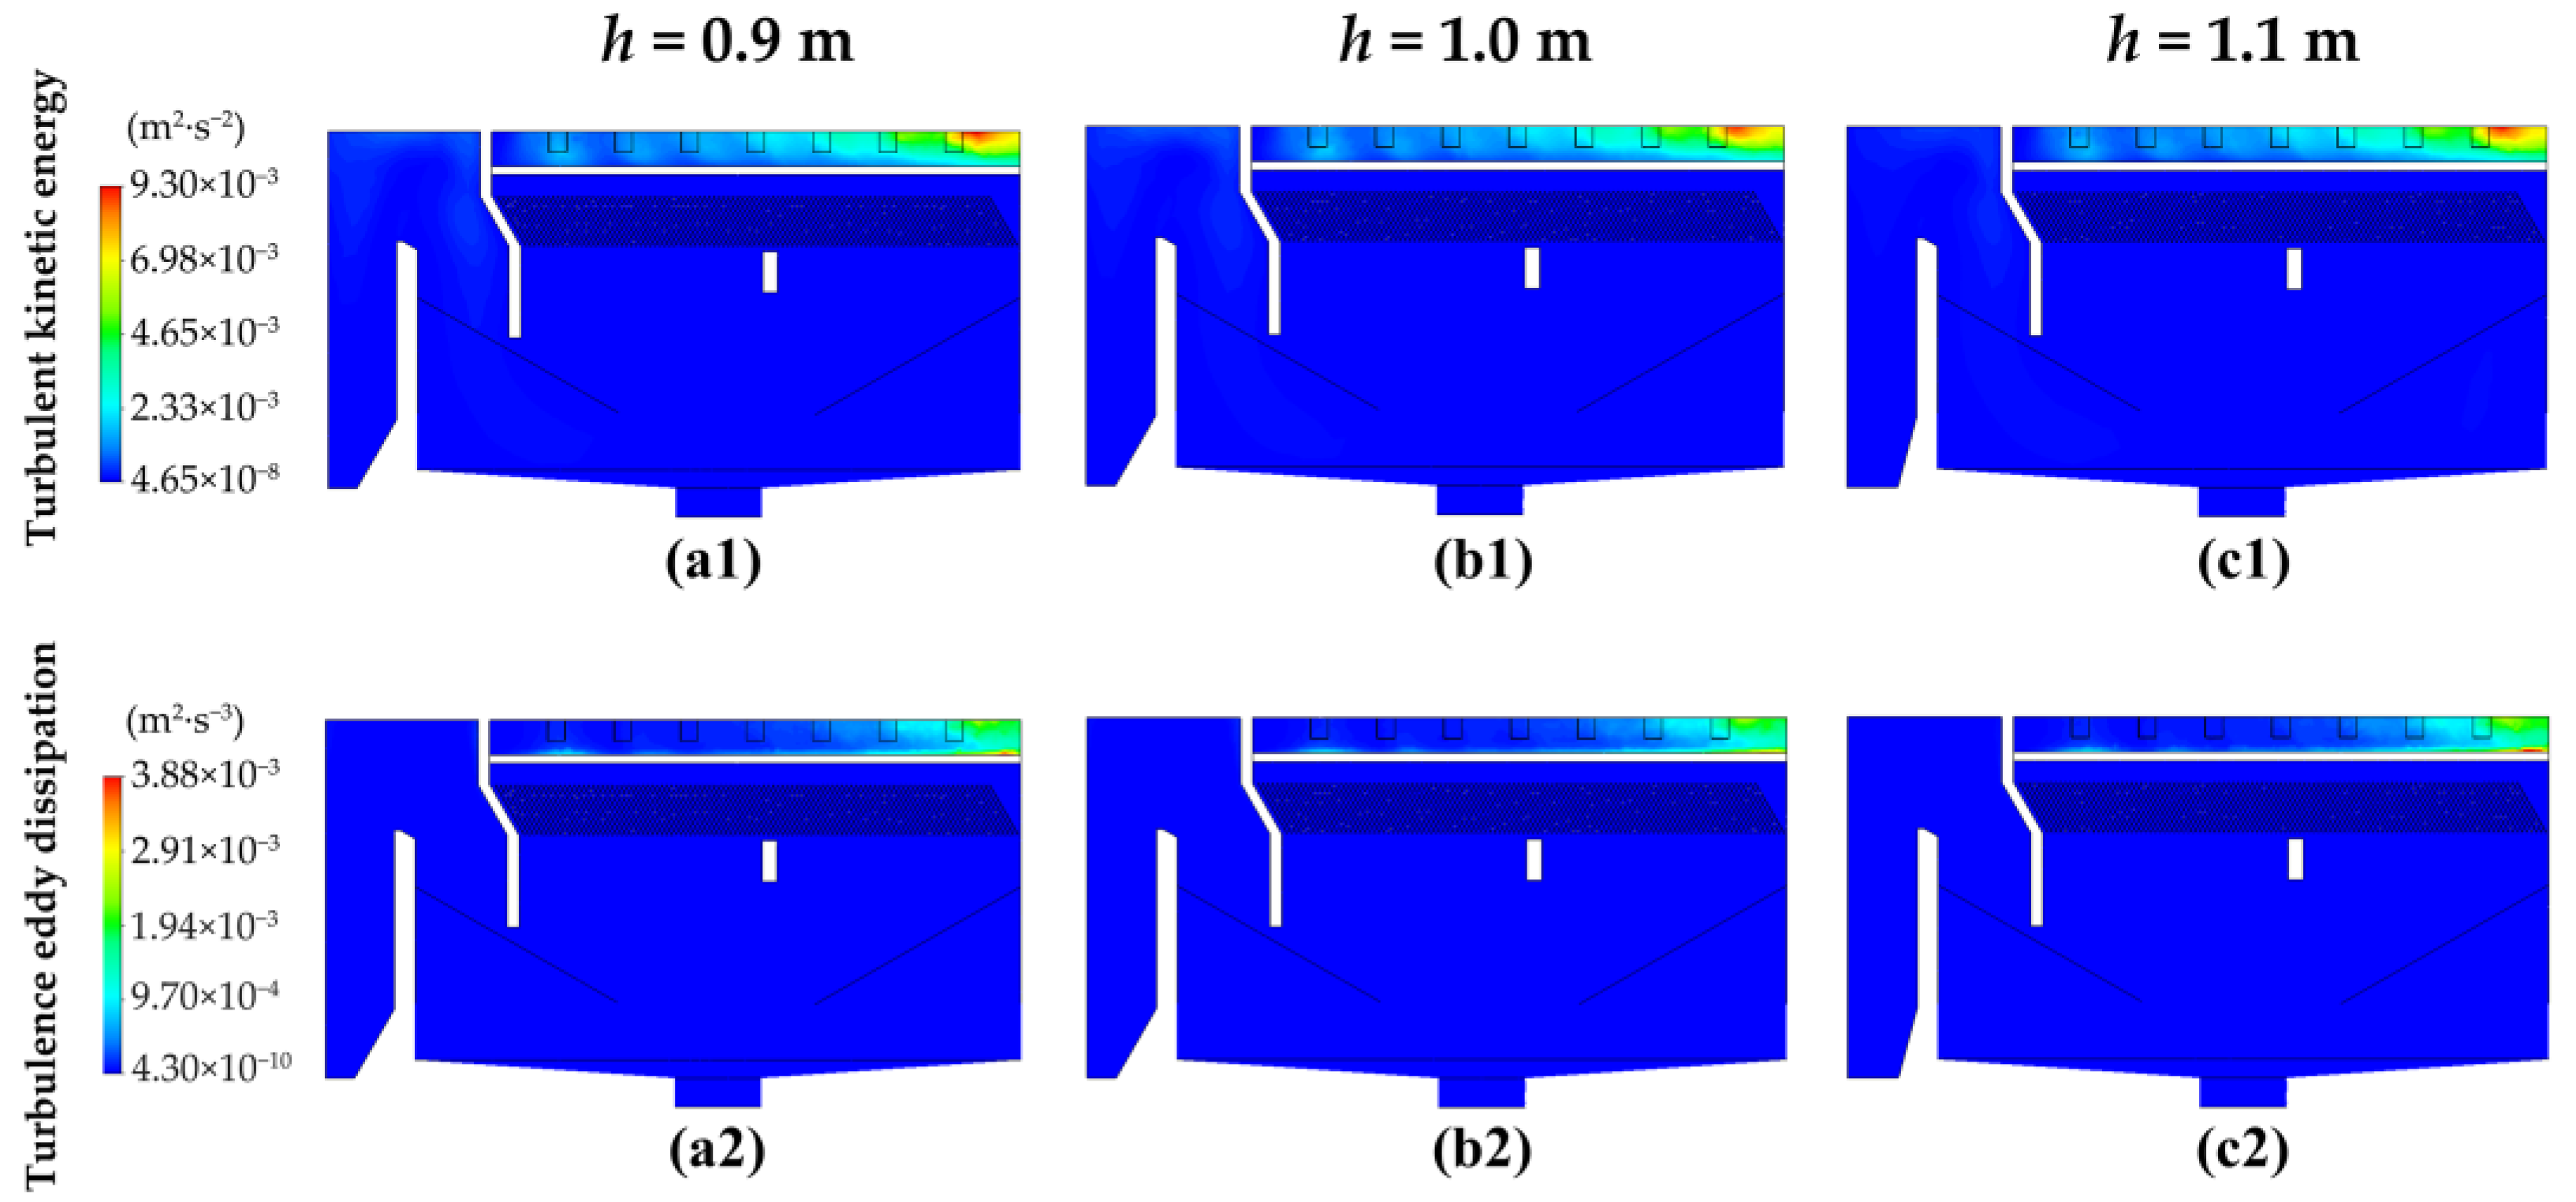
3.2.1. Height of the Water Tunnel

The water tunnel is a channel connecting the flocculation zone and the plug-flow/clarification zone. Under different heights (0.9, 1.0, 1.1 m) of the water tunnel, the flow velocity distribution and streamline diagram along the XY cross-section (Z = 0) are shown in Figure 6. It can be seen that the flow velocity gradually decreases from the plug-flow zone to the center of the clarification zone. In the clarification zone, the water flow is in a cyclic rising state. A large velocity distribution can be observed near the outlet of the water channel.
Table 3 shows the average turbulent kinetic energy and the dissipation rate (XY cross-section) in the whole plug-flow zone. The smallest dissipation rate can be obtained when the height of the water tunnel is set at 1.0 m, while the distribution levels of the turbulent kinetic energy and the dissipation rate in the region below the inclined plate are very low (Figure 7), which creates favorable conditions for solid–liquid separation of flocs. Therefore, the height of the water tunnel is selected to be 1.0 m for later study.

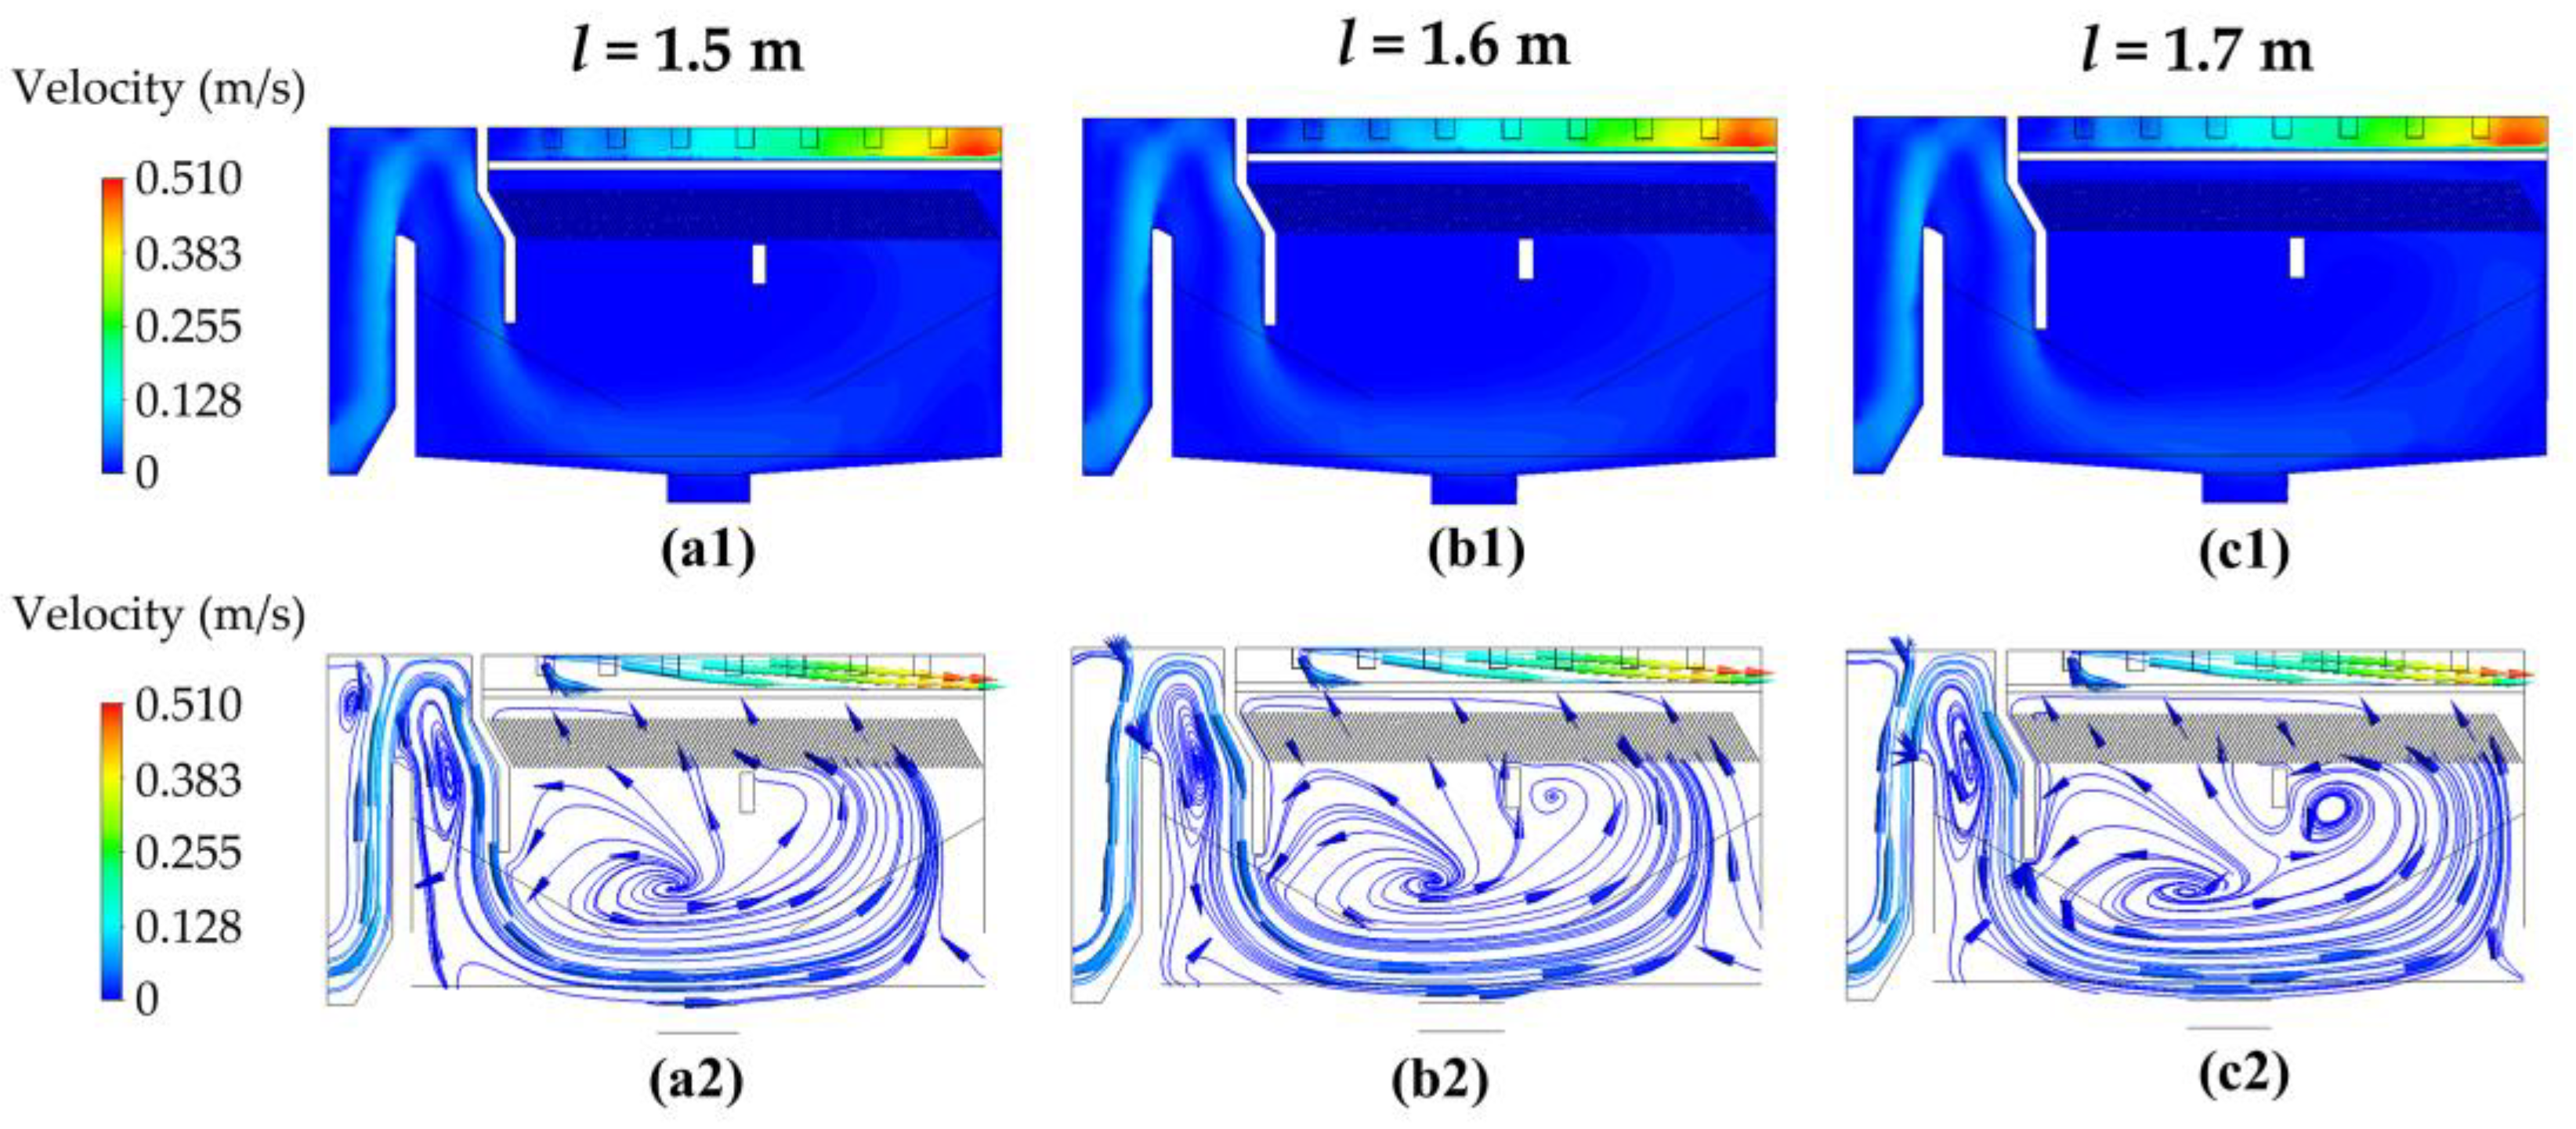
3.2.2. Height of the Water-Retaining Weir

Figure 8 shows the velocity distribution and streamlines along the XY cross-section (Z = 0) at different heights of the water-retaining weir. The overall velocity distribution in the plug-flow and clarification zone remains similar. The velocity gradually decreases from the plug-flow zone to the central region of the clarification zone, where various degrees of swirling and backflow can be observed. When the height of the water-retaining weir is 1.6 m, the number and the size of vortices in the plug-flow and clarification zone are relatively small. The average turbulent kinetic energy and the average dissipation rate (Table S1) in the XY cross-section also prove the optimal height to be 1.6 m, where the lowest average dissipation rate can be obtained.

3.3. Optimization of the Operation Parameters

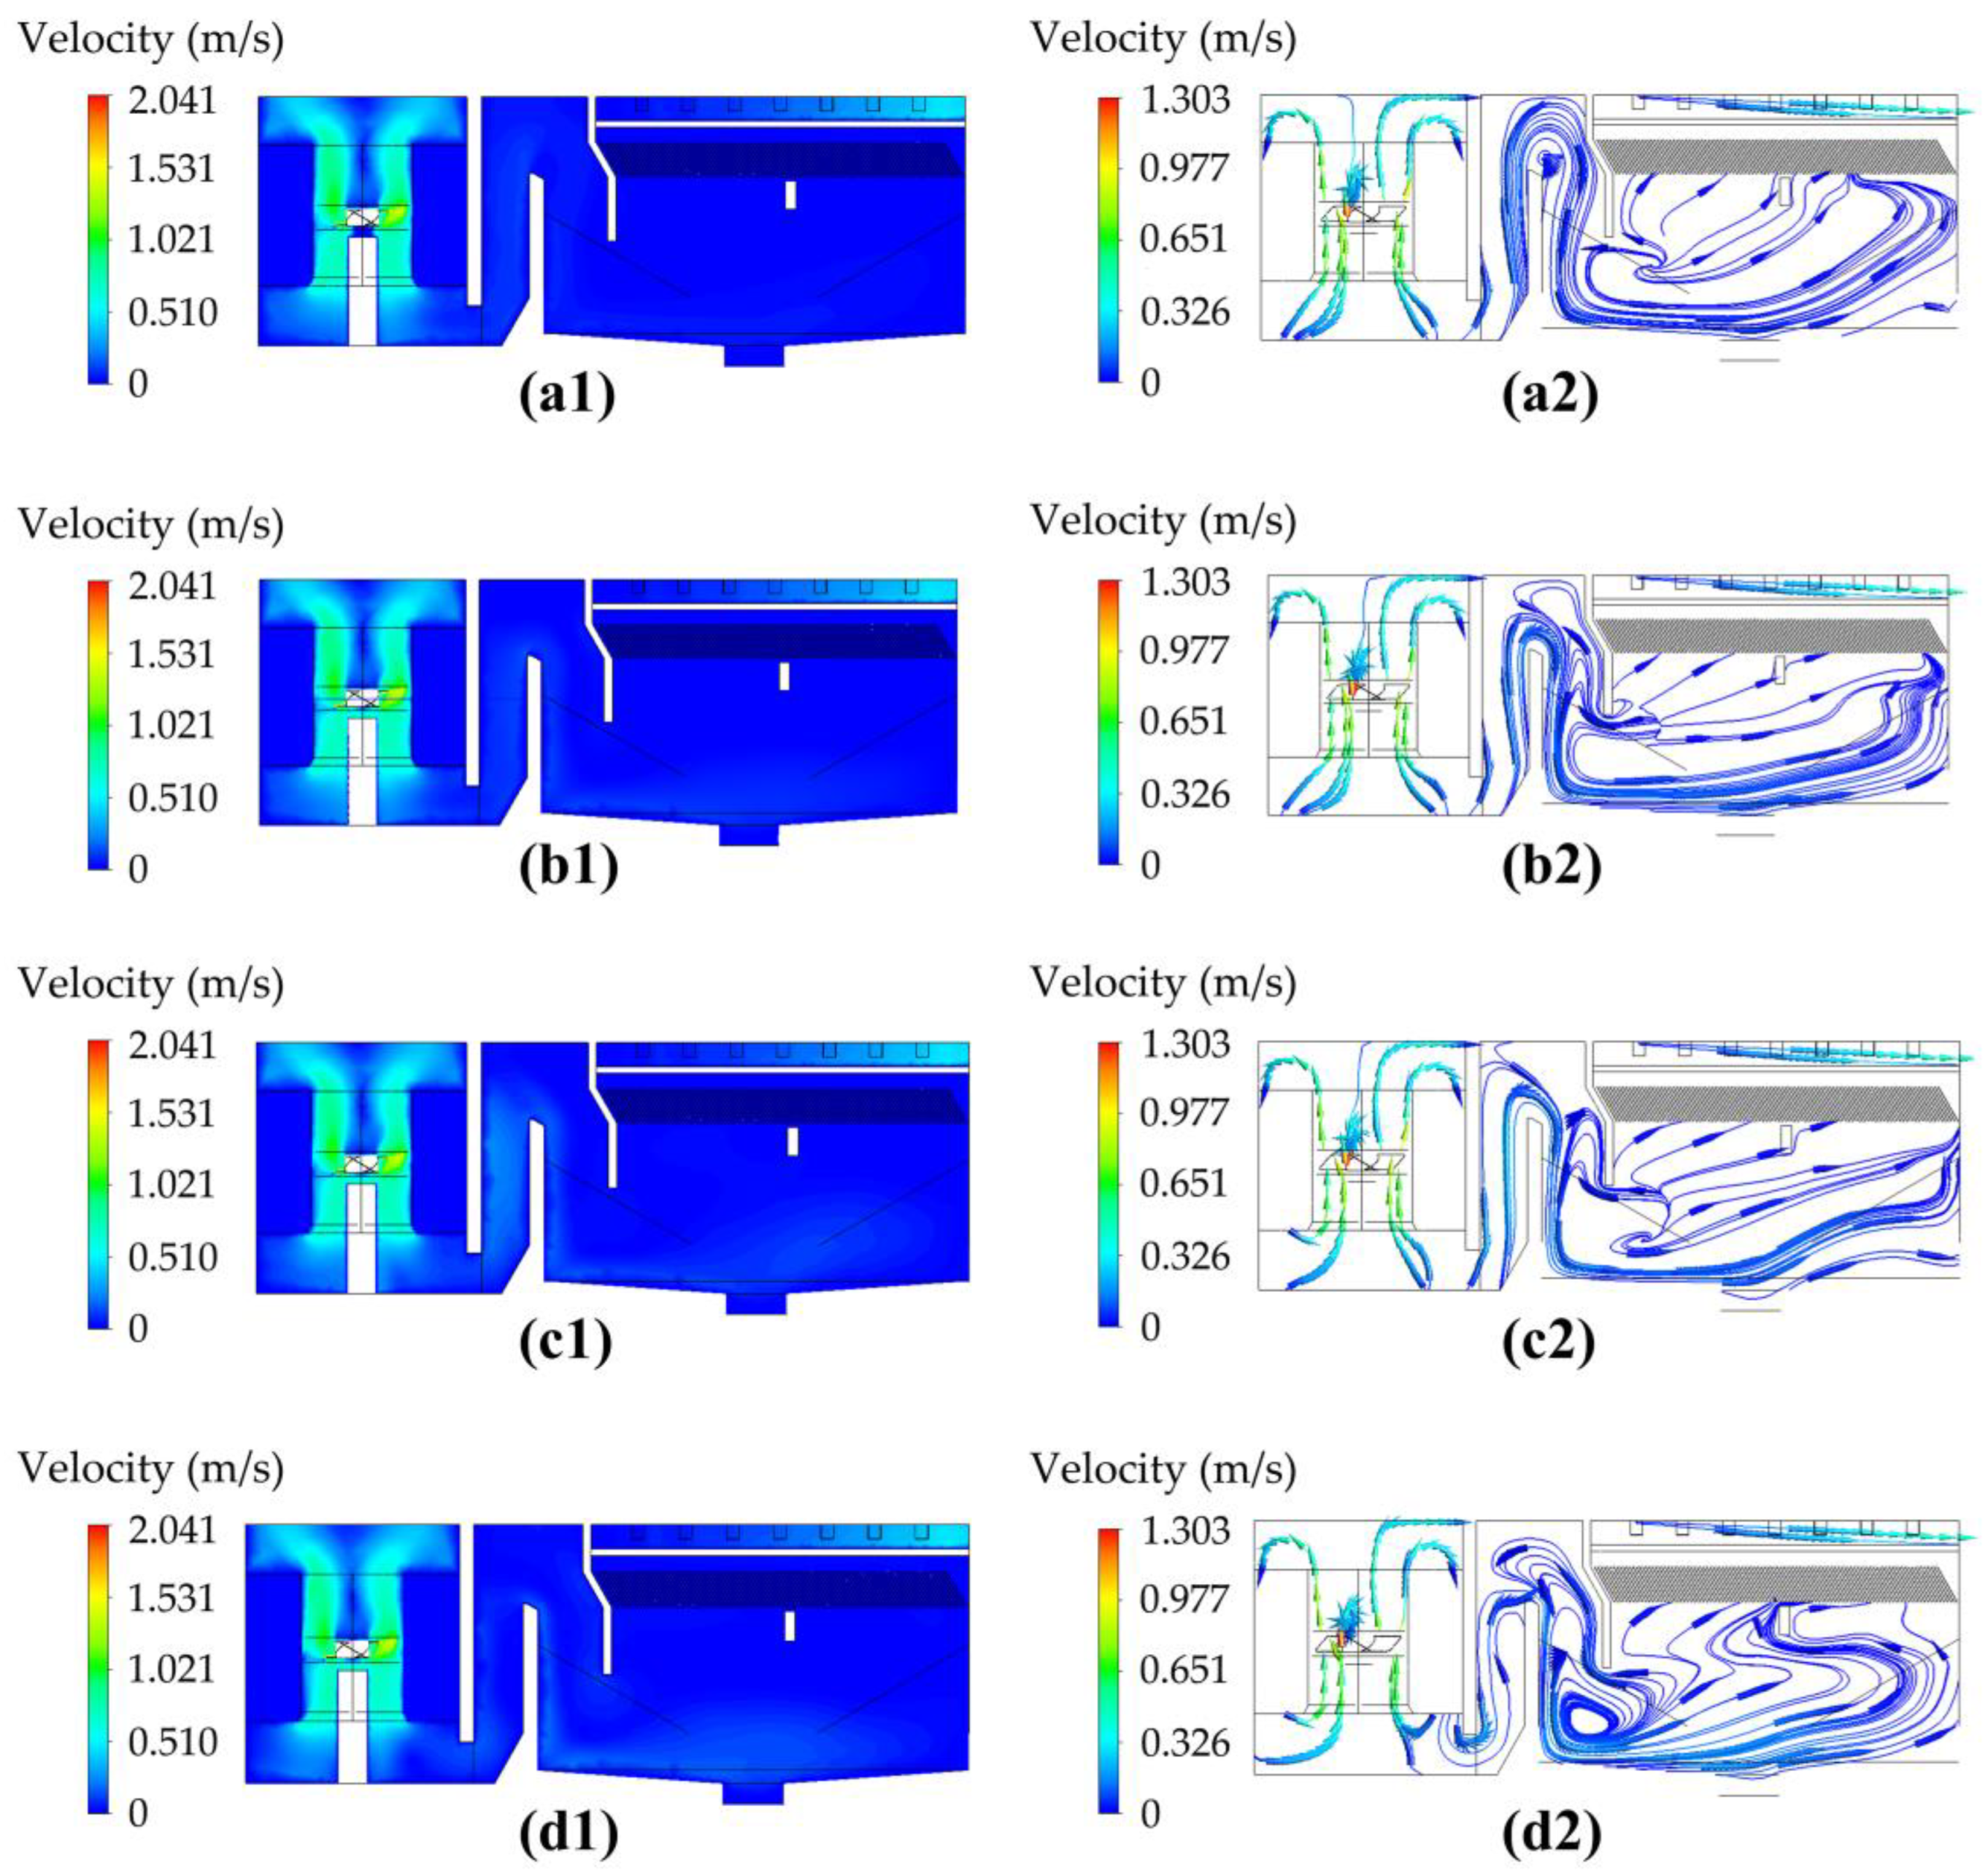
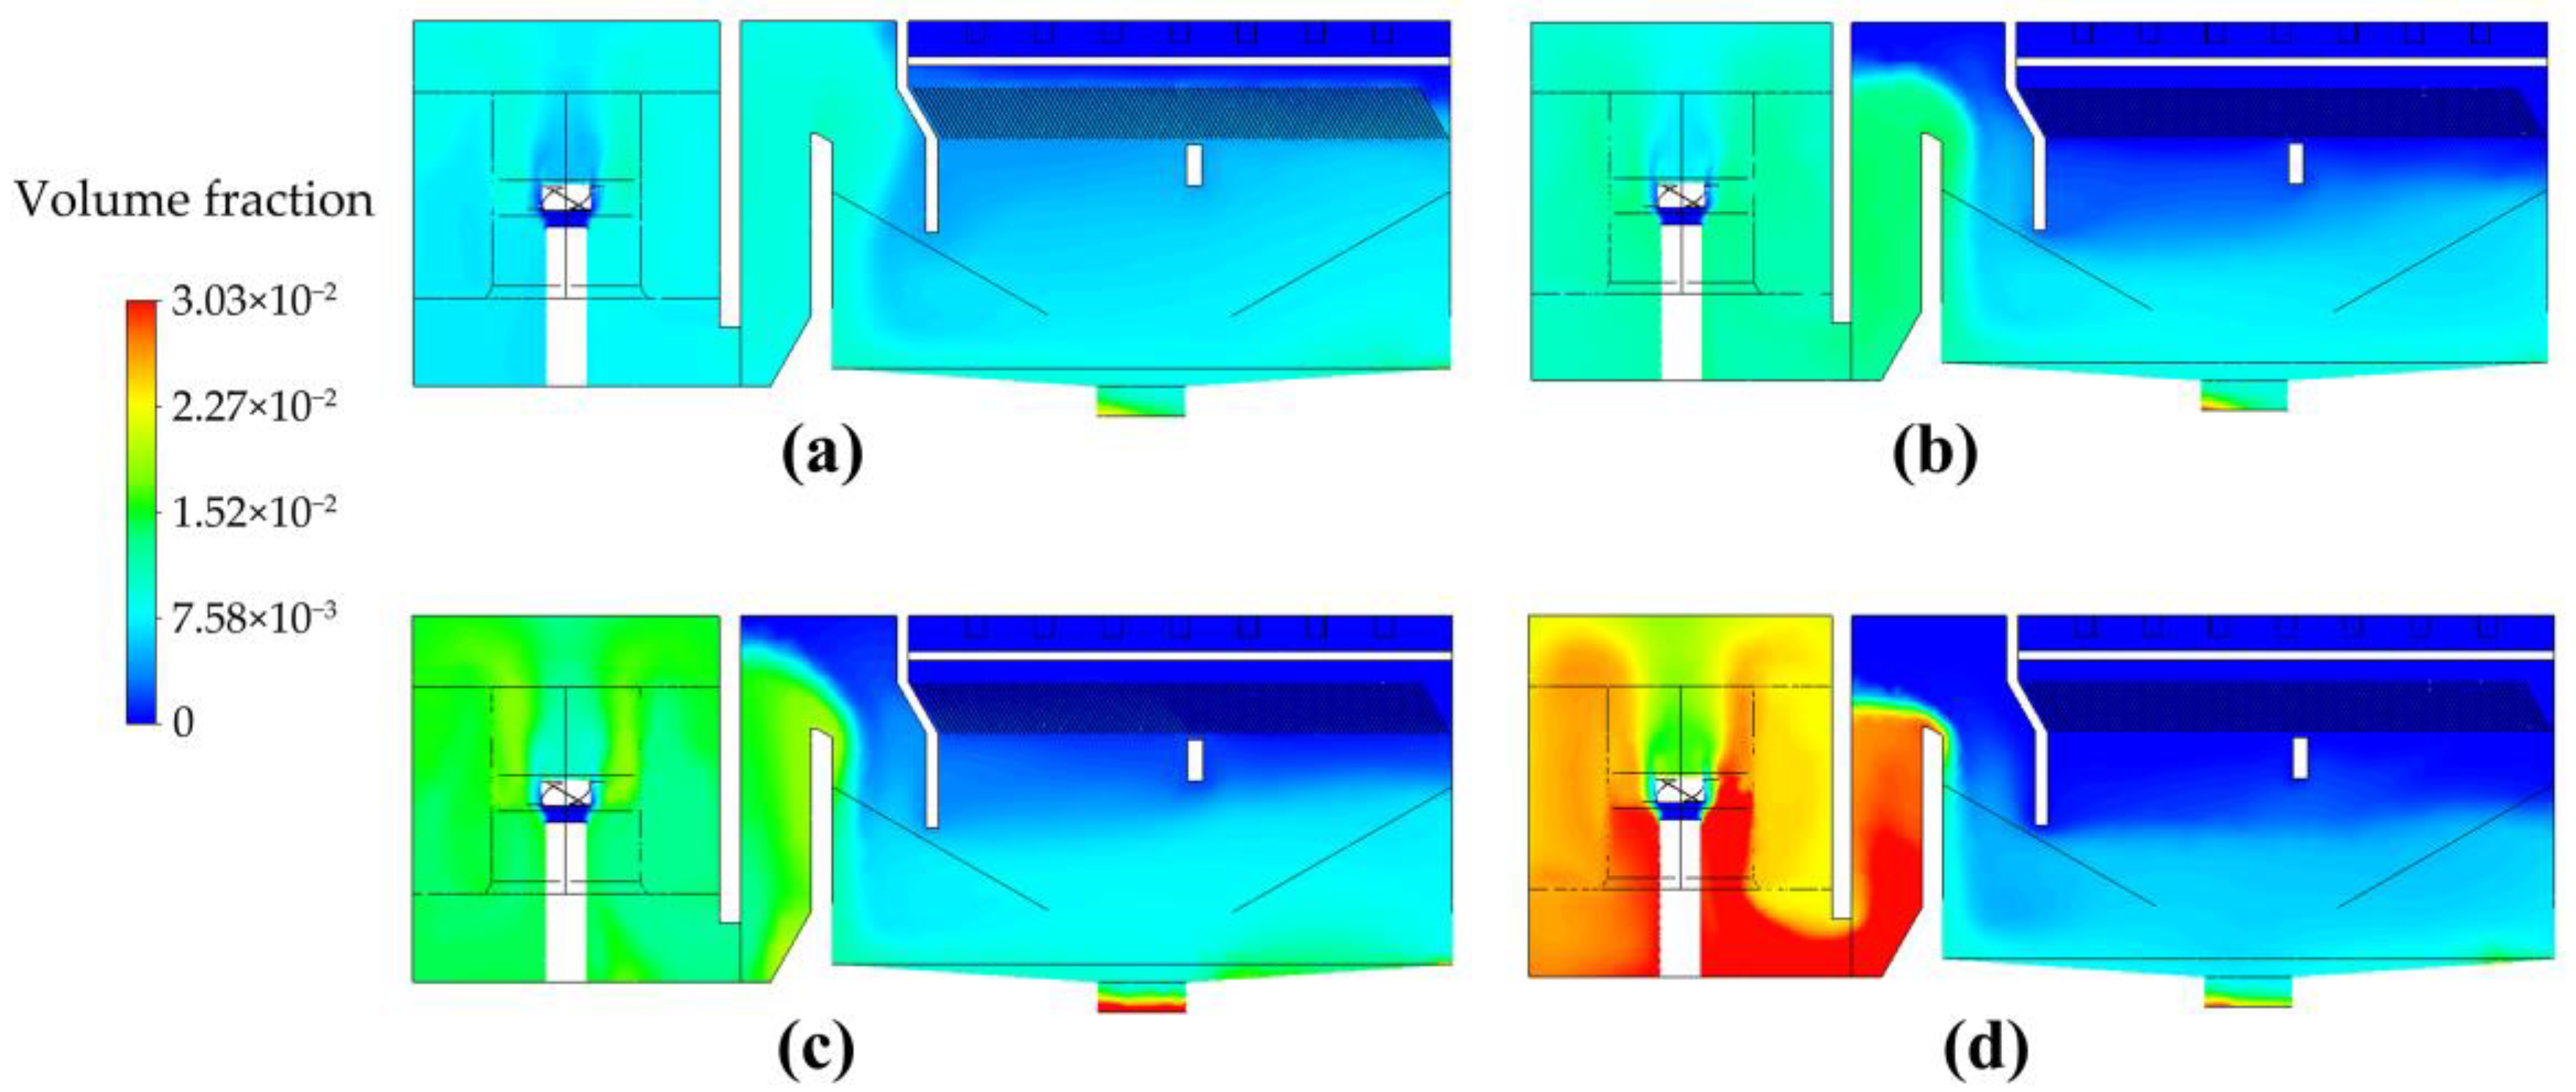
3.3.1. Dosage of Heavy Medium Particles

In addition to the geometric configuration, the operating conditions (such as dosage of dense media particles, stirring rate, and inlet velocity) of the high-efficiency sedimentation tank also have significant impacts on the tank’s overall performance [28].
Heavy medium powder here refers to particles with a density of 2.0 to 6.0 g/cm3. In the coagulation and sedimentation process, the simultaneous addition of inert high-density powder (heavy medium) not only serves as the core for floc formation, but also significantly improves the settling performance of the flocs due to the higher density [29].
In this study, different dosages of heavy medium particles were converted to equivalent densities of flocs to evaluate the impact of heavy medium particle dosage on the hydraulic conditions of the high-efficiency tank. When the dosages of heavy medium particles were 0 mg/L, 20 mg/L, 40 mg/L, and 60 mg/L, the corresponding densities of the flocs were 1060 kg/m3, 1118 kg/m3, 1236 kg/m3, and 1353 kg/m3, respectively.
The velocity distribution and streamline of the liquid phase in the XY cross-section (Z = 0) within the high-efficiency sedimentation tank with different dosages of heavy medium particles are shown in Figure 9. The maximum velocity of the water flow is mainly concentrated near the draft tube of the flocculation zone and at the outlet. When the dosage of heavy medium particles is 60 mg/L, a relatively higher velocity distribution can be observed in the bottom area of the clarifier, which is attributed to the occurrence of the density-driven flow phenomenon.
The flocculation zone exhibits the highest values of the average turbulent kinetic energy and the average dissipation rate at 40 mg/L of heavy medium particles (Table 4). Meanwhile, the plug-flow/clarification zone shows lower k and ε values. It indicates that this condition is favorable for the collision and aggregation of floc particles in the flocculation zone, while allowing for effective solid–liquid separation in the plug-flow/clarification zone.
The distribution of the bulk solid holdup along the XY cross-section (Z = 0) for different amounts of heavy media particles is shown in Figure 10. When the dosage of heavy media particles is zero, the floc particles could be observed near the slant plate area. With the increase in the dosage of heavy media particles, the volume solid holdup of floc particles near the slant plate area decreased significantly. But a large dosage (60 mg/L) of heavy media particles will result in serious aggregation of floc particles near the water tunnel and the plug-flow zone. An amount of 40 mg/L of heavy medium particles can effectively prevent excessive aggregation of floc particles, achieving favorable overall hydraulic conditions throughout the high-efficiency sedimentation tank.

3.3.2. Stirring Rate

The draft tube in the high-efficiency clarification tank is equipped with a stirring paddle. The stirring blade provides the driving force for the collision of particles in the flocculation zone and also encourages the uplifting of the liquid in the draft tube. Therefore, the stirring rate of the paddle has a significant impact on the hydraulic conditions.
The maximum velocity of the water flow is mainly concentrated near the draft tube in the flocculation zone and at the outlet, and it increases with the rising of the stirring rate. Actually, there is a candidate of the stirring rate (30 rpm here) for reducing the eddy formation in the clarification zone (Figure 11).
The volume solid concentration distribution along the XY cross-section (Z = 0) within the high-efficiency sedimentation tank at different stirring rates is shown in Figure 12. Compared to the cases with stirring rates of 25 rpm and 35 rpm, excessive aggregation of floc particles near the water tunnel and at the bottom of the plug-flow zone is avoided when the stirring rate is 30 rpm. Furthermore, a higher stirring rate will require additional electricity costs. In this case, good settling separation can be achieved in the flocculation zone. Therefore, a stirring rate of 30 rpm should be employed for the high-efficiency sedimentation tank.

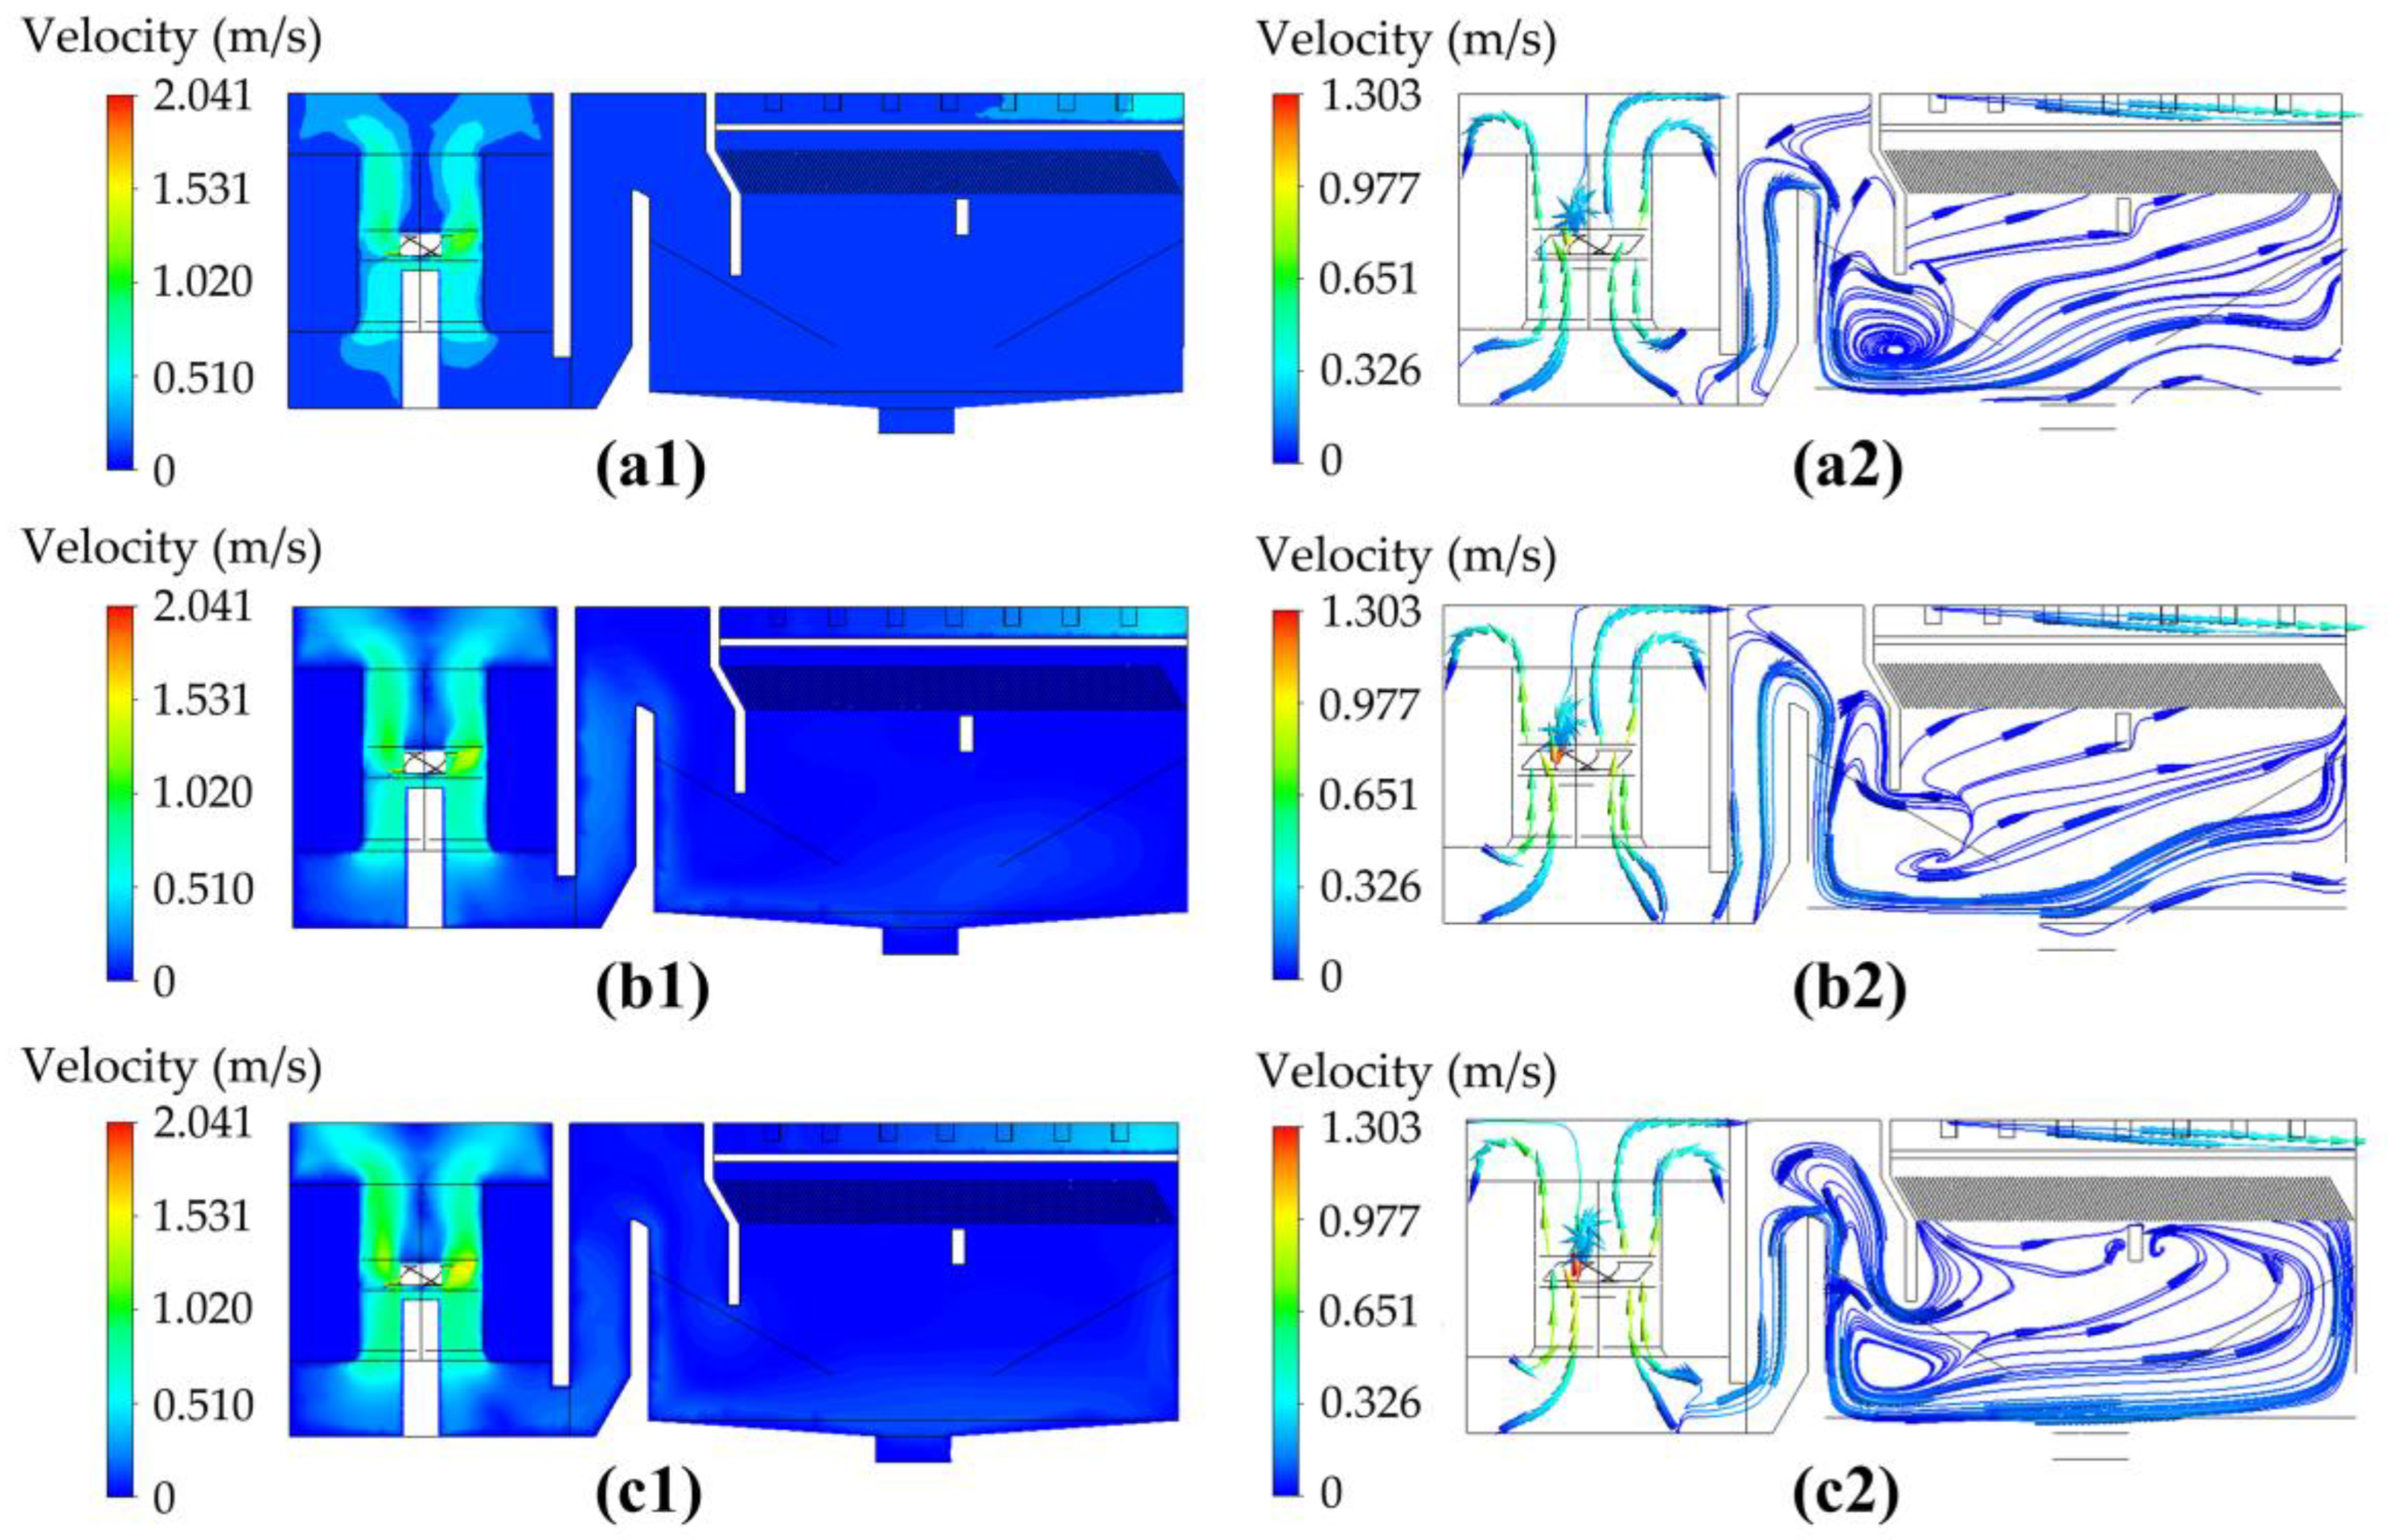
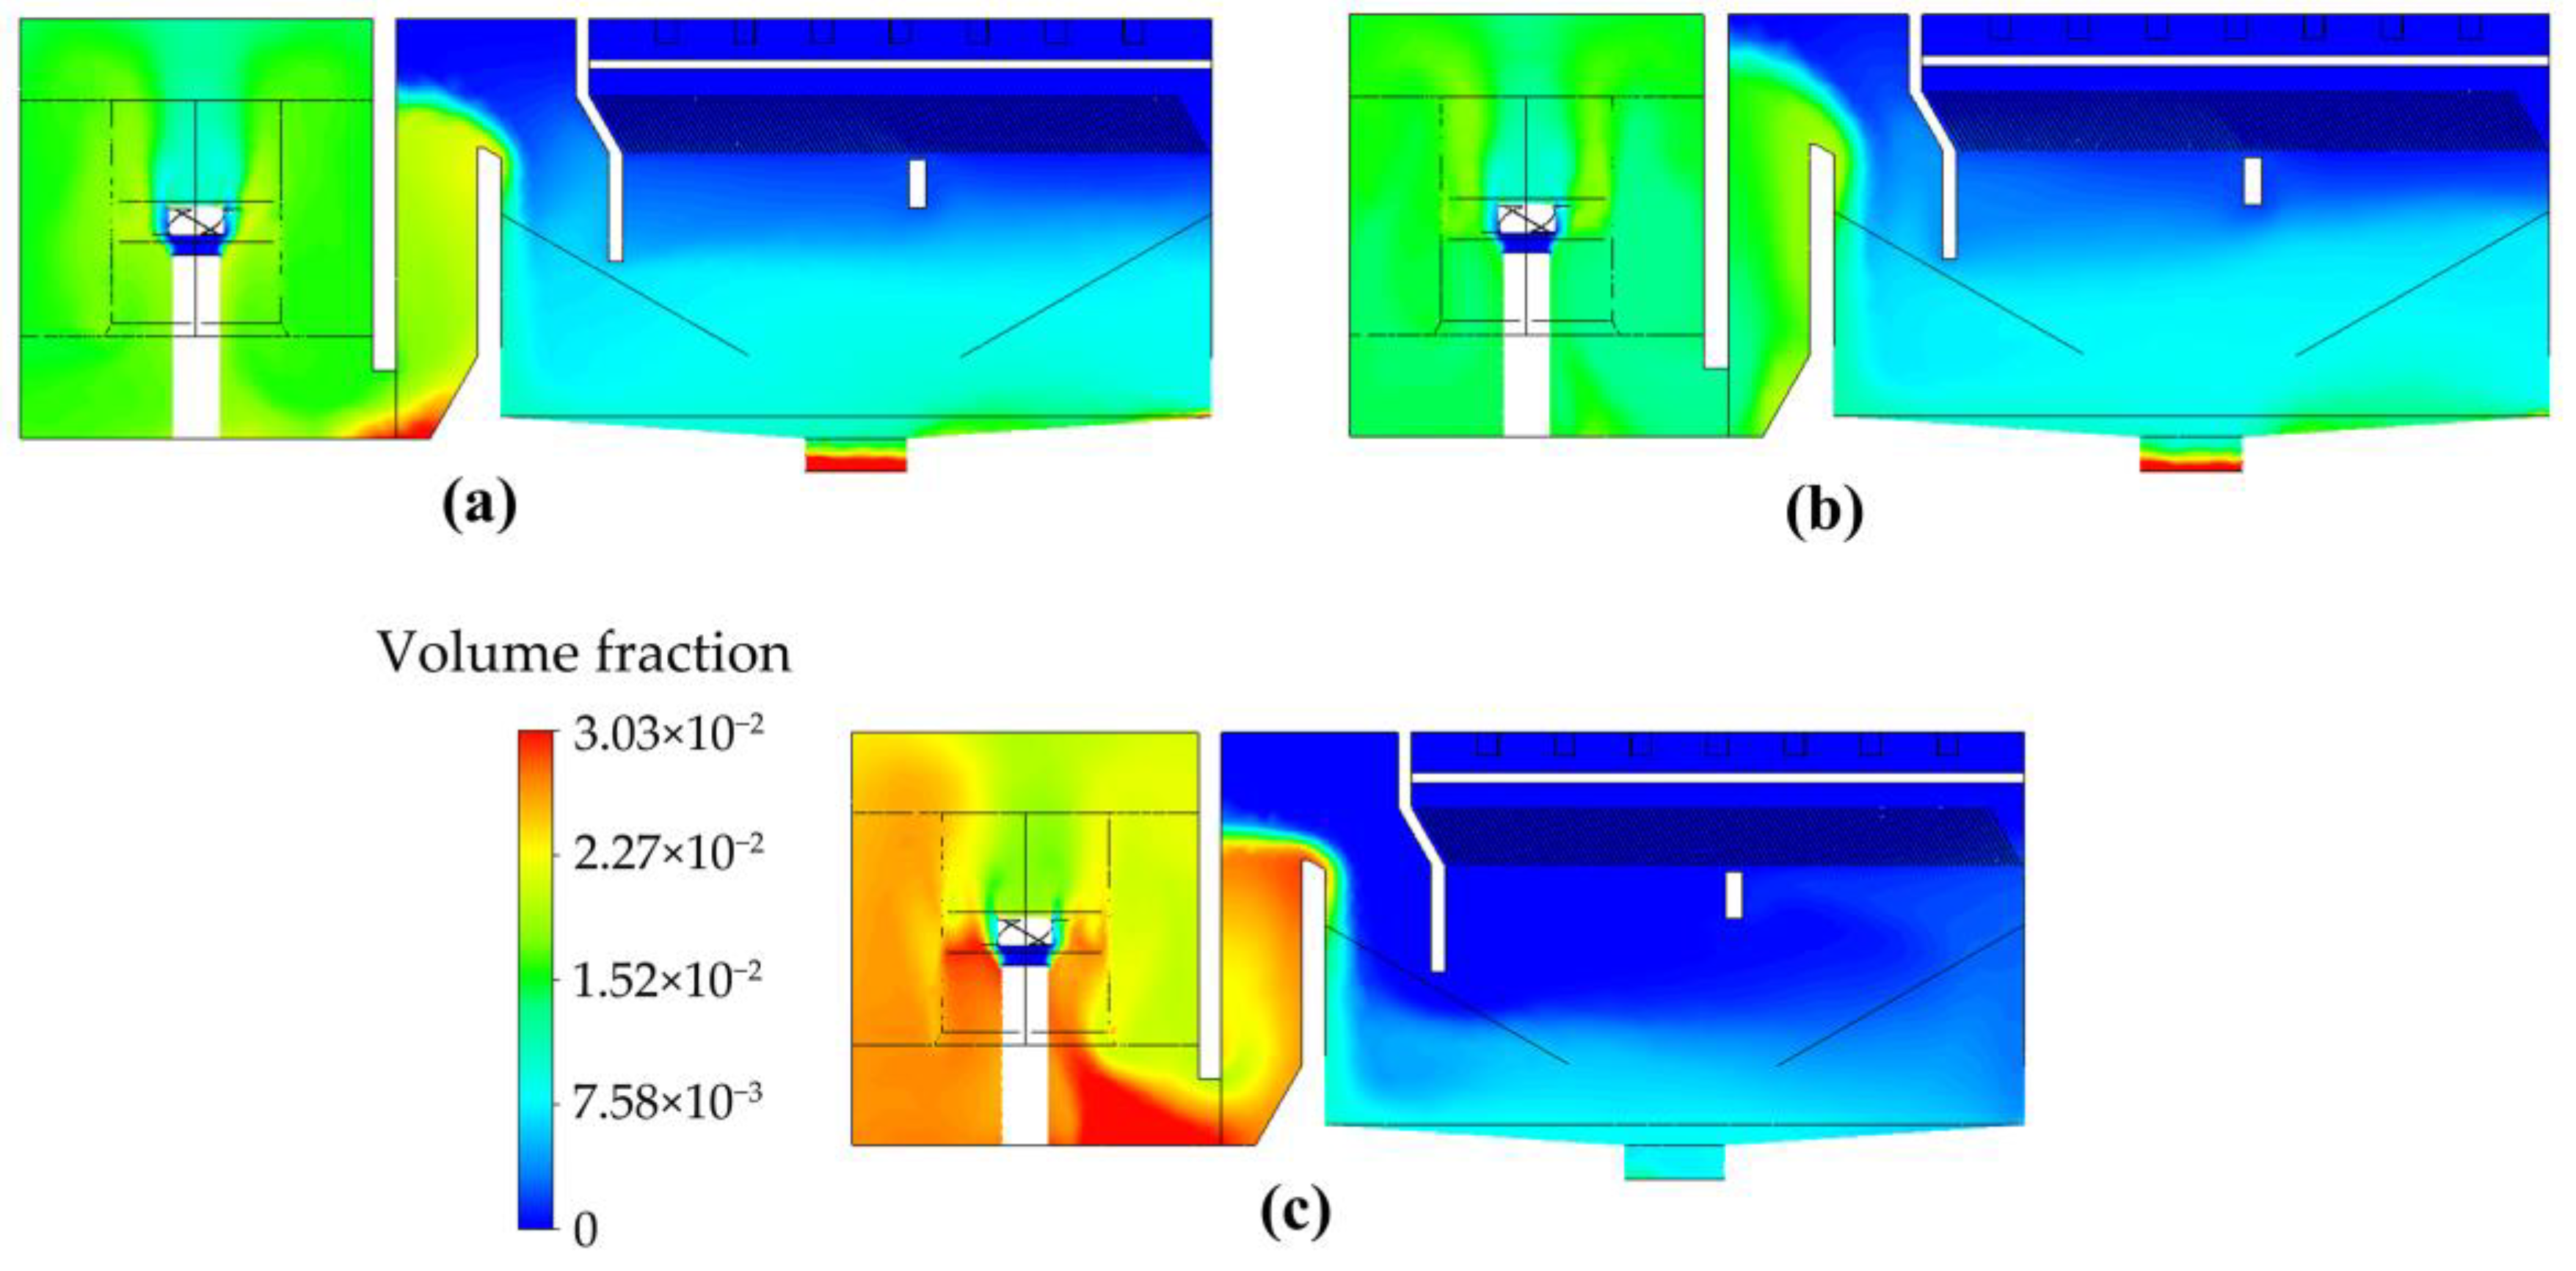
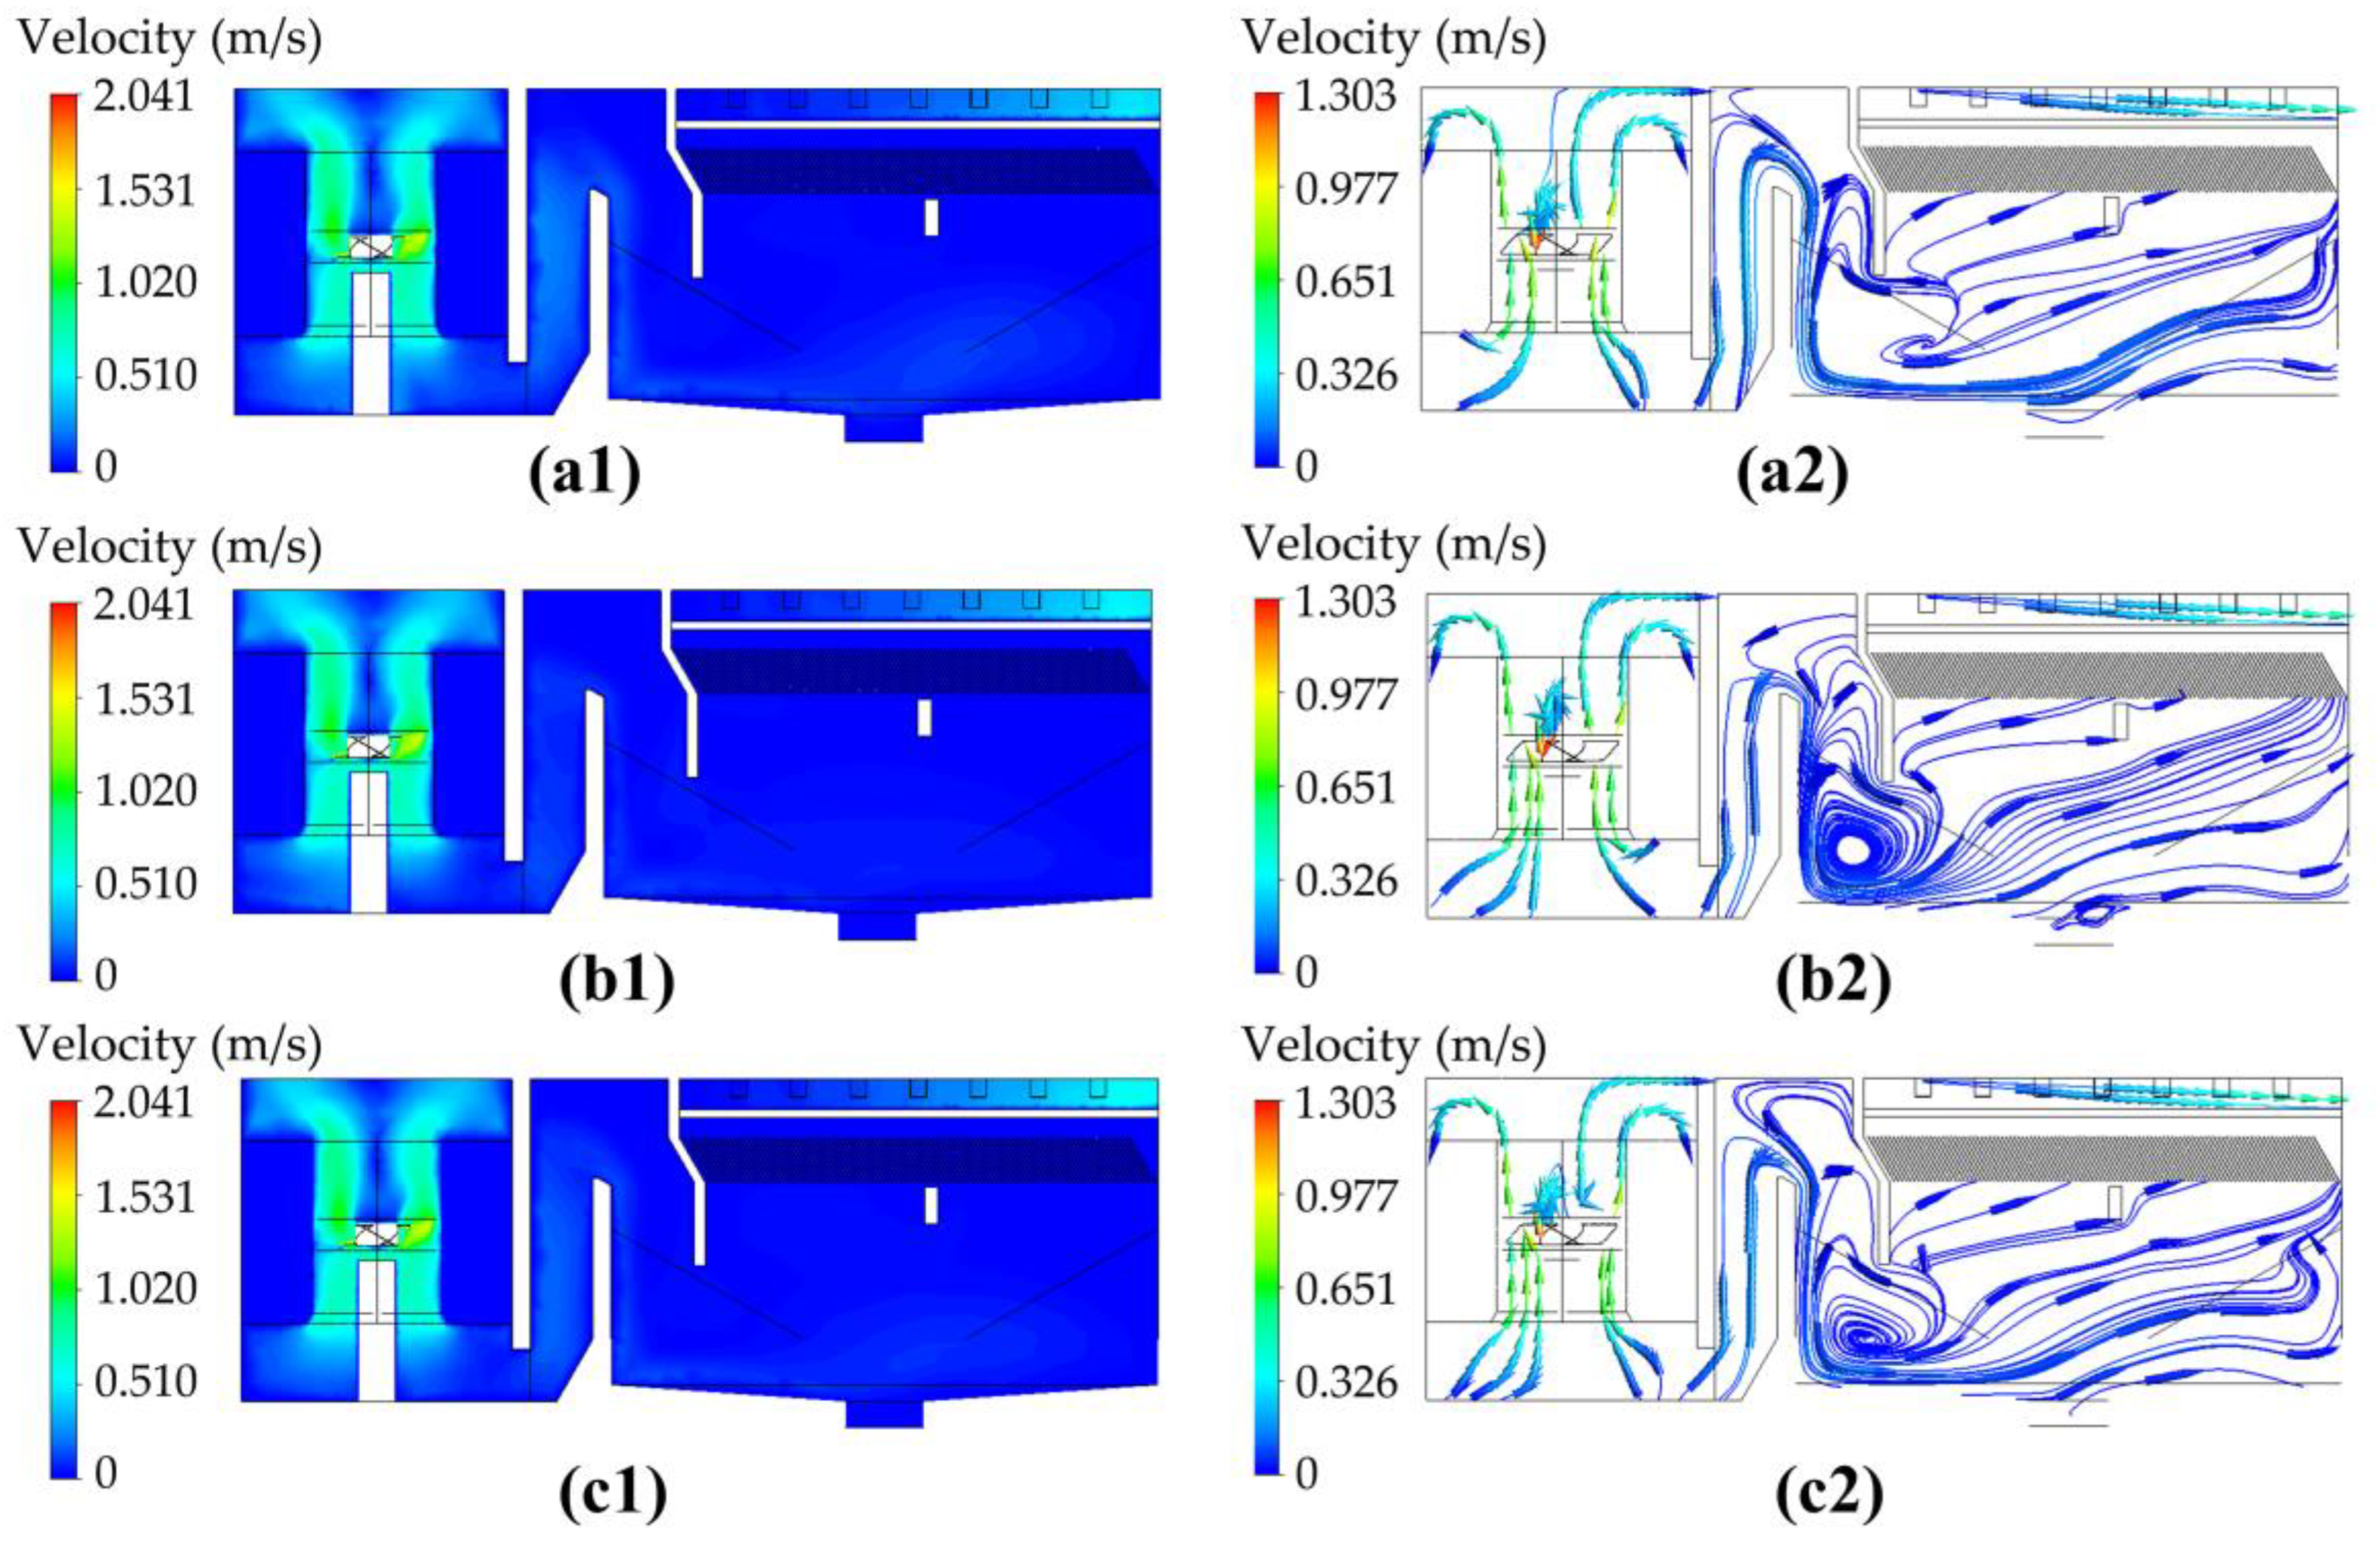
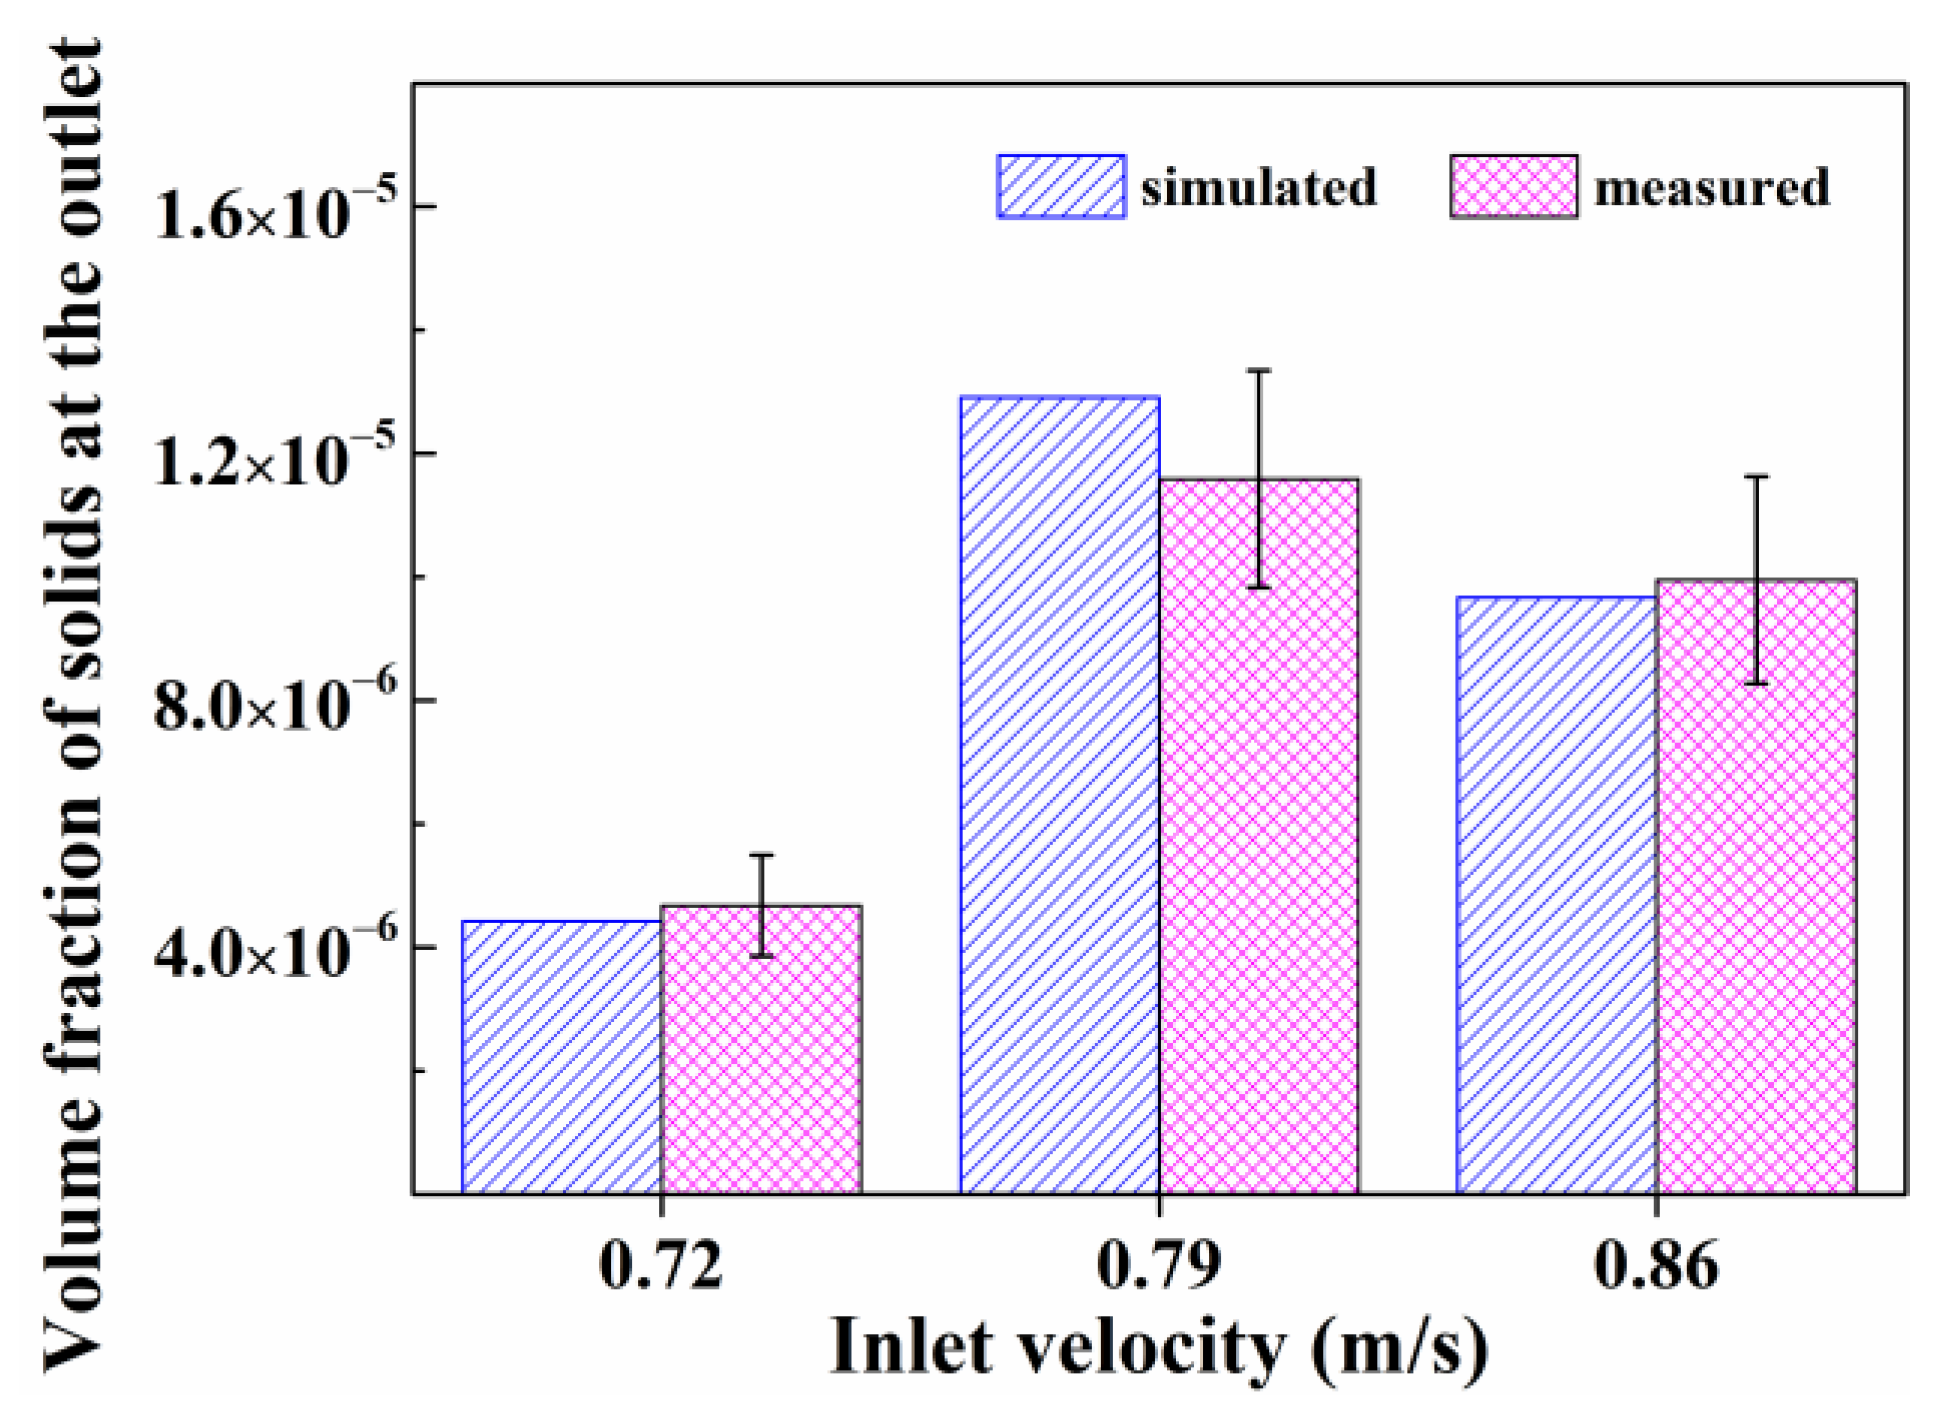
3.3.3. Inlet Velocity

As one of the most important operational parameters, the water flow rate can directly affect the flow characteristics, which in turn influences the treatment performance of the high-efficiency sedimentation tank [30]. Within the increase in inlet flow velocity from 0.72 m/s to 0.86 m/s, the distribution of water velocity is less pronounced (Figure 13). Relatively high flow velocity (0.79 m/s, 0.86 m/s) corresponds to the strong kinetic energy currents formed in the clarification zone.
A low velocity (0.72 m/s) of the inlet flow leads to large values for average turbulent kinetic energy and average dissipation rate in the flocculation zone (Table 5). Furthermore, relatively weak hydraulics can be observed in the flocculation zone, compared to that in the plug-flow and clarification zones. Thus, a relatively slow flow (0.72 m/s) at the inlet can provide sufficient mixing and collision of particles in the flocculation zone, and the settling and separation of the flocs in the clarification zone can also be kept. A further reduction in flow velocity means a larger land footprint may be required to treat the same amount of wastewater, giving rise to additional construction costs. In addition, if the flow velocity is too low, a great number of flocs can accumulate at the bottom of the flocculation tank, which may even result in the formation of floating sludge flocs (namely, sludge bulking) [12].
To verify the results of the CFD simulation, the measured and simulated volume solid holdup of flocs at the outlet were compared. As shown in Figure 14, the simulated results are closer to the experimental data, with a normalized standard error of 6.45%, revealing an acceptable agreement between two sets of results. It shows that the lowest probability of carrying alum floc can be achieved under the inlet velocity of 0.72 m/s. This demonstrates that under this hydraulic condition, the high-efficiency coagulation-clarification integrated device exhibits optimal solid–liquid separation performance.

3.4. Comparison between High-Efficiency Settling Tank and Conventional Clarifier

To illustrate the advantages of high-efficiency settling tanks, they was compared with a conventional mechanically accelerated clarifier for the treatment of circulating water sewage in a power plant in North China. As can be seen from Table 6, the high-efficiency settling tank shows great improvement in removal efficiency of hardness and a significant reduction in doses of flocculant, especially for the high-efficiency settling tank employing magnetite as the ballast material. The enhanced performances are associated with the recirculation of densified sludge and high settling velocity of the flocs in the ballasted high-efficiency settling tank [31]. The ballasted high-efficiency settling tank can reduce 73.3% of land footprint compared with the conventional clarifier for the treatment of the same amount of wastewater. And the construction cost of high-efficiency settling tanks are merely half of that of the conventional mechanically accelerated clarifier. Thus, the ballasted high-efficiency settling tank has enormous advantages over the conventional clarifier, such as higher hydraulic loading, higher removal efficiency of hardness, smaller footprint, and lower doses of flocculant.

4. Conclusions

In this study, the flow field of high-efficiency sedimentation tanks was investigated by employing computational fluid dynamics (CFD) methods. The flow distribution, turbulent kinetic energy, turbulent kinetic energy dissipation rate, and volume solid holdup were used to optimize the internal structural parameters and the operational conditions. The following conclusions were obtained:
(1) The average turbulent kinetic energy of the flocculation zone showed an increasing trend with the rising of the diameter and the height of the draft tube. When the diameter and the height of the draft tube in the flocculation zone are 2.5 and 3.5 m, respectively, the optimal hydraulic conditions for flocculation can be achieved.
(2) When the water tunnel height was 1.0 m and the water-retaining weir height was 1.6 m, the overall plug-flow and clarification zone exhibited the optimal hydraulic conditions, which controlled the collision intensity, avoided floc destruction, and facilitated effective sedimentation.
(3) Excellent overall hydraulic conditions in the high-efficiency sedimentation tank were achieved with a heavy medium particle dosage of 40 mg/L, a stirring rate of 30 rpm, and an inlet velocity of 0.72 m/s. This condition is beneficial for achieving floc particle collision and aggregation in the flocculation zone while ensuring good solid–liquid separation in the plug-flow and clarification zone.
(4) Compared with the conventional mechanically accelerated clarifier, the ballasted high-efficiency settling tank offers major benefits in terms of higher hydraulic loading, higher removal efficiency of hardness, smaller footprint, and lower doses of flocculant.
Despite the fact that CFD provides useful information for the optimization of hydraulic conditions in the high-efficiency settling tank, it is worth noting that the solid–liquid separation efficiency is also known to be affected by floc characteristics other than hydraulic characteristics [32,33]. The evolution of floc characteristics (e.g., density, diameter, and shape) during the coagulation period was not considered in the present study due to the complexity of the reconstruction process of the floc structure. A coupled computational fluid dynamics–population balance model (CFD-PBM) method was recently used to predict changes in floc size during flocculation and sedimentation [34]. Therefore, the CFD-PBM method should be applied to obtain more accurate results in the design and optimization of high-efficiency sedimentation tanks in future studies, though it requires a huge computational resource.

Supplementary Materials

The following supporting information can be downloaded at: https://www.mdpi.com/article/10.3390/w15203656/s1, Figure S1: Distributions of turbulent kinetic energy in different cross-sections for various draft tube diameters D; Figure S2: Distributions of turbulent kinetic energy dissipation rate in different cross-sections for various draft tube diameters D; Figure S3: Distributions of turbulent kinetic energy in different cross-sections for various draft tube heights H; Figure S4: Distributions of turbulent kinetic energy dissipation rate in different cross-sections for various draft tube heights H; Table S1: Effect of water-retaining weir height l on average turbulent kinetic energy k and average turbulent kinetic energy dissipation rate ε in plug-flow/clarification zone.

Author Contributions

Conceptualization, S.K., Z.Y. and J.W.; methodology, Z.Y., Z.W. and J.W.; software, B.Z. and J.W.; validation, S.K., Z.W. and Q.J.; formal analysis, Q.J., J.Z. and B.Z.; investigation, S.K. and B.Z.; resources, Z.Y., J.Z. and B.Z.; data curation, B.Z., J.W. and S.K.; writing—original draft preparation, Z.Y. and J.W.; writing—review and editing, S.K., J.Z. and B.Z.; project administration, Z.W.; funding acquisition, Z.Y. All authors have read and agreed to the published version of the manuscript.

Funding

This research was funded by the Science and Technology Project of China Huaneng Group Co., Ltd. (project number: HNKJ21-HF57, project title: Development of an integrated equipment for heavy-medium enhanced coagulation-clarification).

Institutional Review Board Statement

Not applicable.

Informed Consent Statement

Not applicable.

Data Availability Statement

Not applicable.

Conflicts of Interest

The authors declare no conflict of interest.

References

  1. Imasuen, E.; Judd, S.; Sauvignet, P. High-rate clarification of municipal wastewaters: A brief appraisal. J. Chem. Technol. Biotechnol. 2004, 79, 914–917. [Google Scholar] [CrossRef]
  2. Zhang, S.; Wu, Q.; Ji, H. Research on zero discharge treatment technology of mine wastewater. Energy Rep. 2022, 8, 275–280. [Google Scholar] [CrossRef]
  3. Chen, Z.; Yang, B.; Wen, Q.; Chen, C. Evaluation of enhanced coagulation combined with densadeg-ultrafiltration process in treating secondary effluent: Organic micro-pollutants removal, genotoxicity reduction, and membrane fouling alleviation. J. Hazard. Mater. 2020, 396, 122697. [Google Scholar] [CrossRef]
  4. Song, W.; Ren, Y.; Jia, R.; Zhao, L.; Chen, F.; Zhu, Z. Removal of organic pollutants by contact oxidation of biological carbon sludge. Water Environ. Res. 2020, 92, 1975–1982. [Google Scholar] [CrossRef]
  5. Kumar, S.; Kazmi, A.A.; Ghosh, N.C.; Kumar, V.; Rajpal, A. Urban stormwater runoff treatment of Nainital Lake’s catchment: An application of ballasted sand flocculation technology. Water Supply 2018, 19, 1017–1025. [Google Scholar] [CrossRef]
  6. Xu, Q.; Luo, X.; Xu, C.; Wan, Y.; Xiong, G.; Chen, H.; Zhou, Q.; Yan, D.; Li, X.; Li, Y.; et al. The whole process CFD numerical simulation of flow field and suspended solids distribution in a full-scale high-rate clarifier. Sustainability 2022, 14, 10624. [Google Scholar] [CrossRef]
  7. Vahidifar, S.; Saffarian, M.R.; Hajidavalloo, E. Introducing the theory of successful settling in order to evaluate and optimize the sedimentation tanks. Meccanica 2018, 53, 3477–3493. [Google Scholar] [CrossRef]
  8. Teh, C.Y.; Budiman, P.M.; Shak, K.P.Y.; Wu, T.Y. Recent advancement of coagulation-flocculation and its application in wastewater treatment. Ind. Eng. Chem. Res. 2016, 55, 4363–4389. [Google Scholar] [CrossRef]
  9. Vahidifar, S.; Saffarian, M.R.; Hajidavalloo, E. Numerical simulation of particle-laden flow in an industrial wastewater sedimentation tank. Meccanica 2019, 54, 2367–2383. [Google Scholar] [CrossRef]
  10. Wang, H.; Yu, X.; Li, Y.; Cui, Y.; Zhang, K. Effect of sludge return ratio on the treatment characteristics of high-efficiency sedimentation tank. Desalin Water Treat. 2014, 52, 5118–5125. [Google Scholar] [CrossRef]
  11. Xu, R.; Cao, J.; Fang, F.; Feng, Q.; Yang, E.; Luo, J. Integrated data-driven strategy to optimize the processes configuration for full-scale wastewater treatment plant predesign. Sci. Total Environ. 2021, 785, 147356. [Google Scholar] [CrossRef]
  12. Xu, Q.; Xiao, K.; Wu, Q.; Wang, H.; Liang, S.; Yu, W.; Tao, S.; Hou, H.; Liu, B.; Hu, J.; et al. The optimization on distributions of flow field and suspended solids in a full-scale high-rate clarifier using computational fluid dynamics. Biochem. Eng. J. 2020, 155, 107489. [Google Scholar] [CrossRef]
  13. Vakili, M.H.; Esfahany, M.N. CFD analysis of turbulence in a baffled stirred tank, a three-compartment model. Chem. Eng. Sci. 2009, 64, 351–362. [Google Scholar] [CrossRef]
  14. Samstag, R.W.; Ducoste, J.J.; Griborio, A.; Nopens, I.; Batstone, D.J.; Wicks, J.D.; Saunders, S.; Wicklein, E.A.; Kenny, G.; Laurent, J. CFD for wastewater treatment: An overview. Water Sci. Technol. 2016, 74, 549–563. [Google Scholar] [CrossRef]
  15. Hirom, K.; Devi, T.T. Application of computational fluid dynamics in sedimentation tank design and its recent developments: A review. Water Air Soil. Pollut. 2022, 233, 22. [Google Scholar] [CrossRef]
  16. Sadino-Riquelme, M.C.; Donoso-Bravo, A.; Zorilla, F.; Valdebenito-Rolack, E.; Gomez, D.; Hansen, F. Computational fluid dynamics (CFD) modeling applied to biological wastewater treatment systems: An overview of strategies for the kinetics integration. Chem. Eng. J. 2023, 466, 143180. [Google Scholar] [CrossRef]
  17. Patziger, M.; Kainz, H.; Hunze, M.; Józsa, J. Influence of secondary settling tank performance on suspended solids mass balance in activated sludge systems. Water Res. 2012, 46, 2415–2424. [Google Scholar] [CrossRef]
  18. Zhang, S.; Wang, R.; Xu, J.; Wang, Y. Large-scale hydraulic optimization of high-efficiency clarifiers in water plants. Proc. IOP Conf. Ser. Earth Environ. Sci. 2022, 1011, 012031. [Google Scholar] [CrossRef]
  19. Iserte, S.; Carratalà, P.; Arnau, R.; Martínez-Cuenca, R.; Barreda, P.; Basiero, L.; Climent, J.; Chiva, S. Modeling of wastewater treatment processes with hydrosludge. Water Environ. Res. 2021, 93, 3049–3063. [Google Scholar] [CrossRef]
  20. Hong, F.; Tian, H.; Yuan, X.; Liu, S.; Peng, Q.; Shi, Y.; Jin, L.; Ye, L.; Jia, J.; Ying, D.; et al. CFD-assisted modeling of the hydrodynamic cavitation reactors for wastewater treatment—A review. J. Environ. Manag. 2022, 321, 115982. [Google Scholar] [CrossRef]
  21. Sharma, M.; Mohapatra, T.; Ghosh, P. Hydrodynamics, mass and heat transfer study for emerging heterogeneous Fenton process in multiphase fluidized-bed reactor system for wastewater treatment—A review. Chem. Eng. Res. Des. 2021, 171, 48–62. [Google Scholar] [CrossRef]
  22. Kostoglou, M.; Karapantsios, T.D.; Matis, K.A. CFD model for the design of large scale flotation tanks for water and wastewater treatment. Ind. Eng. Chem. Res. 2007, 46, 6590–6599. [Google Scholar] [CrossRef]
  23. Shahrokhi, M.; Rostami, F.; Md Said, M.A.; Sabbagh Yazdi, S.R.; Syafalni. The effect of number of baffles on the improvement efficiency of primary sedimentation tanks. Appl. Math. Model. 2012, 36, 3725–3735. [Google Scholar] [CrossRef]
  24. Feng, Q.; Ge, R.; Sun, Y.; Fang, F.; Luo, J.; Xue, Z.; Cao, J.; Li, M. Revealing hydrodynamic effects on flocculation performance and surface properties of sludge by comparing aeration and stirring systems via computational fluid dynamics aided calculation. Water Res. 2020, 172, 115500. [Google Scholar] [CrossRef] [PubMed]
  25. Rezavand, M.; Winkler, D.; Sappl, J.; Seiler, L.; Meister, M.; Rauch, W. A fully Lagrangian computational model for the integration of mixing and biochemical reactions in anaerobic digestion. Comput. Fluids 2019, 181, 224–235. [Google Scholar] [CrossRef]
  26. Miller, K.; Chuang, W.L.; Kim, K.; Chang, K.A.; Chellam, S. Simultaneous in situ characterization of turbulent flocculation and reactor mixing using image analysis and particle image velocimetry in unison. ACS EST Eng. 2023, 3, 295–305. [Google Scholar] [CrossRef]
  27. Lin, Z.; Sun, X.; Wang, Q.; Cao, J.; Wang, C.; Kuang, Y. Evaluation of the effect of hydraulic shear intensity on coal-slime water flocculation in a gradient fluidized bed. Powder Technol. 2020, 360, 392–397. [Google Scholar] [CrossRef]
  28. Raeesh, M.; Devi, T.T.; Hirom, K. Recent developments on application of different turbulence and multiphase models in sedimentation tank modeling—A review. Water Air Soil. Pollut. 2022, 234, 5. [Google Scholar] [CrossRef]
  29. Lapointe, M.; Barbeau, B. Selection of media for the design of ballasted flocculation processes. Water Res. 2018, 147, 25–32. [Google Scholar] [CrossRef]
  30. Sun, Y.; Zhou, S.; Chiang, P.-C.; Shah, K.J. Evaluation and optimization of enhanced coagulation process: Water and energy nexus. Water-Energy Nexus 2019, 2, 25–36. [Google Scholar] [CrossRef]
  31. Yadai, T.; Suzuki, Y. Development of softening and ballasted flocculation as a pretreatment process for seawater desalination through a reverse osmosis membrane. npj Clean. Water 2023, 6, 7. [Google Scholar] [CrossRef]
  32. Zhang, D. Optimize Sedimentation Tank and Lab Flocculation Unit by CFD. Master’s Thesis, Norwegian University of Life Sciences, Ås, Norway, 2014. [Google Scholar]
  33. Kim, K.Y.; Park, S.; Lee, W.H.; Kim, J.O. Simulating the behavior of ballasted flocs in circular lamellar settling tank using computational fluid dynamics (CFD). Desalination Water Treat. 2020, 183, 23–29. [Google Scholar] [CrossRef]
  34. Wang, X.; Cui, B.; Wei, D.; Song, Z.; He, Y.; Bayly, A.E. CFD-PBM modelling of tailings flocculation in a lab-scale gravity thickener. Powder Technol. 2022, 396, 139–151. [Google Scholar] [CrossRef]
Figure 1. Three-dimensional schematic diagram of (a) flocculation zone, (b) plug-flow and clarification zone, and (c) the overall high-efficiency sedimentation tank.
Water 15 03656 g001
Figure 2. Velocity distribution contour map of the YZ cross-section at different diameters of the draft tube: (a) 2.4 m, (b) 2.5 m, and (c) 2.6 m.
Water 15 03656 g002
Figure 3. The influence of different diameters of the draft tube on (a) average turbulent kinetic energy k and (b) average turbulent kinetic energy dissipation rate ε on a typical cross-section.
Water 15 03656 g003
Figure 4. The contour profiles of velocities in the YZ cross-section for different heights of the draft tube: (a) 3.4 m, (b) 3.5 m, and (c) 3.6 m.
Water 15 03656 g004
Figure 5. The influence of different heights of the draft tube on (a) average turbulent kinetic energy k and (b) average turbulent kinetic energy dissipation rate ε on a typical cross-section.
Water 15 03656 g005
Figure 6. The velocity distribution (a1c1) and streamline diagram (a2c2) of XY cross-section (Z = 0) at different water tunnel heights: (a1,a2) h = 0.9 m, (b1,b2) h = 1.0 m, (c1,c2) h = 1.1 m.
Water 15 03656 g006
Figure 7. Distribution of turbulent kinetic energy (a1c1) and turbulent kinetic energy dissipation rate (a2c2) in the XY cross-section (Z = 0) at different heights h across the water tunnel. (a1,a2) h = 0.9 m, (b1,b2) h = 1.0 m, (c1,c2) h = 1.1 m.
Water 15 03656 g007
Figure 8. The velocity distribution (a1c1) and streamline diagram (a2c2) of XY cross-section (Z = 0) at different heights of water-retaining weir: (a1,a2) l = 1.5 m, (b1,b2) l = 1.6 m, (c1,c2) l = 1.7 m.
Water 15 03656 g008
Figure 9. The liquid phase velocity distribution (left) and streamline diagram (right) of XY cross-section (Z = 0) with different heavy medium particle dosages: (a1,a2) 0 mg/L, (b1,b2) 20 mg/L, (c1,c2) 40 mg/L, (d1,d2) 60 mg/L.
Water 15 03656 g009
Figure 10. The volume solid holdup distribution of XY cross-section (Z = 0) with different heavy medium particle dosages: (a) 0 mg/L, (b) 20 mg/L, (c) 40 mg/L and (d) 60 mg/L.
Water 15 03656 g010
Figure 11. The velocity distribution (a1c1) and streamline diagram (a2c2) of XY cross-section (Z = 0) at different stirring rates: (a1,a2) 25 rpm, (b1,b2) 30 rpm, (c1,c2) 35 rpm.
Water 15 03656 g011
Figure 12. The volume solid holdup distribution of XY cross-section (Z = 0) at different stirring rates: (a) 25 rpm, (b) 30 rpm, (c) 35 rpm.
Water 15 03656 g012
Figure 13. The velocity distribution (left) and streamline diagram (right) of XY cross-section (Z = 0) at different inlet velocity: (a1,a2) 0.72 m/s, (b1,b2) 0.79 m/s and (c1,c2) 0.86 m/s.
Water 15 03656 g013
Figure 14. Comparisons of the simulated and measured volume solid holdup of flocs at the outlet under different inlet flow rates.
Water 15 03656 g014
Table 1. Turbulent kinetic energy and dissipation rate in the flocculation zone.
Diameter of Draft Tube
(m)
Turbulent Kinetic Energy k
(m2·s−2)
Dissipation Rate ε
(m2·s−3)
2.40.02360.0109
2.50.02890.0155
2.60.02850.0161
Table 2. Effect of draft tube height on average turbulent kinetic energy k and average turbulent kinetic energy dissipation rate ε in flocculation zone.
Height of Draft Tube
(m)
Turbulent Kinetic Energy k
(m2·s−2)
Dissipation Rate ε
(m2·s−3)
3.40.02560.0133
3.50.02890.0155
3.60.02440.0125
Table 3. Effect of water tunnel height on average turbulent kinetic energy k and average turbulent kinetic energy dissipation rate ε in plug-flow/clarification zone.
Height of Water Tunnel
(m)
Turbulent Kinetic Energy k
(m2·s−2)
Dissipation Rate ε
(m2·s−3)
0.90.7787 × 10−40.1245 × 10⁻⁴
1.00.7533 × 10−40.1205 × 10⁻⁴
1.10.7500 × 10−40.1224 × 10⁻⁴
Table 4. Effect of heavy medium particle dosage on average turbulent kinetic energy k and average dissipation rate ε.
Dosage of Heavy Medium Particles (mg/L)Flocculation ZonePlug-Flow/Clarification Zone
k (10−2 m2·s−2)ε (10−3 m2·s−3)k (10−4 m2·s−2)ε (10−5 m2·s−3)
01.976.941.891.34
201.966.963.482.16
402.117.254.092.90
601.887.057.426.46
Table 5. The effect of inlet velocity—on the average turbulent kinetic energy k and the average turbulent kinetic energy dissipation rate ε.
Inlet Velocity
(m/s)
Flocculation ZonePlug-Flow/Clarification Zone
k (10−2 m2·s−2)ε (10−3 m2·s−3)k (10−4 m2·s−2)ε (10−5 m2·s−3)
0.722.117.2474.092.902
0.791.966.9964.433.553
0.861.996.7964.733.755
Table 6. Comparison between high-efficiency settling tank and conventional mechanically accelerated clarifier.
ParameterConventional Mechanically Accelerated ClarifierHigh-Efficiency Settling Tank
(Without Ballast)(Use of Magnetite as a Ballast Material)
Dosages of additives
 NaOH
adjust pH to 9.8adjust pH to 9.8adjust pH to 9.8
 Na2CO3 (mg/L)60~8060~8060~80
 Polyferric coagulant (Fe3+, mg/L) 12106
 Polyacrylamide flocculant (mg/L)1.51.20.5
Sludge returnhydraulically stimulated passive circulationforced circulationforced circulation
Removal efficiency of hardness (%)40~50~80>90
Removal efficiency organic substances (%)20~3020~5020~60
Suspended solid’s concentration in produced water (mg/L)<10<10<5
Hydraulic surface loading (m3/(m2·h))3~710~1515~20
Floor area (m2)about 240 about 104 about 64
Construction cost$342,398$273,918$168,460
Notes: The data come from pretreatment systems (2 × 300 m3/h) for circulating water sewage in a power plant in North China.
Disclaimer/Publisher’s Note: The statements, opinions and data contained in all publications are solely those of the individual author(s) and contributor(s) and not of MDPI and/or the editor(s). MDPI and/or the editor(s) disclaim responsibility for any injury to people or property resulting from any ideas, methods, instructions or products referred to in the content.

