Next Article in Journal
Landscape Ecological Risk Assessment and Driving Force Analysis of the Heihe River Basin in the Zhangye Area of China
Previous Article in Journal
River Recreational Activity Vulnerability Assessment and the Hydraulic Index Proposal
 
 
Correction published on 4 June 2024, see Water 2024, 16(11), 1609.
Article

Wetland Management in Recharge Regions of Regional Groundwater Flow Systems with Water Shortage, Nyírség Region, Hungary

1
József and Erzsébet Tóth Endowed Hydrogeology Chair, Department of Geology, Institute of Geography and Earth Sciences, ELTE Eötvös Loránd University, 1117 Budapest, Hungary
2
Department of Geophysics and Space Science, Institute of Geography and Earth Sciences, ELTE Eötvös Loránd University, 1117 Budapest, Hungary
3
Hortobágy National Park Directorate, 4024 Debrecen, Hungary
*
Author to whom correspondence should be addressed.
Water 2023, 15(20), 3589; https://doi.org/10.3390/w15203589
Submission received: 31 August 2023 / Revised: 2 October 2023 / Accepted: 10 October 2023 / Published: 13 October 2023 / Corrected: 4 June 2024
(This article belongs to the Section Hydrogeology)

Abstract

:
Climate change and increasing human impacts are more emphasised in recharge regions, where the main flow direction is downward, resulting in negative water balance. Two wetlands located in the recharge position of regional groundwater flow systems were investigated in the Nyírség region, Hungary, as pilot areas for representing wetlands in similar hydraulic positions. Hydraulic data processes, chemical data evaluations, and numerical simulations revealed that the wetlands are fed via local flow systems, superimposing regional-scale recharge conditions in the area. The wetlands are discharge and flow-through types in connection with local flow systems. Nevertheless, in the case of significant regional water table decline—due to the high vulnerability of recharge areas to climate change—local flows are degraded, so they are not able to sustain the wetlands. To preserve the groundwater-dependent ecosystems in the areas, water retention at the local recharge areas of the wetlands may help in the mitigation of water level decline under present-day conditions. If the regional water table continues to decline, comprehensive water retention solutions are needed in the whole region. The results highlight that understanding the natural wetland–groundwater interactions at different scales is crucial for the preservation of wetlands and for successful water retention planning.

1. Introduction

Wetlands and associated groundwater-dependent ecosystems (GDEs) are integral parts of groundwater [1,2,3]. Their protection and proper handling require an understanding of their interactions with groundwater flow systems. This connection may be variable, and wetlands can be located in recharge (connected or disconnected), flow-through, or discharge positions [4,5]. These basic positions can be more complex, as wetlands may be simultaneously influenced via flow systems of different orders and magnitudes [6,7,8,9,10]. These complex situations highlight the significance of different scales during the investigation of wetland areas [11]. In addition to spatial scales, time is also an important factor to consider because wetland and groundwater connections may change temporally due to seasonally forming groundwater mounds or sub-local depressions caused via transpiration [1,12]. Not only do short-term seasonal climatic changes affect wetlands or GDEs and their relation to the groundwater but long-term climate change may also have a significant impact on them [13,14,15]. On the one hand, groundwater acts as a buffer against the negative effects of climate change [16] due to the long residence times. In the case of local flow systems, however, especially in recharge areas, climate change is reflected in declining water tables and simplifying flow systems due to the decreasing recharge [17,18,19]. Consequently, connected, vulnerable wetlands and GDEs may face water shortages [20,21,22], especially in recharge and flow-through regions of gravitational flow systems, where the dominant groundwater flow direction is downward or horizontal, causing a negative water balance. As a result, wetlands may dry up, or shrink in area. At the same time, the increasing irrigation demand, the overexploitation of groundwater resources, and land use change are also contributing to the decline in groundwater levels and water shortages in wetlands and GDEs [14,23]. The restoration of wetlands is an important task worldwide, and solutions highly depend on the natural conditions of the area [24]. In the case of groundwater-related wetlands, rehabilitation always requires the investigation of the groundwater flow conditions, on small as well as large scales [13,25,26]. Water retention may help in mitigating the effects of declining water levels [27], but the position of the area along the groundwater flow systems highly determines the most suitable solutions. Managed aquifer recharge (MAR) applications are straightforward options for surface or subsurface water retention in the presence of a good aquifer below the surface [28]. In a successful MAR implementation, understanding groundwater flow conditions is crucial in order to determine the potential pathways of the retained, infiltrated, or injected water. This natural groundwater movement may also be useful for the rehabilitation of GDEs and wetlands by applying appropriate MAR solutions in the recharge areas of GDEs or wetlands [24,29,30], as a nature-based solution [31]. Szabó et al. [31] found that the efficiency of this solution is dependent more on the position of the MAR solution in the flow systems rather than on the amount of retained water.
The Nyírség region at the Great Hungarian Plain (Hungary) is situated in a sedimentary basin environment and is lacking 5–6 km3 of groundwater from the subsurface [32], which is due to climate change and human activity, such as groundwater overexploitation, afforestation, land use change, and canal construction, in the last fifty years. Due to the decreasing water table, most wetlands have dried up in topographically elevated regions, endangering the associated GDEs. Based on the considerations mentioned above, a system approach [33] needs to be applied to assess groundwater and its interaction with wetlands. Determining natural conditions and understanding the groundwater flow dynamics and its connection to wetlands, spatially and temporally, are the foundation of finding the appropriate solution to disappearing wetlands in the area. In the case of wetlands and lakes, bottom deepening or water supply from a deeper well may be feasible options; however, both options may lead to a reduction in groundwater resources by enhancing groundwater evaporation on the surface. In contrast, the present study investigates “near natural” solutions that utilise groundwater flow conditions. This methodology emphasises the significance of understanding groundwater flow systems in wetland rehabilitation and their role in the application of MAR solutions.
The paper focuses on two wetland areas—Lake Csohos and Lake Daruláp—in the South-Nyírség region, representing pilot areas for studying groundwater management in wetlands located in the regional recharge position of the Great Hungarian Plain. Both areas are protected nature conservation areas because of their rare and valuable flora and fauna. The two wetlands are affected via water shortage, which has led to Lake Csohos being dry since 2011 and Lake Daruláp drying up during the dry summers. The main objectives of this study are (1) to understand the natural groundwater flow conditions of the sites and (2) to propose potential solutions to mitigate the water decline affecting the area. At Lake Csohos, the deforestation of a local sand dune was tested as one of the potential water retention strategies. (3) At Lake Daruláp, in addition to water shortage, potential contamination from the neighbouring crop field is also assessed.

2. Materials and Methods

2.1. Study Area

The Nyírség region is located on the northeastern side of the Great Hungarian Plain, in the Pannonian Basin, Hungary. The regional study area is shown in Figure 1a,b.
The area has a gently undulating medium–high lowland-type topography with low floodplains and dissected loess alluvial plains. The main land-forming process is wind, resulting in a sandy alluvial plain covered with sandy loess, surrounded by a rim and parabolic dunes [34,35]. The topographic elevation varies between 95 and 175 m above sea level (m asl) (Figure 1b), continuously decreasing from north to south.
The climate is moderately warm, the annual precipitation in the region ranges from 550–600 mm, while the mean annual temperature is 9–10 °C [36]. The mean annual actual evapotranspiration (ET) is 467–497 mm/yr [37].
Geologically, the area is part of the Pannonian Basin system (Figure 1a), which is a sedimentary basin complex consisting of several sub-basins separated via basement ridges and highs. The pre-Neogene basement is covered by a thick Neogene sedimentary basin fill in the area. The geological units were classified into regional-scale hydrostratigraphic units for hydrogeological investigations after the works of [38,39]. The so-called pre-Neogene basement comprises Palaeozoic metamorphic rocks (gneiss, mica shale, and amphibolite), Mesozoic volcanic rocks, and the overlying marine sediments (pelagic marl and flish) [40], forming the pre-Neogene Aquifer (K ≤ 10−6 m/s). The overlying pre-Pannonian Aquifer (K = 10−6 m/s) contains mainly marine carbonates and clastic pre-Pannonian Miocene sediments. At the beginning of the Pannonian period, the Pannonian Lake was isolated from the Eastern Paratethys and started to fill up with sediments deposited in different geological environments [41]. The clayey marl and calcareous marl sediments of the Endrőd Aquitard (K = 10−9–10−8 m/s) are the result of pelagic sedimentation. The turbidite formation deposited towards the basin margins belongs to the Szolnok Aquifer (K = 10−7–10−6 m/s). The Algyő Aquitard (K = 10−8–10−7 m/s) is composed of aleurolite and clayey marl, representing the self-slope of the basin [42]. In the Pliocene, lacustrine–fluvial sedimentation was significant, represented by the Great Plain Aquifer (K = 10−5 m/s) [41]. In the Pleistocene, the fluvial sedimentation continued and resulted in a large alluvial fan consisting of gravel and alternating sand and clay layers. Twenty-five thousand years ago, the fluvial deposition terminated and wind turned out to be the main land-forming process, redistributing the previously formed alluvial deposits [43]. In this period, eolian deposition (sand, loess) and land formation happened, resulting in depressions and accumulation landforms, such as different dune types [44]. Pleistocene and Holocene sediments are also part of the regional Great Plain Aquifer.
Hydrogeologically, the Great Hungarian Plain has two main groundwater flow regimes [38]. A deep, overpressured upward-directed flow regime that originates in the pre-Neogene basement. The overpressure is dissipated through the Endrőd and Algyő Aquitards reaching normal pressure conditions in the Great Plain Aquifer. This flow system is superimposed by a shallow topography-driven groundwater flow regime in the upper 500–700 m in every part of the Great Hungarian Plain [38]. These two flow systems were identified in the Nyírség region, too [39,45].
Lake Csohos and Lake Daruláp are situated in the southern part of the regional study area (Figure 1b). Lake Csohos is located in a former alluvial valley, which is bounded via a forested NE-SW-directed dune from the west and via a marsh meadow from the east (Figure 2a).
At the eastern edge of the area, Canal Monostori, an artificial canal constructed in the 19th century, is found. The elevation in the area is the highest on the western dune at 125 m asl, while the deepest on the eastern side of the study area (~110 m asl) is in the eastern foreground of the canal. The marsh meadow is dissected by a smaller dune between points Cs4 and Cs5 (Figure 2a). To the northeast of the lake, a U-shaped, old river channel is located, which is usually saturated by water in springtime. Its deepest point (~113 m asl) is a ~200 m2 large concentrical hole (“wet patch” in Figure 2a), which usually remains wet, except in dry summers. Historically, the entire meadow area between the dune and the canal was inundated by water at springtime, and the excess water was led to the canal through a sluice, which has remained closed in the last decade. The lake has not had full water coverage for 40 years and has been completely dry since 2011.
The preservation of the diverse ecosystem of the area needs constant water inundation or, at least, a higher water table at or near the surface. On the dune, west of the lake, poplar trees and locusts are found, while in the lakebed, reed (Phragmite) and gorse grow. In the wet meadow, small forest belts are running. The poplar and locust trees cause large transpiration from the subsurface, with poplar using approximately 680 mm/yr and locust around 279 mm/yr [46], supposedly decreasing the water table and taking up the infiltrating water at the sand dune.
The shallow (upper ~35 m) hydrostratigraphic build-up at Lake Csohos was determined via geophysical measurements (radiomagnetotellurics (RMT)) [47]. In this zone, fine- and medium-grained sand (K = 10−5 m/s) is dominantly dissected by clayey and silty sand lenses (K = 10−6 m/s).
Lake Daruláp is located ~5 km far from Lake Csohos towards E-NE (Figure 1b). The western side of the lake is bordered by a NE-SW-directed sand dune at a ~130 m asl elevation (Figure 2b). The lake and its eastern foreground with crop fields represent the deepest part of the area with a <115 m asl elevation. At the eastern boundary of the local-scale study area, Creek Kálló runs (Figure 2b). At the eastern edge of the lake, a NE-SW-directed former riverbed is located with dense vegetation but no continuous water inundation (Figure 2b).
The lake has quasi-permanent water inundation and dries up only in dry summers. In the case of high lake levels, excess water can be diverted into a ditch on the southern side of the lake. The lake area is vegetated, mainly by gorse. On the northern side of the lake, diffuse groundwater seepage was observed, coinciding with the appearance of tussocky vegetation (Figure 2b). On the crop field, east of the lake (Figure 2b), alfalfa and corn were grown during the field investigations in 2021 and 2022. During farming, manure and fertilisers were also used. The investigations are intended to decide whether these fertilisers can affect the wetland or not.
At Lake Daruláp, based on geophysical measurements carried out by the authors, in shallow (upper ~35 m) depths, fine- and medium-grained sand dominates (K = 10−5–10−6 m/s) [47].

2.2. Methods

2.2.1. Regional-Scale Wetland–Groundwater Characterisation

Firstly, a regional-scale hydraulic and chemical data analysis was carried out to delineate the hydraulic position of the two wetlands in the regional groundwater flow systems. The groundwater potential field and the flow direction were determined from a pressure–elevation (i.e., p(z)) profile and from a vertical hydraulic cross-section (Figure 1b). For these, raw hydraulic data (i.e., water level or pore pressure) were obtained from the well database of the Supervisory Authority for Regulatory Affairs. The data were culled before the data analysis (data can be found in Table S1 of the Supplementary Materials). For conversions between pressure and hydraulic head, a water density of 1000 kg/m3 and a gravitational acceleration of 9.8067 m/s2 were used.
The p(z) profile depicts the measured pore pressure values versus the elevation of the middle of the wells’ screened intervals [38,48]. The vertical pressure gradient of the measured values compared to the hydrostatic gradient (g = 9.81 MPa/km) determines the vertical component of the groundwater flow in the given area. If the gradient is above hydrostatic, the vertical component of the groundwater flow is upward, and if it is below, downward movement can be identified in the area. In addition, the profile helps to identify governing pressure conditions related to the investigated area. Normal pressure represents the prevalence of the topography-driven flow, and abnormal pressure conditions reflect different driving forces and special geological and hydrogeological situations, e.g., tectonic compression in the case of overpressure or unloading in the case of underpressure. In this study, normal pressure conditions, i.e., topography-driven flow, were interpreted between the two hydrostatic pressure gradients between the maximum (170 m asl) and minimum water table (85 m asl) elevations in the basin where the study area is located (zwt(max) and zwt(min), respectively). This pressure zone represents those pressure values that can be generated via differences in water table topography as a driving force in the basin [49]. Above these values, overpressure prevails, and below these values, underpressure prevails. For p(z) profile analysis, the smallest possible area considering data availability was delineated to avoid errors originating from large water table variations between the wells.
Hydraulic cross-section represents hydraulic head data distribution in the function of elevation along a vertical section [38,48]. Thus, the cross-section-aligned flow component of the groundwater can be revealed. For the section compilation, hydraulic head data from a 5 km proximity of the section line location were used.
Along the hydraulic cross-section, the hydrostratigraphic build-up was displayed with the help of the geological logs of the wells used for the hydraulic data process and by applying the hydrostratigraphic compartmentalisation of Szabó [39].
The regional-scale chemical character of the area was represented by data measured in 32 wells penetrating the 7–304 m depth interval. The data were obtained from the General Directorate of Water Management (Table S2 of the Supplementary Materials). Measurements of these wells were carried out between 1981 and 2017. Interpretation was conducted after data culling (based on ionic balance calculation).

2.2.2. Local-Scale Wetland–Groundwater Characterisation

Following the regional-scale characterisation, flow conditions in the close surroundings of the two wetlands (Lake Csohos and Lake Daruláp) were also assessed (Figure 2a,b). Shallow potentiometers were installed in both areas (Cs1–7, D1–3) (Figure 2a,b). At Lake Daruláp, two additional boreholes were drilled, D4 for water level observations in July 2021 and D5 for hydrochemical analysis in August 2021. In all other potentiometers, water levels were observed monthly between July 2021 and April 2022 (except for September and October 2021) to assess the annual variation in water level conditions. The water level of Lake Daruláp was also observed monthly at the observation point “Lake” (Figure 2b). Based on the collected water level data (Table S3 of the Supplementary Materials), seasonal water table maps were constructed in both areas.
As part of the chemical characterisation, water sampling was carried out in August 2021. All samples were analysed for main elements, except for samples D5 and Lake, which were also analysed for Kjeldahl nitrogen, total phosphorus, and chemical oxygen demand (COD). The chemical analyses were carried out by the accredited laboratory of Bálint Analitika Ltd. The analytical methods and measurement inaccuracies are listed in Table S4 of the Supplementary Material, and the measured data are found in Table S5 of the Supplementary Materials.

2.2.3. Local-Scale Numerical Simulation

As a last step, numerical simulation was performed in the surroundings of the two wetlands.
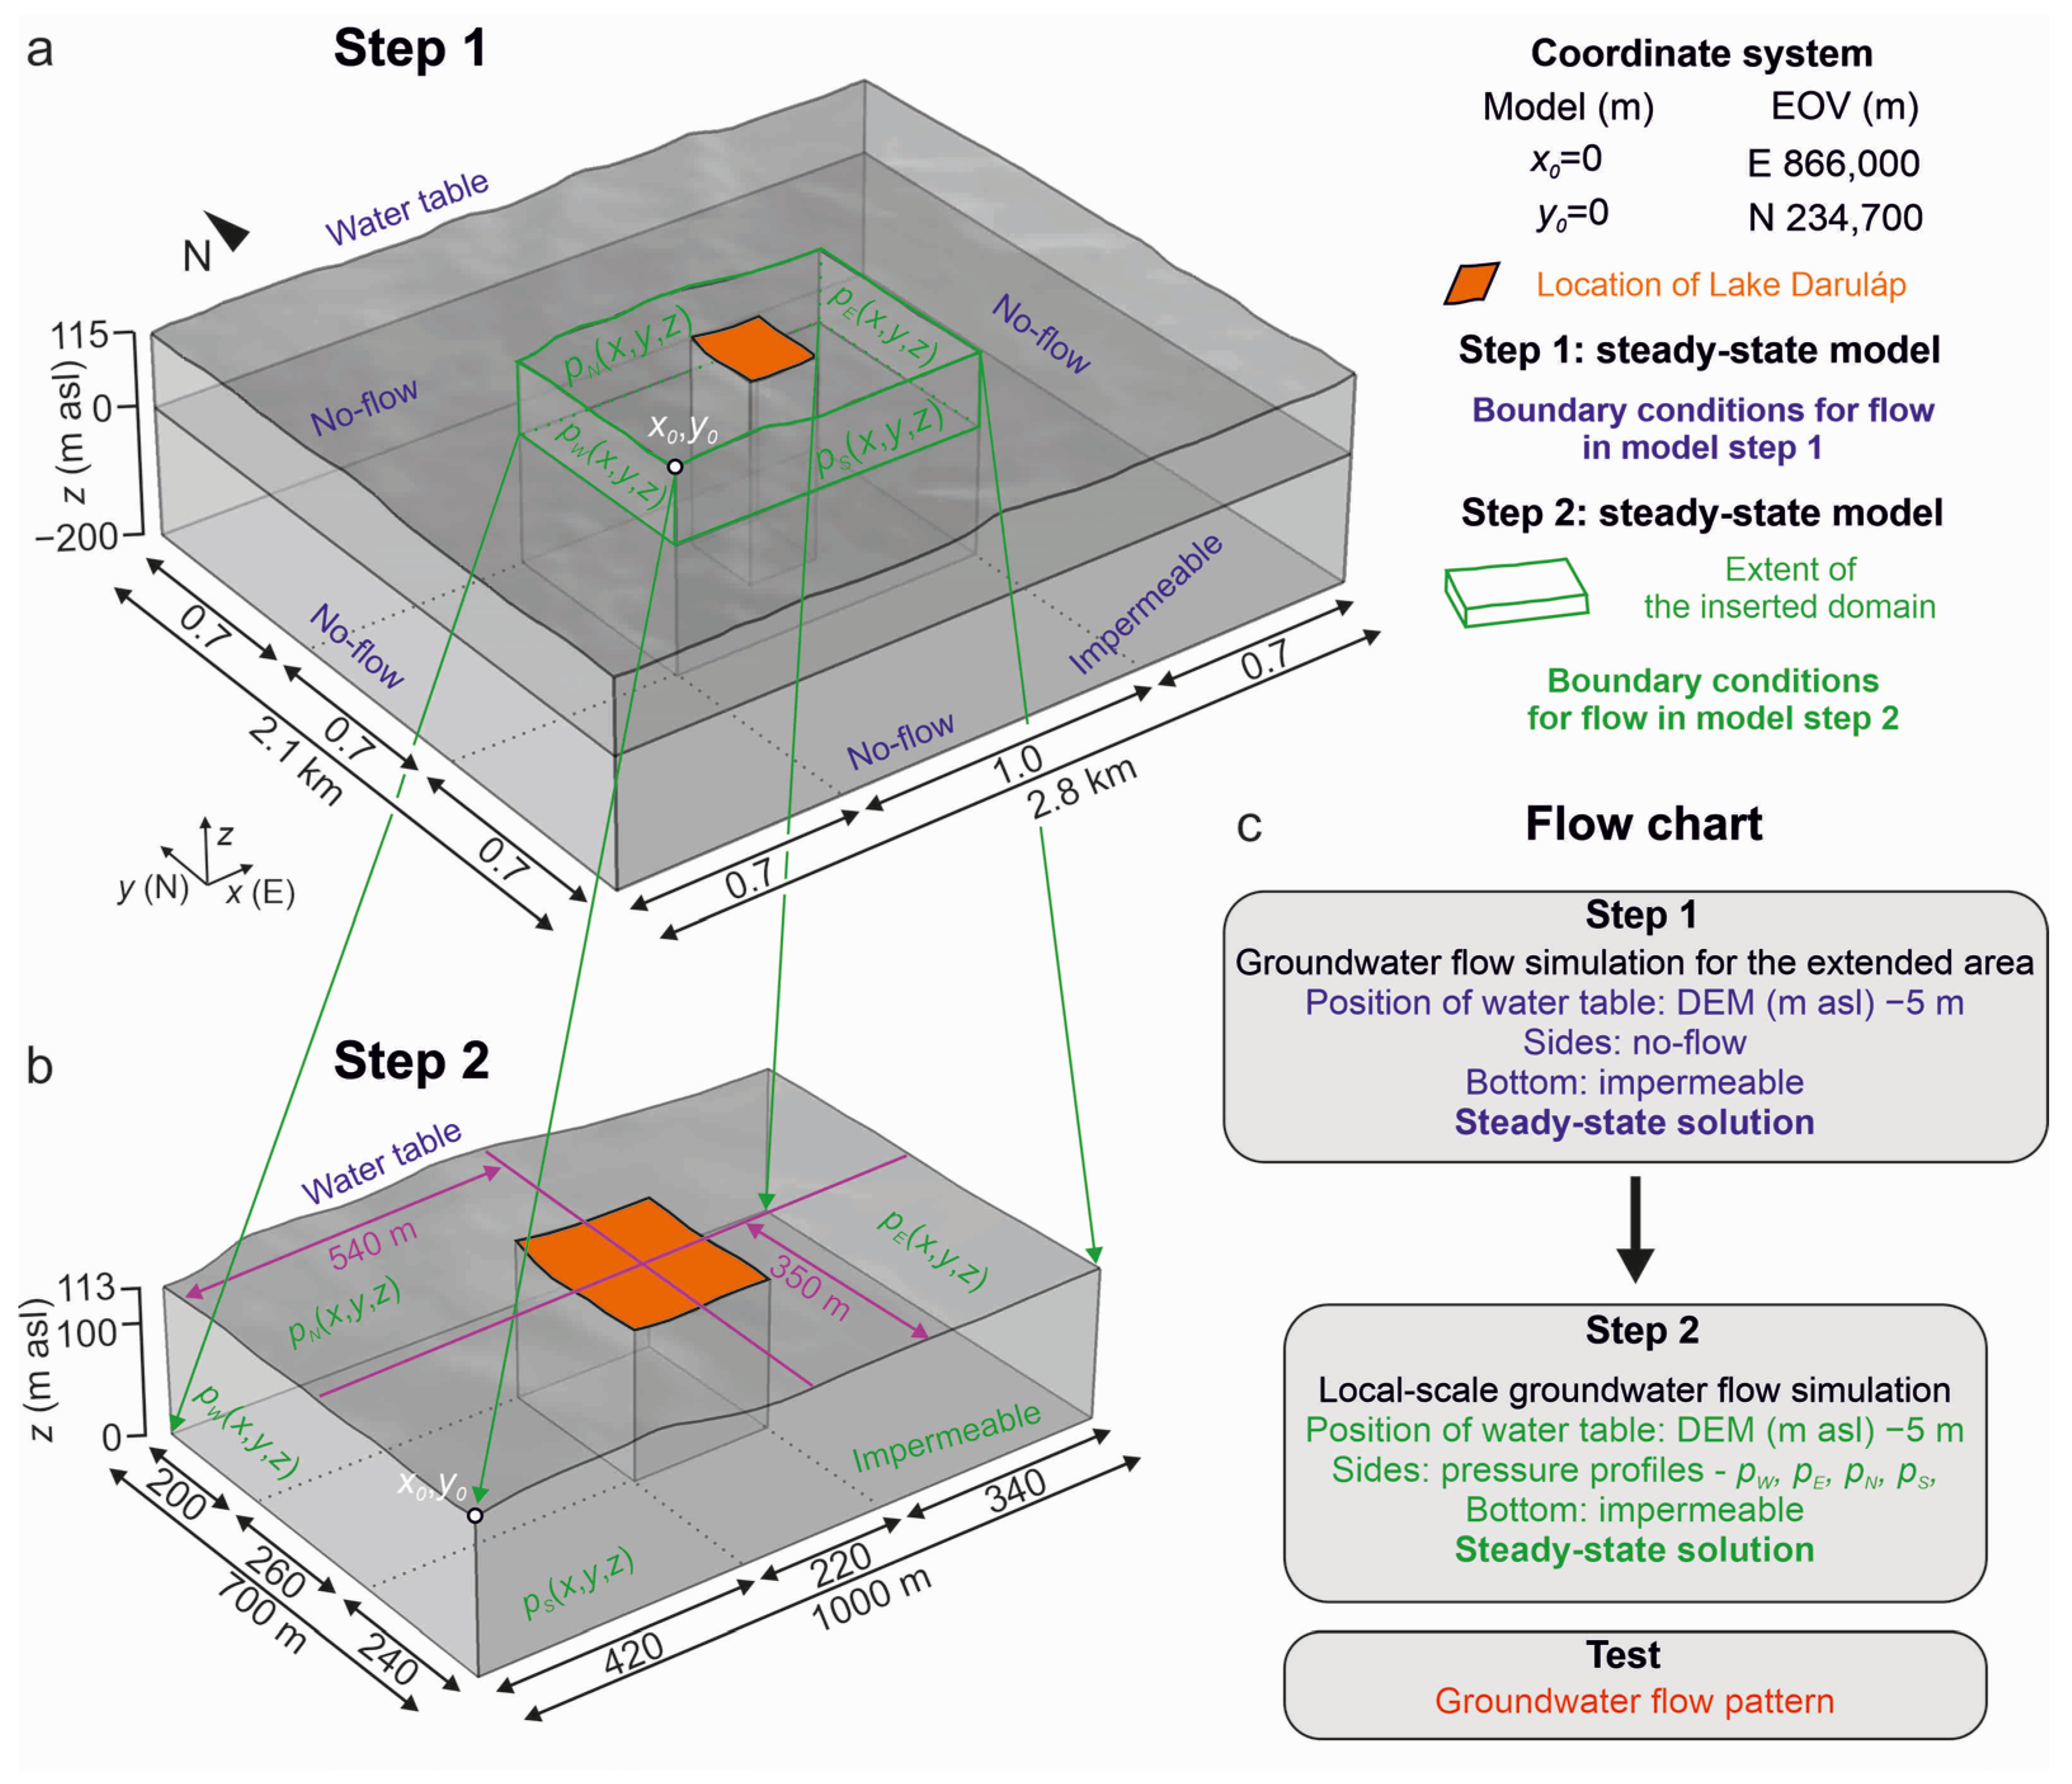
The three-dimensional groundwater simulations were carried out using COMSOL Multiphysics® [50] finite element numerical platform (version 5.3a) to investigate the near-surface hydrogeological conditions. In both areas, firstly (Step 1), the (undisturbed) steady-state groundwater flow controlled by water table configuration was determined for the extended areas around the lakes. In the second step (Step 2), steady-state (Lake Daruláp) and time-dependent (Lake Csohos environment) numerical calculations were carried out using the results from Step 1 in the smaller inset domains with enhanced near-surface vertical MESH resolution (Figure 3 and Figure 4). The differential equation system describing the hydrogeological problem is given in Appendix A.
At Lake Csohos, the reference datum points (x0 = 0 m, y0 = 0 m) in the coordinate system of the model are E 861,000 m and N 235,100 m in HD72 geodetic CRS (Figure 2a). In Step 1, the groundwater problem is described via steady-state mass conservation and Darcy’s equation in the extended model. The geometry of the extended model is shown in Figure 3a (thickness, 330 m; area, 6.16 km2), including the flow boundary conditions.
The water table configuration was determined using a nine-node averaging low-pass filter on a digital elevation model (DEM) with a 30 × 30 m resolution. The water table was a maximum of 5 m lower than the topography. The hydraulic conductivity, porosity, and anisotropy of the homogeneous model domain are Kxx = 4 × 10⁻⁶ m/s [47], φ = 0.2, ε = Kxx/Kzz = 30 [51], respectively.
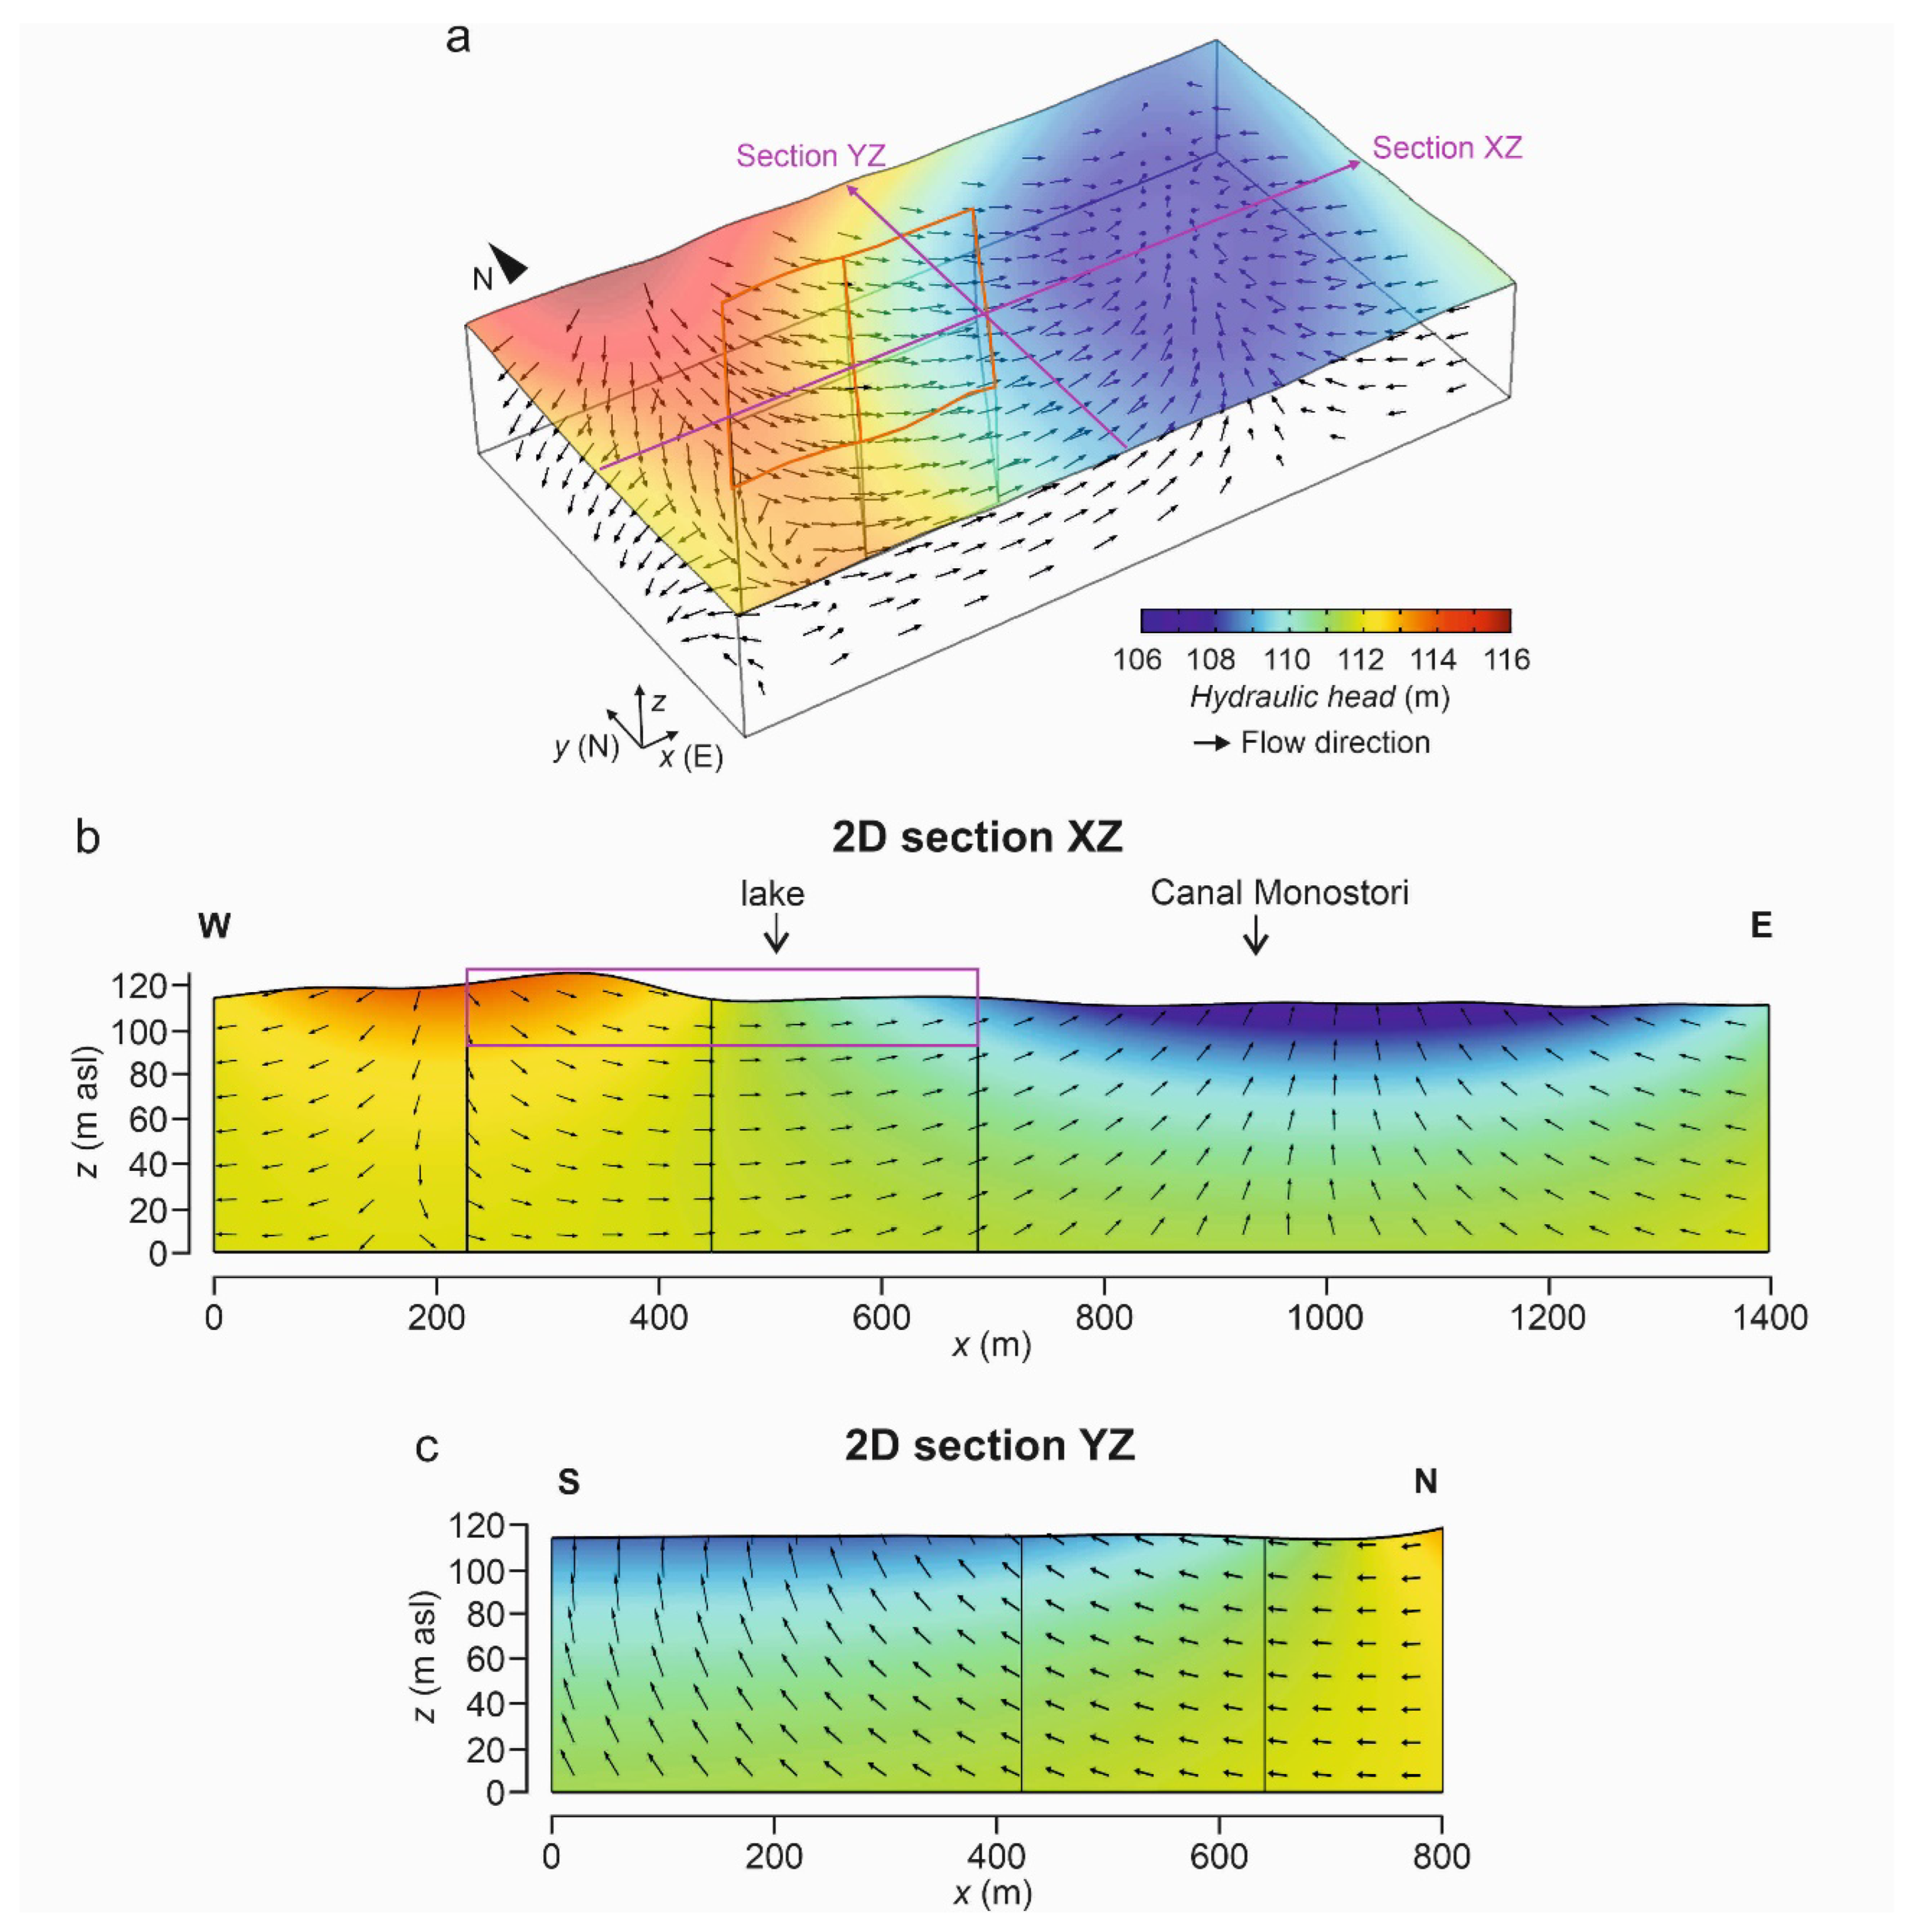
In Step 2 (Figure 3b), the initial condition for the pressure (pi(x,y,z)) and the lateral boundary conditions (pN(x,y,z), pS(x,y,z), pW(x,y,z), pE(x,y,z)) of the inset domain were generated via the steady-state solution (Step 1). The near-surface hydrogeological problem is described via mass conservation; Darcy’s equation, in which the elevation is less than 100 m asl (z < 100 m asl); and the time-dependent Richards’ equation [52], where the elevation is above 100 m asl (z > 100 m asl) (Appendix A). The saturated water volume fraction, the residual water volume fraction, the compressibility of fluid, and the effective compressibility of the matrix are Θs = 0.19, Θr = 0.01, χf = 4 × 10⁻¹⁰ 1/Pa, and χm = 10−4 1/Pa, respectively. The retention was defined using the van Genuchten model [53]. In Step 2, the effect of deforestation was simulated via additional infiltration (R = 10, 100, 1000 mm/yr) on the sand dune over a 5-year period. The possible real infiltration is close to 100 mm/yr. The location of the two-dimensional cross-sections is illustrated in Figure 3b,c. Figure 3d shows a flow chart of the two simulation steps with the initial and boundary conditions and with the tested infiltration rates (R). The groundwater flow system for the local-scale area was presented in 3D distributions and 2D cross-sections of the hydraulic head, while the effect of additional infiltration from the forested area on the location of Lake Csohos was investigated in a 2D cross-section of effective saturation.
The extended model (Step 1) was discretised via tetrahedral elements, where the maximum element was 20 m within the inset domains and 40 m within the surrounding domains. The mesh contained 1,220,146 finite elements (FE#). Within the elements, the solution was approximated via a quadratic function for Darcy’s equation. The steady-state calculation required 10 min CPU time and 5 GB memory on an Intel 3 GHz workstation with 8 cores. In the case of Step 2, the upper boundary of the local-scale model was discretised via free triangular and non-uniform elements, and vertically extended to 20 layers within the two main domains, where z > 100 m asl and z = 0–100 m asl; FE# = 616,360. The solution was approximated via quadratic functions for Darcy’s and Richards’ equations. The time-dependent calculation required 72 h of CPU time and 15 GB memory on an Intel 3 GHz workstation with 8 cores.
At Lake Daruláp, the reference datum points (x0 = 0 m, y0 = 0 m) in the coordinate system of the model are E 866,000 m and N 236,700 m in HD72 geodetic CRS (Figure 2b). During the first step (Step 1) of the simulation, the mass conservation and Darcy’s equation were used to solve the steady-state groundwater flow problem in the extended model. Figure 4a illustrates the geometry of the extended model (thickness, 320 m; area, 5.88 km2), with the boundary condition for groundwater flow.
The configuration and the position of the water table were determined using a similar method to the Lake Csohos environment. In the entire (homogeneous) model domain, the hydraulic conductivity is Kxx = 4 × 10⁻⁶ m/s [47], the porosity is φ = 0.2, and the anisotropy is ε = 30 [51].
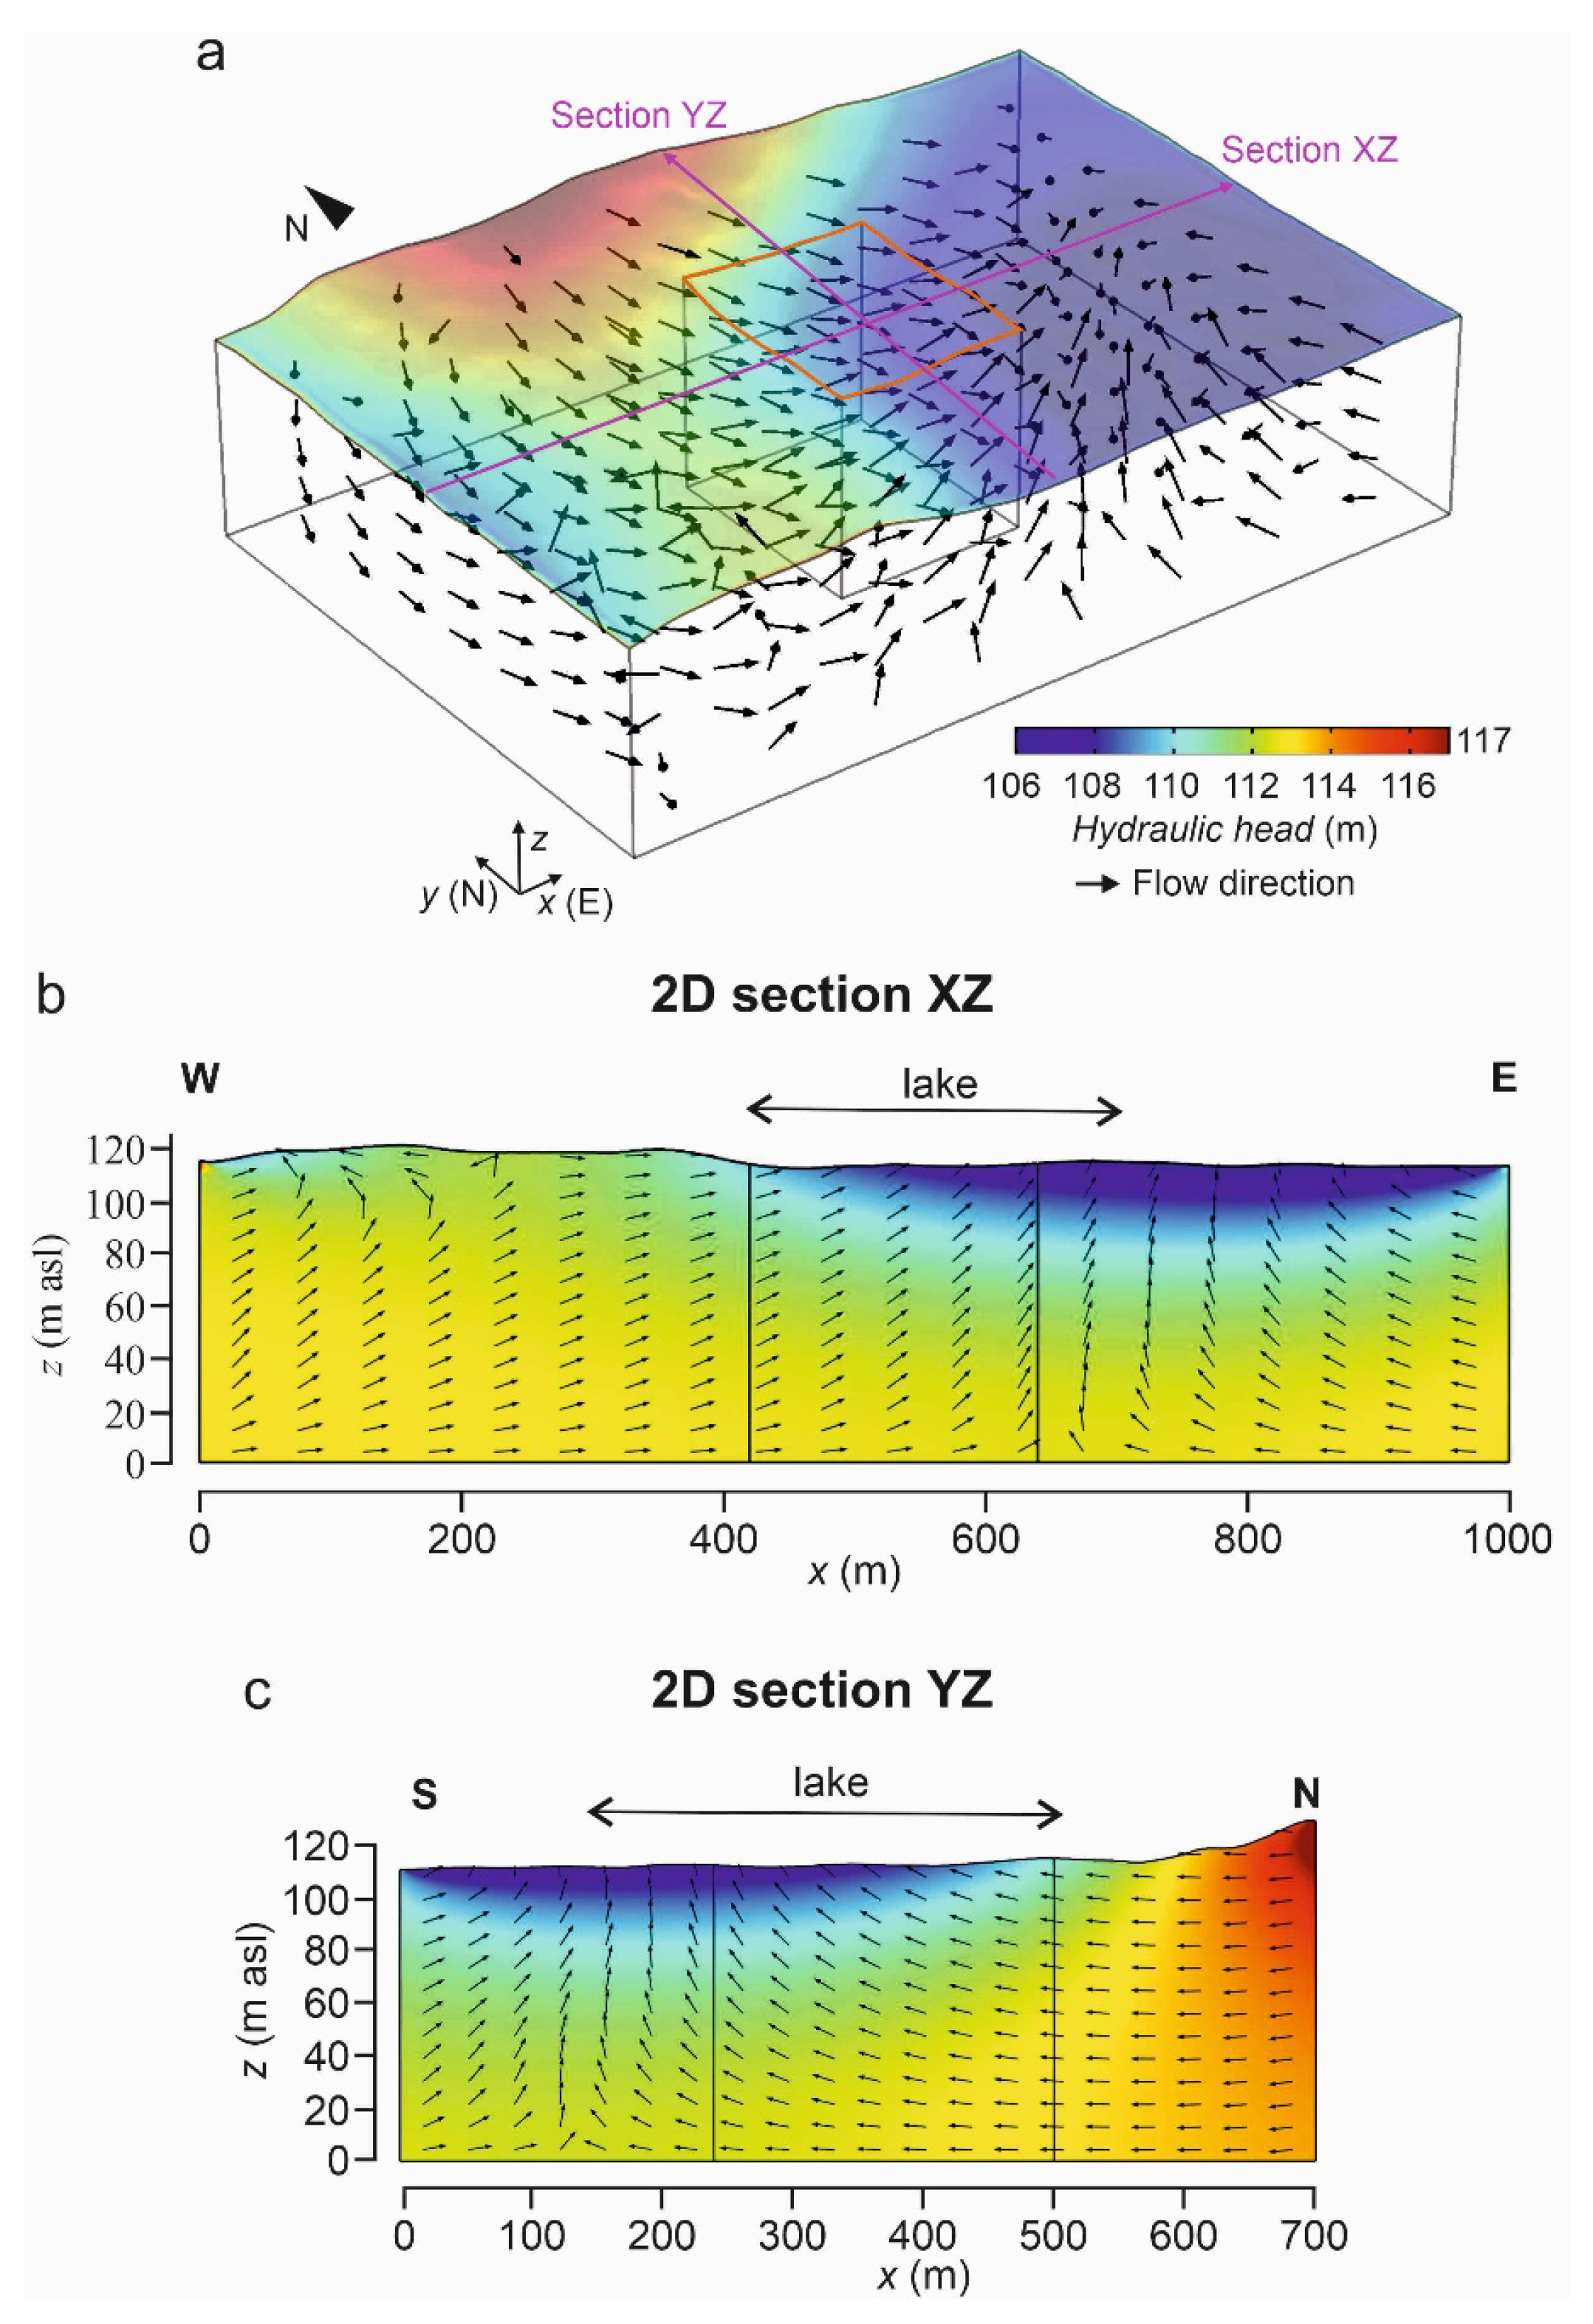
During a continuous simulation (Step 2), the flow boundary conditions in the inset model domain (Figure 4b) were imported from the steady-state solution of the extended simulation (Figure 4a). The procedure is illustrated in Figure 4c. In Step 2, a steady-state groundwater flow problem was solved using another mesh with a higher resolution. The locations of the two-dimensional cross-sections are illustrated in Figure 4b. The local-scale groundwater flow system was presented in 3D distributions and 2D cross-sections of the hydraulic head.
The methodology of the discretisation was similar to a previous scenario, in which FE# was 874,394 in the extended model domain (Step 1) and 168,960 in the local model area (Step 2). The steady-state calculations took 5 min (Step 1) and 10 min (Step 2) CPU times and 5 GB memory on an Intel 3 GHz workstation with 8 cores.

3. Results

3.1. Regional-Scale Groundwater–Wetland Characterisation

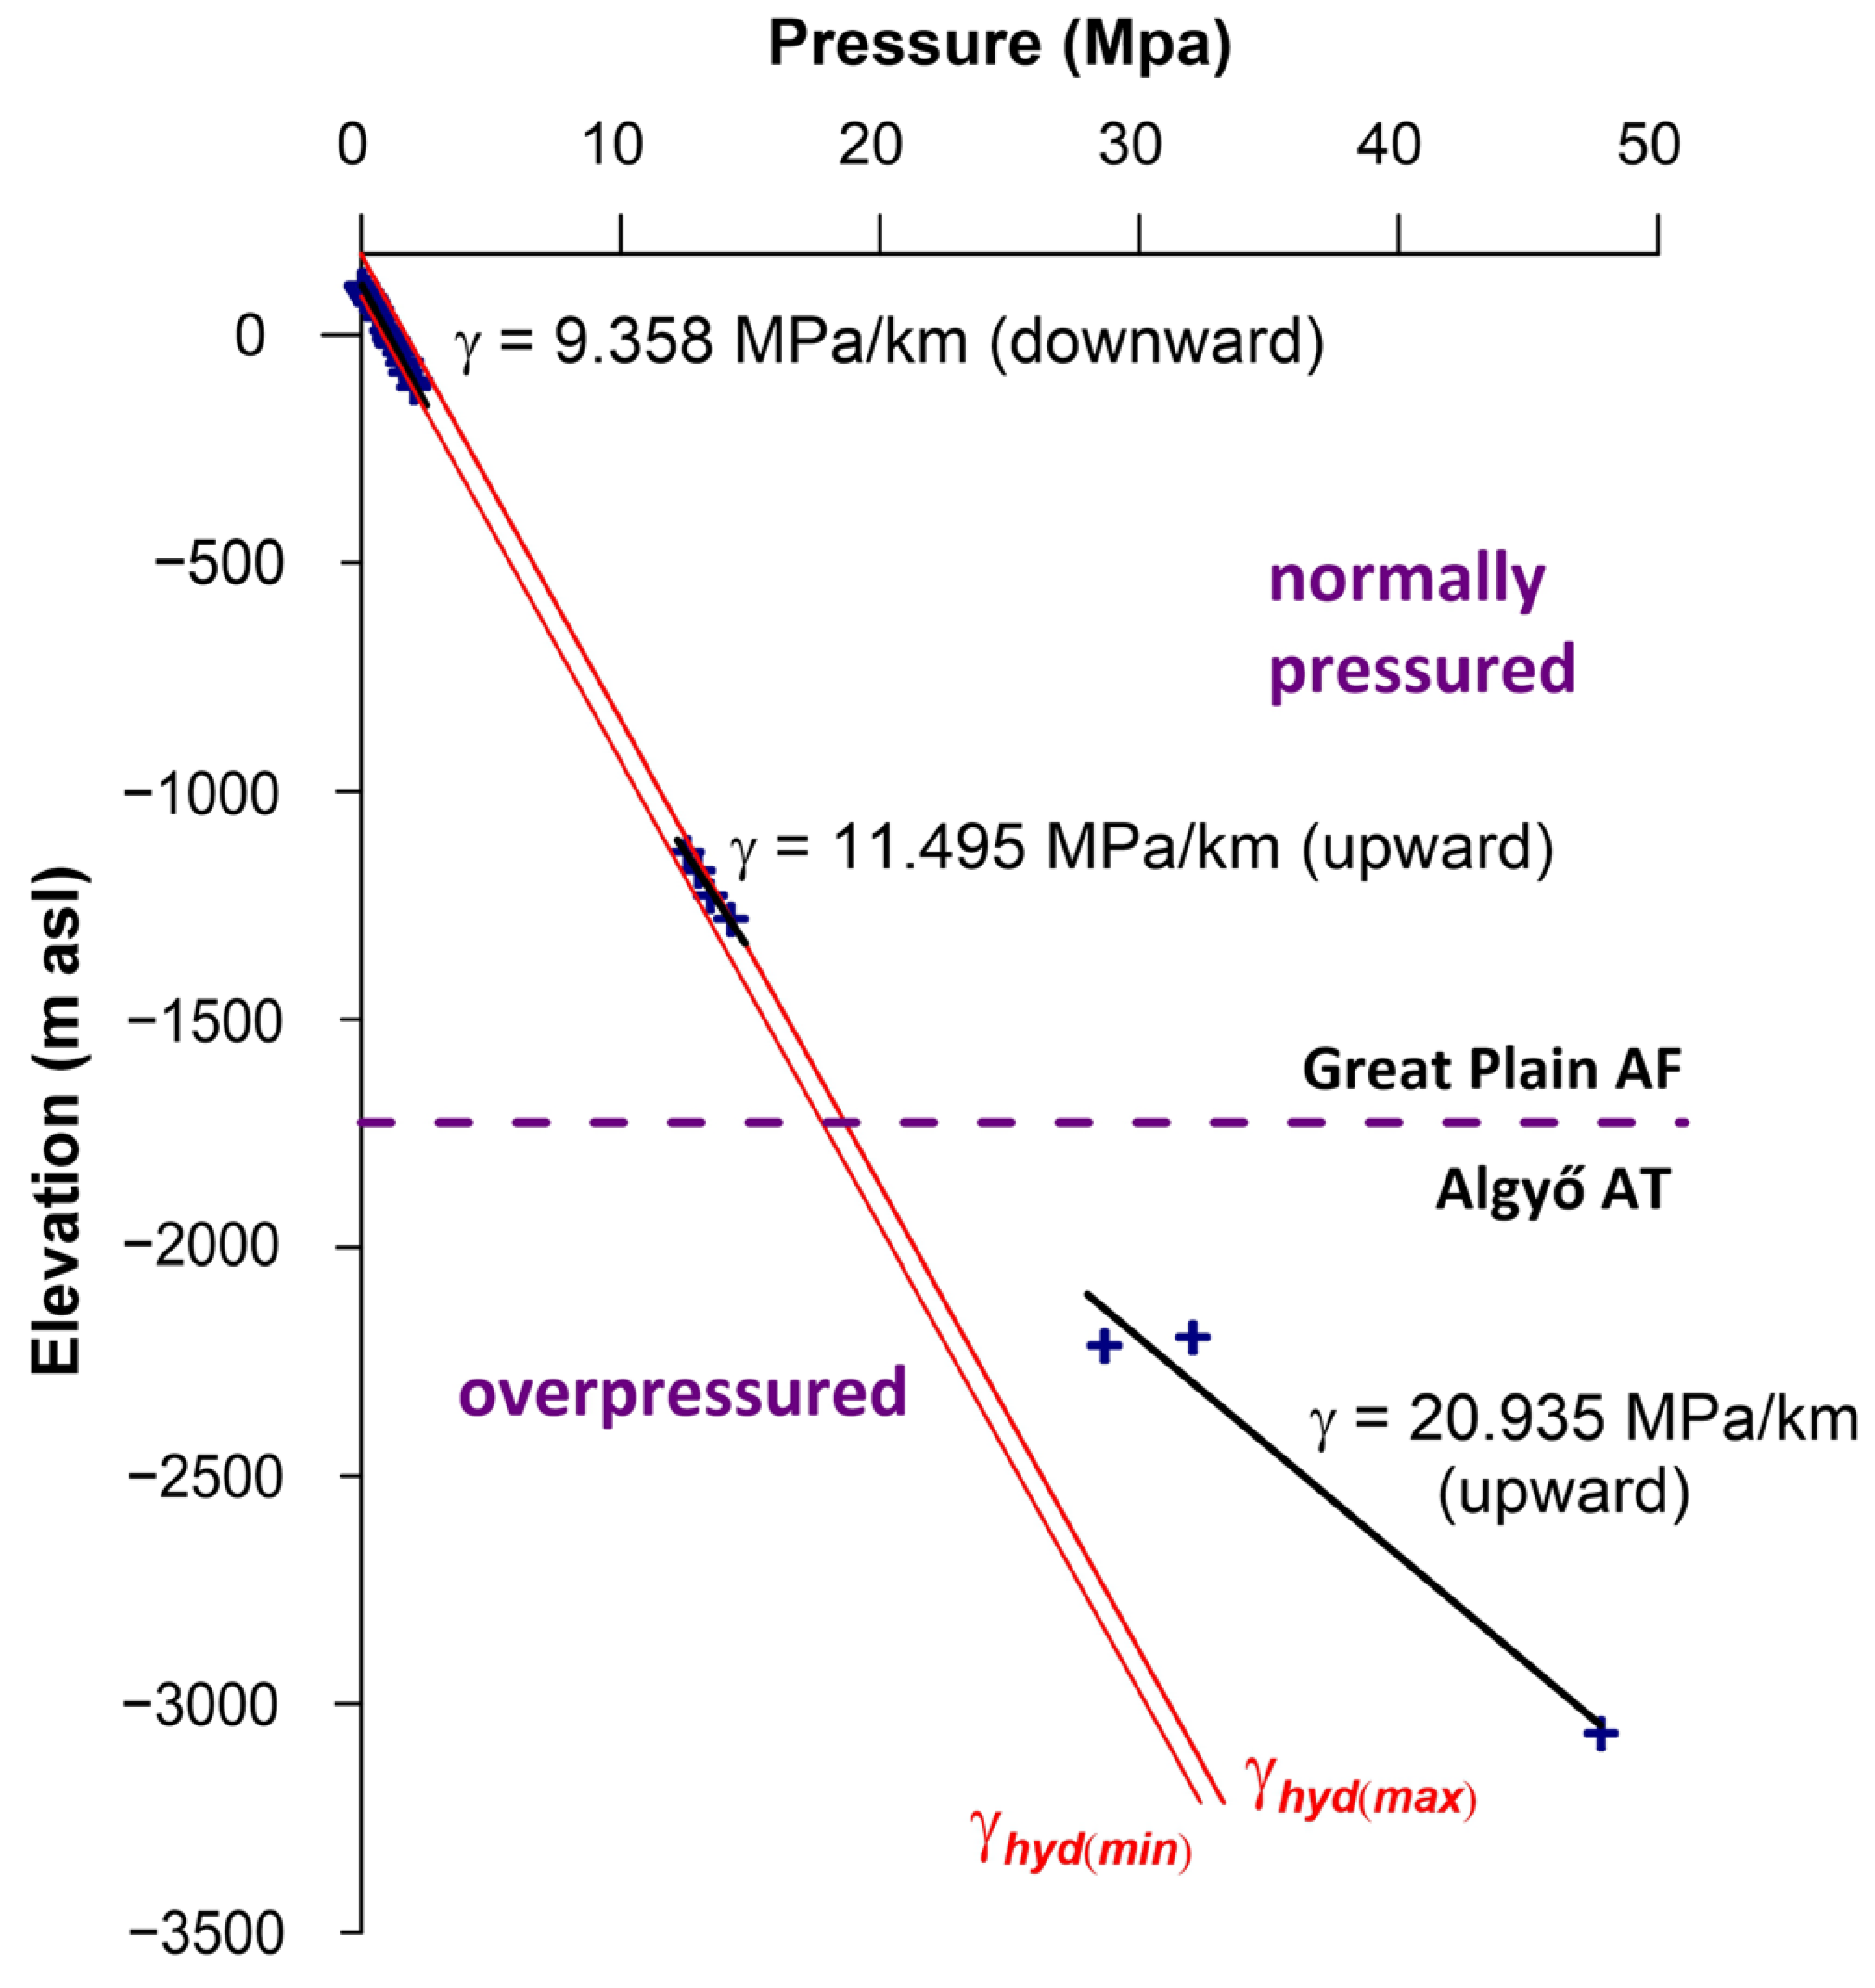
Based on the p(z) profile constructed around the local study areas (Figure 1b), the vertical pressure gradient (9.358 MPa/km) is smaller but close to hydrostatic (9.81 MPa/km) in the upper 200–300 m depth interval, denoting topography-driven downward-moving groundwater with a small horizontal flow component at this depth (Figure 5). The lower extent of the close-to-hydrostatic conditions cannot be observed due to the lack of continuous data availability on the profile. The flow direction changes at ~(−1000) m asl, showing upward-moving groundwater with an 11.495 MPa/km gradient (Figure 5). The values still show normal pressure conditions (Figure 5), located in the Great Plain Aquifer based on Figure 6. Below a ~(−2000) m asl elevation, higher-grade overpressure with upward-moving groundwater (γ = 20.935 MPa/km) can be observed. Based on the geological composition, this pressure increase could be connected to the Algyő Aquitard (Figure 6). The aquitard has a significant sealing effect on the overpressure zone, causing its dissipation [11,38].
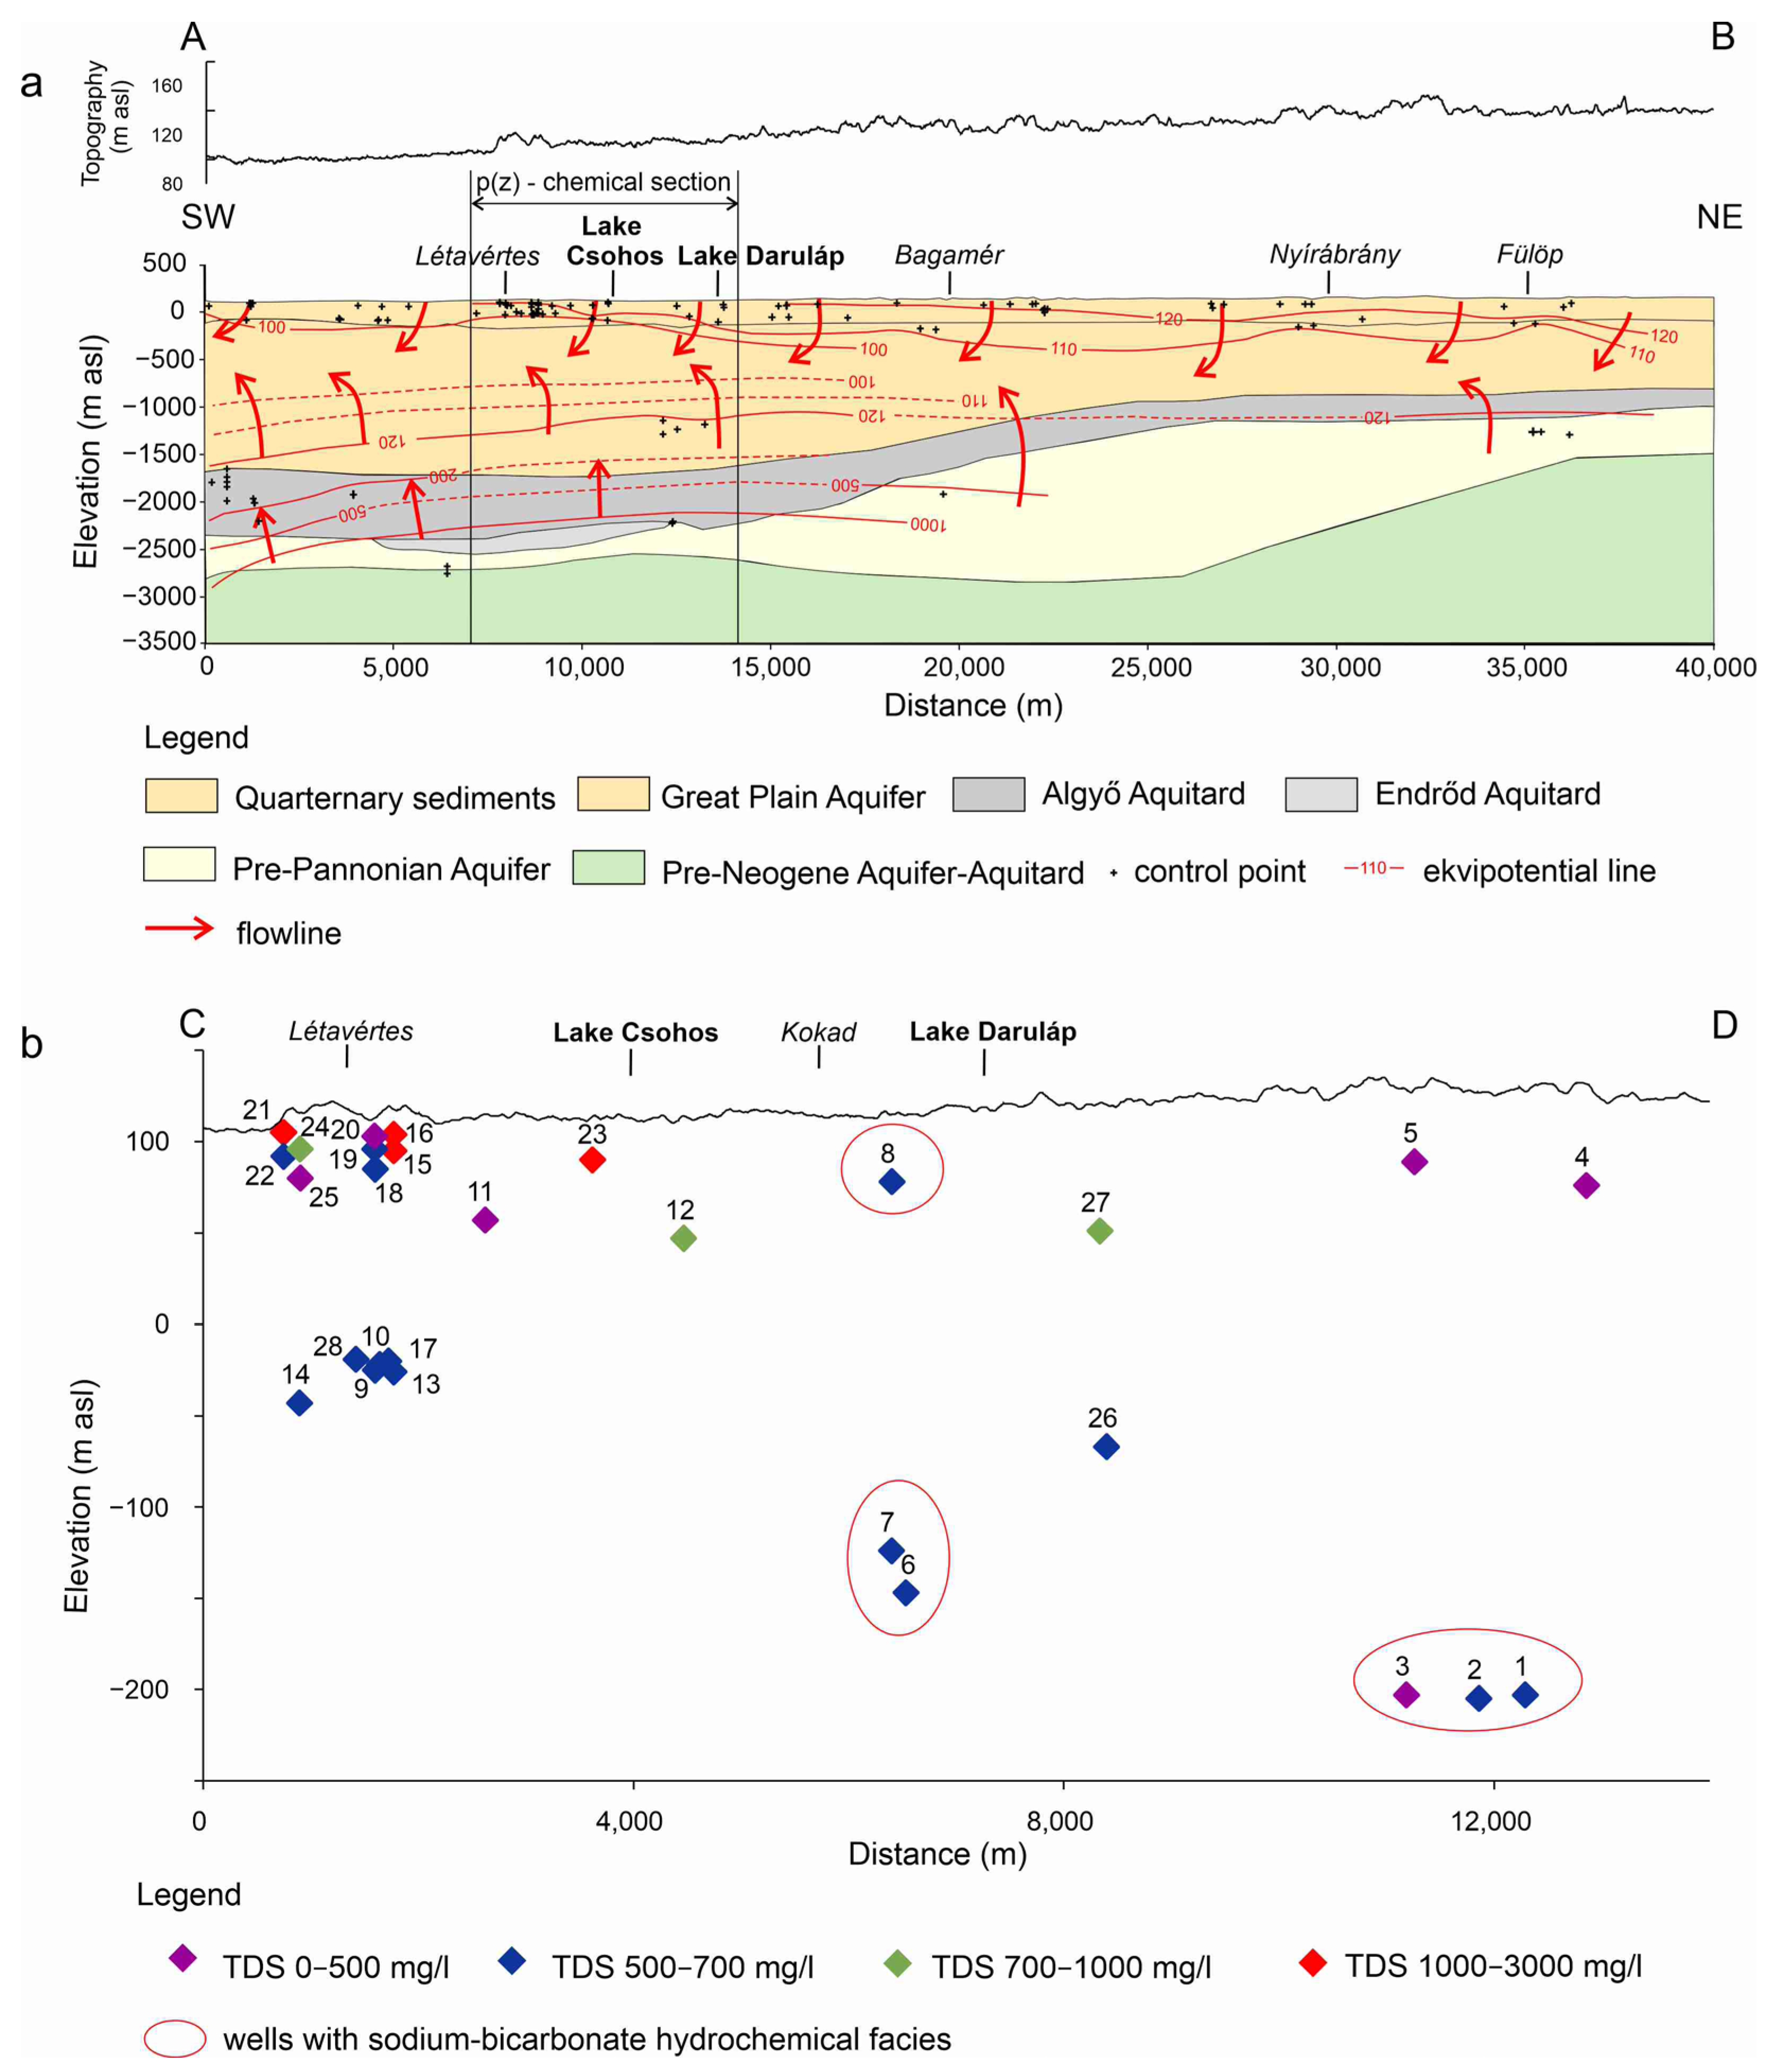
The upper, topography-driven groundwater flow and the overpressured zone underneath shown on the hydraulic cross-section coincide with the results of the p(z) profile. From about 15,000 m to the end of the transect, the cross-section typically shows recharge conditions, which changes to through-flow with increasing depth in the upper 500–600 m in the area (Figure 6a). This downward and slightly horizontal movement of the groundwater is induced via the topography, i.e., the elevated hills of the Nyírség to the north. The two local study areas are located on the SW margin of the gradually declining topography, where recharge still occurs at the regional scale, but the equipotential lines intersecting the ground surface may indicate the occurrence of flow-through (Figure 6a). This upper, topography-driven regime extends to a depth of approximately −500 m above sea level. Underneath, upwelling flow is indicated across the entire area, originating from the Pre-Pannonian Aquifer and representing the overpressured regime that is present in the entire Great Hungarian Plain (Figure 6a). Where the converging upward and downward directed flows of the two different flow regimes meet, horizontal flow occurs towards the southwest.
During the regional-scale hydrochemical assessment of the area, 11 shallow groundwater wells (6–33 m deep) and 17 deeper wells (42–330 m deep) were involved (Figure 1b and Table S2 of the Supplementary Materials). Unfortunately, data from the immediate vicinity of the two wetlands (Lake Csohos and Lake Daruláp) were not available. The data are represented via the section between 7000 and 14,000 m on the hydraulic cross-section (Figure 1b and Figure 6a), as shown in Figure 6b.
The TDS content of the wells varies between 240 and 2373 mg/L (Figure 6b and Table S2 of the Supplementary Materials). The majority of the wells have TDS contents <500 and 500–700 mg/L. Anomalously high (>1000 mg/L) TDS values occur at shallow depths (<73 m), mainly to the south of the wetland areas, and are associated with settlements (Létavértes on Figure 1b and Figure 6b). These relatively high TDS values often occur next to locations with lower (<700 mg/L) TDS values (e.g., 20 and 16, as shown in Figure 6b), indicating that local contamination may influence the chemistry at these locations.
For ammonium, nitrate, and nitrite, several wells exceeded the maximum allowable concentrations (MAC) set by the Hungarian regulations (Decree 6/2009 (IV.14.), indicating potential groundwater contamination in the area (values exceeding MACs are highlighted in grey in Table S2 of the Supplementary Materials). Ammonium ions may occur naturally from the decomposition of organic matter from dead organisms. However, concentrations above the limit value may also indicate possible anthropogenic sources of pollution, such as the use of organic fertilisers, inadequate sewage disposal, a lack of sewerage infrastructure, and improperly constructed manure dumps and landfills [54,55].
Based on the hydrochemical data, groundwater in the area is mostly dominated by Ca,Mg-HCO3 facies. A total of 6 (1, 2, 3, 6, 7, and 8) of the 28 wells showed a Na-HCO3 hydrochemical character (Figure 6b). These wells are associated with the settlements of Kokad and Bagamér (Figure 1) and screened at a z < −100 m asl depth, except for well 8, which is a shallow observation well screened at 73 m asl. The Na dominance of these wells is not in accordance with the elevated (>700 mg/L) TDS value, except in the case of well 8, where, in addition to the elevated Na concentrations, the Cl content is also high (132 mg/L). The increased Na concentrations may indicate anthropogenic contamination at well 8, and likely reflect natural conditions in the case of the deeper wells.

3.2. Local-Scale Investigations at Lake Csohos and Lake Daruláp

3.2.1. Wetland–Groundwater Interaction

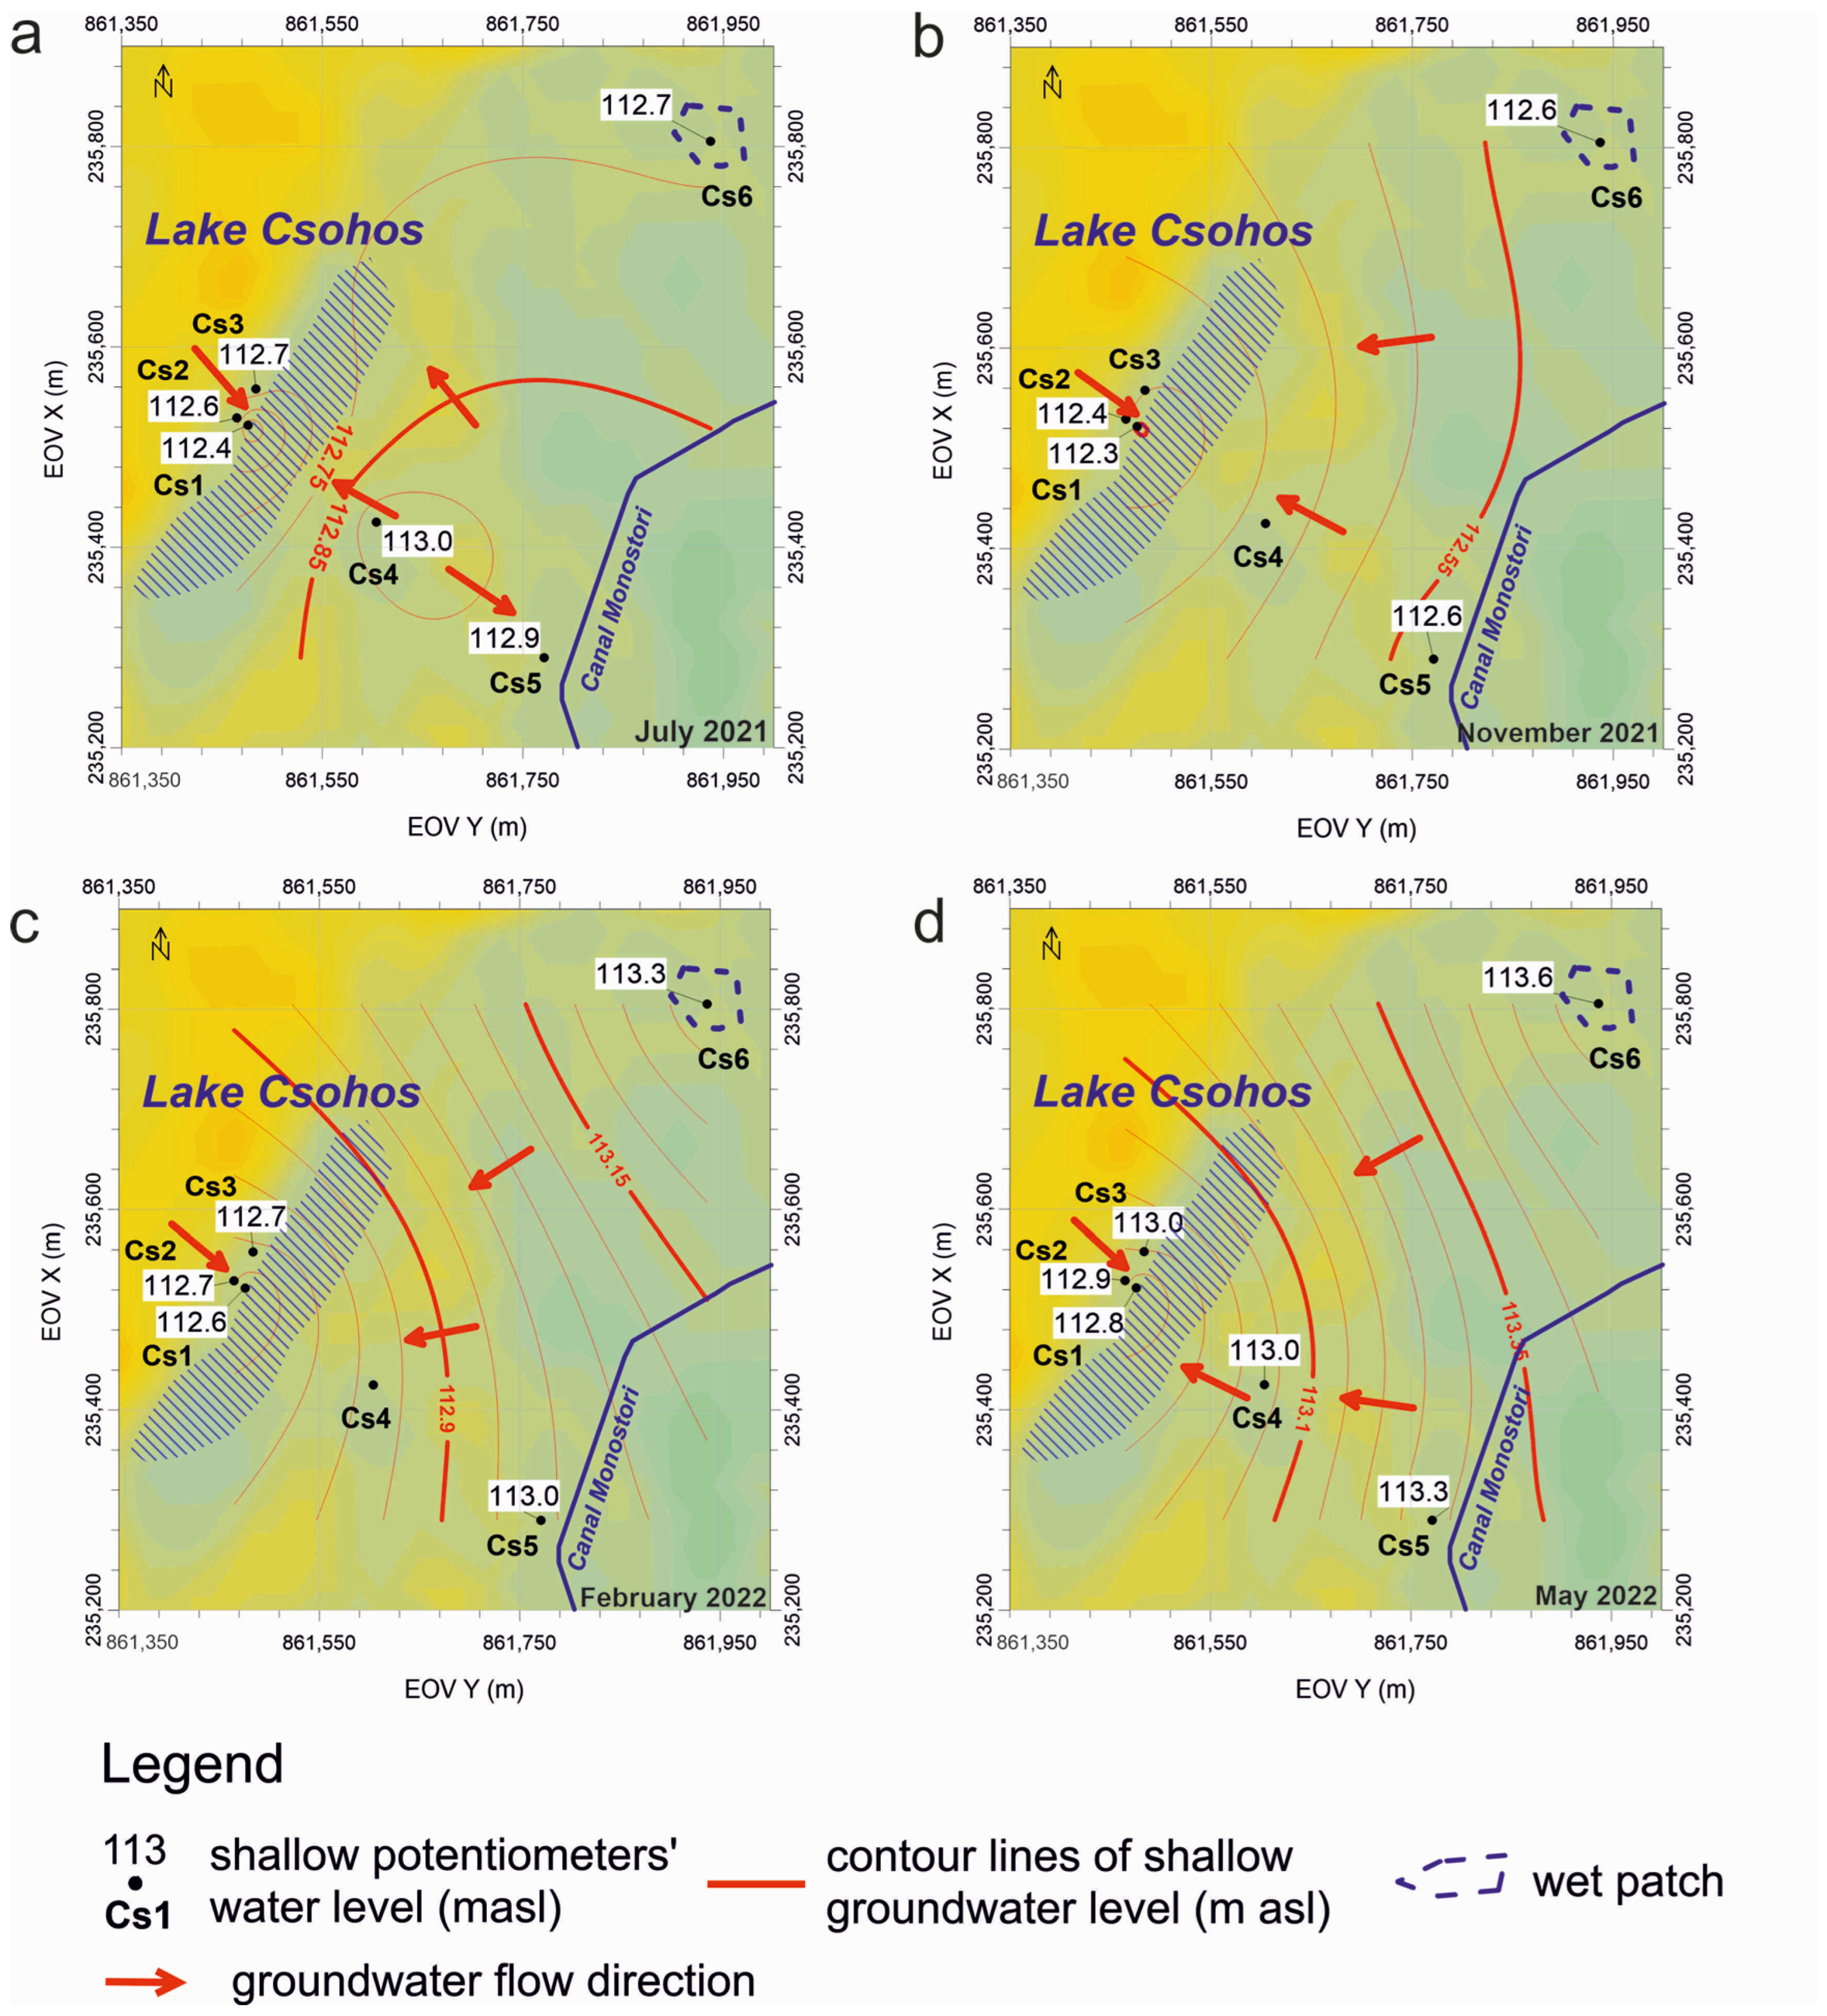
Groundwater levels at Lake Csohos (Figure 2a) were observed in six potentiometers during a 1-year period. Potentiometer Cs1 was drilled in the dry lakebed, and Cs2 and Cs3 were drilled at the lake shore in a slightly (~2 m) elevated position. Cs5 was located on a small dune between the lake area and the canal, and Cs6 was installed in the wet patch. The details of the potentiometers can be found in Table S3 of the Supplementary Materials. Using the measured groundwater level data, seasonal water table maps (Figure 7) were compiled to see the groundwater–wetland interaction, spatially and temporally.
The measured groundwater levels in the Lake Csohos study area vary between 112.3 and 113.6 m asl, showing the deepest water tables at Cs1 (112.3–112.8 m asl) in every season during the observation period. Cs4, Cs5, and Cs6, located at lower surface elevations (115.61, 114.99, and 113.43 m asl) than Cs2 and Cs3 (115.81 and 115.79 m asl), showed the highest water levels. Cs6 had the highest water level values, except in July of 2021. In this month, the water table was higher in Cs4 and Cs5, where a water table mound occurred and influenced the shallow groundwater flow conditions. This mound did not occur again during the observation period, likely due to the extremely dry conditions in 2022. The spatial distribution of the water table seems to follow the topography the most on the western side of the lake area.
The temporal fluctuation in the water levels follows the seasonal climatic conditions (precipitation) of the area, i.e., the water levels are the deepest in the autumn, followed by an increase in the winter, reaching the highest values in the spring (Figure 7). In summer, water levels decline again as a result of decreasing precipitation and increasing evapotranspiration.
The lake area is located in a discharge position regarding the shallow groundwater conditions (in the upper 3.5 m) and remains so in every season. The main recharge point is assumed to be the sand dune located NW of the lake; however, the lake also gains inflow from E to NE (from the direction of Cs5 and Cs6).
During the whole observation period, Canal Monostori was dry.
At Lake Daruláp area, water levels were measured in four boreholes; however, only three potentiometers were installed (D1–2–3) and used for monitoring. D1 is located at the foot of the sand dune NW of Lake Daruláp, D2 was drilled at the lakeshore, while D3 was drilled at the eastern side of the lake, close to the crop field (Figure 2b). The lake level was measured at one location (Lake) (Figure 2b). In borehole D4, the water level was measured only in July 2021. Data can be found in Table S3 of the Supplementary Materials.
The water level data show seasonal fluctuations, similar to Lake Csohos. The highest values were detected in the spring, and the lowest water levels were measured in the autumn. Spatially, the water levels showed a NW-SE-directed decline from D1 towards D3 in almost every season (Figure 8). In July 2021, a water table mound formed at D2 (115.08 m asl), inducing a sublocal flow towards D1 (114.95 m asl) (Figure 8a). In the same season, D4 had a higher water level than D3, resulting in shallow groundwater flowing from the direction of the crop field to D3. In late spring (May 2022) and summer, the lake itself was located in a flow-through position, gaining water from the NW and losing water to the SE. The NW-SE-directed groundwater flow continued to exist below the lakebed when the lakebed was dry in the autumn (Figure 8b). In the winter, the water gradually returned to the lake; however, the water level increase was higher in D3 than in the lake. As a result of the local water table mound at D3, the lake turned into a discharge area and remained as such until early spring (Table S3 of the Supplementary Materials) (Figure 8c). During the observation in Creek Kálló, no water flow existed.
In both areas, the results show the complex relationship between groundwater and lakes.
The sampling and assessment of the hydrochemical conditions were carried out at both locations. At Lake Csohos, five of the six potentiometers were sampled (Cs1–2–4–5–6). The TDS content varied between 202 and 2536 mg/L. The highest TDS value was found at Cs1 drilled into the bed of the lake (2536 mg/L), while the lowest TDS content was found in well Cs5 (202 mg/L) (Table S5 of the Supplementary Materials). The other samples had TDS values between 328 and 398 mg/L. The hydrochemical facies of the samples were Ca-HCO3, except for samples Cs1 and Cs2, which indicated a Ca-SO4 character (Figure 9) at the lake shore and lakebed. In Cs1, Cs2, and Cs6, the pH was below 7. Cs1, drilled in the lakebed, showed slightly elevated specific electrical conductivity and ammonia, and slightly decreased pH, while its sulphate and nitrite concentrations exceeded the MACs. Phosphate and ammonium concentrations at Cs5 and Cs6 also exceeded the MACs.
At Lake Daruláp, the highest TDS value was measured at D3, while the lowest TDS value was found in the lake water sample (Table S5 of the Supplementary Materials). The hydrochemical facies of the water for all sampled locations was Ca-HCO3. The ammonium concentration at D1 was slightly above the MAC. In the crop field, at D5, nitrate and nitrite values were below their respective MACs. In the case of the Lake sample, several parameters exceeded the respective MACs and/or significantly differed from the other samples. It should be noted, however, that this sample was a surface water sample; therefore, its chemical composition is not comparable to that of the groundwater samples. The chemical oxygen demand (COD) (both the dichromate (CODk) and the permanganate (CODp)) exceeded the MAC and was classified as “highly contaminated”. The nitrate, nitrite, and total phosphorus content of the lake water also exceeded the limits for an “excellent” classification but still fell into the “good” and “tolerable” categories.

3.2.2. Groundwater Flow Simulation around the Wetlands and the Effect of Deforestation

Figure 10 shows the results in the inserted model domain of the local-scale steady-state numerical simulation (Step 1) at the Lake Csohos area. The groundwater flow directions and the hydraulic head distribution can be seen in a three-dimensional (3D) block section (Figure 2a, Figure 3b and Figure 10a) and along two two-dimensional (2D) cross-sections (Figure 2a and Figure 10b,c).
The calculated, undisturbed flow pattern on the 2D sections reflects the regional N-S directed groundwater flow in the area (Figure 10a,c), which is consistent with groundwater flow conditions revealed from the regional-scale characterisation of the area. The regional, close-to-N-S directed flow is accentuated in the wider area of the higher elevated sand dune, especially on the northern side of the block section. In the other parts of the area, the NW-SE-directed flow originating from the sand dune is more significant (Figure 10b). The model revealed that the sand dune adjacent to Lake Csohos acts as a local recharge area; however, the transported water discharges further to the east of Lake Csohos (Figure 10a). From the E direction, from outside the study area, another groundwater flow arrives and discharges in the same area. This discharge area covers a ~400 m wide zone between 850 and 1200 m along the section and between coordinates EOV Y (m) 861,950 and 862,300, but it shrinks on the northern side of the block. This wide zone coincides with the approximate location of Canal Monostori and its eastern foreground, where the topography is around 110 m asl (Figure 2a). This implies that the area of Lake Csohos behaves as a flow-through area, obtaining groundwater supply from NW.
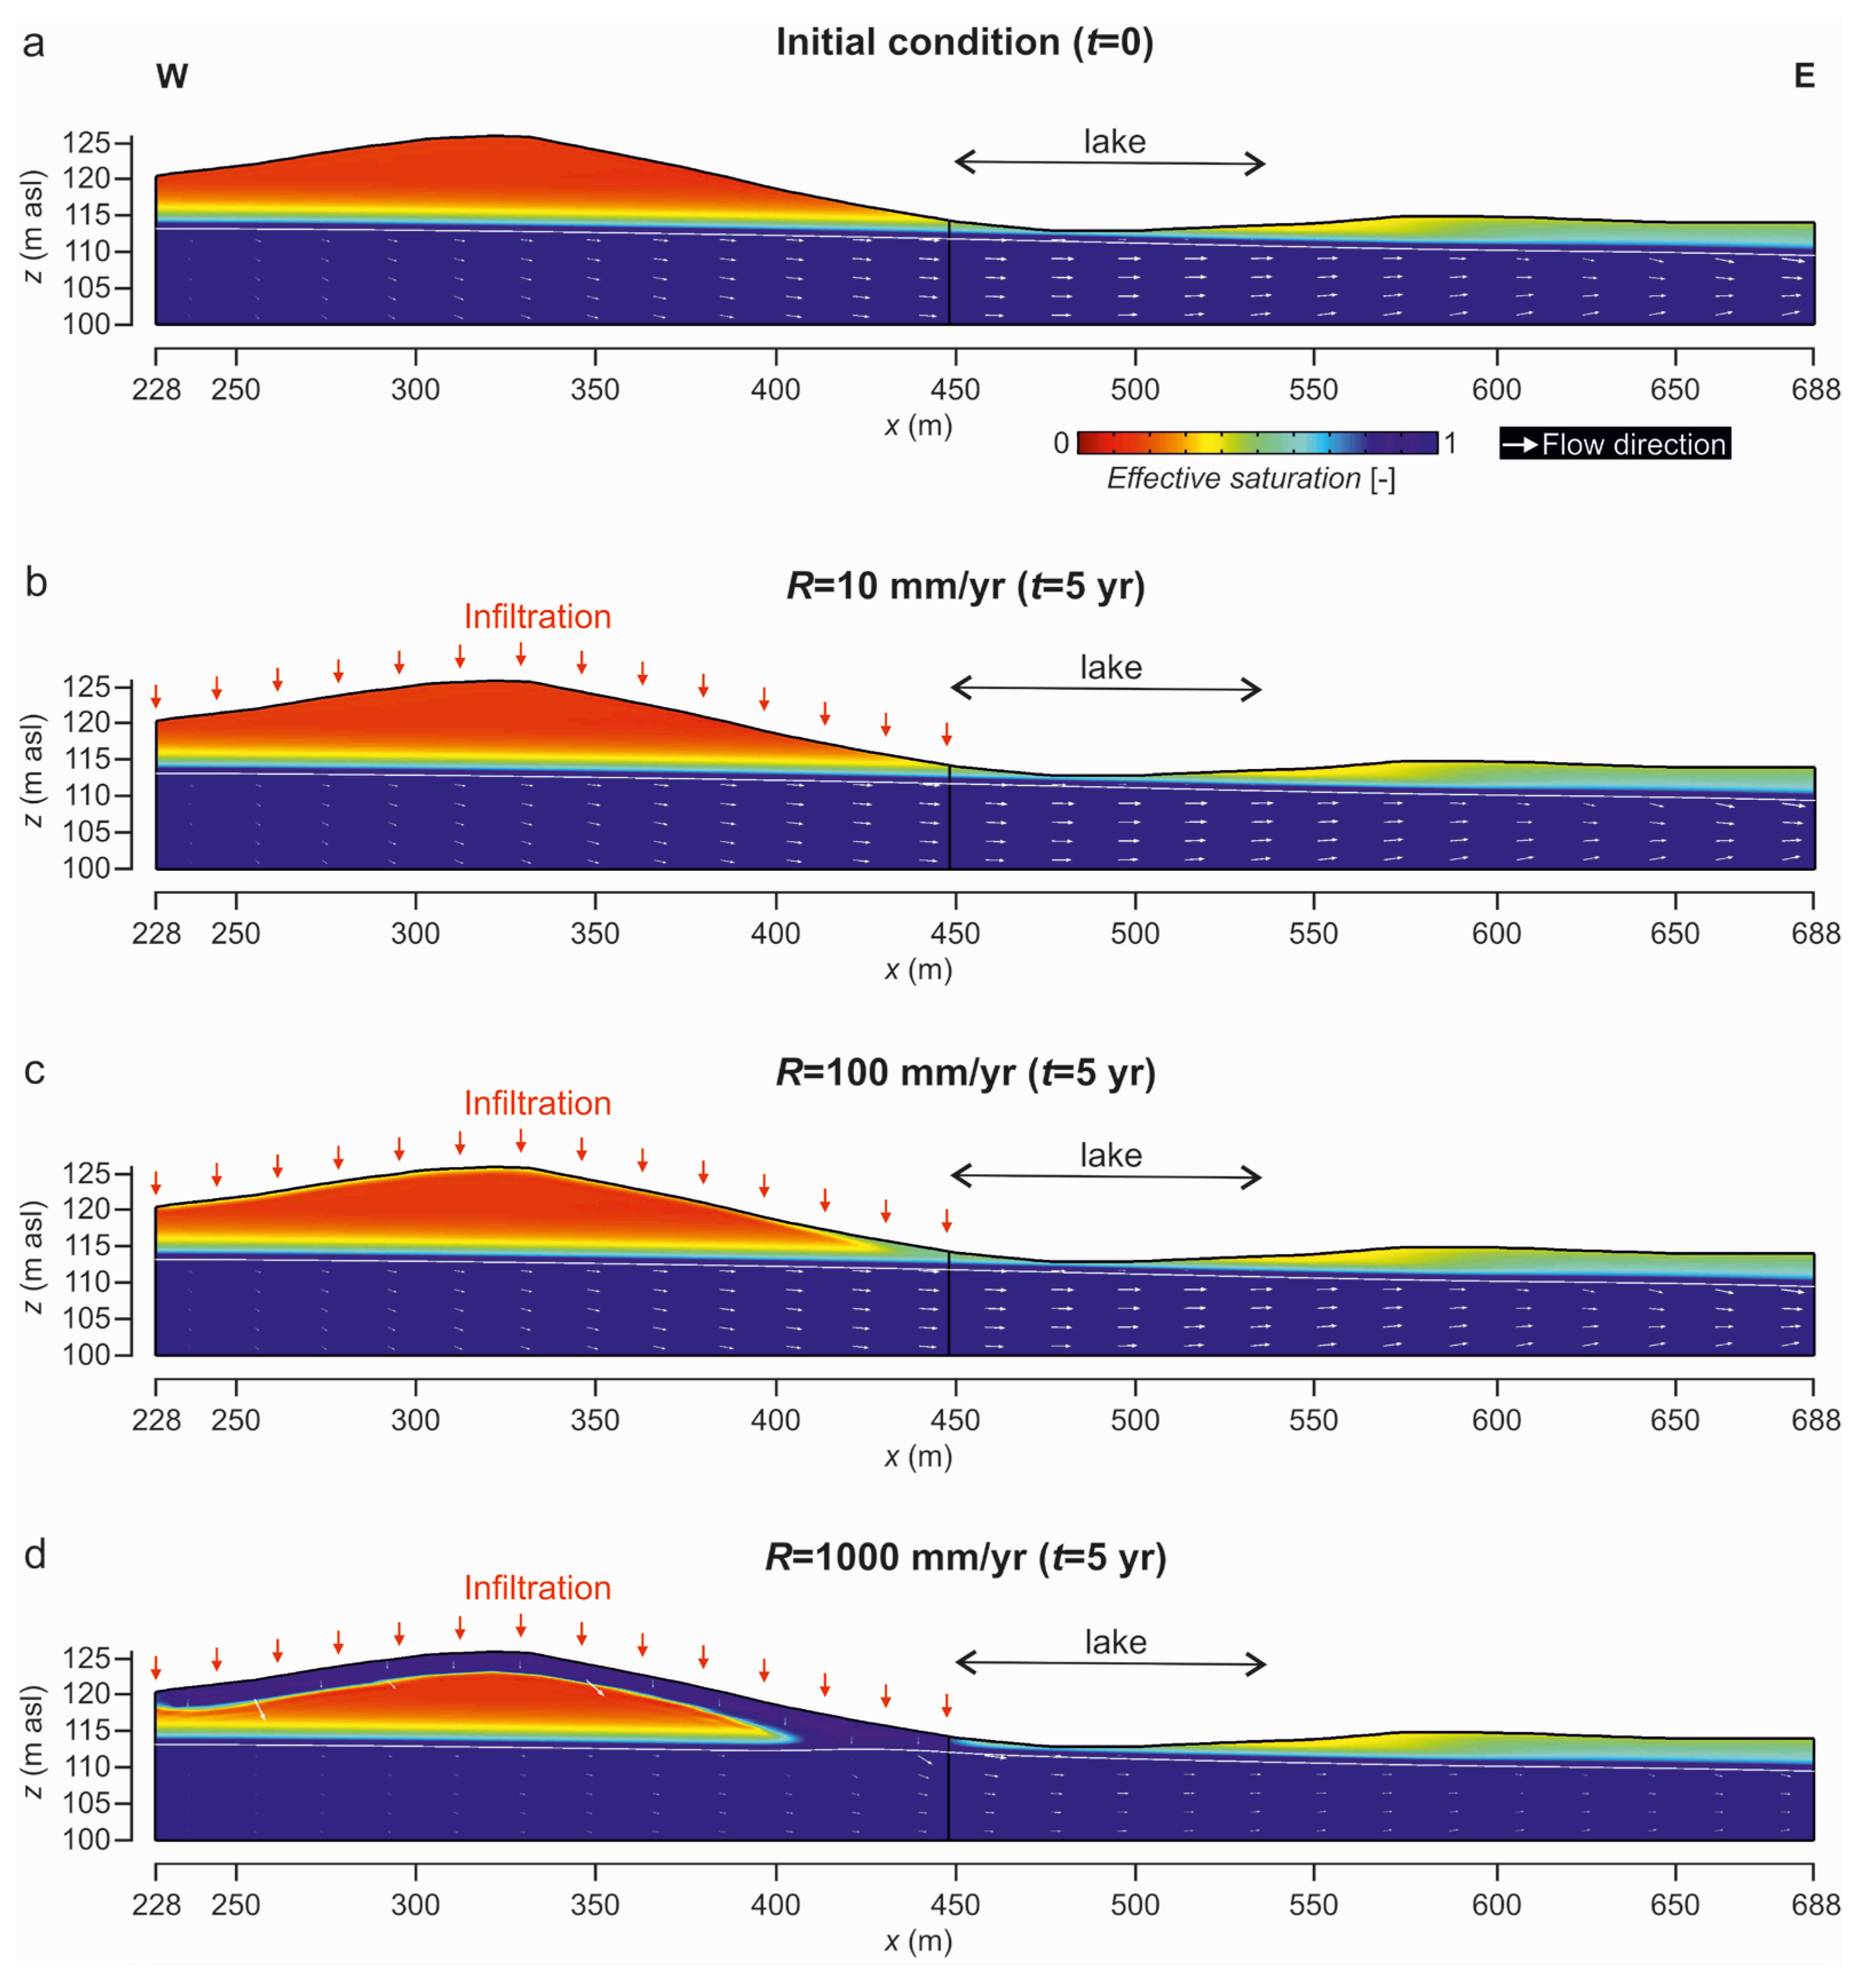
Following the steady-state model, a time-dependent simulation (Step 2 in Figure 3b) was carried out in the immediate vicinity of Lake Csohos to evaluate a water retention solution (Figure 3c). As the sand dune located NW of the lake was identified as a recharge point of the local flow system in the area, it was hypothesised that the deforestation of the dune would increase recharge on the sand dune and, by utilising the natural groundwater flow direction, the infiltrated water would increase the water table elevation below the lake. This solution was tested via the time-dependent simulation at the area of the sand dune and the lake (Figure 2a, Figure 3c and Figure 11). The hypothesis was simulated by applying three different infiltration rates for 5 years (Figure 11).
The infiltration rates represented a relatively small (R = 10 mm/yr in Figure 11b), a close to normal (R = 100 mm/yr in Figure 11c), and an extremely high value (R = 1000 mm/yr in Figure 11c). The cross-section is limited to the parallelogram area illustrated in Figure 3b, where the western part of the parallelogram represents the dune with constant infiltration, and the eastern part is the lake and its eastern foreground (Figure 3c). Figure 11a shows the initial conditions of the effective saturation, where the sand dune and the bed of Lake Csohos are unsaturated. With the first infiltration scenario, no significant change occurs in the saturation of the lakebed (Figure 11b). In the case of 100 mm/yr infiltration, the effective saturation increased at the edge of the dune, but the saturation front did not reach the water table, so the infiltrating water could not provide the necessary water supply to the lake. At 1000 mm/yr infiltration, the saturation increased below the dune, especially at the inclination point. Between 400 and 450 m, the unsaturated zone disappeared, and the infiltration reached the water table, leading to a limited amount of water supply reaching the lake area at the eastern edge of the dune (Figure 11d). However, Figure 11d indicates that, even at these extreme infiltration values, no open water surface would appear in Lake Csohos and that local infiltration at the dune would not have a significant effect on the depth of the groundwater table in the lake area. The results of the model suggest the planned deforestation on the dune west of the lake would not contribute significantly to a rise in the water table in the lake area. Nevertheless, with a longer time interval (>5 years) of extremely high infiltration, the solution may be more effective.
A steady-state numerical simulation was also carried out at the Lake Daruláp area to clarify groundwater flow conditions, as well as to assess potential contamination from the crop field (Figure 12).
Figure 12a shows the steady-state 3D hydraulic head distributions with flow directions calculated for the entire area of the extended model but plotted only in the inserted domain at Lake Daruláp (Step 1 in Figure 4b). The flow directions are plotted in 2D cross-sections in the N-S and W-E directions in Figure 12b,c (cross-section lines in Figure 2b). The block section and the cross-section show that the dune NW-W of the lake represents a recharge area from where water flows eastwards and then discharges at the eastern edge of the lake and at the crop field (Figure 12a–c). In the same area, an N-NE-E-originated groundwater flow also discharges (Figure 12c), arriving from the higher elevated eastern foreground of the study area. Based on the model, the lake area is situated in a flow-through–discharge position. However, the exact lake–groundwater connection cannot be revealed from the results because surface water was not built into the numerical model.

4. Discussion

4.1. Position of the Wetlands in the Groundwater Flow Systems

The proper scale of the investigation is crucial in understanding wetland and groundwater interactions. In the case of wetland areas and connected GDEs, investigations at different scales are crucial in order to fully understand the natural conditions [3,25]. Winter [1] emphasised that wetlands are usually connected to local flow systems superimposing the large regional flow conditions, and these predominantly determine the water supply. In addition, regional-scale groundwater flow systems could also play a role in influencing water supply [8,25,56] or determining the chemical character [7,11] of a wetland and the related GDEs. In particular, during an investigation of the possible effects of climate change, regional-scale investigations are important and required [13]. As a consequence, in the present study, regional- as well as local-scale groundwater flow conditions were interpreted at the two wetlands in accordance with Anibas et al. [57], who also mentioned a hierarchical approach for a full understanding of groundwater–surface water interactions.

4.1.1. Regional Groundwater Flow Conditions around the Wetlands

The investigations revealed that the two ephemeral water bodies are influenced via a regional-scale topography-driven flow system and are situated in a recharge–slightly flow-through position. The areas are located on the southern border of the regional recharge area in the Nyírség region, where, at shallow depths (>500 m), flow-through starts to occur and become more dominant towards SW, followed by discharge conditions more to the south. This finding is consistent with the results of Szabó [39] and Czauner et al. [58], who showed recharge–flow-through conditions at a shallow depth (>500 m) in the South-Nyírség region and discharge conditions to the south of the study area. Szanyi [45] also obtained similar results, showing that original flow-through existed in the South-Nyírség region, but the large water exploitation around Debrecen (a town near the study area, Figure 1b) changed the conditions to mainly recharge-dominated. Nevertheless, the equipotential lines of 110 and 120 m asl, which surface at shallow depths in the section (Figure 6a), may indicate local discharge between the two study sites, but it cannot be confirmed at that scale. The lower boundary of the topography-driven flow regime is located at ~−500 m above sea level, where overpressure-originated upwelling occurs. It appears as a transient zone first, represented by the near-hydrostatic upwelling water of the dissipated overpressure regime on the p(z) plot, as well as on the cross-section. This transient zone was identified in other parts of the Great Hungarian Plain, too [58,59]. Real overpressure values occur only at ~−2000 mBf, representing the upward-directed overpressured flow regime.
The prevailing Ca,Mg-HCO3 facies and the TDS content of 500–700 mg/L in the whole area are consistent with the results of the hydraulic survey. The facies character and TDS content clearly indicate recharge and flow-through conditions and the dominance of short flow paths that spent a relatively short time below the surface. This is in accordance with Szabó’s [39] results, showing that TDS is less than 700 mg/L everywhere above −200 m asl. The anomalous Na-HCO3 facies at shallow depths at point 8 (Figure 6) may be due to the effect of contamination, while in the 150–200 m depth range (points 1–2–3 and 6–7 in Figure 6), the influence of the upwelling groundwater from the deep system may be present. In this case, the boundary of the topography-driven flow system may be shallower than −500 m in these areas (Figure 6).
The elevated TDS values in some wells and the elevated ammonium, nitrate, and nitrite concentrations are supposedly due to agricultural activities associated with the settlements, as well as inadequate drainage.
Regarding the two investigated wetlands, this regional-scale recharge–flow-through position indicates a deeper-located water table that is very vulnerable to changing climatic conditions [17,18]. The infiltrating water in the Nyírség region moves toward the deeper-located discharge areas, which results in a negative water balance related to the water table. In this environment, the shallow wetlands are connected to local flow systems evolving between local topographic lows and highs, and below them, downward or close-to-horizontal flow exists. Because these shallow wetlands are highly dependent on the position of the water table, they are more exposed to water level decline than in regional discharge areas.

4.1.2. Wetland–Groundwater Interaction at Local Scale

Based on the results of the local-scale investigations, the regional-scale recharge–flow-through-type flow system is superimposed via local flow systems induced by local topographic differences in both areas.
In the case of the Lake Csohos area, the study area is located in a flow-through situation in terms of the wider environment (Figure 10), where small relief variations directly around the lakebed also generate flow from the E direction towards the lake area (Figure 7). Consequently, the former lake shows a discharge position at a shallow depth (<~3.5–4 m), gaining water from the western bordering sand dune, but also, from the local water table mounds located E-NE which being present during the entire year (Figure 7). In these shallow conditions, no significant seasonal variation was detected, except a water table mound formed at the Cs4 potentiometer (Figure 7a) in summer. At greater depths (>4 m), the NW-SE-directed flow-through conditions prevail, originating on the western sand dune and moving towards Canal Monostori (Figure 10). This flow contributes to the water supply of the lake area, but its main discharge point is located at the eastern side of the canal. This discharge can be traced via the elevated water levels in Cs5 (directly at the shore of the canal) and Cs6 (in the wet patch) over the entire year, indicating a more continuous water supply.
Comparing the results of the field-data-based local flow characterisation with the groundwater flow simulation, the recharge from the sand dune was detected with both methods, but the groundwater supply from the direction of the water table mounds at Cs5 and Cs6 potentiometers (Figure 7) did not occur in the model (Figure 10). Only the continuous flow-through exists towards the deepest part (~110 m asl) of the study area, towards the canal and its eastern foreground. These differences originate from the simplification applied during the simulation, which is due to the lack of a detailed dataset of the area. As a result of neglecting small-scale variations in the water table and any inhomogeneities (lenses with reduced permeability, etc.), sublocal flows towards the lake from an E-NE direction do not occur.
Regarding Lake Csohos, the identified local flows are not able to provide enough water supply to it due to the deep location of the regional groundwater table in the area, which is a result of the regional recharge–flow-through conditions. Consequently, the regional water table has a significant impact on the water levels at/near the lake.
The chemical composition of the shallow potentiometers confirmed the dominance of relatively short flow paths (TDS < 400 mg/L, Ca-HCO3 facies) connected to local groundwater flow systems and being relevant to the regional recharge position, too. The only exception is the lakebed (Cs1 and Cs2), where Ca-SO4 facies and high sulphate content (1770 mg/L in Cs1) are dominant. This anomalous composition and the chemical values exceeding the MACs at the Lake Csohos area are assumed to be the result of natural processes occurring in a nature conservation area. The occurrence of high sulphate concentrations and pH < 7 at the lakebed (Cs1 and Cs2) is likely the result of organic matter decomposition that often may lead to elevated sulphate contents [60], associated with the elevated ammonia and nitrite values. The ammonia and phosphate anomalies in Cs5 and Cs6, as well as the 6.78 pH value in Cs6, may also be connected to organic matter decomposition, as, in these areas, constant water inundation used to be present, and organic matter has likely accumulated.
In the Lake Daruláp area, a complex flow field was observed and simulated. Superimposing the main, regional recharge, and flow-through conditions, the sand dune located NW of the lake generated an NW-SE-directed local flow system over the area (Figure 8 and Figure 12). In addition, another local flow system arrives from an E direction, originating from outside of the study area (Figure 8a and Figure 12). The main discharge point of these two flow systems is located at the eastern edge of the lake and below the crop field (Figure 8a and Figure 12), ensuring a more stable water inundation than in the case of Lake Csohos. Based on the field measurements, at shallow depths (<~3–4 m), the lake is located in a flow-through position, except in late winter, when an additional sublocal flow provides water supply from an E-SE direction from a water table mound around D3 (Figure 8c). In July 2021, at D2, another water table mound occurred (Figure 8a), inducing sublocal flow from the lake shore towards the sand dune to the NW. These seasonally forming water table mounds are typical phenomena in similar wetlands and lakes, providing additional water supply in some parts of the year [1,12,61]. The occurrence of these is connected to seasonal climatic variations, i.e., the higher precipitation in winter and early springtime. These water table mounds—similar to the Lake Csohos area—did not occur in the results of the numerical simulation (Figure 12) due to the simplifications applied.
The findings indicate that the lake cannot receive water from the direction of the crop field in the largest part of the year because groundwater flow paths arriving from the east discharge at the eastern shore of the lake, at D3, did not reach the current lakebed. The only exception is late winter when a locally, seasonally forming water table mound occurred at D3 allowing groundwater transport from the edge of the crop field to the lake.
Lake Daruláp area’s main chemical composition is consistent with its supplying local flow systems and the regional recharge–flow-through conditions, indicating its groundwater supply and its fen type [62]. The lake shows the effect of eutrophication represented by the elevated COD, phosphate, nitrite, and nitrate values (Table S5 of the Supplementary Materials). The eutrophication may be a natural phenomenon in shallow groundwater-influenced ponds [63]; however, some level of influence via fertilisers (i.e., nitrate leaching from crop fields may contribute to eutrophication of wetlands [64]) cannot be excluded. The groundwater flow directions and the fairly good groundwater quality (no elevated COD, nitrite, nitrate, and phosphorus) below the crop field suggest that the influence of fertilisers does not reach the lake; however, continuous monitoring would be required to ensure that the water quality does not deteriorate.

4.1.3. Significance of Different Scales during Wetland–Groundwater Interaction

In the present paper, the investigations at the regional and local scales revealed significant information about groundwater–wetland interactions. Based on these results, it can observed that the two wetlands are located in complex flow situations, where the position of the water table is of great significance. The lakes are located in a regional recharge–flow-through condition that determines the main water table position in the area and the exposure of the water table to climate change. In this environment, the superimposing local groundwater flow systems predominantly supply the lakes, and their seasonal variation also temporally influences wetland–groundwater interaction. These local flow systems operate between local highs and lows. If the water table decreases, while it is in a very vulnerable situation due to its elevated topographic position, these local flow systems start to diminish, and downward or close-to-horizontal flow becomes prevalent. This will result in the disappearance of the wetlands.
These results prove that both scales are necessary for the full understanding of the special position of the wetlands. Regional conditions are responsible for the declining water table in the area, but local groundwater flows provide water supply for the wetlands. Under climate change, the significance of regional conditions becomes more important, as the regional water table decline can overprint the local groundwater flow conditions and diminish local flow systems.
These findings are supported by Thorslund et al. [65], who also emphasised the significance of large-scale wetland characterisation in addition to local-scale investigations not only in wetland characterisation but also in wetland management.

4.2. Potential Solutions to Mitigate Water Decline Affecting the Areas and Ensure Good Wetland Quality

After delineating the natural conditions of the two wetland areas, potential solutions to mitigate water level decline and ensure good quality were tested.
The results revealed that both wetlands are located in regional recharge–slightly flow-through position, and they are highly influenced via the location of the regional water table. Therefore, the most effective solution for wetland preservation may be a regional water table increase around the entire area. This could be obtained via a comprehensive water retention strategy impacting the whole Nyírség region. As a solution, in the settlements, rainwater or surface runoff could be collected and infiltrated as well as the treated wastewater. These solutions could effectively increase water levels on a catchment scale, too [7,31]. This way, not only in the regional recharge but also in the discharge position the water table could be elevated or at least maintained. Local-scale solutions may be locally effective, as long as the water table is located so close to the surface that local flow systems can operate.
At Lake Csohos, the deforestation of the main local recharge area, the NW-located sand dune, was investigated as a local-scale, indirect water retention solution. The deforestation of non-native vegetation could help to increase recharge in other areas, too [66]. Via deforestation, the high transpiration rate of the currently present poplar and locust trees could be utilised as surplus infiltration in the recharge area. The results of the numerical simulation with different infiltration values showed that increased recharge through the sand dune had no significant effect on the water table at the lakebed. Under extremely high infiltration conditions (1000 mm/yr) over 5 years, the infiltrated water could reach the water table and provide water supply to the lake area, but the lakebed would remain dry. Therefore, deforestation is not expected to solve the problem, but on a longer timescale (>5 years) it is able to contribute to the increase in the water table in the Lake Csohos area.
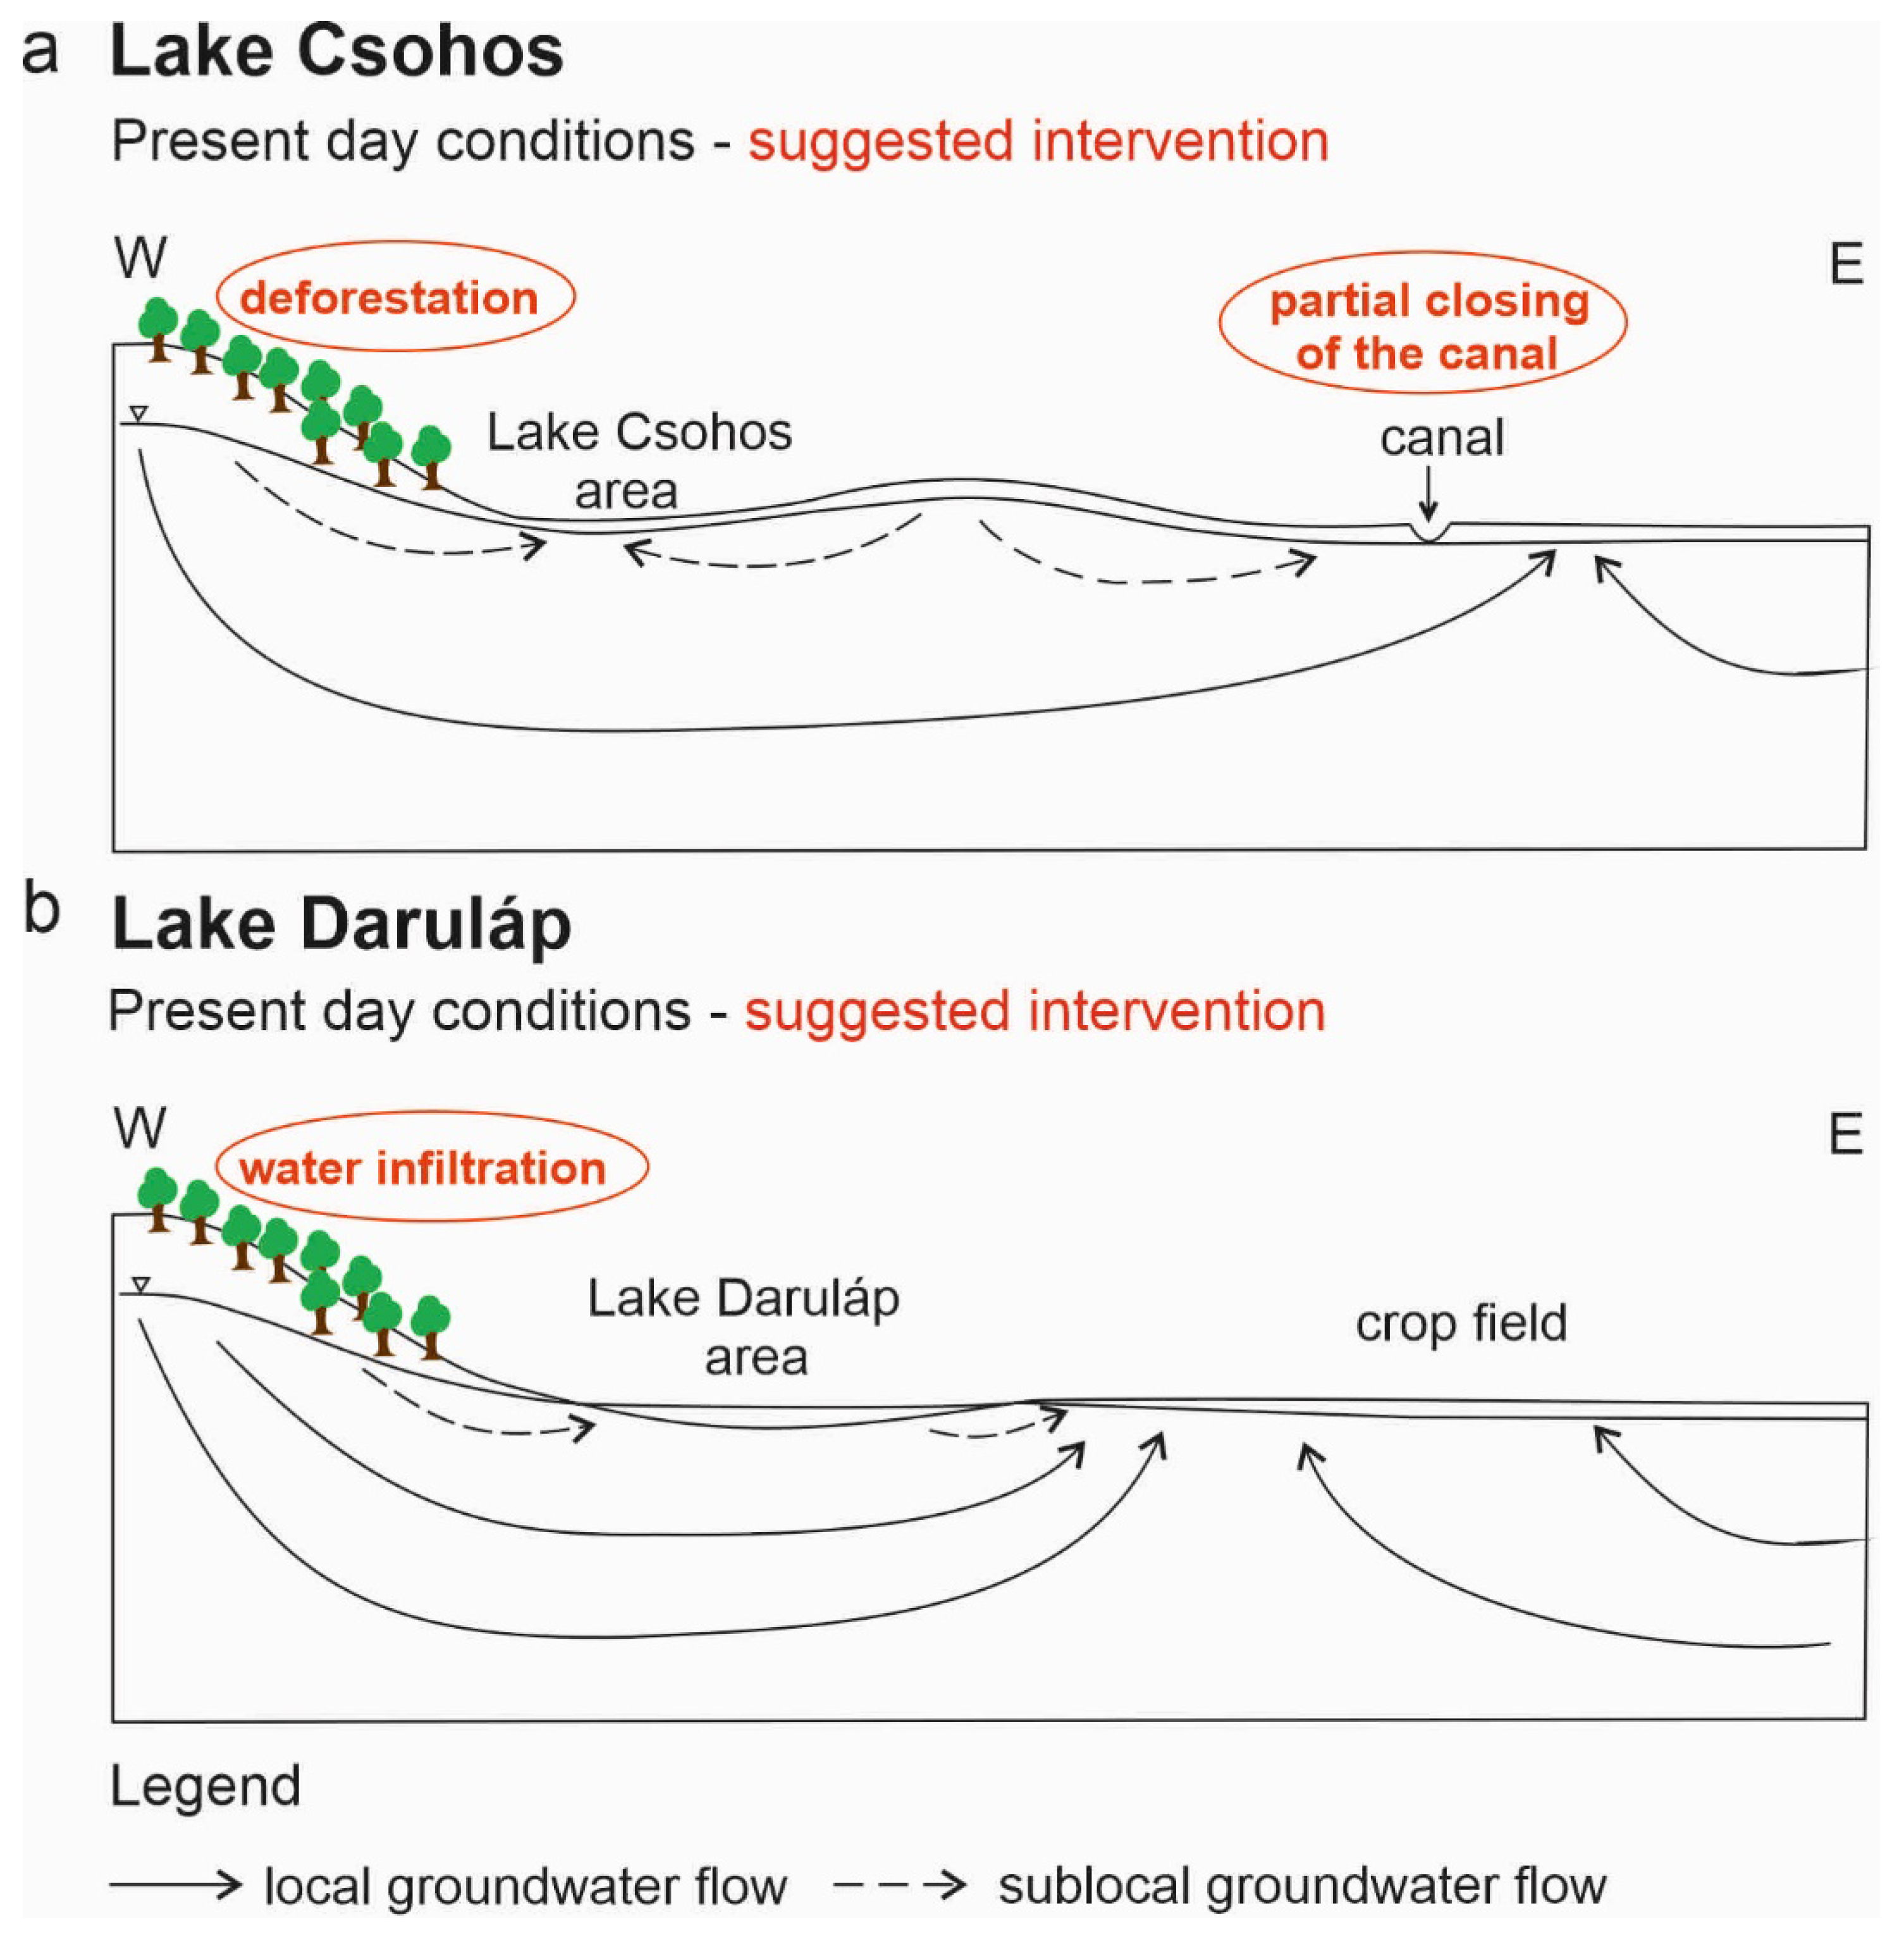
In the long term, deforestation may be able to increase the water level around the canal, too, due to being the main discharge area of the local groundwater flow originating at the sand dune to the NW. The water level increase at the canal area could potentially improve the water levels in Lake Csohos if the increased groundwater level is preserved and not diverted out of the area via the canal (Figure 13a). Therefore, partial closing of the canal coupled with deforestation may potentially result in increased water retention, firstly, in the discharge area and then in the lake area, if the surplus recharge at the dune can be maintained (Figure 13a). The application of direct water infiltration to the NW-located sand dune may be more effective than deforestation; however, this solution requires an additional water source in the area. As the area is far from the settlements where rainwater or surface runoff can be collected, or treated wastewater is available, this solution is not relevant to the area. Another water retention solution may be the construction of a subsurface dam [28] on the eastern side of the lakebed to retain the groundwater arriving from the dune. Unfortunately, this solution works only in the presence of a poorly conductive layer at a shallow depth, which could provide a base for the dam. Due to the lack of such layers in the area, the effectiveness of the dam is questionable.
In the case of Lake Daruláp area, the lake is located in flow-through conditions, but its eastern side receives hydraulic support from the discharge of the local flow system originating from the NW-located sand dune. Because of this, its water supply is more stable than that of Lake Csohos’. At Lake Daruláp, surplus water infiltration at the recharge areas in the NW-located sand dune is supposed to help maintain the water level in the lake wetlands, but due to the lack of water sources, this solution is questionable (Figure 13b).
Regarding the quality of Lake Daruláp, it was found that groundwater flow from the direction of the crop field can only reach the lake in the winter and early spring when a local water table mound forms at D3 (Figure 8c). During these seasons, fertilisers are not used; furthermore, the hydrochemical characteristics did not show any trace of contamination below the crop field even in the summertime. Nevertheless, due to the signs of the early eutrophication of the lake, the possible effect of outwash from the crop field cannot be excluded. Consequently, continuous monitoring is required in the area.

4.3. Limitations of the Investigations

The investigations carried out had some limitations, originating mainly from data availability. In the case of the regional-scale data analysis, data availability and data distribution constrain the full understanding of every detail of groundwater flow movement in the area. In the case of local-scale field measurements, the larger number of potentiometers would increase the understanding of the wetland–groundwater interaction.
The application of the three-dimensional numerical simulation in the study areas could improve the understanding and contextualisation of the results from the hydraulic data processing. These simulations, however, contain simplifications and have limitations that may affect the outcome. Our results revealed that in the case of wetland areas, it is especially important since the water table configuration does not necessarily follow the topography due to the local climatic effects, and the water table can show large seasonal variations (in agreement with the findings of Hokanson et al. [67]). Therefore, sublocal groundwater flows and water table mounds were not represented in the simulations due to the lack of detailed information regarding spatial and temporal variations in the water table. During the numerical modelling study, the following simplifications were applied: (1) In Step 1, water table configurations were described as fixed-flow boundary conditions for flow in the models. In the study areas, a Dirichlet-type boundary condition proposed by the authors of [68] was applied. This methodology was used to establish the “undisturbed” initial and boundary conditions for Step 2. (2) In both scenarios, the seasonal variation in the water table was neglected. In the Lake Csohos environment, the main question was whether the additional infiltration from the forested area could lead to a permanent increase in the position of the water table. Therefore, an annual average was approximated in the simulations. (It should be noted that there are no recorded time series of the water table changes in the studied areas.)

5. Conclusions

The management and rehabilitation of wetland areas are of special importance due to the increasing effect of climate change and groundwater overexploitation. It is especially critical in regional recharge areas. The present study investigated two wetlands in the Nyírség region, the Great Hungarian Plain, Hungary, with both impacted via water shortage. The results highlighted that in the case of groundwater-dependent wetlands, a detailed understanding of the hydraulic position of these areas and the groundwater–wetland interaction are key elements of finding a proper management solution. The novelty of this study was the application of the groundwater flow system approach [33] at different scales during the investigations. The wetlands were investigated firstly in the regional context of groundwater flow systems followed by the characterisation of the local groundwater–wetland interaction. With this gradual approach, all groundwater flow systems influencing the wetlands can be delineated. The results indicate that the application of different scales was necessary to reveal and understand the special hydraulic position of the wetlands. The two shallow lakes are located in the regional recharge–slightly flow-through area where the superimposing local flow systems supply the lakes in local discharge and local flow-through positions. The local wetland–groundwater interaction shows a typical seasonal variation.
The research revealed that the preservation of the wetlands in the identified regional recharge conditions is a challenge in light of the increasing impact of climate change and human activities. In contrast to regional discharge areas, where upward, long groundwater flow paths buffer the effect of climate change, recharge areas—characterised by downward water movement—are impacted directly. The regionally declining water levels endanger the shallow wetlands that are highly dependent on the regional water table position. The investigations highlighted that, if the water table declines regionally, local flow systems diminish or are not able to sustain the shallow wetlands and the associated ecosystems. Therefore, only regional-scale water retention impacting the whole region can provide long-term solutions for water shortage. When the water table is still located near the surface of wetland areas, local-scale hydrogeological solutions may help in mitigation, preservation, or rehabilitation; however, the effectiveness of these solutions is limited. Water retention, such as deforestation or direct water infiltration, at the local recharge areas of the wetlands, may provide additional water supply, thereby may lead to a water level increase in the wetland itself. In the case of wetlands in a similar position to those in the Nyírség region, these solutions may present water management alternatives under present-day conditions. All water retention or MAR strategies, however, should be preceded by a detailed characterisation of the contributing groundwater flow systems.
The results showed that groundwater-related wetlands can be located in complex flow situations, which are simultaneously influenced via different flow systems. The groundwater flow characterisation at different scales contributes to identifying all influencing flow systems and helps to both better assess the expected changes in the groundwater conditions due to climate change and understand the operation of other wetlands situated in similar groundwater flow conditions. Understanding the natural conditions and the effect of groundwater flow systems is crucial for finding the most appropriate water management solutions.

Supplementary Materials

The following supporting information can be downloaded at: https://www.mdpi.com/2073-4441/15/20/3589/s1, Table S1: Data of the regional-scale hydraulic data analysis; Table S2: Data of the regional-scale hydrochemical data analysis; Table S3: Hydraulic data of the potentiometers at the two local study areas; Table S4: Methods and measurement inaccuracies of the local-scale hydrochemical measurements; Table S5: Hydrochemical data of the potentiometers at the local study areas.

Author Contributions

Conceptualisation, S.S., J.D.-T., and J.M.-S.; methodology, S.S., J.D.-T., and M.S.; software, S.S. and M.S.; validation, S.S., J.D.-T., and M.S.; formal analysis, S.S.; investigation, S.S., J.D.-T., and L.S.; resources, S.S., J.D.-T., and L.S.; data curation, S.S and J.D.-T.; writing—original draft preparation, S.S.; writing—review and editing, S.S., J.D.-T., J.M.-S., M.S., and L.S.; visualisation, S.S., J.D.-T., and M.S.; supervision, S.S., J.D.-T., and J.M.-S.; project administration, S.S. and J.D.-T.; funding acquisition, J.M.-S. All authors have read and agreed to the published version of the manuscript.

Funding

This research was funded by the Hortobágy National Park Directorate „Nyírségi és bihari vizes élőhelyek rehabilitációs programja (projekt-előkészítés)” (project: KEHOP-4.1.0-15-2021-00098) and by the National Multidisciplinary Laboratory for Climate Change (project: RRF-2.3.1-21-2022-00014).

Data Availability Statement

The applied data are available in the Supplementary Materials. Any other data are available from the corresponding author upon request.

Acknowledgments

The work was supported by the National Research, Development and Innovation Office (project no.: PD 142660).

Conflicts of Interest

The authors declare no conflict of interest.

Appendix A

In the simulations, a combination of two approaches was used to investigate the groundwater flow in the saturated and unsaturated zones of the study areas. The 3D calculations were carried out using COMSOL Multiphysics® (version 5.3a) [50].

Appendix A.1. Groundwater Flow in Saturated Porous Media

In Step 1, the steady-state solution of groundwater flow required the coupled treatment of the mass conservation (A1) and the Darcy’s Equation (A2), which are given by
ρ w q = 0 ,
q = K s ρ w g p ρ w g z ,
where q and p are the unknown Darcy flux and pressure, respectively; the water density is ρ w = 1000 kg/m3; and Ks denotes the three-dimensional hydraulic conductivity tensor in saturated zone,
K s = K x x 0 0 0 K y y 0 0 0 K z z ,
where Kyy = Kxx.
In the case of Lake Daruláp, a modified form of mass conservation can be solved by
ρ w q = Q ,
Which is due to the constant pressure boundary conditions along the sides of the model in Step 2. Q denotes fluid sink or source. For Lake Csohos, the Darcy’s equation (Equation (A2)) and the time-dependent form of mass conservation are used in the lower part of numerical model (Step 2—z < 100 m asl), in which the porous medium is assumed to be saturated
φ · ρ w t + ρ w q = Q ( t ) ,
where φ and t are the porosity and the time, respectively.

Appendix A.2. Groundwater Flow in Unsaturated Porous Media

In the case of Lake Csohos, the time-dependent changes in (initially) undisturbed groundwater flow caused by the infiltration (Step 2—z > 100 m asl) can be described via the differential equation system, including the third form of mass conservation and the Richards’ equation [52]
ρ w C k ρ w g + S e S p t + ρ w q = Q ( t ) ,
q = K ' ρ w g p ρ w g z ,
where Ck is the specific moisture capacity, Se is the effective saturation, and S is the storage coefficient, K’ = Ks·Kr(Se).
In the simulation, a linearized storage model can be assumed
S = θ s χ f + 1 θ s χ m ,
where Θs = φ, Θr, χf, and χm, which denote the saturated water volume faction, the residual water volume faction, the effective compressibility of the fluid, and the effective compressibility of the matrix, respectively. For this study, Θs = 0.2, Θr = 0.01, χf = 4 × 10⁻¹⁰ 1/Pa, and χm = 10−4 1/Pa.
The retention model is defined using the van Genuchten approximation [53] given by
θ = θ r + S e θ s θ r ;   ψ < 0 θ s ;   ψ 0 ,
S e = 1 1 + α Ψ n k ;   ψ < 0 1 ;   ψ 0 ,
C k = α k 1 α θ s θ r S e 1 k 1 S e 1 k k ;   ψ < 0 0 ;   ψ 0 ,
K r = S e l 1 1 S e 1 k k 2 ;   ψ < 0 1 ;   ψ 0 ,
where Kr is the relative hydraulic conductivity, ψ is the pressure head, and k = 1–1/n is the constitutive parameter. The van Genuchten equations define saturation when the water pressure is atmospheric (ψ = 0). For this study, the constant parameters in the retention model are: α = 1 1/m, n = 2, and l = 0.5.

References

  1. Winter, T.C. Relation of streams, lakes, and wetlands to groundwater flow systems. Hydrogeol. J. 1999, 7, 28–45. [Google Scholar] [CrossRef]
  2. Brown, J.; Wyers, A.; Aldous, A.B.; Bach, S.L. Groundwater and Biodiversity Conservation: A methods Guide for Integrating Groundwater Needs of Ecosystems and Species into Conservation Plans in the Pacific Northwest; The Nature Conservancy: Arlington, VA, USA, 2007; 123p. [Google Scholar]
  3. Kløve, B.; Ala-aho, P.; Bertrand, G.; Boukalova, Z.; Ertürk, A.; Goldscheider, N.; Ilmonen, J.; Karakaya, N.; Kupfersberger, H.; Kvœrner, J.; et al. Widerlund. Groundwater dependent ecosystems. Part I: Hydroecological status and trends. Environ. Sci. Policy 2011, 14, 770–781. [Google Scholar] [CrossRef]
  4. Winter, T.C.; Harvey, J.W.; Franke, O.L.; Alley, W.M. Groundwater and Surface Water: A Single Resource. Circular 1139; US Geological Survey: Denver, CO, USA, 1998; 79p. [Google Scholar]
  5. Liu, Q.; Mou, X. Interactions Between Surface Water and Groundwater: Key Processes in Ecological Restoration of Degraded Coastal Wetlands Caused by Reclamation. Wetlands 2016, 36, 95–102. [Google Scholar] [CrossRef]
  6. Shaw, R.D.; Shaw, J.F.H.; Fricker, H.; Prepas, E.E. Integrated Approach to Quantify Groundwater Transport of Phosphorus to Narrow Lake, Alberta. Limnol. Oceanogr. 1990, 35, 870–886. [Google Scholar] [CrossRef]
  7. Simon, S.; Mádl-Szőnyi, J.; Müller, I.; Pogácsás, G. Conceptual model for surface salinization in an overpressured and a superimposed gravity-flow field, Lake Kelemenszék area, Hungary. Hydrogeol. J. 2011, 19, 701–717. [Google Scholar] [CrossRef]
  8. Zurek, A.J.; Witczak, S.; Dulinski, M.R.; Wachniew, P.; Rozanski, K.; Kania, J.; Postawa, A.; Karczewski, J.; Moscicki, W.J. Quantification of anthropogenic impact on groundwater-dependent terrestrial ecosystem using geochemical and isotope tools combined with 3-D flow and transport modelling. Hydrol. Earth Syst. Sci. 2015, 19, 1015–1033. [Google Scholar] [CrossRef]
  9. Van der Kamp, G.; Hayashi, M. Groundwater-wetland ecosystem interaction in the semiarid glaciated plains of North America. Hydrogeol. J. 2009, 17, 203–214. [Google Scholar] [CrossRef]
  10. Medici, G.; Langman, J.B. Pathways and Estimate of Aquifer Recharge in a Flood Basalt Terrain; A Review from the South Fork Palouse River Basin (Columbia River Plateau, USA). Sustainability 2022, 14, 11349. [Google Scholar] [CrossRef]
  11. Mádl-Szőnyi, J.; Tóth, J. A hydrogeological type section for the Duna-Tisza Interfluve, Hungary. Hydrogeol. J. 2009, 17, 961–980. [Google Scholar] [CrossRef]
  12. Meyboom, P. Mass transfer studies to determine the groundwater regime of permanent lakes in hummocky moraine of western Canada. J. Hydrol. 1967, 5, 117–142. [Google Scholar] [CrossRef]
  13. Erwin, K.L. Wetlands and global climate change: The role of wetland restoration in a changing world. Wetl. Ecol. Manag. 2009, 17, 71–84. [Google Scholar] [CrossRef]
  14. Kløve, B.; Ala-aho, B.; Bertrand, G.; Gurdak, J.J.; Kupfersberger, H.; Kværner, J.; Muotka, T.; Mykrä, H.; Preda, E.; Rossi, P.; et al. Climate change impacts on groundwater and dependent ecosystems. J. Hydrol. 2014, 518, 250–266. [Google Scholar] [CrossRef]
  15. Salimi, S.; Almuktar, S.A.A.A.N.; Scholz, M. Impact of climate change on wetland ecosystems: A critical review of experimental wetlands. J. Environ. Manag. 2021, 286, 112160. [Google Scholar] [CrossRef]
  16. Cuthbert, M.O.; Gleeson, T.; Moosdorf, N.; Befus, K.M.; Schneider, A.; Hartmann, J.; Lehner, B. Global patterns and dynamics of climate–groundwater interactions. Nat. Clim. Chang. 2009, 9, 137–141. [Google Scholar] [CrossRef]
  17. Kurylyk, B.L.; MacQuarrie, K.T.; Voss, C.I. Climate change impacts on the temperature and magnitude of groundwater discharge from shallow, unconfined aquifers. Water Resour. Res. 2014, 50, 3253–3274. [Google Scholar] [CrossRef]
  18. Zhou, P.; Wang, G.; Duan, R. Impacts of long-term climate change on the groundwater flow dynamics in a regional groundwater system: Case modeling study in Alashan, China. J. Hydrol. 2020, 590, 125557. [Google Scholar] [CrossRef]
  19. Trásy-Havril, T.; Szkolnikovics-Simon, S.; Mádl-Szőnyi, J. How Complex Groundwater Flow Systems Respond to Climate Change Induced Recharge Reduction? Water 2022, 14, 3026. [Google Scholar] [CrossRef]
  20. Mitsch, W.J.; Hernandez, M.E. Landscape and climate change threats to wetlands of North and Central America. Aquat. Sci. 2013, 75, 133–149. [Google Scholar] [CrossRef]
  21. van Engelenburg, J.; Hueting, R.; Rijpkema, S.; Teuling, A.J.; Uijlenhoet, R.; Ludwig, F. Impact of Changes in Groundwater Extractions and Climate Change on Groundwater-Dependent Ecosystems in a Complex Hydrogeological Setting. Water Resour. Manag. 2018, 32, 259–272. [Google Scholar] [CrossRef]
  22. Xi, Y.; Peng, S.; Ciais, P.; Chen, Y. Future impacts of climate change on inland Ramsar wetlands. Nat. Clim. Chang. 2021, 11, 45–51. [Google Scholar] [CrossRef]
  23. Xu, W.; Su, X. Challenges and impacts of climate change and human activities on groundwater-dependent ecosystems in arid areas—A case study of the Nalenggele alluvial fan in NW China. J. Hydrol. 2019, 573, 376–385. [Google Scholar] [CrossRef]
  24. Engelen, G.B.; Kloosterman, F.H. Hydrological Systems Analysis: Methods and Applications. Water Science and Technology Library; Kluwer Academic Publishers: Dordrecht, The Netherlands, 1996; Volume 20. [Google Scholar]
  25. Klijn, F.; Witte, J.P.M. Eco-hydrology: Groundwater flow and site factors in plant ecology. Hydrogeol. J. 1999, 7, 65–77. [Google Scholar] [CrossRef]
  26. Aldous, A.R.; Gannett, M.W. Groundwater, biodiversity, and the role of flow system scale. Ecohydrology 2021, 14, e2342. [Google Scholar] [CrossRef]
  27. Scherberg, J.; Baker, T.; Selker, J.S.; Henry, R. Design of Managed Aquifer Recharge for Agricultural and Ecological Water Supply Assessed Through Numerical Modeling. Water Resour. Manag. 2014, 28, 4971–4984. [Google Scholar] [CrossRef]
  28. Dillon, P.; Pavelic, P.; Page, D.; Beringen, H.; Ward, J. Managed Aquifer Recharge: An Introduction. Waterlines Report Series No. 13; National Water Commission: Canberra, Australia, 2009. [Google Scholar]
  29. Batelaan, O.; De Smedt, F.; Triest, L. Regional groundwater discharge: Phreatophyte mapping, groundwater modelling and impact analysis of land-use change. J. Hydrol. 2003, 275, 86–108. [Google Scholar] [CrossRef]
  30. Gale, I.N.; Macdonald, D.M.J.; Calow, R.C.; Neumann, I.; Moench, M.; Kulkarni, H.; Mudrakartha, S.; Palanisami, K. Managed Aquifer Recharge: An Assessment of Its Role and Effectiveness in Watershed Management; British Geological Survey: Nottingham, UK, 2006. [Google Scholar]
  31. Szabó, Z.; Szijártó, M.; Tóth, Á.; Mádl-Szőnyi, J. The Significance of Groundwater Table Inclination for Nature-Based Replenishment of Groundwater-Dependent Ecosystems by Managed Aquifer Recharge. Water 2023, 15, 1077. [Google Scholar] [CrossRef]
  32. Hungarian Ministry of Internal Affairs Hydrological Directorate. Az Aszály Kockázat Kezelés és a Klímaalkalmazkodási Képesség Javítására Irányuló Vízgazdálkodási Intézkedések Meghatározása; Budapest, Hungary, 31 December 2019; 256p. Available online: https://vizeink.hu/wp-content/uploads/2021/04/Aszaly_VGT3_2021.pdf (accessed on 30 August 2023).
  33. Czauner, B.; Molnár, F.; Masetti, M.; Arola, T.; Mádl-Szőnyi, J. Groundwater flow system-based dynamic system approach for geofluids and their resources. Water 2022, 14, 1015. [Google Scholar] [CrossRef]
  34. Kerékgyártó, G. Az Érmelléki löszös hát kistáj településeinek egyedi tájértékei. Agrártudományi Közlemények 2012, 46, 45–50. [Google Scholar]
  35. Borsy, Z. A Nyírség Természeti Földrajza; Academical Press: Budapest, Hungary, 1961; 227p. [Google Scholar]
  36. Bihari, Z.; Babolcsai, G.; Bartholy, J.; Ferenczi, Z.; Gerhát-Kerényi, J.; Haszpra, L.; Homoki-Ujváry, K.; Kovács, T.; Lakatos, M.; Németh, Á.; et al. Magyarország éghajlata. In Magyarország Nemzeti Atlasza: Természeti Környezet; Kocsis, K., Ed.; Hungarian Academy of Science, Research Centre for Astronomy and Earth Sciences: Budapest, Hungary, 2018; pp. 58–69. [Google Scholar]
  37. Ács, F.; Breuer, H.; Szász, G. A tényleges párolgás és a talaj vízkészlet becslése tenyészidőszakban. Agrokémia És Talajt. 2007, 56, 217–236. [Google Scholar] [CrossRef]
  38. Tóth, J.; Almási, I. Interpretation of observed fluid potential patterns in a deep sedimentary basin under tectonic compression: Hungarian Great Plain, Pannonian Basin. Geofluids 2001, 1, 11–36. [Google Scholar] [CrossRef]
  39. Szabó, Z. Folyadékáramlási Rendszerek Komplex Értékelése Hajdúszoboszló–Ebes—Balmazújváros Tágabb Térségében. Master’s Thesis, Department of Applied and Environmental Geology, Eötvös Loránd University, Budapest, Hungary, 2018. [Google Scholar]
  40. Haas, J.; Budai, T.; Csontos, L.; Fodor, L.; Konrád, G.; Koroknai, B. Magyarország Prekainozoos Medencealjzatának Földtana. Magyarázó ”Magyarország Pre-Kainozoos Földtani Térképéhez” (1:500,000); Hungarian Institute of Geology and Geophysics (Magyar Földtani és Geofizikai Intézet): Budapest, Hungary, 2014. [Google Scholar]
  41. Juhász, G. A pannóniai (sl) formációk térképezése az Alföldön: Elterjedés, fácies és üledékes környezet. Földtani Közlöny 1992, 122, 133–165. [Google Scholar]
  42. Pogácsás, G.; Lakatos, L.; Újszászi, K.; Vakarcs, G.; Várkonyi, L.; Várnai, P.; Révész, I. Seismic facies, electro facies and Neogene sequence chronology of the Pannonian Basin. Acta Geol. Hung. 1988, 31, 175–207. [Google Scholar]
  43. Borsy, Z. Blown sand territories in Hungary. Z. Für Geomorphol. Suppl. 1991, 90, 1–14. [Google Scholar]
  44. Buró, B.; Sipos, G.; Lóki; Andrási, B.; Félegyházi, E.; Négyesi, G. Assessing Late Pleistocene and Holocene phases of aeolian activity on the Nyírség alluvial fan, Hungary. Quatern. Int. 2016, 425, 183–195. [Google Scholar] [CrossRef]
  45. Szanyi, J. Felszín Alatti Víztermelés Környezeti Hatásai a Dél-Nyírség Példáján. Ph.D. Thesis, University of Szeged, Szeged, Hungary, 2004. [Google Scholar]
  46. Járó, Z. A hazai erdők vízfogyasztása. Agrártudományi Közlemények 1981, 40, 353–356. [Google Scholar]
  47. Déri-Takács, J.; Szkolnikovics-Simon, S.; Szijártó, M.; Mádl-Szőnyi, J. Létavértes-Kokad Kutatási Terület Fűzlápjai Vízpótlásának Megalapozása; Report to the Hortobágy National Park Directorate: Budapest, Hungary, 2021. [Google Scholar]
  48. Tóth, J. Gravitational Systems of Groundwater Flow: Theory, Evaluation, Utilization; Cambridge University Press: Cambridge, UK, 2009; 310p. [Google Scholar]
  49. Mádlné Szőnyi, J. Felszínalatti Vízáramlások Mintázata Fedetlen és Kapcsolódó Fedett Karbonátos Víztartó Rendszerekben, a Budai-Termálkarszt Tágabb Környezetének Példáján. Ph.D. Thesis, Department of Geology, Eötvös Loránd University, Budapest, Hungary, 2020. [Google Scholar]
  50. Zimmermann, W.B.J. Multiphysics Modeling With Finite Element Methods; World Scientific Publishing Company: Singapore, 2006; 422p. [Google Scholar]
  51. Freeze, A.; Cherry, J. Groundwater; Prentice Hall: Eaglewood Cliff, NJ, USA, 1979; 604p. [Google Scholar]
  52. Farthing, W.M.; Ogden, F.L. Numerical Solution of Richards’ Equation: A Review of Advances and Challenges. Soil Sci. Soc. Am. J. 2017, 81, 1257–1269. [Google Scholar] [CrossRef]
  53. van Genuchtern, M.T. A closed-form for predicting the hydraulic conductivity of unsaturated soils. Soil Sci. Soc. Am. J. 1980, 44, 892–898. [Google Scholar] [CrossRef]
  54. Kerék, B.; Vatai, J. Az Alföld földtani kutatásának környezetvédelmi jelentősége. (The importance of environmental research of the Great Hungarian Plain). Agrártudományi Közlemények 2006, 19, 9–16. [Google Scholar]
  55. Mester, T.; Balla, D.; Szabó, G. Assessment of Groundwater Quality Changes in the Rural Environment of the Hungarian Great Plain Based on Selected Water Quality Indicators. Water Air Soil Pollut. 2020, 231, 536. [Google Scholar] [CrossRef]
  56. Shedlock, R.J.; Wilcox, D.A.; Thompson, T.A.; Cohen, D.A. Interactions between ground water and wetlands, southern shore of Lake Michigan, USA. J. Hydrol. 1993, 141, 127–155. [Google Scholar] [CrossRef]
  57. Anibas, C.; Verbeiren, B.; Buis, K.; Chormański, J.; De Doncker, L.; Okruszko, T.; Meire, P.; Batelaan, O. A hierarchical approach on groundwater-surface water interaction in wetlands along the upper Biebrza River, Poland. Hydrol. Earth Syst. Sci. 2012, 16, 2329–2346. [Google Scholar] [CrossRef]
  58. Czauner, B.; Szabó, Z.; Márton, B.; Mádl-Szőnyi, J. Basin-Scale Hydraulic Evaluation of Groundwater Flow Controlled Biogenic Gas Migration and Accumulation in the Central Pannonian Basin. Water 2023, 15, 3272. [Google Scholar] [CrossRef]
  59. Czauner, B.; Szkolnikovics-Simon, S.; Mádl-Szőnyi, J. Regional scale normal and abnormal pore pressure regimes and groundwater flow systems—Determination, characterization and climate change-related issues. In Proceedings of the 49th IAH Congress—Groundwater Sustainability and Poverty Reduction, Wuhan, China, 20 September 2022. [Google Scholar]
  60. Zak, D.; Hupfer, M.; Cabezas, A.; Jurasinski, G.; Audet, J.; Kleeberg, A.; McInnes, R.; Kristiansen, S.M.; Petersen, R.J.; Liu, H.; et al. Sulphate in freshwater ecosystems: A review of sources, biogeochemical cycles, ecotoxicological effects and bioremediation. Earth-Sci. Rev. 2021, 212, 103446. [Google Scholar] [CrossRef]
  61. Simon, S. Characterization of Groundwater and Lake Interaction in Saline Environment, at Kelemen-szék Lake,Danube-Tisza Interfluve, Hungary. Ph.D. Thesis, Department of Geology, Eötvös Loránd University, Budapest, Hungary, 2010. [Google Scholar]
  62. Wheeler, B.D.; Proctor, M.C.F. Ecological gradients, subdivisions and terminology of North-West European mires. J. Ecology 2000, 88, 187–203. [Google Scholar] [CrossRef]
  63. Akinnawo, S.O. Eutrophication: Causes, consequences, physical, chemical and biological techniques for mitigation strategies. Environ. Chall. 2023, 12, 100733. [Google Scholar] [CrossRef]
  64. Smolders, A.J.P.; Lucassen, E.C.H.E.T.; Bobbink, R.; Roelofs, J.G.M.; Lamers, L.P.M. How nitrate leaching from agricultural lands provokes phosphate eutrophication in groundwater fed wetlands: The sulphur bridge. Biogeochemistry 2010, 98, 1–7. [Google Scholar] [CrossRef]
  65. Thorslund, J.; Jarsjo, J.; Jaramillo, F.; Jawitz, J.W.; Manzoni, S.; Basu, N.B.; Chalov, S.R.; Cohen, M.J.; Creed, I.F.; Goldenberg, R.; et al. Wetlands as large-scale nature-based solutions: Status and challenges for research, engineering and management. Ecol. Eng. 2017, 108, 489–497. [Google Scholar] [CrossRef]
  66. Albhaisi, M.; Brendonck, L.; Batelaan, O. Predicted impacts of land use change on groundwater recharge of the upper Berg catchment, South Africa. Water SA 2013, 39, 211–220. [Google Scholar] [CrossRef]
  67. Hokanson, K.J.; Peterson, E.S.; Devito, K.J.; Mendoza, C.A. Forestland-peatland hydrologic connectivity in water-limited environments: Hydraulic gradients often oppose topography. Environ. Res. Lett. 2020, 15, 034021. [Google Scholar] [CrossRef]
  68. Haitjema, H.M.; Mitchell-Bruker, S. Are Water Tables a Subdued Replica of the Topography? Ground Water 2005, 43, 781–786. [Google Scholar] [CrossRef]
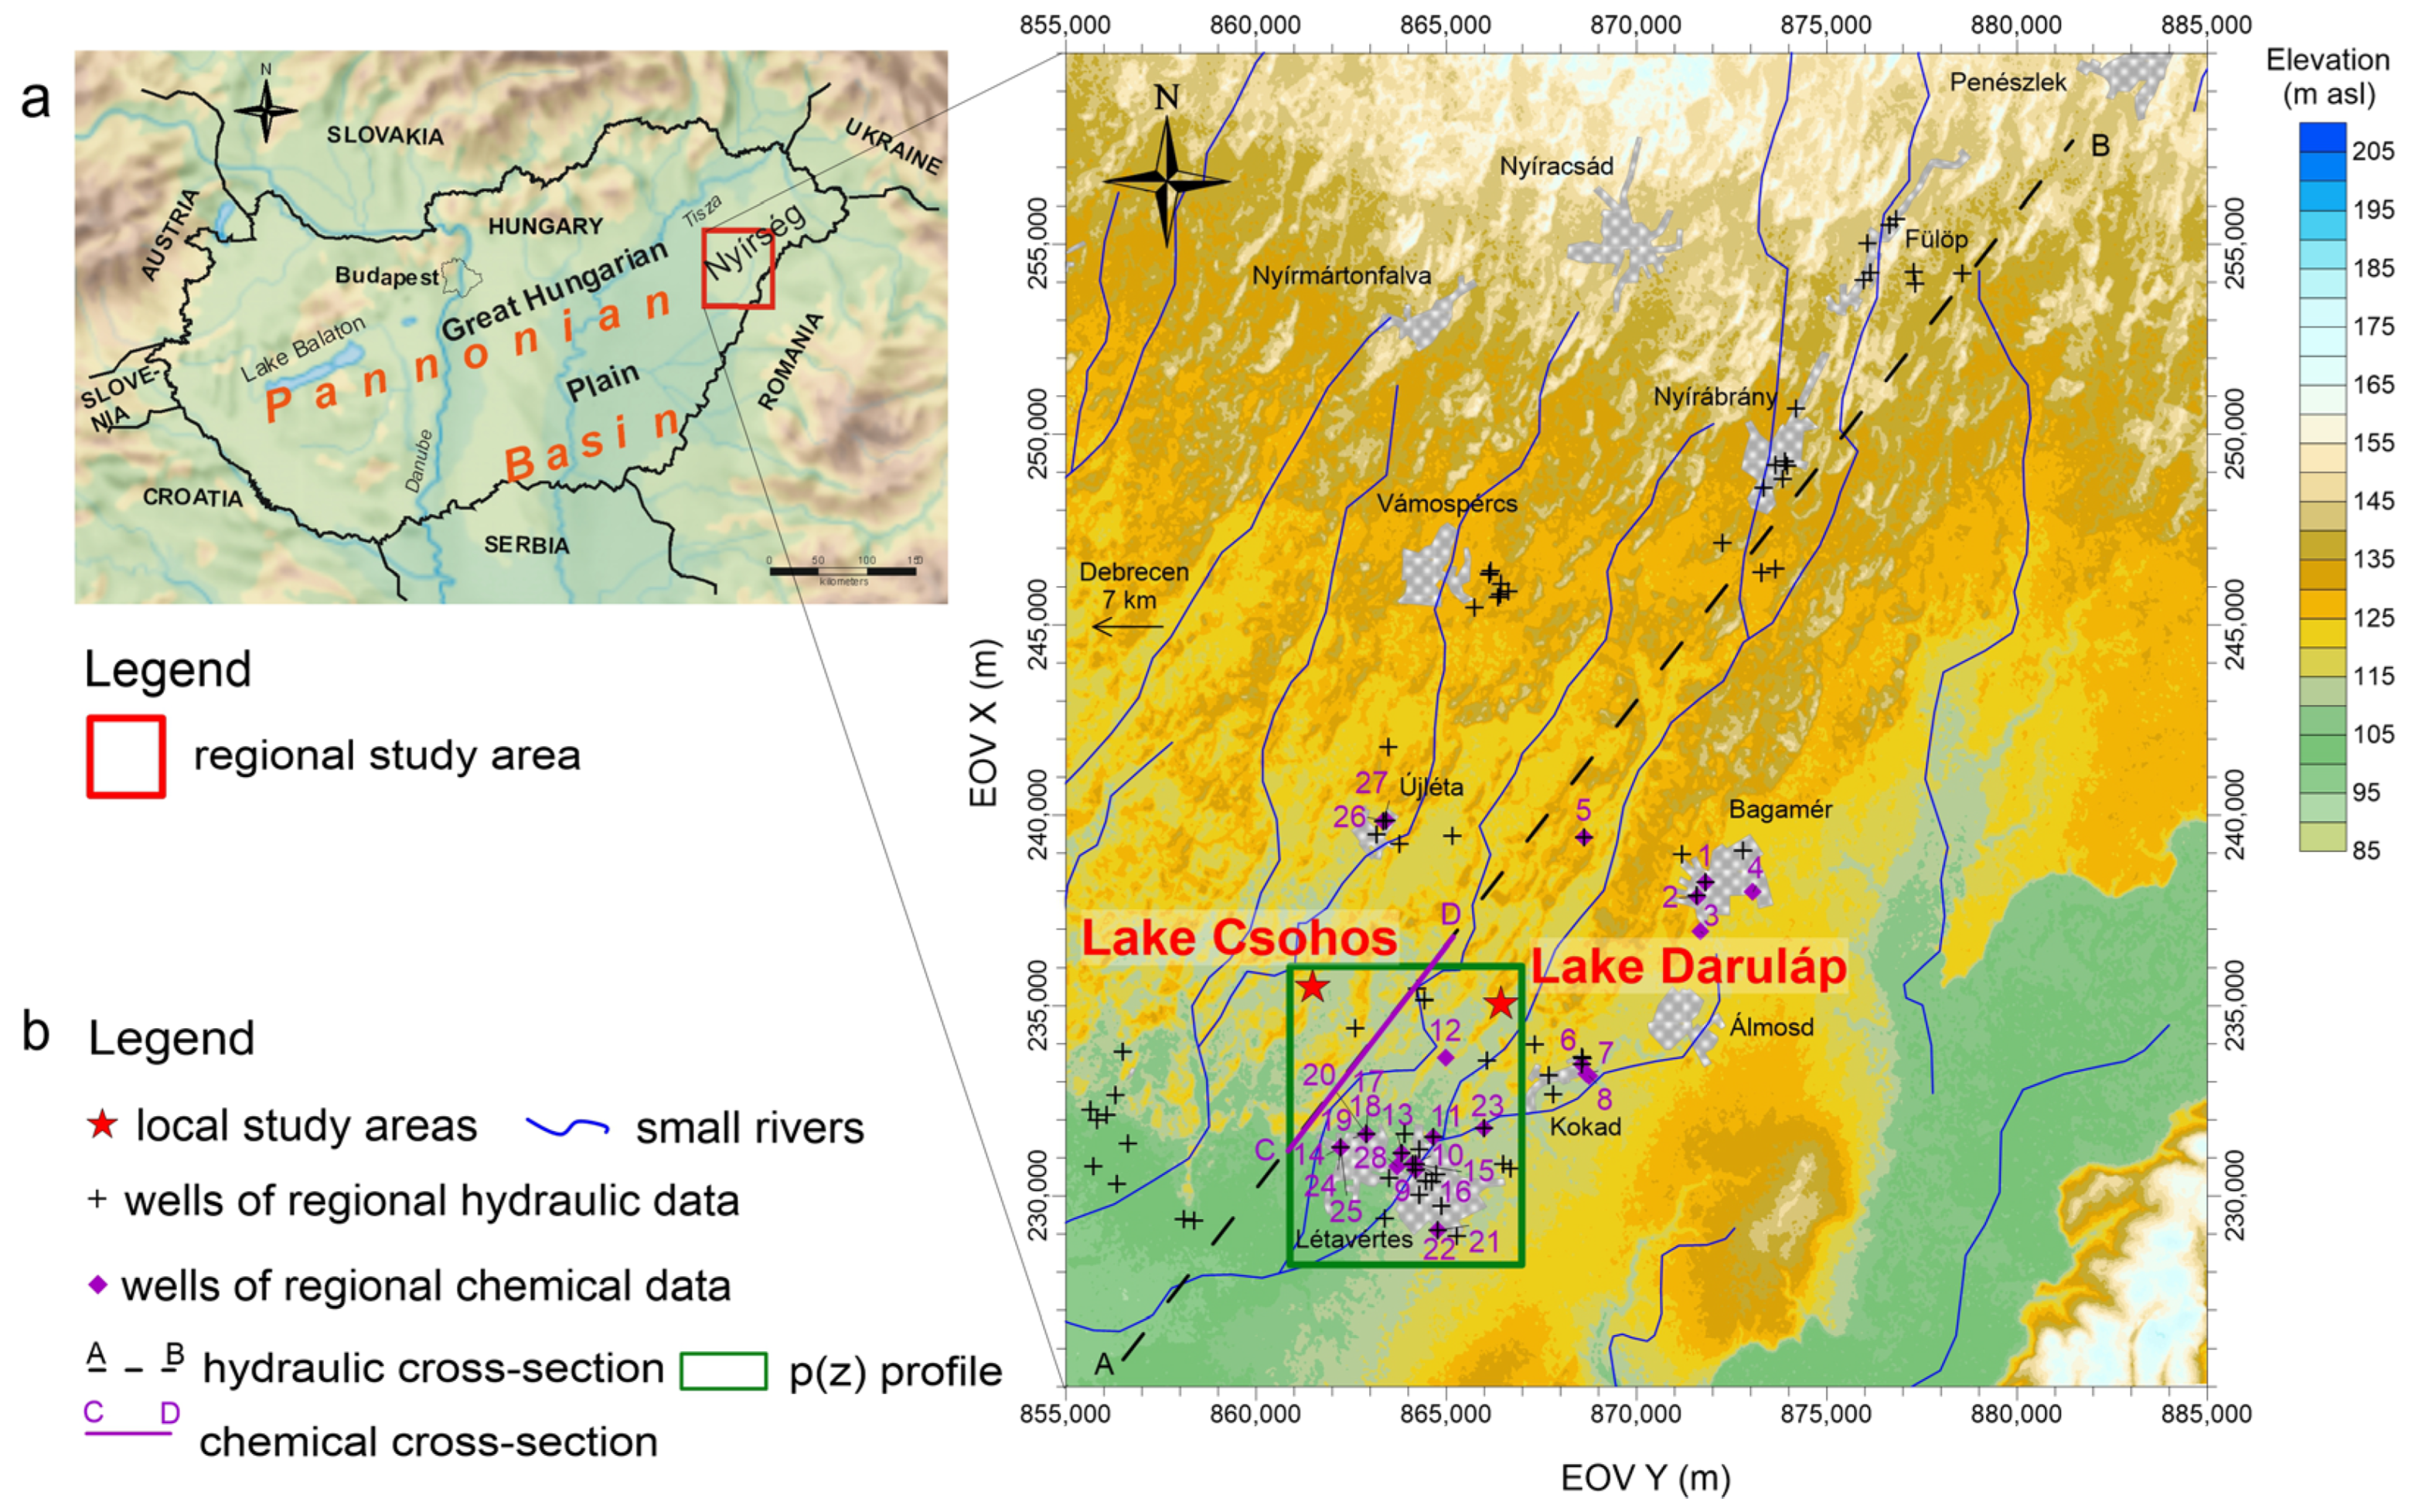
Figure 1. Location of the (a) regional and the (b) local study areas.
Water 15 03589 g001
Figure 2. Local study areas: (a) Lake Csohos area, (b) Lake Daruláp area.
Water 15 03589 g002
Figure 3. Geometry of the groundwater flow model at Lake Csohos area. (a) Step 1: geometry of extended model with boundary conditions (blue), and with the frame of inset local-scale domain (green) (Step 2). (b) Step 2: geometry of local-scale model with boundary conditions (green), and with the location of added infiltration (red). x0 and y0 are the reference coordinates. The location of Lake Csohos is indicated via the orange surface. The location of the 2D cross-sections XZ and YZ in Step 2 is shown via a magenta line. (c) The interpreted 2D cross-section XZ in Step 2 is illustrated via magenta. (d) The flow chart shows the two simulation steps with the outer (Step 1) and inner (Step 2) boundary conditions, the initial condition (Step 2), the tested parameter (infiltration rate, R).
Water 15 03589 g003
Figure 4. Geometry of the groundwater flow model at Lake Daruláp area. (a) Step 1: geometry of model for the extended area with boundary conditions (blue), and with the frame of inset local-scale domain (green) (Step 2). (b) Step 2: geometry of local-scale model with boundary conditions (green). x0 and y0 are the reference coordinates. The location of Lake Daruláp is indicated via the orange surface. The location of the 2D cross-sections XZ and YZ in Step 2 is shown via magenta line. (c) The flow chart shows the two simulation steps with the outer (Step 1) and inner (Step 2) boundary conditions.
Water 15 03589 g004
Figure 5. Pressure–elevation profile in the surroundings of the two wetlands. Hydrostatic pressure gradient values are γhid(min) and γhid(max) = 9.81 MPa/km.
Water 15 03589 g005
Figure 6. Regional-scale (a) hydraulic cross-section and (b) TDS distribution in the Lake Csohos and Lake Daruláp area (locations of the A–B and C–D cross-sections are shown in Figure 1b).
Water 15 03589 g006
Figure 7. Local-scale seasonal water table maps at Lake Csohos area (a) in July 2021, (b) in November 2021, (c) in February 2022, (d) in May 2022.
Water 15 03589 g007
Figure 8. Local-scale seasonal water table maps at Lake Daruláp area (a) in July 2021, (b) in November 2021, (c) in February 2022, (d) in May 2022.
Water 15 03589 g008
Figure 9. Piper plot of the potentiometer data at the local study sites (Lake Csohos and Lake Daruláp). (The locations of data points are shown in Figure 7 and Figure 8).
Water 15 03589 g009
Figure 10. Steady-state solution of hydraulic head (Step 1) at Lake Csohos area. (a) In the 3D inset domain and along the 2D cross-sections (b) XZ and (c) YZ. The vertical exaggeration is 2. The groundwater flow pattern is illustrated via normalised black arrows in the inset model domain. (a) The location of the 2D cross-sections is shown via the magenta line. (b) The magenta rectangle indicates the highlighted part of the 2D XZ cross-section in Step 1 (Figure 3b).
Water 15 03589 g010
Figure 11. (a) Initial effective saturation field from the simulation of the extended area, steady-state solution (Step 1), and the snapshots of effective saturation at the time of t = 5 yr with infiltration rates of (b) R = 10 mm/yr, (c) 100 mm/yr, and (d) 1000 mm/yr in the highlighted part of the 2D XZ cross-section in Step 2 (Figure 10b). The vertical exaggeration is 2. The infiltration area is indicated via red arrows, and the groundwater flow pattern is shown via white arrows.
Water 15 03589 g011
Figure 12. Steady-state solution of hydraulic head (Step 2) at Lake Daruláp area (a) in the 3D inset domain and along the 2D-cross-sections (b) XZ and (c) YZ. The vertical exaggeration is 2. The groundwater flow pattern is illustrated via normalised black arrows in the inset model domain.
Water 15 03589 g012
Figure 13. Water retention solutions (a) at Lake Csohos and (b) at Lake Daruláp area for present-day conditions.
Water 15 03589 g013
Disclaimer/Publisher’s Note: The statements, opinions and data contained in all publications are solely those of the individual author(s) and contributor(s) and not of MDPI and/or the editor(s). MDPI and/or the editor(s) disclaim responsibility for any injury to people or property resulting from any ideas, methods, instructions or products referred to in the content.