1. Introduction
Marine environmental noise is a ubiquitous background sound field in the ocean that carries a wealth of environmental and noise source information. It is formed by a mixture of multiple noise sources, such as seismic noise, ocean noise, shipping noise, and noises generated by wind. Marine environmental noise serves as both the background interference field for various sonars in the ocean waveguide environment and related noise sources. In 1962, physicist Wenz conducted long-term and extensive observations on marine environmental noise, analyzed noise data from different sea areas and seasons, and described the intensity of noise in the marine environment at different frequencies. He proposed the Wenz spectrum to describe the spectrum of marine environmental noise [
1]. According to the Wenz spectrum, noise sources can be roughly divided into three overlapping categories: ocean turbulence, distant ships, and wind-generated noise [
2,
3,
4]. Marine environmental noise is considered a form of chronic and continuous pollution, especially in shallow-water environments, which are the focal point of most human activities. The noise intensity is high and can propagate over considerable distances [
5,
6,
7,
8]. Noise sources in shallow-water environments are also influenced by numerous factors and have complex mechanisms. Therefore, it is necessary to reveal the characteristics of noise and analyze the mechanisms of multiple noise source mixtures through case studies in specific regions.
Previous studies have shown that tidal and tidal–current processes in shallow coastal areas affect the hydrological structure of coastal waters, causing changes in water depth, temperature, and salinity. These processes are also key factors influencing the speed and propagation path of sound waves in water. With the increase in construction projects such as net cage aquaculture, offshore wind power, and oil drilling in the coastal waters of south China, the proportion of anthropogenic noise to underwater noise in the marine environment is gradually becoming more prominent. The overlapping and gradual coupling of noise generated by natural processes and human activities in shallow coastal areas has become a complex mechanism that collectively affects the marine ecosystem alongside the survival and development of the environment. For example, aquatic animals rely on sound for communication, navigation, predation, or avoiding predation in turbid waters, and the acoustic environment of their habitats plays an important role in their lives [
9]. On the one hand, tidal and tidal–current processes can change the movement and propagation of these noise sources, thereby affecting noise levels in the underwater environment. On the other hand, anthropogenic marine noise is characterized by complex and wide-ranging frequency bands and is considered a threat to marine organisms [
10,
11]. Previous studies have shown that underwater noise from wind turbines, observed during periods of relatively fast tidal currents, can even be masked by tidal noise, indicating that tidal noise has a significant contribution to nearby waters [
12]. However, previous research has mainly focused on the characteristics of marine environmental noise and its impact mechanisms in deep-water areas, with less attention to shallow coastal areas [
13,
14,
15,
16], especially in areas with high human activity and the characteristics of marine environmental noise [
17,
18].
Zhanjiang Bay is the largest deepwater port in southern China’s coastal area. It is characterized by intensive and diverse human activities, resulting in significant marine environmental noise pollution. Therefore, it serves as a natural experimental site for investigating how human activities affect the underwater noise field in shallow marine environments. Based on the field observations of marine environmental noise during the spring and autumn seasons, this study focuses on the characteristics of marine environmental noise at the tidal channel entrance of Zhanjiang Bay. This research not only provides a case study for understanding the impact of human activities on the underwater noise field in shallow marine bays but also holds significant implications for the detection of nearby targets such as ships and underwater vehicles, as well as the design and development of underwater acoustic detection devices during underwater engineering operations in the bay area [
19,
20,
21]. Furthermore, it offers valuable insights for preliminary research on site selection and noise reduction during offshore construction projects, such as offshore wind farms.
2. Research Area
Zhanjiang Bay is the main seaport that allows southwestern provinces in China to access foreign countries. It is also an important port for mainland China to reach Southeast Asia, Africa, Europe, and Oceania with the shortest maritime distance. It is a typical drowned valley-type bay in the north of the South China Sea and the largest port in South China. Currently, it has been developed into a comprehensive port with multiple functions, including a major commercial port, a naval port, an offshore oil exploration base, and a deep-sea fishing base. The main tidal current-deep channel extends from the mouth of the bay to the north of Tiaoshun Island, with a length of over 40 km. It is a sedimentary tidal river channel that is connected to the open sea through the 2 km wide Dahuang River estuary channel, forming a semi-enclosed silted harbor. The tidal pattern in Zhanjiang Bay is irregular and semidiurnal, with an average tidal range of about 2 m and a maximum tidal range of about 3.9 m. The total tidal volume is approximately 5 × 10
9 m
3, with a maximum tidal volume of up to 10 × 10
9 m
3. The tidal current velocity ranges from 0.5 to 1.5 m/s, making it an area with a relatively large tidal range along the coast of South China [
22,
23,
24,
25]. During high tides, the tidal current flows from the deep channel outside the bay into the bay; during low tides, the tidal current flows from the bay to the outside of the bay. The tidal current during a high tide mainly flows westward, while during low tides, it mainly flows eastward. In the offshore area outside the bay mouth, wind waves are the main hydrodynamic factor, with prevailing winds and waves from the eastern and northern directions.
3. Materials and Methods
3.1. Data Collection
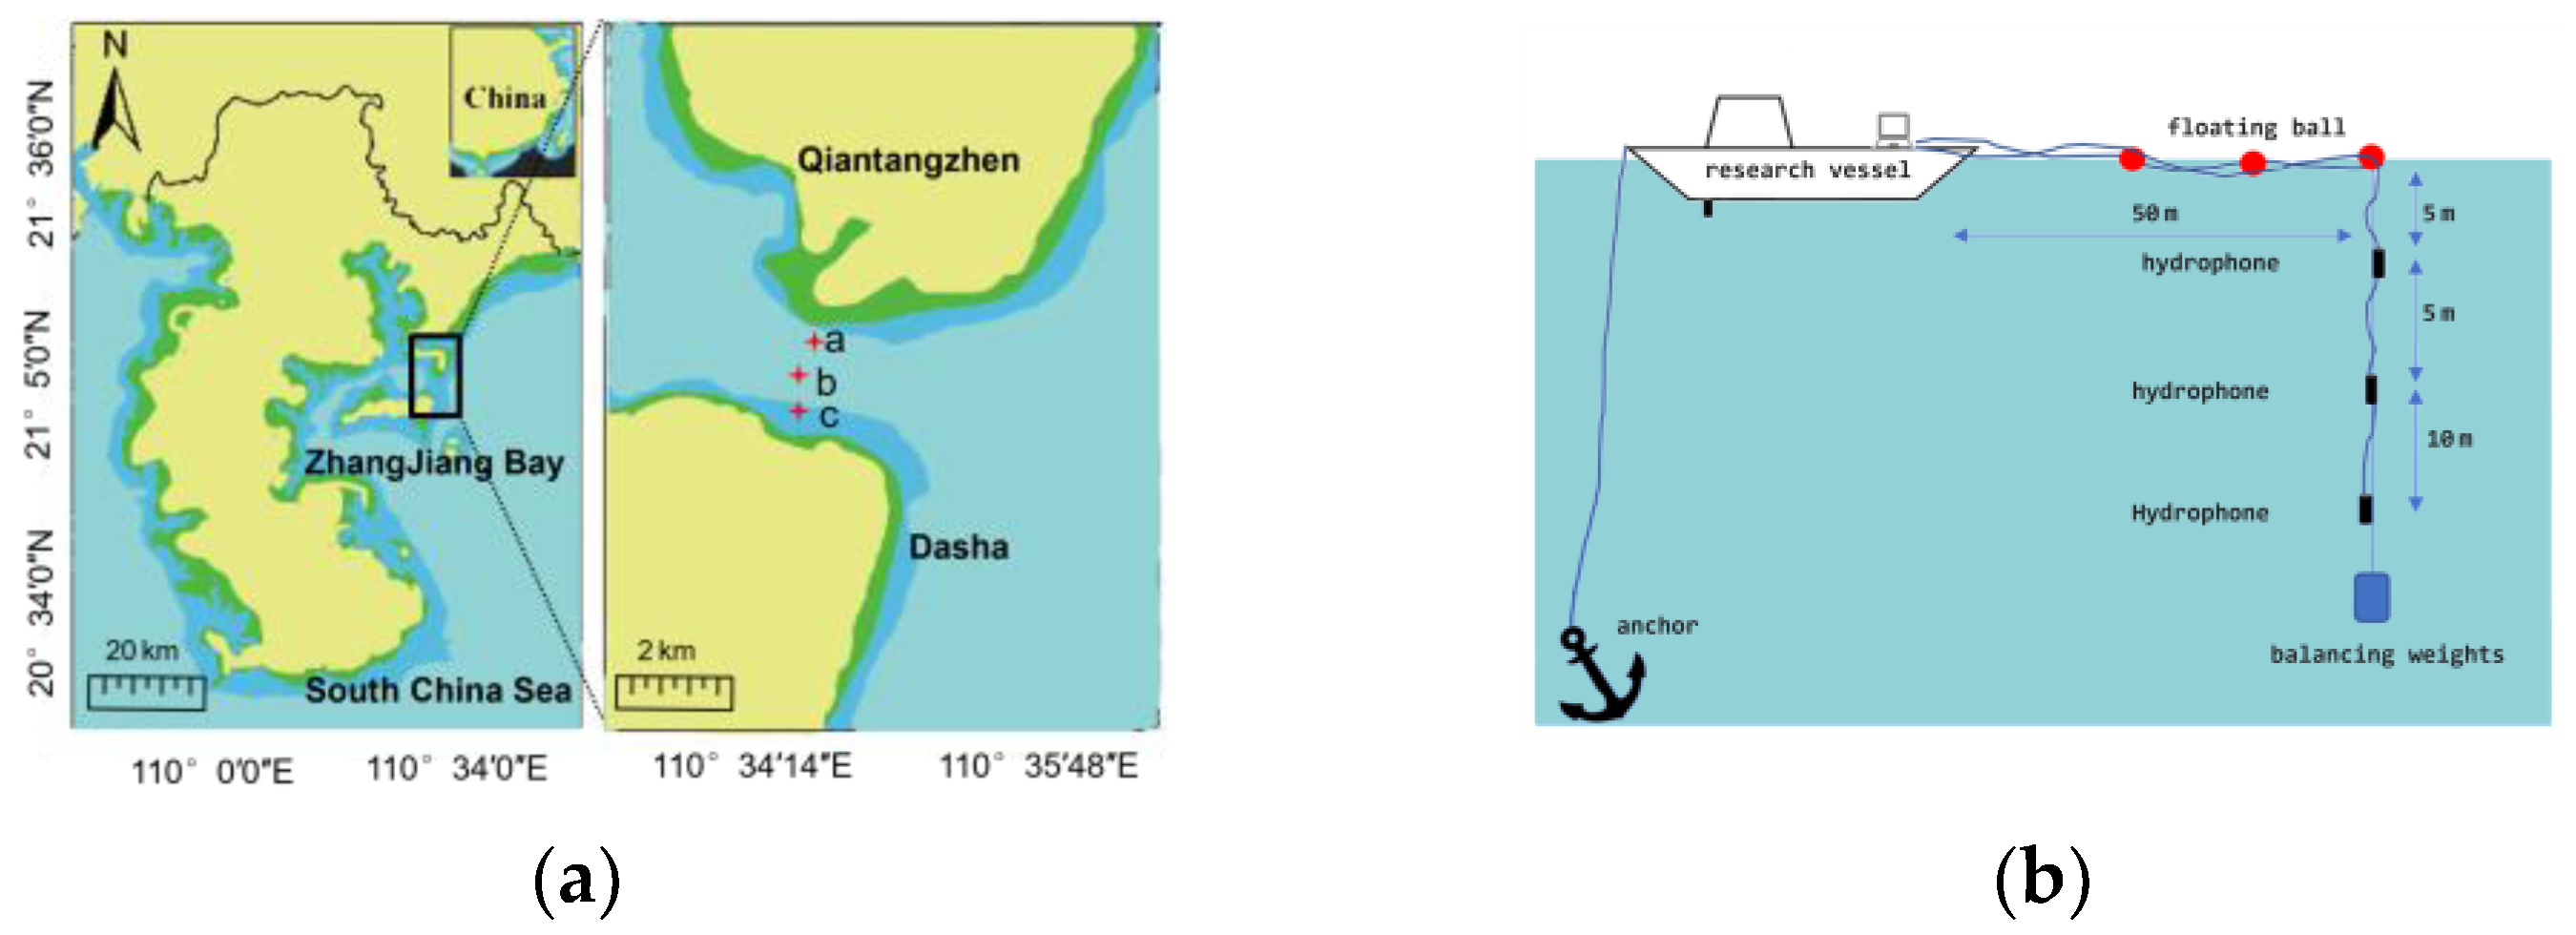
On 12 September 2022, and 21 March 2023, underwater noise data collection was conducted at three stations in Zhanjiang Bay. The locations of these stations are shown in
Figure 1a, and detailed information regarding the latitude, longitude, and deployment time of the hydrophones is recorded in
Table 1. On the day of the experiment, the weather conditions in the area were cloudy with a southeasterly wind of 3 m/s, and the wave conditions ranged from light to moderate. TS-ZRSTQ-03 self-contained hydrophones and TC4037 hydrophones from the REASON company were used for the experiment, and hydrophones were calibrated using the standard hydrophone comparison method prior to the experiment. The voltage sensitivity of TS-ZRSTQ-03 was −198 dB re:1 V/μPa, with a preamplifier gain of 50 dB. The sensitivity of the TC4037 was approximately −192 dB, with an instrument gain of 40 dB. Both types of hydrophones had a sampling frequency of 100 kHz.
Three cross-sections within the bay were selected as the stations based on the actual water depth, as shown in
Figure 1b. According to the requirements of the GBT5262-2009 [
26] Acoustic Underwater Noise Testing Standard 5.4, the data recording length could be determined based on actual needs, though generally it should not be less than 2 min. To meet this requirement, data collection was conducted during two different seasons at representative times. Each time, three stations were measured for 5 min. On 12 September 2022 (autumn), two hydrophones were deployed in the bay to collect noise data at the surface and mid-depth, with hydrophone depths of 5 m and 10 m, respectively. On 21 March 2023 (spring), three hydrophones were deployed to collect noise data at the surface, mid-depth, and deep layers, with hydrophone depths of 5 m, 10 m, and 20 m, respectively. Four tests were conducted at each station. After the vessel arrived at the designated area, the vessel engine was turned off, and self-contained hydrophones were activated and placed in the water for data collection. Detailed information is shown in
Table 1. In addition, tidal information for both experiments was obtained from the China National Marine Data Center.
3.2. Data Processing
The acoustic data collected from two experiments were analyzed using MATLAB. The measured data were segmented, and the frequency characteristics were calculated for each time segment. The spectral density of all windows was averaged to obtain the average spectral density for each frequency. The specific processing steps are as follows:
In Equation (1),
i = 1, 2, 3, …
N − 1,
N represents the number of points, and
fs is the sampling frequency of the hydrophone. In Equation (2),
F is the Fourier transform of the discrete signal. The window function is the Hann window, with a window shift of 50%. The duration for each frame of data is 1 s. In Equation (3),
M represents the sensitivity of the hydrophone.
In Equation (4), represents the sound pressure level in the i-th frequency band, , with a frequency of 1 Hz.
By calculating the correlation coefficient of all frequency pairs, we could understand the contribution of different sound sources to the sound field at various frequencies. The Pearson correlation coefficient for any frequency pair can be calculated using the following Equations (6)–(8):
Here, covariance and the standard deviation are denoted as
i and
j, respectively:
In Equations (7) and (8), and are the power spectral densities of the corresponding frequency bands after Fourier transformation, and and represent the average power spectral density for all time in that frequency band.
4. Results
4.1. Analysis of Noise Spectrum in a Bay Environment
Figure 2 and
Figure 3 illustrate the variations in underwater environmental noise and tidal changes that occurred on the day of the experiment. The horizontal axis represents time, the left vertical axis represents frequency, and the right vertical axis represents tidal information. The brightness of the images represents the sound pressure level. In the first experiment, collected noise data showed significant variations in the wideband sound pressure level at a range of 50–90 dB throughout the underwater observation period. This high energy was mainly concentrated in a frequency range below 1000 Hz, where the sound pressure level exhibited noticeable fluctuations. As the frequency increased above 1000 Hz, the noise strength gradually decreased and eventually exhibited relatively stable spectral characteristics. The tidal level was initially at a low point at the start of the experiment before reaching its highest point around noon and then beginning to recede.
Comparing the noise data collected in the spring and autumn experiments, both experiments showed a certain correlation between oceanic environmental noise and tidal changes. Throughout the underwater observation period, the brightness information in time–frequency plots and the distribution of sound pressure levels indicated that the sound pressure level in spring was slightly higher compared to autumn.
To display the frequency domain characteristics of underwater noise signals, the distribution of sound pressure levels for each station was computed within a 5-min interval.
Figure 4 and
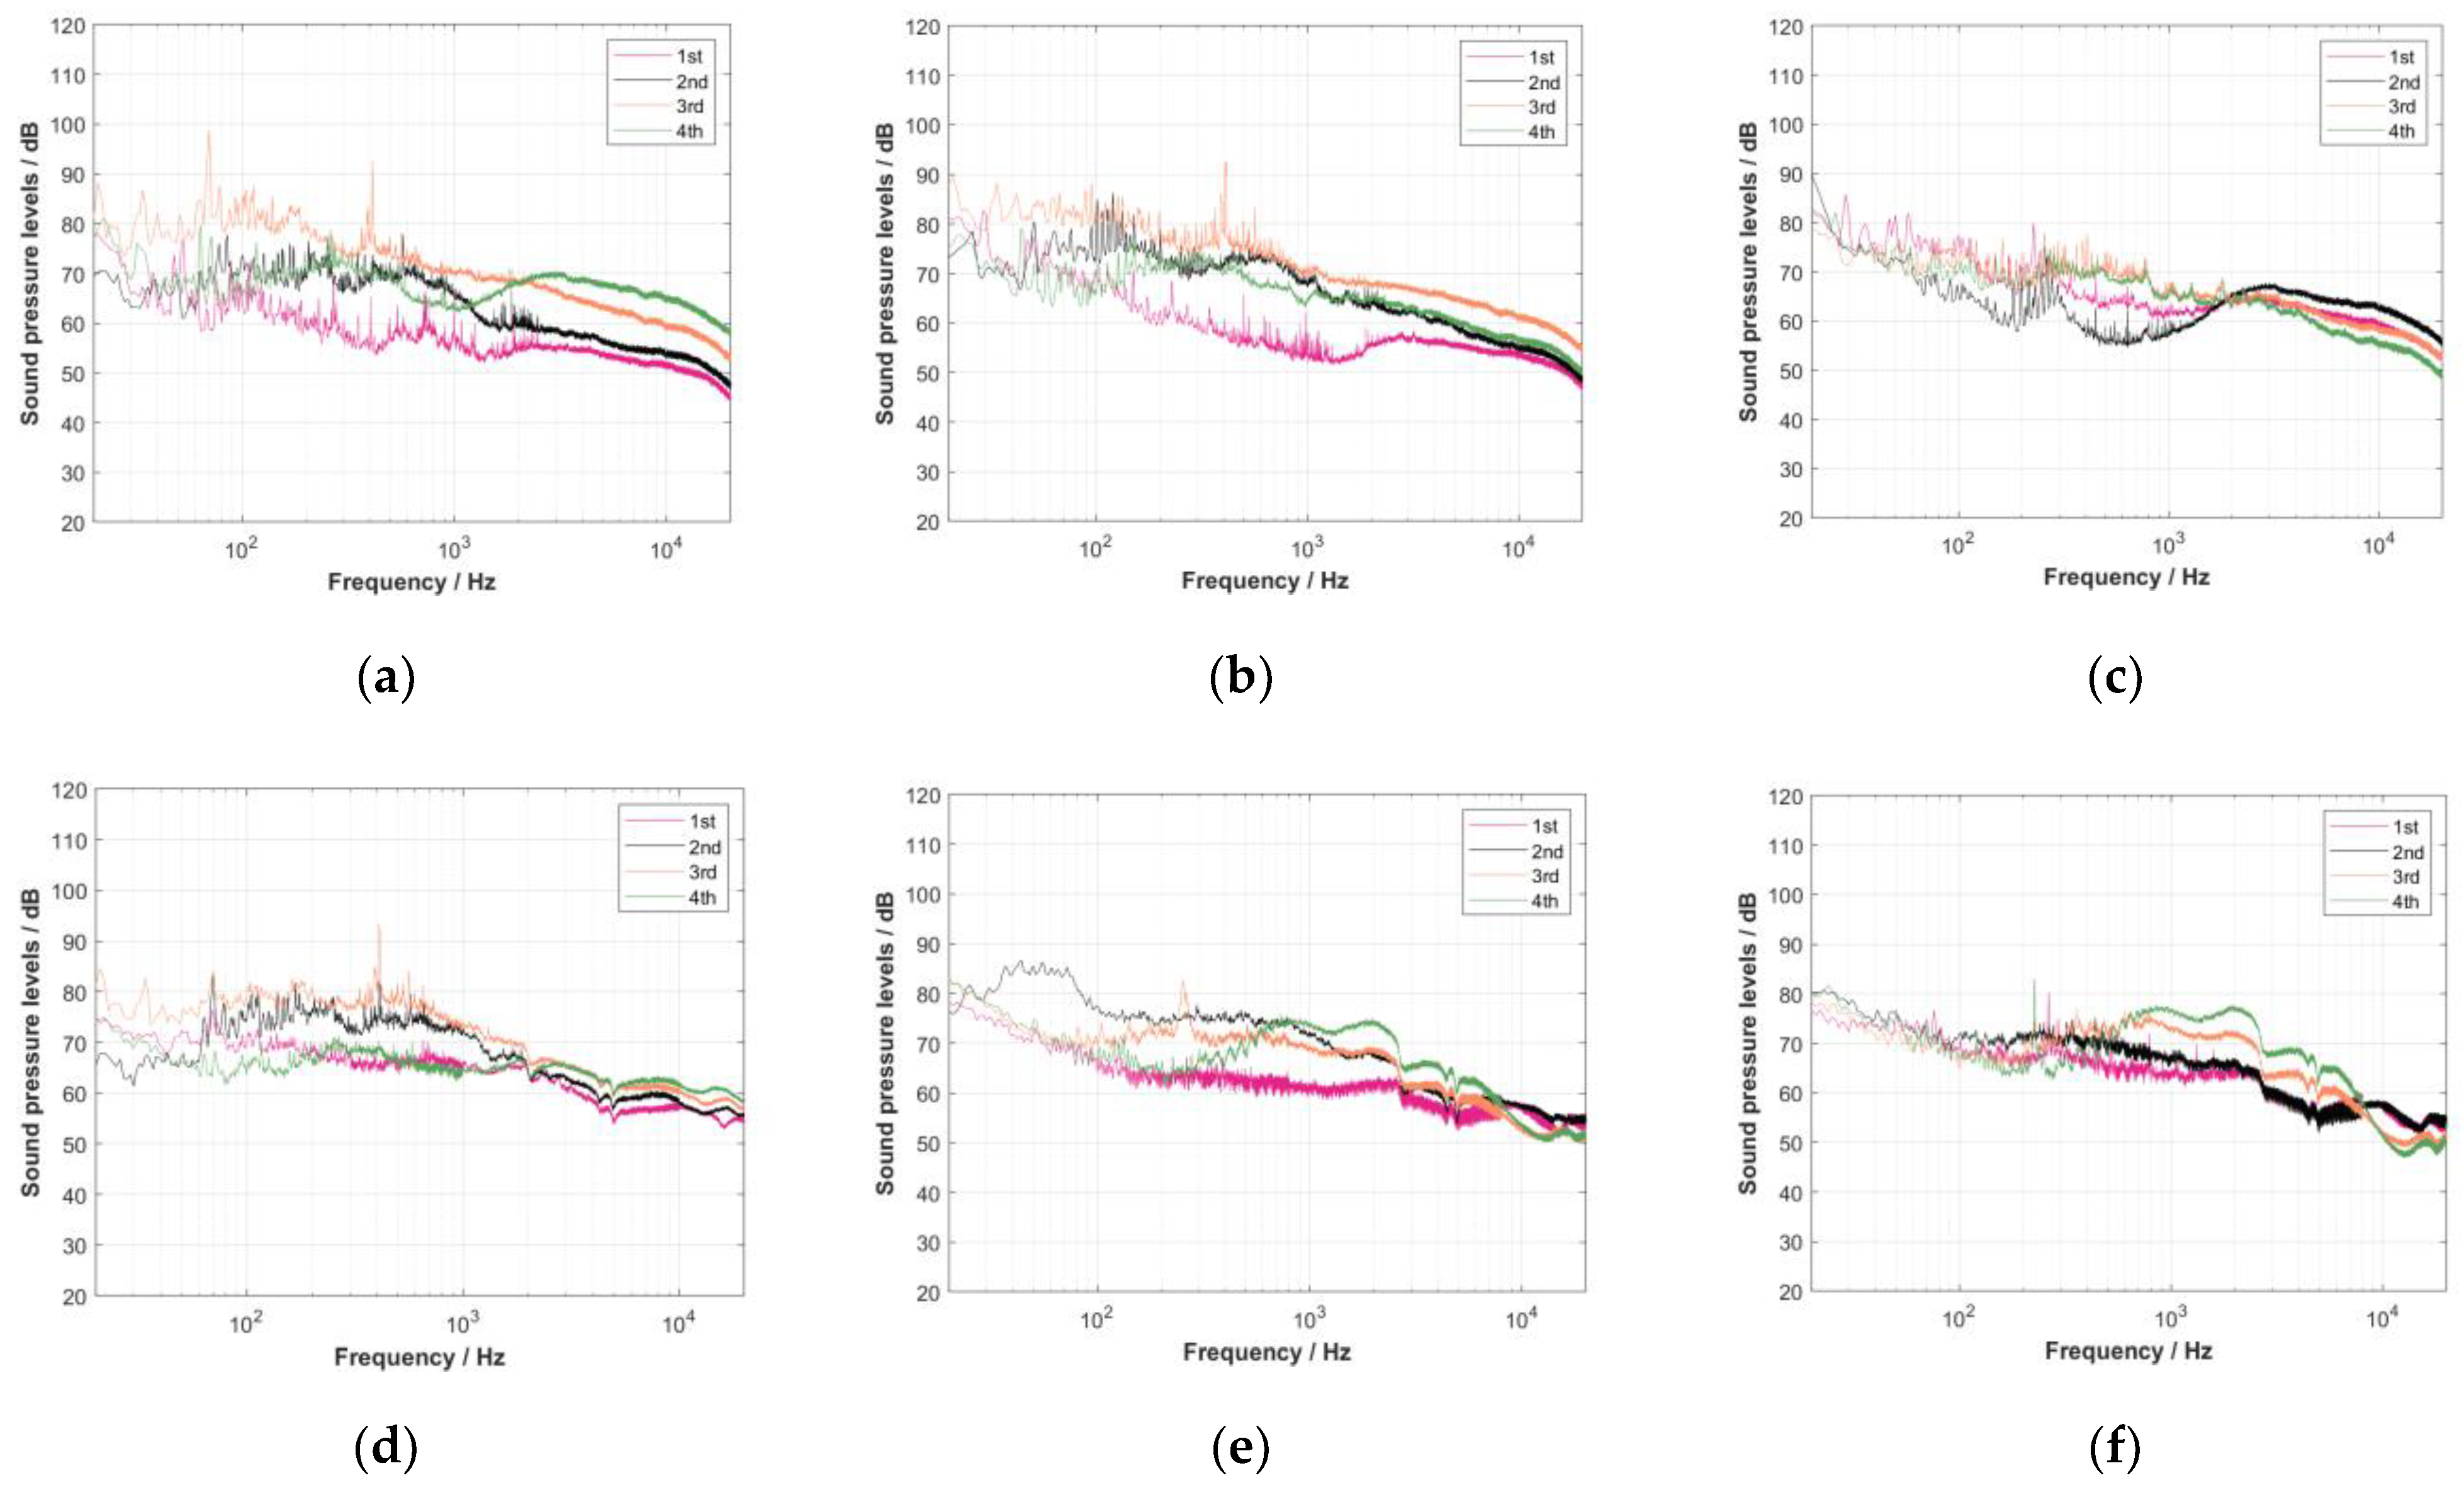
Figure 5 illustrate the sound pressure level curves based on four measurements at each station; a curve depicting sound pressure level versus frequency was plotted. However, the frequency spectrum of underwater noise is shown in
Figure 4 and
Figure 5. It can be observed from this figure that high-energy signals were mainly concentrated in the frequency range below 1000 Hz, while the energy distribution in the high-frequency range fluctuated greatly, indicating that the underwater noise in this study area was mainly concentrated in the low-frequency band. As this frequency increased, the sound pressure level gradually decreased. When the frequency exceeded 1000 Hz, the noise-sound pressure level in the environment tended to stabilize around 40–60 dB.
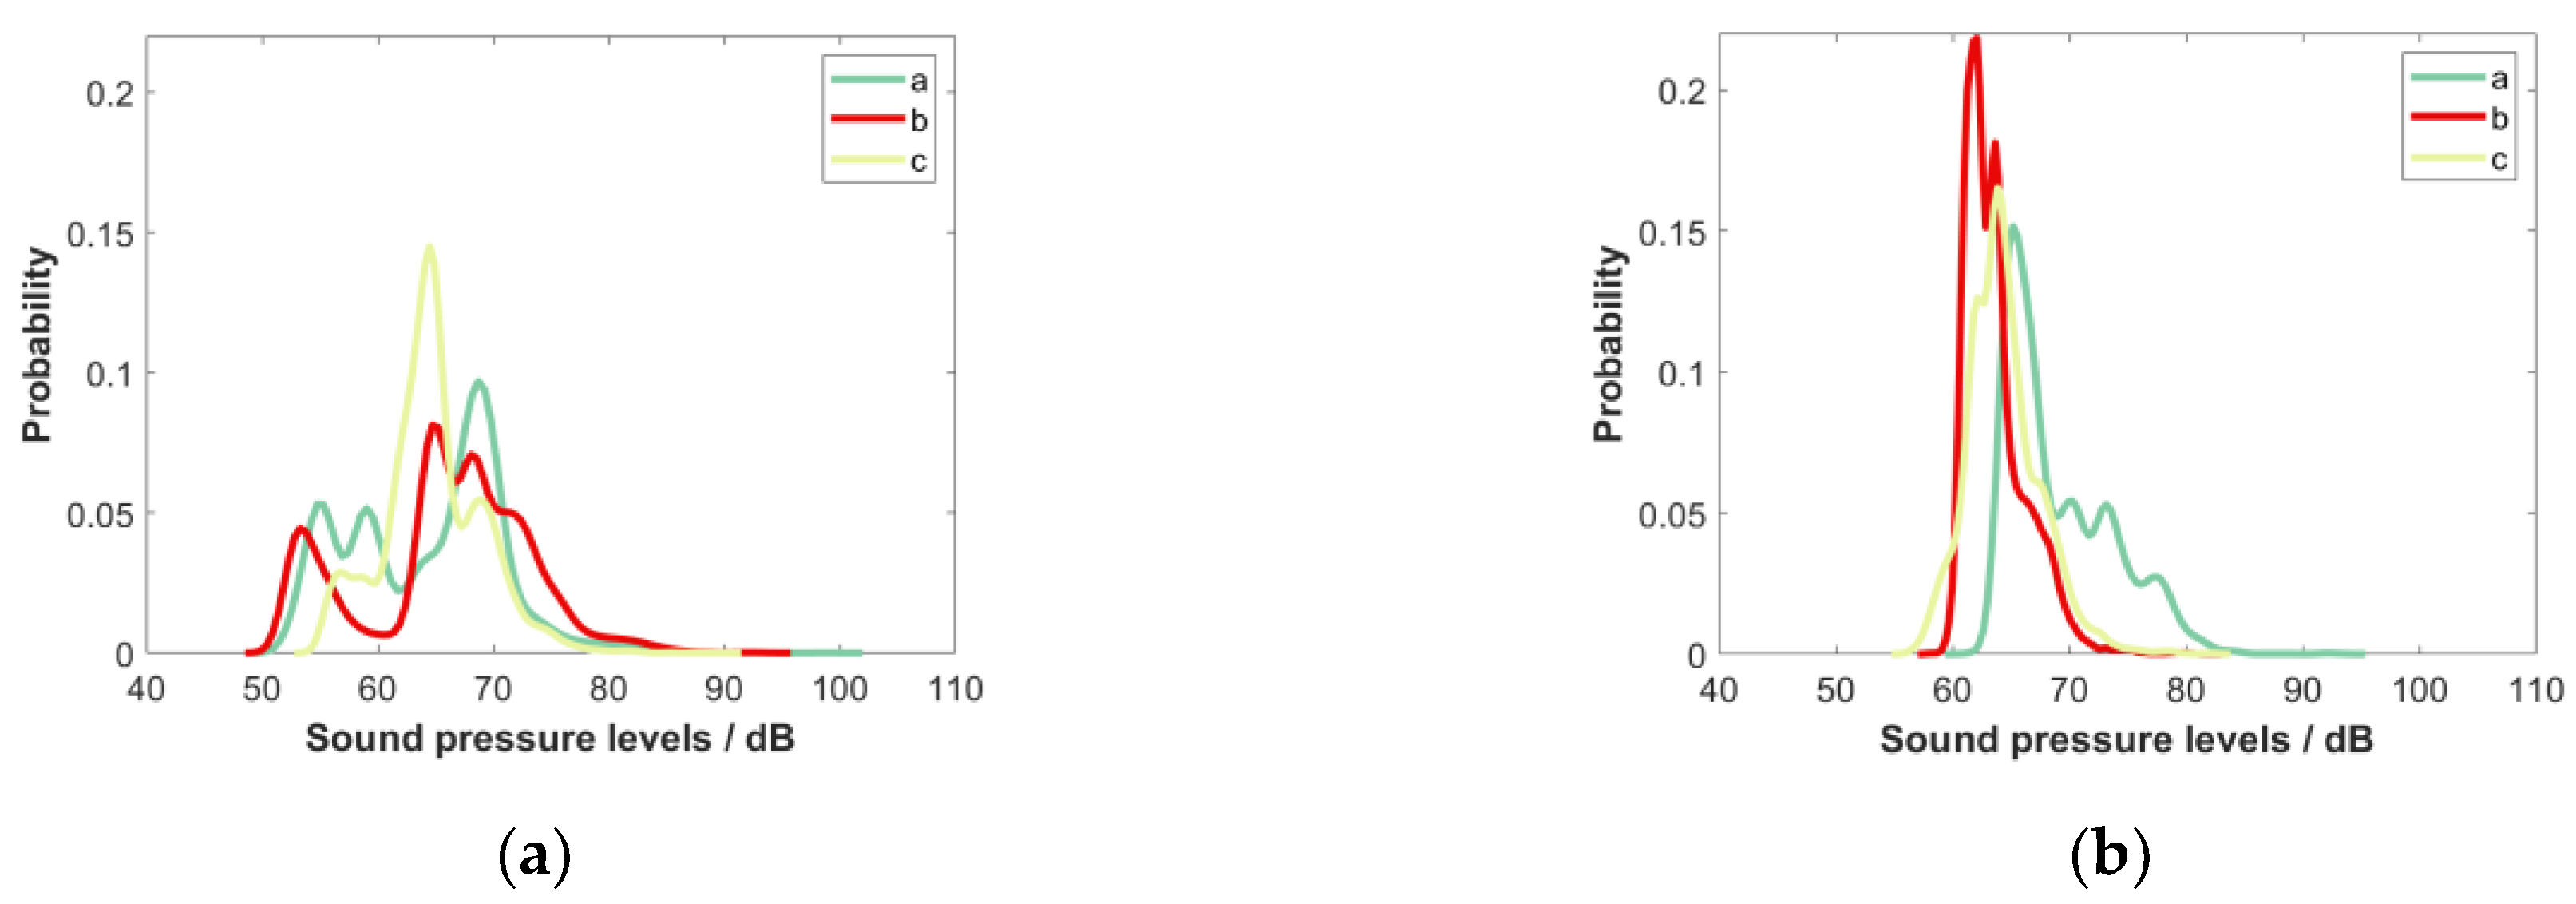
Figure 6 shows the statistical characteristics of noise data from four measurements at each station in autumn. It can be seen from the figure that the probability peak distribution at the same station varied significantly with water depth. The sound pressure level probability range at a 5 m water depth was approximately 53 dB to 77 dB, and the sound pressure level corresponding to the probability peak for the three stations was approximately 69.1 dB, 63.6 dB, and 67.3 dB. Conversely, the probability peak of the sound pressure level at a 10 m water depth was concentrated in the range of about 61 dB to 79 dB, and the sound pressure level corresponding to the probability peak for the three stations was approximately 68.7 dB, 68.5 dB, and 68.8 dB.
Table 2 contains detailed statistical distribution parameters.
Figure 7 shows the statistical characteristics of noise data measured four times at each station in the spring. Similar to the probability peak distribution characteristics of autumn stations, the probability peak distribution of the same station varied significantly with water depth. Each station showcases three distinct probability peaks. The probability range of the sound pressure level at a depth of 5 m at about 61–79 dB, and the probability peak for the three stations was approximately 70 dB, 73.5 dB, 75.2 dB; the probability peak of sound pressure level at a depth of 10 m was concentrated in the range of 62–81 dB, where the peaks were 75.7 dB, 79.8 dB, 82.4 dB; and the probability peak of the sound pressure level at a depth of 20 m was concentrated in the range of 60–78 dB, where the peak were 71.4 dB, 70.9 dB, 74.5 dB.
Table 2 presents the statistical characteristics of probability for two sets of experimental data with a confidence level of 85%. From this table, it can be observed that the probability peak sound pressure in spring is significantly higher than that in autumn, and the probability range in spring shifted toward the right compared to autumn. The probability peaks of sound pressure levels at the same station and at different depths are relatively close, while the probability curve distributions are similar.
4.2. Tidal Level and Sound Pressure Level Characteristics
On 12 September 2022, the experimental testing period was from 8:00 a.m. to 4:00 p.m.. The tidal pattern in Zhanjiang Bay on that day was a semi-diurnal tide in autumn. At 8:00 a.m., the tidal level was 132 cm, gradually rising to 310 cm during the rising tide process. Around noon, at 12:00 p.m., the tidal level reached its peak at 420 cm. Subsequently, the tidal level began to gradually decrease and reached 173 cm at 4:00 p.m., as shown in
Figure 8a. On 21 March 2023, the experimental testing period was from 9:00 a.m. to 5:00 p.m. The tidal pattern on that day was the same as in autumn. At 9:00 a.m., the tidal level was 214 cm, gradually rising to 279 cm during the rising tide process. Around 12:00 a.m., the tidal level reached its peak at 325 cm. Subsequently, the tidal level began to gradually decrease and dropped below 82 cm at 5:00 p.m., as shown in
Figure 8b.
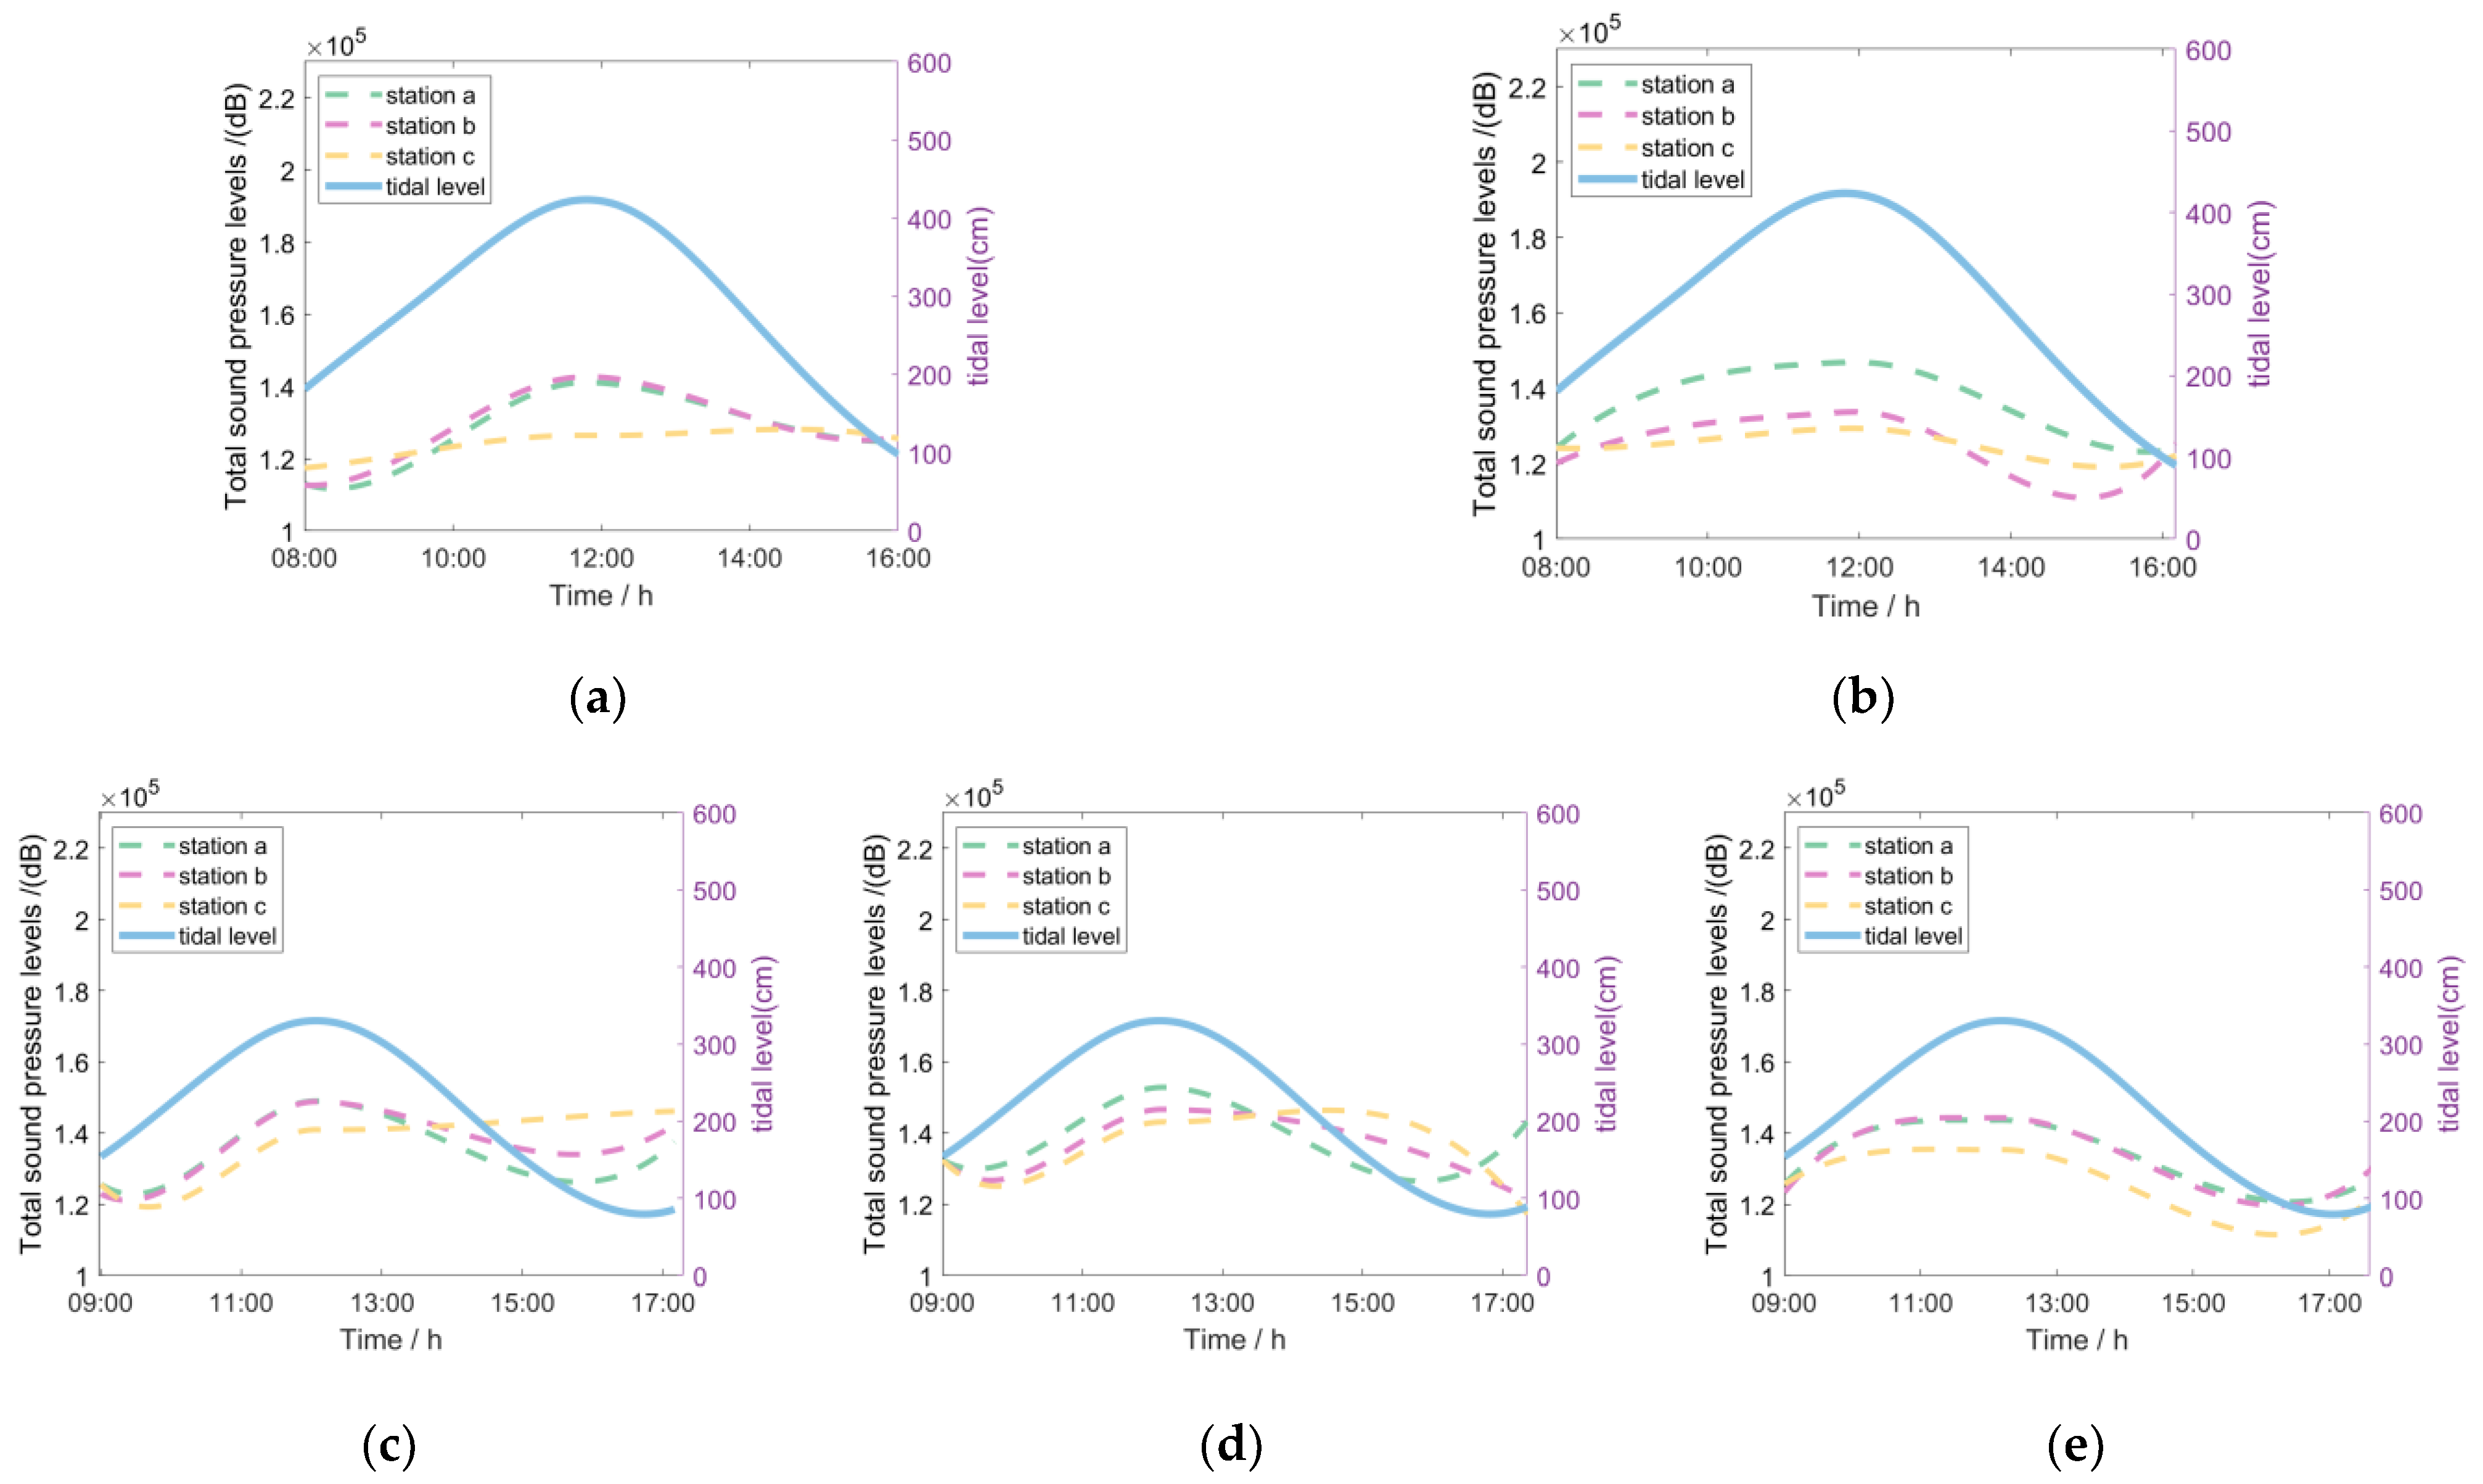
As shown in
Figure 9, the variations in the sum of sound pressure level and tidal level at different depths during the two experiments are presented. There is a clear correlation between the total sound pressure level and the tidal level in this water area. At the beginning of the experiment, during the low tide phase, the total sound pressure level of the marine environmental noise was at its lowest point, indicating an approaching rising tide. As time progressed and during the third measurement at 12:00, the tidal level reached its peak, and the total sound pressure level indicated the highest level of marine environmental noise. In the fourth measurement, as the tide began to ebb, the intensity of total sound gradually decreased.
5. Discussion
Figure 10 and
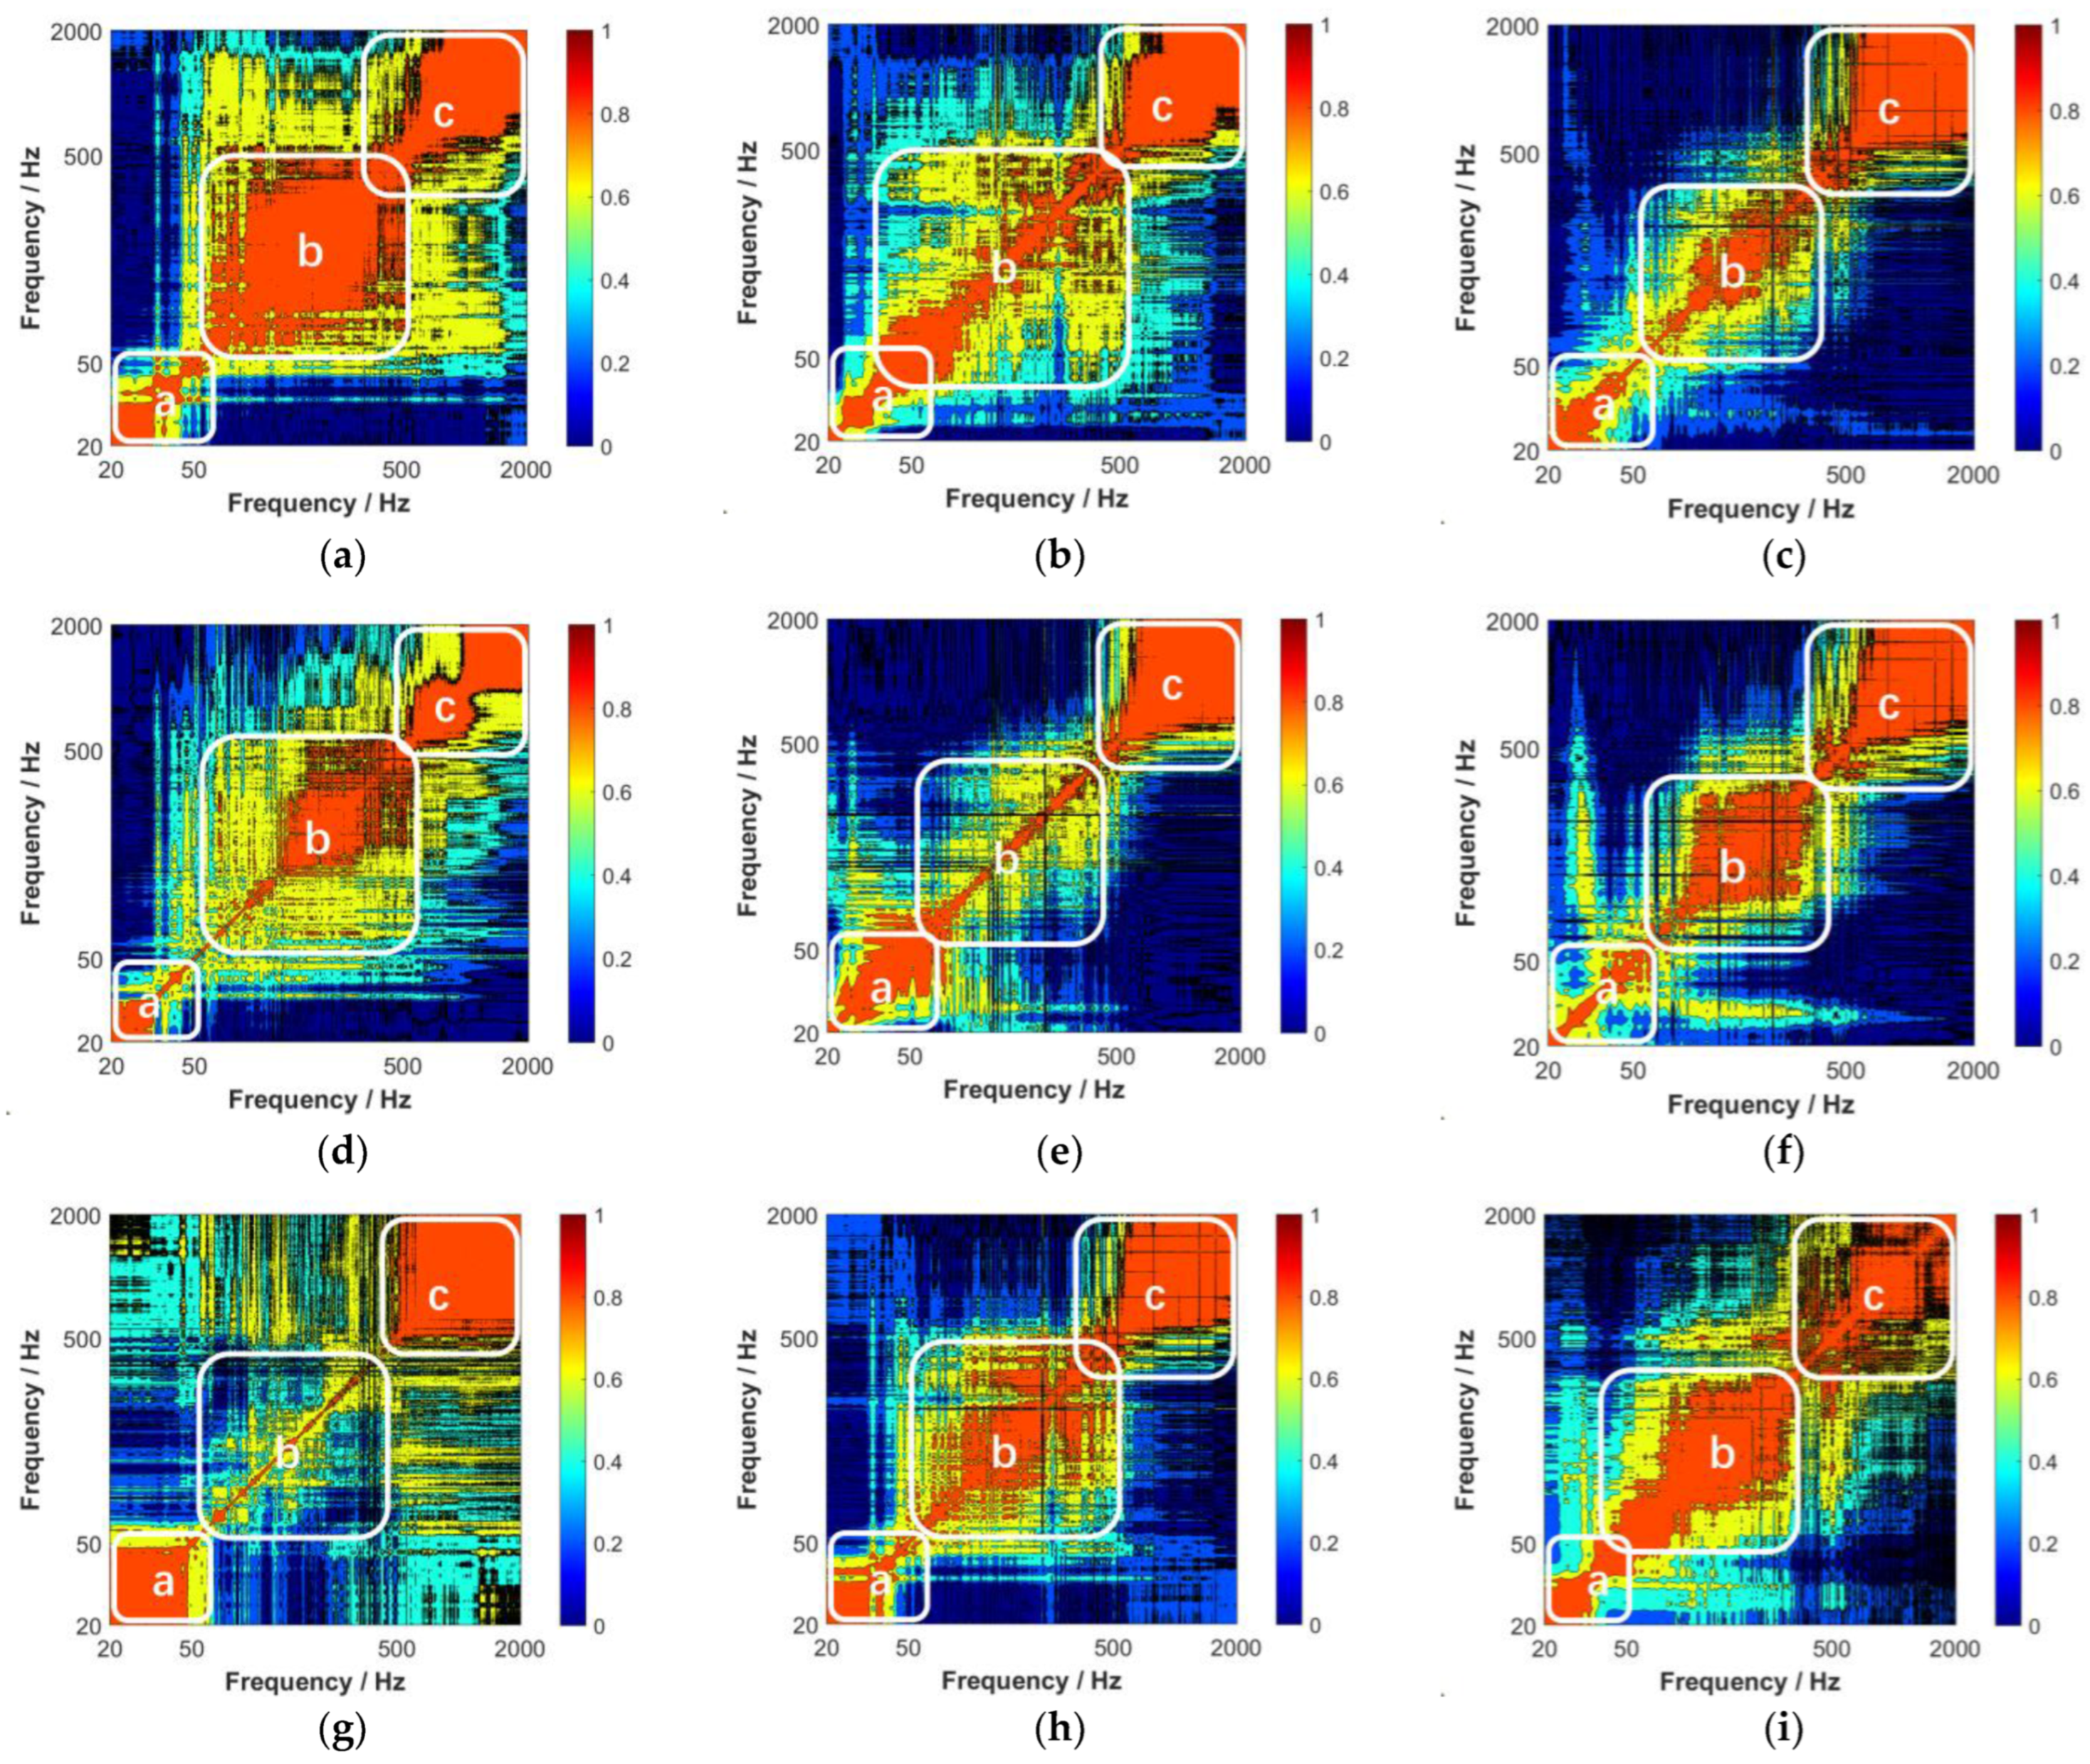
Figure 11 show the noise frequency correlation matrices for the four measurements at each station for the two experiments. The values in the correlation matrices represent the correlation between each frequency. As expected, the elements on the diagonal are always the largest, indicating a correlation coefficient of one for the same frequency. This image is symmetric about the diagonal, and both the horizontal and vertical axes of the correlation matrix follow a general trend. With the horizontal (or vertical) axis unchanged, the correlation coefficient decreases as the vertical (or horizontal) axis increases. This suggests that as the frequency difference increases, the correlation between frequencies decreases, and the probability that these two frequencies originate from the same noise source also decreases. Different regions are identified in this figure, such as regions a, b, and c in
Figure 10 and
Figure 11. The correlation coefficients within these regions are all greater than 0.7, indicating that the signals within this frequency range contain a persistent and stable noise component, which exhibits a strong correlation within this frequency range.
Based on the values of the correlation matrix, it is evident from the figure that regions a and c appear consistently stable in noise data from different station measurements, regardless of time and depth. On the other hand, region b shows significant variations, with noticeable changes in frequency bandwidth among different noise measurements, indicating the greater influence of time and space. This suggests that within region a (with a frequency range less than 50 Hz), the signal contains a persistent and stable noise component with fewer factors affecting its frequency bandwidth variation. On the other hand, region c (with a frequency range greater than 500 Hz) appears stable in the experiment; however, it is still influenced by certain factors, resulting in small fluctuations in the frequency correlation matrix within this region. The frequency ranges of 50 Hz and 500 Hz (region b) are influenced by multiple factors. These factors cause the correlation coefficient within this frequency range to undergo irregular changes between 50 Hz and 500 Hz.
Region b can be explained as a mixture of broadband components from wind noise and nearby ship noise, resulting in many strongly correlated narrowband components within this frequency range. Considering the experimental water area, the main influencing factors are ship noise in the water area, wave propagation caused by distant large ships, and wind-generated noise. When the frequency exceeds 500 Hz, this part of natural noise is directly related to the sea conditions, with surface roughness and wind speed directly affecting high-frequency noise. The tidal dynamics in Zhanjiang Bay show significant variations in flow velocity along the cross-section, resulting in low-frequency noise from bottom friction and horizontal layer friction, which rapidly attenuates in water. Additionally, tidal-induced changes in hydrostatic pressure also generate low-frequency noise.
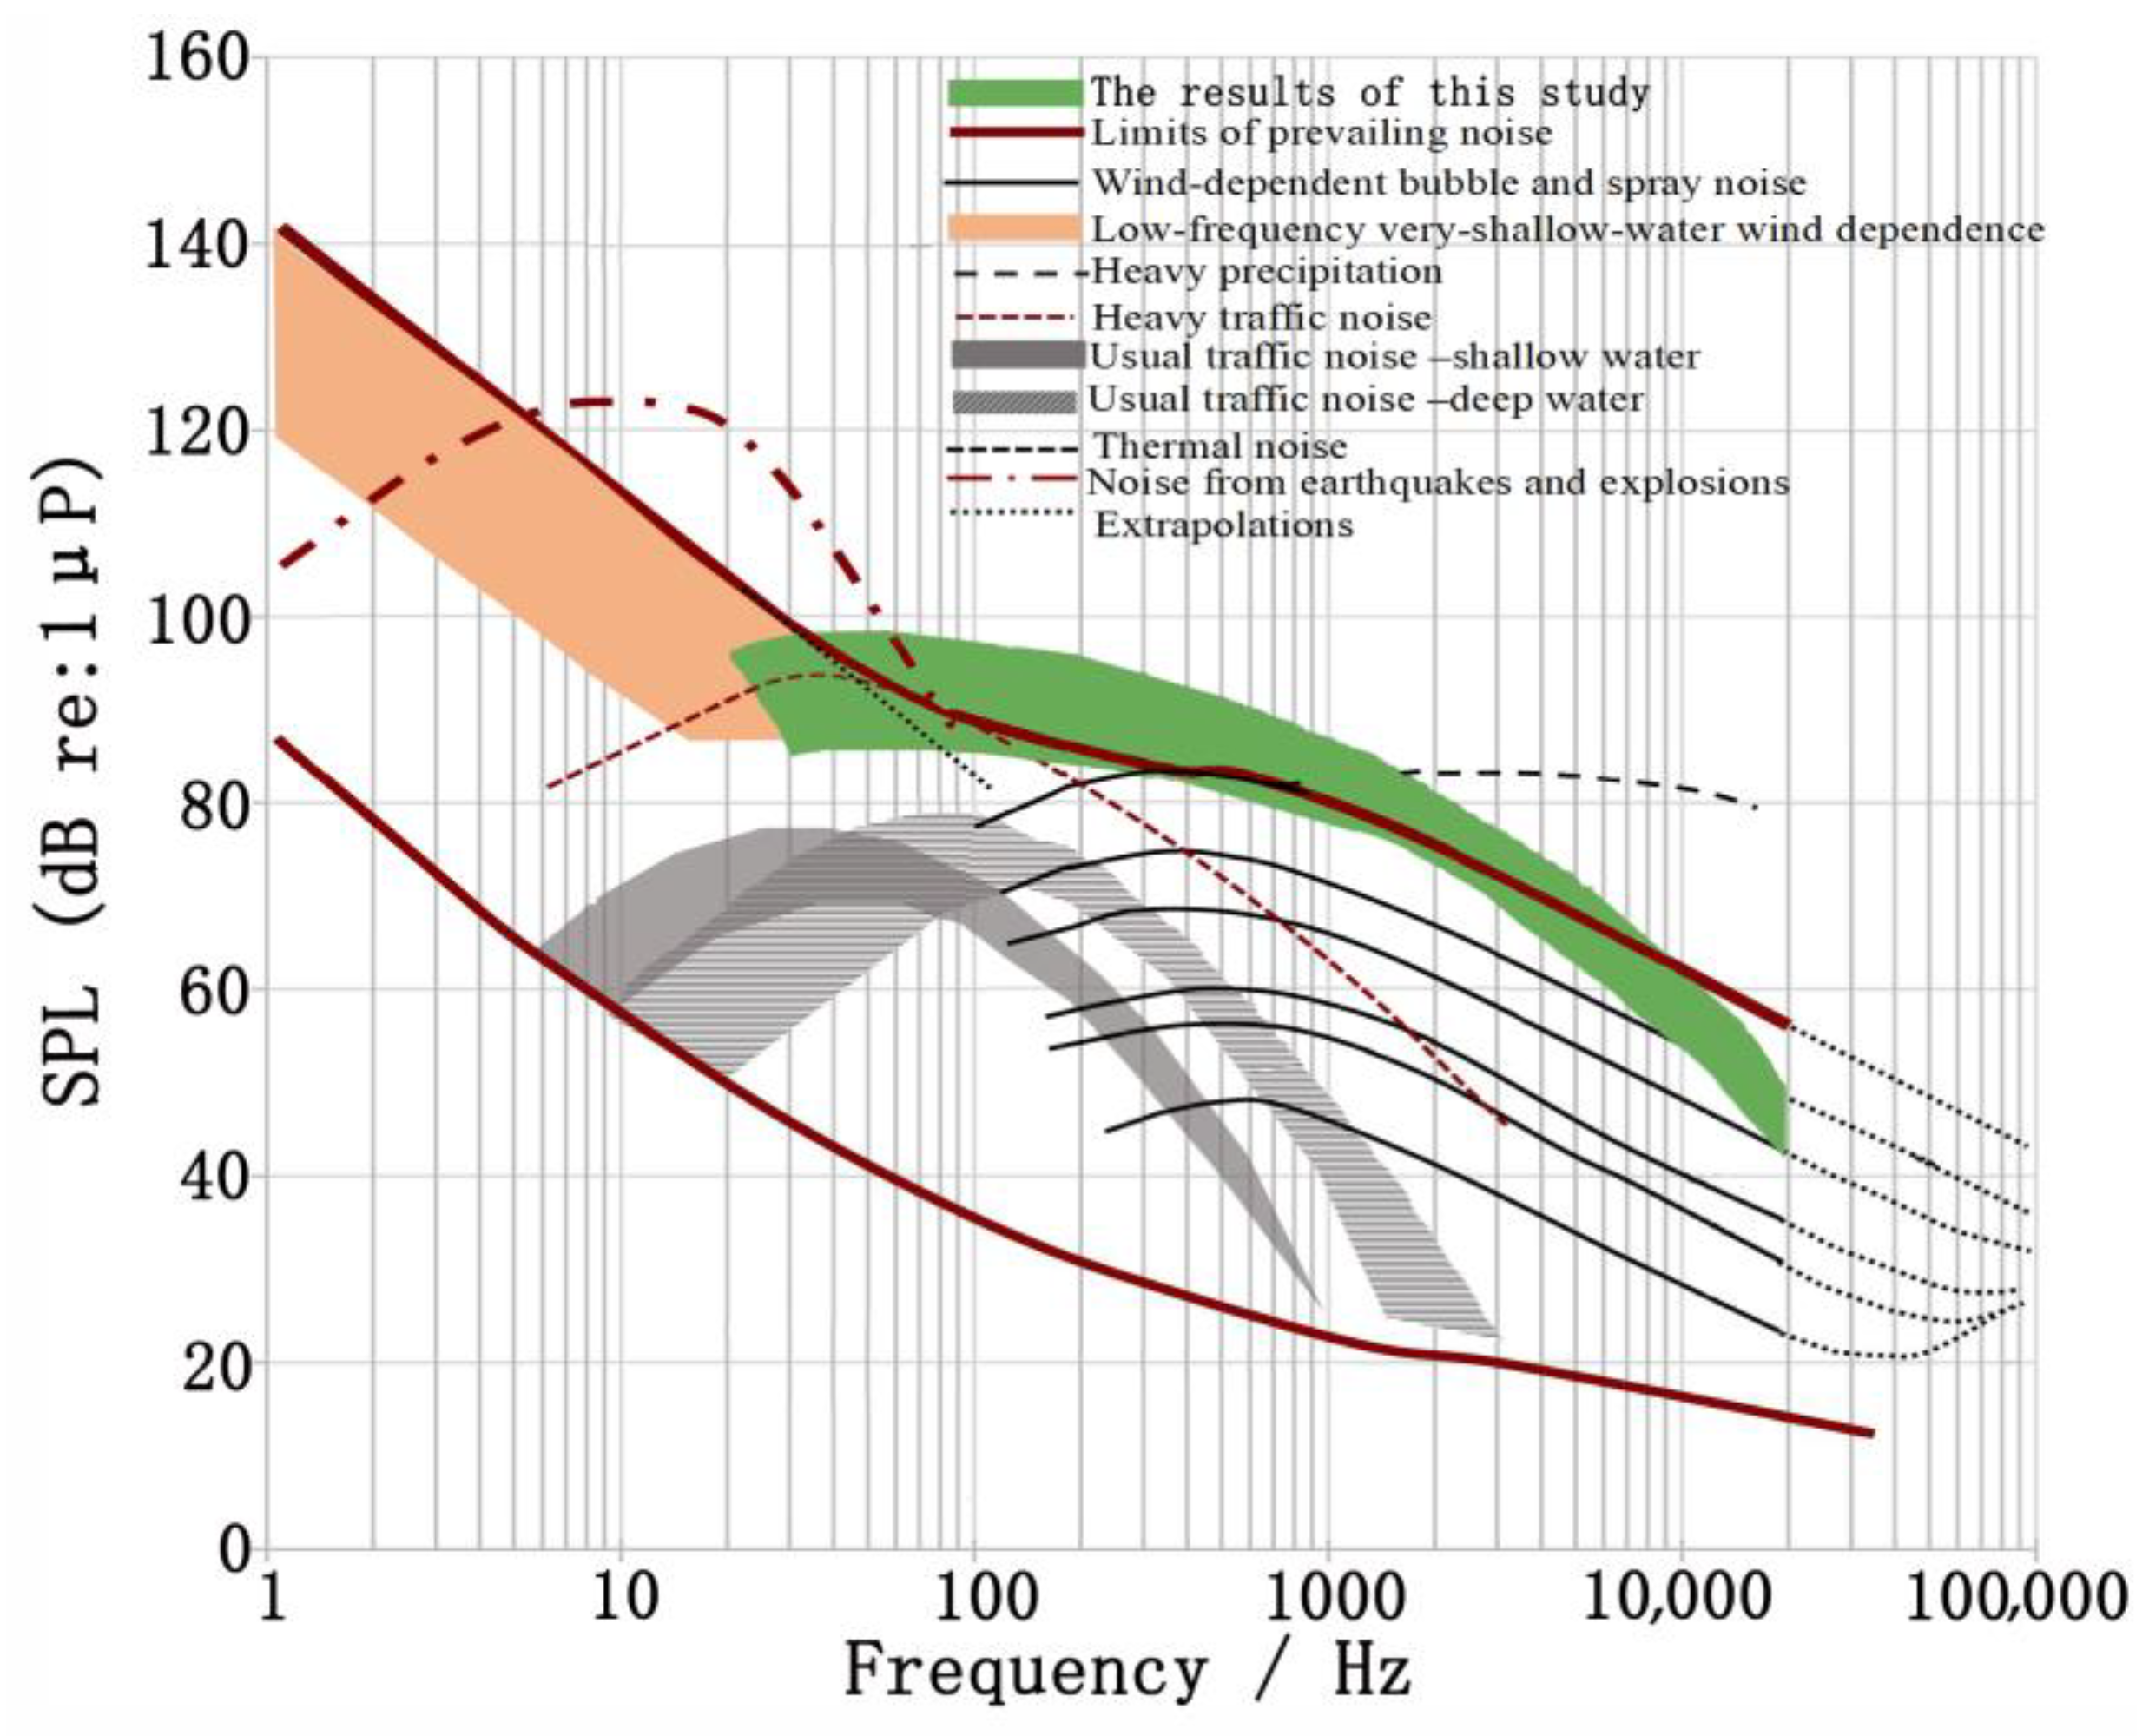
In
Figure 12, the underwater noise and sound pressure levels of the two experiments are calculated, and their values are compared with the Wenz spectrum. The experimental data are represented by the green curve. The results show that the underwater noise level in Zhanjiang Bay is significantly higher than the shallow water noise curve in this figure, with a difference of about 20 dB. This difference can be attributed to the fact that the maximum depth of the experimental area in this study was about 25 m, which is much smaller than the 183 m defined by the Wenz spectrum for the shallow water area. The complex terrain and topography also result in more frequent and intense relative motions in the seawater in this area, making it easier for the periodic motion of waves to superimpose the effect of coastal currents, generating low-frequency noise in the shallow water area. This also leads to a significantly higher noise level in this water area compared to the theoretical values in the figure. The low-frequency noise generated by these hydrodynamic processes has a good correlation with the tidal level, and the noise level fluctuates with the tidal level.
Wenz provides a detailed description of the general laws of deep-sea ocean environmental noise, while the mechanism of noise sources in shallow water environments is complex and requires specific area observations to explain the causes of noise. It should be noted that this study only focuses on the case study of environmental noise characteristics of the semi-diurnal tidal period in Zhanjiang Bay’s entrance area, and there are many other influencing factors, such as construction noise from large-scale construction sites in the northern part of the East China Sea Island and the noise from large cargo ships sailing and docking at the port. The influencing factors of shallow-water ocean environmental noise are numerous, and the mechanisms are more complex. Future research should focus on the following points: (1) conducting directional noise characteristic tests and coupling analysis for different noise sources; (2) analyzing the environmental noise characteristics of different water-crossing sections in Zhanjiang Bay; and (3) comparing and analyzing the environmental noise characteristics of bays with different terrain backgrounds.
6. Conclusions
Environmental noise in the nearby water areas during these two experiments (autumn and spring) exhibited similar noise characteristics. The distribution of low-frequency noise (20–50 Hz) and high-frequency noise (greater than 500 Hz) in water areas remained stable, showing no significant changes with time and space. However, the mid-frequency noise (20 Hz–500 Hz) was greatly influenced by environmental and human factors, exhibiting noticeable differences at various times and locations. The statistical characteristics of these two experiments show that the probability peak distribution at the same station varied significantly with water depth, with each station containing three distinct probability peaks.
In the frequency range below 50 Hz, the causes of noise were very complex. In the study area, the main sources of noise were the tidal currents, which were affected by topography and resulted in significant differences in vertical tidal velocity. This generated turbulence and friction noise, including the low-frequency noise caused by tidal-induced changes in hydrostatic pressure. In the frequency range of 50–500 Hz, the mixed noise from ships and local wind sources was the main influencing factor. Both wind-generated noise and ship noise made significant contributions to the overall noise, with ship-related noise being the dominant component due to intensive maritime activities in this area. As the frequency increased above 500 Hz, the contribution of ship noise gradually decreased, and noise sources became more highly related to sea conditions, mainly consisting of natural noise. The noise in this frequency range had higher frequencies and longer durations, exhibiting smoother fluctuations in the time domain.
The hydrodynamic noise caused by tidal variations had a significant impact on low-frequency noise in underwater areas near Zhanjiang Bay. During high tides, the water level rose, leading to an increase in the total sound pressure level in these water areas. Conversely, during low tides, the water level dropped, resulting in a corresponding decrease in the total sound pressure level. Additionally, human activities near the coast contributed significantly to noise in the nearby water areas. This finding is of great importance for the protection of marine ecosystems and the formulation of relevant management policies.
Author Contributions
Conceptualization, P.Z.; Data curation, X.H.; Formal analysis, X.H.; Funding acquisition, P.Z., G.L. and J.T.; Methodology, P.Z., Y.Y. and B.S.; Resources, P.Z., G.L. and J.T.; Software, X.H.; Supervision, G.L. and J.T.; Validation, Y.Y. and B.S.; Writing—original draft, X.H.; Writing—review & editing, G.L., J.T., Y.Y. and B.S. All authors have read and agreed to the published version of the manuscript.
Funding
This research was funded by the stable supporting fund of the Acoustics Science and Technology Laboratory, grant number JCKYS2021604SSJS008, the National Natural Science Foundation of China, grant number 11974084, the National Natural Science Foundation of Guangdong Province, grant number 2022A1515011067, and the Guangdong Basic and Applied Basic Research Foundation, grant number 2022A1515240023.
Data Availability Statement
The general data are included in the article. Additional data are available on request.
Conflicts of Interest
The authors declare no conflict of interest.
References
- Wenz, G.M. Acoustic Ambient Noise in the Ocean: Spectra and Sources. J. Acoust. Soc. Am. 1962, 34, 1936–1956. [Google Scholar] [CrossRef]
- Yang, Q.L.; Yang, K.D. Seasonal Comparison of Underwater Ambient Noise Observed in the Deep Area of the South China Sea. Appl. Acoust. 2021, 172, 107672. [Google Scholar] [CrossRef]
- Zhu, F.W.; Zheng, G.Y.; Liu, F.C. Analysis of Spectral Characteristics of Winter Environmental Noise in the South China Sea. Acoust. Electron. Eng. 2021, 141, 10–13. [Google Scholar]
- Sun, J.P.; Lin, J.H.; Yi, X.J.; Jiang, P.F.; Li, N. Analysis on the spectral level characteristics of ship-associated ocean ambient noise in Qingdao offshore. Tech. Acoust. 2022, 41, 432–435. [Google Scholar] [CrossRef]
- Pieretti, N.; Lo Martire, M.; Corinaldesi, C.; Musco, L.; Dell’Anno, A.; Danovaro, R. Anthropogenic Noise and Biological Sounds in a Heavily Industrialized Coastal Area (Gulf of Naples, Mediterranean Sea). Mar. Environ. Res. 2020, 159, 105002. [Google Scholar] [CrossRef] [PubMed]
- Bittencourt, L.; Barbosa, M.; Bisi, T.L.; Lailson-Brito, J., Jr.; Azevedo, A.F. Anthropogenic Noise Influences on Marine Soundscape Variability across Coastal Areas. Mar. Pollut. Bull. 2020, 160, 111648. [Google Scholar] [CrossRef] [PubMed]
- Soares, C.; Pacheco, A.; Zabel, F.; González-Goberña, E.; Sequiera, C. Baseline Assessment of Underwater Noise in the Ria Formosa. Mar. Pollut. Bull. 2021, 150, 110731. [Google Scholar] [CrossRef]
- Dosso, S.E.; Chapman, N.R. Measurement and modeling of downslope acoustic propagation loss over a continental slope. J. Acoust. Soc. Am. 1987, 81, 258–268. [Google Scholar] [CrossRef]
- Bagočius, D.; Aleksas, N. The Underwater Sound Levels of Lithuanian Marine Harbour. Mar. Pollut. Bull. 2022, 185, 114335. [Google Scholar] [CrossRef]
- Merchant, N.D.; Putland, R.L.; André, M.; Baudin, E.; Felli, M.; Slabbekoorn, H.; Dekeling, R. A Decade of Underwater Noise Research in Support of the European Marine Strategy Framework Directive. Ocean Coast. Manag. 2023, 228, 106299. [Google Scholar] [CrossRef]
- Liu, H.; Zhang, P.Z.; Shen, C.; Li, G.C.; Gao, S.Y. Short-time Characteristics of Acoustic Signals of Fish Farming in Large Cage. J. Guangdong Ocean Univ. 2023, 43, 17–25. [Google Scholar]
- Yang, C.-M.; Liu, Z.-W.; Lü, L.G.; Yang, G.-B.; Huang, L.-F.; Jiang, Y. Observation and comparison of tower vibration and underwater noise from offshore operational wind turbines in the East China Sea Bridge of Shanghai. J. Acoust. Soc. Am. 2018, 144, EL522–EL527. [Google Scholar] [CrossRef] [PubMed]
- Li, N.; Lin, J.H.; Hu, T.; Jiang, P.F.; Sun, J.P.; Yi, X.J.; Shan, Y.C. Analysis on the characteristics of ocean ambient noise in the East China Sea in summer. Tech. Acoust. 2022, 41, 460–464. [Google Scholar] [CrossRef]
- Hildebrand, J.A.; Frasier, K.E.; Baumann-Pickering, S.; Wiggins, S.M. An Empirical Model for Wind-Generated Ocean Noise. J. Acoust. Soc. Am. 2023, 149, 4516. [Google Scholar] [CrossRef] [PubMed]
- Dan, Y.; Lin, J.; Yi, X.; Jiang, P.; Sun, J.; Li, N. Vertical distribution and vertical directionality of ocean ambient noise in waters with islands and reefs. Acta Acust. 2021, 46, 1114–1123. [Google Scholar]
- Lajaunie, M.; Ollivier, B.; Ceyrac, L.; Dellong, D.; Le Courtois, F. Large-Scale Simulation of a Shipping Speed Limitation Measure in the Western Mediterranean Sea: Effects on Underwater Noise. J. Mar. Sci. Eng. 2023, 11, 251. [Google Scholar] [CrossRef]
- Shooter, J.A.; Demary, T.E.; Wittenborn, A.F. Depth dependence of noise resulting from ship traffic and wind. IEEE J. Ocean. Eng. 1990, 15, 292–298. [Google Scholar] [CrossRef]
- Wu, M. Research on the Spectrum Characteristics and Spatial Characteristics of Limited Data Noise in the North Yellow Sea. Master’s Thesis, Harbin Engineering University, Harbin, China, 2020. [Google Scholar]
- Friendly, M. Corrgrams: Exploratory Displays for Correlation Matrices. Am. Stat. 2002, 56, 316–324. Available online: http://www.jstor.org/stable/3087354 (accessed on 2 July 2020). [CrossRef]
- Li, H.; Guo, X.; Ma, L. Estimating structure and geoacoustic parameters of sub-bottom by using spatial characteristics of ocean ambient noise in shallow water. Acta Phys. Sin. 2019, 68, 160–171. [Google Scholar] [CrossRef]
- Zhang, P.Z.; Wang, B.; Ou, C.L. Suppression of Interference by Direct Arrival Wave Using Dynamic Time Warping Method. J. Guangdong Ocean. Univ. 2015, 35, 77–81. [Google Scholar]
- Zhou, J.B. Analysis of Ambient Noise Spectrum Level Correlation Characteristics in the China Sea. IEEE Access 2020, 8, 7217–7226. [Google Scholar] [CrossRef]
- Li, S.H. Impacts of Reclamation on the Erosion and Deposition at the Coast of Zhanjiang Bay Entrance. Ph.D. Thesis, The First Institute of Oceanography, Qingdao, China, 2013. [Google Scholar]
- Xie, H.L.; Yang, C.S.; Han, Z.Y.; Zou, S.H.; Li, H.Y.; Zhang, N. Study on the characteristic and causes of the Deep-water channel siltation outside Zhanjiang Bay. J. Waterw. Harb. 2023, 44, 47–52. [Google Scholar]
- Li, G.J.; Hu, J.P. Numerical simulation of tidal current fields near Donghai Island of Zhanjiang Bay. J. Waterw. Harb. 2007, 28, 325–330. [Google Scholar]
- GB/T 5265-2009; Acoustics—Measurement of Underwater Noise. Standards Press of China: Beijing, China, 2009.
Figure 1.
This layout and station diagram of hydrophones: (a) station diagram (“a” “b” and “c” serve as data collection points); (b) layout method.
Figure 1.
This layout and station diagram of hydrophones: (a) station diagram (“a” “b” and “c” serve as data collection points); (b) layout method.
Figure 2.
Tidal and noise spectrograms in autumn: (a) 5 m; (b) 10 m.
Figure 2.
Tidal and noise spectrograms in autumn: (a) 5 m; (b) 10 m.
Figure 3.
Tidal and noise spectrograms in Spring: (a) 5 m; (b) 10 m; (c) 20 m.
Figure 3.
Tidal and noise spectrograms in Spring: (a) 5 m; (b) 10 m; (c) 20 m.
Figure 4.
Underwater noise spectrograms in autumn: (a) 5 m, station a; (b) 5 m, station b; (c) 5 m, station c; (d) 10 m, station a; (e) 10 m, station b; (f) 10 m, station c.
Figure 4.
Underwater noise spectrograms in autumn: (a) 5 m, station a; (b) 5 m, station b; (c) 5 m, station c; (d) 10 m, station a; (e) 10 m, station b; (f) 10 m, station c.
Figure 5.
Underwater noise spectrograms in spring: (a) 5 m, station a; (b) 5 m, station b; (c) 5 m, station c; (d) 10 m, station a; (e) 10 m, station b; (f) 10 m, station c; (g) 20 m, station a; (h) 20 m, station b; (i) 20 m, station c.
Figure 5.
Underwater noise spectrograms in spring: (a) 5 m, station a; (b) 5 m, station b; (c) 5 m, station c; (d) 10 m, station a; (e) 10 m, station b; (f) 10 m, station c; (g) 20 m, station a; (h) 20 m, station b; (i) 20 m, station c.
Figure 6.
Statistical characteristics in autumn: (a) 5 m; (b) 10 m.
Figure 6.
Statistical characteristics in autumn: (a) 5 m; (b) 10 m.
Figure 7.
Statistical characteristics in spring: (a) 5 m; (b) 10 m; (c) 20 m.
Figure 7.
Statistical characteristics in spring: (a) 5 m; (b) 10 m; (c) 20 m.
Figure 8.
Tide variation: (a) autumn; (b) spring.
Figure 8.
Tide variation: (a) autumn; (b) spring.
Figure 9.
Underwater noise sound pressure level and tidal variation curves: (a) autumn at 5 m; (b) autumn at 10 m; (c) spring at 5 m; (d) spring at 10 m; (e) spring at 20 m.
Figure 9.
Underwater noise sound pressure level and tidal variation curves: (a) autumn at 5 m; (b) autumn at 10 m; (c) spring at 5 m; (d) spring at 10 m; (e) spring at 20 m.
Figure 10.
Underwater noise frequency correlation matrix in autumn: (a) 5 m, station a; (b) 5 m, station b; (c) 5 m, station c; (d) 10 m, station a; (e) 10 m, station b; (f) 10 m, station c.
Figure 10.
Underwater noise frequency correlation matrix in autumn: (a) 5 m, station a; (b) 5 m, station b; (c) 5 m, station c; (d) 10 m, station a; (e) 10 m, station b; (f) 10 m, station c.
Figure 11.
Underwater noise frequency correlation matrix in spring: (a) 5 m, station a; (b) 5 m, station b; (c) 5 m, station c; (d) 10 m, station a; (e) 10 m, station b; (f) 10 m, station c; (g) 20 m, station a; (h) 20 m, station b; (i) 20 m, station c.
Figure 11.
Underwater noise frequency correlation matrix in spring: (a) 5 m, station a; (b) 5 m, station b; (c) 5 m, station c; (d) 10 m, station a; (e) 10 m, station b; (f) 10 m, station c; (g) 20 m, station a; (h) 20 m, station b; (i) 20 m, station c.
Figure 12.
Oceanic environmental noise spectrum distribution chart (modified from reference [
2], the green curve represents the results of this study).
Figure 12.
Oceanic environmental noise spectrum distribution chart (modified from reference [
2], the green curve represents the results of this study).
Table 1.
Data collection record.
Table 1.
Data collection record.
| Station | Date | Latitude | 1st | 2nd | 3rd | 4th |
|---|
| a | 9 December 2022 | 110°32′23″; 21°04′43″ | 08:02–08:07 | 12:13–12:18 | 12:44–12:49 | 15:43–15:48 |
| b | 9 December 2022 | 110°32′24″; 21°05′12″ | 09:21–09:26 | 11:00–11:05 | 13:17–13:22 | 14:48–14:53 |
| c | 9 December 2022 | 110°32′38″; 21°05′31″ | 09:33–09:38 | 10:34–10:39 | 13:42–13:47 | 14:05–14:08 |
| a | 21 March 2023 | 110°32′23″; 21°04′43″ | 09:00–09:05 | 12:39–12:44 | 13:06–13:11 | 16:51–16:56 |
| b | 21 March 2023 | 110°32′24″; 21°05′12″ | 09:37–09:42 | 11:57–12:02 | 14:29–14:34 | 16:15–16:20 |
| c | 21 March 2023 | 110°32′38″; 21°05′31″ | 10:27–10:32 | 11:10–11:15 | 14:40–14:45 | 15:52–15:57 |
Table 2.
Probability characteristics statistics.
Table 2.
Probability characteristics statistics.
| Number | Station | Probability Interval
5 m (dB) | Probability Interval
10 m (dB) | Probability Interval
20 m (dB) | Probability Peak
5 m (dB) | Probability Peak
10 m (dB) | Probability Peak
20 m (dB) |
|---|
| Autumn | a | (53–78) | (63–79) | / | 69.1 | 68.7 | / |
| b | (52–77) | (61–70) | / | 63.6 | 68.5 | / |
| c | (57–77) | (60–69) | / | 67.3 | 68.8 | / |
| Spring | a | (62–78) | (62–78) | (60–77) | 70.0 | 75.7 | 71.4 |
| b | (61–79) | (62–81) | (62–78) | 73.5 | 79.8 | 70.9 |
| c | (62–78) | (63–81) | (62–70) | 75.2 | 82.4 | 74.5 |
| Disclaimer/Publisher’s Note: The statements, opinions and data contained in all publications are solely those of the individual author(s) and contributor(s) and not of MDPI and/or the editor(s). MDPI and/or the editor(s) disclaim responsibility for any injury to people or property resulting from any ideas, methods, instructions or products referred to in the content. |
© 2023 by the authors. Licensee MDPI, Basel, Switzerland. This article is an open access article distributed under the terms and conditions of the Creative Commons Attribution (CC BY) license (https://creativecommons.org/licenses/by/4.0/).
