Article

Assessment of the Surface Water Quality of the Gomti River, India, Using Multivariate Statistical Methods

1
Department of Civil Engineering, GLA University, Mathura 281406, India
2
Department of Civil Engineering, Galgotias College of Engineering and Technology, Greater Noida 201310, India
3
Department of Civil Engineering, College of Engineering, King Saud University, Riyadh 11421, Saudi Arabia
4
Department of Environmental Science and Engineering, Yeungnam University, Gyeongsan 38541, Republic of Korea
*
Authors to whom correspondence should be addressed.
Water 2023, 15(20), 3575; https://doi.org/10.3390/w15203575
Submission received: 6 July 2023 / Revised: 21 August 2023 / Accepted: 28 September 2023 / Published: 12 October 2023

Abstract

:
In the present study, the quality of the surface water of the Gomti river (Lucknow, India) was investigated. Lucknow is situated in the centre of Uttar Pradesh, which is most the populated state in India. The locality has experienced rapid, unregulated development activities and population growth in recent decades, both of which have had a negative impact on its ecosystem and environment. Continuous monitoring is required to maintain the ecosystem at the desired level. Nine samples of river water were collected from the Gomti River in Lucknow, and they were analysed for a total of nine different characteristics, including pH, turbidity (Tur), dissolved oxygen (DO), total dissolved solids (TDSs), chemical oxygen demand (COD), chloride ion (Cl-) concentration, temperature (T), biochemical oxygen demand (BOD5) and total hardness (TH). The observed data were analysed using multivariate statistical methods. A cluster analysis (CA) was used to sort the sampling locations into different groups, and a principal component analysis (PCA) was used to find the different sources of pollution. Using a cluster analysis, all the water quality parameters were divided into three groups. Cluster 1 represented the less polluted sites, cluster 2 represented the moderately polluted sites and cluster 3 represented the highly polluted sites. Sampling sites SS8, SS4, S99 and SS7 were highly polluted because of nearby pollution sources such as domestic wastewater and runoff storm water. The principal component analysis yielded two meaningful components that explained 82.4% of the total variation in the data. The first factor and second factor explained 59.022 and 23.363 percentages of the total variance, respectively. It was noticed that major sources of pollution for the Gomti river are storm water runoff and the release of domestic and industrial wastewater from residents and industries, respectively. This study will help policy makers to ensure sustainable practices and reduce negative impacts on the availability and quality of water, allowing for the most efficient use of the Gomti River.

1. Introduction

The quality of water refers to the state of a water body, as measured via physio-chemical and biological factors. The physicochemical characteristics of water in a given place are the result of a complex interplay of natural processes and manmade influences [1,2]. Rivers plays significant roles in the lives of each and every person. The pollution of surface water is an issue that has a global impact on the environment. It is essential to regularly monitor the quality of surface water in order to ascertain the present standing of the quality and ensure that it is maintained at a level that is consistent with the standards that are sought. Rivers, for example, are essential sources of drinking water and irrigation and are used for fishing and the production of energy. Surface water quality has been a very sensitive topic in recent years. Water, despite its importance in sustaining life, has the property of dissolving and transporting a range of substances inside it, leaving it completely polluted. Rapid urbanisation and industrialisation place enormous strains on aquatic ecology, resulting in reductions in water quality and biodiversity [3,4]. Agricultural fertilisers, insecticides, and other chemicals are produced during irrigation, and rainfall runoff transfers this pollution load to an accessible surface water system, causing agriculture to be a non-point source of contamination. Rainfall is also responsible for transporting the pollutants in the atmosphere, which are picks up from a diverse range of sources [5,6,7]. The discharge of wastewater from industrial facilities into rivers and estuaries, which causes an increase in the exploitation of water resources due to the influences of various nutrients and hazardous substances, is a common practice. A problem that affects the environment on a global scale is the contamination of surface water. In order to keep the quality of water at a consistent level over time, continuous monitoring is of the utmost importance. The complexity brought on by the vast amount of data and variables involved in monitoring water quality is one of the most significant drawbacks of this practice [8,9,10]. The application of multivariate statistical techniques (MSTs) such as cluster analyses (CAs) and principal components analyses (PCAs) have gained a significant amount of traction in recent years for analysing environmental data and extracting meaningful information [11,12,13,14]. MSTs not only aid in the interpretation of vast and complicated data sets in order to acquire a better to understanding of water quality but it also allows for the discovery of potential factors that affect water quality. An extensive and complex set of data on water quality in the Fuji River Basin was analysed by Shrestha and Kazama (2007) using a cluster analysis (CA), principal component analysis (PCA), factor analysis (FA), and discriminant analysis (DA) to assess temporal/spatial fluctuations and provide an interpretation. Pejman et al. (2009) examined the spatial and seasonal fluctuations in water quality in the Haraz River Basin using MSTs. In 2010, Noori et al. used the PCA technique to evaluate the water quality of the Karoon River in Iran. Njuguna et al. (2020) used a water quality index and MSTs to estimate the health risks associated with the domestic use of the Tana River in Kenya [15,16,17,18] largest city in North India and the economic capital of Uttar Pradesh (India). The city is growing rapidly; manufacturing, food processing, electronics, banking, IT, and real estate are some of the emerging industries in the city. These developments are adversely affecting the water resources of the city. Singh et al. (2004), Singh et al. (2005), Singh et al. (2009) and Somvanshi et al. (2012) studied the water quality of Gomti River and observed that the organic pollution load is a major source of pollution.
The aim of this study was to examine the water quality of the Gomti River and its spatial variation. Further observed data sets of water quality monitoring were treated using MSTs to extract useful information [19,20,21,22,23].

2. Materials and Methodology
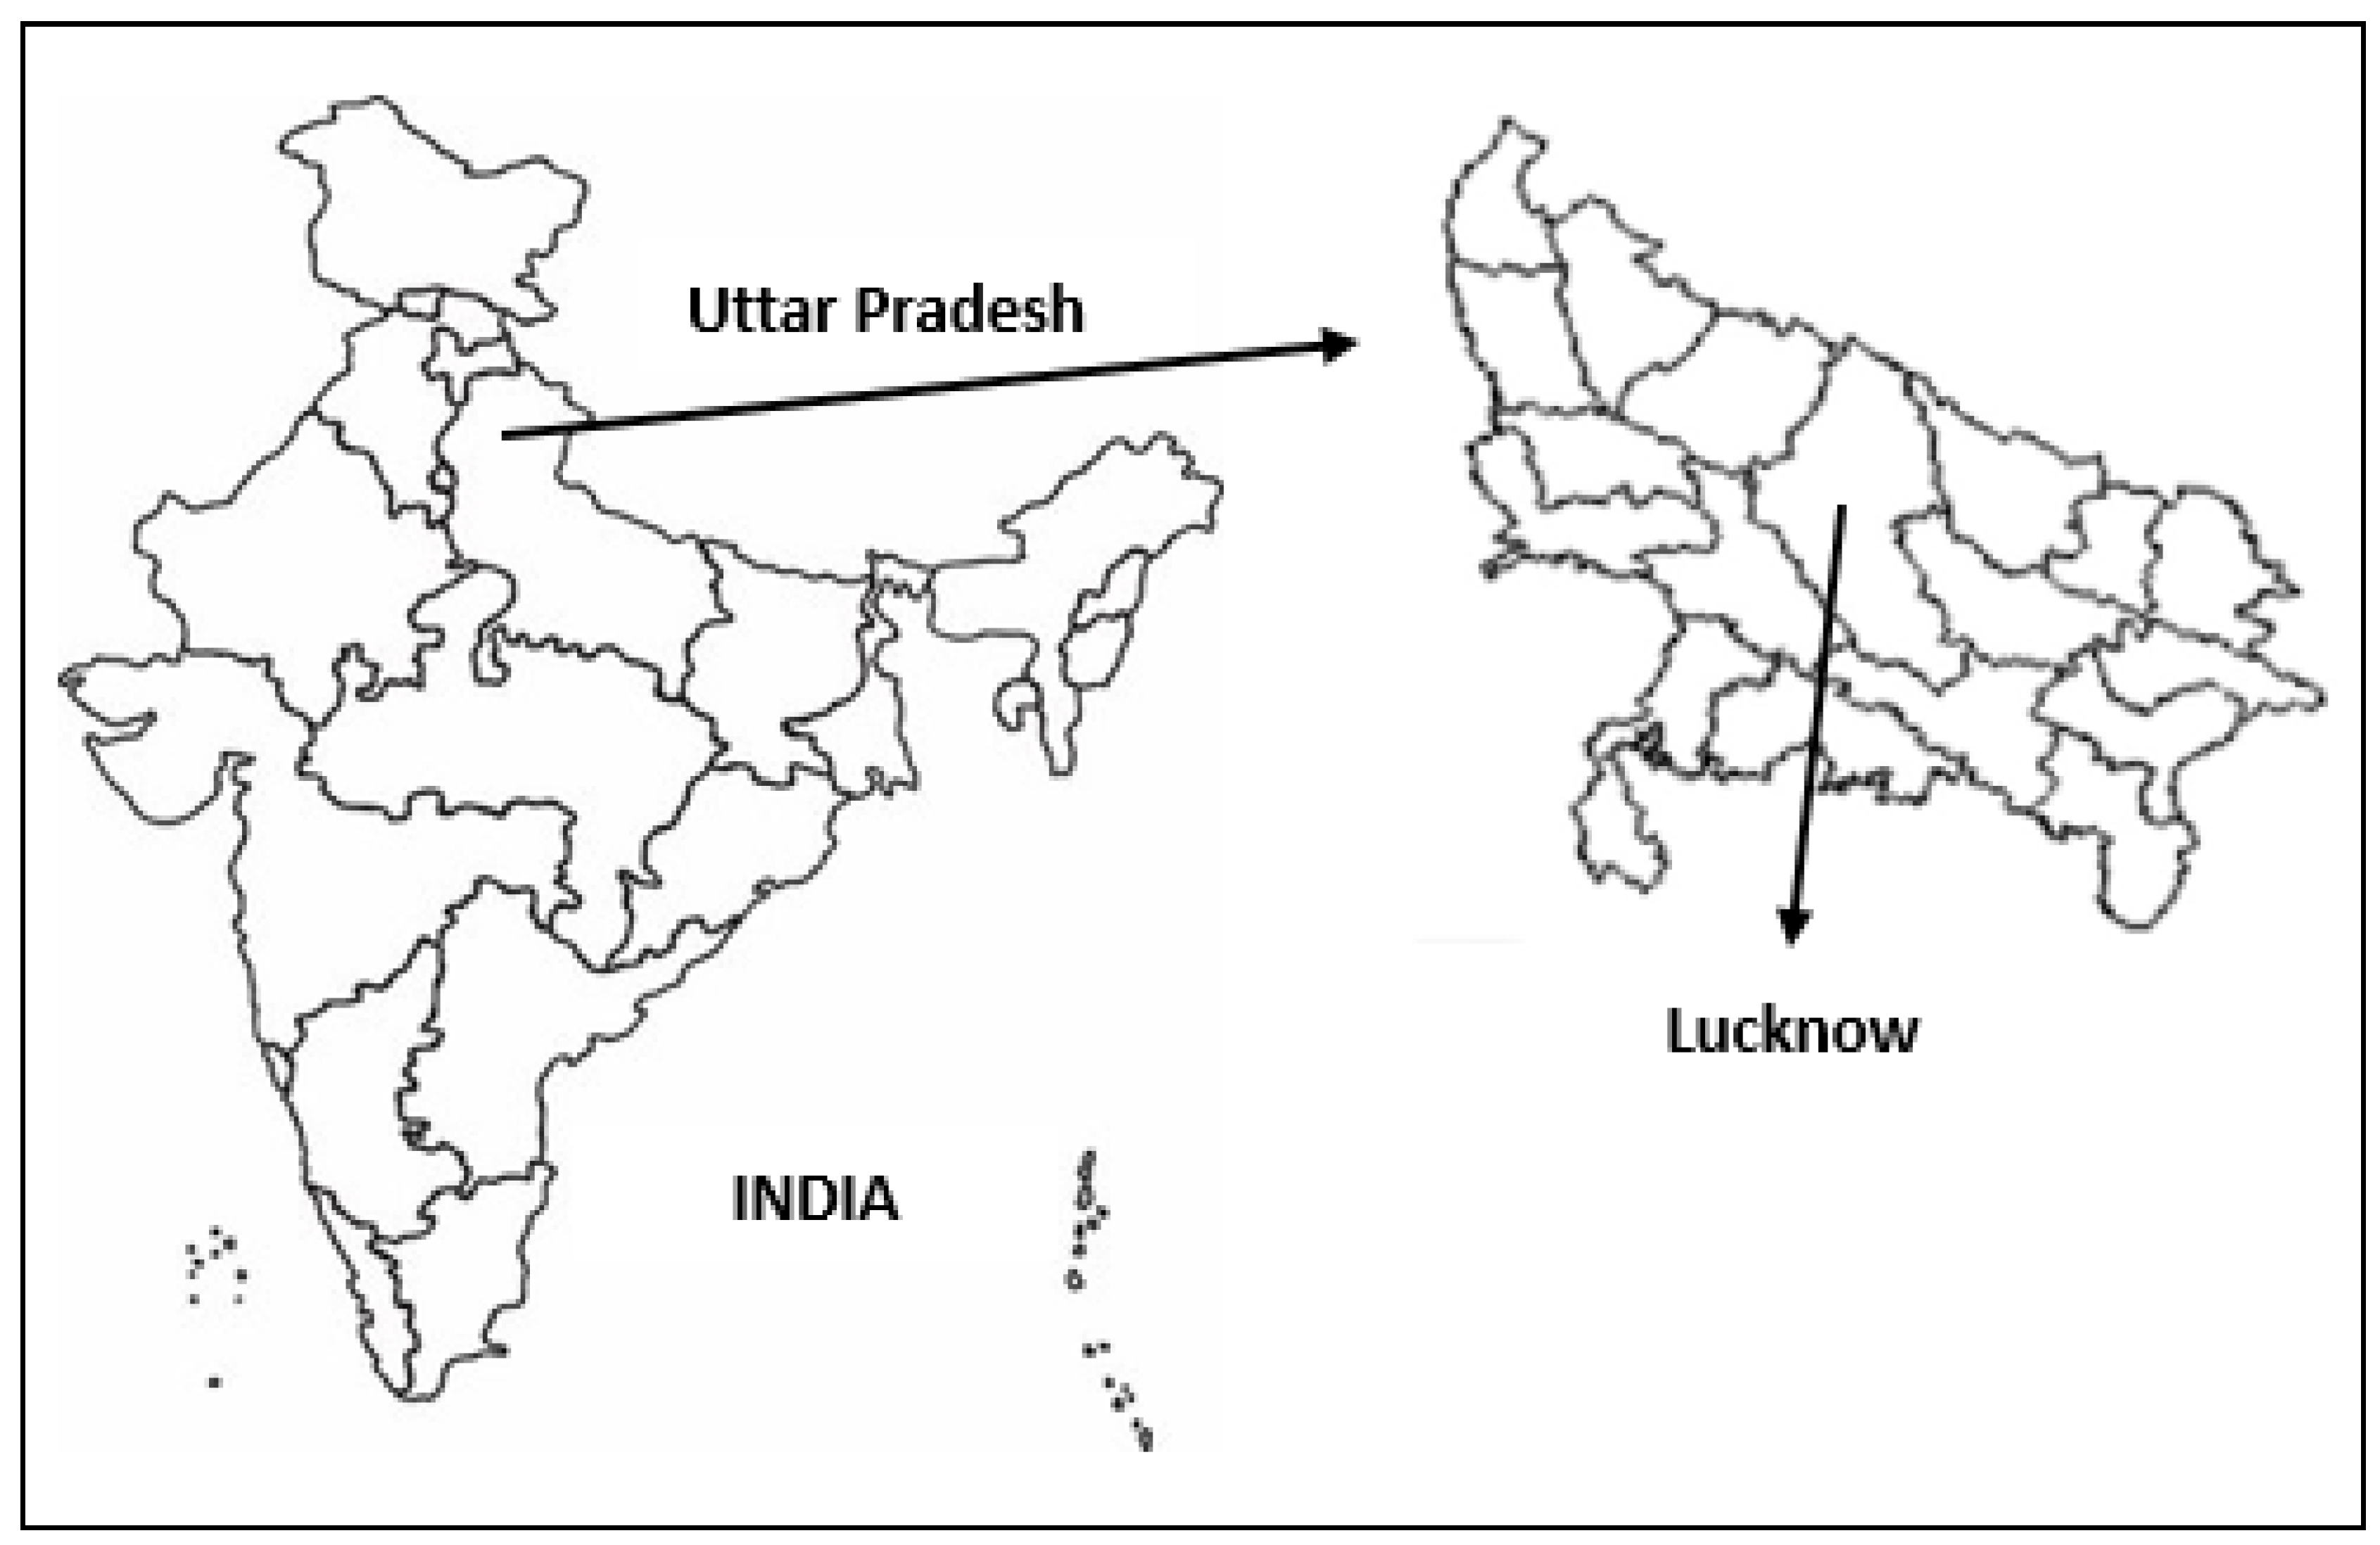
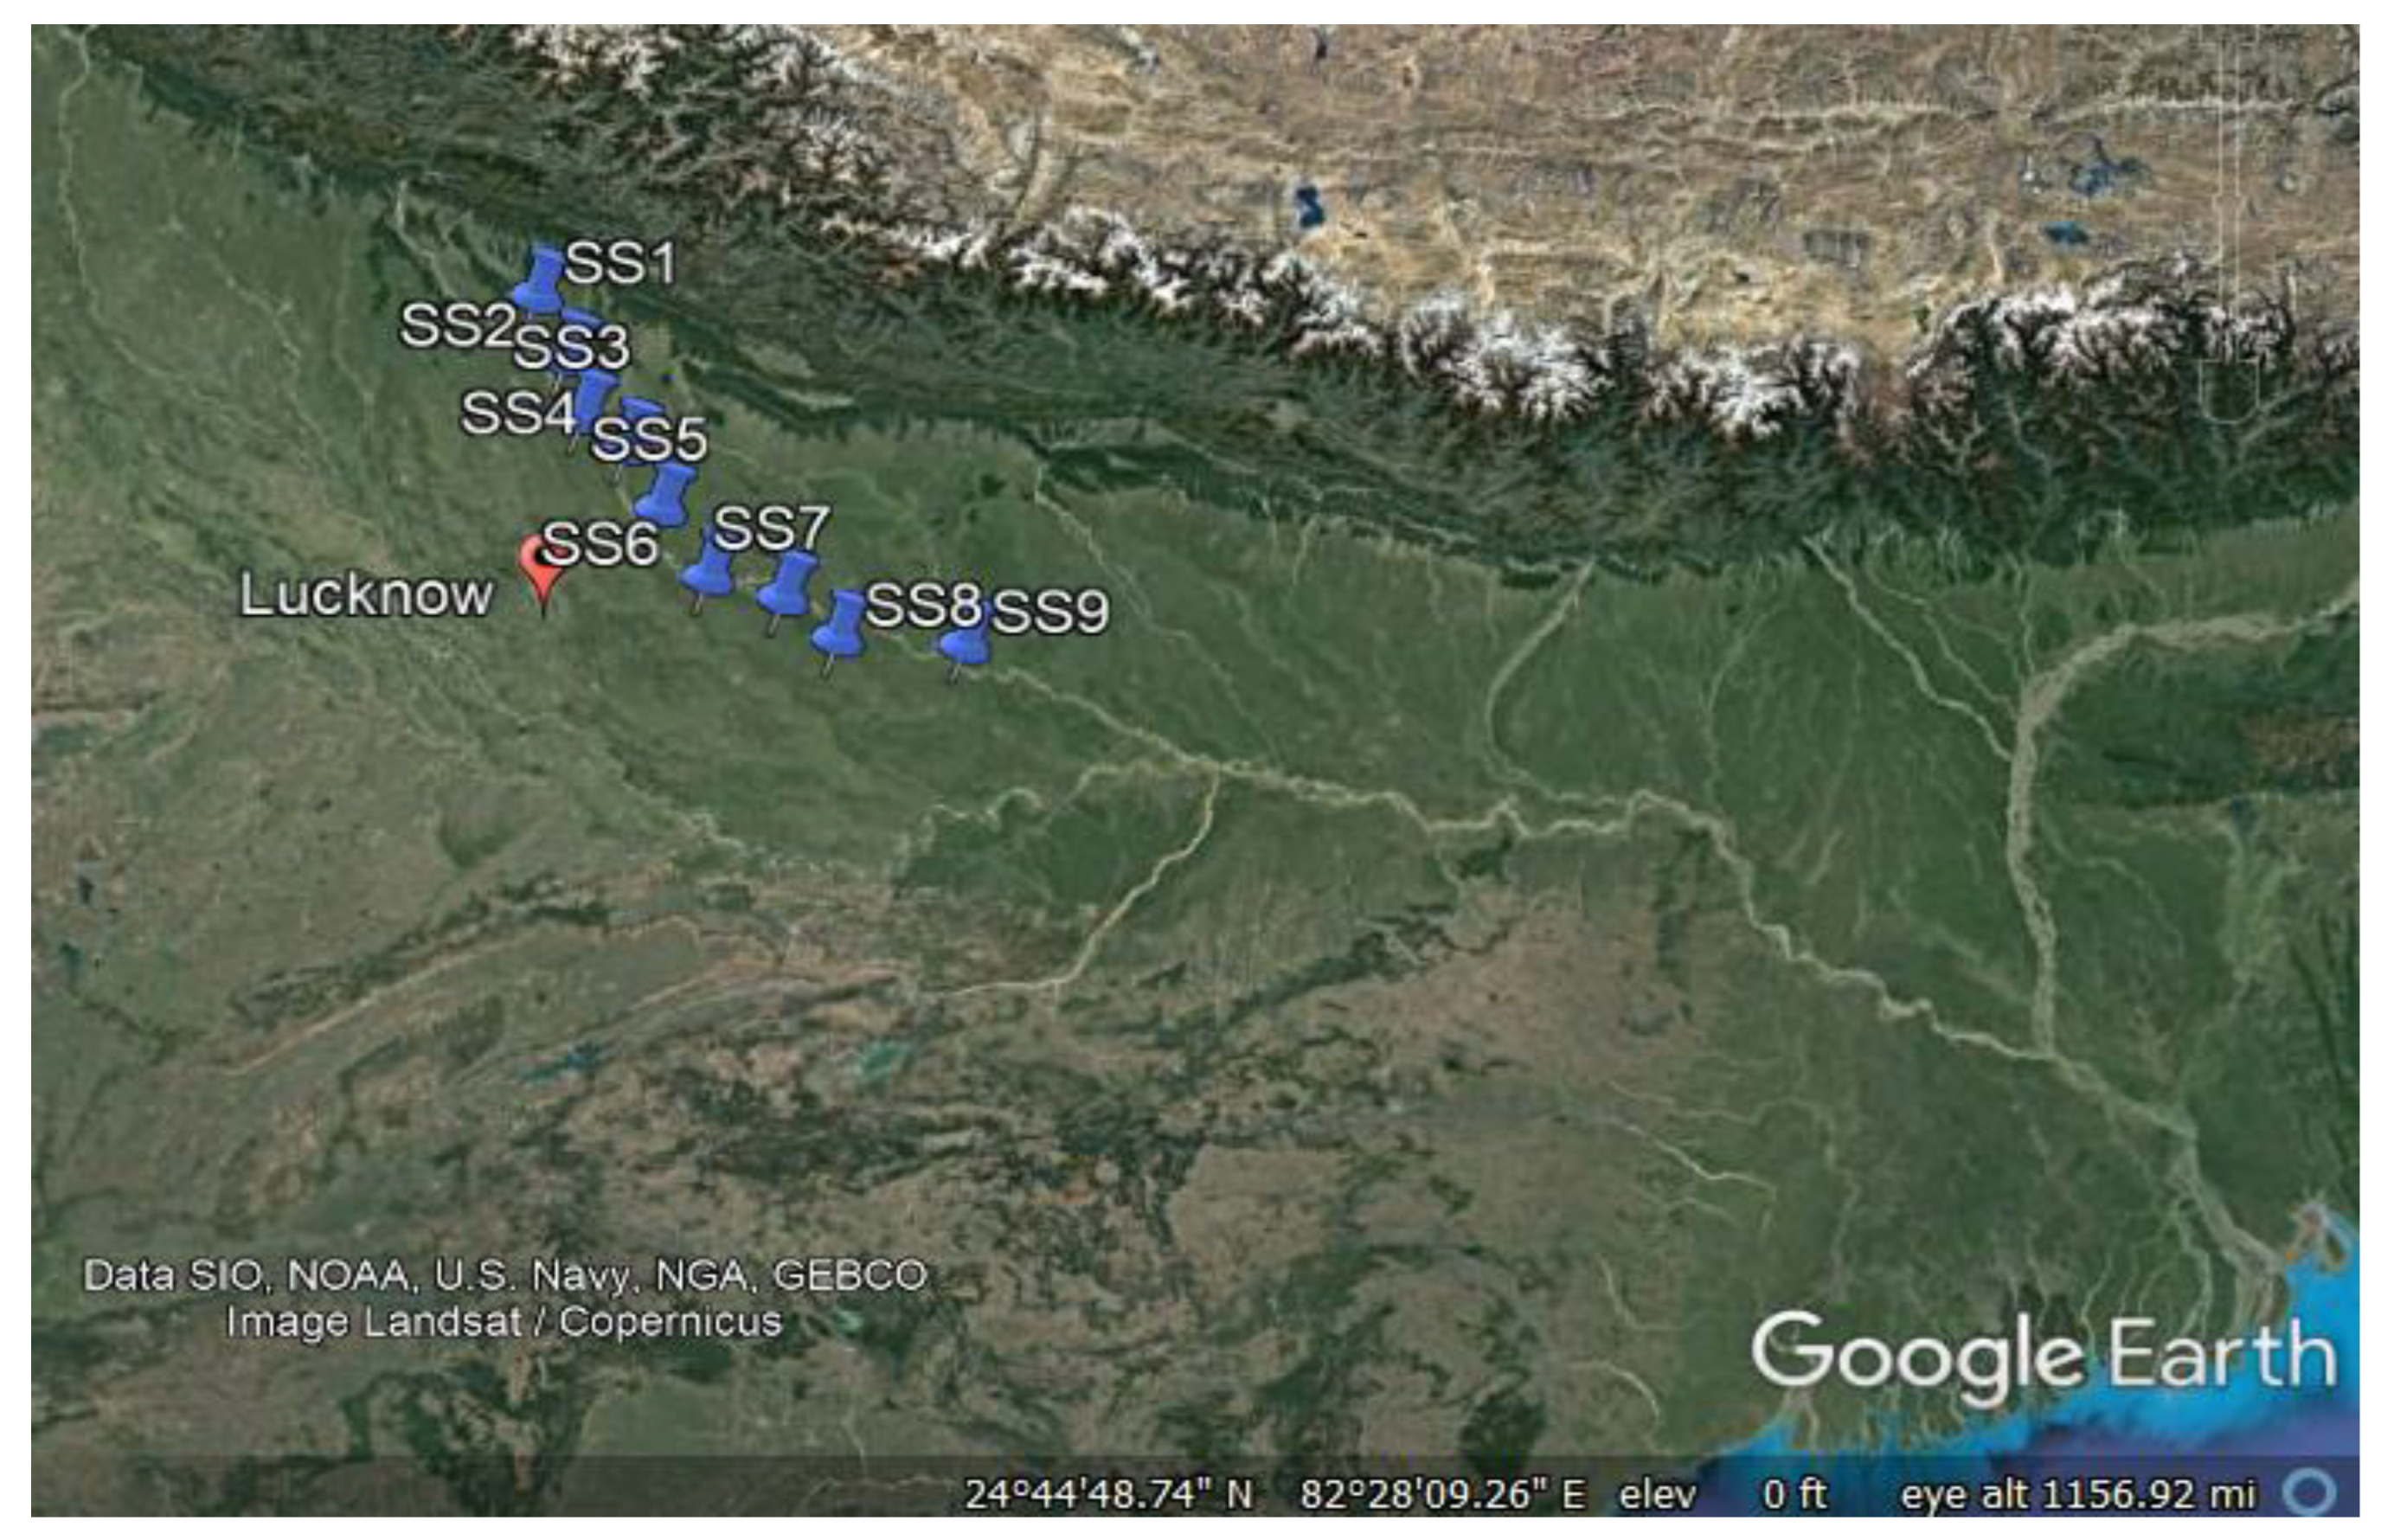
2.1. Study Area

An alluvial river of the Ganga Plain and an important tributary of the Ganga, the Gomti River begins its journey near Mainkot, from a lake known as “FulharJheel” in Madhotanda. This location is around 30 km east of the town of Pilibhit in Uttar Pradesh, at an elevation of 185 m (about 55 km south of the Himalayan foothills). After passing through the districts of Sitapur, Lucknow and Jaunpur on its way southward to meet the Ganga River at Kaithi, the river flows through a valley that has been cut into it. The city of Lucknow, which serves as the capital of Uttar Pradesh and is located at a height of roughly 123 m above the mean sea level, is bounded by the latitudes of 26°51′0″ N and 80°57′0″ E of the Equator (Figure 1). The maximum temperature and minimum temp. range from 37.4 °C to 44.6 °C and 3 °C to 7 °C, respectively, with an annual rainfall ranging from 210 mm to 827.2 mm and an average humidity of 55 percent. The city is in an area with a subtropical climate that is humid in the summer and cool and dry in the winter. The city can be found on the northwestern side of the Gomti River’s shoreline. It is the eleventh largest city in India and the most populous city in Uttar Pradesh, which is the state with the most residents in all of India. The area has experienced rapid and unregulated development, including the installation of several industries, tourism, various building activities, and the use of agricultural and forest land for other purposes. The area has been subjected to a variety of development activities, some of which have been rapid and others which have been uncontrolled. These activities include the establishment of a number of industries, pharmaceuticals, tourism, and different construction projects, as well as the use of farmland and forest land for other kinds of development [24,25,26]. The Gomti River receives its load of pollution not just from point sources but also from non-point sources. It takes in agricultural runoff from its vast catchment area, which is spread out over 10 districts, either directly or indirectly, all the way through its course [27,28,29,30]. Additionally, it takes in untreated municipal wastewater and industrial effluents through its five major tributaries and more than 40 drains in Lucknow (UPPCB, 2015). The practice of washing clothes and animals in the water of the river is another cause of pollution [31,32]. These operations have had a negative influence on the local ecology and the ecosystem of the area in which they have been conducted. Over the last few decades, the city’s terrain has changed, disrupting its ability to hold water and the way it flows from various sources of surface water.

2.2. Sample Collection and Methodical Procedures

During the period from August 2020 to February 2021, water samples were collected from nine sampling sites in the Gomati River. the sampling location sites are shown in Figure 2. Three samples were collected from each sampling site, and samples were collected twice. Standard procedures (APHA 2012) [33] were followed throughout the process of collecting the water samples, preserving them, transporting them to the lab and conducting the analysis [34,35,36,37]. In total, nine different parameters, including temperature (T), pH, turbidity (Tur), total dissolved solids (TDSs), the chemical oxygen demand (COD) dissolved oxygen (DO), the total hardness (TH), chloride (Cl) concentration and the biochemical oxygen demand (BOD5) were measured in the samples analysed. The in situ determination of pH, temperature and dissolved oxygen (DO) were carried out for each water sample, using a field instrument called a multiparameter (Am-P-AL, Aquasol) and a dissolved oxygen meter (AM-DO-1, Aquasol), respectively [38,39]. Within forty-eight hours of their collection, all of the water samples underwent a series of physicochemical tests. The turbidity of each sample was examined using a digital turbidity meter (Model—Metzer-M) immediately after it was escorted into the research laboratory. Both the BOD5 and COD were examined on the day of sampling in order to ignore time-induced changes in the concentration of bacteria. The dilution and seeding methods were utilised for the determination of the BOD5, whereas the acid titration method was utilised for the determination of the COD. The TDSs was measured via a gravimetric analysis at temperatures ranging from 102 °C to 105 °C. EDTA titration was used to determine the total hardness [40,41,42]. The concentration of chloride was found through titration with silver nitrate (AgNO3), using a solution of potassium chromate (K2CrO4) as the indicator. Except for temperature (in degrees Celsius) and pH, all parameters of water quality were measured in milligrams per litre (mg/L). The water quality parameters were compared with the Indian Standard for Drinking Water (BIS 2012).

2.3. Data Evaluation and Multivariate Statistical Assessment

SPSS 20.0 was utilised for all of the mathematical and statistical calculations that were carried out. Using CA and PCA techniques, a multivariate analysis of the data set regarding the quality of the river water was carried out [43,44]. The purpose of the CA was to sort the data into groups called clusters in such a way that the observations within each cluster were comparable to one another in terms of the variables, while the clusters themselves were differentiated from one another. It was utilised in the process of categorising the observations into similar or unique groups. The hierarchical agglomerative clustering (HAC) method was utilised for this particular research study. It is the method that is used most frequently [45,46]. In this approach, each newly formed cluster was the result of the merging of an already existing cluster, and the technique culminated in the formation of a single cluster that comprised all the observations. The CA technique was used to measure each of the water quality parameters so that the most similar parameters could be grouped together. A PCA is a method of pattern recognition that converts a huge number of intercorrelated variables into a more manageable number of independent variables in an effort to interpret the variance that exists within the larger collection of variables [47,48]. It gives information about the most important things that can be used to describe the whole set of data while keeping as much of the original data as possible. It is a sophisticated pattern recognition technique that seeks to explain the variations in a large number of inter-correlated variables by translating them into a smaller number of independent (uncorrelated) variables (principal components). The principal component (PC) is expressed as follows:
zij = ai1x1j + ai2x2j + ai3x3j +…+ aimxmj
where a is the component loading, z is the component score, x is the measured value of a variable, i is the component number, j is the sample number, and m is the total number of variables [20].

3. Results and Discussions

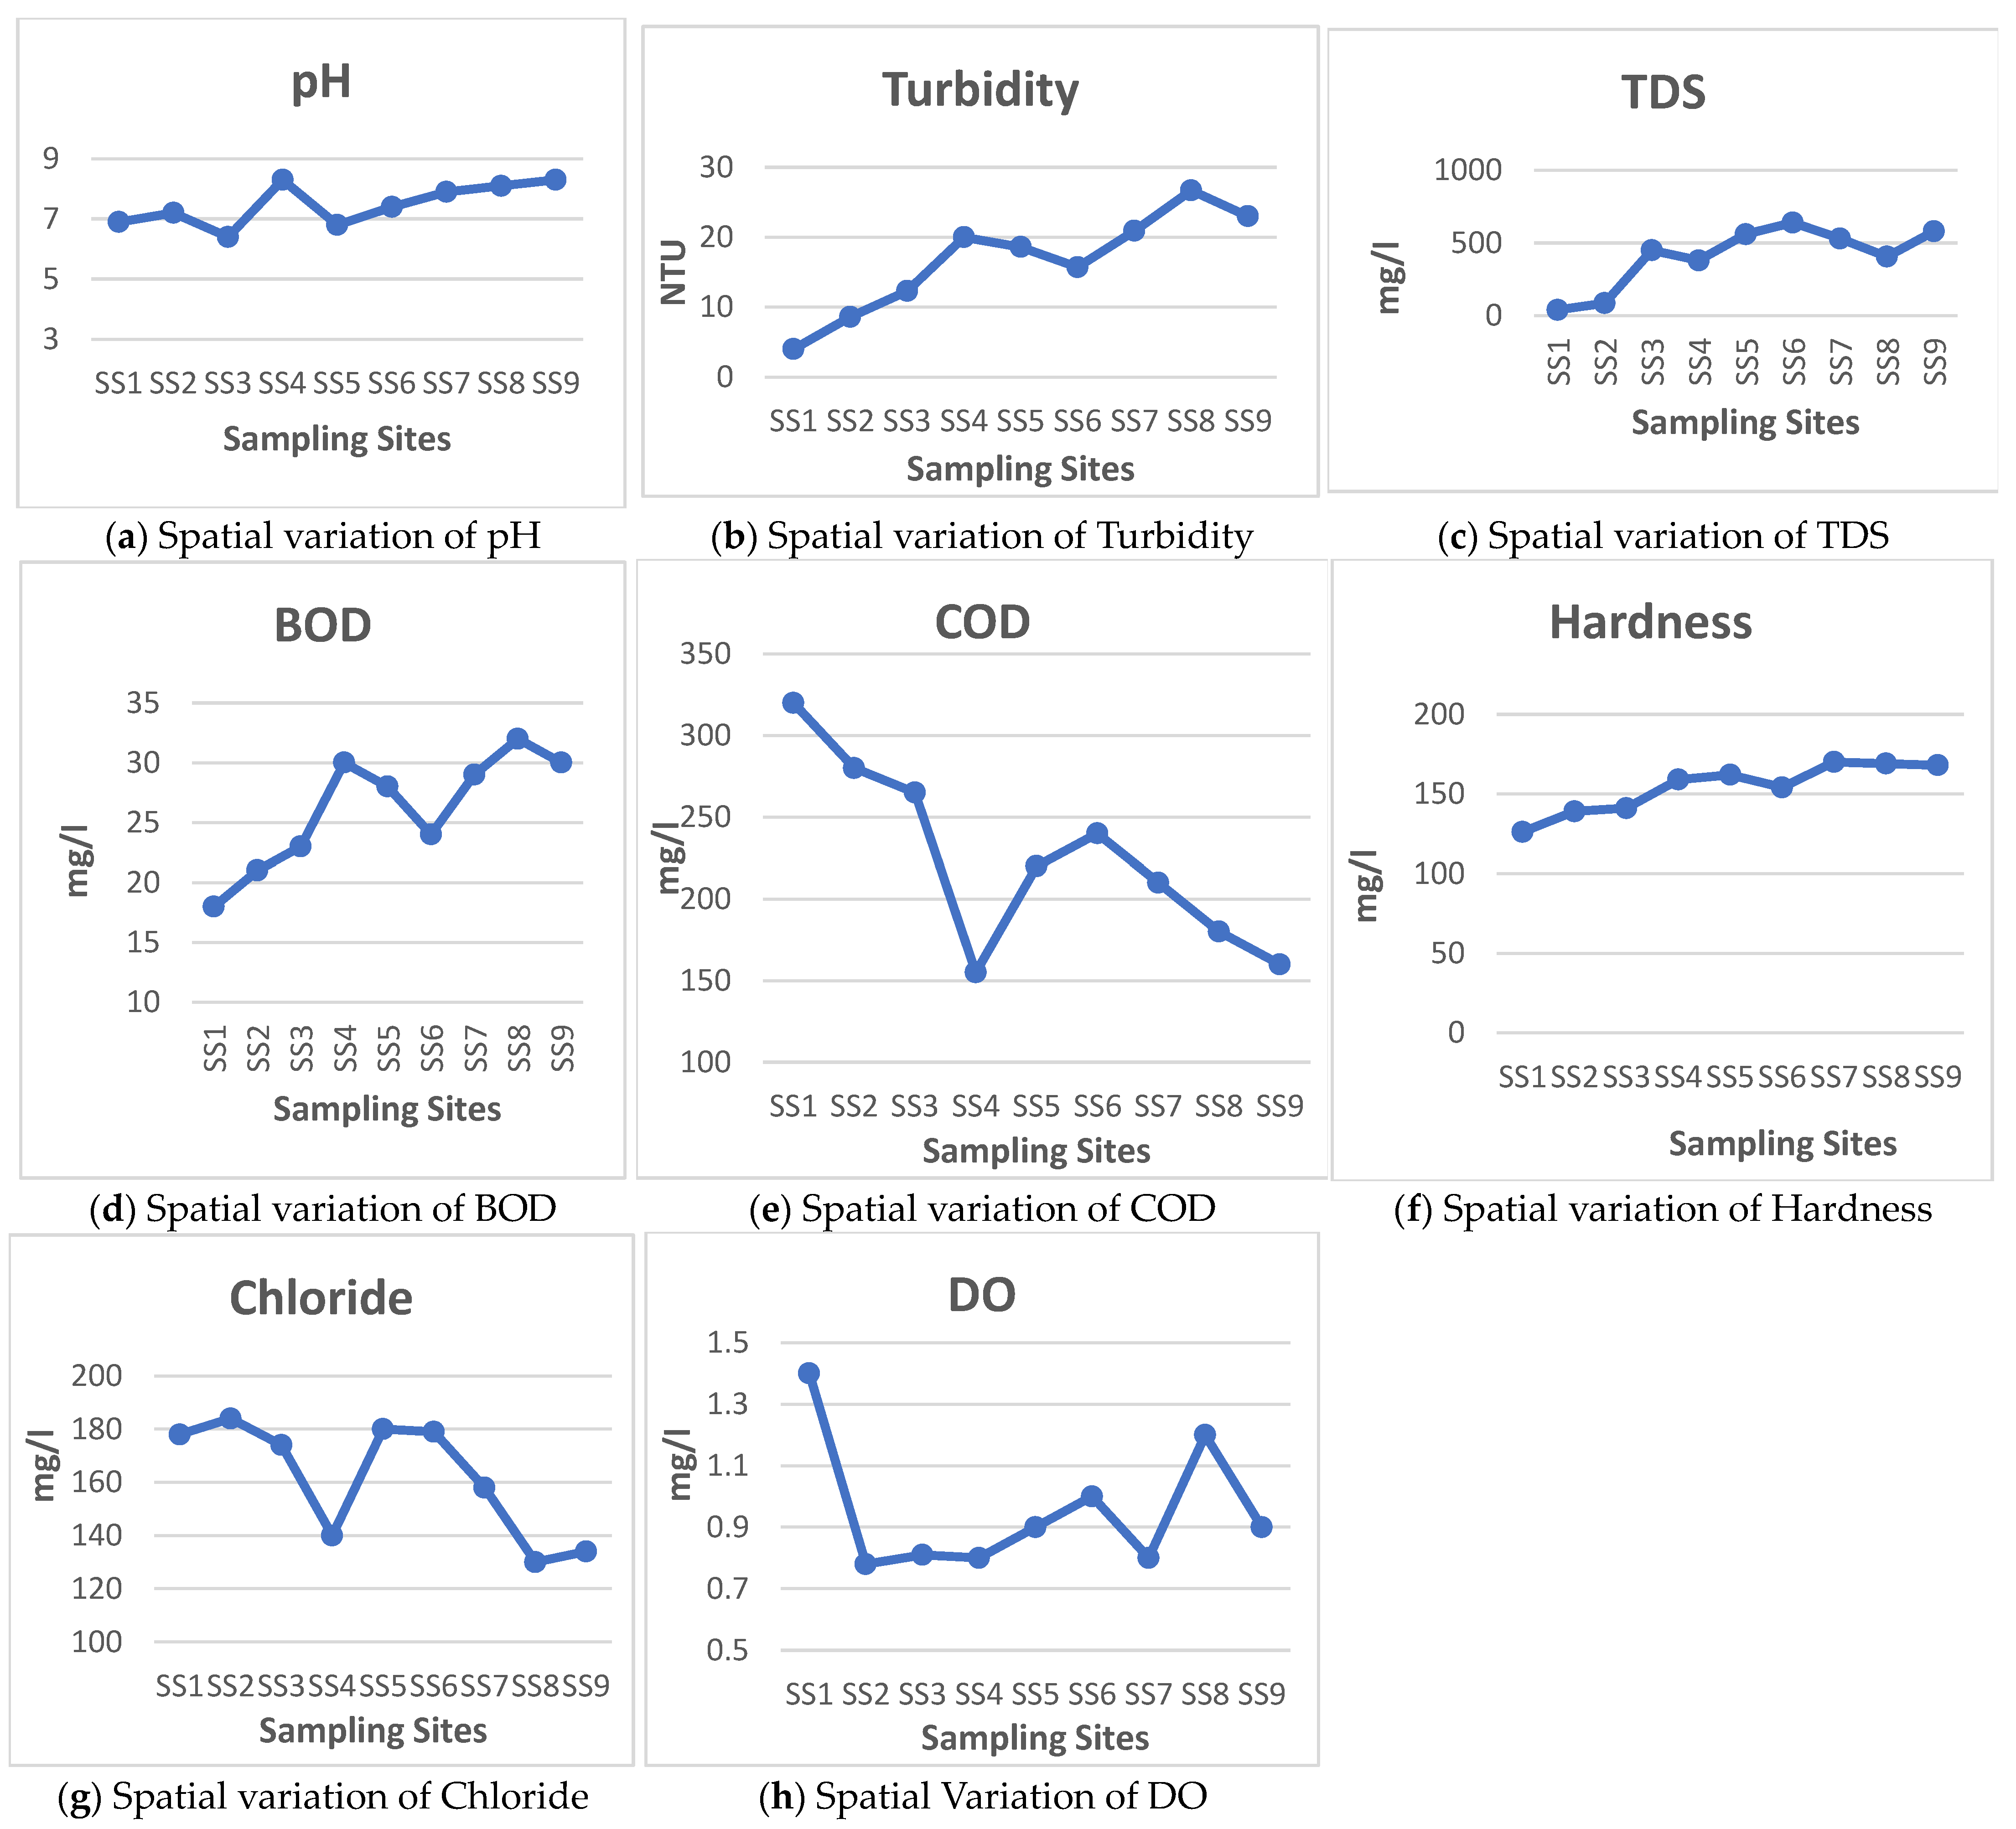
3.1. General Observation

The analytical results of the physicochemical variables were summarized and translated into revealing statistical parameters. Figure 3a–h shows the spatial variations of water quality parameters for different sampling sites. Table 1 shows the kurtosis, minimum, mean, skewness, maximum and median values, as well as the standard deviations for water samples taken from the Gomti River. In natural surface water systems, temperature is considered one of the most essential characteristics. The temperature of the water near the surface has an effect on biological species as well as the rates of activity they exhibit. In addition, it has an effect on the myriad chemical reactions that take place in the natural water system, as well as the solubilities of gases. The water samples had temperatures ranging from 18.5 to 19.8 degrees Celsius. The mean variance in temperature was noted as 19.32 ± 0.40. The ambient temperature had the primary influence on the Gomti River’s temperature. pH is another parameter that is critical. The pH of river water is an indicator of its alkaline or acidic character. There was a wide range in the pH of the river samples from 6.4 to 8.3. The mean pH value (7.48 ± 0.70) was identified. The pH should be between 6.5 and 9.0 so that all aquatic life can do what it needs to do (USEPA 2009). The samples 4 and 9 had the highest pH levels that were measured. It is possible that the decomposition of organic matter caused by the discharge of wastewater is to blame for the somewhat acidic pH of samples 1, 3 and 5. Acidification can be caused by the breakdown of organic matter. During 1994–1998, the average pH of Gomti River, as observed by Singh et al. (2004), was 8 [20]. The turbidity levels were always above the BIS (2012) limit of 5 NTU for drinking water, with the exception of sample 1. The mean turbidity value was (16.64 ± 7.24 SD). The average turbidity value was extremely high compared to the allowed threshold, which causes tremendous suffering for aquatic organisms due to the fact that high turbidity values reduce filter runs, thus making pathogenic organisms more dangerous. The turbidity of each and every sample taken from the river ranged from 4 to 26.7 NTU. The mean turbidity value was greater in the fishing zone and the wetland. Due to the high level of turbidity, numerous aquatic plants lack sufficient light. TDSs in water comprise inorganic salts, trace amounts of organic matter, and other substances that have been dissolved. The TDSs value ranged from 40 mg/L (sample 1) to 640 mg/L across the samples (sample 6). The mean variance TDSs value TDSs was discerned (408 ± 213.03). A higher concentration of TDSs was perceived in sample 6. The high concentration of TDSs was caused by runoff from urban and agricultural areas. In the study by Singh et al. (2005), during 1994–1998, the average concentration of TDSs in the Gomti was in the range of 226–277 mg/L [21,49]. The presence of dissolved compounds of calcium and magnesium can give water its characteristic hardness. The TH ranged from 126 mg/L all the way up to 170 mg/L in concentration (sample 7). The mean variance of was observed (154.22 ± 15.59 SD). The TH of water indicates its usability for domestic, industrial and drinking purposes. The chloride concentration ranged from 130 mg/L (sample 8) to 184 mg/L across the samples (sample 2). The mean value of chloride was perceived (161.89 ± 21.81 SD). The concentrations of Cl ions were within the allowable range of 250 mg/L. (BIS 2012). The presence of chloride in surface water is caused by runoff, the use of inorganic fertilizers and animal feed and irrigation drainage. Other sources of chloride in surface water include natural processes and human activities. Additionally, it is an important indicator of the discharge of sewage. All of the other samples had concentrations of Cl that were less than 500 mg/L. In natural water systems, DO is one of the most essential parameters. It is the factor that defines how healthy an ecosystem is. DO plays a vital function in the biological system of a river and in determining the level of freshness of surface water. Additionally, it aids in assessing the quality and natural pollution of surface water. In this investigation, the DO concentration ranged from 0.78 mg/L all the way up to 1.4 mg/L, and the mean concentration of DO in the river water was 0.95 ± 0.21. DO and temperature are inversely related. DO concentrations fall as water temperature rises. The average DO was below the allowed threshold, indicating that fish and aquatic species are the principal victims. The low DO concentration has been blamed for many fish deaths in the adjacent fishing zone. Another crucial environmental indicator of the condition of natural water bodies is the chemical oxygen demand (COD). The COD is frequently used as an indicator of pollution in normal and polluted waters and to assess the quality of waste such as industrial effluents and sewage water. COD is a unit of measurement for the total quantity of oxygen necessary to convert all organic matter into carbon dioxide and water. The COD ranged between 155 mg/L to 320 mg/L. Sample 1 showed the highest COD levels COD. The mean COD value was 225.56 ± 56.21 SD, and it was above the permitted limit, endangering the health of everyone and the species inhabiting the aquatic environment. The biological oxygen demand, or BOD5, is the amount of oxygen that is used up by microorganisms in the process of decomposing organic matter in water when aerobic conditions are present. The BOD5 concentration ranged from 21 mg/L to 32 mg/L. Sample number eight had the highest BOD5 reading (32 mg/L). The mean value of the BOD5 was discerned (26.11 ± 4.78). The river included a variety of organic materials, including dead plants, animal excrement, leaves and other types of woody waste. Another source of biological oxygen demand (BOD5) was identified to be the discharge of domestic wastewater into river. In the study by Singh et al. (2009), over a period of 10 years, the average BOD of Gomti was in the range of 0.12–31.67 mg/L [22].
A correlation matrix was used to determine the vital components in charge of regulating the movement and distribution of the influencing contaminants [50,51]. The matrix was used to find the relationships between the relevant factors. The correlation coefficients between the variables are displayed in Table 2. The correlation between pH and turbidity and BOD5 is high. Similarly, the correlation between turbidity and BOD5 and hardness is very high. The correlation between TDS and hardness is high. DO and BOD are inversely correlated. Additionally, BOD and pH had a strong positive link, and temperature and turbidity were found to have a positive correlation as well.

3.2. Cluster Analysis

A CA was utilised to classify the sampling sites in this investigation. In this study, we used Euclidean distance as the similarity measure and Ward’s method of linking to perform an HAC on the normalized data (Z-score normalisation) [17,28,43]. A CA was used to group the related parameters in the water quality data set, and a dendrogram was constructed as a consequence, as shown in Figure 4. All nine locations were grouped into three clusters based on a visual assessment. Cluster 1 was formed by SS1, Cluster 2 was formed by SS2, SS3, SS5 and SS6, and Cluster 3 was formed by SS4, SS7, SS8 and SS9. Cluster 1 represents the less polluted sites, cluster 2 represents the moderately polluted sites and cluster 3 represents the highly polluted sites.

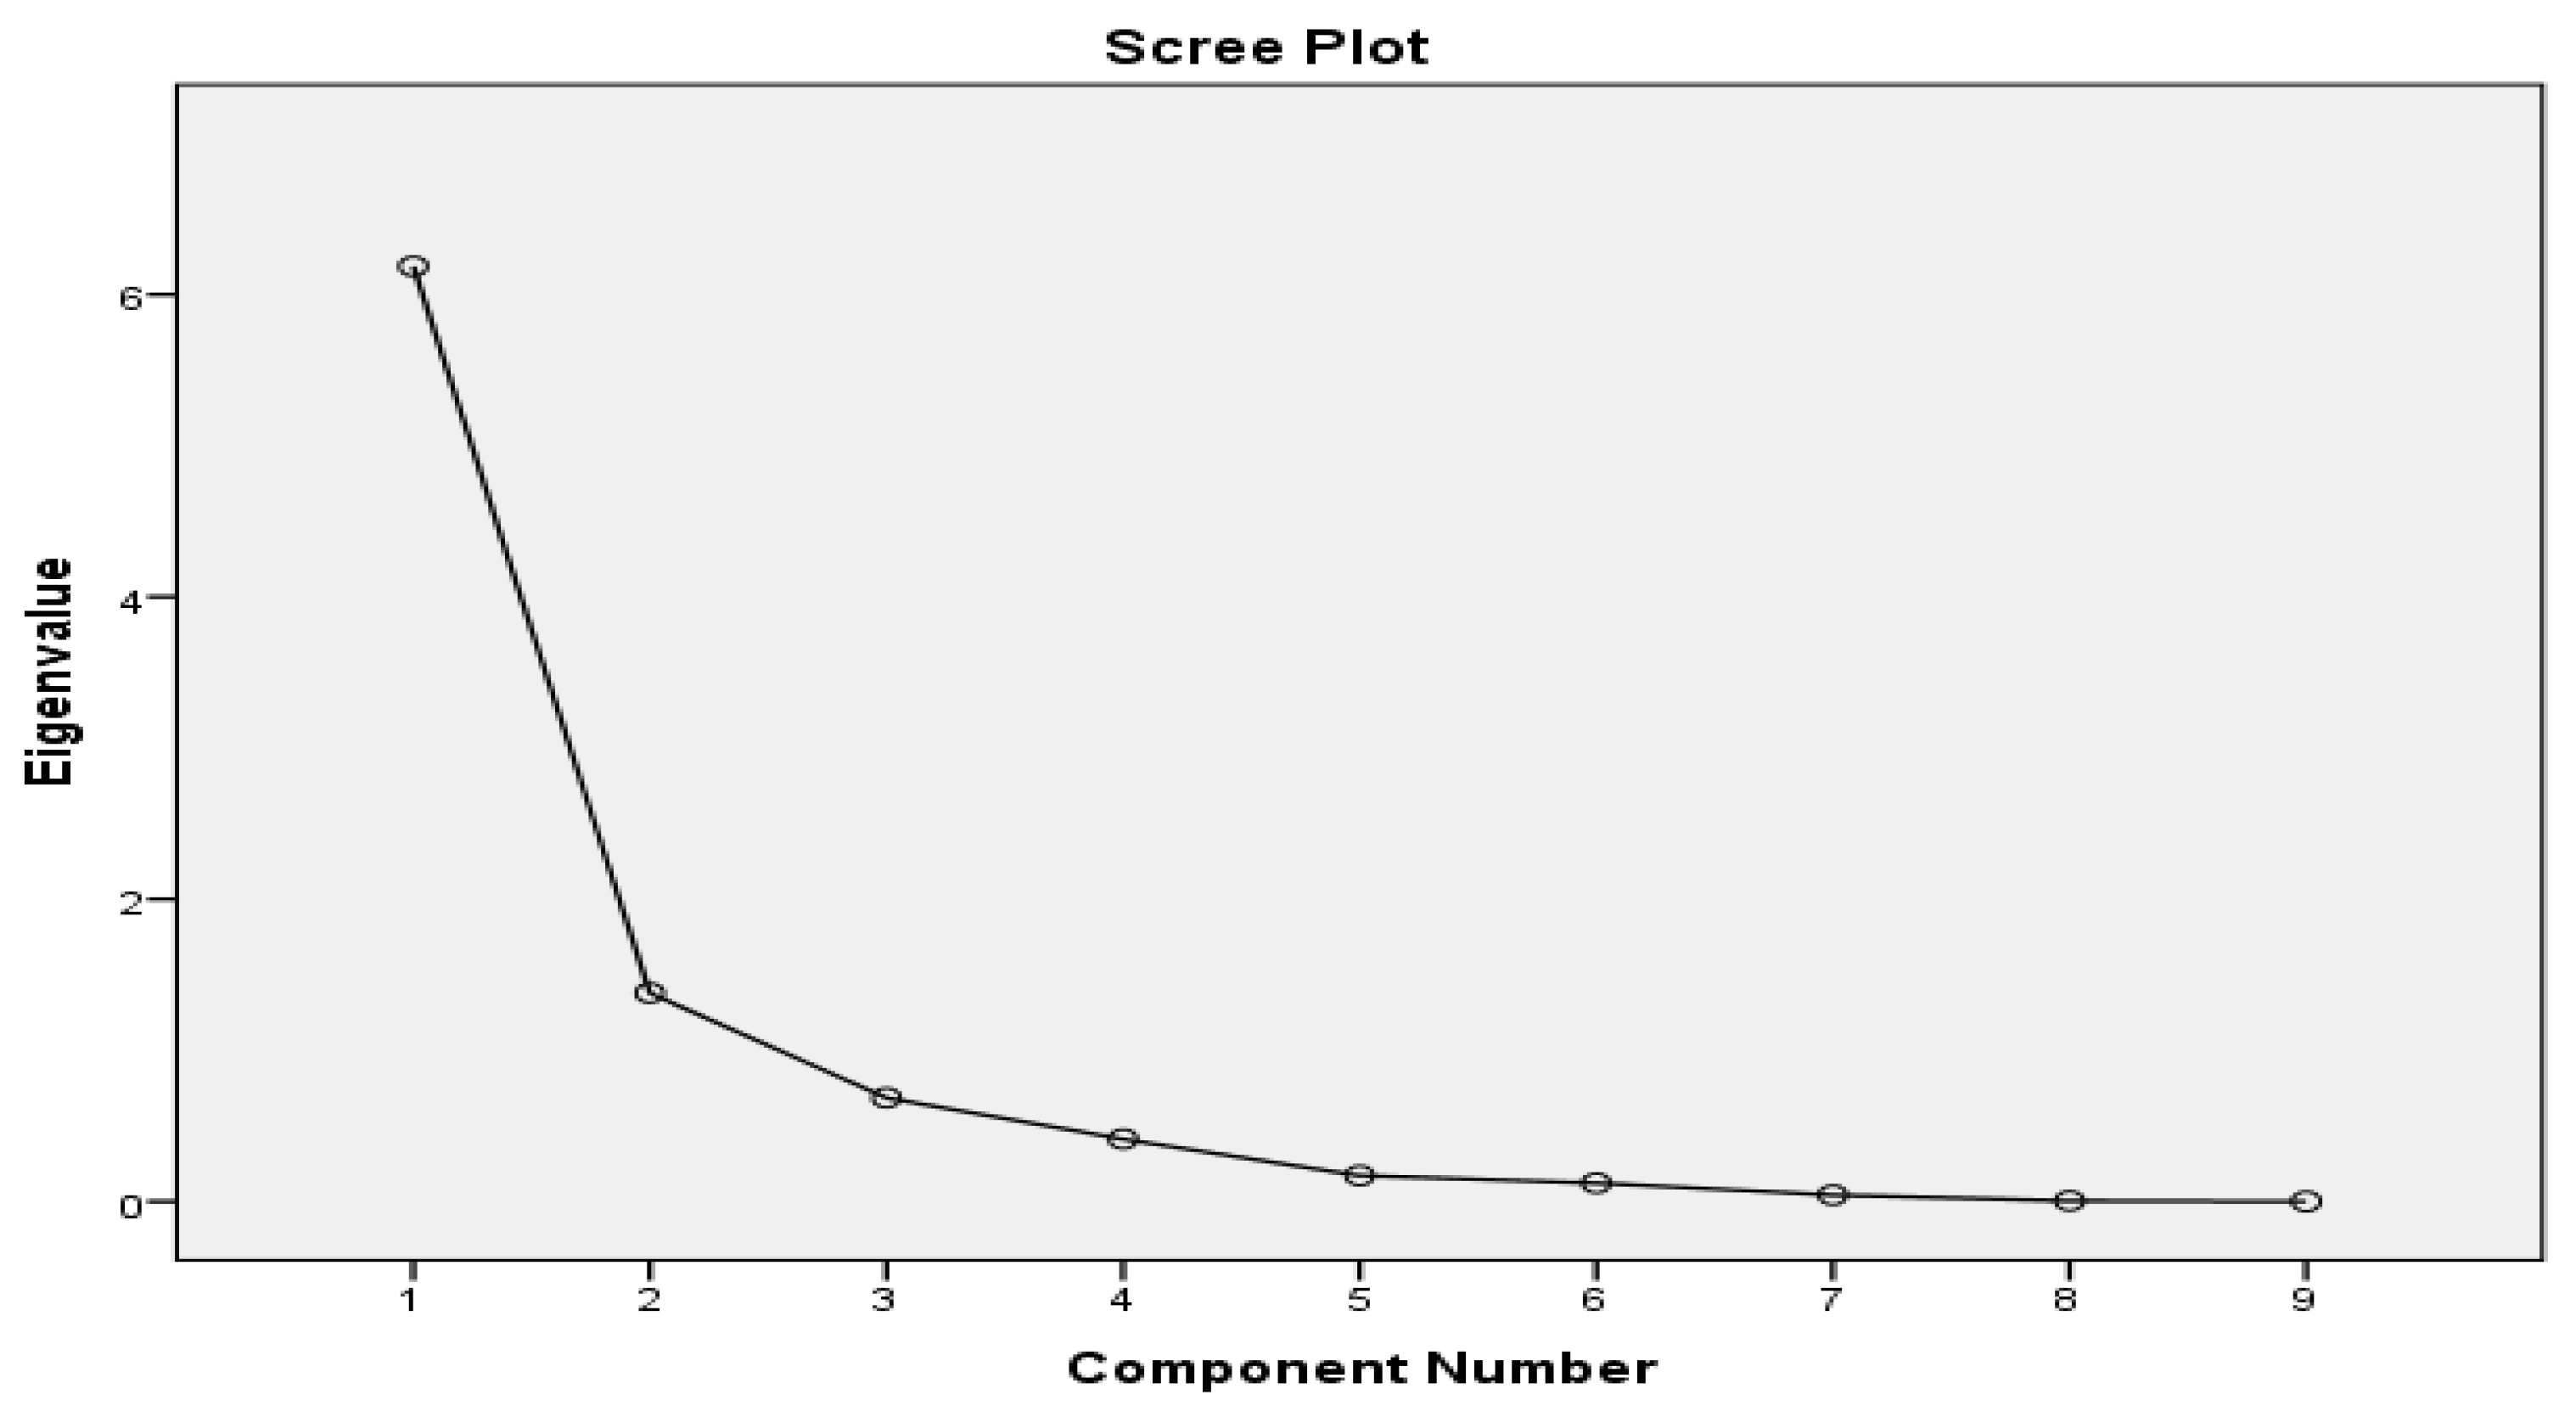
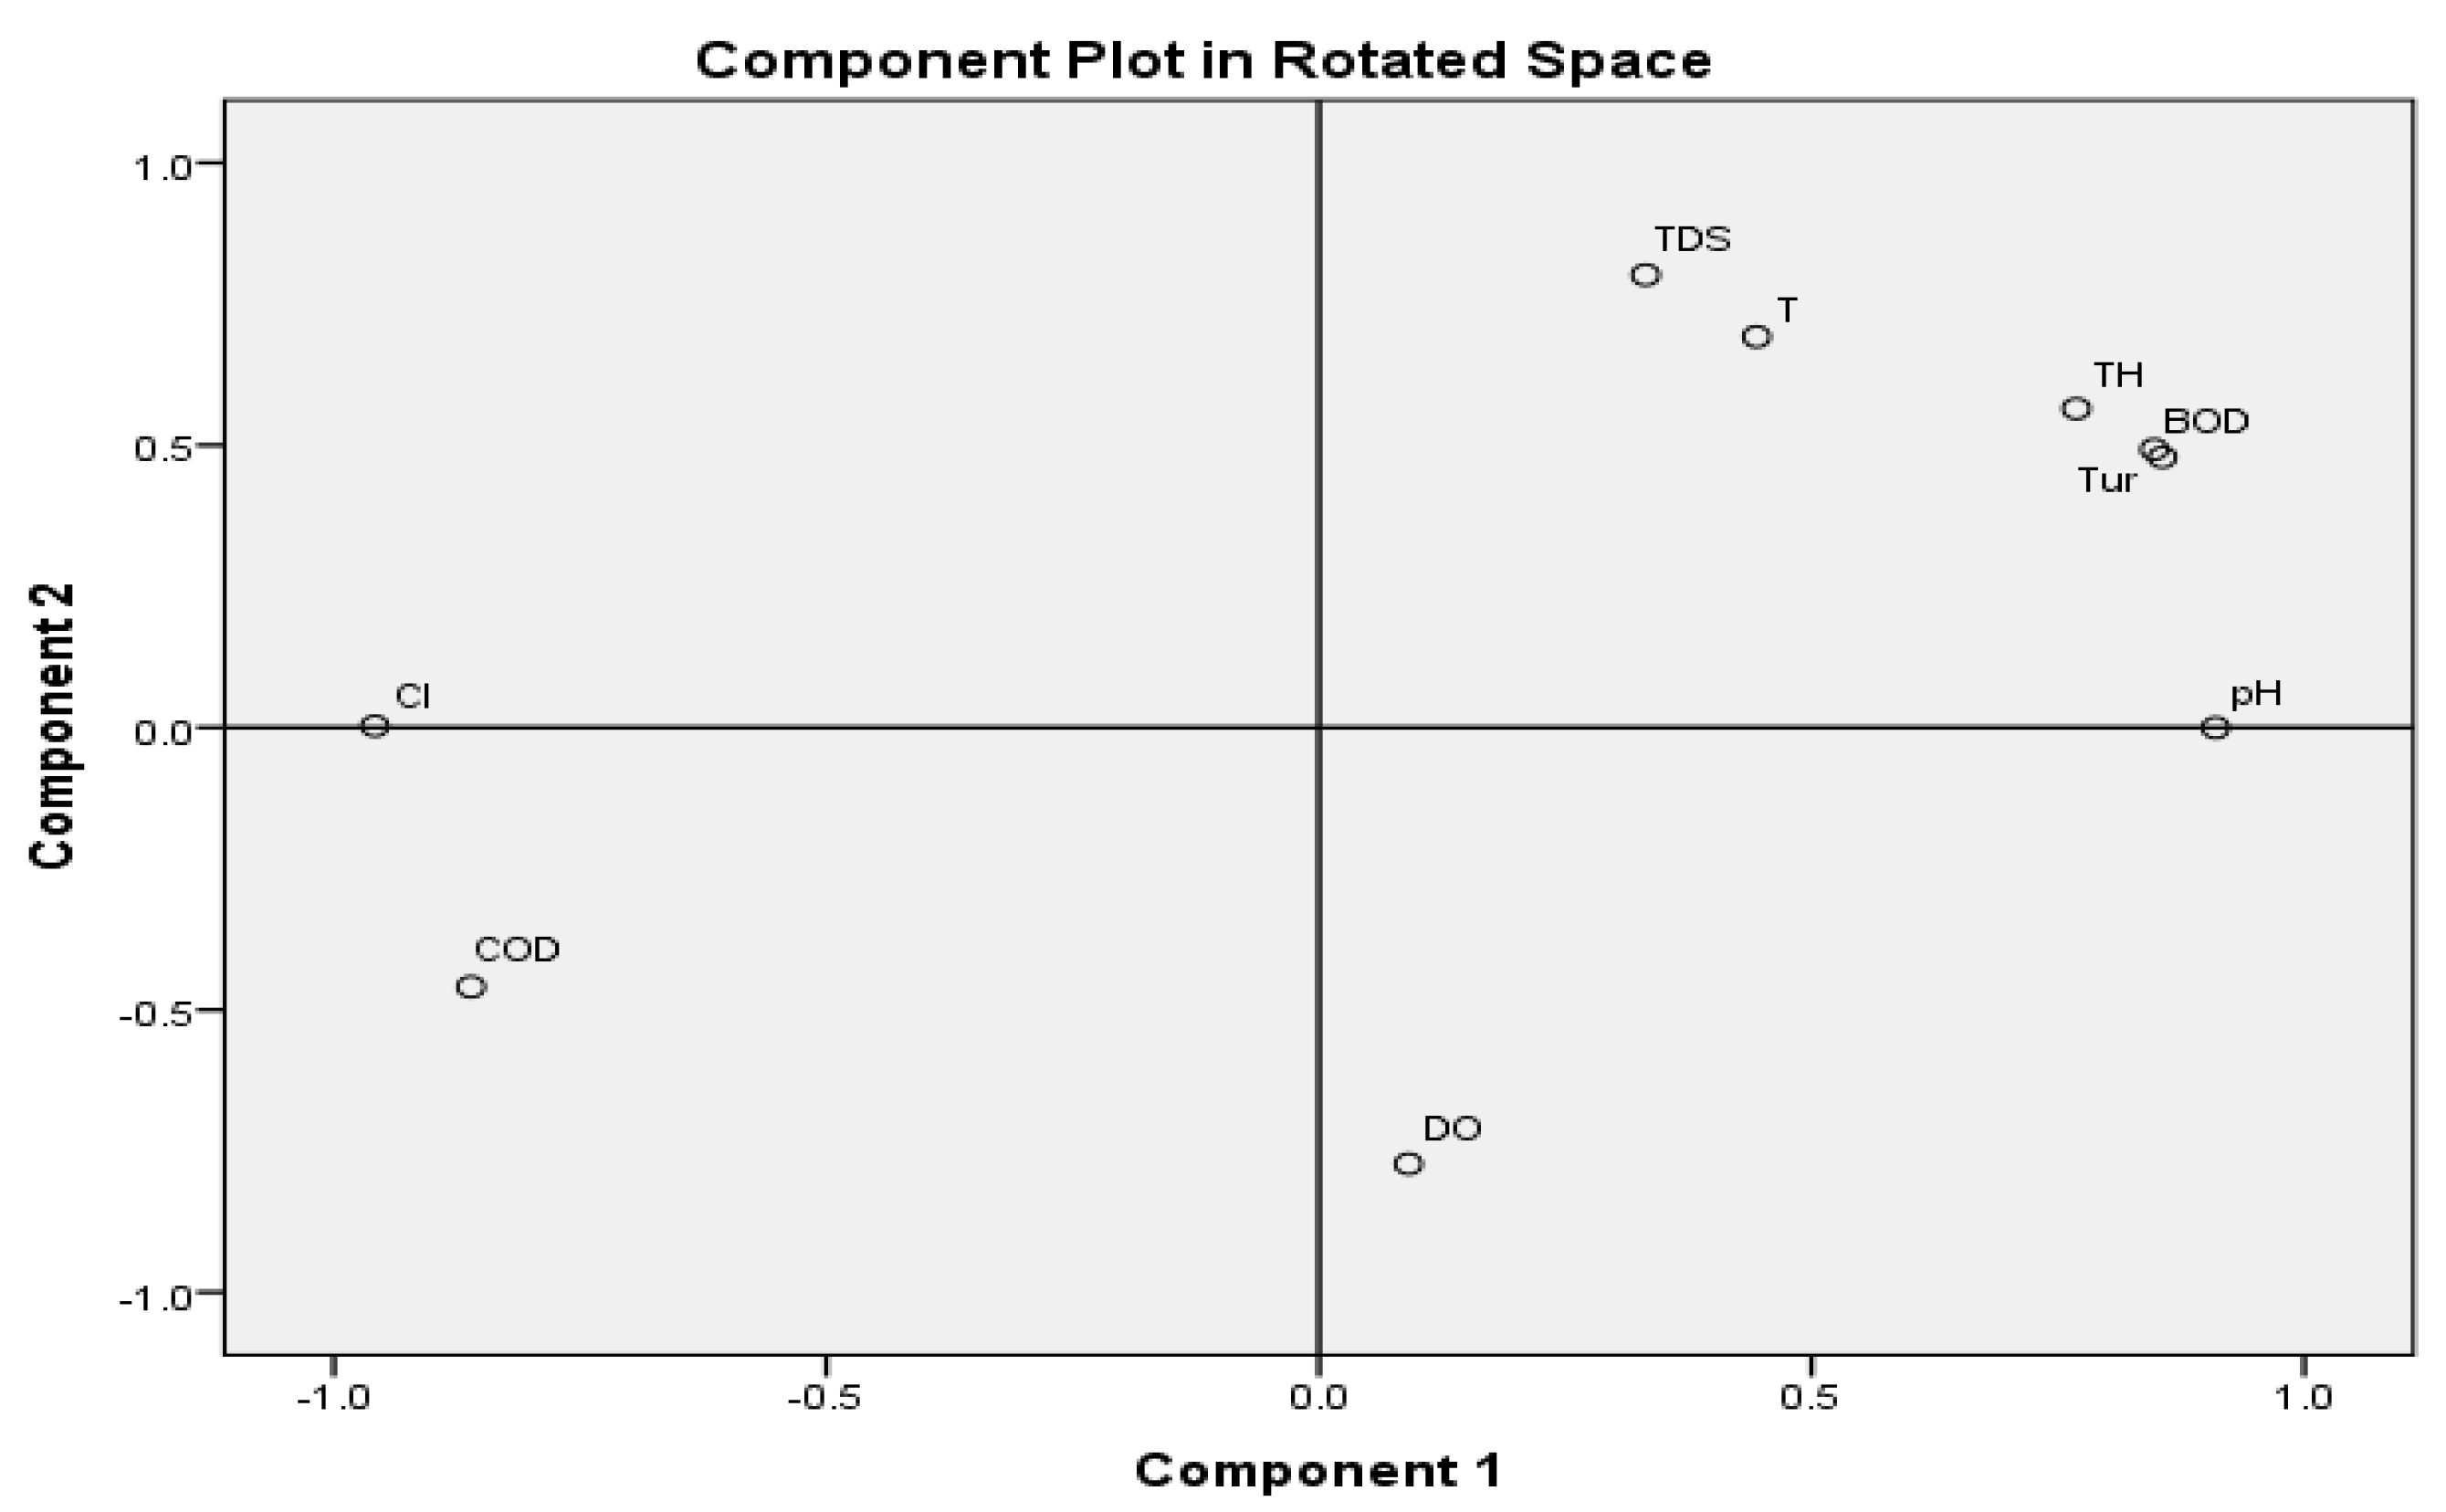
3.3. Principal Component Analysis

In order to conduct an analysis of the data set that consisted of nine river water samples and nine water parameters, a PCA was first performed on the correlation matrix, and then a Varimax rotation was carried out. These steps were taken in order to fulfil the aim of conducting the analysis.
A scree plot (Figure 5) was used in the PCA to determine how many factors should be kept. The eigenvalues of the factors were sorted in descending order of magnitude on the scree plot from left to right. The aim was to identify the factors that could be changed by identifying their point of inflexion. The number of factors prior to flattening the curve was therefore a significant number of factors that needed to be extracted for the factor analysis.
Table 3 provides an overview of the communalities for all the measures that were measured. A parameter’s communality can be seen as the sum of the loadings that parameter has on each of the extracted elements. Because the communality of each parameter was very high (higher than 0.50), the factor analysis could be relied upon, and each parameter was accurately mirrored by the components that were extracted.
The eigenvalues of the extracted factors are shown in Table 4, together with the percentage of total sample variation that can be attributed to each factor’s explanation. The analysis uncovered a total of nine contributing factors. The extraction of the usable principal component was done based on eigenvalues that were greater than 1, which served as the criterion. Table 4 shows that two of the components had eigenvalues that were higher than 1.
These two primary contributors were responsible for 82.38 percent of the overall variation. Table 4 contains the parameter loading information for the two useful components derived from the PCA of the data set [52]. It was determined that a loading that was larger than 0.75 was considered to be strong, while a loading that was between 0.75 and 0.50 was considered to be moderate, and a loading that was less than 0.50 was considered to be weak [16,49]. The first factor explained 59.022 percentage of the total variance and is highly loaded with Cl, BOD5, COD, Tur, pH and TH (Table 5). This factor represents the influence of municipal wastewater discharge [8,17,28]. The discharge of untreated or only partially treated sewage was released into the river in large quantities. The second factor explained 23.363 percentage of the total variance and is highly loaded with TDS and DO. It is due to the runoff of storm water. Several research studies were conducted on the Gomti River shown in Table 6.
The elements of a space-rotated graph provide an easier presentation in which the relative locations of the data with respect to the axes and their connections indicate the similarities of the environmental data (Figure 6).

4. Conclusions

This research investigated the quality of the surface water in the Gomti River in Lucknow (India). The water quality of the Gomti river was evaluated based on nine different characteristics, and samples were taken at nine different locations along the river. The categorisation of water quality metrics and the characterisation of the sources were accomplished using a CA and PCA. The water quality metrics were organized into three distinct categories via a CA. The PCA analysis led to the discovery of two important factors that comprised 82.4 percent of the total variation. The discharge of municipal wastewater and surface runoff were recognized as the sources of pollution in the Gomti river. This research illustrates that the CA and PCA are both useful techniques for analysing the extensive and intricate data sets produced by water-quality-monitoring programmes. It could be beneficial for people who make rules about how to keep water clean.
The results of this study also indicate the need for proper planning, the management of water resources and the safe disposal of industrial and municipal wastes, which would otherwise lead to serious environmental degradation.
In this study, water samples were collected from specific locations and at specific time intervals. However, this approach cannot capture short-term fluctuations or provide a comprehensive understanding of water quality over larger areas. Water quality can vary greatly seasonally due to factors such as temperature, precipitation and biological activity. Observation during certain seasons does not necessarily provide a complete picture of year-round conditions.
Traditional water-quality-monitoring programs may not detect emerging contaminants or contaminants that are not regularly tested. As new chemicals and pollutants are introduced, monitoring methods must be adapted to include them. Further study is required for the continuous monitoring of emerging pollutants.

Author Contributions

V.K.K.: drafting—data collection and preparation of the manuscript, writing—review and editing; K.R.S.: drafting—preparation of the manuscript, revision, and correction; N.G.: composing—reviewing and modifying; P.B.: composing—reviewing and modifying; F.M.A.: composing—reviewing and modifying, M.A.K.: composing—reviewing and modifying, S.A.: composing—reviewing and modifying, O.Q.: composing—reviewing and modifying. All authors have read and agreed to the published version of the manuscript.

Funding

The authors would like to acknowledge the support provided by Researchers Supporting Project Number RSP2023R297, King Saud University, Riyadh, Saudi Arabia.

Data Availability Statement

All data are presented in the article.

Conflicts of Interest

The authors declare no conflict of interest.

References

  1. Singh, G.; Patel, N.; Jindal, T.; Srivastava, P.; Bhowmik, A. Assessment of spatial and temporal variations in water quality by the application of multivariate statistical methods in the Kali River, Uttar Pradesh, India. Environ. Monit. Assess. 2020, 192, 394. [Google Scholar] [CrossRef] [PubMed]
  2. Matta, G.; Nayak, A.; Kumar, A.; Kumar, P. Water quality assessment using NSFWQI, OIP and multivariate techniques of Ganga River system, Uttarakhand, India. Appl. Water Sci. 2020, 10, 206. [Google Scholar] [CrossRef]
  3. Nnorom, I.C.; Ewuzie, U.; Eze, S.O. Multivariate statistical approach and water quality assessment of natural springs and other drinking water sources in SoutheasternNigeria. Heliyon 2019, 5, e01123. [Google Scholar] [CrossRef] [PubMed]
  4. Ustaoğlu, F.; Tepe, Y. Water quality and sediment contamination assessment of Pazarsuyu Stream, Turkey using multivariate statistical methods and pollution indicators. Int. Soil Water Conserv. Res. 2019, 7, 47–56. [Google Scholar] [CrossRef]
  5. Kumar, A.S.; Reddy, A.M.; Srinivas, L.; Reddy, P.M. Assessment of Surface Water Quality in Hyderabad Lakes by Using Multivariate Statistical Techniques, Hyderabad-India. Environ. Pollut. 2014, 4, 14–23. [Google Scholar] [CrossRef]
  6. Alam, R.; Ahmed, Z.; Seefat, S.M.; Nahin, K.T.K. Assessment of surface water quality around a landfill using multivariate statistical method, Sylhet, Bangladesh. Environ. Nanotechnol. Monit. Manag. 2021, 15, 100422. [Google Scholar] [CrossRef]
  7. Barakat, A.; El Baghdadi, M.; Rais, J.; Aghezzaf, B.; Slassi, M. Assessment of spatial and seasonal water quality variation of Oum Er Rbia River (Morocco) using multivariate statistical techniques. Int. Soil Water Conserv. Res. 2016, 4, 284–292. [Google Scholar] [CrossRef]
  8. Bhuiyan, M.A.H.; Rakib, M.A.; Dampare, S.B.; Ganyaglo, S.; Suzuki, S. Surface water quality assessment in the central part of Bangladesh using multivariate analysis. KSCE J. Civ. Eng. 2011, 15, 995–1003. [Google Scholar] [CrossRef]
  9. Bilgin, A.; Konanç, M.U. Evaluation of surface water quality and heavy metal pollution of Coruh River Basin (Turkey) by multivariate statistical methods. Environ. Earth Sci. 2016, 75, 1–18. [Google Scholar] [CrossRef]
  10. Bouguerne, A.; Boudoukha, A.; Benkhaled, A.; Mebarkia, A.H. Assessment of surface water quality of Ain Zada dam (Algeria) using multivariate statistical techniques. Int. J. River Basin Manag. 2017, 15, 133–143. [Google Scholar] [CrossRef]
  11. Boyacioglu, H.; Boyacioglu, H. Surface water quality assessment by environmetric methods. Environ. Monit. Assess. 2007, 131, 371–376. [Google Scholar] [CrossRef] [PubMed]
  12. Chen, Q.; Mei, K.; Dahlgren, R.A.; Wang, T.; Gong, J.; Zhang, M. Impacts of land use and population density on seasonal surface water quality using a modified geographically weighted regression. Sci. Total Environ. 2016, 572, 450–466. [Google Scholar] [CrossRef] [PubMed]
  13. Duan, W.; He, B.; Nover, D.; Yang, G.; Chen, W.; Meng, H.; Zou, S.; Liu, C. Water quality assessment and pollution source identification of the eastern poyang lake basin using multivariate statistical methods. Sustainability 2016, 8, 133. [Google Scholar] [CrossRef]
  14. Khan, M.A.; Wen, J. Evaluation of physicochemical and heavy metals characteristics in surface water under anthropogenic activities using multivariate statistical methods, Garra River, Ganges Basin, India. Environ. Eng. Res. 2020, 26, 200280. [Google Scholar] [CrossRef]
  15. Noori, R.; Sabahi, M.S.; Karbassi, A.R.; Baghvand, A.; Zadeh, H.T. Multivariate statistical analysis of surface water quality based on correlations and variations in the data set. Desalination 2010, 260, 129–136. [Google Scholar] [CrossRef]
  16. Pejman, A.H.; Bidhendi, G.R.N.; Karbassi, A.R.; Mehrdadi, N.; EsmaeiliBidhendi, M. Evaluation of spatial and seasonal variations in surface water quality using multivariate statistical techniques. Int. J. Environ. Sci. Technol. 2009, 6, 467–476. [Google Scholar] [CrossRef]
  17. Shrestha, S.; Kazama, F. Assessment of surface water quality using multivariate statistical techniques: A case study of the Fuji river basin, Japan. Environ. Model. Softw. 2007, 22, 464–475. [Google Scholar] [CrossRef]
  18. Njuguna, S.M.; Onyango, J.A.; Githaiga, K.B.; Gituru, R.W.; Yan, X. Application of multivariate statistical analysis and water quality index in health risk assessment by domestic use of river water. Case study of Tana River in Kenya. Process Saf. Environ. Prot. 2020, 133, 149–158. [Google Scholar] [CrossRef]
  19. Isiyaka, H.A.; Mustapha, A.; Juahir, H.; Phil-Eze, P. Water quality modelling using artificial neural network and multivariate statistical techniques. Model. Earth Syst. Environ. 2019, 5, 583–593. [Google Scholar] [CrossRef]
  20. Singh, K.P.; Malik, A.; Mohan, D.; Sinha, S. Multivariate statistical techniques for the evaluation of spatial and temporal variations in water quality of Gomti River (India)—A case study. Water Res. 2004, 38, 3980–3992. [Google Scholar] [CrossRef]
  21. Singh, K.P.; Malik, A.; Sinha, S. Water quality assessment and apportionment of pollution sources of Gomti river (India) using multivariate statistical techniques—A case study. Anal. Chim. Acta 2005, 538, 355–374. [Google Scholar] [CrossRef]
  22. Singh, K.P.; Basant, A.; Malik, A.; Jain, G. Artificial neural network modeling of the river water quality—A case study. Ecol. Modell. 2009, 220, 888–895. [Google Scholar] [CrossRef]
  23. Somvanshi, S.; Singh, K.P.; Singh, N.B.; Shukla, S.P.; Pathak, V. Integrated remote sensing and GIS approach for water quality analysis of Gomti river, Uttar Pradesh. Int. J. Environ. Sci. 2012, 3, 62–74. [Google Scholar]
  24. Fan, X.; Cui, B.; Zhao, H.; Zhang, Z.; Zhang, H. Assessment of river water quality in Pearl River Delta using multivariate statistical techniques. Procedia Environ. Sci. 2010, 2, 1220–1234. [Google Scholar] [CrossRef]
  25. Feher, I.C.; Moldovan, Z.; Oprean, I. Spatial and seasonal variation of organic pollutants in surface water using multivariate statistical techniques. Water Sci. Technol. 2016, 74, 1726–1735. [Google Scholar] [CrossRef]
  26. ZareGarizi, A.; Sheikh, V.; Sadoddin, A. Assessment of seasonal variations of chemical characteristics in surface water using multivariate statistical methods. Int. J. Environ. Sci. Technol. 2011, 8, 581–592. [Google Scholar] [CrossRef]
  27. Shrestha, S.; Muangthong, S. Assessment of surface water quality of Songkhram River (Thailand) using environmetric techniques. Int. J. River Basin Manag. 2014, 12, 341–356. [Google Scholar] [CrossRef]
  28. Simeonov, V.; Stratis, J.; Samara, C.; Zachariadis, G.; Voutsa, D.; Anthemidis, A.; Sofoniou, M.; Kouimtzis, T. Assessment of the surface water quality in Northern Greece. Water Res. 2003, 37, 4119–4124. [Google Scholar] [CrossRef]
  29. Singh, P.; Chaturvedi, R.K.; Mishra, A.; Kumari, L.; Singh, R.; Pal, D.B.; Giri, D.D.; Singh, N.L.; Tiwary, D.; Mishra, P.K. Assessment of ground and surface water quality along the river Varuna, Varanasi, India. Environ. Monit. Assess. 2015, 187, 170. [Google Scholar] [CrossRef]
  30. Penilaian, K.; Aminu, I.; Hafizan, J.; Mohd, E.T.; Mustapha, A.; Azman, A.; Isiyaka, H.A. Assessment of Surface Water Quality Using Multivariate Statistical Techniques in the Terengganu River Basin. Malays. J. Anal. Sci. 2015, 19, 338–348. [Google Scholar]
  31. Hamid, A.; Bhat, S.A.; Bhat, S.U.; Jehangir, A. Environmetric techniques in water quality assessment and monitoring: A case study. Environ. Earth Sci. 2016, 75, 321. [Google Scholar] [CrossRef]
  32. Herojeet, R.; Rishi, M.S.; Lata, R.; Dolma, K. Quality characterization and pollution source identification of surface water using multivariate statistical techniques, Nalagarh Valley, Himachal Pradesh, India. Appl. Water Sci. 2017, 7, 2137–2156. [Google Scholar] [CrossRef]
  33. APHA. Standard Methods for the Examination of Water and Wastewater, 22nd ed.; American Public Health Association: Washington, DC, USA, 2012. [Google Scholar]
  34. Ioele, G.; De Luca, M.; Grande, F.; Durante, G.; Trozzo, R.; Crupi, C.; Ragno, G. Assessment of surface water quality using multivariate analysis: Case study of the crati River, Italy. Water 2020, 12, 2214. [Google Scholar] [CrossRef]
  35. Jung, K.Y.; Lee, K.L.; Im, T.H.; Lee, I.J.; Kim, S.; Han, K.Y.; Ahn, J.M. Evaluation of water quality for the Nakdong River watershed using multivariate analysis. Environ. Technol. Innov. 2016, 5, 67–82. [Google Scholar] [CrossRef]
  36. Kamaruddin, A.F. JurnalTeknologi Spatial and identification sources of pollution using multivariate analysis at. Spat. Charact. Identif. sources Pollut. using Multivar. Anal. Teren. River Basin Malays. 2015, 1, 269–273. [Google Scholar]
  37. IS10500; Indian Standard Drinking Water—Specification (Second Revision). Bureau of Indian Standards (BIS): New Delhi, India, 2012.
  38. Khound, N.J.; Bhattacharyya, K.G. Multivariate statistical evaluation of heavy metals in the surface water sources of Jia Bharali river basin, North Brahmaputra plain, India. Appl. Water Sci. 2017, 7, 2577–2586. [Google Scholar] [CrossRef]
  39. Khound, N.J.; Bhattacharyya, K.G. Assessment of water quality in and around Jia-Bharali river basin, North Brahmaputra Plain, India, using multivariate statistical technique. Appl. Water Sci. 2018, 8, 221. [Google Scholar] [CrossRef]
  40. Markad, A.T.; Landge, A.T.; Nayak, B.B.; Inamdar, A.B.; Mishra, A.K. A multivariate statistical approach for the evaluation of spatial and temporal dynamics of surface water quality from the small reservoir located in the drought-prone area of South-West India: A case study of Tiru reservoir (India). Environ. Sci. Pollut. Res. 2021, 28, 31031. [Google Scholar] [CrossRef] [PubMed]
  41. Koklu, R.; Sengorur, B.; Topal, B. Water quality assessment using multivariate statistical methods-a case study: Melen river system (Turkey). Water Resour. Manag. 2010, 24, 959–978. [Google Scholar] [CrossRef]
  42. Kumar, V.; Parihar, R.D.; Sharma, A.; Bakshi, P.; Sidhu, G.P.S.; Bali, A.S.; Karaouzas, I.; Bhardwaj, R.; Thukral, A.K.; Gyasi-Agyei, Y.; et al. Global evaluation of heavy metal content in surface water bodies: A meta-analysis using heavy metal pollution indices and multivariate statistical analyses. Chemosphere 2019, 236, 124364. [Google Scholar] [CrossRef] [PubMed]
  43. Kumarasamy, P.; James, R.A.; Dahms, H.U.; Byeon, C.W.; Ramesh, R. Multivariate water quality assessment from the Tamiraparani river basin, Southern India. Environ. Earth Sci. 2014, 71, 2441–2451. [Google Scholar] [CrossRef]
  44. Li, S.; Li, J.; Zhang, Q. Water quality assessment in the rivers along the water conveyance system of the Middle Route of the South to North Water Transfer Project (China) using multivariate statistical techniques and receptor modeling. J. Hazard. Mater. 2011, 195, 306–317. [Google Scholar] [CrossRef] [PubMed]
  45. Masoud, A.A. Groundwater quality assessment of the shallow aquifers west of the Nile Delta (Egypt) using multivariate statistical and geostatistical techniques. J. Afr. Earth Sci. 2014, 95, 123–137. [Google Scholar] [CrossRef]
  46. Muangthong, S.; Shrestha, S. Assessment of surface water quality using multivariate statistical techniques: Case study of the Nampong River and Songkhram River, Thailand. Environ. Monit. Assess. 2015, 187, 1–12. [Google Scholar] [CrossRef] [PubMed]
  47. Muxika, I.; Borja, Á.; Bald, J. Using historical data, expert judgement and multivariate analysis in assessing reference conditions and benthic ecological status, according to the European Water Framework Directive. Mar. Pollut. Bull. 2007, 55, 16–29. [Google Scholar] [CrossRef]
  48. Rizvi, N.; Katyal, D.; Joshi, V. Assessment of Water Quality of Hindon River in Ghaziabad and Noida, India By Using Multivariate Statistical Methods. J. Glob. Ecol. Environ. 2015, 3, 80–90. [Google Scholar]
  49. Phung, D.; Huang, C.; Rutherford, S.; Dwirahmadi, F.; Chu, C.; Wang, X.; Nguyen, M.; Nguyen, N.H.; Do, C.M.; Nguyen, T.H.; et al. Temporal and spatial assessment of river surface water quality using multivariate statistical techniques: A study in Can Tho City, a Mekong Delta area, Vietnam. Environ. Monit. Assess. 2015, 187, 1–13. [Google Scholar] [CrossRef]
  50. Chen, B.; Liang, X.; Xu, W.; Huang, X.; Li, X. The changes in trace metal contamination over the last decade in surface sediments of the Pearl River Estuary, South China. Sci. Total Environ. 2012, 439, 141–149. [Google Scholar] [CrossRef]
  51. Liu, C.W.; Lin, K.H.; Kuo, Y.M. Application of factor analysis in the assessment of groundwater quality in a blackfoot disease area in Taiwan. Sci. Total Environ. 2003, 313, 77–89. [Google Scholar] [CrossRef]
  52. Pati, S.; Dash, M.K.; Mukherjee, C.K.; Dash, B.; Pokhrel, S. Assessment of water quality using multivariate statistical techniques in the coastal region of Visakhapatnam, India. Environ. Monit. Assess. 2014, 186, 6385–6402. [Google Scholar] [CrossRef]
Figure 1. Map of Uttar Pradesh.
Water 15 03575 g001
Figure 2. Locations of sampling sites.
Water 15 03575 g002
Figure 3. (ah). Spatial variations in water quality parameters.
Water 15 03575 g003
Figure 4. Dendrogram of sampling locations.
Water 15 03575 g004
Figure 5. Scree plot.
Water 15 03575 g005
Figure 6. Rotated Component Box.
Water 15 03575 g006
Table 1. Statistical summary of observed data.
pHTemp.TurbidityTDSBOD5CODHardnessChlorideDO
Minimum6.4018.504.0040.0018.00155.00126.00130.000.78
Maximum8.3019.8026.70640.0032.00320.00170.00184.001.40
Mean7.4819.3216.64408.0026.11225.56154.22161.890.95
Stand. Error0.230.132.4171.011.5918.745.207.270.07
Median7.4019.4018.60450.0028.00220.00159.00174.000.90
Stand. Deviation0.700.407.24213.034.7856.2115.5921.810.21
Sample Variance0.490.1652.3845,382.0022.863159.03242.94475.610.05
Kurtosis−1.531.02−0.43−0.20−1.05−0.86−0.63−1.741.27
Skewness−0.16−0.99−0.52−1.00−0.520.30−0.76−0.571.44
Table 2. Correlation Matrix.
pHTemp.TurbidityTDSBOD5CODHardnessChlorideDO
pH1
Temp.0.331.00
Turbidity0.710.721.00
TDS0.250.650.701.00
BOD50.730.700.980.641.00
COD−0.81−0.68−0.92−0.62−0.951.00
Hardness0.690.630.970.750.95−0.891.00
Chloride−0.85−0.45−0.79−0.28−0.810.84−0.681.00
DO−0.09−0.35−0.23−0.37−0.280.35−0.33−0.031.00
Table 3. Communalities.
CharacteristicsInitialExtraction
pH1.000.782
T1.000.591
Tur1.000.956
TDS1.000.707
BOD51.000.961
COD1.000.955
TH1.000.921
Cl1.000.943
DO1.000.598
Table 4. Total variance analysed.
Initial EigenvaluesExtraction Sums of Squared LoadingsRotation Sums of Squared Loadings
ComponentTotalPercentage of VarianceCumulative PercentageTotalPercentage of VarianceCumulative PercentageTotalPercentage of VarianceCumulative Percentage
15.86465.16165.1615.86465.16165.1615.31259.02259.022
21.55017.22582.3861.55017.22582.3862.10323.36382.386
30.6627.35989.745
40.5836.48196.226
50.2062.29398.519
60.0890.98599.504
70.0430.48299.986
80.0010.014100.000
9 0.000 0.000 100.000
Table 5. Rotated component matrix.
Component
12
Cl−0.9520.189
BOD50.9300.309
COD−0.929−0.303
Tur0.9160.342
pH0.881−0.078
TH0.8380.468
Temp0.5880.495
TDS0.0960.836
DO−0.058−0.771
Table 6. Similar research studies [20,21,22,23].
AuthorYearNo. of Sampling SitesConclusion
Singh et al. 200508Agricultural soil weathering, leaching and runoff; municipal and industrial wastewater
Singh et al.200408Natural and anthropogenic sources of pollution
Singh et al. 200908Wastewater drains and organic loading
Somvanshi et al. 201205Industrial and domestic wastewater
Disclaimer/Publisher’s Note: The statements, opinions and data contained in all publications are solely those of the individual author(s) and contributor(s) and not of MDPI and/or the editor(s). MDPI and/or the editor(s) disclaim responsibility for any injury to people or property resulting from any ideas, methods, instructions or products referred to in the content.

