Carbon Accounting and Carbon Emission Reduction Potential Analysis of Sponge Cities Based on Life Cycle Assessment
Abstract
:1. Introduction
2. Methods and Processes
2.1. Subsection Case Study Area and Overview
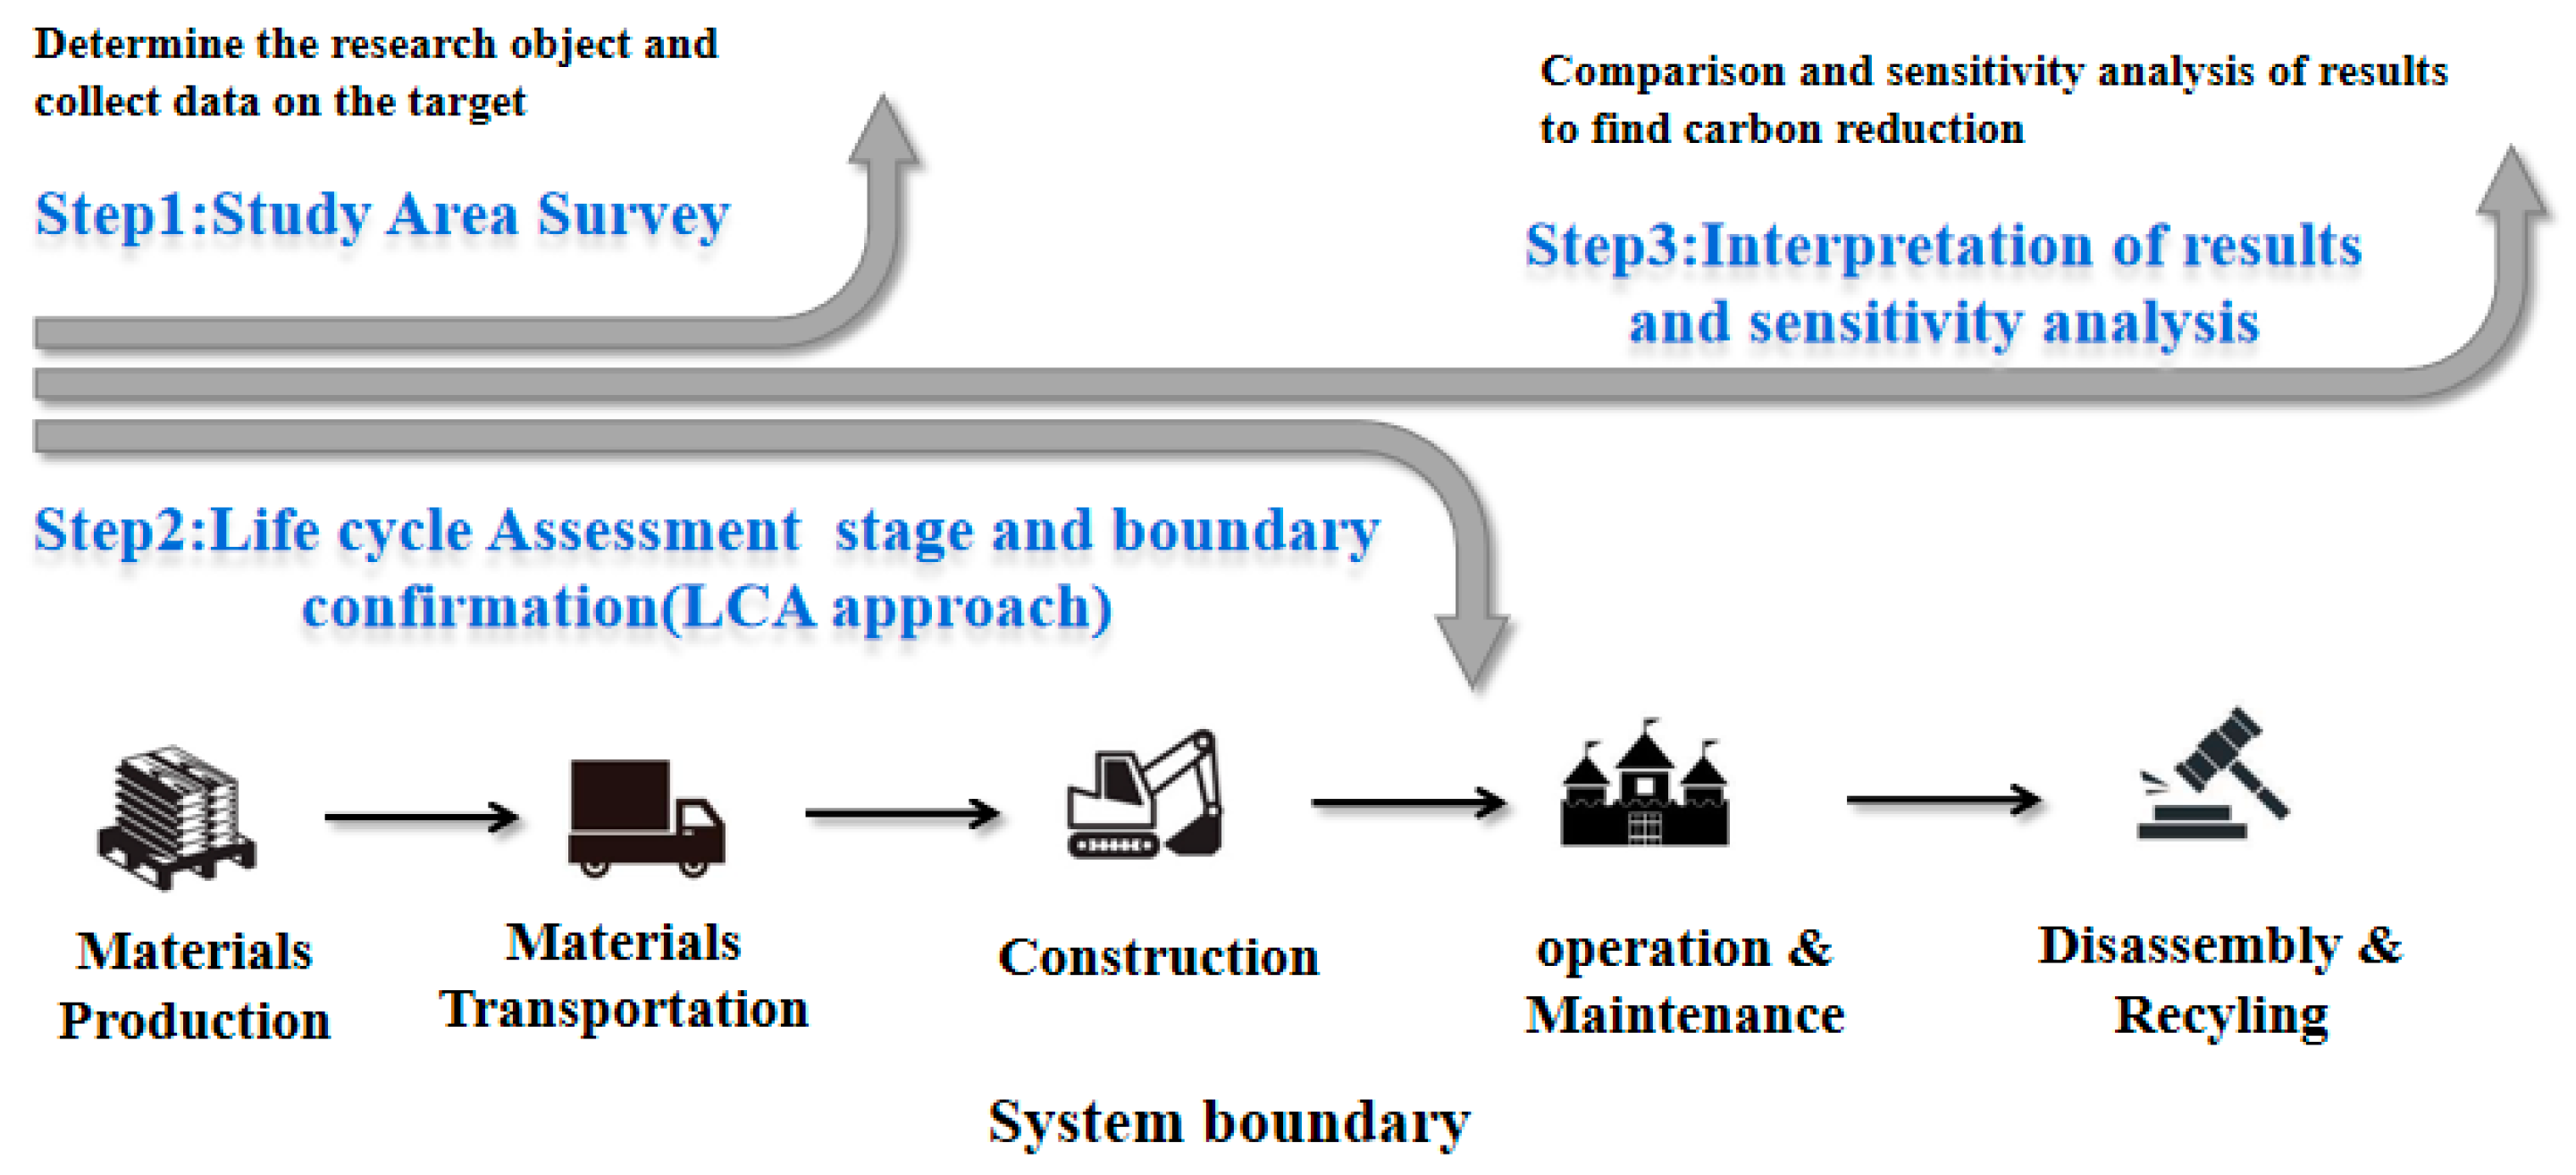
2.2. Life Cycle Assessment
2.2.1. Goal
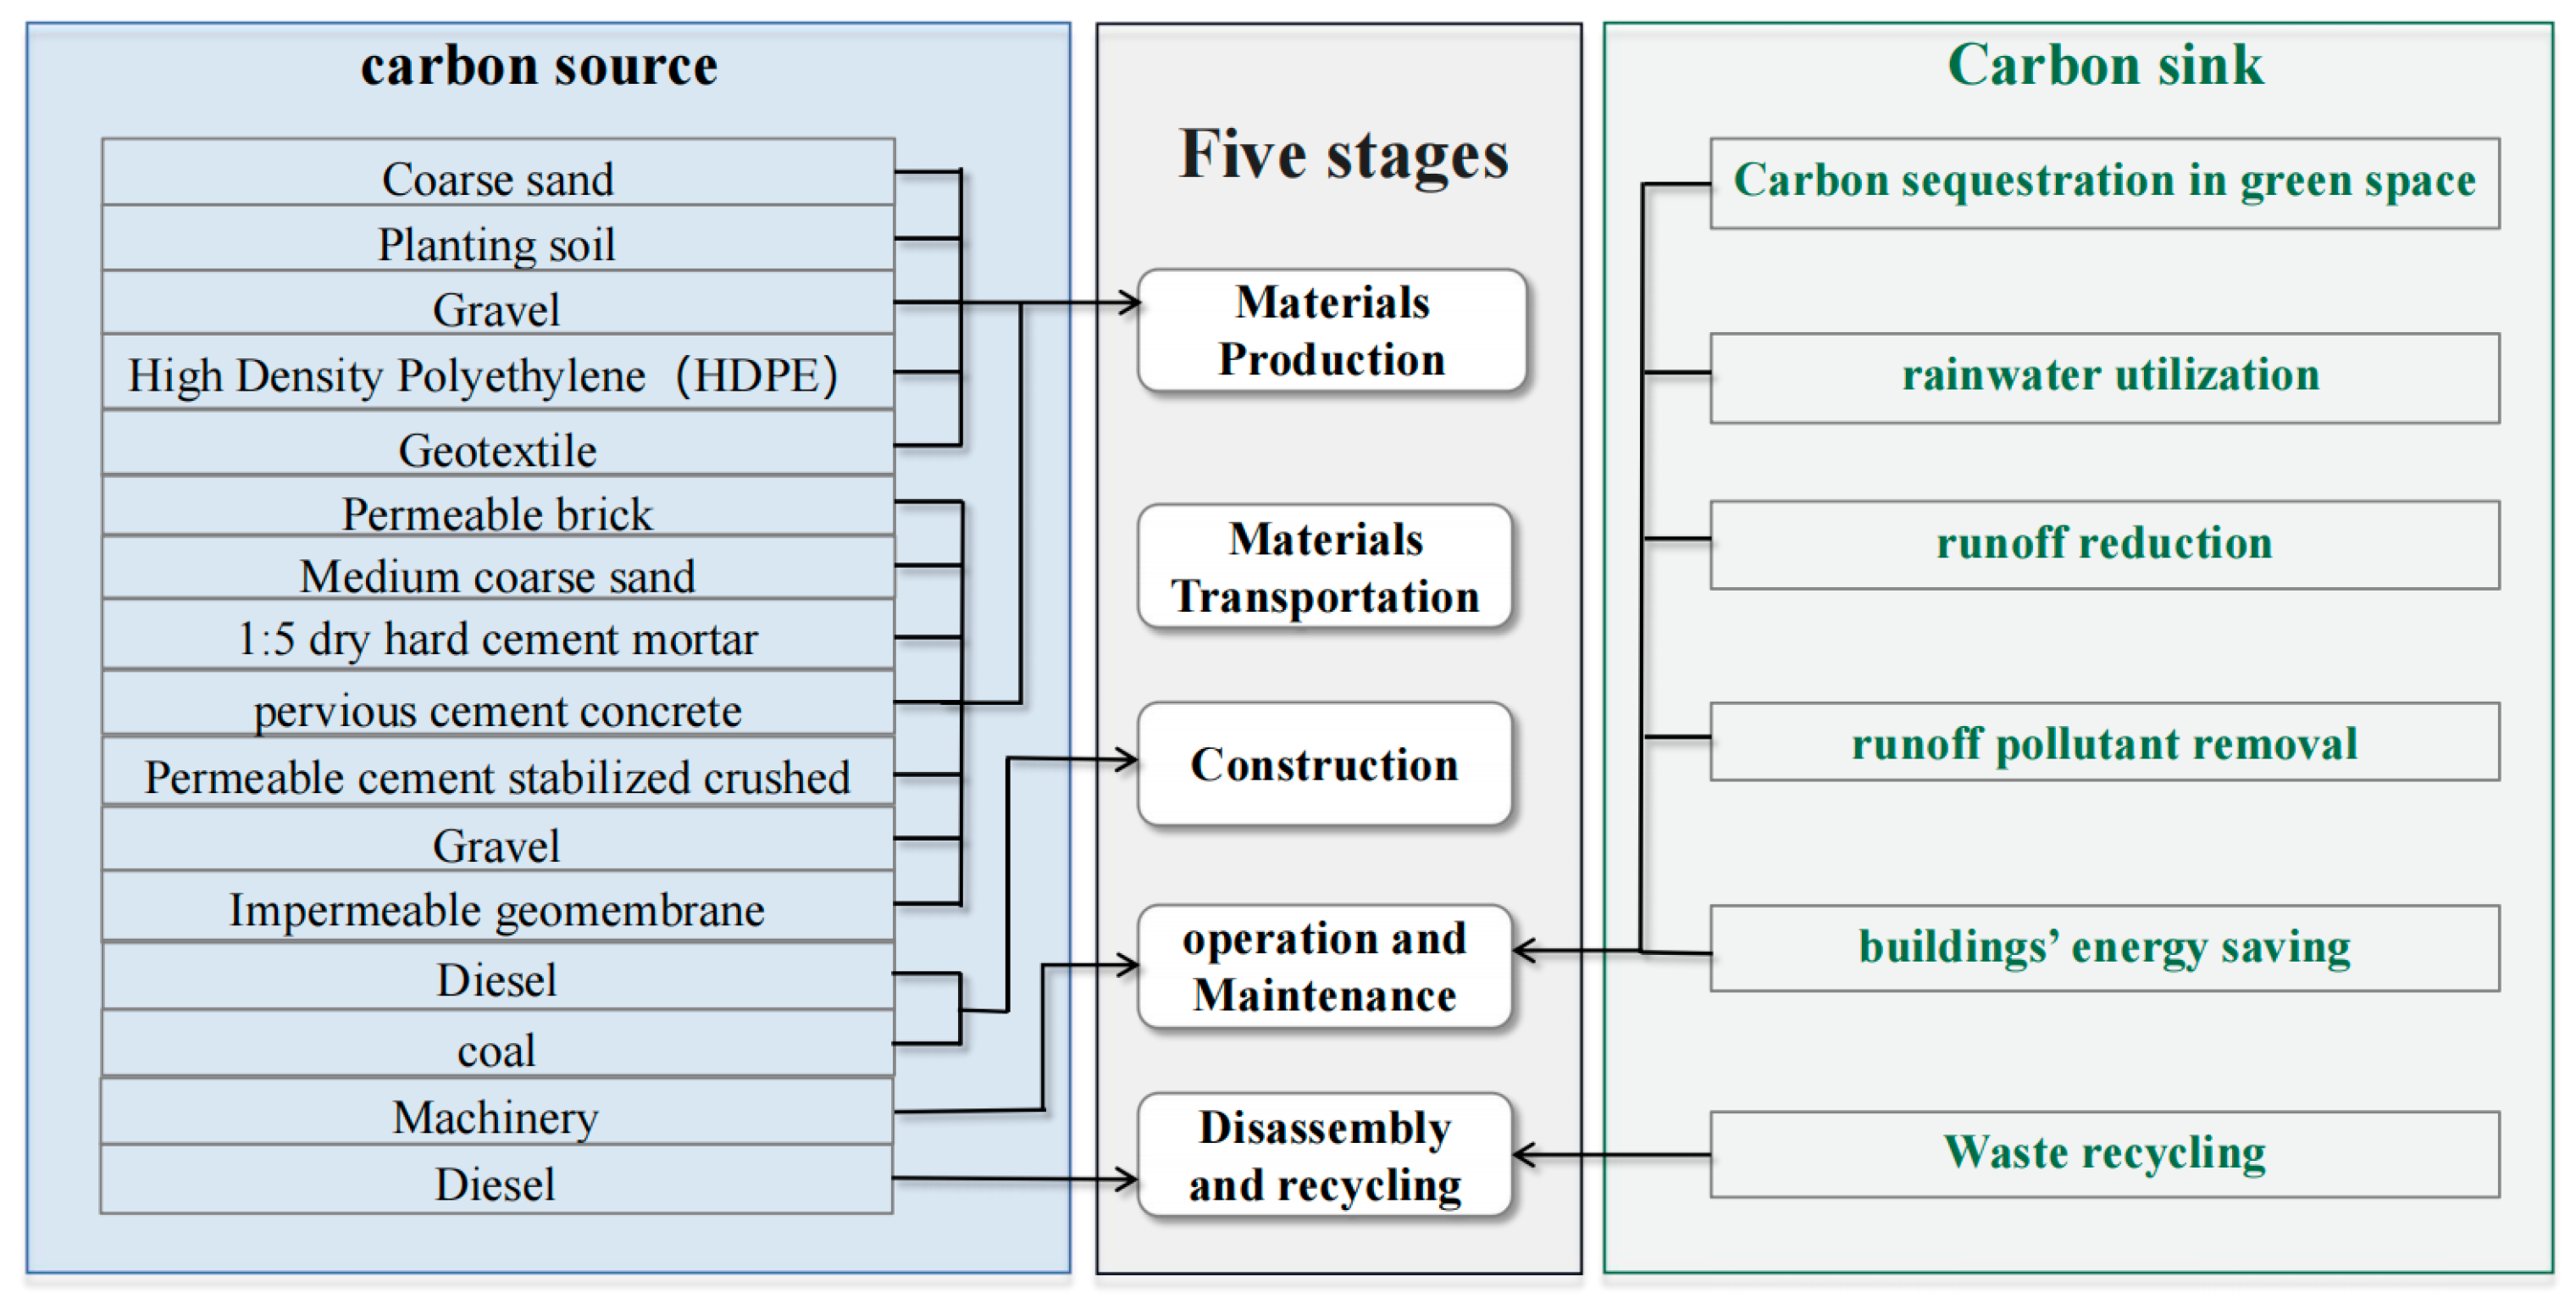
2.2.2. System Boundary and Inventory
2.3. Method of Carbon Emission Accounting
3. Life Cycle Inventory Analysis
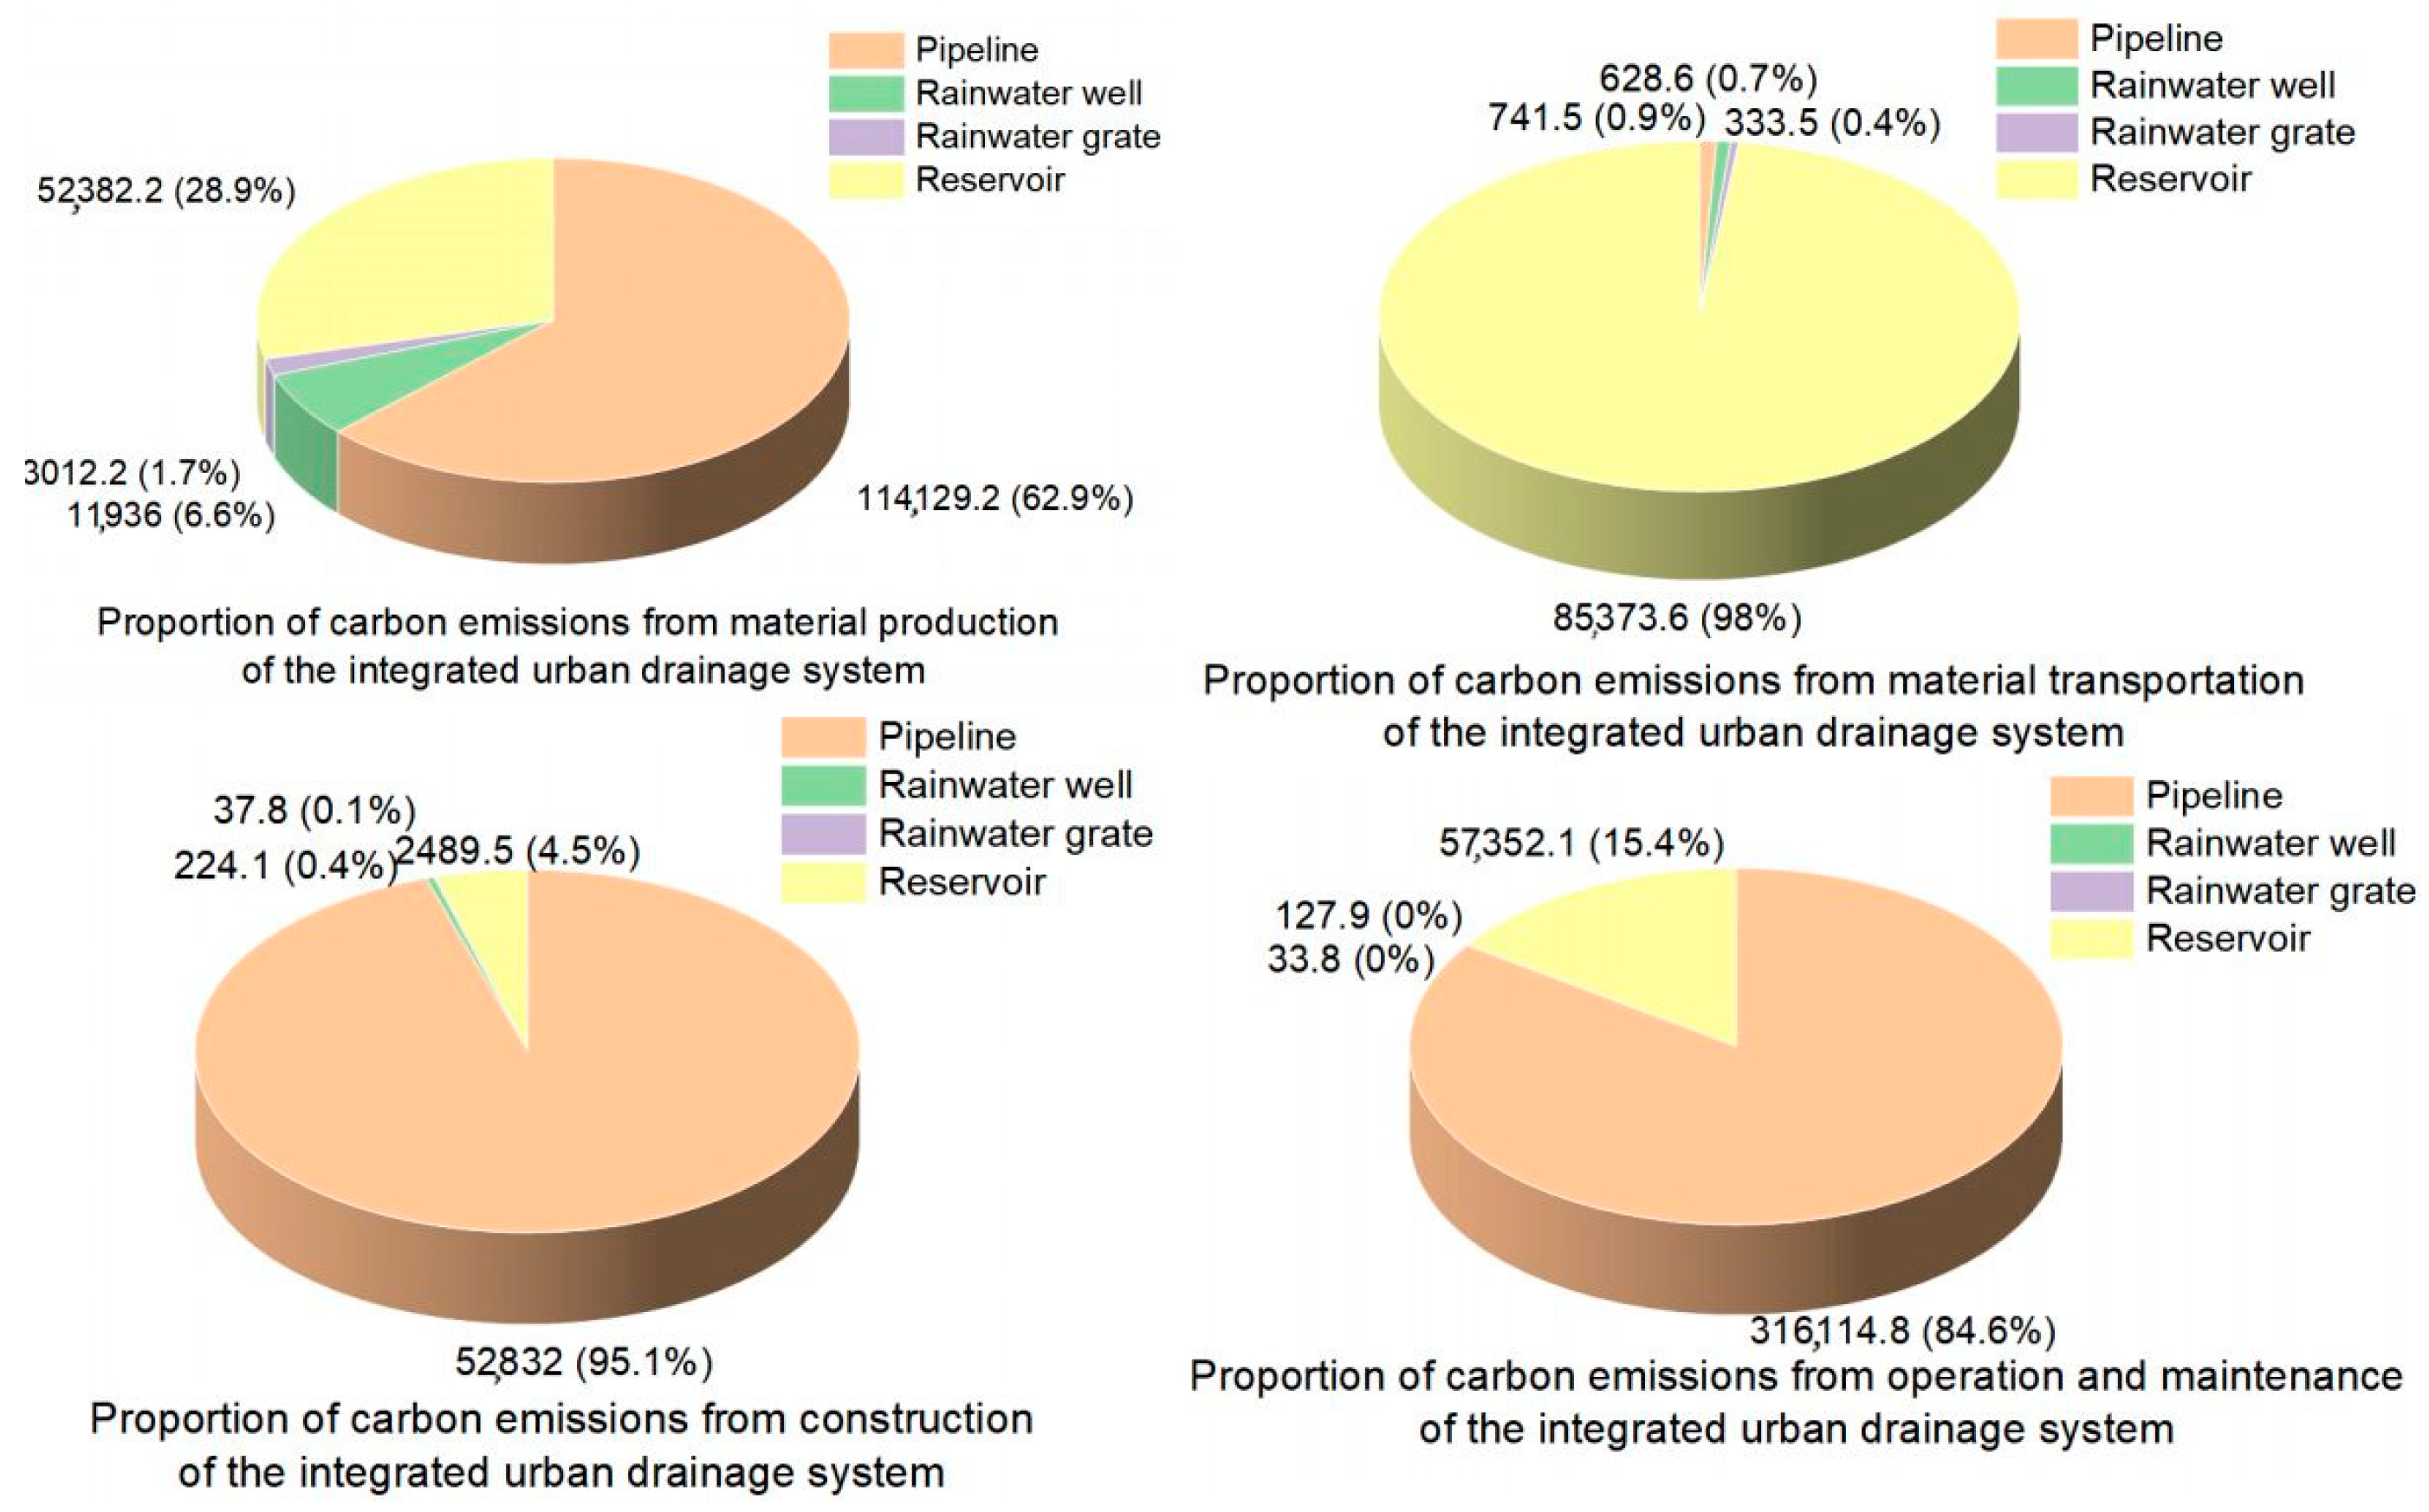
3.1. Carbon Emissions from Material Production
3.2. Carbon Emissions from Material Transportation
3.3. Carbon Emissions from Construction
3.4. Carbon Emissions from Plant Maintenance
3.4.1. Plant Maintenance Carbon Emissions
3.4.2. Carbon Emissions from Mechanical Operation and Maintenance
3.4.3. Carbon Sink
3.5. Carbon Emissions from Disassembly and Recycling
4. Results and Discussion
4.1. Carbon Emissions from IUDS
4.2. Carbon Emissions from Sponge City
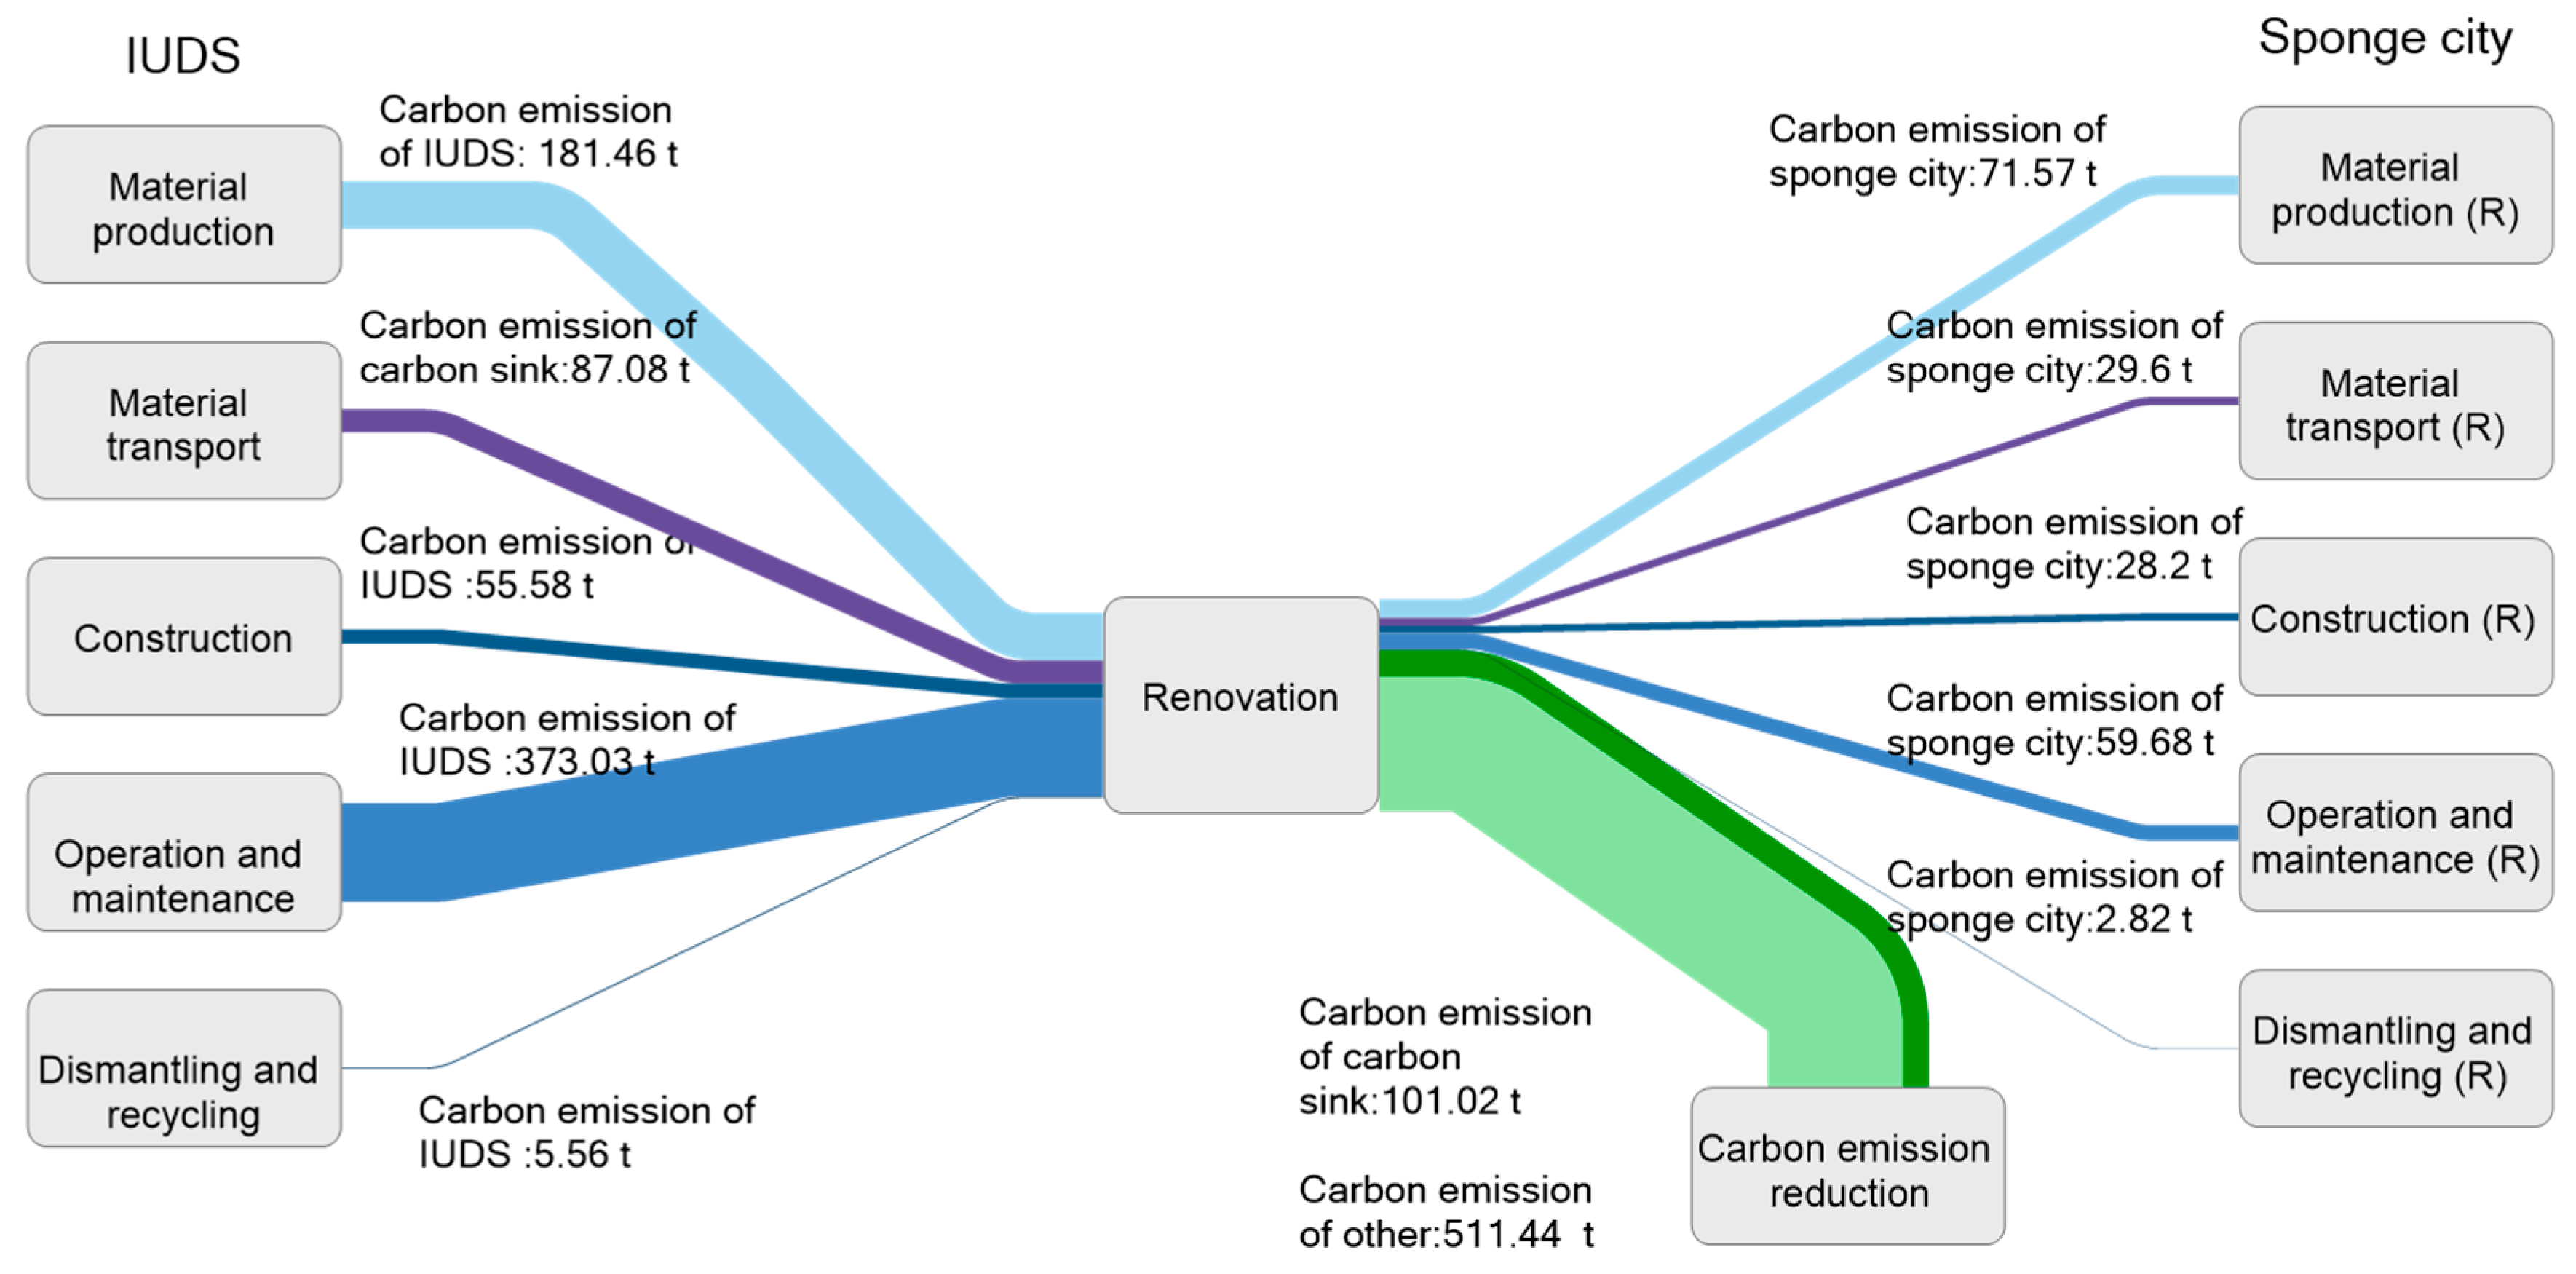
4.3. Comparative Analysis of IUDS and Sponge City
4.4. Sensitivity Analysis
4.5. Suggestion
- (1)
- The energy-saving and low-carbon sponge city construction materials were used in the process of material production. During the construction of a sponge city, a large amount of carbon emissions are generated in the material production process. Therefore, it is suggested to use more environmentally friendly materials with low carbon emission coefficients, renewable materials, and materials produced from industrial or urban solid waste to reduce carbon emissions. For example, Biochar (BC) [32] was used in the green roof, which reduced the daily heat gain of the green roof by at least 0.06 MJ/m2. Biological carbon not only plays a significant role in stormwater runoff but also achieves better hydrothermal properties compared with BC-free ones.
- (2)
- Local manufacturers close to the construction site and energy-saving construction process should be selected. Due to the high density and thickness of the material, convenient transportation and nearby selection of material origin can reduce transportation carbon emissions. During the construction phase, trenchless top pipe construction is chosen to lay pipelines, energy-saving and environmental protection technologies to reduce energy consumption for transportation and machinery within the site. For example, LED lawn lights are used for night construction,
- (3)
- The vegetation selection and maintenance of the sponge city were chosen and designed scientifically and rationally. The carbon sequestration rate of the plants in the green area has an important impact on the sponge city. It is necessary to choose plant species with strong carbon sequestration ability and drought resistance, such as white Yulania soulangeana, Prunus davidiana, etc. At the same time, it is necessary to reduce dependence on fertilizers, pesticides, and other chemicals. Reduce the use of chemical fertilizers and combinate with inorganic fertilizers, or mix and compost the mowed lawn grass and fallen leaves from autumn collection sites with sewage from septic tanks to reduce carbon emissions. Biological control methods can be used, and natural enemies of pests can be used to reduce insect pests, such as lace flies, to control aphids.
5. Conclusions
Author Contributions
Funding
Data Availability Statement
Acknowledgments
Conflicts of Interest
References
- Yu, K.; Li, D.; Yuan, H.; Fu, W.; Qiao, Q.; Wang, S. “Sponge City”: Theory and Practice. City Plan. Rev. 2015, 39, 26–36. [Google Scholar]
- Xia, J.; Zhang, Y.Y.; Xiong, L.H.; Shan, H.E.; Wang, L.F.; Zhongbo, Y.U. Opportunities and challenges of the Sponge City construction related to urban water issues in China. Sci. China Earth Sci. 2017, 60, 652–658. [Google Scholar] [CrossRef]
- Technical Guidelines for Sponge City Construction: Construction of Rainwater Systems for Low Impact Development (Trial); Ministry of Housing and Urban Rural Development: Beijing, China, 2014.
- Zhang, J.; Wang, Y.; Hu, Q.; He, R. Discussion and views on some issues of the sponage city construction in China. Adv. Water Sci. 2016, 27, 793–799. [Google Scholar]
- Vitousek, P.M.; Mooney, H.A.; Lubchenco, J.; Melillo, J.M. Human Domination of Earth’s Ecosystems. Science 1997, 277, 494–499. [Google Scholar] [CrossRef]
- Mahlman, J.D. Uncertainties in Projections of Human-Caused Climate Warming. Science 1997, 278, 1416–1417. [Google Scholar] [CrossRef]
- Churkina, G. Modeling the carbon cycle of urban systems. Ecol. Model. 2008, 216, 107–113. [Google Scholar] [CrossRef]
- Chen, J.; Gao, M.; Cheng, S.; Hou, W.; Song, M.; Liu, X.; Liu, Y.; Shan, Y. County-level CO2 emissions and sequestration in China during 1997–2017. Sci. Data 2020, 7, 391. [Google Scholar] [CrossRef]
- Su, X.; Shao, W.; Liu, J.; Jiang, Y.; Wang, J.; Yang, Z.; Wang, N. How does sponge city construction affect carbon emission from integrated urban drainage system? J. Clean. Prod. 2022, 363, 132595. [Google Scholar] [CrossRef]
- Wang, Y.; Li, H.; Abdelhady, A.; Harvey, J. Initial evaluation methodology and case studies for life cycle impact of permeability of permeable pavements. Int. J. Transp. Sci. Technol. 2018, 7, 169–178. [Google Scholar] [CrossRef]
- Getter, K.L.; Rowe, D.B.; Robertson, G.P.; Cregg, B.M.; Andresen, J.A. Carbon sequestration potential of extensive green roofs. Environ. Sci. Technol. 2009, 43, 7564–7570. [Google Scholar] [CrossRef]
- Yao, X.; Song, C. Effect of different factors dominated by water level environment on wetland carbon emissions. Environ. Sci. Pollut. Res. 2022, 29, 74150–74162. [Google Scholar] [CrossRef] [PubMed]
- Flynn, K.M.; Traver, R.G. Green infrastructure life cycle assessment: A bio-infiltration case study. Ecol. Eng. 2013, 55, 9–22. [Google Scholar] [CrossRef]
- Ian, C.; John, K.; Cui, Y. Evaluation of hidden carbon content of traditional Pavement and pervious concrete Pavement Brick Pavement. Struct. Units Units Archit. 2012, 32–35+25. (In Chinese) [Google Scholar]
- O’Sullivan, A.D.; Wicke, D.; Hengen, T.J.; Sieverding, H.L.; Stone, J.J. Life Cycle Assessment modelling of stormwater treatment systems. J. Environ. Manag. 2015, 149, 236–244. [Google Scholar] [CrossRef] [PubMed]
- Jie, M. A Study of Carbon Emissions of Typical Measures Adopted in Sponge City. For. Coll. 2018, 16, 27–32. [Google Scholar]
- Lin, X.; Ren, J.; Xu, J.; Zheng, T.; Cheng, W.; Qiao, J.; Huang, J.; Li, G. Prediction of Life Cycle Carbon Emissions of Sponge City Projects: A Case Study in Shanghai, China. Sustainability 2018, 10, 3978. [Google Scholar] [CrossRef]
- Shao, W.; Liu, J.; Yang, Z.; Yang, Z.; Yu, Y.; Li, W. Carbon Reduction Effects of Sponge City Construction: A Case Study of the City of Xiamen. Energy Procedia 2018, 152, 1145–1151. [Google Scholar] [CrossRef]
- Li, C. Study on carbon emission of sponge city stormwater system based on life cycle assessment. Environ. Sustain. Dev. 2019, 44, 132–137. [Google Scholar]
- Zheng, T. Estimation of Carbon Emission during Sponge City Reconstruction of esidential Community. China Water Wastewater 2021, 37, 112–119. [Google Scholar]
- Su, J.; Li, J.; Gao, X.; Yao, Y.; Jiang, C. Comprehensive analysis of waterlogging control and carbon emission reduction for optimal LID layout: A case study in campus. Environ. Sci. Pollut. Res. 2022, 29, 87802–87816. [Google Scholar] [CrossRef]
- Chunjing, S.; Chenglong, C.; Zhihui, Z. Quantitative Assessment on Carbon Emission of Different Structures in Building Life Cycle. Build. Sci. 2011, 27, 66–70+95. [Google Scholar]
- GJBT-975 06MS201; Municipal Drainage Pipeline Engineering and Auxiliary Facilities. China, 2006. Available online: http://www.jianhuw.com/Geipai/guifan/376337.html (accessed on 4 October 2023).
- Zhang, X. Carbon Emussions Measurement Methods and Comparative Studies on Green Building Structural System. Master’s Thesis, Harbin Institute of Technology, Harbin, China, 2014. [Google Scholar]
- Cui, P. The Establishment of a Life-Cycle Carbon Emission Factor Database for Buildings and Research. Master’s Thesis, Southeast University, Nanjing, China, 2015. [Google Scholar]
- Xiong, B. Study on the Estimation of Carbon Emissions of Residential Buildings during Their Whole Life Cycle. Master’s Thesis, Shenzhen University, Shenzhen, China, 2015. (In Chinese). [Google Scholar]
- National Bureau of Statistics. China Statistical Yearbook-2021; China Statistics Press: Beijing, China, 2021. [Google Scholar]
- Lu, L. Life Cycle Assessment of Two Typical Low Impact Development Technology. Master’s Thesis, Beijing University of Civil Engineering and Architecture, Beijing, China, 2013. [Google Scholar]
- Kun, H. Research on the Water Quality Evaluation and Use or Rain on City Area. Master’s Thesis, Harbin Institute of Technology, Harbin, China, 2009. [Google Scholar]
- Chen, L. Research on Carbon Emission Calculation and Emission Reduction Strategy of Residential Buildings in the Whole Life Cycle—A Case Study of Lishui New Town Project in Shenyang. Master’s Thesis, Shenyang Jianzhu University, Shenyang, China, 2020. [Google Scholar]
- Li, J.; Zhang, X.; Li, H. A case study of Carbon Emissions in the Construction and Operation of the Sponge City in a Certain Area of Beijing. Water Resour. Prot. 2023, 39, 86–93. [Google Scholar]
- Tan, K.; Wang, J. Substrate modified with biochar improves the hydrothermal properties of green roofs. Environ. Res. 2023, 216, 114405. [Google Scholar] [CrossRef] [PubMed]


| Installation | Structure | Raw Processed Material | Carbon Emission Factor | Total Weight | Carbon Emissions |
|---|---|---|---|---|---|
| (kg/Unit) | (kg) | (kgCO2eq) | |||
| IUDS | Pipeline | UPVC | 7930.00 kg/t | 7233.29 | 57,359.97 |
| Steel reinforced concrete | 1915.92 kg/t [22] | 29,630.29 | 56,769.26 | ||
| Rain well (φ 1000 circular brick rainwater inspection well (closed type) D = 200~600) [23] | Spall | 2.18 kg/t | 6138.00 | 13.38 | |
| C15 concrete | 264.60 kg/m3 [24] | 12,267.00 | 3245.85 | ||
| MU10 brick masonry with M7.5 cement mortar | 257.79 [25], 250.00 kg/m3 | 269.28 | 5320.53 | ||
| 1:2 Waterproof cement mortar plastering | 531.25 kg/m3 [25] | 1944.00 | 1032.53 | ||
| Rainwell cover | 2500.00 kg/t [25] | 792.00 | 1980.00 | ||
| Plastic-clad ladder (deformed steel) | 3154.00 kg/t [25] | 108.90 | 343.47 | ||
| Rain olivier (brick flat grate-type single-grate gutter inlet (cast iron well ring)) [23] | Spall | 2.18 kg/t | 1813.50 | 3.95 | |
| C15 concrete | 264.60 kg/m3 [24] | 2570.04 | 680.03 | ||
| M10 cement mortar MU15 brick | 315.39 kg/m3 [25] | 1368.00 | 431.45 | ||
| 1:2 waterproof cement mortar plastering | 531.25 kg/m3 [25] | 1368.00 | 726.75 | ||
| A-type cast iron grate cover seat | 2500.00 kg/t [25] | 468.00 | 1170.00 | ||
| Reservoir (200 m3) [23] | Ready-mixed C15 concrete | 200.00 kg/m3 [26] | 16,968.00 | 1414.00 | |
| Permeability resistance grade of ready-mixed C20 concrete p6 | 239.19 kg/m3 [26] | 130,896.00 | 13,045.42 | ||
| Concrete iron | 3755.00 kg/t [24] | 9129.35 | 34,280.70 | ||
| Dry mixed plastering cement mortar DPM20 | 473.00 kg/m3 [24] | 13,090.00 | 3642.10 | ||
| Total | 236,053.64 | 181,459.63 |
| Installation | Structure | Raw Processed Material | Carbon Emission Factor | Total Weight | Carbon Emissions |
|---|---|---|---|---|---|
| (kg/Unit) | (kg) | (kgCO2eq) | |||
| Sponge city | Biodetention facilities | Planting soil | 0 | 305.1 | 0 |
| Grouan | 2.51 kg/t | 203.37 | 714.64 | ||
| Spall | 2.18 kg/t | 1642.75 | 8451.61 | ||
| High-density polyethylene (HDPE) | 2620.00 kg/t | 1184.45 | 41,532.17 | ||
| Geotextile | 0.16 kg/m2 | 3896.31 | 623.41 | ||
| Permeable pavement | Permeable brick | 320.00 kg/m3 | 15.66 | 5012.35 | |
| Medium coarse sand | 12.00 kg/m3 [26] | 4.7 | 56.39 | ||
| 1:5 dry hard cement mortar | 393.65 kg/m3 | 4.7 | 1849.79 | ||
| Imperious cement concrete | 201.38 kg/m3 [26] | 31.33 | 6308.67 | ||
| Permeable cement stabilized crushed stone | 12.69 kg/m3 | 31.33 | 397.54 | ||
| Spall (30—50 mm) | 2.18 kg/t | 54.82 | 282.05 | ||
| Impermeable geomembrane | 0.16 kg/m2 [16] | 2349.54 | 375.93 | ||
| Overflow well | - | - | 10,759.59 | 5967.99 | |
| Total | 20,483.66 | 71,573.89 |
| Installation | Structure | Total Weight | Carbon Emission Factor | Carbon Emissions |
|---|---|---|---|---|
| (kg) | (kg/Unit) | (kgCO2eq) | ||
| IUDS | Dry mixed plastering cement mortar DPM20 | 13,090.00 | 0.078 kgCO2eq/(t*km) | 179.70 |
| Reinforced concrete pipe | 29,630.29 | 501.90 | ||
| UPVC | 7233.29 | 0.179 kgCO2eq/(t*km) | 239.55 | |
| Spall | 7951.50 | 284.66 | ||
| Concrete iron | 9129.35 | 0.162 kgCO2eq/(t*km) | 260.30 | |
| MU10 brick masonry with M7.5 cement mortar | 269.28 | 0.286 kgCO2eq/(t*km) | 13.55 | |
| 1:2 Waterproof cement mortar plastering | 3312.00 | 167.71 | ||
| Rainwell cover | 792.00 | 39.87 | ||
| Plastic-clad ladder (deformed steel) | 108.90 | 5.48 | ||
| M10 cement mortar MU15 brick | 1368.00 | 68.86 | ||
| A-type cast iron grate cover seat | 468.00 | 23.56 | ||
| Concrete | 162,701.04 | 3.670 kgCO2eq/(t*km) | 85,293.06 | |
| Total | 87,077.20 | |||
| Sponge city | Permeable brick | 78,318.00 | 0.057 kgCO2eq/(t*km) | 785.69 |
| Concrete | 84,451.50 | 978.92 | ||
| Grouan | 292,233.73 | 3093.13 | ||
| Planting soil | 518,670.00 | 5203.30 | ||
| Spall | 1,775,199.34 | 18,706.15 | ||
| Cement mortar | 8928.25 | 0.162 kgCO2eq/(t*km) | 303.49 | |
| Perforated blind pipe (HDPE) | 15,851.86 | 451.97 | ||
| Geotextile | 396.00 | 0.286 kgCO2eq/(t*km) | 47.16 | |
| Fertilizer | 0.01 | 0.00 | ||
| MU10 brick masonry with M7.5 cement mortar | 134.64 | 6.78 | ||
| Rainwell cover | 396.00 | 19.93 | ||
| Plastic-clad ladder (deformed steel) | 54.45 | 2.74 | ||
| Total | 29,599.24 |
| Installation | Calculated Items | Unit Energy Consumption | Carbon Emission Factor | Carbon Emissions |
|---|---|---|---|---|
| (kJ/m2) [16,28] | (kg/Unit) | (kgCO2eq) | ||
| IUDS/sponge city | Material stacking | 5220 | The carbon emission conversion coefficient of standard coal is 29.30 kg/GJ | Total: (1) IUDS is 55,583.28 kgCO2eq (2) Sponge city is 28,202.24 kgCO2eq |
| Foundation excavation | 27,260 | |||
| Earth backfilling | 17,030 | |||
| Site cleaning | 10,000 | |||
| Air compressor | 2270 | |||
| Precast concrete | 90,000 | |||
| Greening and vegetation | 2270 | |||
| Temporary service | 22,650 | |||
| Site mixed concrete | 158,400 | |||
| Paving | 1140 | |||
| Site layout | 52,240 | |||
| Crane operation | 39,750 |
| Installation | Calculated Items | Calculation Type | Material Consumption (Unit/m2) | Carbon Emission Factor [11] | Carbon Emissions (kgCO2eq) |
|---|---|---|---|---|---|
| IUDS/sponge city | Prune | Hedgerow machine | 105.73 L/m2 | 0.592 kg/L | Total: (1) IUDS is 114,704.25 kgCO2eq (2) Sponge city is 27,695.64 kgCO2eq |
| Grass mower | 57.84 L/m2 | 0.592 kg/L | |||
| Spread manure | Compound fertilizer | 37.63 kg/m2 | 0.742 kg/kg | ||
| Insecticide | 20.83 kg/m2 | 5.1 kg/kg | |||
| Bactericide | 11.82 kg/m2 | 3.9 kg/kg | |||
| Fuel consumption of the dispenser | 5.29 L/m2 | 0.592 kg/L | |||
| Irrigate | Running water | 308.79 t/m2 | 1.05 kg/t |
| Carbon Emission Factor of the Rainwater Garden (kg/m2) | Carbon Emission Factor of the Green Space (kg/m2) | Area (m2) | Carbon Sink (kgCO2eq) |
|---|---|---|---|
| 2.2255 [15] | 1.6018 [15] | 679.46 | 21,188.96 kgCO2eq |
| Items | COD |
|---|---|
| Annual rainfall (mm) | 584.60 |
| Initial rainwater (mm) | 12.00 |
| The total annual runoff control rate (%) | 48 |
| Control rainfall (mm) | 280.61 |
| Runoff coefficient | 0.72 |
| Catchment area (m2) | 4700 |
| Runoff control volume (m3) | 949.42 |
| Pavement pollutant concentration (mg/L) | 775.00 [29] |
| Processing efficiency (%) | 70 |
| Carbon emission factor (kg/kg) | 3.1 [20] |
| Year (a) | 50 |
| Carbon sink (kgCO2eq) | 79,834.00 |
| Influence Factors | Corresponding Stage | Change of the Carbon Emissions during Each Process | ||||
|---|---|---|---|---|---|---|
| −20% | −10% | 10% | 20% | |||
| IUDS | UPVC | Material production | −6.32% | −3.16% | 3.16% | 6.32% |
| Transport distance (C20 ready-mixed concrete) | Material transportation | −19.42% | −9.71% | 9.71% | 19.42% | |
| Rainwater forced drainage | Operation and maintenance | −8.16% | −4.08% | 4.08% | 8.16% | |
| Sponge city | HDPE | Material production | −11.61% | −5.80% | 5.80% | 11.60% |
| Transport distance (gravel) | Material transportation | −11.14% | −5.57% | 5.57% | 11.14% | |
| Annual rainfall | Operation and maintenance | −38.62% | −19.31% | 19.31% | 38.62% | |
| Carbon sequestration rates of green space | Operation and maintenance | −36.58% | −18.29% | 18.29% | 36.58% | |
| Fertilization and deworming | Operation and maintenance | 11.71% | 5.85% | −5.85% | −11.71% | |
| Influence Factor | Change of Carbon Emissions during the Whole Process | ||||
|---|---|---|---|---|---|
| −20% | −10% | 10% | 20% | ||
| IUDS | UPVC | −1.63% | −0.82% | 0.82% | 1.63% |
| Transport distance | −2.48% | −1.24% | 1.24% | 2.48% | |
| Rainwater forced drainage | −4.34% | −2.17% | 2.17% | 4.34% | |
| Sponge city | HDPE | −9.14% | −4.57% | 4.57% | 9.14% |
| Transport distance | −6.52% | −3.26% | 3.26% | 6.52% | |
| Annual rainfall | 17.57% | 8.79% | −8.79% | −17.57% | |
| Carbon sequestration rates of green space | 16.64% | 8.32% | −8.32% | −16.64% | |
| Fertilization and deworming | −5.33% | −2.66% | 2.66% | 5.33% | |
Disclaimer/Publisher’s Note: The statements, opinions and data contained in all publications are solely those of the individual author(s) and contributor(s) and not of MDPI and/or the editor(s). MDPI and/or the editor(s) disclaim responsibility for any injury to people or property resulting from any ideas, methods, instructions or products referred to in the content. |
© 2023 by the authors. Licensee MDPI, Basel, Switzerland. This article is an open access article distributed under the terms and conditions of the Creative Commons Attribution (CC BY) license (https://creativecommons.org/licenses/by/4.0/).
Share and Cite
Zhao, Z.; Liu, C.; Xie, H.; Li, Y.; Zhu, C.; Liu, M. Carbon Accounting and Carbon Emission Reduction Potential Analysis of Sponge Cities Based on Life Cycle Assessment. Water 2023, 15, 3565. https://doi.org/10.3390/w15203565
Zhao Z, Liu C, Xie H, Li Y, Zhu C, Liu M. Carbon Accounting and Carbon Emission Reduction Potential Analysis of Sponge Cities Based on Life Cycle Assessment. Water. 2023; 15(20):3565. https://doi.org/10.3390/w15203565
Chicago/Turabian StyleZhao, Zhonghui, Changqi Liu, Hao Xie, Yang Li, Chong Zhu, and Meijing Liu. 2023. "Carbon Accounting and Carbon Emission Reduction Potential Analysis of Sponge Cities Based on Life Cycle Assessment" Water 15, no. 20: 3565. https://doi.org/10.3390/w15203565
APA StyleZhao, Z., Liu, C., Xie, H., Li, Y., Zhu, C., & Liu, M. (2023). Carbon Accounting and Carbon Emission Reduction Potential Analysis of Sponge Cities Based on Life Cycle Assessment. Water, 15(20), 3565. https://doi.org/10.3390/w15203565


