Article

Optimizing the Flood Limit Water Level of Reservoirs in Sediment-Laden Rivers under Changing Water and Sediment Conditions: A Case Study of the Xiaolangdi Reservoir

1
Yellow River Engineering Consulting Co., Ltd., Zhengzhou 450003, China
2
Key Laboratory of Water Management and Water Security for Yellow River Basin, Ministry of Water Resources (Under Construction), Zhengzhou 450003, China
*
Author to whom correspondence should be addressed.
Water 2023, 15(20), 3552; https://doi.org/10.3390/w15203552
Submission received: 20 August 2023 / Revised: 18 September 2023 / Accepted: 25 September 2023 / Published: 11 October 2023
(This article belongs to the Section Hydrology)

Abstract

:
Optimizing the flood limit water level (FLWL) of reservoirs in sediment-laden rivers under changing water and sediment conditions is an important research topic that could improve comprehensive utilization benefits. Because reservoir operation has multiple objectives in sediment-laden rivers, this study established a water–sediment mathematical model, a comprehensive benefit evaluation model, and an evaluation index system. Taking the Xiaolangdi Reservoir of the Yellow River as an example, the operation mode of the FLWL under changing water and sediment conditions was studied. Under the scenarios of incoming sediment amounts of 300–800 million tons, when using the operation mode of gradually raising the FLWL, the sediment retention period was 4–13 years longer; the lower average annual siltation of the downstream channel and minimum bank-full discharge of the downstream channel after 50 years was larger by 150–260 m3/s than the operation mode of raising the FLWL at one time. However, with enhanced benefits of sediment blocking and siltation reduction, other benefits such as water resources supply, hydropower generation, and ecological improvement are reduced. The average annual number of days that do not meet the downstream water resources supply requirements, irrigation, and ecological improvement was increased by 0.64–2.16 days, and 91–197 million kW·h reduced average annual hydropower generation. The critical amount of incoming sediment was 350 million for conversion between the two FLWL operation modes, and it will increase to 450 million tons if the incoming runoff of the Yellow River increases by 20%. After constructing the Guxian Reservoir in the middle of the Yellow River, the critical amount of incoming sediment will increase to 600 million tons. This study is of great significance for improving the utilization efficiency of water resources and promoting the socio-economic development of river basins.

1. Introduction

Water shortage is an important factor limiting the long-term stable development of human society [1]. For sediment-laden rivers, such as the Yellow River, less water with more sediment causes a sharp contradiction between water resources supply and demand, which has become a bottleneck for the socio-economic development of the basin [2]. Reservoir operation is an efficient way for runoff regulation and water resource exploitation [3,4,5], and can be optimized to maximize flood control, siltation reduction, and profit generation [6,7]. The flood limit water level (FLWL) is a crucial indicator of reservoir operation [8]; it defines not only the lower limit water level of the flood control operation but also the upper limit water level of the profit operation. Therefore, it is critical to manage the contraction between controlling floods and maximizing benefits [9,10]. A lower FLWL denotes better flood control safety, but water resources supply, hydropower generation, and irrigation capacities are compromised. In sediment-laden rivers, reservoir operation during the flood seasons is more complicated than in other rivers, which carry less sediment because of severe sedimentation. Scientific determination of the FLWL is critical to ensure the safety of reservoir flood control and improve water resource utilization efficiency [11], thereby reducing the regional water supply and water demand contradiction.
Control and optimization of the reservoir FLWL have long received extensive attention and generally fall into any of the three modes: single, staged static, and staged dynamic modes. The single FLWL mode adopts a fixed water level to cope with floods regardless of the seasonal variations of flood patterns. Although this method can effectively handle the occurrence of major floods during the flood season, it can cause problems concerning a large amount of abandoned water during the flood season and insufficient water for use when the flood season ends, thus seriously reducing the profit generation of reservoirs [12,13,14]. The staged static FLWL is based on seasonal changes in flood patterns in the basin and adopts different FLWLs at different stages to utilize part of the original storage of flood control at a specific time to generate profits, thereby improving the flood resource utilization efficiency without lowering the flood control standard [15,16,17]. The staged dynamic FLWL refers to real-time dynamic adjustment in the FLWL control threshold of the reservoirs based on the forecast information of weather and hydrology [18,19,20,21], which further improves the flood resources utilization efficiency in the flood period based on staged static FLWL.
Due to differences in hydro-meteorological characteristics and the social demand for water resources, China differs from other countries in controlling FLWL. In particular, foreign reservoirs generally adopt the single FLWL. For example, to improve the balance between the supply and demand of water resources in the US, Waylen and Woo [22], Leclerc and Marks [23], Colorni and Fronza [24], Miller et al. [25], and Black and Werritty [26] proposed ideas or scenarios for redistributing reservoir capacity. Wurbs and Cabezas [27] studied reservoir capacity redistribution and water level for flood control and operational profit of reservoirs during different periods in the Brazos Basin, College Station, TX, USA. Johnson et al. [28] suggested that reservoir capacity allocation should be studied regarding water resource demand and seasonal river runoff changes. Monsoons significantly influence floods in most basins in China and exhibit noticeable seasonal variations, with the flood seasons primarily concentrated from May to October [29]. Considering the varying runoff amount each month, some large reservoirs were changed from the initial operation of single FLWL to staged FLWL. For instance, Shu et al. [30] proposed that the FLWL of the Baihetan Reservoir can be maintained at 785.0 m from June to July and raised by 10 m every ten days from August to September. Liu et al. [31] proposed that the FLWL of the Three Gorges Reservoir should be 155 m during the operation period, which was 10 m higher than the level of 145 m during the construction period. Although such studies have improved the control and optimization of FLWL in reservoirs, the impact of siltation is seldom considered.
In sediment-laden rivers, the large amounts of sediment entering the reservoirs lead to serious siltation. It is necessary to adopt an appropriate reservoir operation mode and efficiently handle the sedimentation problem to maximize the long-term comprehensive benefits of a reservoir. The incoming water and sediment conditions, which significantly influence the FLWL and sedimentation of the reservoir, should be considered carefully during optimization. In the past 20 years, the amounts of water and sediment in the major rivers of China have variably decreased. For example, in the Yellow River, the annual average measured water and sediment amounts from 2000 to 2020 at the Tongguan hydrological station in the middle reaches were 25.91 billion m3 and 240 million tons, which were 27.3% and 77.8% less than those from 1960 to 2000, respectively. The siltation rate of the reservoir has also decreased significantly. Water and sediment changes affect FLWL in reservoirs. Therefore, to improve the comprehensive benefits of a reservoir, it is essential to optimize the operation mode of FLWL according to the conditions of incoming water and sediment. However, under the changing water and sediment conditions, there is still a lack of relevant research on optimizing the FLWL operation mode of reservoirs in sediment-laden rivers to improve the comprehensive utilization efficiency.
Therefore, this paper studied the optimal operation mode of FLWL under changing water and sediment conditions to improve water resource utilization efficiency and the comprehensive benefits of reservoirs constructed on sediment-laden rivers. This study established a water–sediment mathematical model of reservoirs and rivers, a comprehensive benefit evaluation model, and an evaluation index system. The Xiaolangdi Reservoir (XLDR), located in the middle reach of the Yellow River (see Figure 1) was taken as an example to validate the proposed optimal regulation mode and the established models. Specifically, the possible scenarios of incoming water and sediment were set up first, and then the comprehensive benefits of the reservoir with different FLWL modes were calculated and evaluated. Finally, the operation mode of FLWL with the best comprehensive utilization benefits of the reservoir was indicated. The research process is shown in Figure 2.

2. Methodology

The FLWL of reservoirs constructed on sediment-laden rivers significantly influences flood control, siltation reduction, water resources supply, irrigation, hydropower generation, ecological improvement, and other objectives. This study established a water–sediment mathematical model for reservoirs and rivers to evaluate the effects of different FLWL regulation modes on the abovementioned objectives. Furthermore, a comprehensive benefit evaluation model and an evaluation index system were proposed to assess the reservoir operation effects of the different FLWL operation modes.

2.1. Water–Sediment Mathematical Model

The water–sediment mathematical model was built to simulate flow and sediment movement in reservoirs and river channels. This model can calculate the reservoir’s water level, outflow, reservoir siltation, sediment retention period, downstream channel siltation, minimum bank-full discharge in the downstream channel, and hydropower generation. Moreover, the model is a one-dimensional water–sediment mathematical model.

2.1.1. Model Principles and Control Equations

  • Water flow movement control equation
    B z t + Q x = q l
    Q t + 2 Q A Q x B Q 2 A 2 z x Q 2 A 2 A x z = g A z x g n 2 Q Q A A B 4 3
    where x denotes the direction of water flow (m); t is time (s); Q represents the water flow (m3/s); z is the water level (m); A denotes the cross-sectional overflow area (m2); B is the river width (m); q l is the inflow (or outflow) per unit time and per unit length (m2/s2); n is the Manning roughness coefficient; and g denotes the gravitational acceleration (m/s2).
  • Non-equilibrium sediment transport equation
By dividing the suspended sediment into M groups and denoting the sediment concentration of group k by S k , the equation of non-equilibrium sediment transport was expressed as
A S k t + Q S k x = α ω k B S k S * k + q l s
The sediment carrying capacity of water flow was expressed as
S = 2.5 0.0022 + S V u 3 κ ρ S ρ m ρ m g h ω m L n h 6 D 50 0.62
in which S k is the sediment concentration of group k (kg/m3); S * k is the sediment carrying capacity of group k (kg/m3); α is the recovery saturation coefficient; ω k is the settling velocity of group k (m/s); q l s is the sediment inflow (or outflow) per unit time and unit length (kg/(m.s)); S V is the volumetric sediment concentration (kg/m3); u represents the flow velocity (m/s); h denotes the water depth (m); κ is the Karman constant affected by the sediment concentration; ρ S and ρ m are the densities of solid particles and muddy water, respectively (kg/m3); ω m is the representative settling velocity of mixed sediment (m/s); and D 50 is the median diameter of bed sediment (mm).
3.
Riverbed deformation equation
γ A t = k = 1 M α ω k B S k S * k B q b x
where γ is the dry bulk density of sediment (kN/m3).
4.
Power generation equation
N = 9.81 η Q p H n
where N is the hydropower generation (kW.h); η is the hydropower station efficiency obtained by verification from the measured data; Q p is the discharge flowing through the hydropower station turbine (m3/s); and H n is the net head of the hydropower station (m).

2.1.2. Solution Method

The incoming flow and sediment processes were taken as the model inlet conditions, and the water level processes were adopted as the model outlet conditions. The control equations of the water–sediment mathematical model were discretized by the finite volume method, while the SIMPLE (Semi Implicit Method for Pressure Coupled Equations) algorithm was chosen to deal with the coupling of flow discharge and water level.

2.1.3. Constraining Conditions

Constraints mainly include those of water level, outflow, and water balance.
Water level constraints:
Z m a x Z f c
Z e f s Z n s l
where Z m a x represents the calculated maximum water level during the flood season; Z f c is the maximum water level allowed for controlling flood; Z e f s is the water level at the end of the flood season; and Z n s l is the normal storage level.
Outflow constraints:
max Q o u t Q f c
Q o u t Z i Q max Z i
min Q o u t max Q w i , m i n Q p , m i n Q e
in which max(Out) is the maximum outflow of reservoir; Q f c is the outflow of flood control; Qout (Zi) is the outflow under the Zi level; Q max Z i is the maximum outflow capacity of reservoir under the Zi level; min(Qout) is the minimum outflow of reservoir; Q w i is the outflow required for water resources supply and irrigation; m i n Q p is the minimum outflow of a single turbine in a hydropower station; and m i n Q e is the minimum outflow for the ecological requirement of the downstream river.
Water balance constraints:
V t = V t 1 + I ¯ t O ¯ t Δ t t = 1 , 2 , , n
where V t 1 and V t are the storage capacity at the beginning and end of the t calculation period, respectively; I ¯ t and O ¯ t are the average inflow and outflow of the t calculation period, respectively; Δ t is the calculation time step; and n is the number of time steps.

2.1.4. Model Verification

The measured data of water and sediment and erosion and deposition in the XLDR and the Lower Yellow River (LYR) were collected to verify the accuracy of the water–sediment mathematical model. Data for the XLDR were collected from its operation in 1999 to 2021, and 59 measured sections in the reservoir area with an average distance between sections of 2.09 km were used. Data for the LYR were collected from 1976 to 2021, and 104 measured sections with an average distance between sections of 8.3 km were used. The cumulative siltation amount of the XLDR from 1999 to 2021 was measured as 3.201 billion m3 and calculated as 3.336 billion m3, with a relative error of 4.2%. The cumulative siltation amount from 1976 to 2021 in the LYR was measured as 735 million tons and calculated as 665 million tons, with a relative error of 9.6%. The model verification results are shown in Figure 3, which indicate that the mathematical model could accurately simulate the erosion and deposition characteristics of reservoirs and river channels in sediment-laden rivers.

2.2. Comprehensive Benefit Evaluation Model

2.2.1. Evaluation Indices

Based on the principles of scientificity, representativeness, comparability, and quantifiability, with the optimal regulation for comprehensive reservoir utilization as the general goal, the evaluation indices were selected according to the reservoir development objectives. The index system to evaluate the comprehensive benefit of the reservoir’s FLWL was established (Table 1). The primary indices were multi-objective goals, such as flood control, siltation reduction, water resources supply, irrigation, hydropower generation, and ecological improvement. The secondary indices were two regulation categories: the reservoir and the river downstream. The tertiary indices were the specific utilization objectives of the reservoir. Two indices were selected for flood control: the maximum water level for controlling reservoir flood and the cross-section flow capacity of the river downstream. A lower maximum water level for reservoir flood control denotes a higher degree of safety, while a higher cross-section flow capacity of the river downstream indicates that the river has a higher flood control capacity. Three indices were selected for siltation reduction: the sediment retention period of the reservoir, the siltation amount of the river downstream, and the minimum bank-full discharge of the main channel. The longer the sediment retention period of the reservoir is, the greater the sediment retention and siltation reduction benefit is generated. A smaller siltation amount of the downstream channel and greater minimum bank-full discharge of the main channel denotes a higher capacity to transport flood and sediment. Water resources supply, irrigation, and ecological improvement require a minimum reservoir discharge. Therefore, the number of days not meeting this requirement was selected to evaluate such effects. Furthermore, a higher reservoir level denotes a larger water head and better hydropower generation efficiency. Therefore, the two indices of reservoir water level and hydropower generation were selected. Among the tertiary indices, those that provided better results with larger values were called benefit indices. Conversely, those contributing to better results with smaller values are called cost indices.

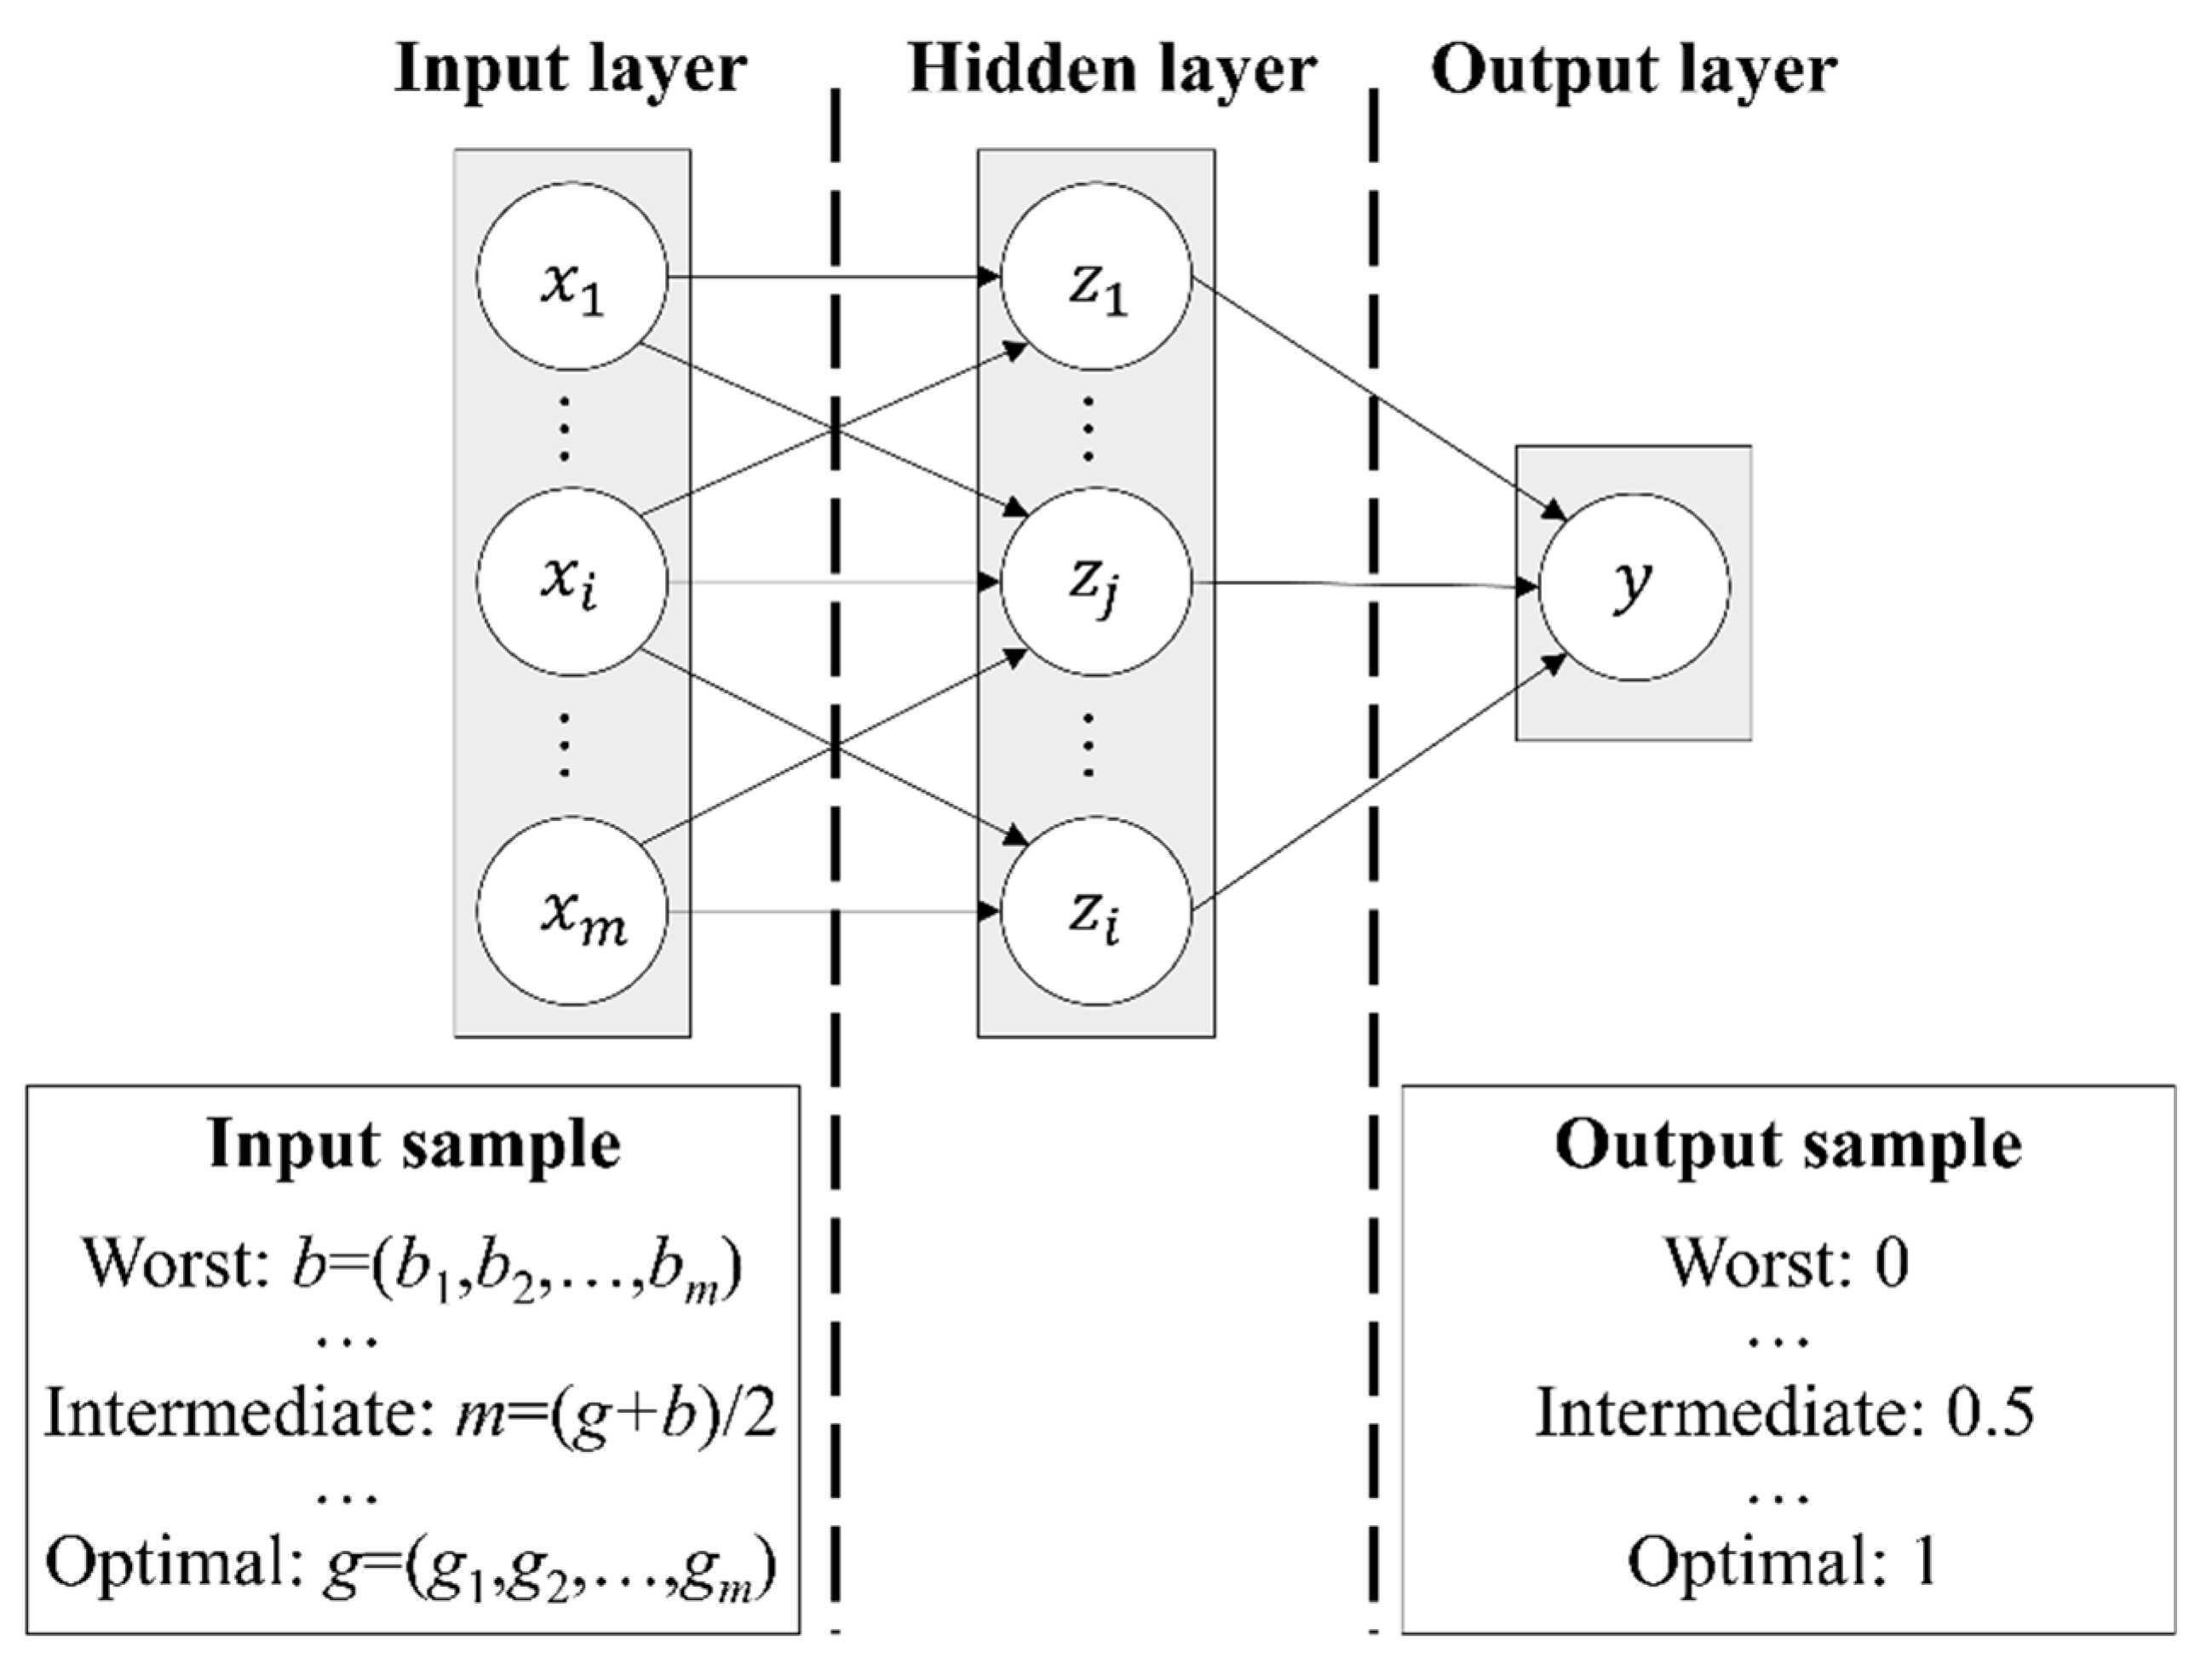
2.2.2. Evaluation Model

FLWL optimization, which seeks to maximize the comprehensive benefits of reservoirs rather than the maximization of individual sub-objectives is a typical solution–decision process of multi-objective and multi-scheme complex systems. During the solving process, there is no apparent boundary between high and low FLWLs, and a certain degree of fuzzy connection exists between the comprehensive objectives and each sub-objective. Therefore, this study used a multi-objective fuzzy optimization method to research the FLWL optimization and established a comprehensive benefit evaluation model to evaluate the effects of different FLWL operation modes based on the fuzzy optimization theory [32,33,34] and artificial neural network (ANN) with error feedback [35,36].
According to the fuzzy optimization theory, it is assumed that m FLWL operation modes to be optimized constitute the sample set together with eight target values (Table 1), including the maximum reservoir water level for flood control, the cross-section flow capacity of the river downstream, the sediment retention period of the reservoir, the siltation amount of the downstream channel, the minimum bank-full discharge of the main channel, the number of days that do not meet the minimum discharge requirement of water resources supply, irrigation, and ecological improvement, the water level of the reservoir, and the hydropower generation. Its eigenvalue matrix X is as follows:
X = x i j 8 × m = x 11 x 12 x 1 m x 21 x 22 x 2 m x 81 x 82 x 8 m
Considering that the dimensions and numerical ranges of the eight objective values were inconsistent, the eigenvalue matrix X of the scheme to be optimized was normalized to determine its relative membership matrix R. The benefit and cost indices were normalized as indicated below.
Benefit indices:
r i j = x i j max j x i j
Cost indices:
r i j = min j x i j x i j min j x i j 0 1 x i j max j x i j min j x i j = 0
where max j x i j represents the maximum value of the i objective in the sample range, which does not take the value of zero. And min j x i j denotes the minimum value of the i objective in the sample range.
The relative membership matrix R of the eigenvalues of the scheme to be optimized was further obtained as follows:
R = r i j 8 × m = r 11 r 12 r 1 m r 21 r 22 r 2 m r 81 r 82 r 8 m
where the relative membership vector of the optimal scheme is g = g 1 , g 2 , , g 8 , with the relative membership of the i objective as g i = max j r i j , and the relative membership vector of the worst scheme is b = b 1 , b 2 , , b 8 , with the relative membership of the i objective as b i = min j r i j . The measurement standard of the better scheme is set to be close to the best scheme g. The relative membership u j of the j scheme, relative to the optimal scheme was calculated using Equation (17) according to the fuzzy optimization theory, and the scheme with the maximum value was selected as the best scheme based on ranking.
u j = 1 + i = 1 8 w i × ( g i r i j ) 2 i = 1 8 w i × ( r i j b i ) 2 1
where w i denotes the weight vector, which satisfies i = 1 n w i = 1 , and its determination was crucial.
Relative membership weights were obtained by training with backpropagation (BP)-ANN model based on error feedback and has a powerful non-linear simulation capability [37,38]. According to the fuzzy optimization theory, the scheme composed of optimal values of each objective was assumed to be optimal, and its relative membership to the optimal scheme was 1.0. The scheme composed of the worst values of each objective was assumed to be the worst, and its relative membership to the optimal scheme was considered 0.0. The optimal and worst objective values were linearly interpolated to obtain multiple schemes between the optimal and worst schemes with values such as 0.75, 0.50, 0.25 or 0.90, 0.80,……, 0.20, 0.10. Thus, a non-linear mapping relationship could be established between the different objective systems and the membership relative to the optimal scheme. BP-ANN was trained using simulated training samples, and the number of hidden layer nodes was determined according to trial calculations (see Figure 4). The training process was controlled by the simulation accuracy and number of iterations to determine the corresponding network structure and relative membership weights after meeting the corresponding error and iteration number requirements.

3. Case Study

The optimization of the reservoir’s FLWL operation mode on sediment-laden rivers during flood seasons under changing water and sediment conditions was studied by taking the XLDR of the Yellow River as an example. The XLDR is in the sediment retention period and will remain for a certain period. Therefore, this study mainly focused on optimizing the reservoir’s FLWL during the sediment retention period.

3.1. Research Area and Data

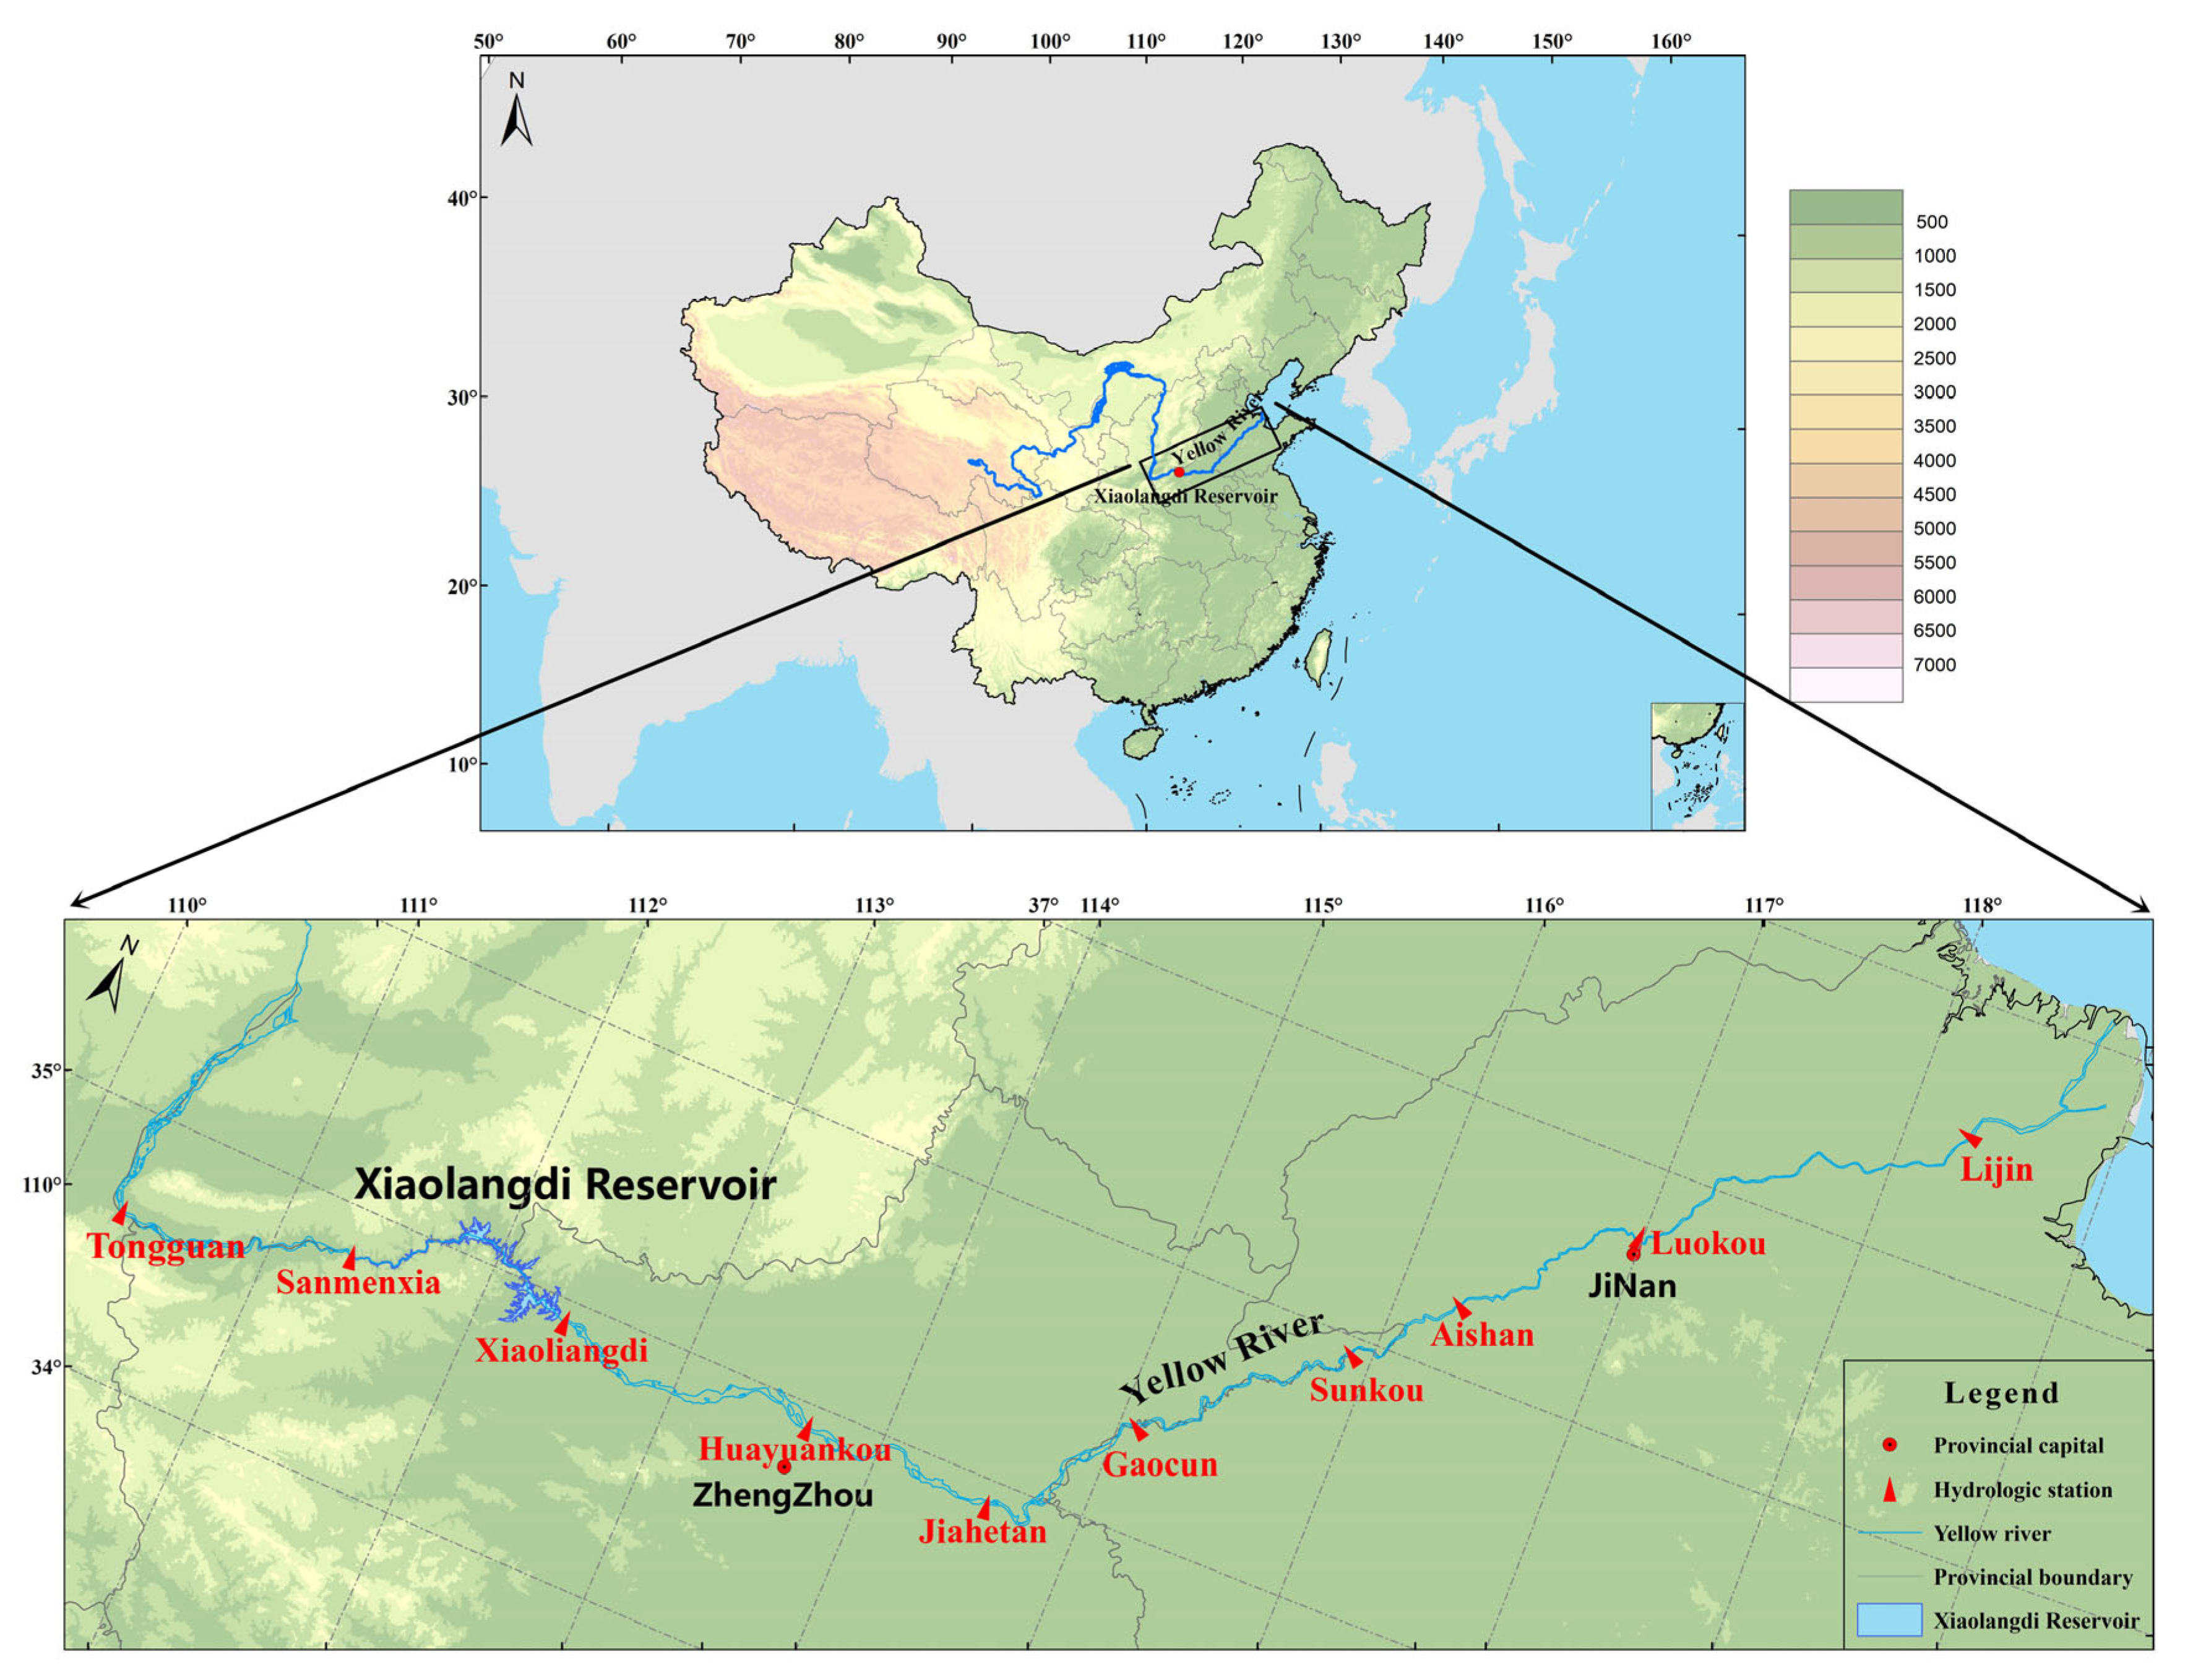
3.1.1. Research Area

The XLDR was developed mainly for two purposes. The primary one is for flood control (ice-jam control) and siltation reduction, while the secondary one is for water resources supply, irrigation, and hydropower generation [39]. It plays a vital role in the economic and ecological improvement in the downstream river areas. Therefore, the XLDR and its downstream river channel were selected as the research area (see Figure 1).
The XLDR is located in the last canyon reach of the Middle Yellow River. It controls the basin area of 694,000 km2, accounting for about 92.3% of the Yellow River basin area. The design storage capacity of the XLDR is 12.65 billion m3, of which 4.1 billion m3 is for controlling flood, 7.55 billion m3 is for retaining sediment, and 1.0 billion m3 is for regulating flow and sediment [40]. Moreover, the designed FLWL of the XLDR is 254 m during regular operation. During the design stage of the XLDR, based on the assumption that the sediment amount in the Yellow River is 1.275 billion tons, it was proposed that the FLWL should be gradually raised during the pre-flood (from July to August) and post-flood (from September to October) periods to slow down the siltation of the reservoir as much as possible, with a predicted sediment retention period of just 15 years. However, during 23 years of the XLDR operation, the sediment amount decreased to less than 300 million tons, and the siltation rate of the reservoir has slowed down significantly. The XLDR came into operation in October 1999, and until April 2022, its cumulative siltation amount was 3.392 billion m3, accounting for 45% of the design sediment retention capacity. The reservoir was operated by gradually raising the FLWL (Figure 5). The current FLWLs of 235 m and 248 m during the pre-flood and post-flood periods are still 19 m and 6 m lower than the designed FLWL of 254 m during normal operation, respectively.
The mainstream of the LYR is about 881 km long, which has serious siltation. Since the start of the XLDR operation, the downstream river channel was scoured along the reservoir’s sediment retention and water–sediment regulation. As of April 2022, the total scoured sediment amount is approximately 3.27 billion tons, while the average scouring depth of the river channel is 2.6 m. The minimum bank-full discharge of the main channel has recovered from 1800 m3/s in 2002 to 4600 m3/s, significantly reducing flood prevention pressure in the LYR.

3.1.2. Datasets

The incoming water and sediment are essential data for determining the FLWL operation mode of reservoirs and primary conditions for calculating erosion and deposition of reservoirs and river channels. The Yellow River is characterized by a bit of water with a lot of sediment and large sediment transport, with large inter-annual variations and uneven distribution within the year [41,42]. Influenced by climate variation and human activities, the amounts of incoming water and sediment in the river have decreased significantly since 2000. The Tongguan hydrological station, located in the middle reach of the Yellow River, controls 91% of its basin area, 90% of the runoff amount, and nearly 100% of the sediment amount. The annual average water and sediment amounts from 2000 to 2020 at Tongguan station were 25.91 billion m3 and 240 million tons, decreasing by 27.3% and 77.8%, respectively, compared with those from 1960 to 2000. The future amounts of incoming flow and sediment are influenced by natural climatic factors and human activities, such as water conservancy projects, soil and water conservation projects, and economic and social development [43]. Generally, the water and sediment amount in the future will be significantly reduced. The current perception of future sediment amounts in the Yellow River ranges from approximately 300 to 800 million tons.

3.1.3. Minimum Discharge from the XLDR

The LYR had minimum discharge requirements for the XLDR regarding water resources supply, irrigation, hydropower generation, and ecological improvement. The minimum discharge of the reservoir min(Qout) should be greater than or equal to the maximum of the three minimum discharge requirements (Table 2). The greater the number of days that do not meet the minimum discharge requirements for the reservoir, the worse the benefits of water resources supply, irrigation, electricity generation, and ecological improvements are.

3.2. Scenario Conditions

3.2.1. Scenario Conditions of Incoming Water and Sediment

This study considered six scenarios of incoming sediment amounts, which are 800, 700, 600, 500, 400, and 300 million tons, to investigate the FLWL operation in the XLDR. It should be noted that the six scenarios represent the measured annual average sediment amounts of the Yellow River for the past 60, 55, 50, 40, 30, and 20 years, with their corresponding annual runoffs as 27.2, 26.7, 26.2, 25.7, 25.2, and 24.6 billion m3, respectively. The incoming flow and sediment processes of each scenario are shown in Figure 6. Industrial and agricultural water use was considered in the incoming water processes.

3.2.2. Scenario Conditions of FLWL Operation Modes for the XLDR

Under changing water and sediment conditions, the XLDR was still operated by gradually raising the FLWL, which was unable to achieve optimal comprehensive utilization benefits. Raising the FLWL once to the designed level of 254 m under the current boundary conditions could benefit water resources supply, irrigation, hydropower generation, and ecological improvement. Given the different incoming sediment scenarios in the Yellow River, the regulation modes of raising the FLWL gradually and once were compared during the XLDR’s sediment retention period. The two modes differed mainly from 11 July to 31 August (details in Table 3). The two modes were operated similarly after the sediment retention capacity was full of sediment and entered the standard operation period.
For the operation mode of gradually raising the FLWL from 11 July to 31 August, when the reservoir’s adjustable water amount, calculated by the sum of the water volume of the reservoir above the dead water level and the incoming water volume, was more significant than 1.3 billion m3, the reservoir started discharging. It released a large outflow with a value larger than 3700 m3/s into the LYR at the Huayuankou station for at least five days. The corresponding highest water level was the FLWL during that flood season. When the reservoir’s adjustable water amount was more than 600 million m3 and the forecasted inflow was greater than or equal to 2600 m3/s, it started discharging when gathering the flow and released a large outflow with the value of more than 3700 m3/s at the Huayuankou station for at least five days. When the forecasted inflow was greater than or equal to 2600 m3/s and the sediment concentration was greater than or equal to 200 kg/m3, the reservoir activated a high-sediment concentration dispatch, pre-discharging two days in advance or storing 300 million m3 of water and then making the outflow equal to the inflow. After the reservoir entered the second stage of sediment retention (when the siltation amount exceeds 4.2 billion m3) and the forecasted inflow was greater than or equal to 2600 m3/s, the reservoir started to lower the water level, thereby scouring the sediment in the reservoir area. For the mode in which the FLWL was raised at one time, the reservoir started discharging when the water level of the XLDR reached the designed FLWL of 254 m from 11 July to 31 August. The reservoir continued discharging when gathering the flow, but the high-sediment concentration dispatch and lowering of the water level to scour the reservoir area were no longer operated to maintain a suitable channel scale of the downstream river channel.

3.3. Results

3.3.1. Analysis of Single Objective Effect

A mathematical model was used to calculate the effects of two FLWL operation modes for the XLDR for 50 years (Figure 7). The initial riverbed boundary was the pre-flood topography in 2022. The FLWL of the two modes changed below the designed limit of 254 m during the standard operation period, which did not influence the flood control capacity above the FLWL. Therefore, the effects of flood control were the same, and the comparison was no longer made. The effects of the two FLWL modes for the XLDR under the incoming sediment amounts of 300–800 million tons in the Yellow River are as follows:
Compared with the operation mode of raising the FLWL at one time, the mode of gradually raising the FLWL of the XLDR has more chances to discharge sediment and slow sediment accumulation in the reservoir area, with a 4–13 years longer sediment retention period. The smaller the incoming sediment amount, the greater the difference between the two modes in the sediment retention period of the XLDR (TSRP_XLDR).
For the operation mode of raising the FLWL at one time, the siltation rate of the XLDR was fast, resulting in less siltation in the LYR in a short period. However, the XLDR had a short sediment retention period, and the LYR quickly re-silted after the sediment retention period ended. Hence, cumulative siltation in the LYR was larger at the end of 50 years, and the corresponding minimum bank-full discharge (Qbmin_LYR) was smaller. Under the incoming sediment amount scenarios of 400–800 million tons, for the mode of gradually raising the FLWL, the average annual siltation of the LYR (WS_LYR) was smaller by 10–19 million tons, and the minimum bank-full discharge was larger by 150–260 m3/s at the end of the calculation period. After 50 years, the downstream channel of the two modes will still be in a state of erosion under the incoming sediment amount scenario of 300 million tons. The smaller the incoming sediment amount, the smaller the differences in the average annual siltation in the LYR and the minimum bank-full discharge are.
By comparing with the regulation mode of raising the FLWL at one time, the regulation mode which gradually raises the FLWL of the XLDR showed less water storage, while the average annual number of days that did not meet the downstream requirements for water resources supply, irrigation, and ecological improvement (Td) was greater by 0.64–2.16 days. The smaller the incoming sediment amount, the smaller the corresponding incoming runoff amount, and the larger this difference will be.
By comparing with the regulation mode of raising the FLWL at one time, the mean water level of the XLDR from July to August (WLXLDR) was 6.79–8.35 m lower, and the hydropower generation (N XLDR) was 91–197 million kW.h smaller for the operation mode of gradually raising the FLWL, with the differences between the two modes increasing with decreasing incoming sediment amount in the Yellow River.
In the process of comprehensive benefit evaluation, the relative membership weights were obtained by the BP-ANN model first, and then the comprehensive benefits were evaluated. The calculation results of relative membership weights are shown in Table 4. It can be found that the weight of sediment reduction is the highest, followed by the weight of water resource utilization and power generation. The full utilization of water resources is very important in the Yellow River basin, due to water resource shortage, while flood control safety is the most important, which can be partially measured by the effective control of sediment deposition because of its sediment-laden characteristic. Compared to sediment reduction and water resource utilization, the importance of power generation is relatively weaker.

3.3.2. Analysis of Comprehensive Effects

According to the comprehensive utilization requirements for the XLDR, two FLWL operation modes under various scenarios of the incoming sediment amount were evaluated with the objectives of the longest sediment retention period of the XLDR, the least downstream river channel siltation, the largest minimum bank-full discharge in the LYR at the end of the calculation period, the least average annual number of days not meeting the downstream requirement for water resources supply, irrigation, and ecological improvement, the highest average annual water level during the main flood period, and the largest average annual hydropower generation.
When the incoming sediment amount scenario in the Yellow River is 800 million tons, for the two operation modes of raising the FLWL, the target eigenvalues of the operation modes and relative membership matrix after performing the normalization process were calculated as shown in Equation (18).
X = 13 9 1.63 1.82 2760 2500 5.48 4.84 242.26 249.05 58.97 59.88 R = 1.000 0.692 1.000 0.896 1.000 0.906 0.883 1.000 0.973 1.000 0.985 1.000
According to the fuzzy optimization theory, the relative membership vector of the optimal scheme was extracted from the relative membership matrix of the solutions to be optimized as g = (1.000, 1.000, 1.000, 1.000, 1.000, 1.000, 1.000), and its relative membership value to the optimal scheme was set to 1.00. The relative membership vector of the worst solution was b = (0.692, 0.896, 0.906, 0.883, 0.973, 0.985), and its relative membership value to the optimal scheme was set to 0.00. The relative membership vectors for the intermediate solution were m1 = (0.923, 0.974, 0.976, 0.971, 0.993, 0.996), m2 = (0.846, 0.948, 0.953, 0.942, 0.986, 0.992), and m3 = (0.769, 0.922, 0.929, 0.912, 0.980, 0.989), and the relative membership values to the optimal scheme were set to 0.75, 0.50, and 0.25, respectively. Thus, five training samples were obtained for the BP-ANN. The sample outputs were the expected model parameter training output values of 1.00, 0.75, 0.50, 0.25, and 0.00, while the computed outputs were the actual output values (Table 5). The relative membership weights were obtained via network training. The simulation errors in the table show that the trained BP-ANN network has a good simulation ability of relative membership values to the optimum scheme for different schemes. The multi-objective relative membership of the schemes to be optimized was substituted into the trained ANN network to obtain the corresponding membership values (Figure 6). Via optimal sorting, the relative membership value to the optimal scheme of 0.804 for the operation mode of gradually raising the FLWL was higher than the value of 0.494 for the operation mode of raising the FLWL at one time. It indicates that the comprehensive utilization benefits obtained by gradually raising the FLWL of the XLDR during the flood season are higher, with 800 million tons of incoming sediment in the Yellow River.
Similarly, other incoming sediment amount scenarios were evaluated (Figure 8). The results showed that as the incoming sediment amount decreases, the operation mode of gradually raising the FLWL will gradually reduce the comprehensive benefits. In contrast, the operation mode of raising the FLWL at one time will gradually increase the comprehensive benefits of the XLDR. The benefits of reducing sedimentation are relatively good when the FLWL is gradually raised, while the benefits of water resource utilization are poor. In the case of inflow with large sediment, gradually raising the flood limit water level mode is more optimal, due to the high weight of sediment reduction indicators and the significant difference in sediment reduction benefits between the two modes. However, as the amount of sediment gradually decreases, the difference in sediment reduction benefits is gradually narrowing, and the difference in water resource utilization benefits is gradually increasing. Therefore, the evaluation value of gradually raising the FLWL will become smaller. The critical amount of incoming sediment for converting the two modes was ~350 million tons.

3.3.3. Suggestions for Optimizing the FLWL of the XLDR during Flood Seasons

With the socio-economic development, flood control security and the high-quality development of the basin and related areas increased the reservoir’s utilization requirements to reduce siltation and maximize profits with a proper balance between short-term and long-term benefits. This study suggests that when the future incoming sediment amount in the Yellow River is larger than 350 million tons, the XLDR should still be operated per the current regulation mode of gradually raising the FLWL during the flood seasons. When the incoming sediment amount is <350 million tons, the FLWL of the XLDR can be raised once from the current FLWL of 235 m during the pre-flood season and 248 m during the post-flood season to the designed FLWL of 254 m to achieve greater comprehensive utilization benefits. This does not mean the reservoir should be operated at 254 m throughout the flood. It still needs to discharge non-overbank flow, which is more than 3700 m3/s, for at least five days to maintain the size of the downstream river channel.

3.4. Discussion

Incoming water and sediment conditions are the main factors affecting the FLWL operation and the sedimentation changes in the reservoirs of sediment-laden rivers. In the case of identical incoming sediment amounts, increases in incoming water volume will be beneficial to increase the water volume for sediment transport, water utilization, and sedimentation reduction in reservoirs and rivers. To alleviate the water shortage problem, it usually adopts large-scale inter-basin water transfer projects worldwide [44]. For example, China has taken the initiative of the South-to-North Water Diversion Project to solve the shortage problem of water resources in the north. It is divided into three routes: the Western, the Middle, and the Eastern Routes. The Western Route transfers water from the upper Yangtze River to the upper Yellow River in three phases [45]. In the first phase, 8 billion m3 is transferred, 6 billion m3 is used for socio-economic development, and 2 billion m3 is diverted to the Middle Yellow River. Under the six incoming sediment amount scenarios of 800, 700, 600, 500, 400, and 300 million tons in the Middle Yellow River and the corresponding annual runoff increase of 2 billion m3, the critical amount of incoming sediment for conversion of the two modes of raising the FLWL gradually or at one time was calculated to be ~450 million tons (see Figure 9).
Additionally, the construction of water conservancy projects to retain sediment will reduce the amount of river sedimentation [46,47]. The Guxian Water Conservancy Project was proposed to be built in the middle reach of the Yellow River, 450 km upstream of the XLDR. As one of the major projects of the Yellow River water and sediment regulation system, it controls 65% of the Yellow River basin area and 60% of the sediment volume. The project is designed mainly for flood control and siltation reduction, considering the comprehensive benefits of water resources supply, irrigation, and electricity generation. The designed total storage capacity is 13.059 billion m3, which includes 9.342 billion m3 for retaining sediment and 2.00 billion m3 for regulating the incoming flow and sediment. After completion, the project will be operated with the XLDR, significantly reducing the LYR sediment. Under the incoming sediment amount scenarios of 600 million tons and below, the LYR will be in a state of erosion in the next 50 years. After the Guxian project takes effect, the critical amount of incoming sediment for conversion of the two FLWL operation modes in the XLDR is ~600 million tons (see Figure 10).
In summary, increasing the water volume into the river by transferring water from outer basins or reducing the sediment amount into the river by constructing water conservancy projects upstream can improve the flexibility of the FLWL operation of sediment-laden river reservoirs, which could further enhance their comprehensive utilization benefits.

4. Conclusions

  • A mathematical model of water and sediment was established to simulate the water level, outflow, siltation, sediment retention period, and hydropower generation in the reservoir and siltation and minimum bank-full discharge in the river channel to study the FLWL operation modes of the reservoirs in sediment-laden rivers under changing water and sediment conditions. Considering the objectives of flood control, silt reduction, water resources supply, irrigation, hydropower generation, and ecological improvement, an index system for evaluating the comprehensive benefit of the FLWL was proposed. Furthermore, a comprehensive benefit evaluation model of the FLWL was established based on the fuzzy optimization theory and BP-ANN to evaluate the various FLWL operation modes’ effects.
  • Considering six scenarios of the incoming sediment amounts, which include 800, 700, 600, 500, 400, and 300 million tons, the water–sediment mathematical model was used to estimate the effect of the operation modes of raising the FLWL gradually or at one time during the XLDR’s sediment retention period. The former mode provided more sediment discharge opportunities and slowed XLDR’s sedimentation rate. Furthermore, the sediment retention period was 4–13 years longer, the average annual siltation in the LYR was lower, and the minimum bank-full discharge of the main channel after 50 years was larger by 150–260 m3/s. However, the mean annual number of days that did not meet the requirements for the downstream water resources supply, irrigation, and ecological improvement was larger by 0.64–2.16 days, average annual water level from July to August during the main flood period was lower by 6.79–8.35 m, and average annual hydropower generation was lower by 91–197 million kW.h. The above results indicated that the regulation mode of gradually raising the FLWL is good for sediment retention and siltation reduction but poor for economic and ecological improvements.
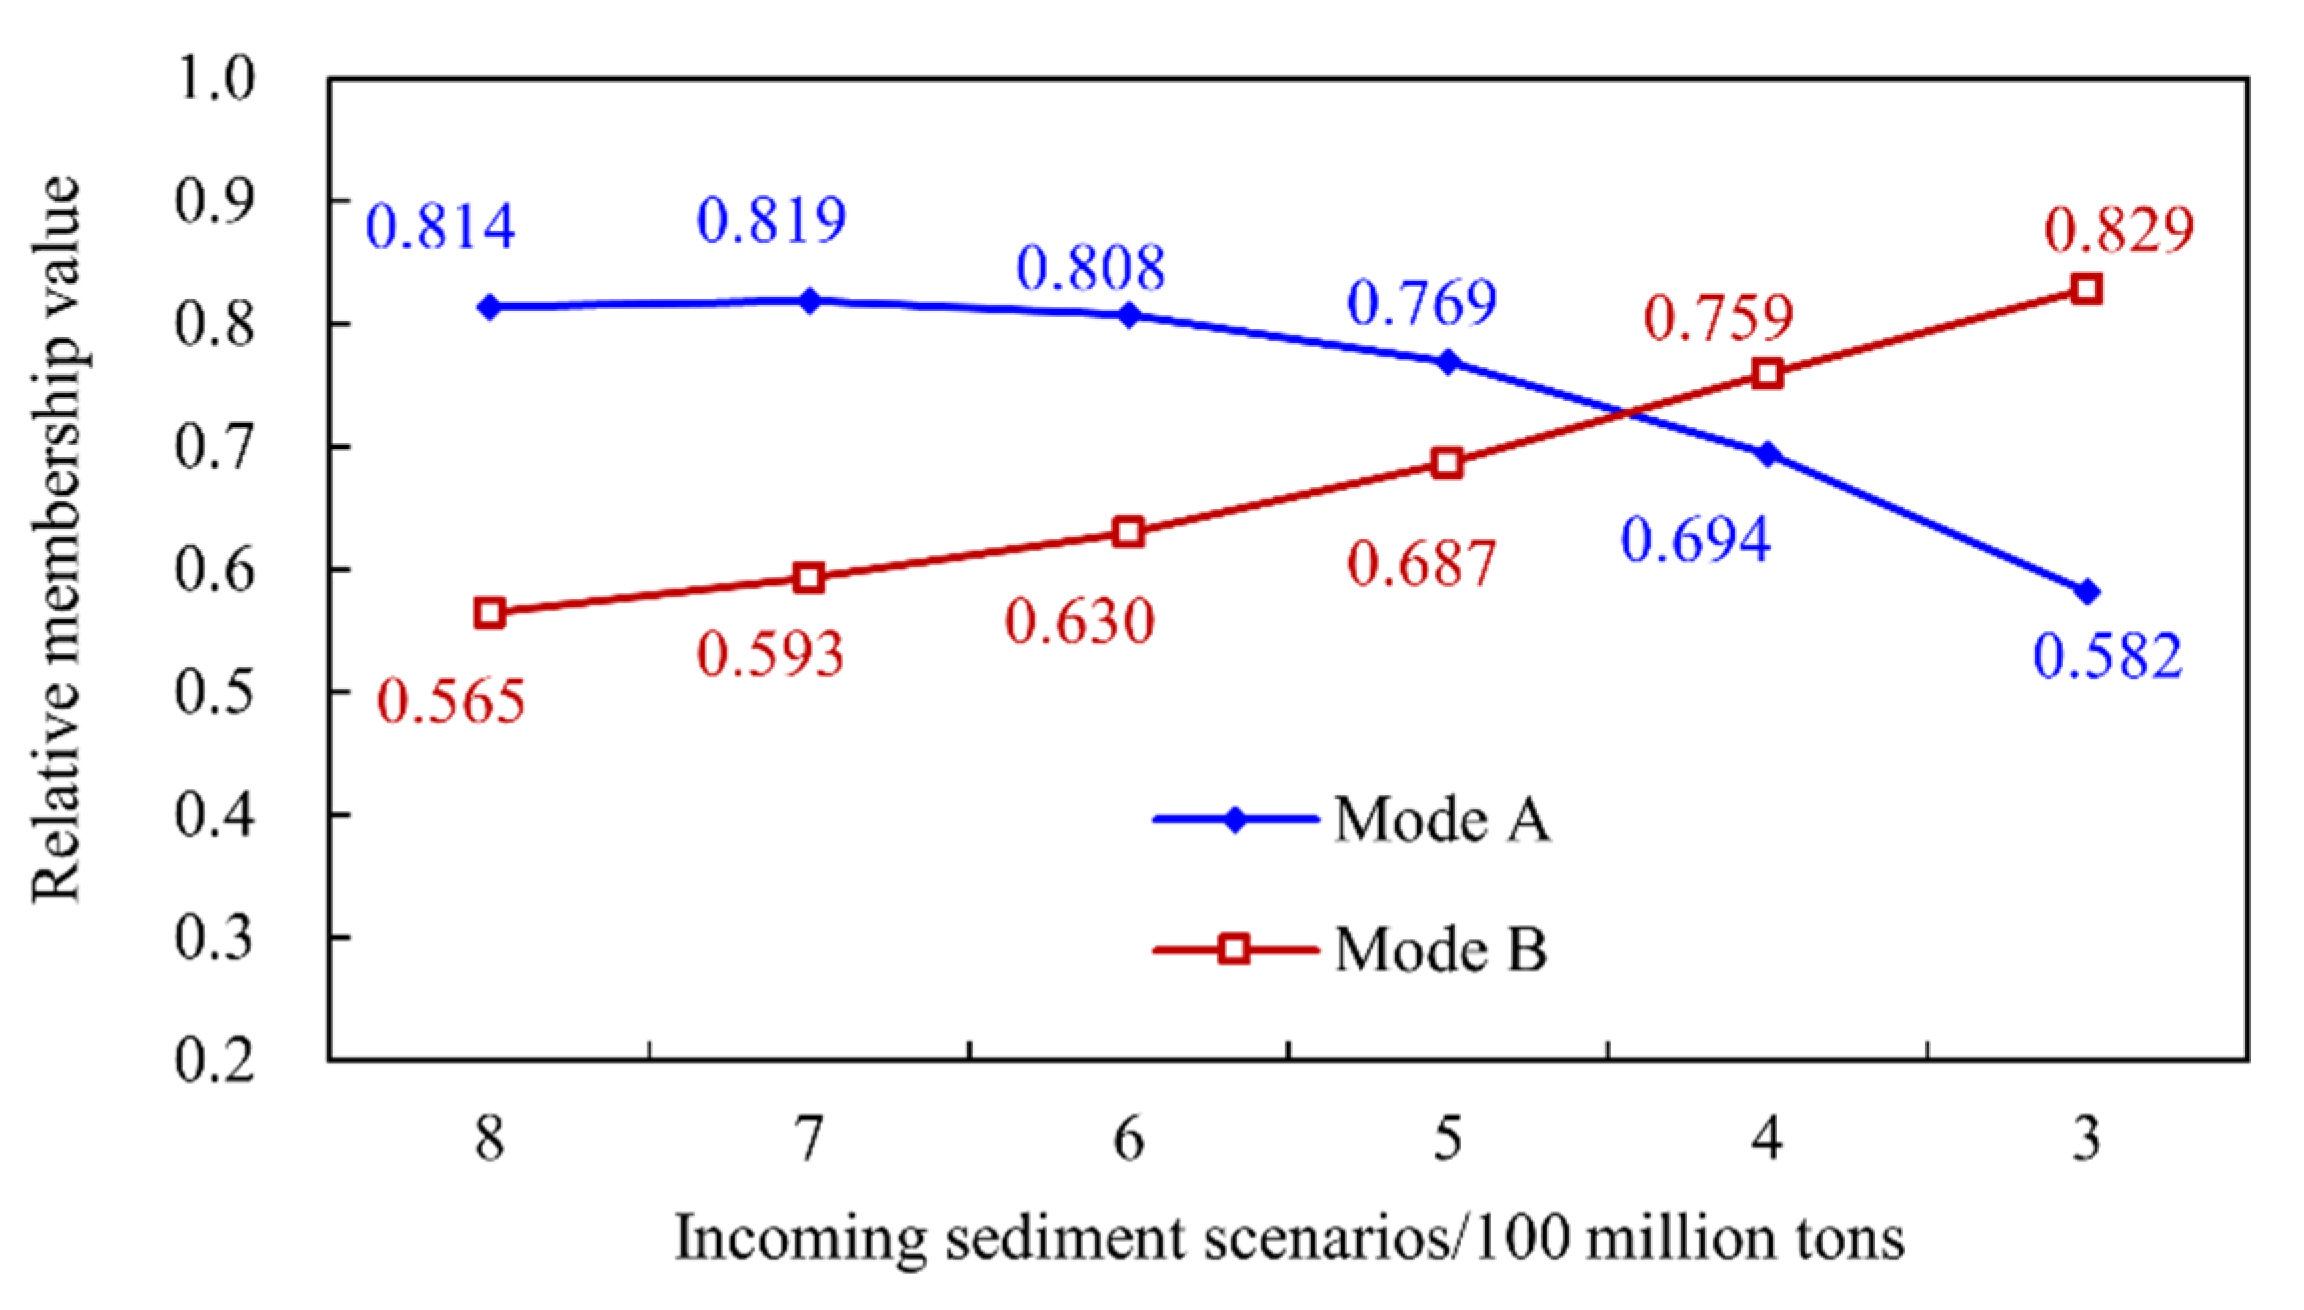
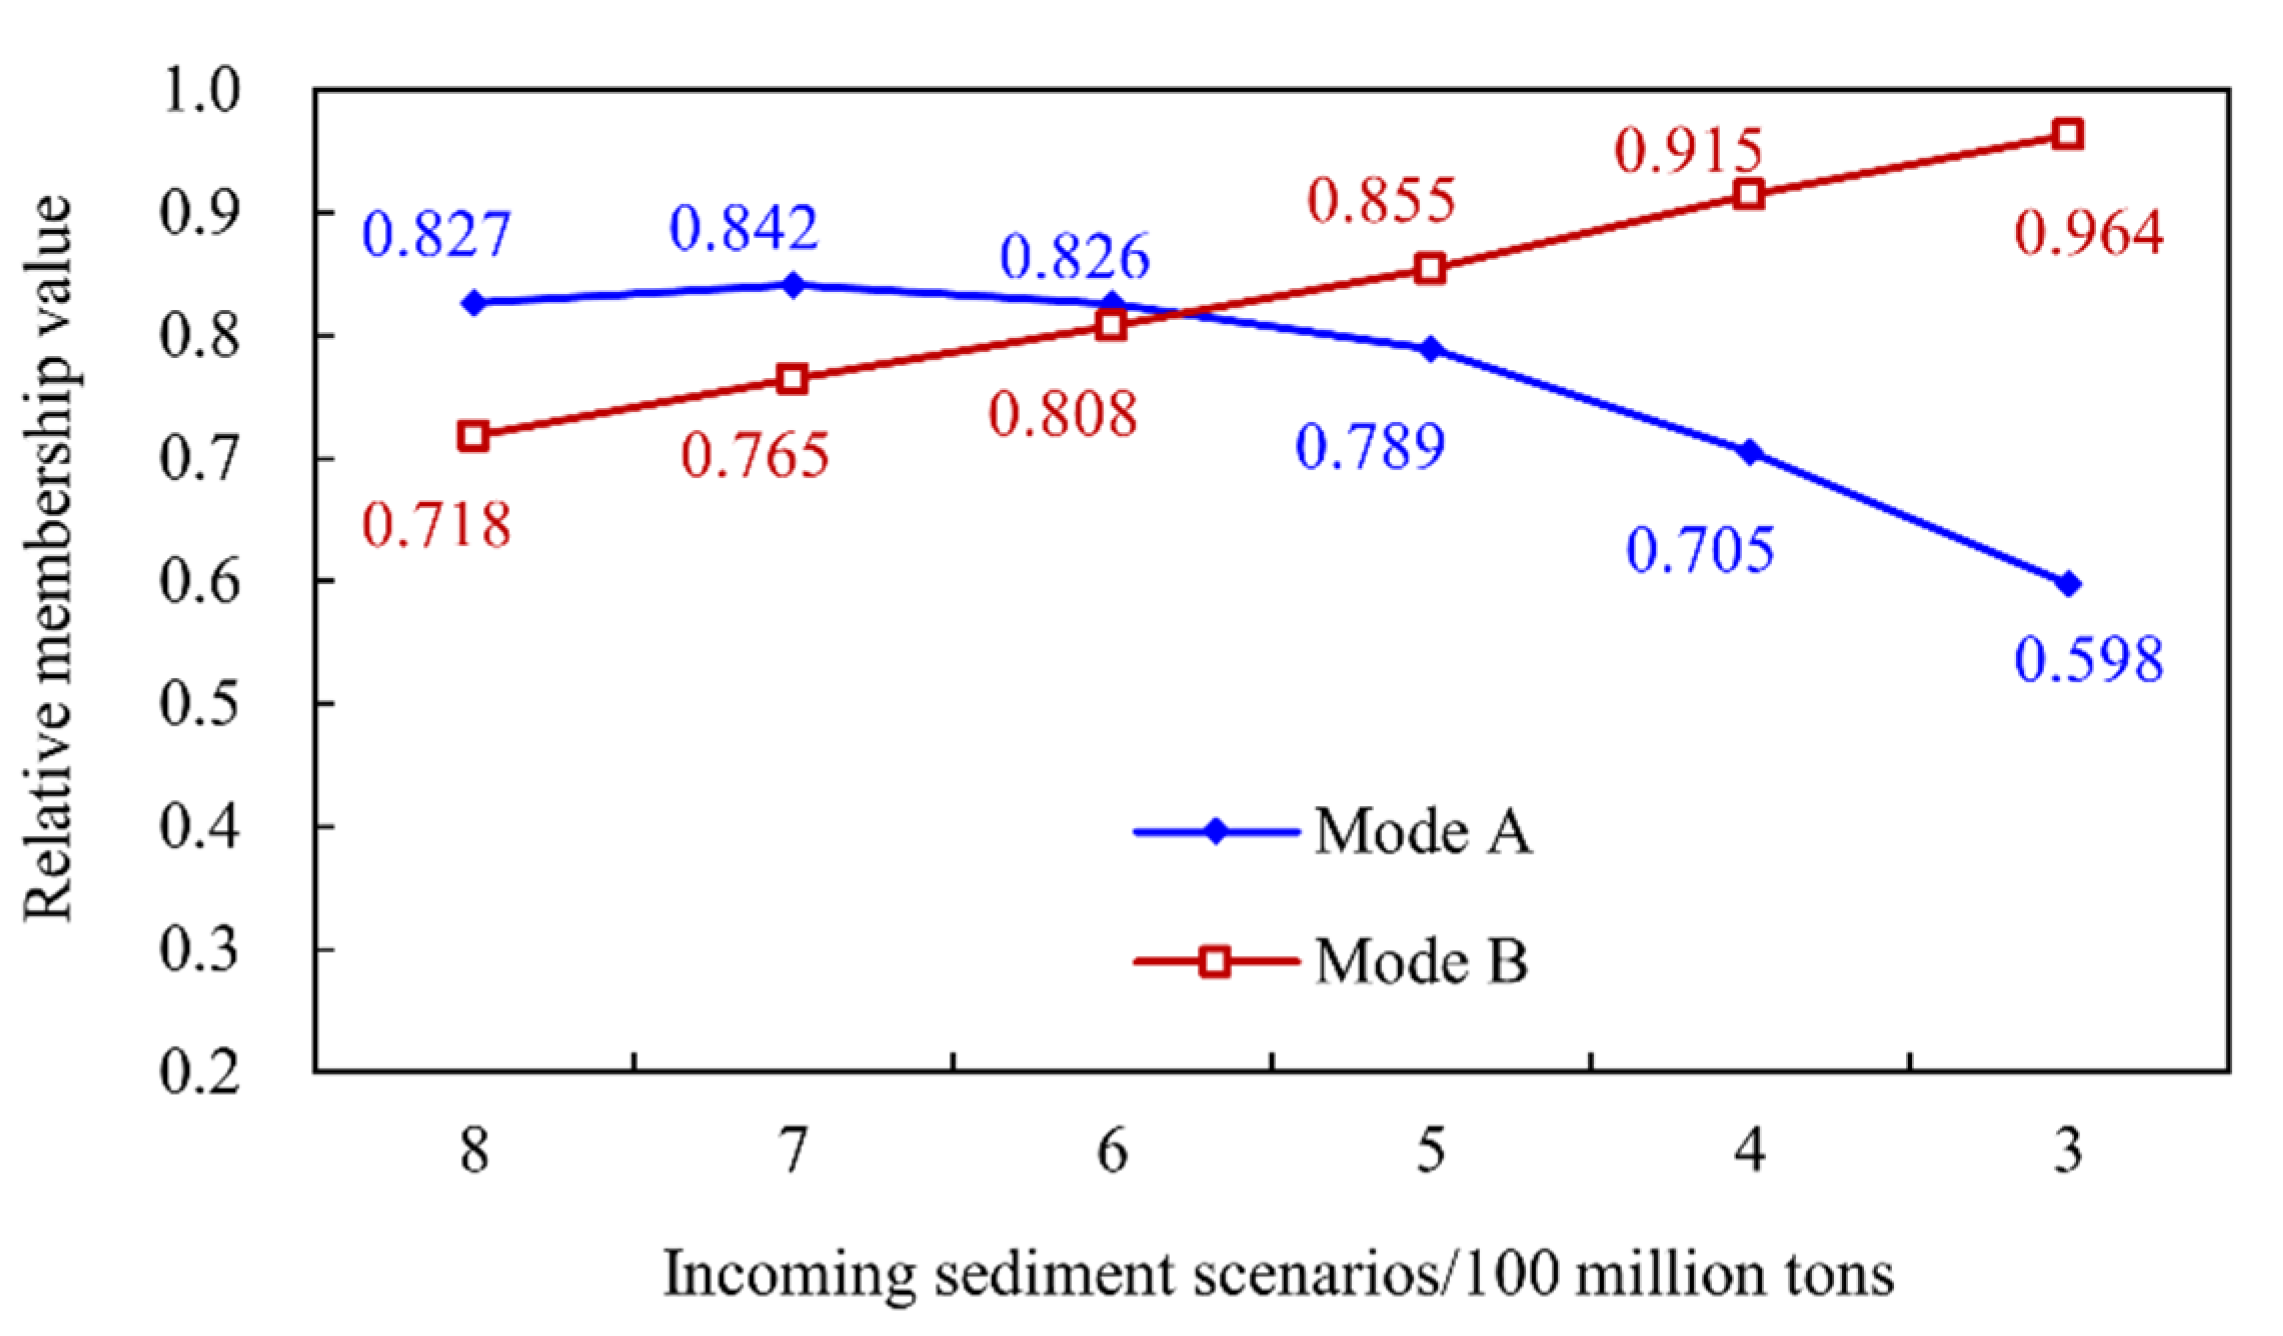
  • The reservoir’s comprehensive benefit by raising the FLWL gradually decreases with the reduction in incoming sediment amounts in the Yellow River, while that of the reservoir with raising the FLWL at one time increases. The critical amount of incoming sediment for conversion of the two FLWL operation modes in the XLDR is about 350 million tons. It is suggested that the reservoir be operated in the current mode and gradually raise the FLWL during the flood season when the incoming sediment amount exceeds 350 million tons. However, the FLWL can be raised from the current level of 235 m during the pre-flood season and 248 m during the post-flood season to the designed FLWL of 254 m when the incoming sediment amount is <350 million tons. It is feasible to increase the water amount of the Yellow River by transferring water from the outer basin or reducing sediment into the downstream river channel by constructing large-scale water conservancy projects to improve the flexibility of reservoir operation. When the average annual incoming water volume increases by 2 billion m3, the critical amount of incoming sediment for converting the two FLWL operation modes will be ~450 million tons. This will increase to ~600 million tons after the Guxian Water Conservancy Project takes effect.
This paper focused on the FLWL operation during the reservoir’s sediment retention period in sediment-laden rivers. In the future, the control of the FLWL should be further investigated when the sediment retention period ends, and the standard operation period starts to fully promote the long-term comprehensive benefits of reservoirs.

Author Contributions

Methodology, C.C., X.G., C.Z., C.A., D.L. and J.L.; formal analysis, C.C., X.G., M.W., C.Z., C.A., D.L. and J.L.; writing—original draft preparation, C.C.; writing—review and editing, C.C., M.W. and C.Z. All authors have read and agreed to the published version of the manuscript.

Funding

This study was supported by the National Natural Science Foundation of China (U2243237, U22A20237), and the Young Elite Scientists Sponsorship Program of the Henan Association for Science and Technology (No. 2022HYTP022).

Data Availability Statement

Data supporting this study’s findings are available from the corresponding author upon reasonable request (all simulation data).

Conflicts of Interest

The authors declare that they have no known competing financial interest or personal relationship that could have appeared to influence the work reported in this paper.

References

  1. Mekonnen, M.M.; Hoekstra, A.Y. Four billion people facing severe water scarcity. Sci. Adv. 2016, 2, 1500323. [Google Scholar] [CrossRef] [PubMed]
  2. Kong, D.X.; Miao, C.Y.; Li, J.H.; Zheng, H.Y. Full-stream erosion in the lower Yellow River: Feasibility, sustainability and opportunity. Sci. Total Environ. 2022, 807, 150810. [Google Scholar] [CrossRef] [PubMed]
  3. Chou, F.N.F.; Wu, C.W. Expected shortage-based pre-release strategy for reservoir flood control. J. Hydrol. 2013, 497, 1–14. [Google Scholar] [CrossRef]
  4. Dobson, B.; Wagener, T.; Pianosi, F. An argument-driven classification and comparison of reservoir operation optimization methods. Adv. Water Resour. 2019, 128, 74–86. [Google Scholar] [CrossRef]
  5. Xu, W.F.; Liu, P.; Guo, S.L.; Cheng, L.; Ming, B.; Gong, Y. Optimizing the reservoir operation for hydropower generation by using the flexibility index to consider inflow uncertainty. J. Water Resour. Plan. Manag. 2021, 147, 06021008. [Google Scholar] [CrossRef]
  6. Feng, Z.K.; Niu, W.J.; Jiang, Z.Q.; Qin, H.; Song, Z.G. Monthly operation optimization of cascade hydropower reservoirs with dynamic programming and Latin hypercube sampling for dimensionality reduction. Water Resour. Manag. 2020, 34, 2029–2041. [Google Scholar] [CrossRef]
  7. Rani, D.; Mourato, S.; Moreira, M. A generalized dynamic programming modeling approach for integrated reservoir operation. Water Resour. Manag. 2020, 34, 1335–1351. [Google Scholar] [CrossRef]
  8. Mo, C.X.; Mo, G.Y.; Liu, P.; Zhong, H.H.; Wang, D.Y.; Huang, Y.; Jin, J.L. Reservoir operation by staging due to climate variability. Hydrol. Sci. J. 2018, 63, 926–937. [Google Scholar] [CrossRef]
  9. Chen, L.; Guo, S.L.; Yan, B.W.; Liu, P.; Fang, B. A new seasonal design flood method based on the bivariate joint distribution of flood magnitude and date of occurrence. Hydrol. Sci. J. 2010, 55, 1264–1280. [Google Scholar] [CrossRef]
  10. Eum, H.I.; Simonovic, S.P. Integrated reservoir management system for adaptation to climate change: The Nakdong river basin in Korea. Water Resour. Manag. 2010, 24, 3397–3417. [Google Scholar] [CrossRef]
  11. Ouyang, S.; Zhou, J.Z.; Li, C.L.; Liao, X.; Wang, H. Optimal design for flood limit water level of cascade reservoirs. Water Resour. Manag. 2015, 29, 445–457. [Google Scholar] [CrossRef]
  12. Ding, W.; Zhang, C.; Peng, Y.; Zeng, R.J.; Zhou, H.C.; Cai, X.M. An analytical framework for flood water conservation considering forecast uncertainty and acceptable risk. Water Resour. Res. 2015, 51, 4702–4726. [Google Scholar] [CrossRef]
  13. Wang, Z.Z.; Wu, J.J.; Cheng, L.; Liu, K.; Wei, Y.M. Regional flood risk assessment via coupled fuzzy c-means clustering methods: An empirical analysis from China’s Huaihe River Basin. Nat. Hazards 2018, 93, 803–822. [Google Scholar] [CrossRef]
  14. Su, C.; Chen, X. Assessing the effects of reservoirs on extreme flows using nonstationary flood frequency models with the modified reservoir index as a covariate. Adv. Water Resour. 2019, 124, 29–40. [Google Scholar] [CrossRef]
  15. Mo, C.X.; Zhu, C.; Ruan, Y.L.; Lei, X.B.; Xing, Z.X.; Sun, G.K. Study on the staged operation of a multi-purpose reservoir in flood season and its effect evaluation. Water 2021, 13, 2563. [Google Scholar] [CrossRef]
  16. Mo, C.X.; Deng, J.; Lei, X.B.; Ruan, Y.L.; Lai, S.F.; Sun, G.K.; Xing, Z.X. Flood season staging and adjustment of limited water level for a multi-purpose reservoir. Water 2022, 14, 775. [Google Scholar] [CrossRef]
  17. Song, Y.; Wang, H.R. Study on stage method of reservoir flood season. In Proceedings of the 2021 6th International Conference on Clean, Shanghai, China, 10–12 September 2021; Energy Reports. Elsevier: Amsterdam, The Netherlands, 2022; Volume 8, pp. 138–146. [Google Scholar] [CrossRef]
  18. Liu, D.D.; Li, X.; Guo, S.L.; Rosbjerg, D.; Chen, H. Using a Bayesian probabilistic forecasting model to analyze the uncertainty in real-time dynamic control of the flood limiting water level for reservoir operation. J. Hydrol. Eng. 2015, 20, 04014036. [Google Scholar] [CrossRef]
  19. Liu, G.J.; Qin, H.; Shen, Q.; Tian, R.; Liu, Y.Q. Multi-Objective Optimal Scheduling Model of Dynamic Control of Flood LimitWater Level for Cascade Reservoirs. Water 2019, 11, 1836. [Google Scholar] [CrossRef]
  20. Zhang, J.; Min, Y.W.; Feng, B.F.; Duan, W.X. Research and application of key technologies for dynamic control of reservoir water level in flood season. Water 2021, 13, 3576. [Google Scholar] [CrossRef]
  21. Pan, J.B.; Xie, Y.; Liu, M.; Gao, Z.; Gao, Z.Z.; Xue, B.W. Dynamic control of water level in flood-limited reservoir based on intelligent calculation. Hindawi Math. Probl. Eng. 2022, 2022, 3683122. [Google Scholar] [CrossRef]
  22. Waylen, P.; Woo, M.K. Prediction of annual floods generated by mixed processes. Water Resour. Res. 1982, 18, 1283–1286. [Google Scholar] [CrossRef]
  23. Leclerc, G.; Marks, D.H. Determination of the discharge policy for existing reservoir networks under differing objectives. Water Resour. Res. 1983, 9, 1155–1165. [Google Scholar] [CrossRef]
  24. Colorni, A.; Fronza, G. Reservoir management via reliability programming. Water Resour. Res. 1976, 12, 85–88. [Google Scholar] [CrossRef]
  25. Miller, B.A.; Whitlock, A.; Hughes, R.C. Flood management—The TVA Experience. Water Int. 1996, 21, 119–130. [Google Scholar] [CrossRef]
  26. Black, A.R.; Werritty, A. Seasonality of flooding: A case study of North Britain. J. Hydrol. 1997, 195, 1–25. [Google Scholar] [CrossRef]
  27. Wurbs, R.A.; Cabezas, L.M. Analysis of reservoir storage reallocations. J. Hydrol. 1987, 92, 77–95. [Google Scholar] [CrossRef]
  28. Johnson, W.K.; Wurbs, R.A.; Beegle, J.E. Opportunities for reservoir-storage reallocation. J. Water Resour. Plan. Manag. 1990, 116, 550–566. [Google Scholar] [CrossRef]
  29. Villarini, G.; Smith, J.A.; Serinaldi, F.; Bales, J.; Bates, P.D.; Krajewski, W.F. Flood frequency analysis for nonstationary annual peak records in an urban drainage basin. Adv. Water Resour. 2009, 32, 1255–1266. [Google Scholar] [CrossRef]
  30. Shu, W.M.; Li, Q.P.; Cao, G.R.; Wang, H.T.; Li, P. Analysis of compensation benefits of Wudongde and Baihetan cascade reservoirs. Water Power 2018, 44, 74–77. [Google Scholar] [CrossRef]
  31. Liu, P.; Li, L.P.; Guo, S.L.; Xiong, L.H.; Zhang, W.; Zhang, J.W.; Xu, C.Y. Optimal design of seasonal flood limited water levels and its application for the Three Gorges Reservoir. J. Hydrol. 2015, 527, 1045–1053. [Google Scholar] [CrossRef]
  32. Chen, S.Y. The theory and application of fuzzy optimum selection for the multistage and multi-objective decision-making system. Shuilixuebao 1990, 1, 499–512. [Google Scholar]
  33. Hasebe, M.; Nagayama, Y. Reservoir operation using the neural network and fuzzy systems for dam control and operation support. Adv. Eng. Softw. 2002, 33, 245–260. [Google Scholar] [CrossRef]
  34. Deka, P.C.; Chandramouli, V. Fuzzy neural network modeling of reservoir operation. J. Water Resour. Plan. Manag. 2009, 135, 5–12. [Google Scholar] [CrossRef]
  35. Hadzima-Nyarko, M.; Rabi, A.; Sperac, M. Implementation of artificial neural networks in modeling the water-air temperature relationship of the river Drava. Water Resour. Manag. 2014, 28, 1379–1394. [Google Scholar] [CrossRef]
  36. Wambua, R.M.; Mutua, B.M.; Raude, J.M. Prediction of missing Hydro-meteorological data series using artificial neural networks (ANN) for upper Tana River Basin, Kenya. Am. J. Water Resour. 2016, 4, 35–43. [Google Scholar]
  37. Deweber, J.T.; Wagner, T. A regional neural network ensemble for predicting mean daily river water temperature. J. Hydrol. 2014, 517, 187–200. [Google Scholar] [CrossRef]
  38. Piccolroaz, S.; Calamita, E.; Majone, B.; Gallice, A.; Siviglia, A.; Toffolon, M. Prediction of river water temperature: A comparison between a new family of hybrid models and statistical approaches. Hydrol. Process. 2016, 30, 3901–3917. [Google Scholar] [CrossRef]
  39. Chen, C.X.; Fu, J.; Wu, M.X.; Gao, X.; Ma, L.M. High-efficiency sediment transport requirements for the operation of the Xiaolangdi Reservoir in the Lower Yellow River. Water Supply 2022, 22, 8572–8586. [Google Scholar] [CrossRef]
  40. Chen, L.; Sui, X.; Wang, D.S.; Yin, X.Y.; Ji, G.D. The ecological benefit-loss evaluation in a riverine wetland for hydropower projects—A case study of Xiaolangdi reservoir in the Yellow River, China. Ecol. Eng. 2016, 96, 34–44. [Google Scholar] [CrossRef]
  41. Zhao, Y.; Cao, W.H.; Hu, C.H.; Zhang, X.M.; Lv, X.Z.; Yin, X.L.; Hu, C.H.; Wang, Y.S.; Wang, Z.Y.; Zhang, X.M.; et al. Analysis of changes in characteristics of flood and sediment yield in typical basins of the Yellow River under extreme rainfall events. Catena 2019, 177, 31–40. [Google Scholar] [CrossRef]
  42. Hou, C.; Yi, Y.J.; Song, J.; Zhou, Y. Effect of water-sediment regulation operation on sediment grain size and nutrient content in the lower Yellow River. J. Clean. Prod. 2021, 279, 123533. [Google Scholar] [CrossRef]
  43. Zhao, Y.; Hu, C.H.; Zhang, X.M.; Lv, X.Z.; Yin, X.L.; Wang, Z.Y. Response of sediment discharge to soil erosion control in the middle reaches of the Yellow River. Catena 2021, 203, 105330. [Google Scholar] [CrossRef]
  44. Chen, Z.S.; Wang, H.M.; Qi, X.T. Pricing and water resource allocation scheme for the South-to-North Water Diversion Project in China. Water Resour. Manag. 2013, 27, 1457–1472. [Google Scholar] [CrossRef]
  45. Huang, H.; Niu, J.Y. Compensative operating feasibility analysis of the west route of the South-to-North Water Transfer Project dased on M-Copula Function. Water Resour. Manag. 2015, 29, 3919–3927. [Google Scholar] [CrossRef]
  46. Yang, T.; Zhang, Q.; Chen, Y.Q.D.; Tao, X.; Xu, C.Y.; Chen, X. A spatial assessment of hydrologic alteration caused by dam construction in the middle and lower Yellow River, China. Hydrol. Process. 2008, 22, 3829–3843. [Google Scholar] [CrossRef]
  47. Wang, S.; Fu, B.J.; Piao, S.L.; Lv, Y.H.; Ciais, P.; Feng, X.M.; Wang, Y.F. Reduced sediment transport in the Yellow River due to anthropogenic changes. Nat. Geosci. 2016, 9, 38–41. [Google Scholar] [CrossRef]
Figure 1. Location of XLDR in the Lower Yellow River.
Water 15 03552 g001
Figure 2. Flow chart of the present study.
Water 15 03552 g002
Figure 3. Comparison of calculated and measured cumulative siltation amounts in (a) the XLDR and (b) the LYR.
Water 15 03552 g003
Figure 4. Schematic diagram of training using the fuzzy optimization network in BP-ANN.
Water 15 03552 g004
Figure 5. Floods limit the XLDR’s water levels since its operation in October 1999.
Water 15 03552 g005
Figure 6. Processes of (a) incoming water and (b) sediment in the Middle Yellow River under different water and sediment scenarios.
Water 15 03552 g006
Figure 7. Comparison of the regulation effects of two FLWL modes for the XLDR in the next 50 years under changing sediment conditions. (a) TSRP_XLDR. (b) WS_LYR. (c) Qbmin_LYR after 50 years. (d) Td. (e) WLXLDR. (f) N XLDR. Mode A: gradually raising the FLWL; Mode B: raising the FLWL at one time; A-B: difference between Mode A and Mode B. The data next to the bars in each figure panel reflect the differences.
Water 15 03552 g007
Figure 8. Comparison of the relative membership values to the optimal scheme of the two FLWL operation modes for the XLDR in the next 50 years under different incoming sediment amount scenarios. Mode A: gradually raising the FLWL; Mode B: raising the FLWL at one time.
Water 15 03552 g008
Figure 9. Comparison of the relative membership values to the optimal scheme of the two FLWL operation modes for the XLDR in the next 50 years under a 20% increase in the incoming water. Mode A: gradually raising the FLWL; Mode B: raising the FLWL at one time.
Water 15 03552 g009
Figure 10. Comparison of the relative membership values to the optimal scheme of the two FLWL operation modes for the XLDR in the next 50 years after constructing the Guxian Water Conservancy Project in the upstream section. Mode A: gradually raising the FLWL; Mode B: raising the FLWL at one time.
Water 15 03552 g010
Table 1. Flood limit water level comprehensive benefit evaluation index system of the reservoir.
Overall Objective Primary IndicesSecondary IndicesTertiary IndicesTypes
The optimal regulation effect of comprehensive utilization of the reservoir Flood controlReservoirMaximum water level for flood controlCost
Downstream river channelCross-section flow capacityBenefit
Siltation reductionReservoirSediment retention periodBenefit
Downstream river channelSiltation amountCost
Minimum bank-full discharge of main channelBenefit
Water resources supply,
Irrigation,
ecological improvement
Downstream river channelNumber of days that do not meet the minimum discharge requirementCost
Hydropower generationReservoirWater level in front of the damBenefit (within the water level limit)
Power Station Hydropower generationBenefit
Table 2. Minimum discharge requirements of the Xiaolangdi Reservoir for water supply, irrigation, and ecological improvement in the lower reaches of the Yellow River. Units: m3/s.
Discharge RequirementsJanuaryFebruaryMarchAprilMayJuneJulyAugustSeptemberOctoberNovemberDecember
a. Water resources supply and irrigation 89307617653509354206151282319130112
b. Hydropower generation of a single station300300300300300300300300300300300300
c. Minimum ecological discharge at sea entry control station100100100757575220220220220100100
min(Qout) = max(a,b,c)300307617653509354300300300319300300
Table 3. Operation modes of raising the FLWL gradually and once in the XLDR during the flood season.
Operation ModesDischarging When
Filling Up
Discharging When Gathering FlowDispatching with High Sediment ConcentrationLowering the Water Level to Scour the Reservoir Area
Gradually raising the flood limit water levelStarting conditionWXLD ≥ 1.3 billion m3Qin ≥ 2600 m3/s
WXLD ≥ 600 million m3
Qin ≥ 2600 m3/s
Sin ≥ 200 kg/m3
Qin ≥ 2600 m3/s
ΔWsXLD ≥ 4.2 billion m3
Scheduling commandQHYK ≥ 3700 m3/s
T ≥ 5 d
QHYK ≥ 3700 m3/s
T ≥ 5 d
Pre-discharge or storage water to 300 million m3 2 days in advance,
Qout = Qin
QHYK = 4000 m3/s 2 days in advance until Qin < 2600 m3/s
Raising the flood limit water level at one timeStarting conditionZXLD ≥ 254 mSame with gradually raising the flood limit water level//
Scheduling commandQHYK ≥ 3700 m3/s
T ≥ 5 d
Same with gradually raising the flood limit water levelQout = min(Qout)Qout = min(Qout)
Note: WXLD is the adjustable water volume, i.e., the sum of incoming water volume and the storage volume above the dead level of the reservoir; Qin, Qout, and QHYK are the inflow of the Xiaolangdi Reservoir, an outflow of the Xiaolangdi Reservoir, and the flow at the Huayuankou Station of the LYR, respectively; Sin is the sediment concentration in the inflow; ΔWsXLD is the accumulated siltation in the Xiaolangdi Reservoir; T is the time; ZXLD is the water level in front of the dam in the Xiaolangdi Reservoir; min (Qout) is the minimum flow that the reservoir needs to discharge.
Table 4. Calculation results of relative membership weights.
Evaluation IndexTSRP_XLDRWS_LYRQbmin_LYRTdWLXLDRNXLDR
relative membership weights0.190.200.240.160.120.09
Table 5. List of BP-ANN training samples and simulation errors.
OptionsSample InputExpected OutputCalculated OutputSimulation Errors
Best(1.000, 1.000, 1.000, 1.000, 1.000, 1.000)1.001.0004080.000408
Intermediate 1(0.923, 0.974, 0.976, 0.971, 0.993, 0.996)0.750.7502500.000250
Intermediate 2(0.846, 0.948, 0.953, 0.942, 0.986, 0.992)0.500.5001570.000157
Intermediate 3(0.769, 0.922, 0.929, 0.912, 0.980, 0.989)0.250.249994−0.000006
Worst(0.692, 0.896, 0.906, 0.883, 0.973, 0.985)0.000.0000710.000071
Disclaimer/Publisher’s Note: The statements, opinions and data contained in all publications are solely those of the individual author(s) and contributor(s) and not of MDPI and/or the editor(s). MDPI and/or the editor(s) disclaim responsibility for any injury to people or property resulting from any ideas, methods, instructions or products referred to in the content.

