1. Introduction
The 0.74 °C rise in global air temperature in the 20th century has not only profoundly changed the precipitation variabilities and patterns but also the hydrological regimes of river basins throughout the world [
1]. This is especially true for the hydrological regimes of basins in the arid and semi-arid regions, where rivers originate from the mountains and mountain snowmelts sustain oases in the basins. Changes in these regimes will affect the regions’ water resource availability, food production, and the management of resources. Regional planners and policymakers must consider these interconnected issues, including the mitigation of natural hazards (e.g., floods and droughts).
With the increasing difficulties in accessing water in different parts of the world [
2] a better understanding of how climate change could influence regional water supplies becomes more essential for sustainable development, better water governance, and water resource utilization [
3]. This could be done by identifying and quantifying the trend of water resources at the regional scale under the current changing climate [
4]. Therefore, numerous studies have applied various statistical methods to assess the changing statistical properties of long-term hydro-meteorological time series (e.g., precipitation, temperature, and streamflow) around the globe (e.g., [
5,
6,
7,
8,
9,
10,
11]).
The Turpan Basin, which is located in the eastern Xinjiang Uyghur Autonomous Region of China, is one of the most arid and water-insecure regions. Surrounded by mountain ranges and far from the sea, the Turpan basin is characterized by a hot and arid continental climate with highly uneven spatio-temporal distributions of precipitation. The water resources and oasis systems of the basin originate mainly from mountain snowmelt. Agriculture in the basin has been traditionally irrigated using either surface water from rivers whose source is the mountainous areas in the north and west or Karez systems, which rely on tunnels that tap groundwater from higher areas [
12]. However, the irrigated areas in the Turpan basin have been greatly expanded from 60,000 hectares in 1970 to 113,000 hectares in 2008 through the construction of reservoirs and canals, the application of improved irrigation technologies in the cropping fields, and the drilling of groundwater pumping wells. Worse still, with agriculture using about 95% of the water, the region finds it difficult to satisfy increasing water demands in other sectors, particularly petroleum, natural gas, and coal production. Competition for water resources is the chief impediment to the region’s economic and social development. To understand how water resources can be sustainably used in this region, it is essential to analyze the regional climatic variability and its impact on streamflow under the changing climate.
Previous studies have largely concentrated on studying the hydro-meteorological variations of the whole Xinjiang (e.g., [
13,
14,
15]), the Tarim River basin in southern Xinjiang (e.g., [
16,
17,
18,
19,
20]), Tian Shan in northwestern Xinjiang (e.g., [
21,
22,
23,
24,
25]), and the Manas River basin in northern Xinjiang (e.g., [
26,
27]). Based on air temperature, precipitation, and surface runoff time series in Xinjiang over the past 50 years, [
14] examined the long-term trend and jump point of the time series, whereas [
13] investigated the spatio-temporal variabilities of the data. For the Tarim River basin, Ref. [
19] explored the hydrological response to climate change in the basin by using both parametric and non-parametric methods and concluded that temperature rose by nearly 1 °C over the study period and annual precipitation increased by 6.8 mm per decade. They also detected a step change in both temperature and precipitation in 1986, and these changes in climatic variables resulted in a significant monotonic increase in the streamflow of the Aksu River and the Yarkant River. Ref. [
18] echoed the conclusion of [
19] by attributing the cause of increases in hydro-meteorological variables to the geomorphologic properties of the headwater areas. On the other hand, Ref. [
16] showed that an increase in runoff in the headstreams was due to climate change, while a decrease in runoff in the main streams was a response to human activities. With their important role as the ‘water tower of Central Asia’, Tian Shan and its catchments have been heavily studied, and the flow response to climate change was characterized by increasing temperatures leading to glacier shrinkage and flow increases in most of the rivers [
21,
23,
25].
Climate change has left marks on the ecosystem in Northwestern China with steadily increasing temperatures and a moderate increase in precipitation, more noticeably since 1980 [
28]. The dry desert climate, with high evapotranspiration demand and little rainfall in summer, makes irrigation and extraction of groundwater in the Turpan Basin indispensable for agriculture in the region. The desert agriculture practice is detrimental to soil health as the high evaporation and irrigation can cause soil salinization and degradation. It is critical to understand what the current trend of climate is to understand the ramifications of future climate change on soil health.
The above studies have significantly advanced the understanding of the sensitivity and susceptibility of glacier-fed and snowmelt-dominant streamflow regimes to climate change in Xinjiang and certain parts of the region; however, investigation on the climatic variability and its possible hydrological implications in eastern Xinjiang (i.e., Turpan basin) has not been addressed and has been very limited in the literature. To the best of the authors’ knowledge, Ref. [
29] study has been the only one to examine the relationship between reference evapotranspiration and growing degree days in the Turpan area. In light of the documented impact of climate change on flow regimes in other regions and the growing competition for water resources in the Turpan basin, this study presents novel contributions. The objectives of this study are threefold: (1) to analyze the trends and their magnitudes of hydro-meteorological variables in the Turpan basin from 1959 to 2012 with the use of a Mann–Kendall test and a Sen’s slope estimator; (2) to detect the change points of the time series in this study period using a Pettitt test; and (3) to explore the plausible association between streamflow and climate change by Pearson correlation analysis. By addressing these objectives, our study offers a unique perspective on long-term hydrological changes and their responses to climate variability, providing valuable insights for sustainable water resource management in the Turpan basin.
The remainder of the paper is organized into five key sections.
Section 2 introduces this study area, providing geographical context. In
Section 3, the data sources and collection methods are detailed.
Section 4 outlines the methodology, explaining analytical approaches.
Section 5 presents the results, highlighting key findings. Finally,
Section 6 combines discussion and conclusions, offering insights and summarizing this study’s contributions.
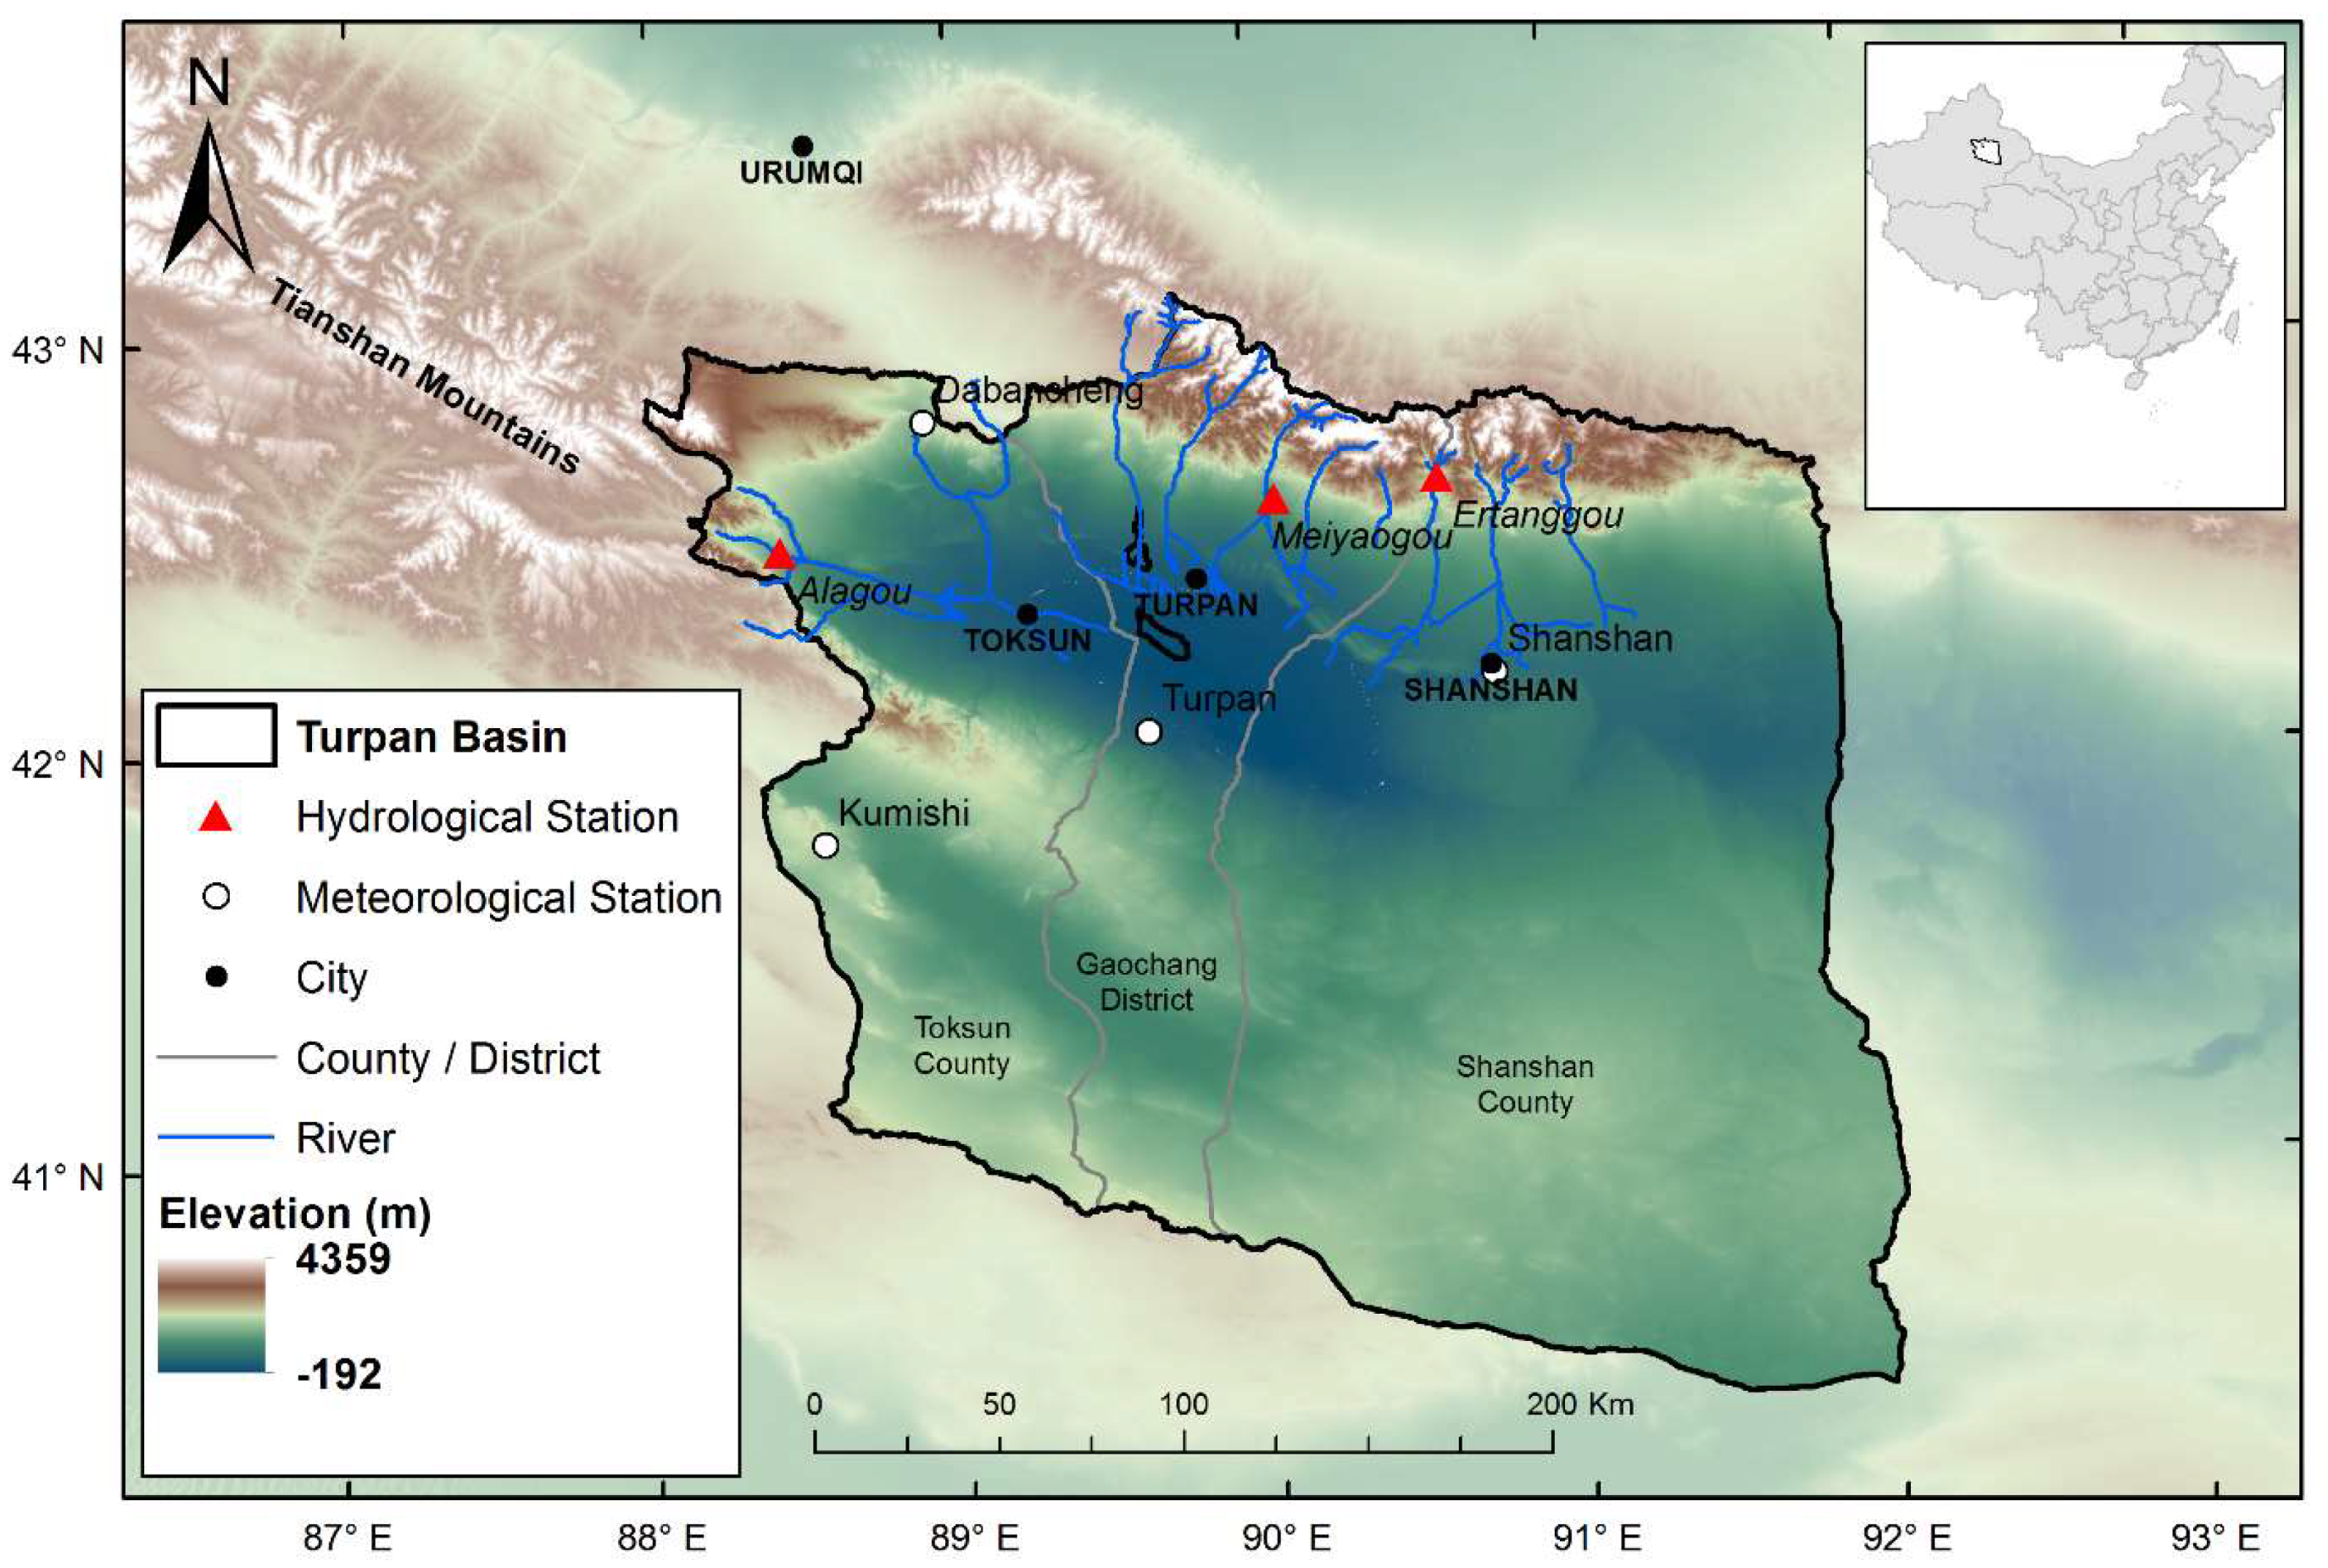
2. Study Area
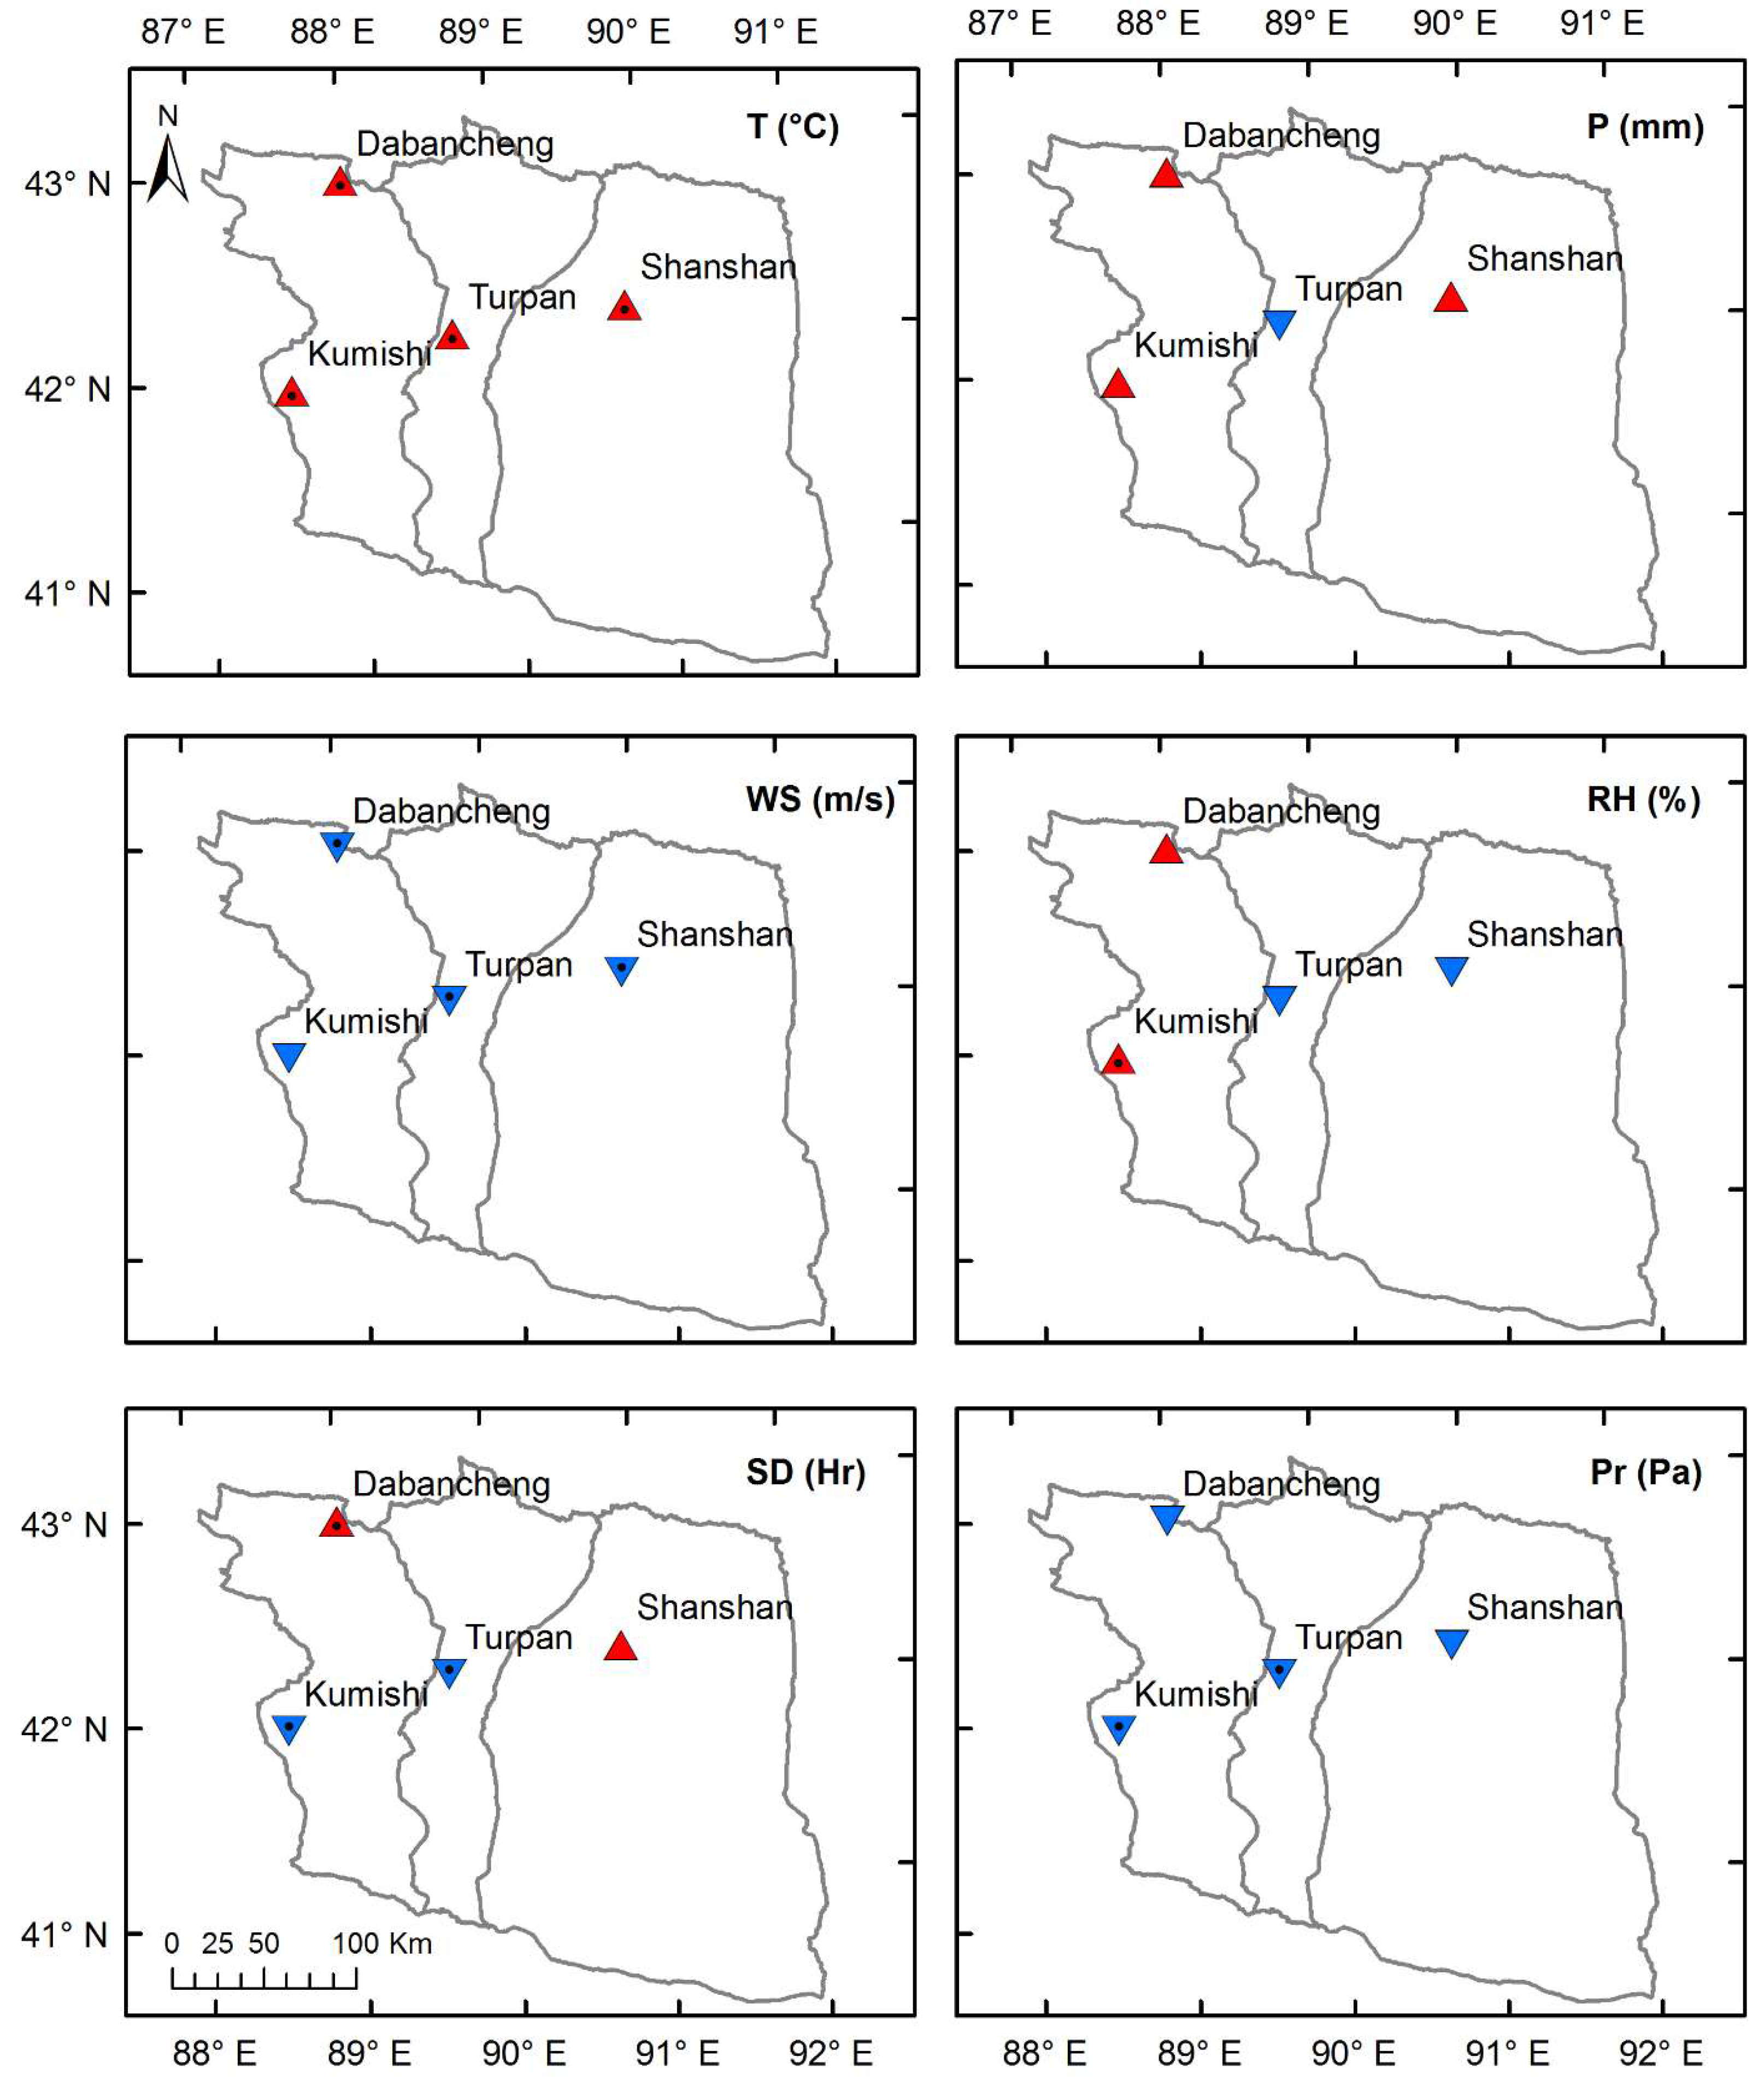
The Turpan basin is situated about 150 km southeast of the provincial capital city, Urumqi, of the Xinjiang province in China. It has a total area of about 70,000 km
2 and a population of nearly 600,000. It covers 95% of the Turpan prefecture, which consists of three sub-divisions: Toksun County, Shanshan County, and Gaochang District (see
Figure 1). This is one of the poorest regions in China, where the annual per capita net income is around US
$440, ranking eighth from the bottom on the national rural income list. The Turpan Basin is a closed intermountain basin in the south of the eastern Tianshan Mountains, surrounded by mountain ranges with snow-covered peaks that reach over 4000 m in the north. Lake Aiding is the destination of surface runoff in the Turpan Basin, which is the second lowest point on earth at 154.31 m below sea level in its southern part.
Dominated by continental arid conditions and little influence of the East Asian Monsoon, this arid region is characterized by a hot and arid continental climate, a wide temperature range, low precipitation, and low humidity. It has very hot and long summers and very cold and long winters. The annual mean temperature is 13.4 °C and ranges from −9.8 °C in January to 31.8 °C in July. Annual precipitation in the basin varies from 6.3 to 25.3 mm, while annual evapotranspiration falls within 2751–3744 mm.
The basin’s water resources (both surface and groundwater) originate mainly from mountain snowmelt, which sustains the oasis systems in the northern part of the basin. Away from sources of water, the basin is not covered by vegetation. Streamflow primarily occurs in summer seasons and contributes to 60–80% of the total annual flow of the basin. Despite the low amount of annual precipitation, the Turpan basin often experiences annual flooding from mountain snowmelt. For instance, in a 1996 flood event, thousands of people were made homeless, and direct economic losses alone were estimated at US
$67 million. The Turpan basin’s desert climate and its reliance on glacier melt make it vulnerable to climate change, as future warming tends to be stronger in high latitudes and high mountains than the global average [
1,
30,
31].
5. Results
The above statistical tests were applied to the time series from 1959 to 2012 for the six meteorological variables: mean temperature (
), total precipitation (
), mean wind speed (
), relative humidity (
), hour of sunshine duration (
), and mean pressure (
) at four meteorological stations. The tests were also conducted on the time series for the streamflow (
) at two hydrological stations. The significance of the statistical results was evaluated at three different significance levels (
) 10%, 5%, and 1%, respectively. The results are presented in three sections here.
Section 5.1 shows the results on the detection of monotonic trends within the hydro-meteorological time series. In
Section 5.2, the change points of each variable, if any, are identified and discussed. Lastly,
Section 5.3 displays the relationships between streamflow and meteorological variables.
5.1. Trends in the Hydro-Meteorological Variables
The results of the MK test for the monotonic trends on the annual time series of the meteorological variables are shown in
Figure 2. On an annual time scale,
of all stations had undergone significant increasing trends at ≤10% significance level, with Turpan station experiencing the strongest upward association over time of 0.569, followed by Kumishi (0.430), Dabancheng (0.385), and Shanshan (0.176) (
Table 3). On the contrary, all stations exhibited decreasing trends for
and
. The decreasing wind speed and pressure at Turpan station during the last five decades were both statistically significant at the 1% significance level. Yet, Dabancheng and Shanshan stations only showed significant downward trends for
whereas Kumishi station only indicated significant decreasing trends for
. The trends of
at Dabancheng and Kumishi stations, which are both located at higher elevations on mountains, were increasing, while at Turpan and Shanshan stations, they were decreasing. All the detected trends were, however, not statistically significant, except the upward trend at Kumishi station at the 5% significance level. The hour of sunshine duration at Kumishi and Turpan stations experienced a significant (
) reduction, whereas that at Dabancheng station exhibited a considerable increase at the 5% significance level. In addition, although the total precipitation displayed a positive trend at most stations (except Turpan station), the trend was not statistically significant at any significance levels.
On a seasonal basis (
Table 3), the significant increasing trends of temperature at four stations mainly occurred in summer and autumn, with average Kendall’s tau values of 0.312 and 0.356, respectively. Spring warming was also evident in four stations, where Turpan and Shanshan stations showed a stronger upward association over time (>0.254) than Dabancheng and Kumishi stations (>0.157). In winter, Kumishi and Turpan stations exhibited different degrees of warming during this study period, while Dabancheng station showed an insignificant increase in temperature. On the other hand, Shanshan station was the only station that displayed a negative association over time at the 1% significance level. Regarding the total precipitation, all stations except Turpan showed a significant (
) positive association over winter time, with Kendall’s tau values ranging from 0.237 to 0.284. Similar to the insignificant annual trends, the trends in other seasons were not statistically significant at any significance level. With respect to wind speed, the negative associations over time were most prevailing in summer (>−0.341), followed by spring (>−0.319), winter (>−0.306), and autumn (>−0.209). In particular, the trends of
at Dabancheng station were significantly (
) decreasing in spring and summer only, while the downward trends at Turpan and Shanshan stations, which are located at lower elevations of the basin, occurred in four seasons. Concerning the relative humidity, statistically significant (5%) positive trends at Kumishi station could be detected not only on an annual basis but also in autumn and winter. Conversely, even though no significant annual trends were found in Turpan and Shanshan stations, statistically significant (
) negative trends of
were identified in spring at Turpan and Shanshan and in autumn at Turpan. Referring to the hour of sunshine duration, the decrease in sunshine duration was witnessed through four seasons at Kumishi station, with autumn experiencing the most significant reduction (−0.402). The decreasing trends of
at Turpan station in autumn and winter were much stronger than those at Kumishi, where the Kendall’s tau values were −0.419 and −0.539, respectively. For pressure, all stations showed a negative association over autumn time at the ≤5% significance level, with Kendall’s tau values ranging from −0.202 (Kumishi) to −0.305 (Turpan). In addition, both Kumishi and Turpan stations displayed significant (
) downward trends of
in winter.
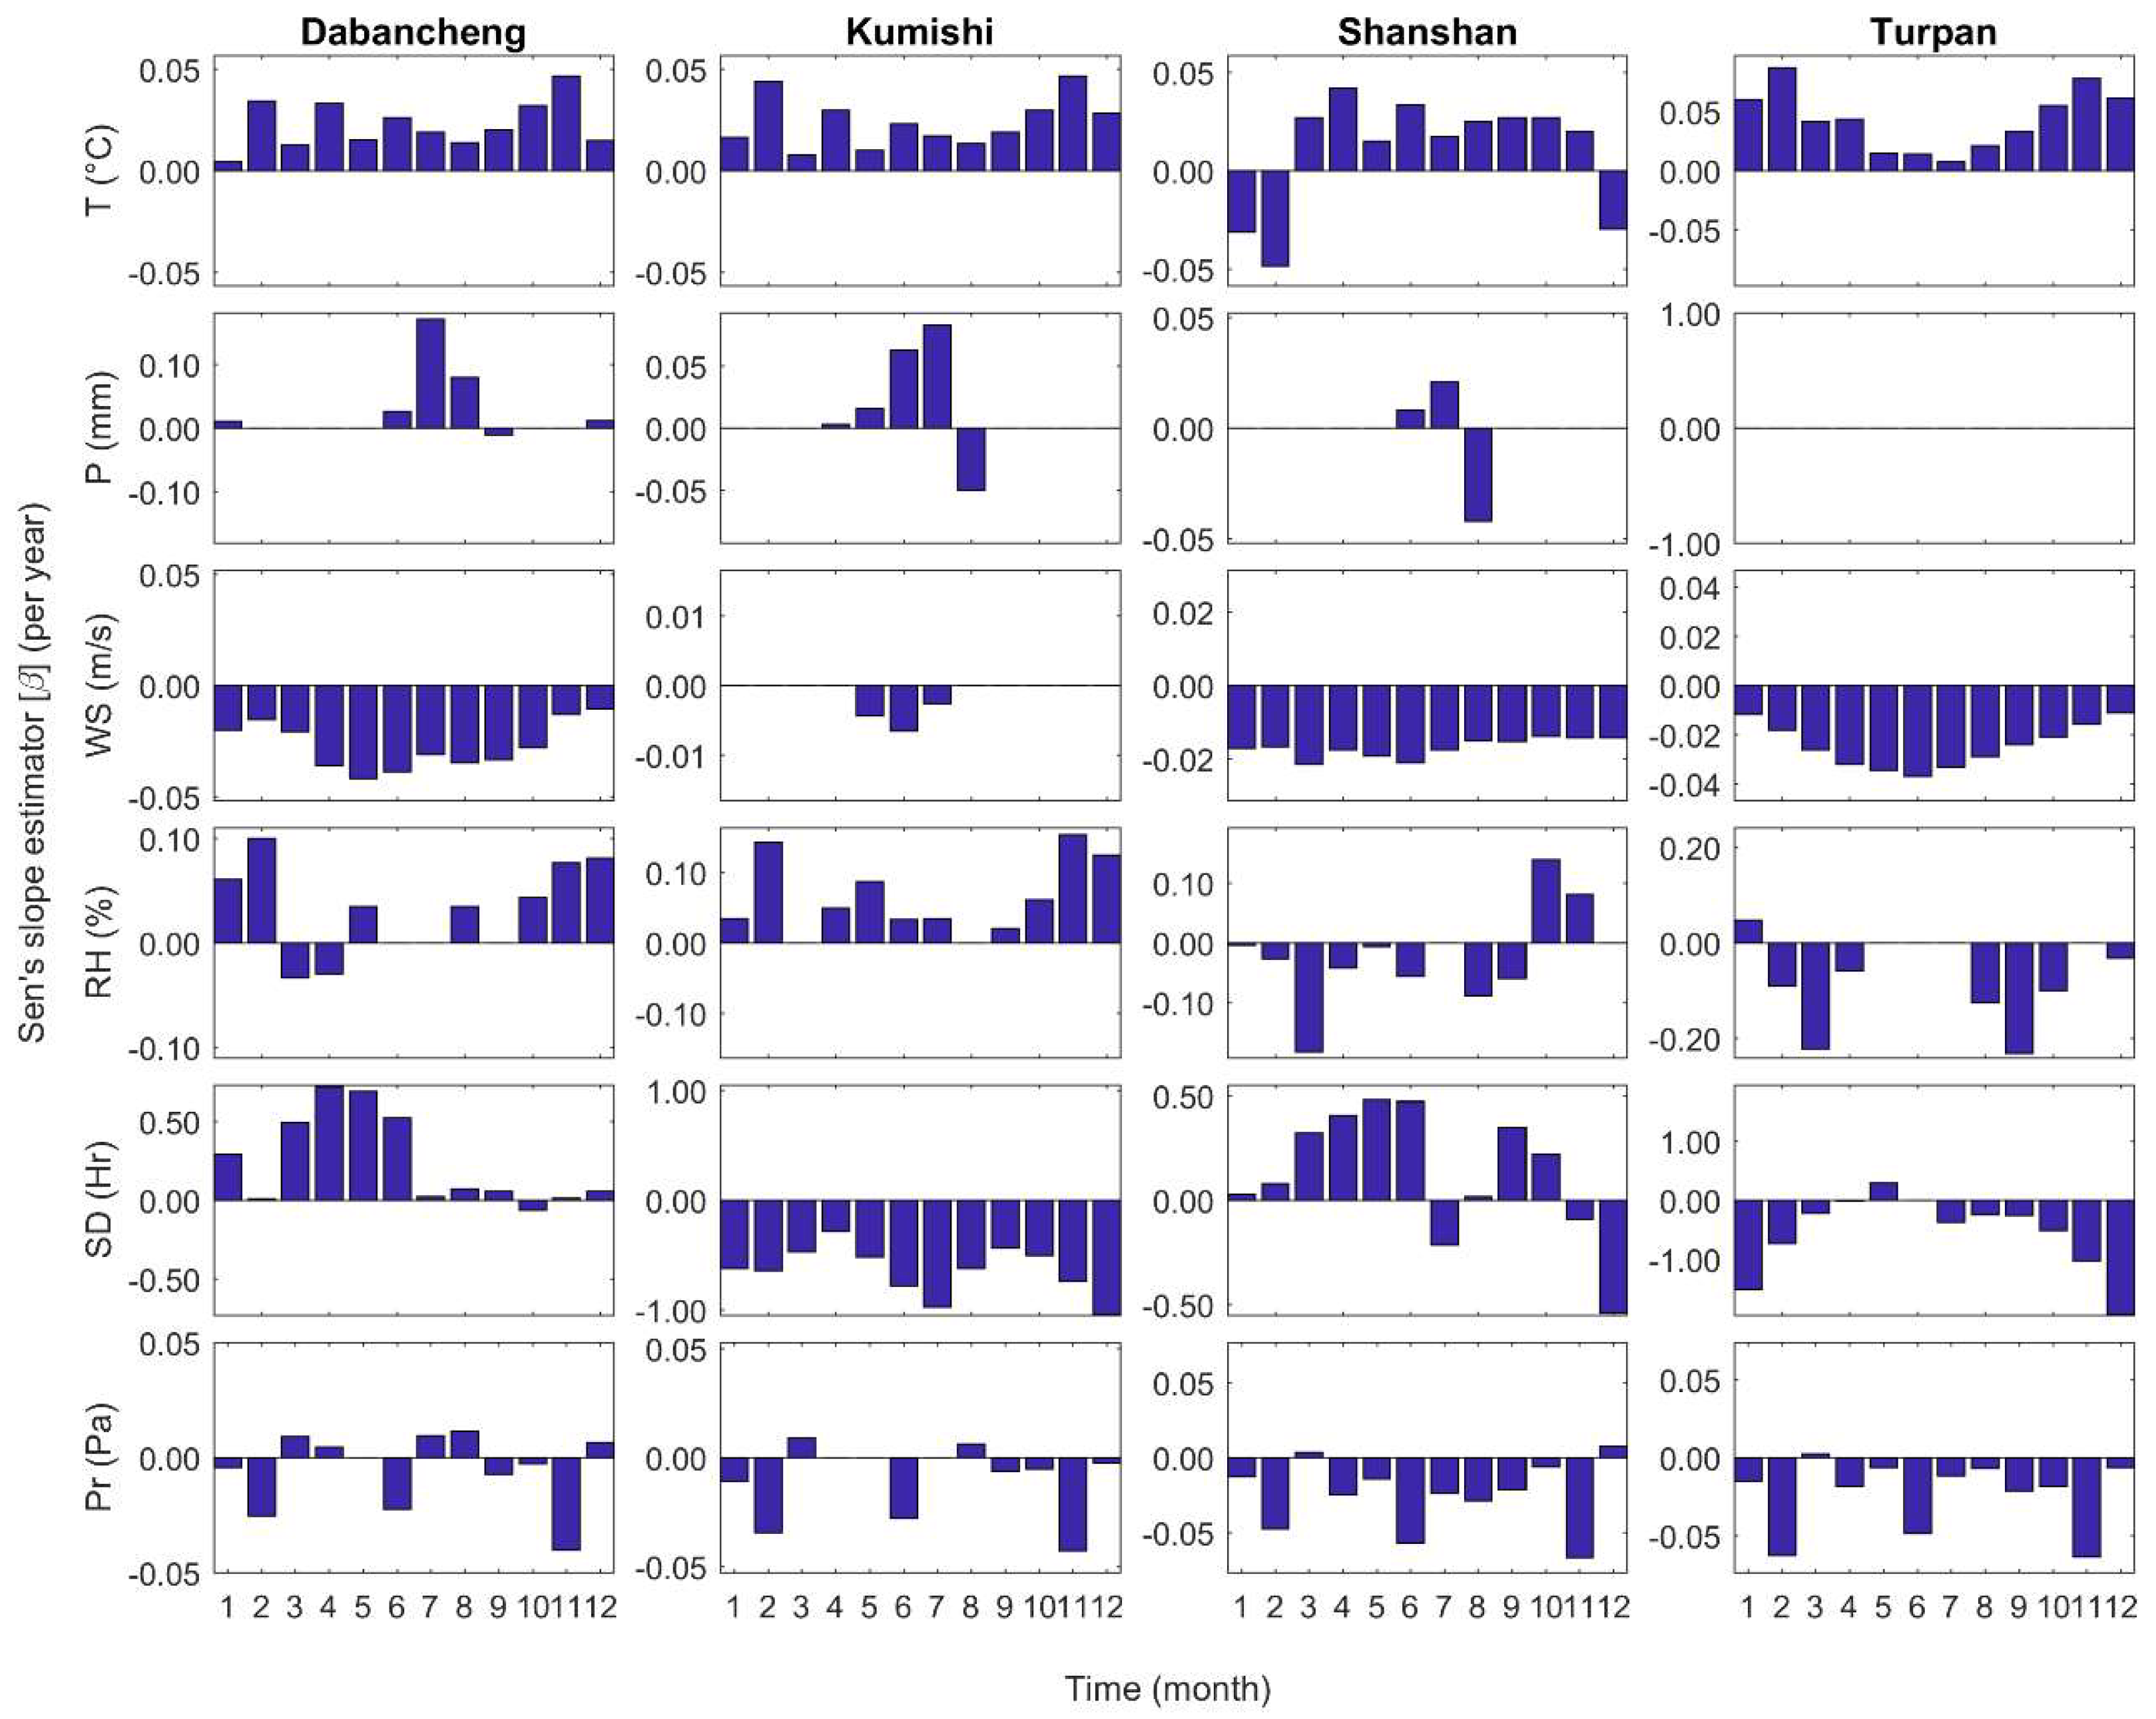
Further examination of the magnitude of the detected trends was done on a monthly basis (
Figure 3). Located at the foothills of the Tianshan Mountains, both Dabancheng and Kumishi stations experienced similar monthly patterns of increasing temperature, with the rates of increase being the largest in November (0.47 °C/decade). Turpan station, which is located at the valley bottom of the basin, displayed the highest average warming of 0.43 °C/decade. In particular, the rates of increase in five months were greater than 0.5 °C/decade, and the largest was seen in February. On the contrary, the temperature at Shanshan station declined the fastest in February, with a decreasing rate of −0.48 °C/decade. Precipitation at all stations (except Turpan) exhibited similar monthly patterns, with major changes occurring during June and August. An increasing amount of precipitation was witnessed during June and July, with positive rates ranging from 0.08 mm/decade to 1.72 mm/decade. Yet, precipitation at Kumishi and Shanshan stations decreased in August, with an average reduction rate of −0.46 mm/decade. While the magnitude of decreasing wind speed at Shanshan station was fairly even throughout the year (−0.17 m/s per decade on average), Dabancheng and Turpan stations showed a more “U-shape” pattern in which the rates of decreasing wind speed were the highest during the transition from spring to summer (−0.40 and −0.36 m/s per decade, respectively). Relative humidity at Dabancheng and Kumishi stations generally showed an increasing percentage in most of the months, with Kumishi having a higher average rate of increase (0.62%/decade) than Dabancheng (0.43%/decade). Turpan and Shanshan stations, however, displayed the opposite patterns, in which relative humidity in most of the months was lower over this study period. The reducing hours of sunshine duration were quite substantial at Kumishi station, where the average decreasing rate was −6.36 h/decade, and the largest reduction occurred in December (−10.39 h/decade). Likewise, the highest rate of reducing sunshine duration at Shanshan and Turpan stations was in December (−5.42 and −19.37 h/decade, respectively). On the other hand, Dabancheng and Shanshan stations experienced longer periods of sunshine during January and June, with a range of 0.10 to 7.21 h/decade. Pressure at four stations shared fairly similar monthly patterns of decreasing pressure in most of the months in which the three most decreasing rates appeared in February (−0.42 Pa/decade), June (−0.39 Pa/decade), and November (−0.53 Pa/decade).
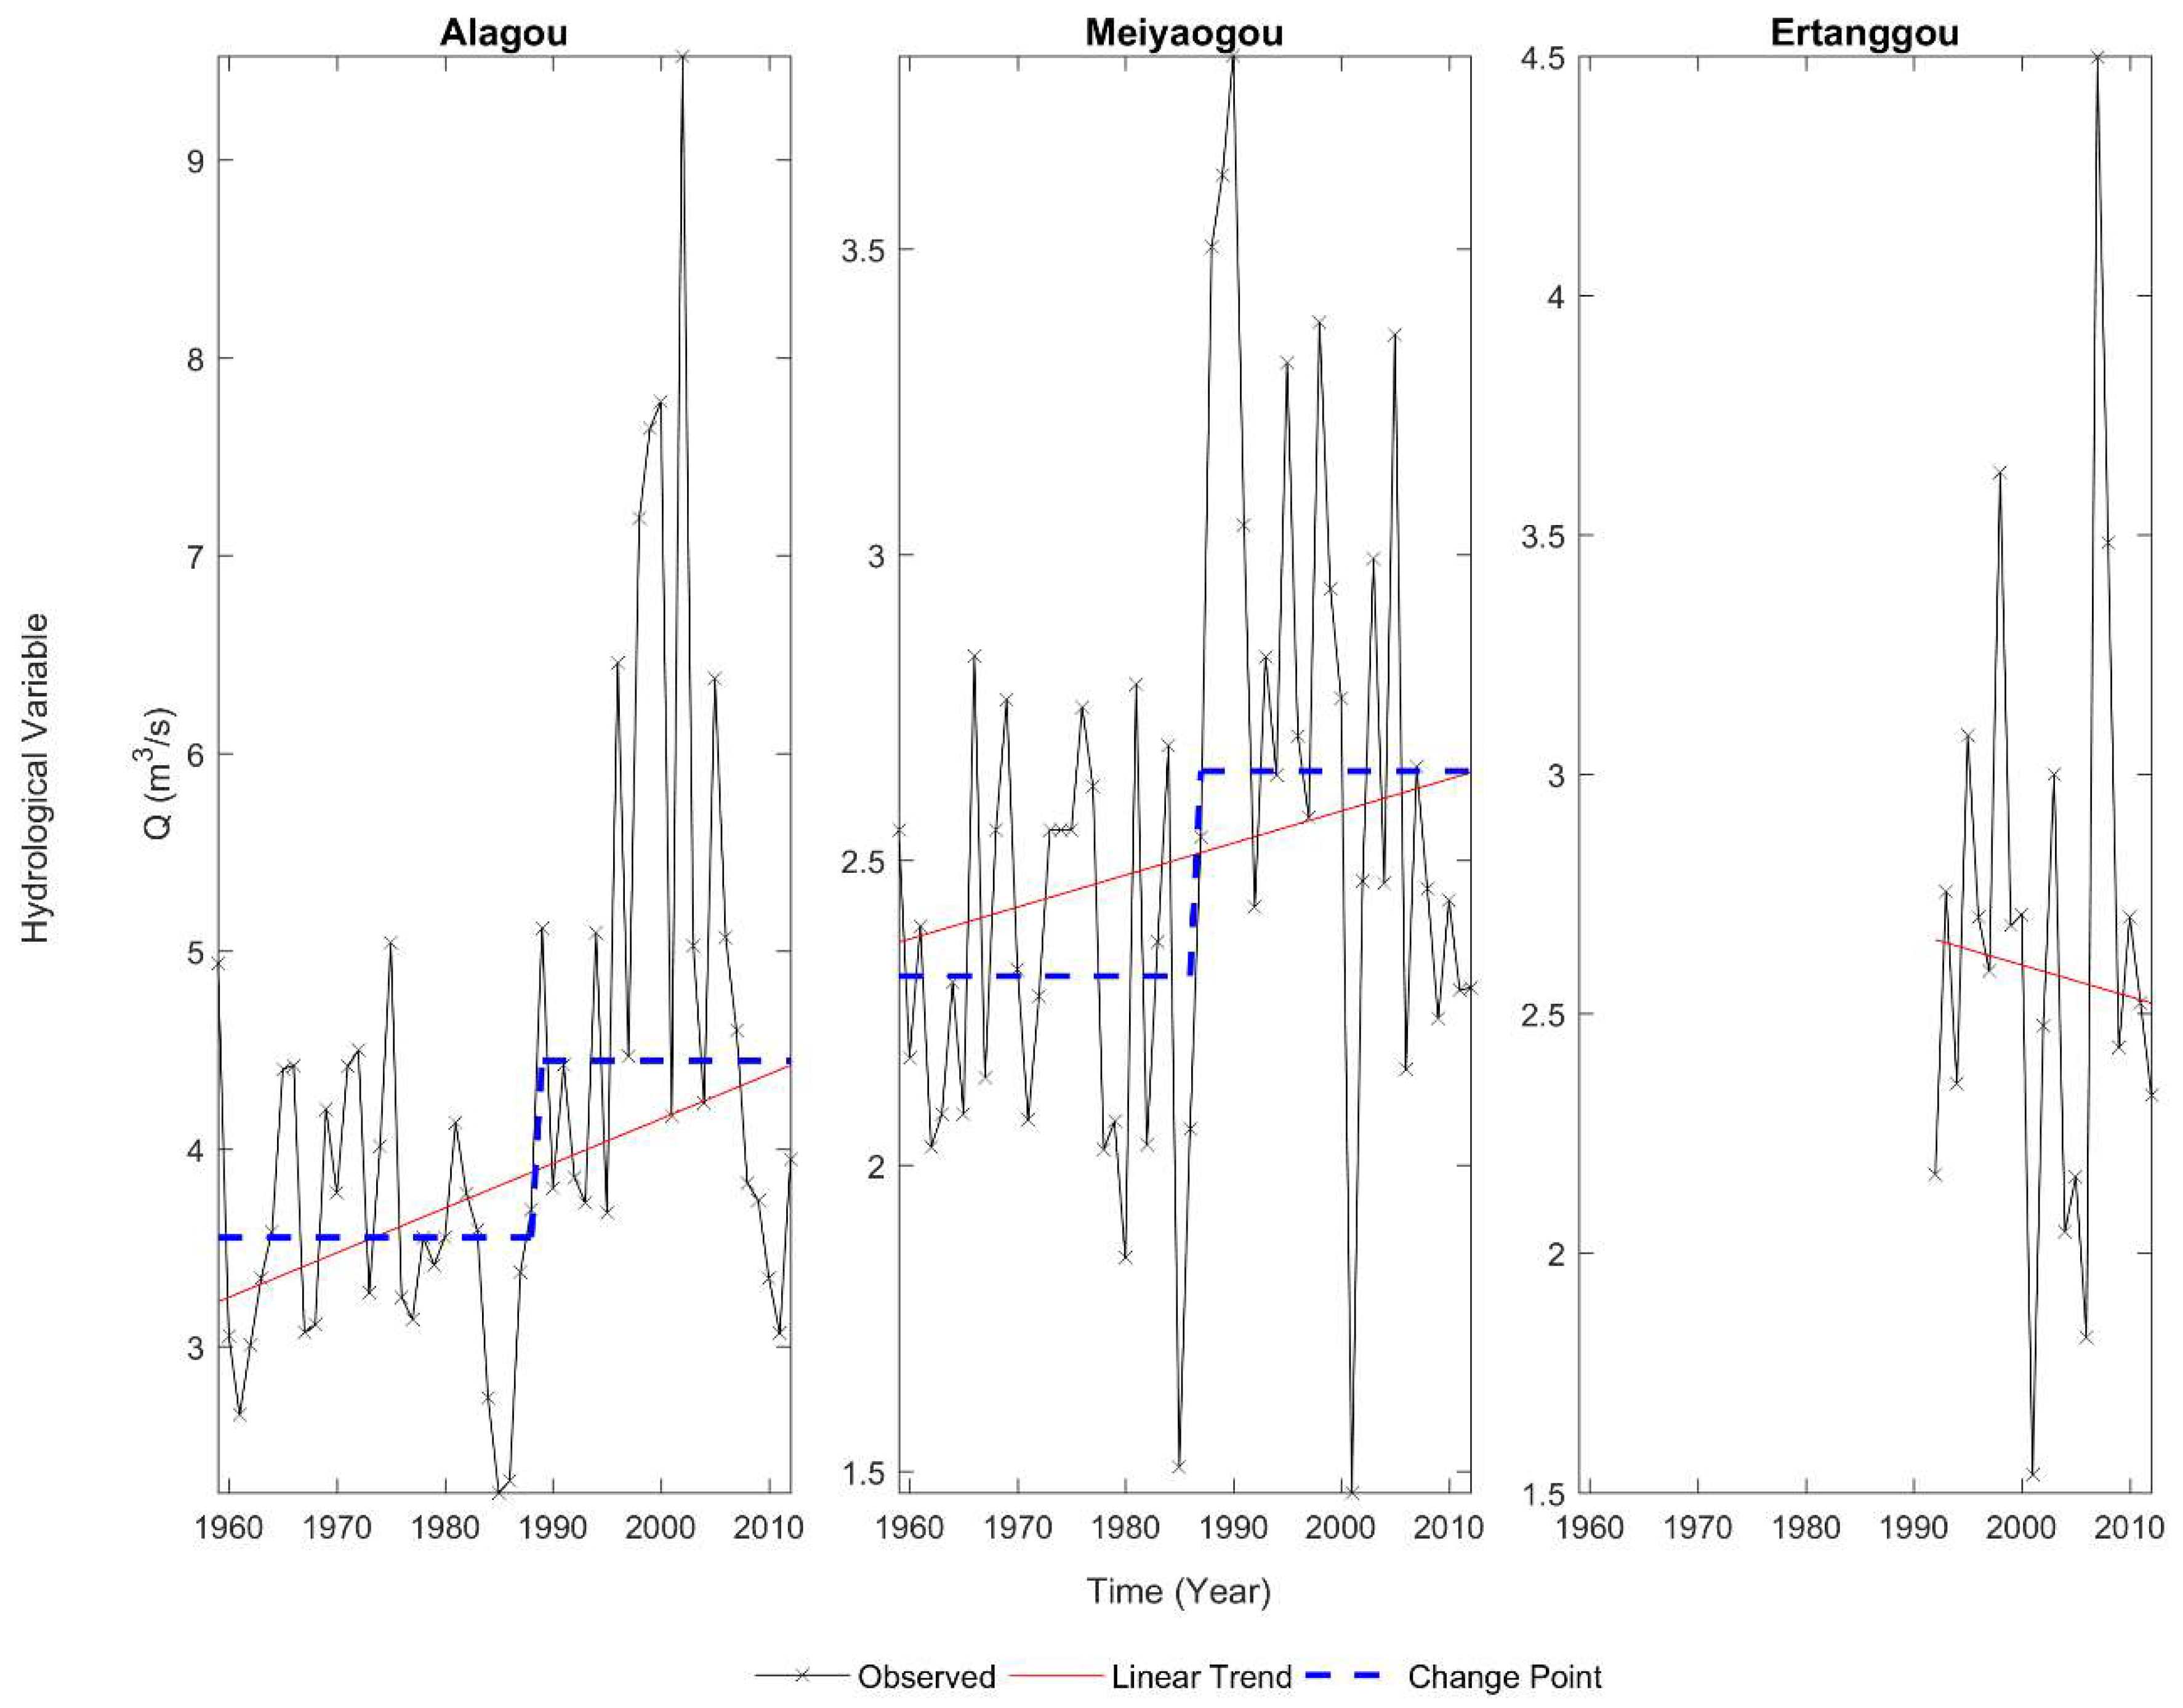
Streamflow at Alagou and Meiyaogou hydrological stations was also assessed to detect the existence of monotonic trends and determine the magnitude of the detected trends at monthly, seasonal, and annual scales (
Table 4). Ertanggou station was omitted for analysis due to its short duration. The results of the MK tests revealed that the increasing annual trend of streamflow at Alagou station was statistically significant (
) while that of Meiyaogou station was not significant at any significance levels. This was the same when examining the seasonal scale, in which the increasing trends at Alagou were significant at the 1% significance level in spring and autumn and at the 5% level in summer and autumn, but none at Meiyaogou. The upward association over time at Alagou was the strongest in autumn (0.250), followed by spring (0.242), winter (0.208), and summer (0.196). On a monthly basis, the significant (
) increasing trends at Alagou mainly occurred from February to April, July, and September to November. On the other hand, streamflow at Meiyaogou experienced a reducing flow volume in January at the 5% significance level and an increasing trend in June at the 10% significance level. Regarding the magnitude of the trends, the annual increasing rate of streamflow at Alagou (0.23 m
3/s per decade) was greater than that of Meiyaogou (0.05 m
3/s per decade). In particular, the streamflow at Alagou increased the most in summer with a rising volume of 0.42 m
3/s per decade, while the streamflow at Meiyaogou showed a more gentle increase (except in winter) with average rates of 0.08 m
3/s per decade.
5.2. Change Points in the Hydro-Meteorological Variables
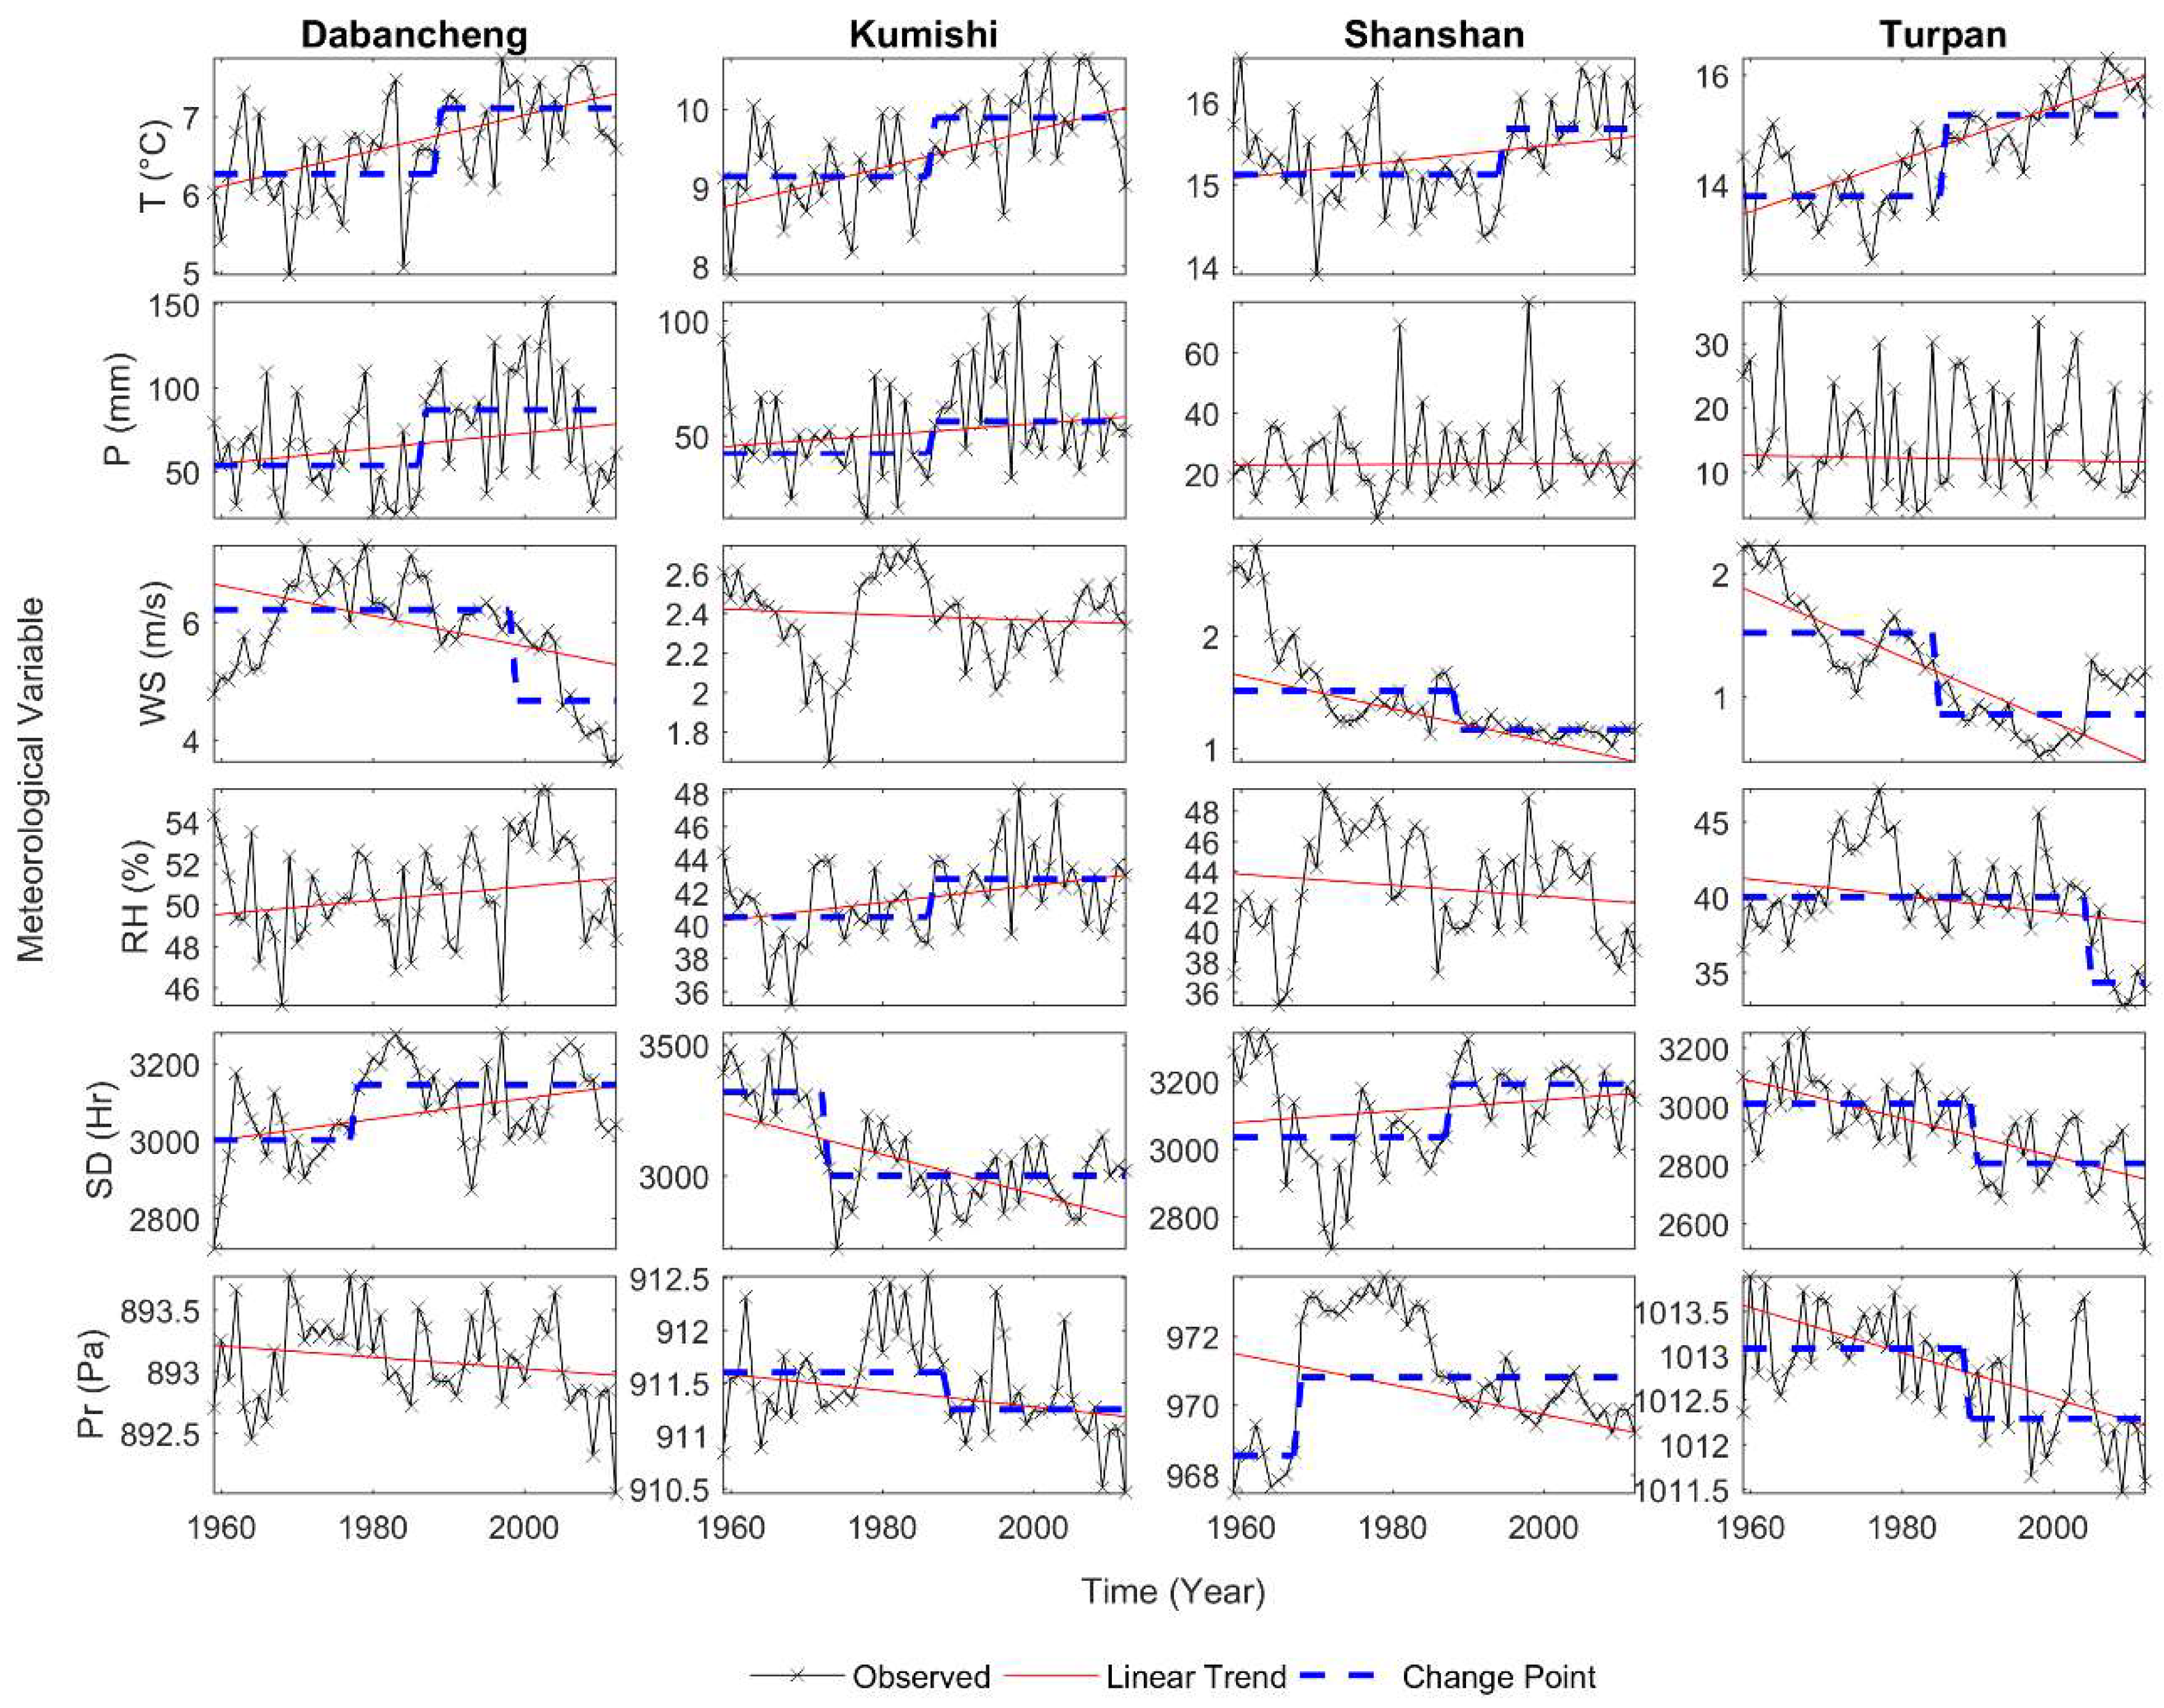
Figure 4 and
Figure 5 show the annual time series and the change points of the meteorological variables and streamflow, respectively. The linear trends were also plotted to visualize the long-term changes over this study period. For the meteorological stations (
Figure 4), statistically significant (
) abrupt change points in temperature at Dabancheng, Kumishi, Shanshan, and Turpan stations occurred in 1988, 1986, 1994, and 1985, respectively. Change points in the time series of precipitation can be found in 1986 at Dabancheng and Kumishi stations, while there were no significant change points at the other two stations. The time series of wind speed at Dabancheng, Shanshan, and Turpan stations were all changing in a downward direction; however, the locations of change occurred differently in 1998, 1988, and 1984, respectively. The step change point in relative humidity at Kumishi appeared in 1986, whereas that at Turpan occurred in 2004. However, no change points were detected at the remaining stations. All stations showed significant change points in
, with the time series of two stations at higher elevation changing in the 1970s and those of the stations at lower elevation changing in the late 1990s. Change points can be detected for pressure, and they both appeared in 1988 at Kumishi and Turpan stations and in 1967 at Shanshan. Regarding the hydrological stations (
Figure 5), abrupt changes in annual streamflow at Alagou and Meiyaogou stations occurred in 1988 and 1986, respectively, while there were no step change points at Ertanggou.
Significance testing for change points, such as the Pettitt test mentioned in the manuscript, is a valuable statistical tool for detecting shifts or abrupt changes in time series data. However, it is important to be aware of some caveats and limitations associated with this approach. For example, the test requires the assumption of independence, meaning that the occurrence of an event at one time does not affect the occurrence at another time. Many time series data, especially climatic and environmental data, may exhibit some level of autocorrelation or serial dependence. Violation of this assumption can lead to incorrect change point detection. As highlighted by Killick et al. (2012), it is advisable to employ multiple tests to corroborate the detection of genuine changes in time series data. Using a combination of tests can enhance the robustness of change point detection and reduce the risk of drawing erroneous conclusions.
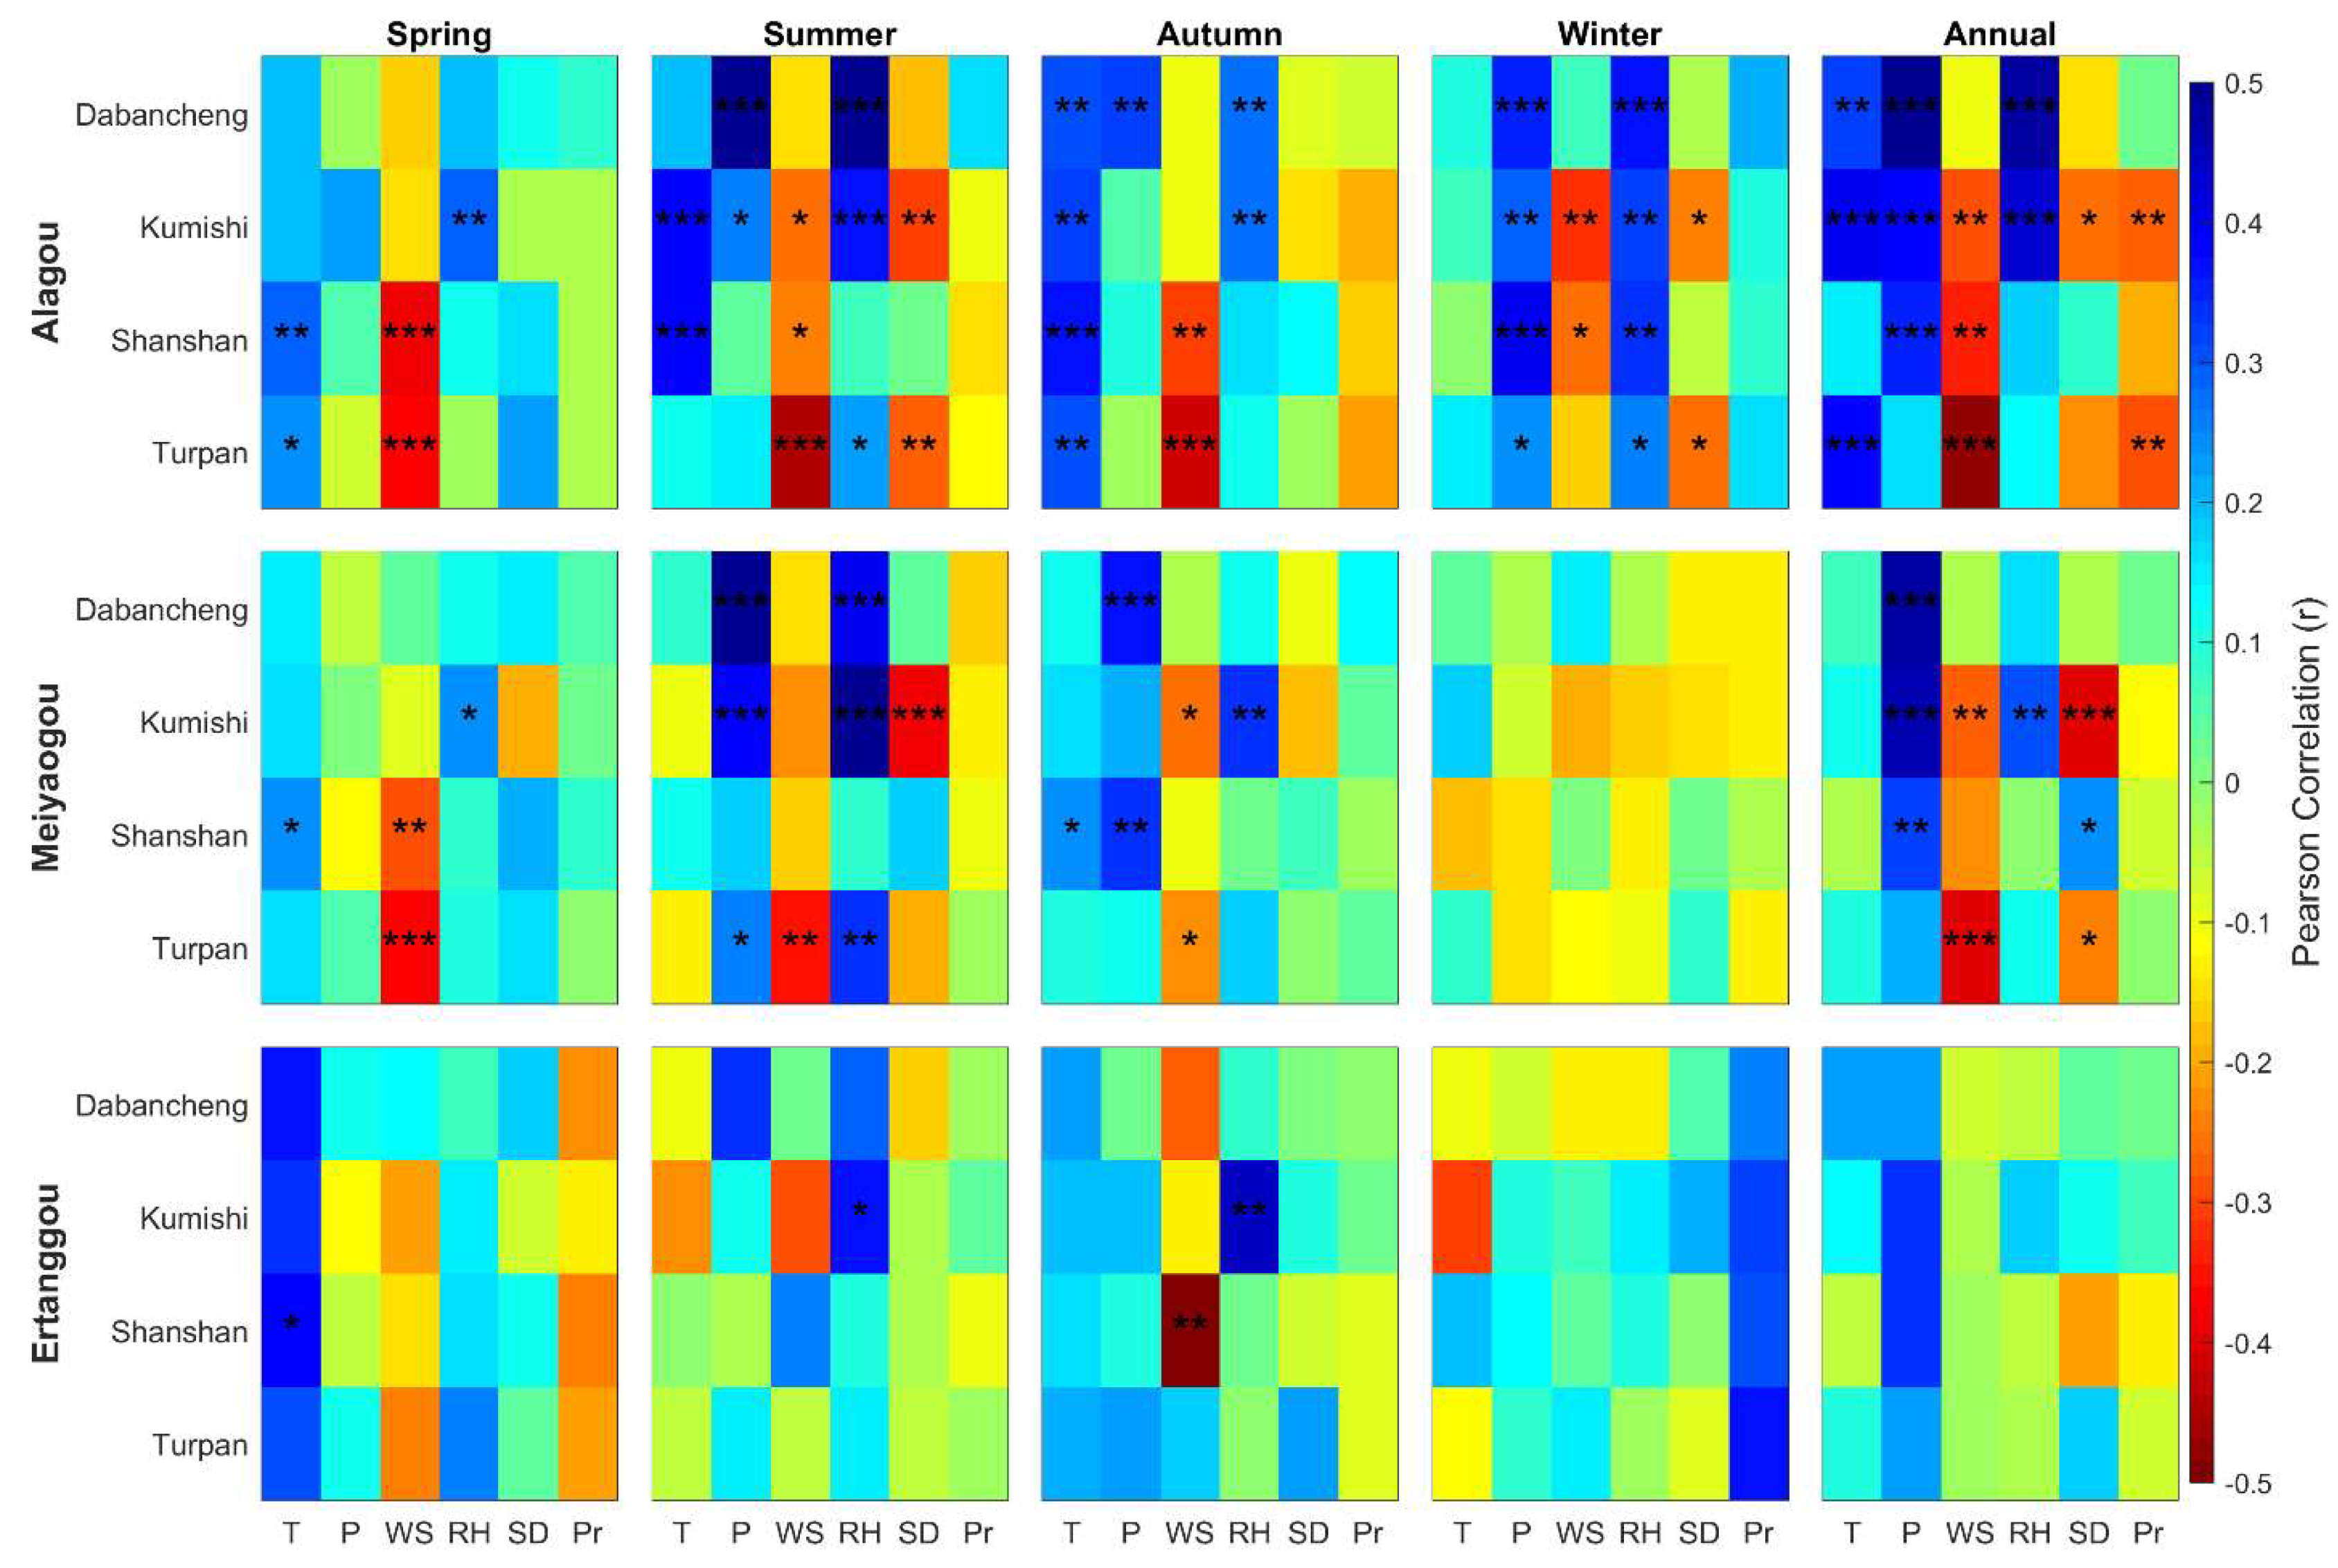
5.3. Relationships between Streamflow and Meteorological Variables
Streamflow in relation to the meteorological variables was examined at the seasonal and annual scales (
Figure 6). The annual streamflow at Alagou station had a positive correlation with temperature at all meteorological stations at the ≤5% significance level (except Shanshan), with an average correlation coefficient of 0.36. In particular, the correlation coefficients in autumn were all statistically significant (
) whereas those in winter were not. In summer, the positive relationship between
and
was significant at <1% significance level only at Kumishi and Shanshan stations. A significant (
) positive correlation was also seen between annual streamflow and precipitation at all stations (except Turpan) and relative humidity at Dabancheng and Kumishi stations, of which the correlation coefficients of
and
were the highest at Dabancheng (0.64 and 0.48, respectively). Unlike the winter correlation with temperature, the correlation coefficients of
in winter were all statistically significant at various significance levels, with a range of 0.25 (Turpan) to 0.41 (Shanshan). This was also the same as in the winter relationship with relative humidity. While there was generally no significant correlation in spring, the relationships between streamflow, precipitation, and relative humidity were the strongest at Dabancheng in summer (0.70 and 0.54, respectively). On the other hand, the relationship between annual streamflow and wind speed was negatively correlated at all stations at the ≤5% significance level (except Dabancheng), with the strongest
(−0.47) being shown at Turpan. Specifically, the negative correlation between seasonal
and
was statistically significant at various significance levels in four seasons (except winter in Turapan) at the two meteorological stations with lower elevation. The relationships between annual
and
and
were, in general, negatively correlated; however, most of them were not statistically significant.
The annual streamflow at Meiyaogou station generally showed a very weak positive correlation with temperature without any statistical significance. A significant () positive correlation was only shown in spring and autumn at Shanshan, of which the correlation coefficients were 0.24 and 0.25, respectively. On the contrary, the positive relationship between annual streamflow and precipitation was strongly correlated at all stations except Turpan, with the highest significant () being shown at stations with higher elevation (0.46 on average). In particular, the seasonal correlations in summer and autumn were stronger than those in spring and winter. The correlation coefficients of relative humidity were generally positive at the annual scale, with the relationship being statistically significant () only at Kumishi. Similar to the summer correlation with precipitation, the correlation coefficients of in summer were the highest at stations with higher elevation (0.48 on average at 1% significance level). The relationship between annual streamflow and wind speed showed a very similar correlation pattern as at Alagou station, in which Turpan showed the largest negative annual, spring, and summer (−0.39, −0.36, and −0.34, respectively) at various significance levels. The relationship between annual and , on the other hand, displayed an inconsistent correlation pattern in which Kumishi and Turpan showed a negative correlation (−0.4 and −0.25 at 1% and 10% significance levels, respectively), whereas Shanshan indicated a positive association (0.24 at 10% significance level). Seasonally, negative was only statistically significant () at Kumishi in the summer. In addition, there was no significant correlation between streamflow and pressure at both annual and seasonal scales.
The annual streamflow at Ertanggou station essentially showed similar correlation patterns with all the meteorological variables as at the other two hydrological stations. However, none of the correlations were statistically significant at any significance level. This was also true at seasonal scales, except having significant () positive of relative humidity at Kumishi in summer and autumn (0.37 and 0.45, respectively), significant () positive of temperature at Shanshan in spring (0.39), and significant () negative of wind speed at Shanshan in autumn (−0.51).
6. Discussion and Conclusions
The hydrological regimes of river basins in the arid and semi-arid regions are highly susceptible to the effects of climate change, especially when mountain snowmelts are the major sources of river flows. Climate change in terms of rising temperature and variability in precipitation not only influences the total volume of the streamflow during the snowmelt season but also the temporal pattern of the river regime. Changes in hydrological processes will in turn affect the socio-economic development of a region that heavily relies on the availability of water resources. The Turpan basin, which is one of the most arid regions in China, is a closed intermountain basin. Its water resources and oasis systems originate primarily from mountain snowmelt, and its agriculture and other socio-economic activities are greatly dependent on this surface water. Therefore, understanding the impact of climate change on water resources in the Turpan basin is essential, and this can be done by identifying the long-term trends of meteorological and hydrological time series and examining the plausible association between the hydro-meteorological variables. A set of non-parametric statistical tests, including Mann–Kendall, Kendall’s tau, Sen’s slope estimator, and the Pettitt test, was applied to analyze the statistical properties (trend, magnitude of the trend, and change point) of the streamflow, temperature, precipitation, and other meteorological variables from 1959 to 2012 in the Turpan basin.
Results showed that the annual mean temperature within the basin had a significant increasing trend with a warming rate of 0.26 °C/decade on average. This finding echoed the previous studies that the increasing rate of temperature in eastern Xinjiang was 0.33 °C/decade [
14] and the respective rising rates on the south and north slopes of the Tianshan Mountains were 0.24 and 0.24 °C/decade [
15]. In particular, the rise in seasonal temperature was more pronounced in summer and autumn across the basin, while spring warming was more prevailing at the higher elevation of the basin (i.e., the south of the eastern Tianshan Mountains). Our study also revealed that the increasing rate could potentially be reduced eastward from Turpan (0.47 °C/decade) to Shanshan, which aligned with the gradual decline of the increasing rate of temperature from Turpan to Hami (a city further east from Shanshan) as found in [
13].
Due to its higher spatial variability, the total precipitation did not show a consistent upward or downward trend across the basin, where Turpan station displayed a negative trend and the remaining stations showed a positive trend. Regardless of the direction, all the detected annual trends were not statistically significant over this study period. This is similar to what had been found in [
13] which showed that Shisanjianfang (a town between Shanshan and Hami) had an insignificant downward trend but others had increasing trends. When examining the increasing rates of precipitation in different aspects of the Tianshan Mountains, [
15] presented that the annual increasing rate of precipitation on the north slope of the Tianshan Mountains was 15.48 mm/decade, while that on the south slope was 6.75 mm/decade. Our study showed a much smaller average increasing rate of 0.35 mm/decade on the south slope of the eastern Tianshan Mountains. Such an increasing amount of annual precipitation over this study period could be mainly attributed to the significant increasing trends in wintertime (
Table 3).
Change points of various meteorological variables and streamflow can be generally found in the 1980s in this study. It is noticeable that temperature, precipitation, relative humidity, and streamflow had abrupt changes concurrently in 1986. The averages of
,
,
at stations with higher elevation, and
at Meiyaogou station before 1986 were 9.24 °C, 51.75 mm, 40.59%, and 2.32 m
3/s, while after 1986 they were 9.91 °C, 73.12 mm, 42.92%, and 2.74 m
3/s, respectively. In other words, the temperature, precipitation, relative humidity, and streamflow after 1986 increased by 7.2, 41.3, 5.7, and 18.3%, respectively. Interestingly, the occurrence of the change point in 1986 collided with other river basins in northwest China (e.g., temperature and precipitation in the Tarim River basin [
17,
19,
20]; temperature in the Manas River basin [
27]; temperature and precipitation in the Kaidu River basin [
14]. This implies that the detection of significant trends and change points reported in this study was not an isolated and local case and provided another piece of evidence that a general change in the regional climate system from warm-dry to warm-wet was prominent in northwest China [
45]. While the atmospheric water vapor content increased after 1986, it is still unclear whether the major source of water vapor comes from the Atlantic Ocean and Artic Ocean [
13] or from the Indian Ocean and the south of the Arabian Sea [
45]. Temperature and precipitation in Northwest China can be influenced by nearby Siberia High and remote forcing such as El Nino, Pacific Decadal Oscillation, or North Atlantic Oscillation [
28,
46]. Further research is needed to investigate this.
Pearson correlation analysis in this study revealed that the strength of the relationship between annual streamflow and precipitation (0.34 on average) was generally greater than that between streamflow and temperature (0.16 on average) at three hydrological stations, despite the significant increasing trends in temperature and the insignificant increasing trends in precipitation. Although the three rivers shared a similar characteristic of runoff generation, in which the runoff is primarily recharged from snowmelt and precipitation in the mountains, they had different degrees of response to the effect of climatic variability. In particular, the annual streamflow at Alagou station showed a significant positive correlation with both temperature and precipitation, whereas that at Meiyaogou station displayed a significant positive association with precipitation only. This could be due to the differences in their elevations and the aspect of the slope they are facing. The synthetic effect of temperature and precipitation was the strongest at Alagou station, where its elevation was the lowest (777.3 m). Given the lower elevation and the significant increasing trend in temperature, there is a higher chance of a longer period of time when the temperature is around or above the melting point. Thus, more snowmelt could occur, and thus more runoff would be generated. However, the effect of increasing temperature might be partially weakened by the higher elevation at Meiyaogou station (940.0 m), and thus the correlation coefficient of temperature was not statistically significant and was smaller than that of precipitation at the annual scale. The weaker and insignificant correlations between annual streamflow and temperature and precipitation at Ertanggou station could be because of not only the higher elevation (1450.0 m) but also the shorter duration of the time series (21 years).
It is worth noting that the increasing rates of streamflow at the two hydrological stations (as shown in
Table 4) exhibited their highest values during the summer season, with respective values of 0.42 and 0.18 m
3/s per decade. This observation can be attributed to the hydrological response time lag due to climatic variability. The notable increase in winter precipitation led to the accumulation of more snow and ice in the mountainous regions during the winter months. Subsequently, as temperatures rose above freezing in the following summer months, this stored snow and ice melted and contributed to the streamflow. In conjunction with the rise in summer precipitation at higher elevations, the correlation between summer streamflow and precipitation strengthened, averaging 0.46, which was the highest among the four seasons (as illustrated in
Figure 6). However, it is important to acknowledge that further analysis, such as elasticity calculations, is essential for a more comprehensive understanding of the streamflow response to precipitation.
The above analysis had two implications for water resource management and allocation in the Turpan basin. First of all, the fastest-increasing rate of streamflow and rising volume in summer might potentially increase the chance of flooding in the basin. Currently, the Turpan prefecture has four development projects in which flood disaster mitigation is one of the focuses. The flood mitigation project would construct essential water infrastructure (e.g., dams and reservoirs) at the outlets of the three main river valleys upstream to reduce the risk of flooding, increase storage capacity for both agriculture and industry, and maintain minimum ecological flows in the downstream rivers. This study provides valuable information on the changing properties of the streamflow in the basin at seasonal and annual scales, and the non-stationarity of the streamflow should be considered when designing the water infrastructure, including the dam, open spillway, diversion and discharge tunnel, and water supply tunnel. Secondly, it is acknowledged that the interactions among the hydro-meteorological variables are complicated, in that on the one hand, the rising temperature might increase snowmelt and runoff, and on the other hand, it might increase evaporation and, in turn, reduce the flow volume. This study provides a prerequisite step in understanding the temporal variability of streamflow and meteorological conditions and provides insights for facilitating the prefectural government’s decision to formulate a better integrated river basin management strategy that focuses on evapotranspiration-based water resource planning and water-saving technologies for increasing irrigation efficiency. However, streamflow changes in response to climatic variability are complex processes, and uncertainties arise from precipitation distribution, the magnitude and timing of the snowmelt process, and the limited availability of data in mountainous regions. Socio-economic activities (e.g., irrigation, water withdrawal from groundwater, industrial development) might further modify the hydrological regimes of the basin. Further research based on hydrological modeling is thus needed to investigate the mechanism of the snowmelt process and incorporate human activities into the changing climate.
The Turpan basin has experienced a significant temperature increase in the last few decades, with relatively little or no precipitation increase in the summer. The summer streamflow increase in the basin is also relatively small compared to the temperature increase, which will exacerbate the water stress during the growing season and require more irrigation using groundwater extraction. This has implications for the desert soil in the Turpan basin, as global warming will continue well after the greenhouse gas concentration level drops, even if the carbon neutral targets by 2060 are met. The overuse of groundwater and increased precipitation deficits under climate change would deteriorate the water and soil situation in the Turpan basin. Drip irrigation and plastic mulching have expanded in the Turpan basin to efficiently use water and decrease evaporation. To secure water resources and soil health in the region under climate change, more research on innovative water management and desert soil preservation and enhancements is needed for sustainable development in the 21st century.


 ,
, 


