Article

Exploring the Drivers for Changes in Lake Area in a Typical Arid Region during Past Decades

1
Key Laboratory of Watershed Geographic Sciences, Nanjing Institute of Geography and Limnology, Chinese Academy of Sciences, Nanjing 210008, China
2
University of Chinese Academy of Sciences, Beijing 100049, China
3
State Key Laboratory of Simulation and Regulation of Water Cycle in River Basin, China Institute of Water Resources and Hydropower Research, Beijing 100038, China
*
Author to whom correspondence should be addressed.
Water 2023, 15(19), 3354; https://doi.org/10.3390/w15193354
Submission received: 9 August 2023 / Revised: 15 September 2023 / Accepted: 22 September 2023 / Published: 24 September 2023

Abstract

:
Lakes are important surface water bodies, and ongoing climate change is a growing threat to the hydrological cycle and water resource availability of lakes in arid regions. Accurately estimating different drivers’ contributions to lake water volume can enhance our understanding of lake variations in arid regions. In this study, we combined the land surface model and hydrological model, as well as statistical methods, to analyze the spatiotemporal heterogeneity of lake area changes and the factors affecting these changes during the past decades in Bosten Lake, Ulungur Lake, Ebinur Lake, and Sayram Lake, which are located in a typical dry region in China. The study revealed that the average amounts of river inflow, TWVF, lake ice sublimation, lake surface precipitation, and river outflow in the four lakes were 17.41 × 10⁸ m3 yr−1, 6.60 × 10⁸ m3 yr−1, 0.41 × 10⁸ m3 yr−1, 0.98 × 10⁸ m3 yr−1, and 9.12 × 10⁸ m3 yr−1, respectively. We found that river inflow is the dominant factor affecting changes in open lake areas, while lake surface precipitation is the main factor affecting changes in closed lake areas. Our findings suggest that the main factors dominating the variability of lake water volume differ in different phases and lake types.

1. Introduction

Lakes are crucial surface water bodies that play a pivotal role in preserving environmental and ecological stability. Nevertheless, the equilibrium and resilience of lake water resources face growing challenges due to the impact of climate change, particularly in arid regions. The lake area, serving as a key metric for their water volume, is experiencing significant fluctuations [1,2,3]. For example, in the arid region of Xinjiang Province, China, out of the 84 lakes with an area greater than 10 km2, 54 lakes exhibited significant changes in area between 1986 and 2019. Among these, 41 lakes demonstrated a significant expansion in area, while 13 lakes experienced a significant reduction in their area. The largest lake in Xinjiang, Bosten Lake, expanded at an average rate of 1.16 km2 per year during 1986–2019; the third largest lake in Xinjiang, Ebinur Lake, shrank at an average rate of 0.55 km2 per year [4]. The dramatic changes in the lake areas were mainly caused by the imbalance between the income and outcome terms of the water balance due to climate change [5]. It is worth mentioning that the drivers and water balance components of arid lakes were usually sensitive to climate change. Taking the Xinjiang region as an example once more, between 1961 and 2020, there has been a noticeable decrease in potential evapotranspiration, at a rate of −14.84 mm per decade, and a concurrent increase in precipitation, at a rate of 8.58 mm per decade. These trends suggest that Xinjiang’s climate has become wetter in the past few decades [6]. At the same time, the occurrence of rainstorm events also showed an increasing trend. Moreover, the climate in Xinjiang is warming, with extreme low temperatures becoming rarer extreme high temperatures becoming more frequent, respectively [7]. Thus, the income and outcome terms of the lake water balance in arid regions (e.g., in Xinjiang) are susceptible to the impacts of climate change, resulting in dramatic decadal variations in lake surface area and water level.
In addition to climate affecting lake water volume, human activities also play a significant role in influencing lake water area. For instance, Ma et al. [8] employed a multivariate linear model and determined that human activity was responsible for a reduction in Ebinur Lake’s area by 286.8 km2 between 1955 and 2010. Since the 1950s, with the rapid expansion of agriculture in Xinjiang, substantial changes in land use have occurred, leading to a significant increase in agricultural water demand. This is primarily manifested in alterations in river runoff due to the construction of reservoirs in the upper and middle reaches and the excessive use of surface water and groundwater for agricultural irrigation.
The underlying mechanisms of long-term changes in lake water area and volume in arid regions showed strong spatiotemporal heterogeneity. On one hand, the key factors that drove water area or volume changes in different lakes in the same arid region might be clearly different; on the other hand, the key driving factors of the status changes at the same lake could potentially vary with time (i.e., in different periods). Therefore, long-term (e.g., decadal-scale) studies that include the complete water cycles of lakes in arid regions are urgently needed, in order to illustrate the spatiotemporal characteristics and underlying mechanisms of the changes in lake water area and volume. However, few studies considered comparatively complete hydrological components in lake water budget investigations in dry regions, which was partly caused by the limited observational data available in these regions [9,10]. For example, sublimation is an important outflow of water in the lake in dry and cold regions such as Xinjiang and Tibet plateau, where a long winter season with widespread lake freezing is commonly observed. Currently, few studies on lake water area (or volume) changes have referred to lake sublimation [11,12]. Furthermore, the possible varying key drivers of the changes in lake water area/volume during different periods remain uncertain and relevant studies need to be urgently strengthened.
The present study aims to illustrate the spatiotemporal heterogeneity of the changes in lake area and volume in a typical dry region in China during the past decades, and to explore the underlying mechanisms and key factors that drive these changes.

2. Study Sites and Materials
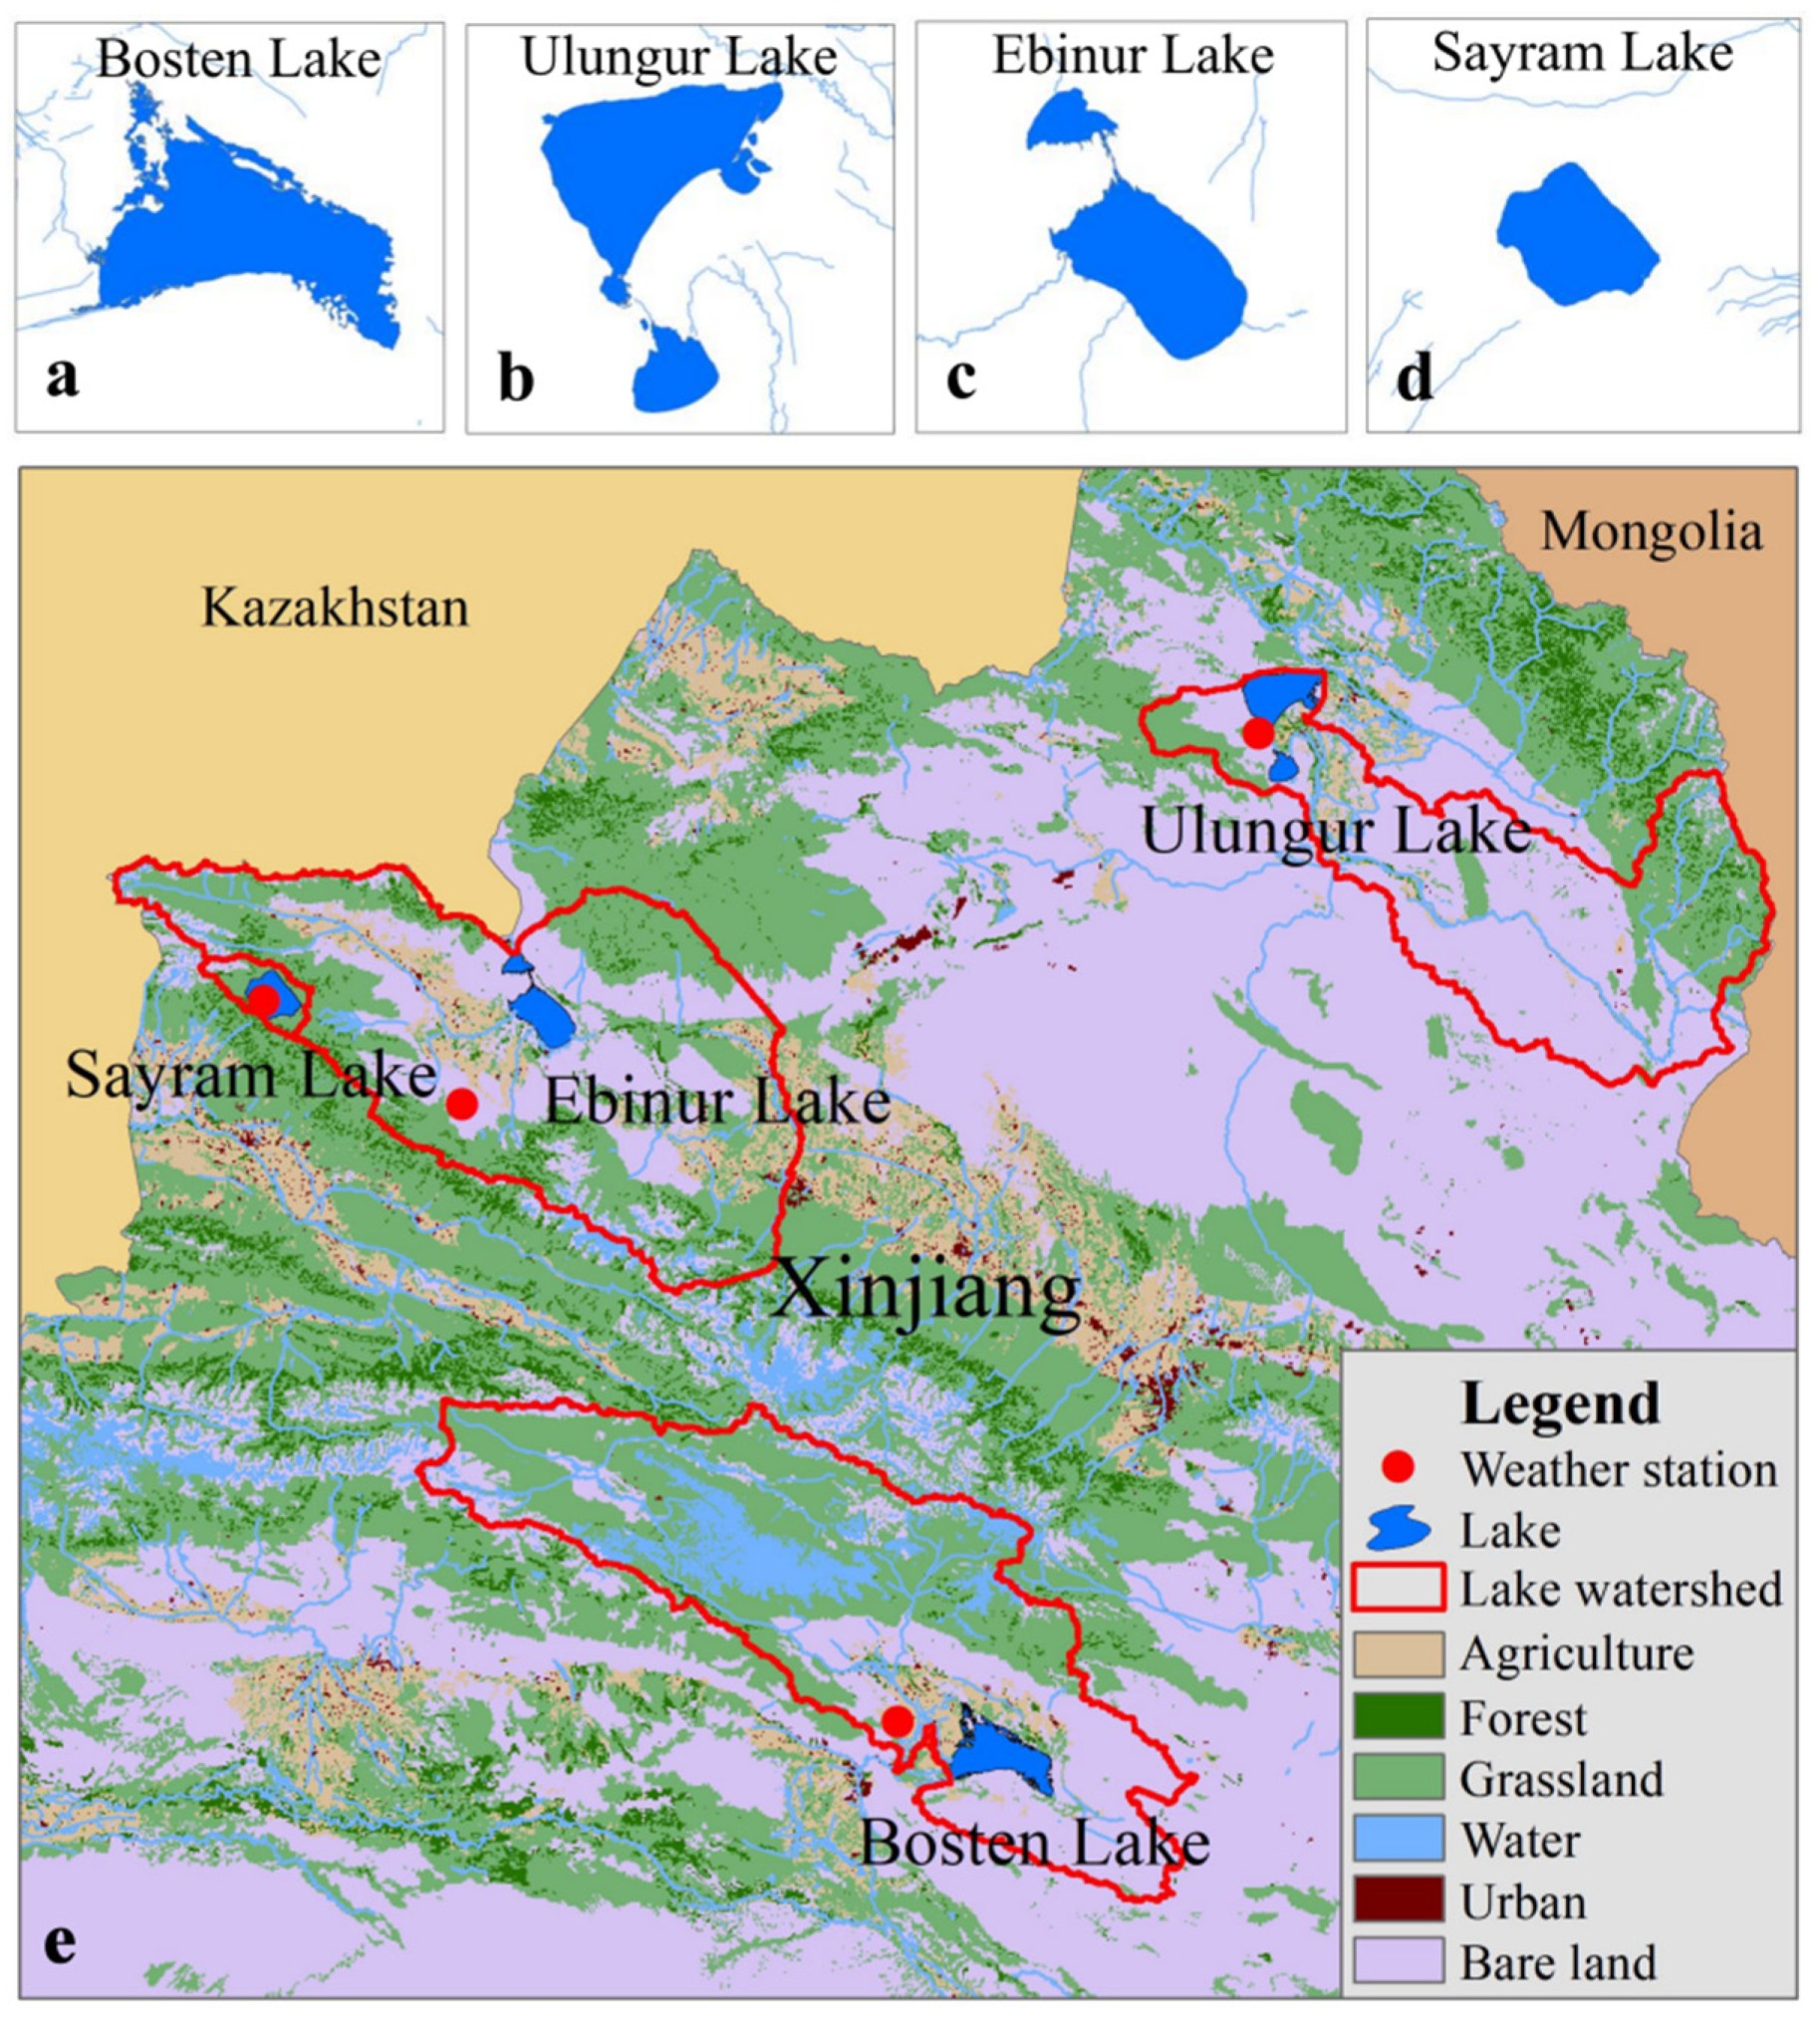
2.1. Study Sites

The largest four lakes in Xinjiang Uyghur Autonomous Region, which occupied a substantial proportion of the dry regions in China, were selected for investigation in the study (Figure 1). Bosten Lake is situated in the Bayingole Mongolian Autonomous Prefecture in central Xinjiang. The topography of the lake basin is characterized by higher elevations in the northwest and lower terrain in the southeast. Ulungur Lake is located in Altay Prefecture in northern Xinjiang, with the lake basin featuring higher elevations in the east and lower terrain in the west. Ebinur Lake is situated in the flatlands of Bortala Mongolian Autonomous Prefecture, in eastern Xinjiang. In contrast, Sayram Lake is located in the mountainous region of Bortala Mongolian Autonomous Prefecture in eastern Xinjiang, surrounded by elevated terrain. The surface areas of these four lakes varied from 458.6 km2 to 1047.8 km2, and elevations were from 189 m to 2072 m. The mean annual precipitation was from 75.2 mm to 246.0 mm, with an average of 143.8 mm; the mean annual air temperature varied from 4.0 °C to 8.6 °C, with an average of 6.2 °C. The low winter temperature (from −8.4 °C to −17.0 °C) resulted in long ice cover periods at these four lakes, i.e., from 77 to 147 days per year (Table 1). In addition to temperature influencing the duration of lake ice cover, lake salinity also plays a significant role in determining their length. Higher salinity levels make it more challenging for lakes to freeze. For instance, while the average winter temperatures of Ebinur Lake and Sayram Lake are close (Table 1), Ebinur Lake’s ice cover is 35 days shorter than that of Sayram Lake. This discrepancy may be attributed to differences in salinity levels between the two lakes. The four lakes can be categorized into two groups based on the presence or absence of river inflow: open lakes (Bosten Lake, Ulungur Lake, and Ebinur Lake) and a closed lake (Sayram Lake). Among them, Bosten Lake stands out as the only lake with a significant river outflow. More information on the selected lakes can be found in Table 1.

2.2. Study Materials
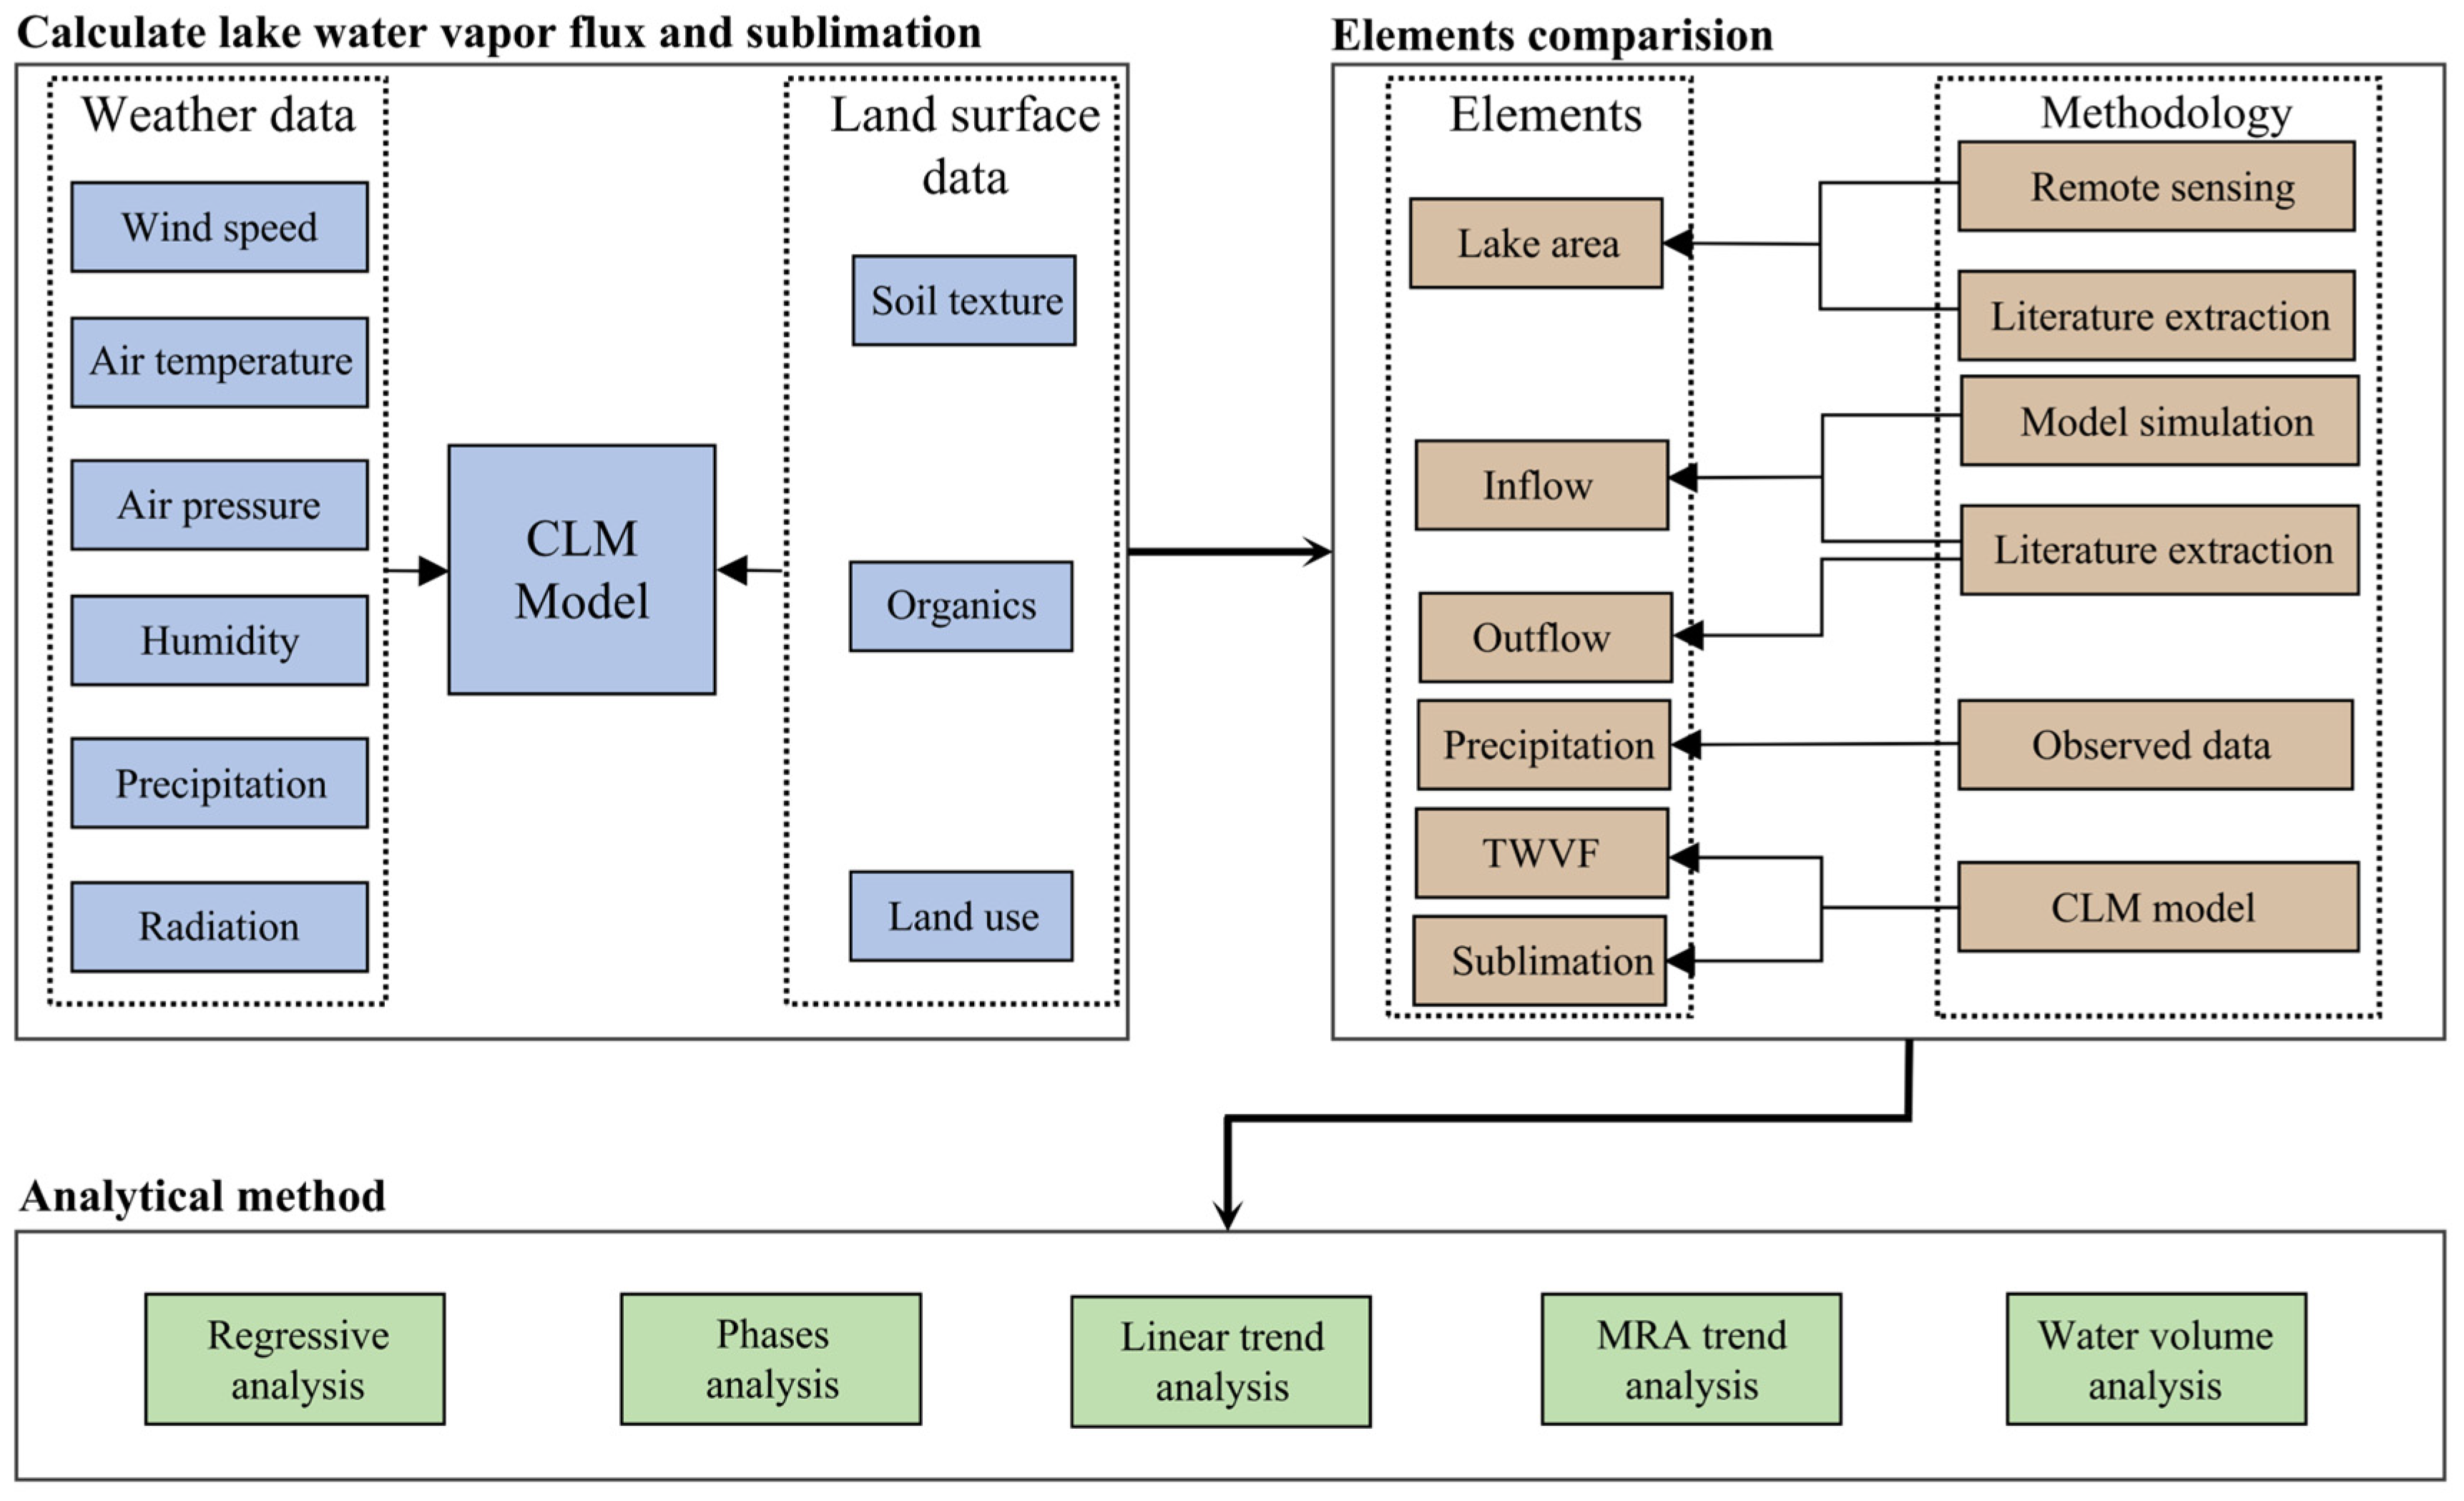
Data on river inflow and lake area were primarily sourced from published literature (Table S1). In cases when inflow data were missing, we utilized a hydrological model for simulation. Specifically, for Bosten Lake, lake surface area data from 1961 to 2013 and river inflow data from 1961 to 2008 were obtained from Yang [17], while river inflow data for the period from 2009 to 2013 were simulated using the SWAT model. The data of river outflow were obtained form Li et al. [18]. The surface area data for Ulungur Lake were acquired from the European Union Joint Research Centre (JRC) Global Surface Water Dataset (https://developers.google.com/earth-engine/datasets (accessed on 2 February 2021)). River inflow runoff data for Ulungur Lake were extracted from Zhai et al. [19]. For Ebinur Lake, both area data and river inflow information were obtained from Wei [20]. As for Sayram Lake, area data were extracted from Bayinzhahan et al. [21]. For historical simulations of Total Water Vapor Flux (TWVF) and sublimation using the CLM model from 1961 to 2013, meteorological data were collected from CRUNCEP7 (https://rda.ucar.edu/datasets/ds314.3 (accessed on 19 November 2020)). The data included air temperature, precipitation, incident solar radiation, incident longwave radiation, surface pressure, relative humidity, and wind speed. The temporal resolution was 6 h. The CLM model was executed at a spatial resolution of 0.9° × 1.25°, and air forcing data with a resolution of 0.5° × 0.5° were bilinearly interpolated to match the CLM grids. Lake fractions were prescribed accordingly for the corresponding CLM grid. Meteorological data for calculating lake surface precipitation were obtained from the nearest national weather station to each lake at daily scale [22], as indicated in Figure 1.

3. Methodology

The methods used in the present study are shown in Figure 2. Here, we proposed a framework for quantifying and interpreting the decadal scale lake variabilities in the typical dry region in Northwest China. Specifically, a land surface model (Community Land Model version 5—CLM5; The National Center for Atmospheric Research (NCAR), Boulder City, NV, USA) including a lake water–energy balance module was used to estimate Total Water Vapor Flux (TWVF) and lake ice sublimation, and a hydrological model (Soil and Water Assessment Tool—Version 2012—SWAT 2012) was used to simulate the part of the river inflow into the lake. The lake water cycle components involved in this study included river inflow, TWVF, lake ice sublimation, lake surface precipitation, and river outflow. Moreover, the relationships between influencing factors and lake water areas/volumes and corresponding contributions were investigated based on regression analysis, phase analysis, and trend analysis.

3.1. Calculation of TWVF and Sublimation

In our previous study [23], we evaluated the accuracy of the CLM model in calculating TWVF and sublimation at lakes in the cold region of China using Eddy Covariance observations. The error of TWVF is in the range of 1–9%, and the error of sublimation is in the range of 5–17%. Therefore, we used the CLM model to calculate the lakes’ total water vapor flux (here after “TWVF”) and sublimation in this study.
The Community Land Model version 5.0 (CLM5) [24] in Community Earth System Model (CESM) [25] version 2.1.3 was used to simulate the lake TWVF, lake sublimation, and lake ice cover days for the study lakes. CLM5 is a widely used land surface model that includes a lake module [26]. CESM2, which includes CLM5 as its land component, is participating in approximately 20 Model Intercomparison Projects (MIPs) [27]. The lake in CLM5 consists of 0–5 snow layers, 10 water and ice layers, 10 “soil” layers, and 5 bedrock layers in global simulations. Each lake body layer has a fixed water mass (set by the nominal layer thickness and the liquid density), with dynamic frozen fractions.
The solar radiation received by the lakes during the summer season can be partially stored and later released during the autumn/winter season, reflecting the actual heat storage and release processes and their corresponding influences on TWVF in large lakes. Conservation of energy at the lake surface requires
β S g L g H g λ E g G = 0
where β S g is the absorbed solar radiation in the lake, β is the fraction absorbed at the surface, L g is the net emitted longwave radiation (+ upwards), H g is the sensible heat flux (+ upwards), E g is the TWVF (+ upwards), and G is the ground heat flux (+ downwards). All of these fluxes depend implicitly on the temperature at the lake surface T g . λ converts E g to an energy flux based on
λ t = λ s u b λ v a p   T g T f T g > T f
The sensible heat flux (W m−2) is:
H g = ρ a t m C p θ a t m T g r a h
where ρ a t m is the density of moist air (kg m−3), C p is the specific heat capacity of air (J kg−1 K −1), θ a t m is the atmospheric potential temperature (K), T g is the lake surface temperature (K) (at an infinitesimal interface just above the top resolved model layer: snow, ice, or water), and r a h is the aerodynamic resistance to sensible heat transfer (s m−1).
The TWVF (kg m−2 s−1) is calculated as
E g = ρ a t m q a t m q s a t T g r a w
where q a t m is the atmospheric specific humidity (kg kg−1), q s a t T g is the saturated specific humidity (kg kg−1) at the lake surface temperature T g , and r a w is the aerodynamic resistance to water vapor transfer (s m−1).
The heat flux into the lake surface G (W m−2) is
G = 2 λ T Δ z T ( T g T T )
where λ T is the thermal conductivity (W m−1 K−1), Δ z T is the thickness (m), and T T is the temperature (K) of the top resolved lake layer (snow, ice, or water). Specific settings of parameters are shown in Table S2.
Previous studies have highlighted the variations in TWVF estimation when employing different methods. While the CLM method has been considered one of the more accurate approaches for modeling and calculating TWVF in lakes [23], its applicability to arid region lakes has rarely been demonstrated using observation data (e.g., Eddy Covariance observations). Therefore, it is necessary to compare the TWVF results derived from the CLM model with other estimation methods. Currently, various methods and tools exist for estimating TWVF, but the accuracy of each method has been the subject of much discussion and debate among hydrological and atmospheric researchers as direct observations of TWVF in lakes are influenced by environmental and human factors. Based on the classification of estimation methods, TWVF methods can be categorized as observational methods, equation calculation methods, model simulation methods, etc. [28,29].

3.2. SWAT Model

The missing river inflow data at Bosten Lake were acquired through SWAT model simulations. The SWAT model is a semi-distributed, watershed-scale conceptual simulation of river hydrology, water quality, and crop growth, relying on the SCS (Soil Conservation Service) runoff generation theory [30,31,32]. It delineates watersheds and sub-watersheds based on topography, and further sub-divides the sub-basins into Hydrologic Response Units (HRUs) considering a combination of land use, soil, and slope attributes. By incorporating HRUs, SWAT accounts for spatial variability within the sub-watersheds, leading to more accurate feedback of rainfall, infiltration, seepage, evapotranspiration, and vegetation in the model simulations. The SWAT model employs water balance equations to calculate various hydrological components such as soil water, precipitation, runoff, evapotranspiration, percolation, and return flow [33,34].
In the SWAT model, the runoff is composed of three components: surface runoff, lateral runoff, and groundwater runoff, which are combined together. Surface runoff is particularly influenced by the SCS curve number equation [35].
Q = ( R 0.2 S ) 2 R + 0.8 S , R > 0.2 S
Q = 0 , R 0.2 S
where Q is the surface runoff in daily scale (mm), R is the rainfall in daily scale (mm), and S is the retention parameter determined using the curve number (CN) with SCS equation [35,36].
S = 254 ( 100 C N 1 )
The curve number in the SWAT model is determined using soil permeability, land use, and antecedent soil-water conditions. The curve number calculated based on average antecedent soil water conditions is referred to as CN2, and its value typically falls within the range of 30 to 100. CN2 is considered a highly sensitive parameter for river flow simulation in SWAT, and the calibration of CN2 is crucial for the successful application of the model. The calibration and validation periods of the SWAT simulation were from 1960 to 1999 and from 2000 to 2007, respectively. In total, 12 parameters were calibrated (Table S3). The simulation and prediction results are shown in Figure S1.

3.3. Multi-Resolution Analysis (MRA) Method

In this study, we utilized the Multi-Resolution Analysis (MRA) method to explore the long-term variations in lake water cycle components. MRA is a powerful technique that decomposes time series into approximation and detail components using a high-pass filter and low-pass scaling filter associated with the “db30” wavelet [37,38]. The method allowed us to analyze time series based on their periodicity. The extracted trends from the MRA method were found to be non-linear and focused on decadal variations, excluding periodicities of less than ten years. These trends differed significantly from those obtained through traditional linear regression approaches. We observed specific patterns in the lake water cycle components, such as overall increasing or decreasing trends, as well as transitions from decreasing to increasing trends and vice versa. Our previous studies demonstrated the effectiveness of the MRA method in extracting non-linear trends from long-term hydrological time series in lake basins. In fact, compared to other trend-extraction methods such as the Ensemble Empirical Mode Decomposition, the MRA method outperformed them, providing more accurate and meaningful results [5,39,40]. Overall, by applying the MRA method, we successfully revealed complex long-term variations in lake water cycle components and identified specific patterns, improving our understanding of the hydrological behavior of lakes over extended periods.

4. Results

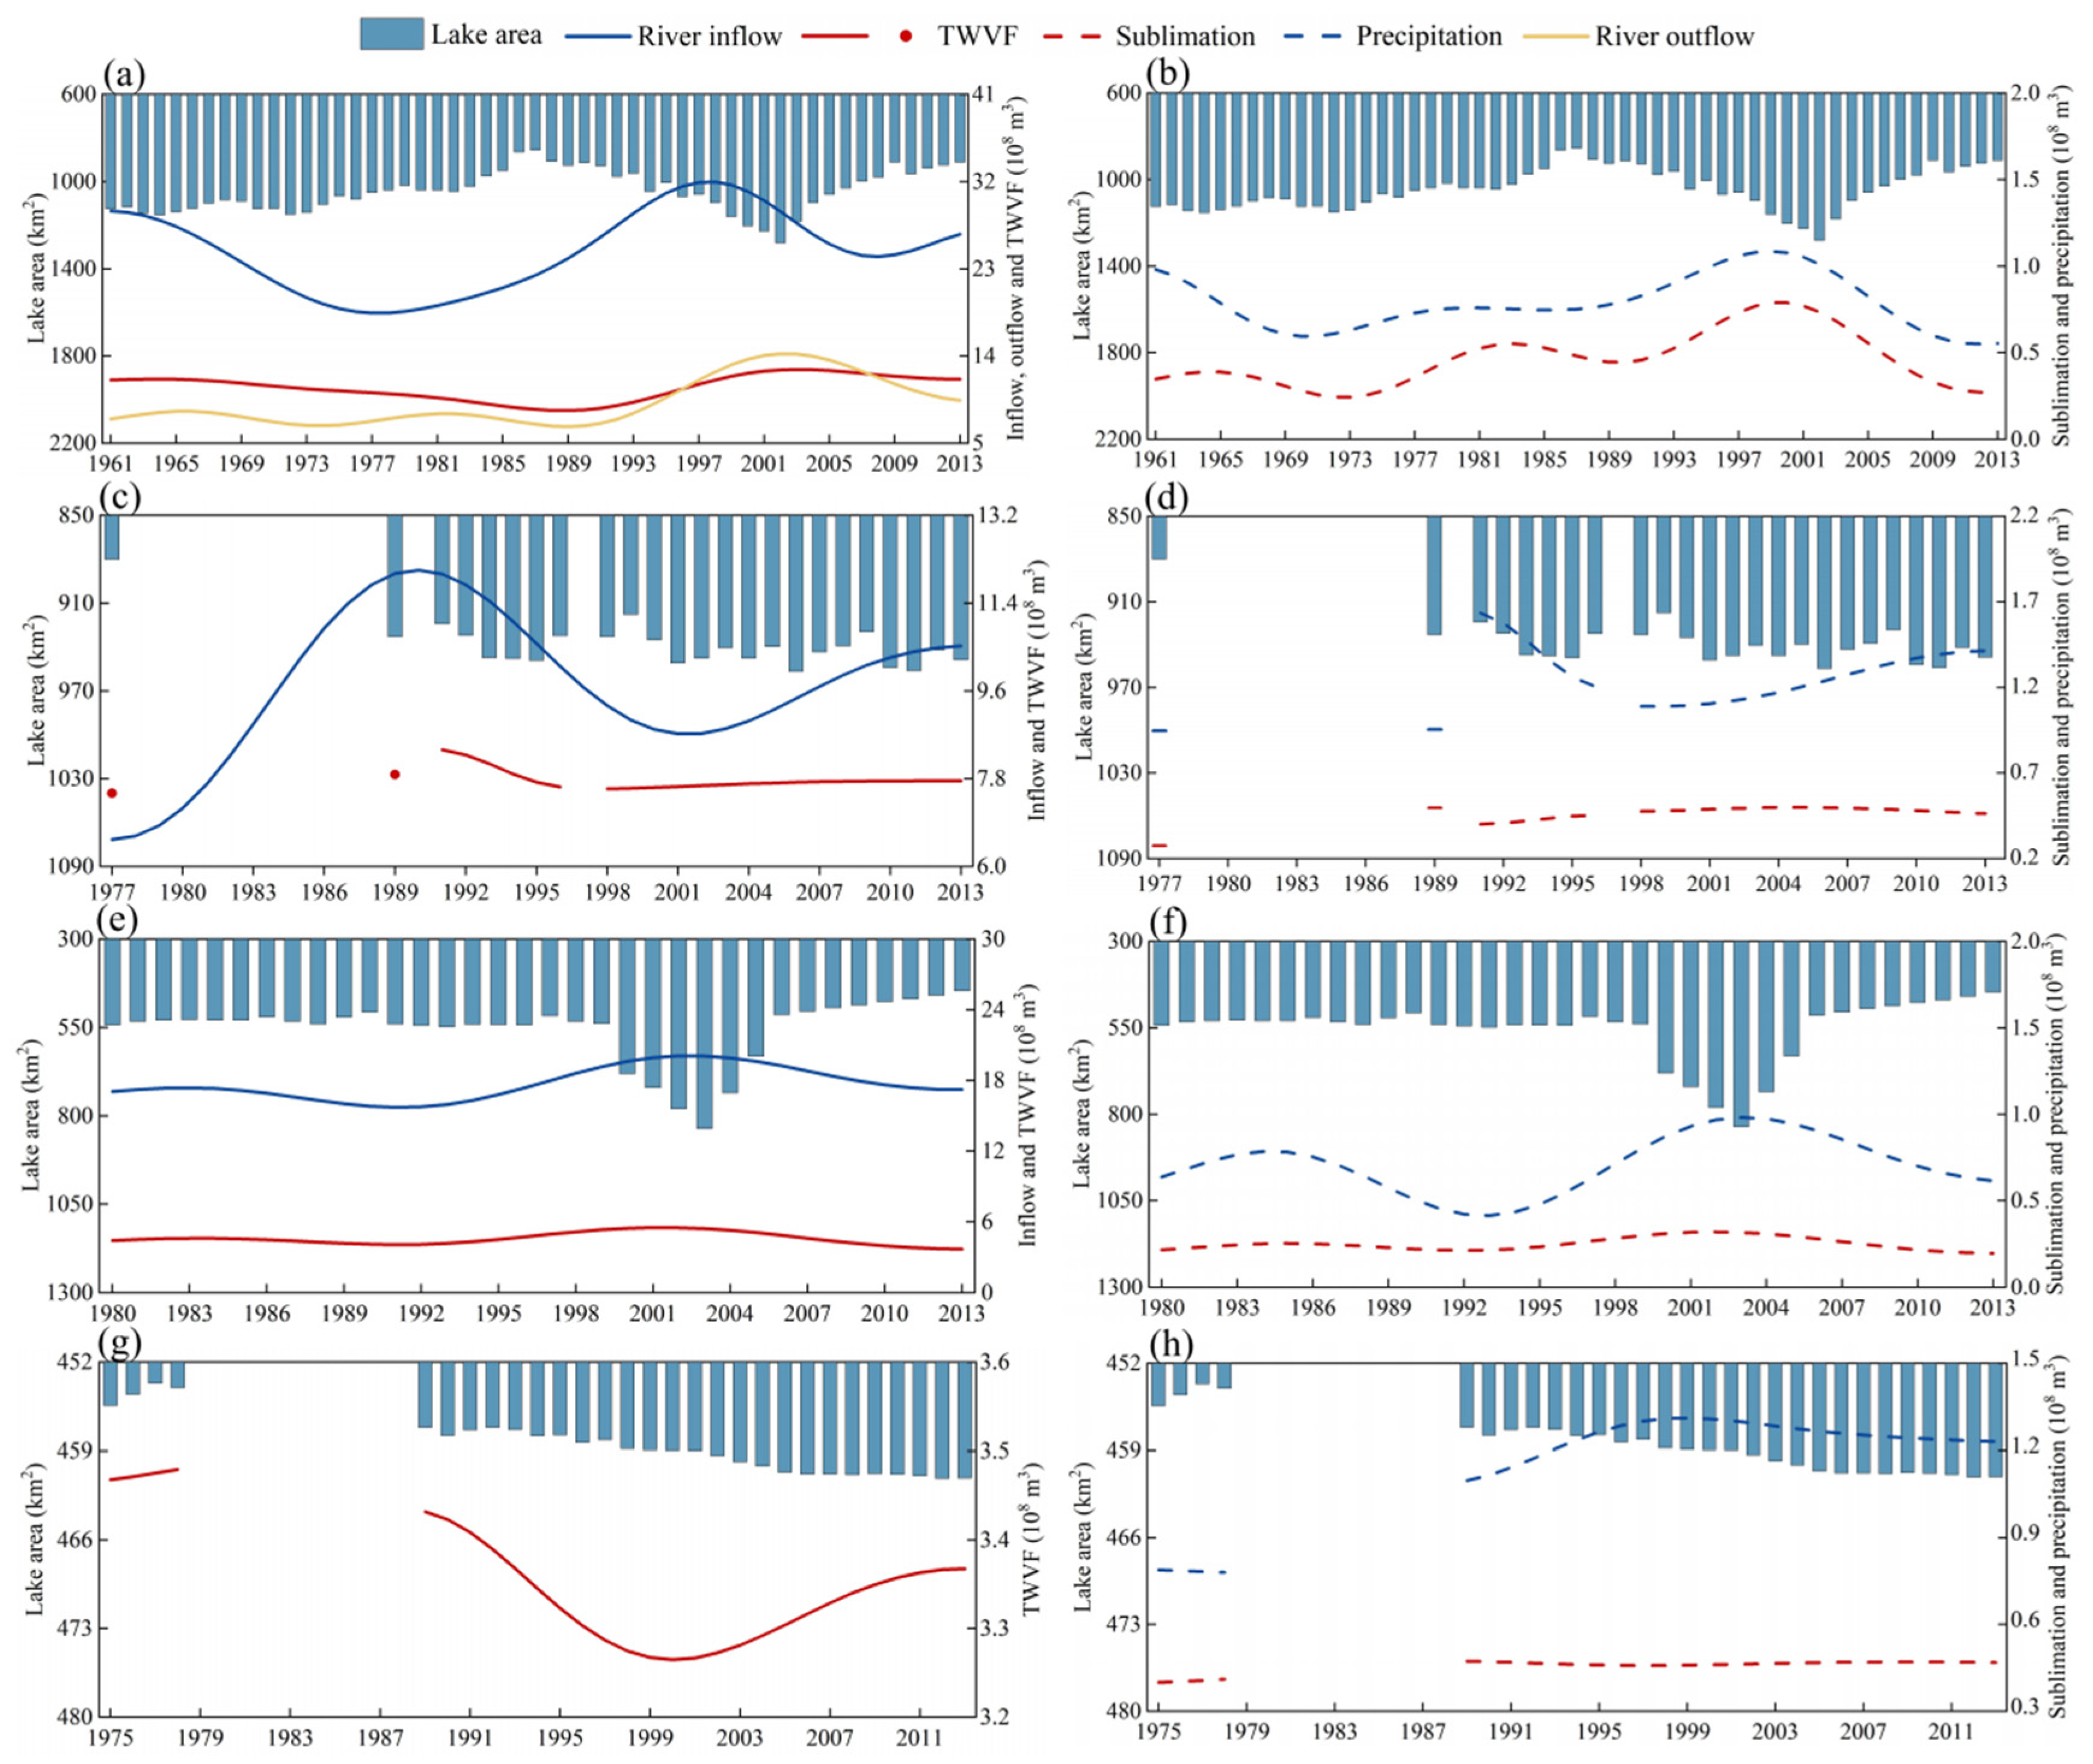
4.1. Spatial Distribution of Variations in Lake Area and Water-Cycle Components

Overall, the average amount of river inflow, TWVF, lake ice sublimation, lake surface precipitation, and river outflow in the four lakes was 17.41 × 10⁸ m3 yr−1, 6.60 × 10⁸ m3 yr−1, 0.41 × 10⁸ m3 yr−1, 0.98 × 10⁸ m3 yr−1, and 9.12 × 10⁸ m3 yr−1, respectively. Regarding the spatial distribution, Bosten Lake, which is the largest lake in the four lakes, displayed the highest values for several key metrics, including river inflow, TWVF, lake ice sublimation, and river outflow, with annual averages of 24.9 × 10⁸ m3 yr−1, 10.7 × 10⁸ m3 yr−1, 0.5 × 10⁸ m3 yr−1, and 9.1 × 10⁸ m3 yr−1, respectively (Figure 3). Bosten Lake receives water from the Kaidu River, Ulungur Lake from the Ulungur River, and Ebinur Lake from the Jing River and Bortala River. The TWVF resulted in a water loss of 10.7 × 10⁸ m3 yr−1, 7.8 × 10⁸ m3 yr−1, 4.6 × 10⁸ m3 yr−1, and 3.4 × 10⁸ m3 yr−1 in Bosten Lake, Ulungur Lake, Ebinur Lake, and Sayram Lake, respectively. This loss was aligned with the ranking of the lakes by area, and this was also reflected in the sublimation of lake ice. It is worth noting that the ranking of total lake surface precipitation did not exactly correspond to the ranking by lake area. Apart from the lake surface area, the rate of lake surface precipitation also plays a crucial role in determining its ranking. The total lake surface precipitation for Ulungur Lake, Sayram Lake, Bosten Lake, and Ebinur Lake was 1.3 × 10⁸ m3 yr−1, 1.2 × 10⁸ m3 yr−1, 0.8 × 10⁸ m3 yr−1, and 0.7 × 10⁸ m3 yr−1, respectively.

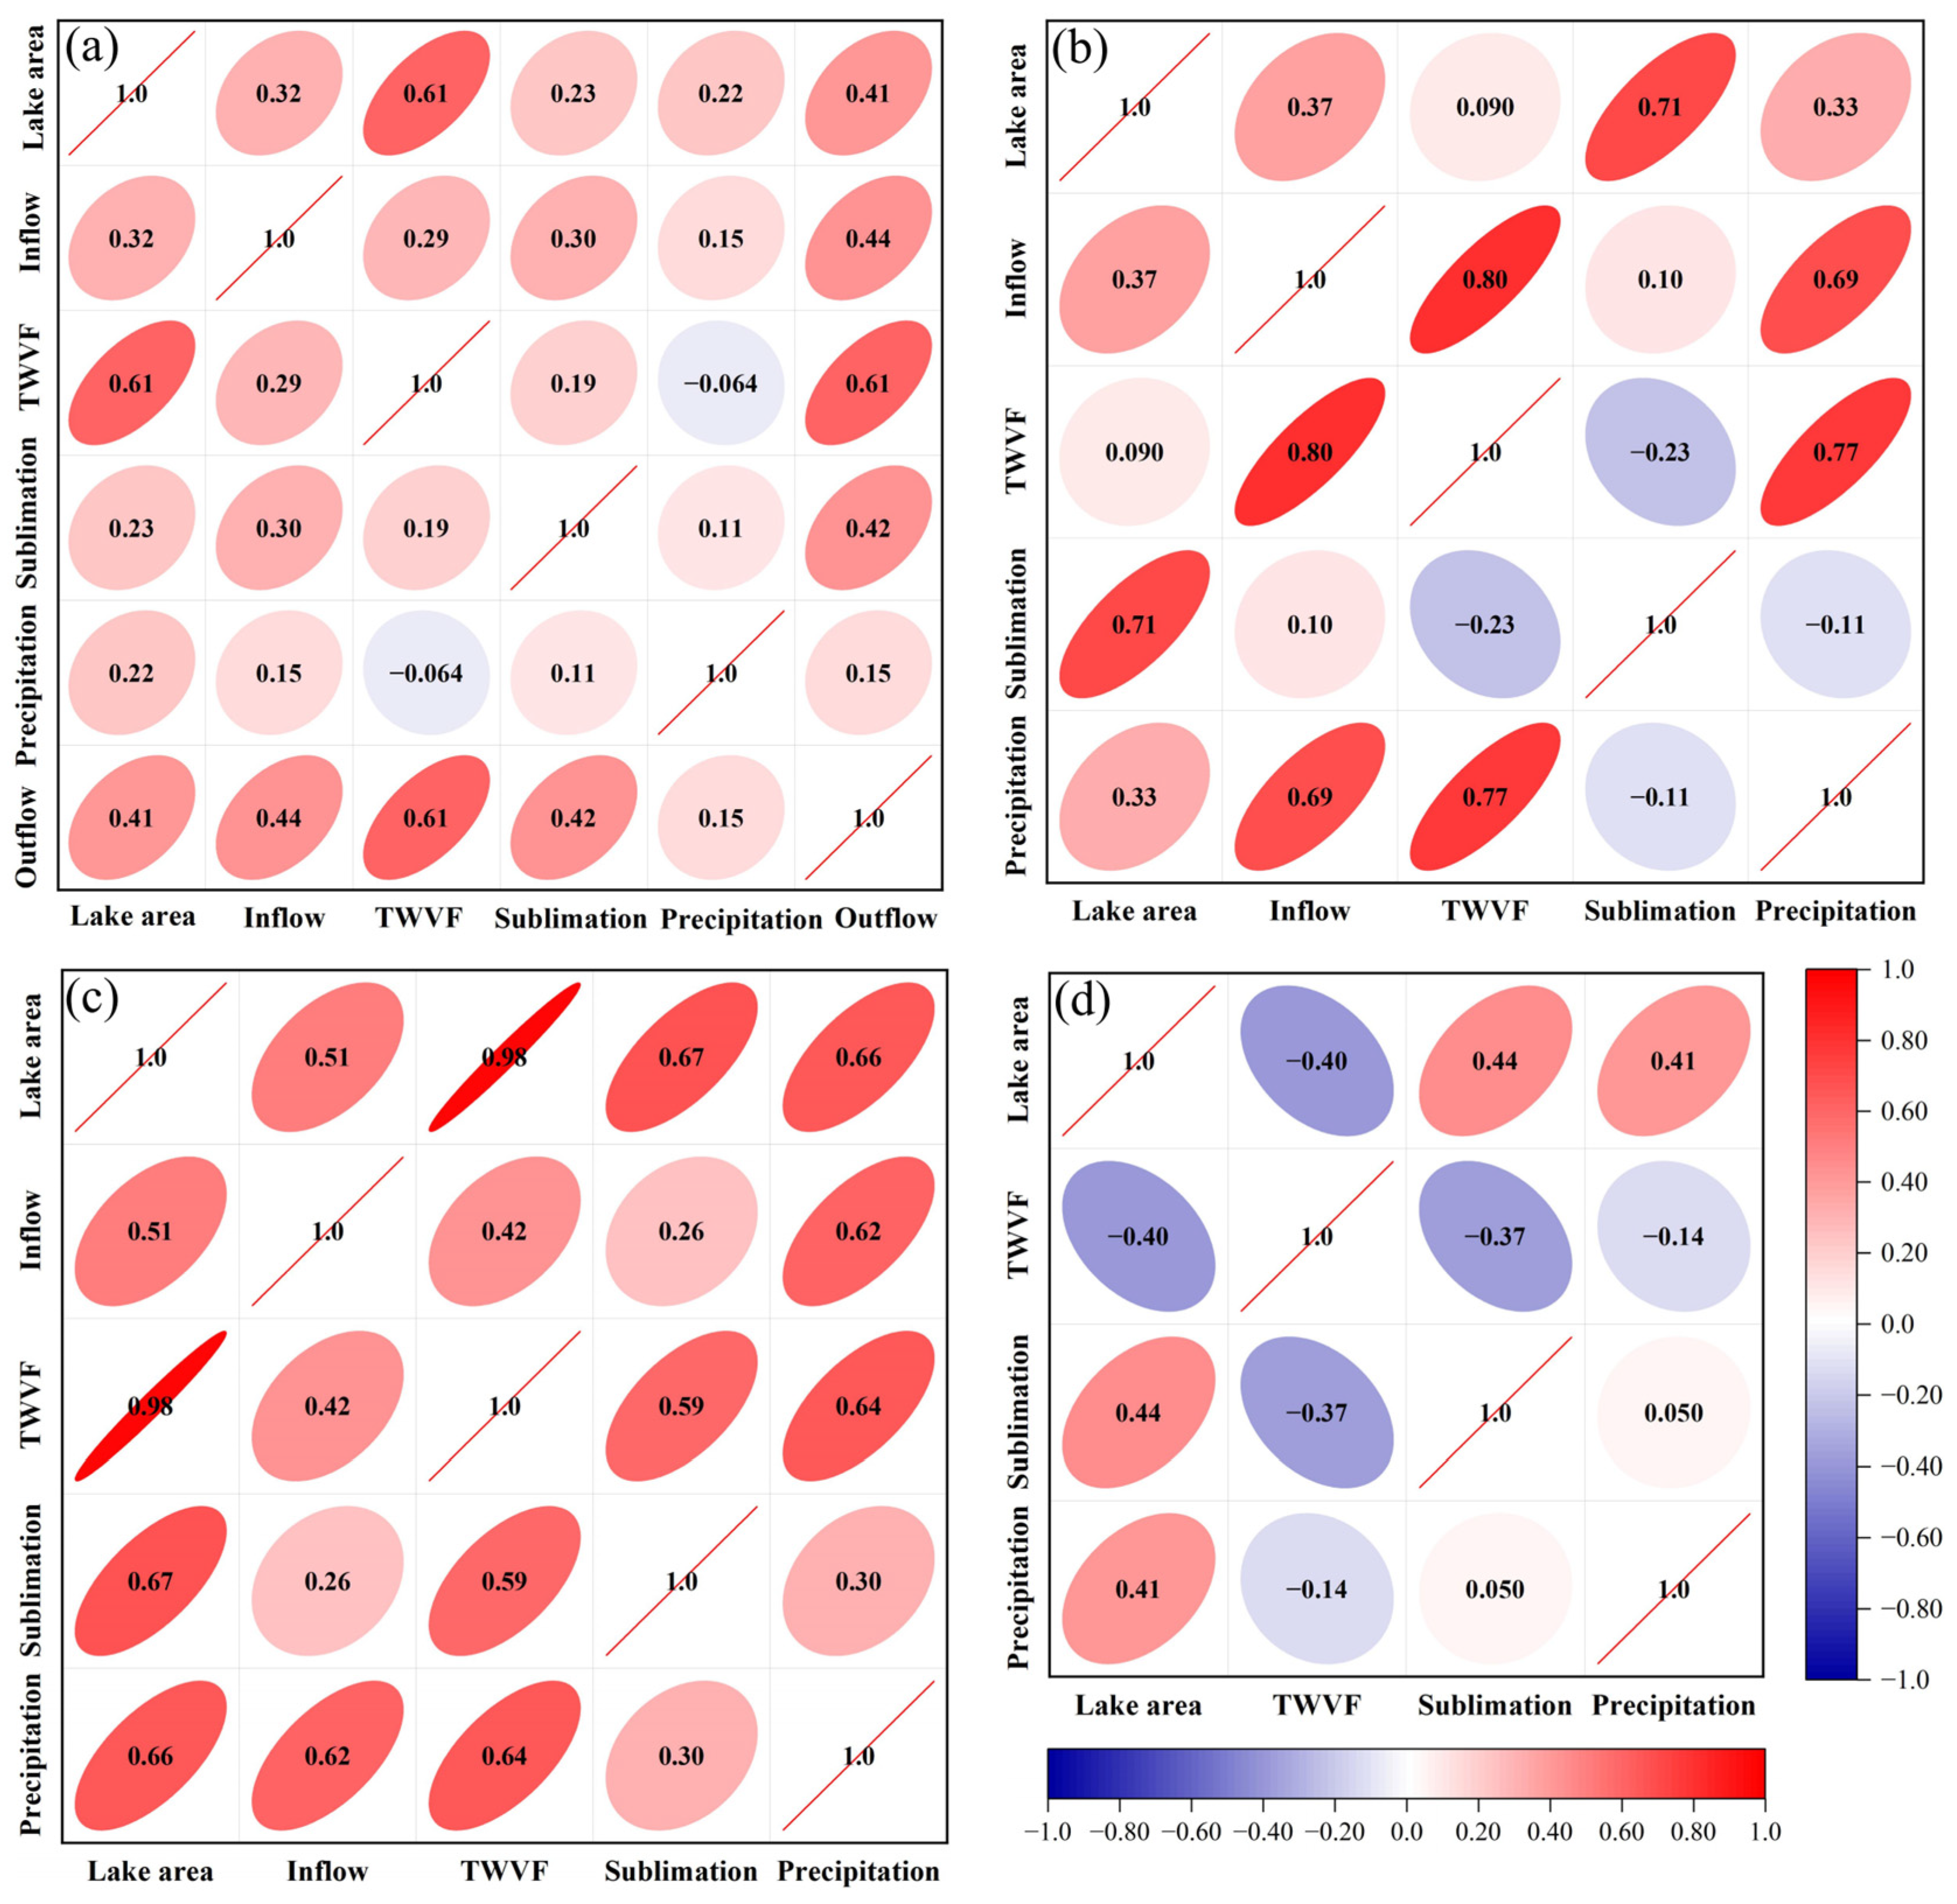
4.2. The Relationships between Lake Area and Lake Water-Cycle Components

The river inflow, TWVF, lake ice sublimation, lake surface precipitation, and river outflow are factors that impact the lake area, with interconnections among them. For instance, there are relationships between the rate of TWVF and sublimation, the rate of lake surface precipitation and river inflow, and the rate of lake surface precipitation and lake ice sublimation. According to Figure 4, there was a high positive correlation between river inflow and lake area in the open lakes, namely Bosten Lake, Ulungur Lake, and Ebinur Lake. The Pearson correlation coefficient ranged from 0.32 to 0.51, with an average value of 0.40. Although Bosten Lake, Ulungur Lake, and Ebinur Lake showed a negative correlation between the rate of TWVF and the lake area (Figure S2), the total TWVF volume and lake area exhibited a positive correlation. This positive correlation was attributed to the significant changes in the area of these open lakes. In contrast, the closed Sayram Lake, which lacks significant river inflow and experiences minimal variation in lake area (0.1% yr−1), exhibited a negative correlation between TWVF and lake area, with a correlation coefficient of −0.40 (Figure 4). The total lake surface precipitation, on the other hand, showed a positive correlation with lake area in all four lakes: Bosten Lake, Ulungur Lake, Ebinur Lake, and Sayram Lake. The correlation coefficients for these lakes were 0.22, 0.33, 0.66, and 0.41, respectively. Furthermore, lake ice sublimation and lake area exhibited a positive correlation in these four large lakes. The river outflow was positively correlated with the area of Bosten Lake, with a correlation coefficient of 0.41, indicating that the larger the lake, the greater the river outflow. Although there was no connection between lake precipitation and river inflow in the water cycle, the precipitation has the characteristics of integrity. When the lake surface receives precipitation, the basin of the river entering the lake may also receive precipitation. Therefore, lake surface precipitation may be a signal of watershed precipitation. The rates of the factors in the lake water cycle also displayed interconnections (Figure S2). The rates of lake TWVF and lake ice sublimation showed a strong negative correlation, primarily through their impact on the duration of lake ice cover. Additionally, the rates of lake surface precipitation and lake ice sublimation demonstrated a significant positive correlation in most lakes, likely influenced by their combined effect on airflow over the lake surface.

4.3. Different Methods to Analyze the Key Factors Influencing Lake Area Changes

4.3.1. Phase Analysis on Average

Phase analysis means dividing the whole study period into different intervals. The basis for dividing Bosten Lake, Ulungur Lake, and Ebinur Lake into different phases lies in the evident periods of decrease and increase in lake area. As for Sayram Lake, which exhibited a singular growth trend in area, the division points were in the year 1990. The division results of different phases are shown in Table 2. In Bosten Lake, the average lake area during the three phases was 1065.56 km2, 1050.97 km2, and 999.84 km2, respectively. Correspondingly, the river inflow during these phases was 22.24 × 10⁸ m3 yr−1, 29.89 × 10⁸ m3 yr−1, and 24.40 × 10⁸ m3 yr−1, respectively. Notably, the average lake area in the second phase decreased by 14.59 km2 compared to the first phase, while the river inflow in the second phase increased by 7.66 × 10⁸ m3 yr−1. In contrast, the lake loss in terms of river outflow increased by 2.71 × 10⁸ m3 yr−1. These findings strongly suggest that the reduction in the average annual lake area in the second phase, as opposed to the first phase, could be primarily attributed to the observed increase in river outflow. The average lake area of the lake in the third phase was 51.13 × 10⁸ km2 less than that in the second phase, and the order of contribution (from largest to smallest) was a decrease in river inflow by 5.49 × 10⁸ m3 yr−1, an increase in TWVF by 1.73 × 10⁸ m3 yr−1, an increase in river outflow by 1.16 × 10⁸ m3 yr−1, and a decrease in lake surface precipitation by 0.23 × 10⁸ m3 yr−1. In Ulungur Lake, the lake area during the second phase increased by 35.13 km2 compared to the first phase. Concurrently, there was an increase in both the river inflow and lake surface precipitation by 0.74 × 10⁸ m3 yr−1 and 0.34 × 10⁸ m3 yr−1, respectively. In Ebinur Lake, the lake area experienced a substantial increase of 148.92 km2 during the second phase compared to the first phase. This significant expansion was primarily driven by two main factors: a considerable increase in river inflow, amounting to 3.62 × 10⁸ m3 yr−1, and the increase of lake surface precipitation, totaling 0.29 × 10⁸ m3 yr−1. The rapid decrease in lake area (−160.05 km2) in the third phase over the previous phase was mainly due to a decrease in river inflow and lake surface precipitation by 2.01 × 10⁸ m3 yr−1 and 0.12 × 10⁸ m3 yr−1, respectively. In all three open lake phases, although TWVF was generally positively correlated with lake area, it was the main factor that determined the loss of lake water. In Sayram Lake, the slight increase in lake area during the second phase compared to the first phase (+3.99 km2) was mainly attributed to two factors: an increase in lake surface precipitation (0.37 × 10⁸ m3 yr−1) and a decrease in TWVF (−0.10 × 10⁸ m3 yr−1). Notably, the impact of lake surface precipitation on the change in lake area outweighed that of TWVF.

4.3.2. Linear Trends Analysis

Our study presented segmented linear trends in lake areas and lake water cycle components (Figure 5). The open lakes exhibited significant variation in area change during the study period, with the maximum and minimum values differing by 425.6 km2, 76.8 km2, and 390.1 km2 in Bosten Lake, Ulungur Lake, and Ebinur Lake, respectively. In contrast, the closed Sayram Lake showed an increasing trend to a lesser extent, with an area change of 7.5 km2. The river inflow in all three open lakes showed an overall increasing trend of 0.045 ± 0.031 × 10⁸ m3 yr−1. Regarding the TWVF, Bosten Lake exhibited an overall increasing trend, while Ulungur Lake, Ebinur Lake, and Sayram Lake experienced decreasing trends. Lake ice sublimation and lake surface precipitation showed an increasing trend in the four lakes (Table S4). The river outflow from Bosten Lake showed a clear upward trend (0.108 ± 0.021 × 10⁸ m3 yr−1).
River inflow, as the largest component of the region’s lakes, generally coincided with trends in lake area for most of the segmented period, indicating that river inflow plays a crucial role in determining the amount of stored lake water. However, there were instances where it did not align with changes in lake area, such as in the third phase of Bosten Lake (2003–2013) and the second phase of Ulungur Lake (1990–2013). In the third phase of Bosten Lake, although the trend of river inflow did not correspond to the lake area, there was an 18.4% decline in this component compared to the second phase. Furthermore, there was a steep 53.8% decline in river inflow in 2003 compared to the inflow in 2002. The high value of river outflow of the lake in the third phase (11.4 × 10⁸ m3 yr−1) also contributed to the decrease in lake area in this phase. The TWVF, as the second largest component of lake water volume, exhibited an overall opposite linear trend to the lake water volume in Bosten Lake, Ulungur Lake, and Sayram Lake. However, from an inter-annual perspective, the TWVF increased with the growth of lake area. High (low) loss of TWVF in successive years led to a subsequent decrease (increase) in lake area, highlighting the significant impact of TWVF on lake area. The lake surface precipitation generally aligned with changes in lake area for most of the period. Although its effect on lake volume was limited, it may serve as a signal of river inflow from small rivers around the lake that were not included in the statistics of this study due to a lack of observational data. In the closed Sayram Lake, the first phase of lake area changes was primarily influenced by the TWVF and lake surface precipitation, and reductions in lake area during the second phase were mainly attributed to reductions in total TWVF.
Based on the aforementioned analysis, it is evident that the dominant factor influencing the lake area varied across different phases. Specifically, during these phases, the change in lake area was primarily governed by the inflow of water from the river. The loss of water due to TWVF and river outflow showed that they were also significant factors that impacted the lake area and subsequently contributed to its changes.

4.3.3. MRA Trends Analysis

The MRA method was employed to extract multi-decadal trends of the time series of lake water cycle components. Periodicities shorter than ten years and noise were subtracted from the original time series. Figure 6 displays the MRA variations in changes in the amounts of lake water cycle components for four major lakes in recent decades. It was observed that different components of the lake water cycle exhibited varying levels of oscillation. Specifically, the oscillation of river inflow and river outflow surpassed that of TWVF, while the oscillation of lake surface precipitation exceeded that of lake ice sublimation.
The MRA amplitude of the river inflow varied from 4.37 × 10⁸ m3 (Ebinur Lake) to 13.5 × 10⁸ m3 (Bosten Lake). The magnitude of MRA for the river outflow from Bosten Lake was 7.51 × 10⁸ m3. The TWVF exhibited an MRA amplitude ranging from 0.21 × 10⁸ m3 (Sayram Lake) to 4.20 × 10⁸ m3 (Bosten Lake). The MRA values for lake ice sublimation and lake surface precipitation showed a magnitude of change ranging from 0.12 × 10⁸ m3 (Ebinur Lake) to 0.55 × 10⁸ m3 (Bosten Lake), and from 0.07 × 10⁸ m3 (Sayram Lake) to 0.69 × 10⁸ m3 (Ulungur Lake).
In the case of Bosten Lake, the evolution of its lake area could be categorized into three distinct phases: a slow decreasing phase, a rapid increasing phase, and a rapid decreasing phase. In parallel, the river inflow underwent a declining trend, followed by an increasing trend, and then another decreasing trend. These two variables showed a consistent trend of change. On the other hand, the TWVF experienced phases of slow decline, rapid increase, and relative stability. The river outflow of the lake went through periods of stability, rapid increase, and subsequent decline. These two factors contributed to the large loss of lake water after 2002, contributing to the decline in lake area during this period. The trends of precipitation and sublimation were similar, both showing a decreasing trend, followed by an increasing trend, and then a decreasing trend. In Ulungur Lake, the steep increase in river inflow from 1977 to 1989 explained the rapid increase in lake area during the same period, and the fluctuations in lake area after 1989 aligned with the trend of river inflow. Although river inflow and lake area did not exhibit a perfect linear relationship (e.g., the second phase in the linear trend for Ulungur Lake), the MRA trend analysis indicated that river inflow is the most significant factor influencing the area of Ulungur Lake. Furthermore, the trends in MRA of lake surface precipitation were also aligned with changes in lake area. In Ebinur Lake, during a period of unusually large lake area (2000—2005), the MRA variability of river inflow and lake surface precipitation also reached peak values of 19.90 × 10⁸ m3 and 0.95 × 10⁸ m3, respectively. The TWVF and sublimation contributed to the decline in lake area during 2006—2013 by consistently causing high values of water loss from the lake. The total amount of TWVF and sublimation remained relatively constant over the study period, in contrast to the fluctuating river inflow and lake surface precipitation. The MRA of TWVF experienced an insignificant increase with a change rate of 0.000 ± 0.009 × 10⁸ m3 yr−1, while river inflow displayed a significant increase with a change rate of 0.069 ± 0.021 × 10⁸ m3 yr−1. Additionally, the lake surface precipitation exhibited an obvious bimodal pattern. In Sayram Lake, the lake area showed a continuous weak increase at an average rate of 0.190 ± 0.008 km2 yr−1. The lake area and TWVF displayed a negative correlation with a correlation coefficient of 0.44, indicating a close relationship between TWVF and the area of this lake. Additionally, the lake surface precipitation exhibited a significant increase at a rate of 0.013 ± 0.002 × 10⁸ m3 yr−1 and showed a strong positive correlation with lake area, with a correlation coefficient of 0.65. This correlation highlights the substantial contribution of increased precipitation to the expansion of the lake area. The loss of lake water from lake ice sublimation exhibited a stable pattern and had a limited effect on lake area.

4.4. The Role of Lake Water Cycle Components in Lake Water Balance

Figure 7 presents the total changes in lake water cycle components on the same axis, allowing for a clear comparison of the variations in the volume of water cycle components in the four lakes. In the open lakes, the total amount of river inflow was the highest among the components, surpassing the total amount of TWVF in Bosten Lake, Ulungur Lake, and Ebinur Lake by 14.13 × 10⁸ m3 (131.8%), 1.95 × 10⁸ m3 (25.1%), and 13.10 × 10⁸ m3 (287.4%), respectively. Among the three open lakes, Ulungur Lake was the only one where the total river inflow was lower than the total TWVF in certain dry years. This could be attributed to the high latitude of the location and low precipitation in the basin, resulting in less river inflow. Additionally, the low winter temperatures caused snowfall in the precipitation to not quickly form runoff. The average annual variability of river inflow in these three lakes was substantial, reaching 20.1%, 56.1%, and 9.6%, respectively, and the maximum annual variability was even higher, reaching 73.8%, 444.1%, and 25.1%, respectively. There was a noticeable correspondence between the peaks of lake area and the peaks of river inflow, implying that the high lake area is likely a result of substantial river inflow. The annual average change rates of total TWVF in the four lakes ranged from 2.7% to 5.8%, with maximum change rates ranging from 5.6% to 21.0%. The river outflow from Bosten Lake was lower than the TWVF in most years. However, the annual average river outflow was higher than the TWVF by 3.73 × 10⁸ m3 in 2000–2004, while they caused comparable lake water loss after 2004. Additionally, the annual average amount of lake precipitation exceeded the annual average amount of lake ice sublimation in all four lakes, with differences of 72.2%, 173.5%, 180.4%, and 166.6%, respectively. However, during certain dry years in Bosten Lake and Ebinur Lake, the total amount of lake ice sublimation surpassed the total amount of lake surface precipitation, highlighting the non-negligible importance of lake ice sublimation to the overall water balance of the lakes, especially in dry years.

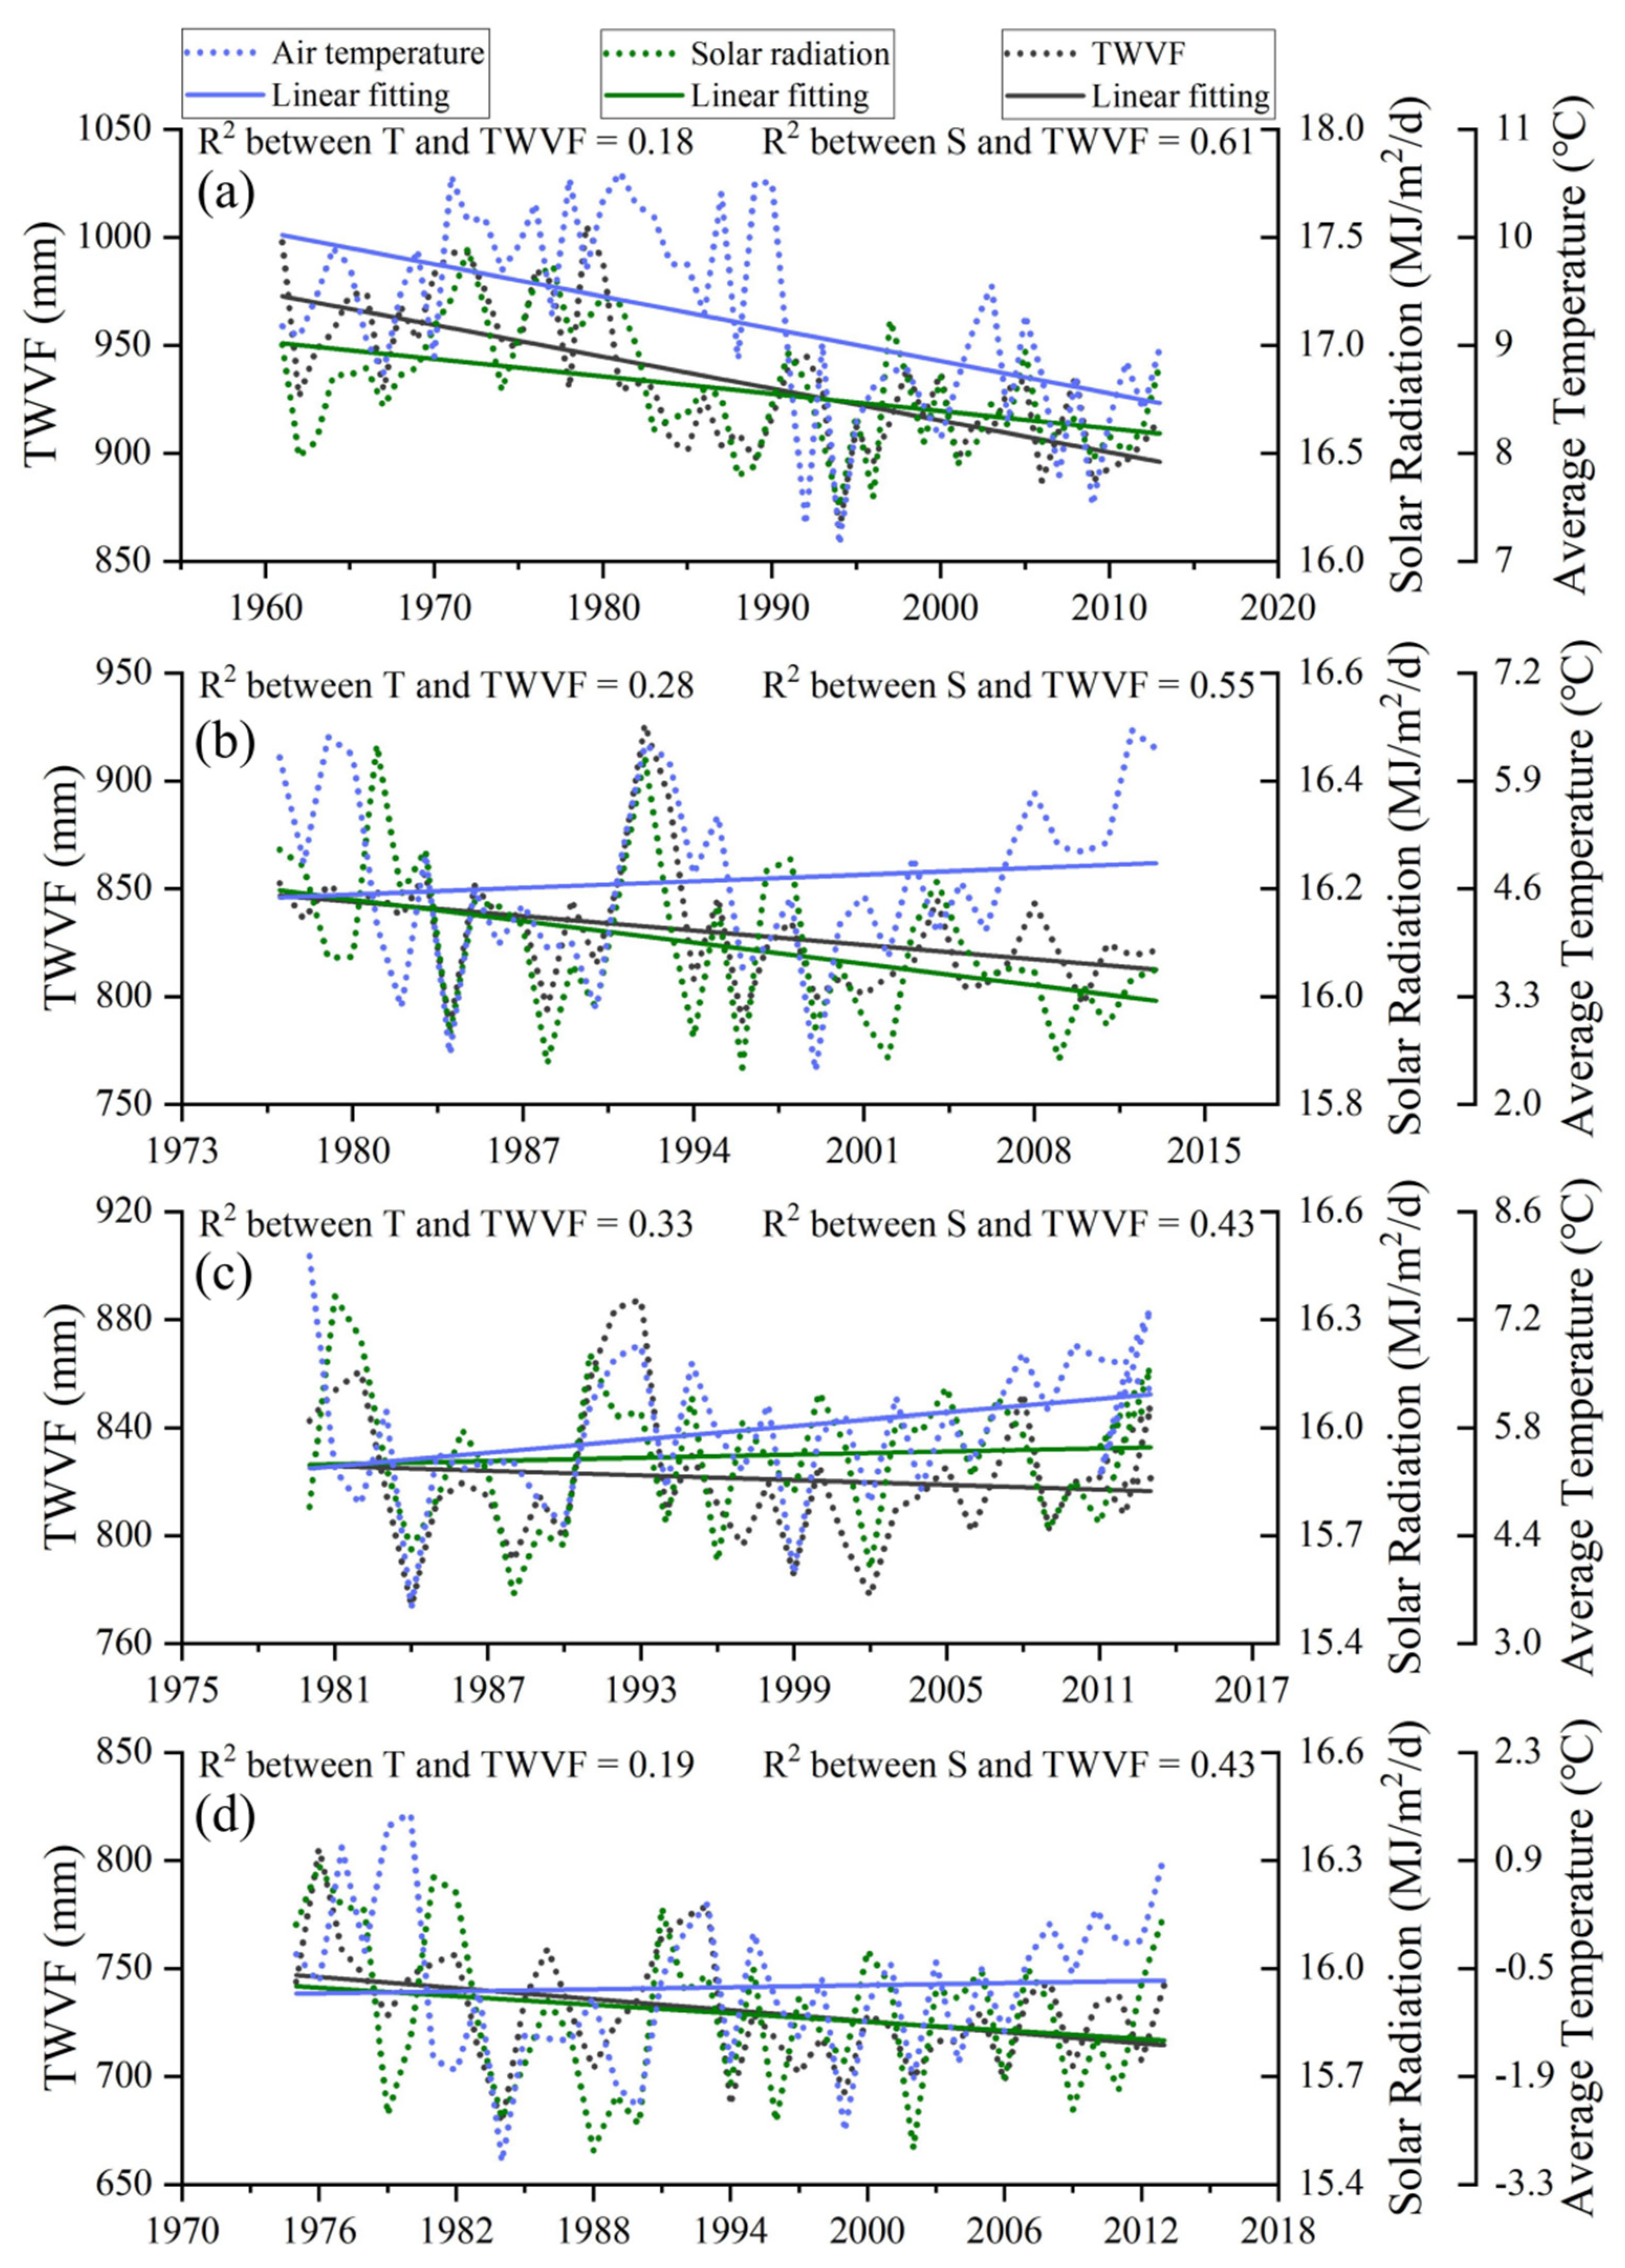
4.5. Effects of Temperature and Solar Radiation on TWVF

The TWVF is the primary mechanism for lake water loss, yet the relationship between the TWVF and meteorological factors remained unclear in this study. To gain deeper insights into the connection between TWVF in the four lakes and key meteorological variables, we present the inter-annual variation trends of TWVF rate, air temperature, and solar radiation. As depicted in Figure 8, the rate of TWVF exhibited similar inter-annual variations as air temperature and solar radiation. On average, the correlation coefficient between the TWVF rate and air temperature was 0.25, while the average correlation coefficient between the TWVF rate and solar radiation was 0.51. In terms of linear trends, the relationship between the rate of TWVF and solar radiation was stronger than that between the rate of TWVF and air temperature. Specifically, the correlation coefficients of TWVF and solar radiation in order from the highest to the lowest were Bosten Lake, Ulungur Lake, Ebinur Lake, and Sayram Lake. Conversely, the correlation coefficients of TWVF and air temperature were ranked from the highest to the lowest in Ebinur Lake, Ulungur Lake, Sayram Lake, and Bosten Lake. During the study period, the rate of TWVF exhibited a significant downward trend in Bosten Lake, Ulungur Lake, and Sayram Lake, corresponding to a decline in solar radiation in these three lakes. Among the four lakes, only Bosten Lake showed an obvious decreasing trend in temperature, while the other three lakes showed a stable or increasing trend in temperature.

5. Discussion

5.1. Comparison with Other Literature Results

Different methods and data can yield varying conclusions about changes in lake water volume, underscoring the importance of comparing the results of this study with other research. Li et al. [18] employed Ensemble Empirical Model Decomposition (EEMD), water balance analysis, and climate elasticity methods to investigate water area changes in Bosten Lake from 1960 to 2018. Some of their findings align with our conclusion, emphasizing the significant role of river inflow as the primary factor influencing the lake’s water area. Furthermore, we have arrived at similar conclusions regarding the increase in TWVF at the lake surface coinciding with an expansion in lake area. However, their conclusion pointed to river inflow as the predominant factor behind the decrease in water areas between 2003 and 2014. In contrast, our study found that river inflow did not primarily drive the reduction in lake area during the 2003–2013 phase, as evidenced by the opposing linear trends in river inflow and lake area change. This disparity in findings could be attributed to variances in analytical approaches.
A work on Xinjiang lake was carried out by Gao et al. [41], who analyzed the factors of lake area change in Ulungur Lake from 1977 to 2017 using the Pearson correlation analytical method and sufficient observational data. One significant factor identified in their study was the diversion of water, ranging from 3 × 10⁸ m3 yr−1 to 4 × 10⁸ m3 yr−1, from the Irtysh River after 1988, which is not part of the Ulungur Lake Basin. This diversion played a role in the rapid increase in the area of Ulungur Lake during the first phase of the study period (1977–1989). The study concluded that the area of Ulungur Lake is heavily influenced by anthropogenic factors, such as artificial diversions and irrigation. This finding helps explain why the linear trends in our study did not correlate strongly with the area of Ulungur Lake specifically in terms of river inflow from the Ulungur River alone. The presence of additional water inputs, such as the diversion from the Irtysh River, contributes to the complex dynamics of the lake’s water balance.
In the study of Ebinur Lake’s area change, Ge [42] employed integrated learning algorithms to assess the significance of various influencing factors. The study’s findings are consistent with our conclusions, highlighting that river inflow has a more pronounced effect on changes in the area of Ebinur Lake than precipitation. Additionally, the study observed a significant lag in river inflow around 2000, which was attributed to heavy anthropogenic water use at the lake’s entrance. In our investigation of Ebinur Lake, we focused on comprehensively analyzing both overall and periodic variations in the lake’s area, omitting an exploration of the exceptional years. Regarding Sayram Lake, Chai et al. [43] conducted a study to investigate the impact of temperature and precipitation on the lake’s area expansion. They divided the study periods into more finely-grained 10-year intervals and found that the increase in precipitation predominantly drove the expansion of the lake area. This finding aligns with the conclusion drawn from our phase analysis, further emphasizing that precipitation exerts a greater influence than TWVF.

5.2. Effects of Other Components on Lake Area

Groundwater seepage to and from lakes is a crucial component of their water balance. However, the pathways of groundwater beneath a lake are complex, and variations in groundwater runoff over just a few meters can exhibit substantial differences. Conditions at the lake bottom, including sediment type, geological factors, and topography, contribute to the spatial heterogeneity of lake seepage. The SWAT hydrological model employed in this study has limited accuracy in calculating groundwater dynamics within lakes due to its inability to account for geological characteristics, such as rock types. Among the four lakes, we could only find limited years’ worth of groundwater exchange data for Bosten Lake in Liu’s study [44].
Figure 9 illustrates the relationship between groundwater into Bosten Lake and its corresponding lake area. The negative values indicated groundwater flowing into the lake for that year, while the positive values signified groundwater outflow from the lake. The results suggest that there was no significant correlation between groundwater seepage and lake area. On average, the groundwater inflow into Bosten Lake was 0.825 × 10⁸ m3 yr−1, which was 96% and 92% lower than the river inflow and TWVF, respectively. Additionally, it exceeded the lake ice sublimation by 31% and lake precipitation by 7%.
Although we were unable to find pertinent literature on groundwater exchange data for the other three lakes, Yang’s [45] study highlights that Ebinur Lake’s characteristics include deep silt and very shallow water (Table 1), resulting in minimal leakage from the lake bottom. However, our understanding of the vertical movement of water volume at the lake bottom in Ulungu Lake and Sayram Lake remains incomplete. This aspect represents a source of uncertainty in this study, and further research in this area will be necessary.
We also extracted the inter-annual variation in groundwater levels from relevant literature for observation wells located around Bosten Lake and Ebinur Lake (Figure 10). These wells are situated approximately 27.3 km and 57.2 km away from the corresponding lakes, respectively. The monitoring stations for groundwater levels began operating in 2004 and 1990, respectively. Figure 10 illustrates the yearly variation in groundwater levels, providing a comprehensive depiction of the dynamic characteristics observed during the study period. The results indicated an overall decreasing trend in groundwater level, with rates of −0.18 ± 0.06 m yr−1 and −0.16 ± 0.01 m yr−1 for Bosten Lake and Ebinur Lake, respectively. Correspondingly, Bosten Lake experienced a significant decrease in lake area during the same period. It is evident that the lake area and groundwater levels exhibited a positive correlation for most of the years in Bosten Lake. In the case of Ebinur Lake, the decreasing trend in groundwater levels can partially explain the decline in lake area from 1990 to 2012. However, it is challenging to fully explain the high level in lake area during the study period of 2000 to 2005. This high level is attributed to high river inflow and lake surface precipitation.
Desertification in Xinjiang has reached a critical level. The runoff from rivers into the lakes often carries a significant amount of sediment, which tends to accumulate at the lake’s bottom, thereby impacting both water volume and lake area. Table S5 provides data on the average annual sediment deposition in the three open lakes. The results revealed that the yearly sediment inflow into these lakes ranges from 0.0015 × 10⁸ m3 to 0.0108 × 10⁸ m3, with an average value of 0.0057 × 10⁸ m3. The sediment from runoff has a limited influence on lake water volume, amounting to just 1.4% of the average annual volume of lake ice sublimation.

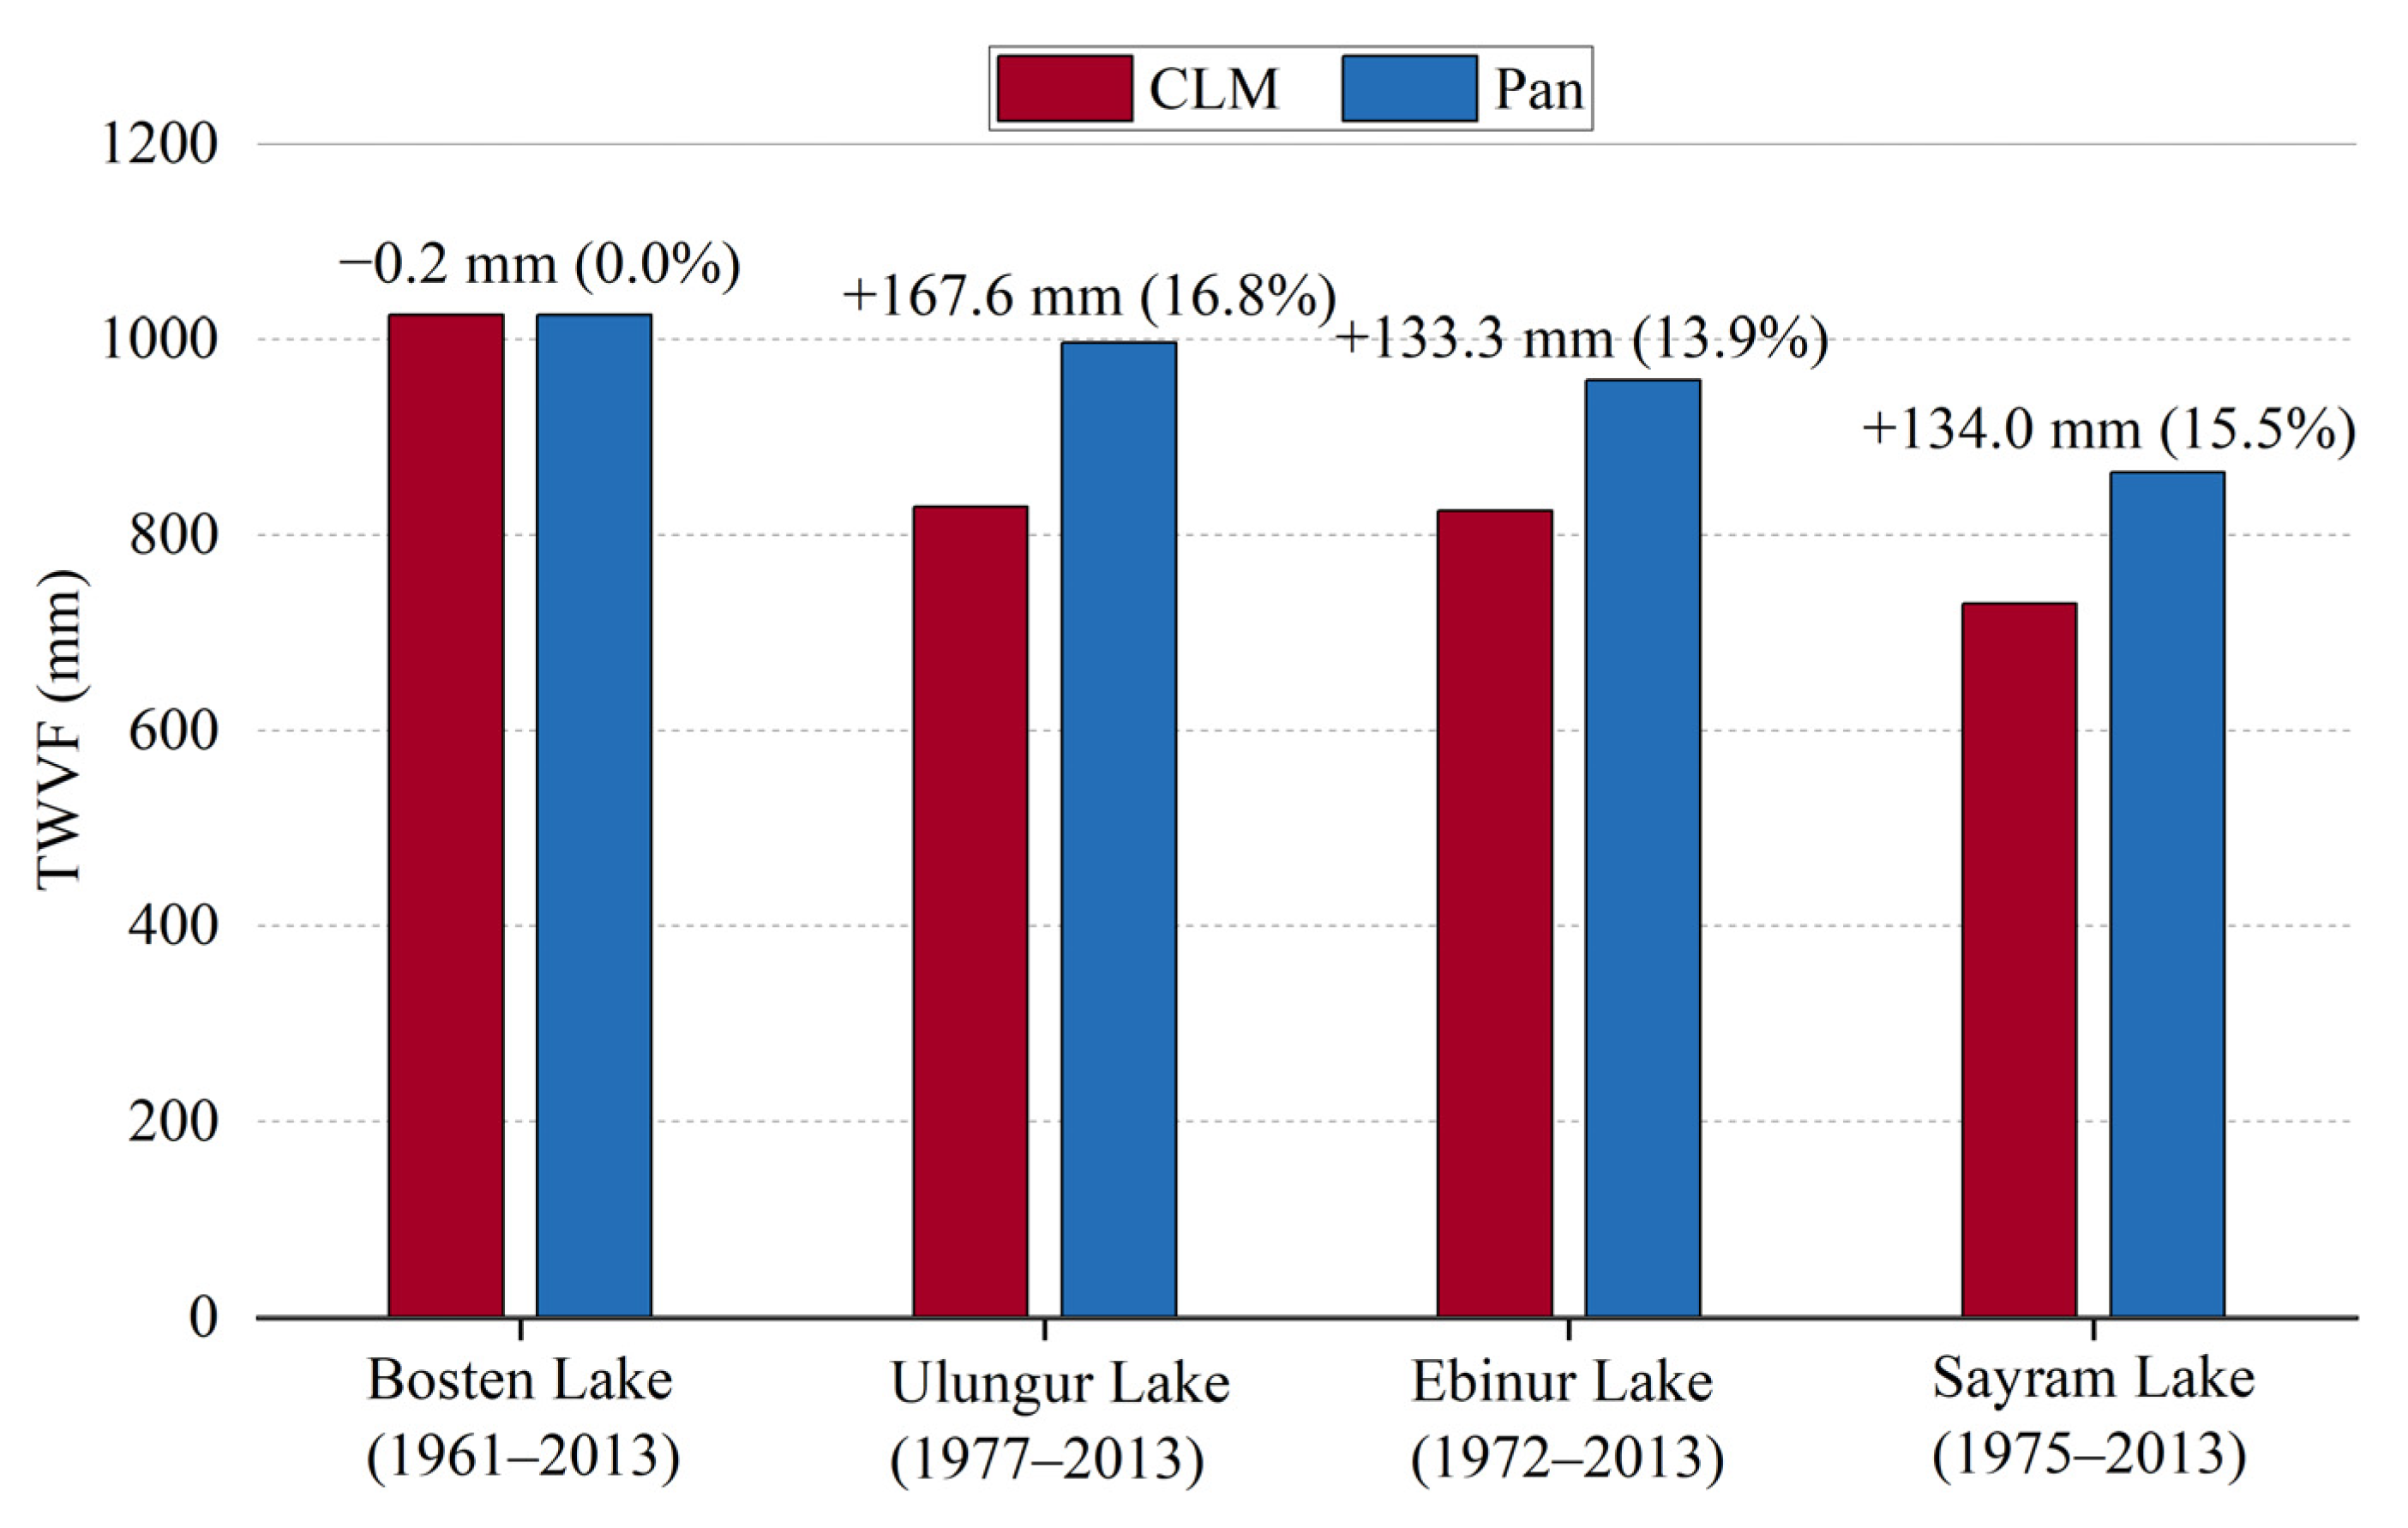
5.3. Uncertainty in TWVF

The evaporation pan, a commonly used observation tool at hydrological and meteorological stations, is one of the simplest, most cost-effective, and widely practiced methods for directly observing local TWVF conditions [48,49]. In this study, we utilized data from two types of evaporation pans (D20 pan with observations from 1951 to 1998 and E601 pan with observations from 1996 to present), from which we chose the evaporation pan station located closest to the lake (same location as the meteorological observation station in Figure 1). These observations were converted to obtain TWVF values at the lake surface.
Figure 11 displays a comparison between the calculated results using the CLM method and the pan method for the four lakes during the study period. The TWVF results obtained from both methods were generally comparable, particularly in Bosten Lake, where the difference was only 0.2 mm yr−1. The comparison showed that the calculated TWVF using the CLM method deviated from the pan method by only 0.2 mm yr−1 and 167.6 mm yr−1 (0.0% to 16.8%), with an average deviation of 108.8 mm yr−1 (11.6%). This indicated a relatively small error in the TWVF results caused by the CLM method. The verification results confirmed the reliability of the TWVF results obtained in this study.

6. Conclusions

In the present study, we used a land surface model to estimate the TWVF and lake ice sublimation, and a hydrological model to simulate the part of the river inflow into the lake. Based on regression analysis, phase analysis, and trend analysis we illustrated the spatiotemporal heterogeneity of the changes in lake areas/volumes in a typical dry region in China during the past decades and explored the key factors and underlying mechanisms influencing these changes. The key findings in this study are as follows:
(a)
The river inflow in all three open lakes showed an overall increasing trend of 0.045 ± 0.031 × 10⁸ m3 yr−1. Regarding the TWVF, Bosten Lake exhibited an overall increasing trend, while Ulungur Lake, Ebinur Lake, and Sayram Lake experienced decreasing trends. The lake ice sublimation and lake surface precipitation showed increasing trends in the four lakes. The river outflow from Bosten Lake showed a clear upward trend (0.108 ± 0.021 × 10⁸ m3 yr−1).
(b)
The influencing factors on the change in lake area varied for different phases and lake types. Overall, river inflow was the dominant factor affecting the change in open lake areas, while lake surface precipitation was the primary factor affecting the change in closed lake areas. The TWVF and river outflow, as the primary factors contributing to lake water loss, had a significant impact on the lake areas in subsequent years.
(c)
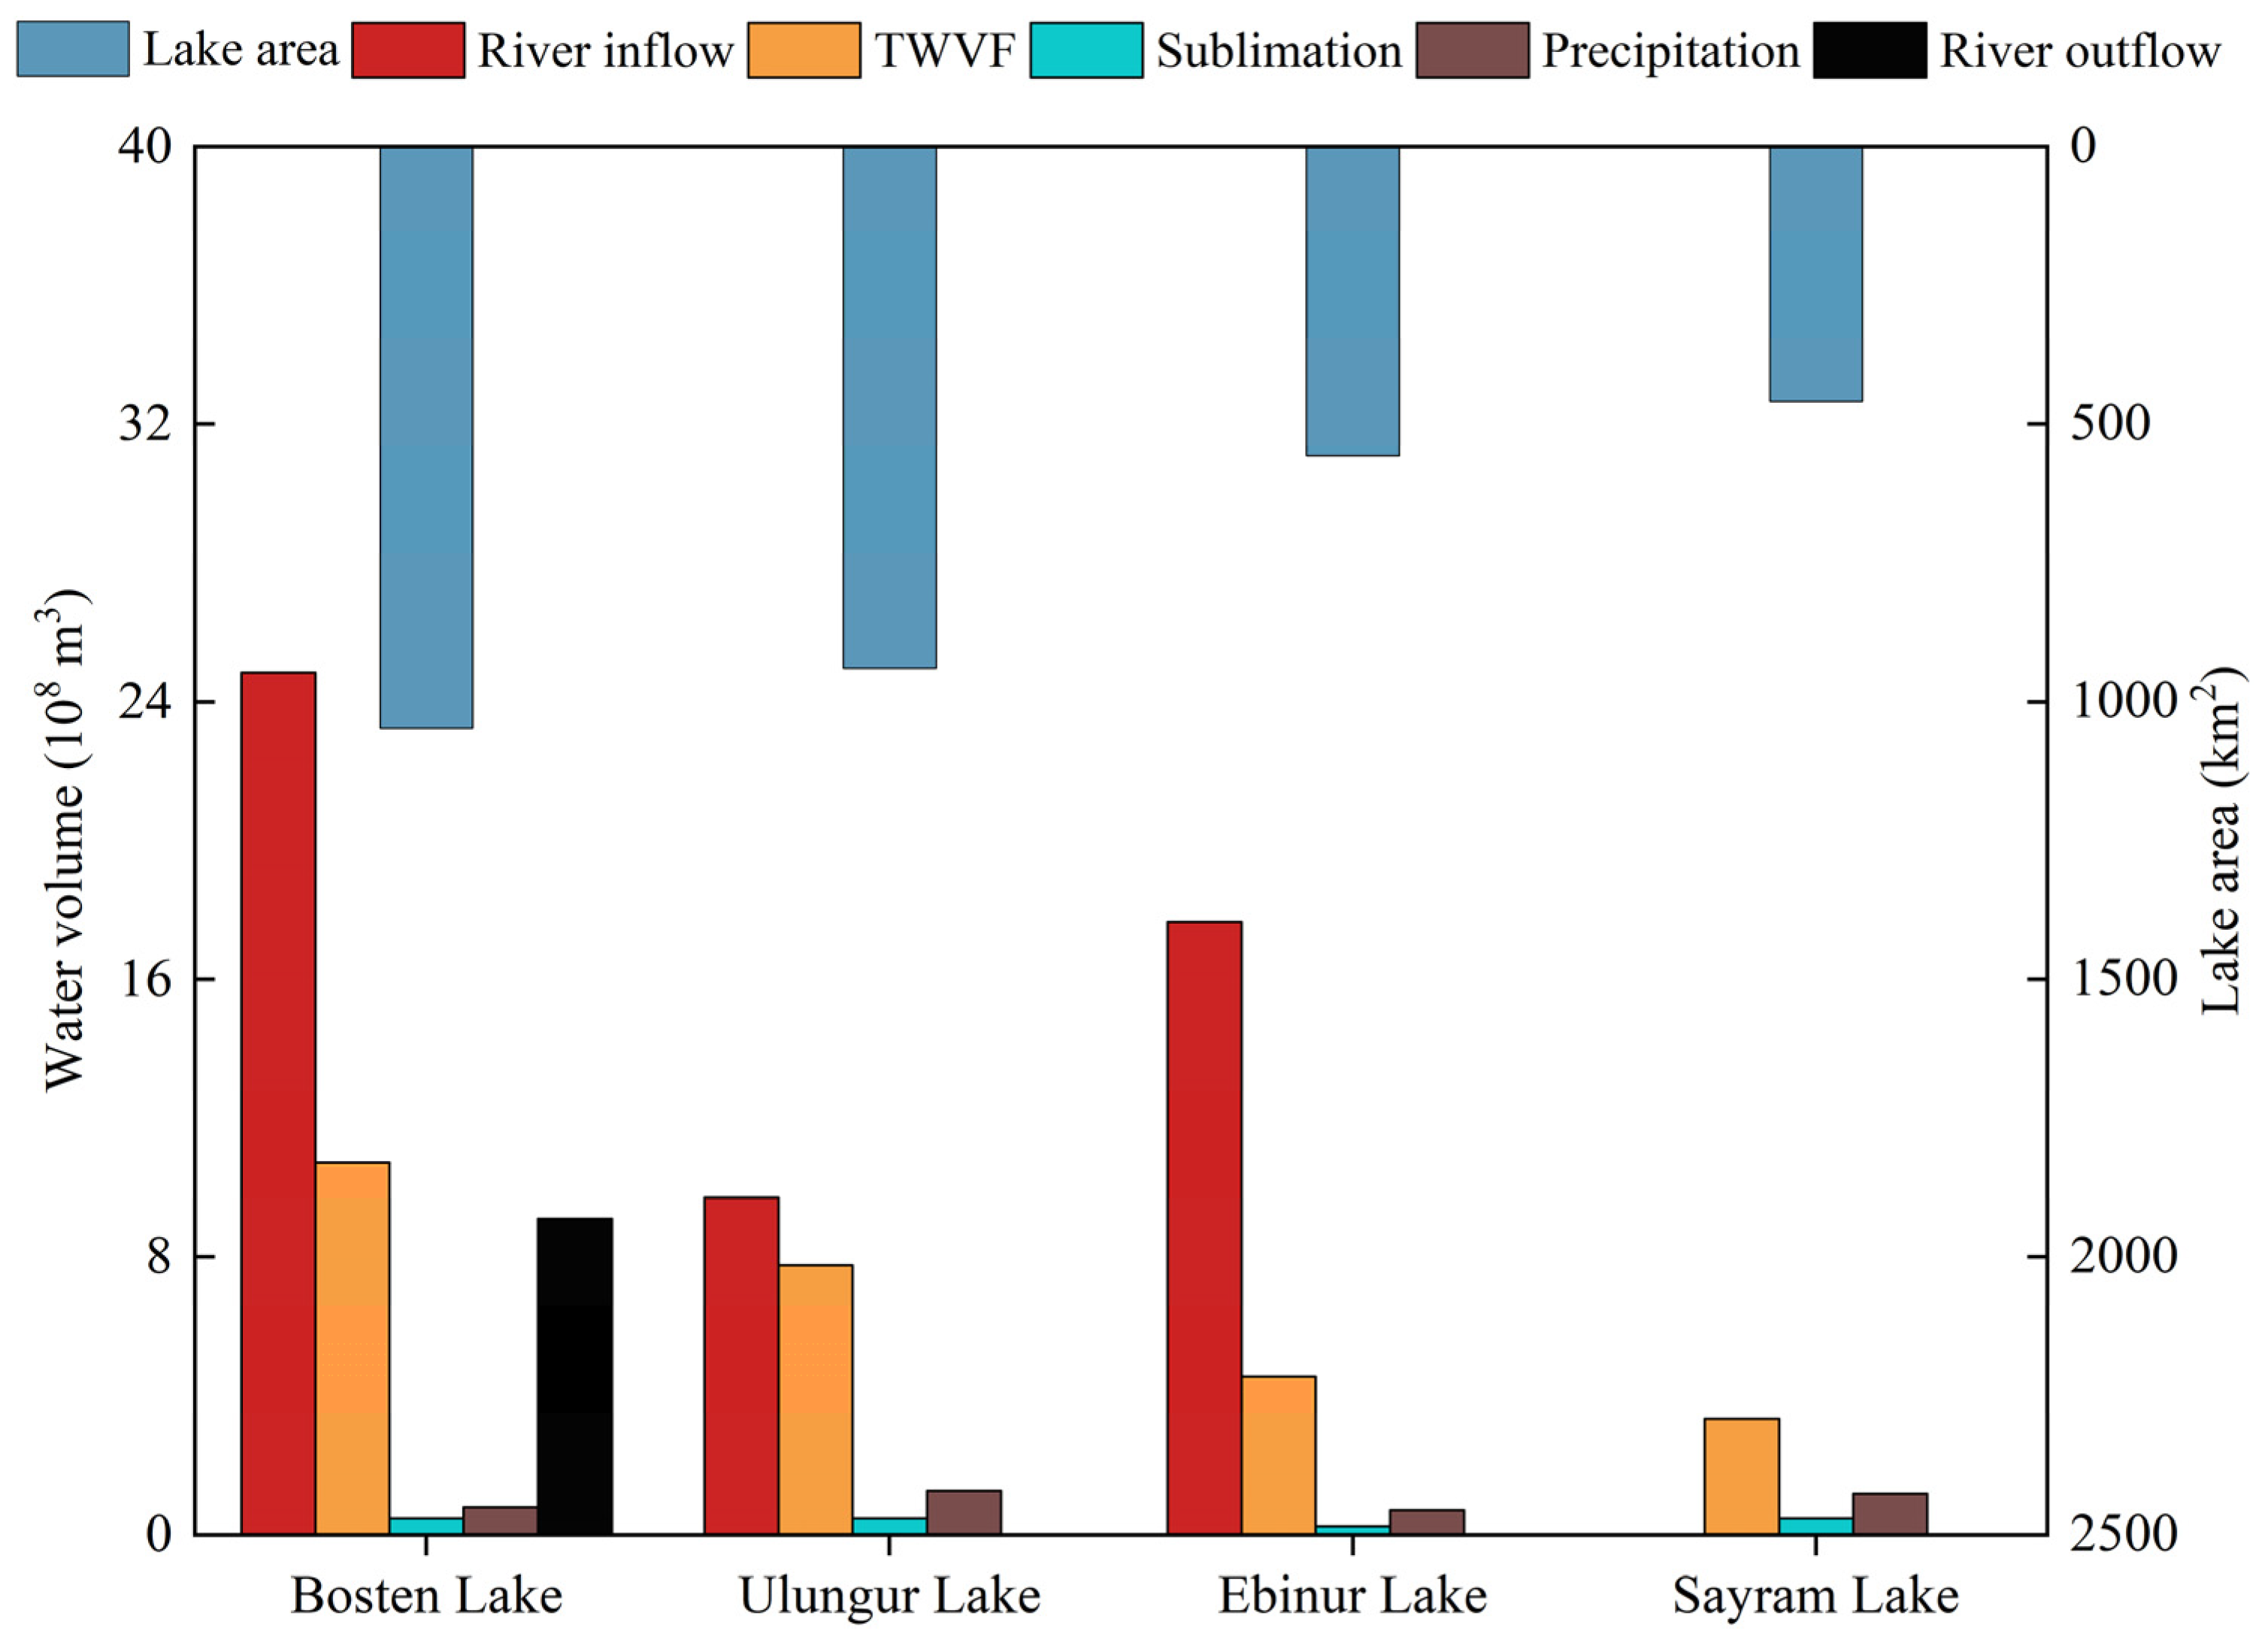
The average amount of river inflow, TWVF, lake ice sublimation, lake surface precipitation, and river outflow in the four lakes was 17.41 × 10⁸ m3 yr−1, 6.60 × 10⁸ m3 yr−1, 0.41 × 10⁸ m3 yr−1, 0.98 × 10⁸ m3 yr−1, and 9.12 × 10⁸ m3 yr−1, respectively. The TWVF and lake ice sublimation, which were the components of lake water cycle with no observed values in the four lake surfaces, played an important role in influencing changes in lake area in dry years. The water balance analysis revealed that Ulungur Lake encountered periods with a river inflow that was lower than the TWVF, while Bosten Lake and Ebinur Lake had certain years where the total lake ice sublimation exceeded total lake surface precipitation.

Supplementary Materials

The following supporting information can be downloaded at: https://www.mdpi.com/article/10.3390/w15193354/s1, Figure S1: Calibration (1961–1999), validation (2000–2007), and prediction (2008–2013) of the runoff of the Kaidu River by using SWAT model, an inflow river of Bositen Lake; Figure S2: Pearson correlation coefficients between lake area (km2), river inflow (108 m3), TWVF (mm), lake surface precipitation (mm), lake ice sublimation (mm), and river outflow (108 m3). (a) Bosten Lake. (b) Ulungur Lake. (c) Ebinur Lake. (d) Sayram Lake; Table S1: The sources of materials in this study; Table S2: Parameter settings for TWVF and sublimation calculations in CLM5; Table S3: Parameters and corresponding ranges in SWAT model for Kaidu River; Table S4: The linear trend of river inflow, TWVF, lake ice sublimation, lake surface precipitation, and river outflow; Table S5: The annual amount of sediment carried by rivers into the lakes. Refs. [50,51,52,53] are cited in Supplementary Materials.

Author Contributions

Y.C.: conceptualization, methodology, software, validation, formal analysis, writing—original draft preparation; C.F.: conceptualization, methodology, writing—review and editing; M.Y. methodology, writing—review and editing; H.W.: (Huawu Wu) software, resources; project administration; H.W.: (Haohao Wu) conceptualization, formal analysis; H.Z.: resources, writing—review and editing; Y.X.: resources, writing—review and editing, supervision; Z.Z.: resources, writing—review and editing. All authors have read and agreed to the published version of the manuscript.

Funding

This research was funded by the National Key Research and Development Program of China (grant number 2019YFA0607100), the Pioneer Hundred Talent Program, Chinese Academy of Sciences (grant number Y7BR021001), the NIGLAS startup project for introducing talents (grant number Y7SL041001), and the National Natural Science Foundation of China (grant number 41971044).

Data Availability Statement

The national meteorological data and pan data used in the present study were obtained from the China Meteorological Data Service Center (http://data.cma.cn/data/cdcindex/cid/f0fb4b55508804ca.html (accessed on 25 January 2021); these data were removed from the official website recently). The meteorological data used to drive the CLM5 model were CRUNCEP7 (https://rda.ucar.edu/datasets/ds314.3 (accessed on 19 November 2020)). The other data in this study are available upon reasonable request to the corresponding author (C. Fu, [email protected]).

Conflicts of Interest

The authors declare no conflict of interest.

References

  1. Xu, F.; Dawson, R.W.; Tao, S.; Cao, J.; Li, B.G. A method for lake ecosystem health assessment: An Ecological Modeling Method (EMM) and its application. Hydrobiologia 2001, 443, 159–175. [Google Scholar] [CrossRef]
  2. Kosamu, I.B.M.; Makwinja, R.; Kaonga, C.C.; Mengistou, S.; Kaunda, E.; Alamirew, T.; Njaya, F. Application of DPSIR and Tobit Models in Assessing Freshwater Ecosystems: The Case of Lake Malombe, Malawi. Water 2022, 14, 619. [Google Scholar] [CrossRef]
  3. Luo, M.; Liu, T.; Meng, F.H.; Duan, Y.C.; Bao, A.M.; Xing, W.; Feng, X.W.; De Maeyer, P.; Frankl, A. Identifying climate change impacts on water resources in Xinjiang, China. Sci. Total Environ. 2019, 676, 613–626. [Google Scholar] [CrossRef]
  4. Wang, W.; Samat, A.; Ma, L.; Ge, Y.; Abuduwaili, J. Spatio-temporal variations and trend analysis of lake area in Xinjiang in 1986–2019. Acta Ecol. Sin. 2022, 42, 1300–1314. [Google Scholar] [CrossRef]
  5. Fu, C.; Wu, H.; Zhu, Z.; Song, C.; Xue, B.; Wu, H.; Ji, Z.; Dong, L. Exploring the potential factors on the striking water level variation of the two largest semi-arid-region lakes in northeastern Asia. CATENA 2021, 198, 105037. [Google Scholar] [CrossRef]
  6. Zhang, Y.; Long, A.; Lv, T.; Deng, X.; Wang, Y.; Pang, N.; Lai, X.; Gu, X. Trends, Cycles, and Spatial Distribution of the Precipitation, Potential Evapotranspiration and Aridity Index in Xinjiang, China. Water 2023, 15, 62. [Google Scholar] [CrossRef]
  7. Dong, T.; Liu, J.; Liu, D.; He, P.; Li, Z.; Shi, M.; Xu, J. Spatiotemporal variability characteristics of extreme climate events in Xinjiang during 1960–2019. Environ. Sci. Pollut. Res. 2023, 30, 57316–57330. [Google Scholar] [CrossRef] [PubMed]
  8. Ma, L.; Wu, J.L.; Liu, W.; Abuduwaili, J. Distinguishing between anthropogenic and climatic impacts on lake size: A modeling approach using data from Ebinur Lake in arid northwest China. J. Limnol. 2014, 73, 350–357. [Google Scholar] [CrossRef]
  9. Rahimi, A.; Breuste, J. Why is Lake Urmia Drying up? Prognostic Modeling With Land-Use Data and Artificial Neural Network. Front. Environ. Sci. 2021, 9, 603916. [Google Scholar] [CrossRef]
  10. Plug, L.J.; Walls, C.; Scott, B.M. Tundra lake changes from 1978 to 2001 on the Tuktoyaktuk Peninsula, western Canadian Arctic. Geophys. Res. Lett. 2008, 35, L03502. [Google Scholar] [CrossRef]
  11. Zhou, J.; Wang, L.; Zhang, Y.; Guo, Y.; Li, X.; Liu, W. Exploring the water storage changes in the largest lake (Selin Co) over the Tibetan Plateau during 2003–2012 from a basin-wide hydrological modeling. Water Resour. Res. 2016, 51, 8060–8086. [Google Scholar] [CrossRef]
  12. Zhang, G.; Yao, T.; Chen, W.; Zheng, G.; Shum, C.; Yang, K.; Piao, S.; Sheng, Y.; Yi, S.; Li, J.; et al. Regional differences of lake evolution across China during 1960s-2015 and its natural and anthropogenic causes. Remote Sens. Environ. 2019, 221, 386–404. [Google Scholar] [CrossRef]
  13. Qi, C.; You, B.; Chang, Y. Analysis of water quality verification and monitoring results of Bosten Lake. Arid Environ. Monit. 2019, 33, 159–162. [Google Scholar]
  14. Ji, F.; Shen, J.; Ma, X.; Xiong, L.; Sun, X.; Sun, L. Analysis on water quality changes and causes of Wulungu Lake. J. Hydroecol. 2018, 39, 61–66. [Google Scholar] [CrossRef]
  15. Xin, H.; Chen, Z.; Wu, L. Water quality status and nutrition assessment of Ebinur Lake. J. Salt Lake Res. 2010, 18, 30–34. [Google Scholar]
  16. Luan, H. Temporal and Spatial Distribution of Main Physical and Chemical Factors and Water Quality Evaluation of Sailimu Lake. Master’s Thesis, Dalian Ocean University, Dalian, China, 2014. [Google Scholar]
  17. Yang, L. Effect of Hydrometeorological Elements Change on Water Level of Bosten Lake in Yanqi Basin. Master’s Thesis, Lanzhou University, Lanzhou, China, 2019. [Google Scholar]
  18. Li, Y.; Chen, Y.; Zhang, Q.; Fang, G. Analysis of the change in water level and its influencing factors on Bosten Lake from 1960 to 2018. Arid Zone Res. 2021, 38, 48–58. [Google Scholar] [CrossRef]
  19. Zhai, M.; Gao, F.; Liu, K.; Jiang, F. Characteristics and Attribution Identification of Runoff Variation in the Source Area of Ulungur River Based on the Budyko Hypothesis. Water Resour. Power 2023, 41, 44–48. [Google Scholar] [CrossRef]
  20. Wei, B. Dynamic Change of Ebinur Lake Area in Recent 45 Years Research on Its Driving Mechanism. Master’s Thesis, Shandong University of Science and Technology, Qingdao, China, 2018. [Google Scholar]
  21. Bayinzhahan; Zhang, D. Exploring the method of determining the minimum ecological water level in the Sailimu Lake basin in Xinjiang. Ground Water 2020, 42, 182–185. [Google Scholar] [CrossRef]
  22. Wu, H.W.; Fu, C.S.; Zhang, C.C.; Zhang, J.M.; Wei, Z.W.; Zhang, X.P. Temporal Variations of Stable Isotopes in Precipitation from Yungui Plateau: Insights from Moisture Source and Rainout Effect. J. Hydrometeorol. 2022, 23, 39–51. [Google Scholar] [CrossRef]
  23. Cao, Y.; Fu, C.; Wu, H.; Wu, H.; Zhang, H.; Yang, M.; Ji, Z.; Yu, M.; Dong, L. Exploring Methods to Estimate Ice Sublimation and Total Water Vapor Flux of Large Lakes in China. J. Geophys. Res. Atmos. 2023, 127, e2022JD037095. [Google Scholar] [CrossRef]
  24. Fisher, R.A.; Wieder, W.R.; Sanderson, B.M.; Koven, C.D.; Oleson, K.W.; Xu, C.G.; Fisher, J.B.; Shi, M.J.; Walker, A.P.; Lawrence, D.M. Parametric Controls on Vegetation Responses to Biogeochemical Forcing in the CLM5. J. Adv. Model. Earth Syst. 2019, 11, 2879–2895. [Google Scholar] [CrossRef]
  25. Kay, J.E.; Deser, C.; Phillips, A.; Mai, A.; Hannay, C.; Strand, G.; Arblaster, J.M.; Bates, S.C.; Danabasoglu, G.; Edwards, J.; et al. The Community Earth System Model (CESM) large ensemble project A Community Resource for Studying Climate Change in the Presence of Internal Climate Variability. Bull. Am. Meteorol. Soc. 2015, 96, 1333–1349. [Google Scholar] [CrossRef]
  26. Lawrence, D.M.; Fisher, R.A.; Koven, C.D.; Oleson, K.W.; Swenson, S.C.; Bonan, G.; Collier, N.; Ghimire, B.; van Kampenhout, L.; Kennedy, D.; et al. The Community Land Model Version 5: Description of New Features, Benchmarking, and Impact of Forcing Uncertainty. J. Adv. Model. Earth Syst. 2019, 11, 4245–4287. [Google Scholar] [CrossRef]
  27. DeRepentigny, P.; Jahn, A.; Holland, M.M.; Smith, A. Arctic Sea Ice in Two Configurations of the CESM2 During the 20th and 21st Centuries. J. Geophys. Res. Ocean. 2020, 125, e2020JC016133. [Google Scholar] [CrossRef]
  28. Katul, G.G.; Oren, R.; Manzoni, S.; Higgins, C.; Parlange, M.B. Evapotranspiration: A process driving mass transport and energy exchange in the soil-plant-atmosphere-climate system. Rev. Geophys. 2012, 50, RG3002. [Google Scholar] [CrossRef]
  29. McVicar, T.R.; Roderick, M.L.; Donohue, R.J.; Li, L.; Van Niel, T.G.; Thomas, A.; Grieser, J.; Jhajharia, D.; Himri, Y.; Mahowald, N.M.; et al. Global review and synthesis of trends in observed terrestrial near-surface wind speeds: Implications for evaporation. J. Hydrol. 2012, 416, 182–205. [Google Scholar] [CrossRef]
  30. Arnold, J.G.; Srinivasan, R.; Muttiah, R.S.; Williams, J.R. Large area hydrologic modeling and assessment—Part 1: Model development. J. Am. Water Resour. Assoc. 1998, 34, 73–89. [Google Scholar] [CrossRef]
  31. Neitsch, S.L.; Arnold, J.G.; Kiniry, J.R.; Williams, J.R. Soil and Water Assessment Tool Theoretical Documentation Version 2005; Texas Water Resources Institute: Temple, TX, USA, 2006. [Google Scholar]
  32. Arnold, J.G.; Moriasi, D.N.; Gassman, P.W.; Abbaspour, K.C.; White, M.J.; Srinivasan, R.; Santhi, C.; Harmel, R.D.; van Griensven, A.; Van Liew, M.W.; et al. SWAT: Model use, Calibration, and Validation. Trans. ASABE 2012, 55, 1491–1508. [Google Scholar] [CrossRef]
  33. Fu, C.S.; James, A.L.; Yao, H.X. SWAT-CS: Revision and testing of SWAT for Canadian Shield catchments. J. Hydrol. 2014, 511, 719–735. [Google Scholar] [CrossRef]
  34. Fu, C.S.; Lee, X.; Griffis, T.J.; Baker, J.M.; Turner, P.A. A Modeling Study of Direct and Indirect N2O Emissions From a Representative Catchment in the US Corn Belt. Water Resour. Res. 2018, 54, 3632–3653. [Google Scholar] [CrossRef]
  35. King, K.W.; Arnold, J.G.; Bingner, R.L. Comparison of Green-Ampt and curve number methods on Goodwin Creek Watershed using SWAT. Trans. ASABE 1999, 42, 919–925. [Google Scholar] [CrossRef]
  36. Kannan, N.; Santhi, C.; Williams, J.R.; Arnold, J.G. Development of a continuous soil moisture accounting procedure for curve number methodology and its behaviour with different evapotranspiration methods. Hydrol. Process. 2008, 22, 2114–2121. [Google Scholar] [CrossRef]
  37. Mallat, S.G. A theory for multiresolution signal decomposition—The wavelet representation. IEEE Trans. Pattern Anal. Mach. Intell. 1989, 11, 674–693. [Google Scholar] [CrossRef]
  38. Martinez, B.; Amparo Gilabert, M. Vegetation dynamics from NDVI time series analysis using the wavelet transform. Remote Sens. Environ. 2009, 113, 1823–1842. [Google Scholar] [CrossRef]
  39. Fu, C.; James, A.L.; Yao, H. Investigations of uncertainty in SWAT hydrologic simulations: A case study of a Canadian Shield catchment. Hydrol. Process. 2015, 29, 4000–4017. [Google Scholar] [CrossRef]
  40. Wu, H.; Wang, N.; Jiang, X.; Guo, Z. Variations in water level and glacier mass balance in Nam Co lake, Nyaincientanglha range, Tibetan Plateau, based on ICESat data for 2003-09. Ann. Glaciol. 2014, 55, 239–247. [Google Scholar] [CrossRef]
  41. Gao, F.; He, B.; Yan, Z.; Xue, S.; Li, Y. Analysis of the changes and driving force of the water area in the Ulungur Lake over the past 40 years. J. Water Supply Res. Technol.-Aqua 2020, 69, 500–511. [Google Scholar] [CrossRef]
  42. Ge, X. Analysis of Lake Surface Change and Natural Driving Factors in Ebinur Lake Based on Machine Learning in Recent 30a. Master’s Thesis, Xinjiang University, Urumqi, China, 2019. [Google Scholar]
  43. Chai, H.X.; Cheng, W.M.; Zhou, C.H.; Zhao, S.M.; Liu, H.J. Climate effects on an inland alpine lake in Xinjiang, China over the past 40 years. J. Arid Land 2013, 5, 188–198. [Google Scholar] [CrossRef]
  44. Liu, L. Analysis of the Hydrological Characteristics and Water Balance of Bosten Lake. Master’s Thesis, Sichuan Normal University, Chengdu, China, 2012. [Google Scholar]
  45. Yang, C. Analysis calculation on water and balance of Aibi Lake. Arid Land Geogr. 1990, 4, 36–39. [Google Scholar] [CrossRef]
  46. Zhang, H. An Integrated Modeling of Groundwater-Surface Water Interaction in the Kaidu River Basin. Master’s Thesis, Nanjing University, Nanjing, China, 2016. [Google Scholar] [CrossRef]
  47. Wang, Y.; Liu, Z.; Yao, J.; Bayin, C. Effect of Climate and Land Use Change in Ebinur Lake Basin during the Past Five Decades on Hydrology and Water Resources. Water Resour. 2017, 44, 204–215. [Google Scholar] [CrossRef]
  48. Box, J.E.; Steffen, K. Sublimation on the Greenland Ice Sheet from automated weather station observations. J. Geophys. Res. Atmos. 2001, 106, 33965–33981. [Google Scholar] [CrossRef]
  49. Zuo, H.; Chen, B.; Wang, S.; Guo, Y.; Zuo, B.; Wu, L.; Gao, X. Observational study on complementary relationship between pan evaporation and actual evapotranspiration and its variation with pan type. Agric. For. Meteorol. 2016, 222, 1–9. [Google Scholar] [CrossRef]
  50. Liu, Y. Soil Alteration and Water Loss in the Tarim River Basin. J. Hydroecol. 2022, 43, 105–112. [Google Scholar] [CrossRef]
  51. Wang, Z.; Cheng, T.; Liu, K.; Jiang, H. Water resources and its features in Ulungur River Watershed, Xinjiang. Arid Land Geogr. 2000, 23, 123–128. [Google Scholar] [CrossRef]
  52. Dai, J. Study on changes of runoff and sediment content in Boltala River Basin, Xinjiang. Heilongjiang Sci. Technol. Water Conserv. 2014, 42, 35–36. [Google Scholar] [CrossRef]
  53. Li, Y.; Chu, X.; Jin, H. Study on changes of hydrological characteristics of Ebinur Lake Basin in Xinjiang. J. China Hydrol. 2006, 5, 68–71. [Google Scholar]
Figure 1. The four study lakes in the present study. (a) Bosten Lake. (b) Ulungur Lake. (c) Ebinur Lake. (d) Sayram Lake. (e) Spatial distribution of the selected lakes.
Water 15 03354 g001
Figure 2. Schematic figure illustrating the main analyses and methods.
Water 15 03354 g002
Figure 3. Comparison of annual average values of lake water cycle components in four lakes during the study period.
Water 15 03354 g003
Figure 4. Pearson correlation coefficients between lake area (km2), river inflow (108 m3), TWVF (108 m3), lake surface precipitation (108 m3), lake ice sublimation (108 m3), and river outflow (108 m3). (a) Bosten Lake. (b) Ulungur Lake. (c) Ebinur Lake. (d) Sayram Lake.
Water 15 03354 g004
Figure 5. The time-series data for river inflow, TWVF, lake ice sublimation, lake surface precipitation, and river outflow were analyzed to understand the changes in the four lakes’ areas. (af) for Bosten Lake; (gk) for Ulungur Lake; (lp) for Ebinur Lake; (qt) for Sayram Lake. The solid red lines represent the linear downward trend fitted to the entire series of years, while the solid blue lines represent the linear upward trend fitted to the entire series of years. The dashed lines indicate the trend for segmented years.
Water 15 03354 g005
Figure 6. Comparisons between multi-decadal variations in lake water cycle components in the four lakes. (a,b) Bosten Lake; (c,d) Ulungur Lake; (e,f) Ebinur Lake; (g,h) Sayram Lake.
Water 15 03354 g006
Figure 7. The role played by lake water cycle components in lake water balance. In the case of Bosten Lake and Ulungur Lake, the river inflow represents the runoff from the Kaidu River and Ulungur River, respectively. As for Ebinur Lake, the river inflow comprises the combined runoff from the Jing River and Bortala River. The river outflow represents the runoff of Kongque River.
Water 15 03354 g007
Figure 8. The inter-annual variations in TWVF rate, average air temperature, and solar radiation in the four lakes. The solid line is the linear fit line for the three variables. (a) Bosten Lake. (b) Ulungur Lake. (c) Ebinur Lake. (d) Sayram Lake.
Water 15 03354 g008
Figure 9. Groundwater inflow into Bosten Lake in 1975 and during the years 1981–1985. The red line represents the total amount of groundwater recharge to the lake equal to the total amount of lake recharge to the groundwater.
Water 15 03354 g009
Figure 10. Groundwater level changes in (a) (Bosten Lake), and (b) (Ebinur Lake). The groundwater level data in the figure were obtained from Zhang [46] and Wang et al. [47], respectively. The red lines represent the linear downward trend fitted to the series of years.
Water 15 03354 g010
Figure 11. Comparisons of annual TWVF results of CLM model and evaporating pan in the four lakes.
Water 15 03354 g011
Table 1. Detailed information on the four lakes. The ice cover length was calculated using the Community Land Model (CLM). The area of Bosten Lake, Ulungur Lake, Ebinur Lake, and Sayram Lake in this table is the average value for 1961–2013, 1991–2017, 1992–2017, and 1975–2013, respectively.
Lake NameAltitude (m)Winter Temperature (°C)Annual Ice Cover Length (days)Area (km2)Water Volume (108 m3)Lake Depth (Average vs. Maximum, in meters)Water Retention (days)Salinity (g L−1)
Bosten Lake1052−8.4771047.8758 vs. 1630611.05 [13]
Ulungur Lake480−17.0128944.9598 vs. 1734031.98 [14]
Ebinur Lake189−12.5112872.181.4 vs. 2.8/142.74 [15]
Sayram Lake2072−12.5147458.621056 vs. 92/3.58 [16]
Table 2. Changes in average lake area (km2), river inflow (108 m3), TWVF (108 m3), lake ice sublimation (108 m3), lake surface precipitation (108 m3), and river outflow (108 m3) at the lakes in different phases.
Lake NamePhaseLake AreaRiver
Inflow
TWVF Sublimation Precipitation River
Outflow
Bosten LakeFirst phase (1961–1987)1065.5622.2410.440.390.737.55
Second phase (1988–2002)1050.9729.8910.280.630.9510.26
Difference from previous phase−14.597.66-0.160.240.222.71
Third phase (2003–2013)999.8424.4012.010.390.7211.42
Difference from previous phase−51.13−5.491.73−0.24−0.231.16
Ulungur LakeFirst phase (1977–1990)906.489.267.690.390.95/
Second phase (1991–2013)941.6110.007.780.471.29/
Difference from previous phase35.130.740.090.080.34/
Ebinur LakeFirst phase (1980–1997)532.9716.554.410.230.60/
Second phase (1998–2003)681.8920.175.470.310.89/
Difference from previous phase148.923.621.060.080.29/
Third phase (2004–2016)521.8418.164.290.240.77/
Difference from previous phase−160.05−2.01−1.18−0.07−0.12/
Sayram LakeFirst phase (1975–1990)455.43/3.430.430.88/
Second phase (1991–2013)459.42/3.330.461.26/
Difference from previous phase3.99/−0.100.030.37/
Disclaimer/Publisher’s Note: The statements, opinions and data contained in all publications are solely those of the individual author(s) and contributor(s) and not of MDPI and/or the editor(s). MDPI and/or the editor(s) disclaim responsibility for any injury to people or property resulting from any ideas, methods, instructions or products referred to in the content.

