Article

Risks of Antibiotic Resistance Dissemination by Leachates from Municipal Landfills of Different Ages

1
Faculty of Biology, University of Latvia, 1 Jelgavas Str., LV-1004 Riga, Latvia
2
Latvian Biomedical Research and Study Centre, 1 Ratsupites Str., LV-1067 Riga, Latvia
3
Institute of Food Safety, Animal Health and Environment, BIOR, 3 Lejupes Str., LV-1076 Riga, Latvia
4
Getliņi EKO Ltd., 57 Kaudzisu Str., Rumbula, LV-2121 Ropažu, Latvia
*
Author to whom correspondence should be addressed.
Water 2023, 15(19), 3349; https://doi.org/10.3390/w15193349
Submission received: 11 August 2023 / Revised: 21 September 2023 / Accepted: 22 September 2023 / Published: 24 September 2023
(This article belongs to the Special Issue Biodiversity and Ecosystem Services in Rivers)

Abstract

:
Landfill leachate is regarded as a significant point source of pollutants that may pose a hazard to the environment, particularly to surface and ground waters. Leachates are highly variable and heterogeneous. Our study was focused on the characterization of landfill leachates derived from young (YDS) and matured (MDS) dumpsites in terms of the abundance of micropollutants, antimicrobial resistance genes (ARG), and microbial community structure. The concentrations of poly- and perfluoroalkyl substances (PFASs) were found to be higher in MDS compared to YDS, i.e., 13.19 and 7.16 μg/L, respectively. Among pharmaceutical compounds, ibuprofen was detected at the highest concentrations, i.e., 12.54, 12.81, and 13.13 μg/L, in the leachates derived from MDS, YDS, and ponds. The distribution of bacteria, archaea, eukaryotes, and viruses in the three leachate samples was as follows: 85.15 ÷ 88.04%, 9.13 ÷ 12.29%, 2.20 ÷ 2.68%, and 0.12 ÷ 0.15%, respectively. In total, 31 distinct families of ARGs were identified, comprising a total of 80 ARGs. Incubation of P. putida MSCL650 in sterile leachate from the pond resulted in decreasing the minimum inhibitory concentrations for six antibiotics as compared to cells incubated in nutrient broth. Hydrological processes, i.e., runoff and infiltration, can increase the dissemination of ARGs.

1. Introduction

The worldwide use of antibiotics stimulates the evolution of bacterial resistance to antibiotics due to selection pressure, which poses a global health burden. In this respect, the dissemination paths of antibiotic resistance genes (ARG) from anthropogenic sources represent an important area of research. The main sources of antibiotics, antibiotic-resistant bacteria (ARB), and ARG are as follows: wastewater treatment plants, sewer runoff, pharmaceutical manufacturers, hospitals, agricultural and animal industrial sources, and estuaries, as well as landfill leachate [1,2,3].
According to EU Council recommendations in 2022, strengthening the environmental monitoring of antimicrobial resistance (AMR) in groundwater and surface waters is needed to combat AMR according to the One Health approach [4].
Furthermore, the role of environmental (ambient) waters in the development, transmission, and spread of AMR should be prioritized as well [5]. Several critical issues related to effectively tackling the spread of AMR still remain unclear, e.g., (i) what kind and levels of ARGs in water carry a risk of acquiring resistant infections; (ii) what are the key hotspots for horizontal transfer of ARGs; (iii) which environmental factors elevate the selective pressure for maintenance of ARGs; and (iv) what are the best monitoring approaches [6,7]. The impact of four domains, i.e., mankind, livestock, agriculture, and the ecosystem, should be recognized [8].
Micropollutants act as stressors, sharing a similar stimulating mechanism through several changes in bacterial gene expression. Among the stressors affecting ARG dissemination in waters are pharmaceutical compounds (PC), plastics, poly- and perfluoroalkyl substances (PFAS), heavy metals, and others [9,10,11,12].
Since these stressors are present in wastewater almost everywhere at trace levels, controlling the conditions that cause stress is extremely difficult [13].
Over 1000 ARG subtypes have evolved and multiplied because of prolonged antibiotic treatments, and the diversity of the microbial communities in wastewater sludge has been reduced [2,9,14]. The potential impact of PC on the spread of AMR through wastewater effluents can be evaluated by “predicted no-effect concentrations” (PNECs). The list of PCs currently published by the pharmaceutical manufacturing industry includes 125 antibiotics. However, this list does not encompass all known antibiotics [15]. A recent statistical evaluation of the data has been performed using 0.05 μg/L of antibiotics as the default PNEC [15].
The high ubiquity, resistance to degradation, and potential toxicity of PFAS have recently received a lot of attention from environmental regulators and the general public. These micropollutants are derived from the textile finishing, semiconductor, paper, and chemical industries [10,16].
The EU Commission recently proposed to amend the Directive on Environmental Quality Standards (EQS) with additional quality standards for groundwater priority pollutants, e.g., PFAS (0.0044 PFOS equivalents), carbamazepine (0.25 µg/L), sulfamethoxazole (0.01 µg/L), a sum EQS for PC (0.25 µg/L), and a sum EQS for non-relevant pesticide metabolites (nrMs). It has been proposed by the Commission to assess PFAS substances, for which the sum of EQS shall be expressed as PFOA equivalents, using the Relative Potency Factor (RFP) approach [17]. The total PFOA emissions from landfills in the United States in 2013 were estimated to be 52 kg/year [18].
At present, the assessment of AMR hazards in the community remains challenging due to the heterogeneity of the sources and the lack of data on the genomic, biochemical, and community levels [8]. The relative impact of the environment versus the influence of different stress-inducing factors (e.g., bacteriophages, biocidal agents, heavy metals, detergents, pesticides, temperature, pH level, and others) should be evaluated in the context of AMR [8,19]. The transmission routes of ARG in the environment are studied for informing and improving policy and monitoring systems, as well as identifying the relevant sampling locations and potential intervention points [20]. Among the potential routes of ARG transmission are surface waters (designated bathing areas, lakes, estuaries), groundwater resources and their vulnerability, municipal water supplies, and others [20].
Landfill leachate is regarded as a significant point source of pollutants that may pose a hazard to the environment, particularly to surface and groundwater. In the context of AMR dissemination risks, recent studies have characterized landfill leachates in terms of microbial community structure [12], viral abundance and related bacterial hosts [21], AMR abundance [22], the concentration of micropollutants (e.g., PC and PFAS) [23,24,25,26], seasonal variations [27], and a comparison between different landfills [28]. Nevertheless, more research is needed to evaluate the potential risks of AMR dissemination from landfills in order to reveal common trends and specific differences regarding local landfills.
Our study was performed with leachates from the Getlini landfill, which has served Riga and the surrounding municipalities since 1973, collecting about half of the municipal waste volume produced in Latvia. It was hypothesized that landfill leachates derived from young (YDS) and matured (MDS) dumpsites, as well as leachate ponds, would differ in terms of micropollution, ARG abundance, microbial community structure, and the risks of AMR induction by leachates. The dumpsites of different ages differed by waste composition and stage of waste decomposition and might have distinct differences in the aforementioned parameters.

2. Materials and Methods

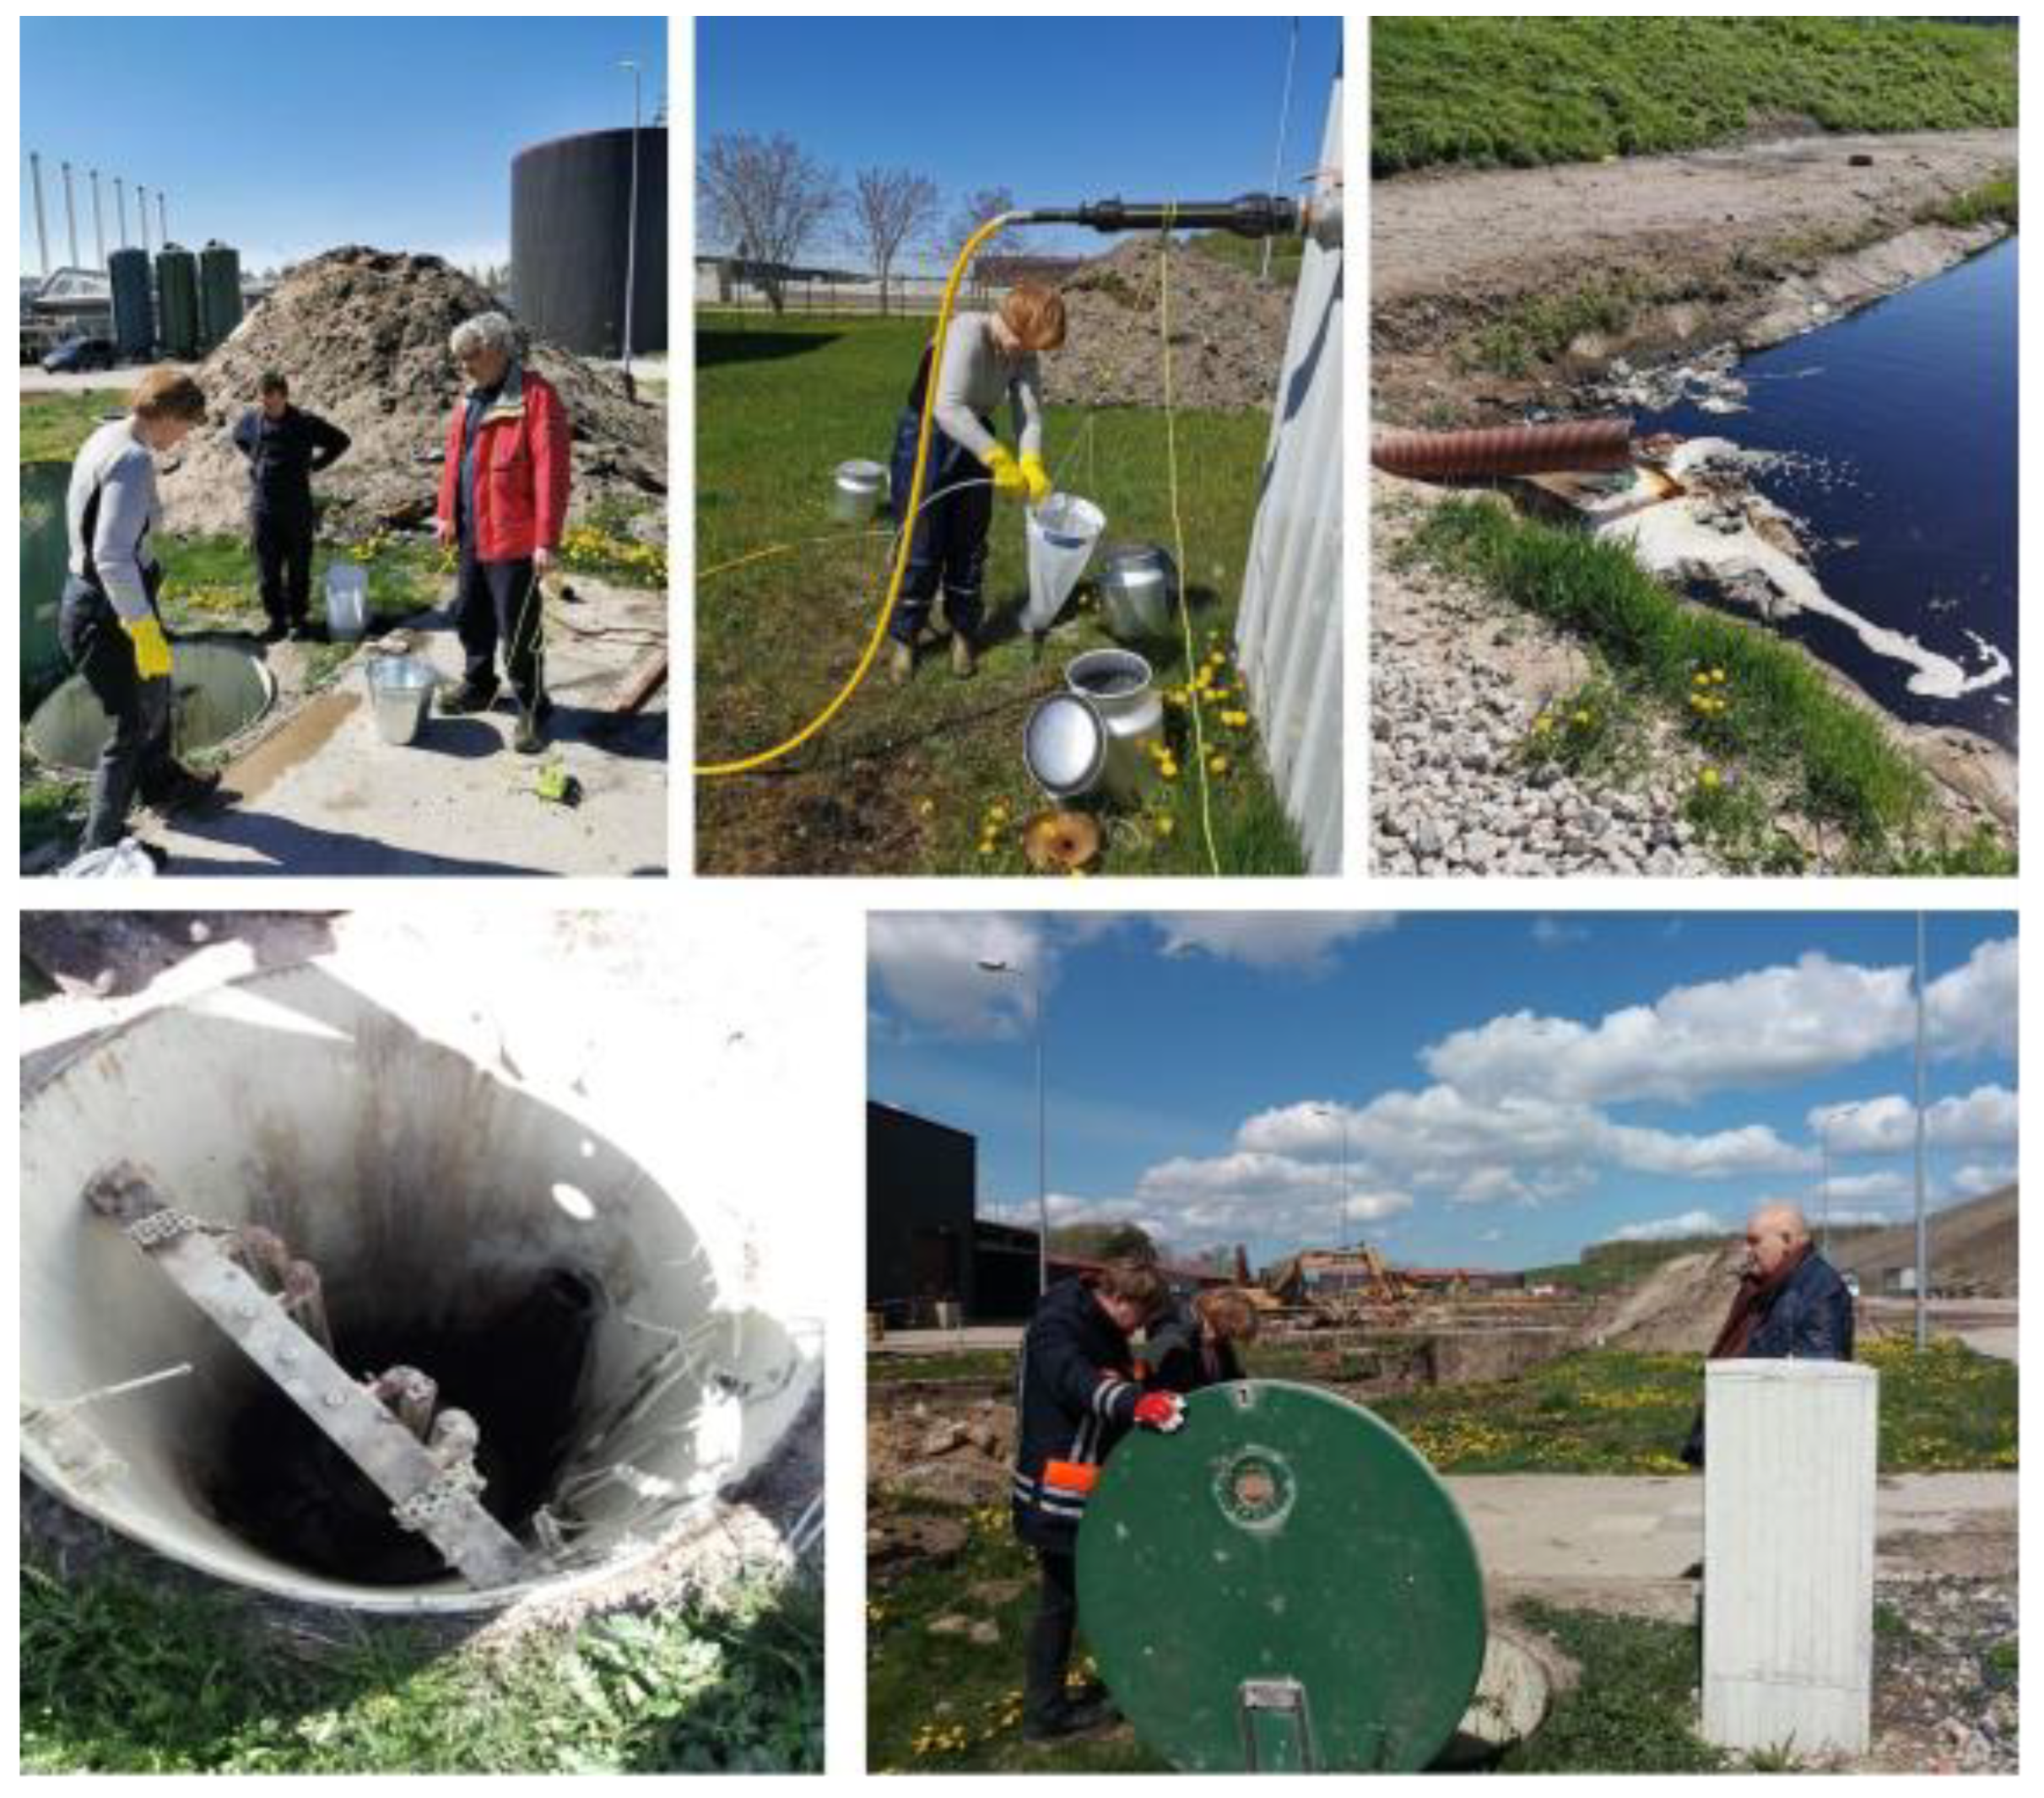
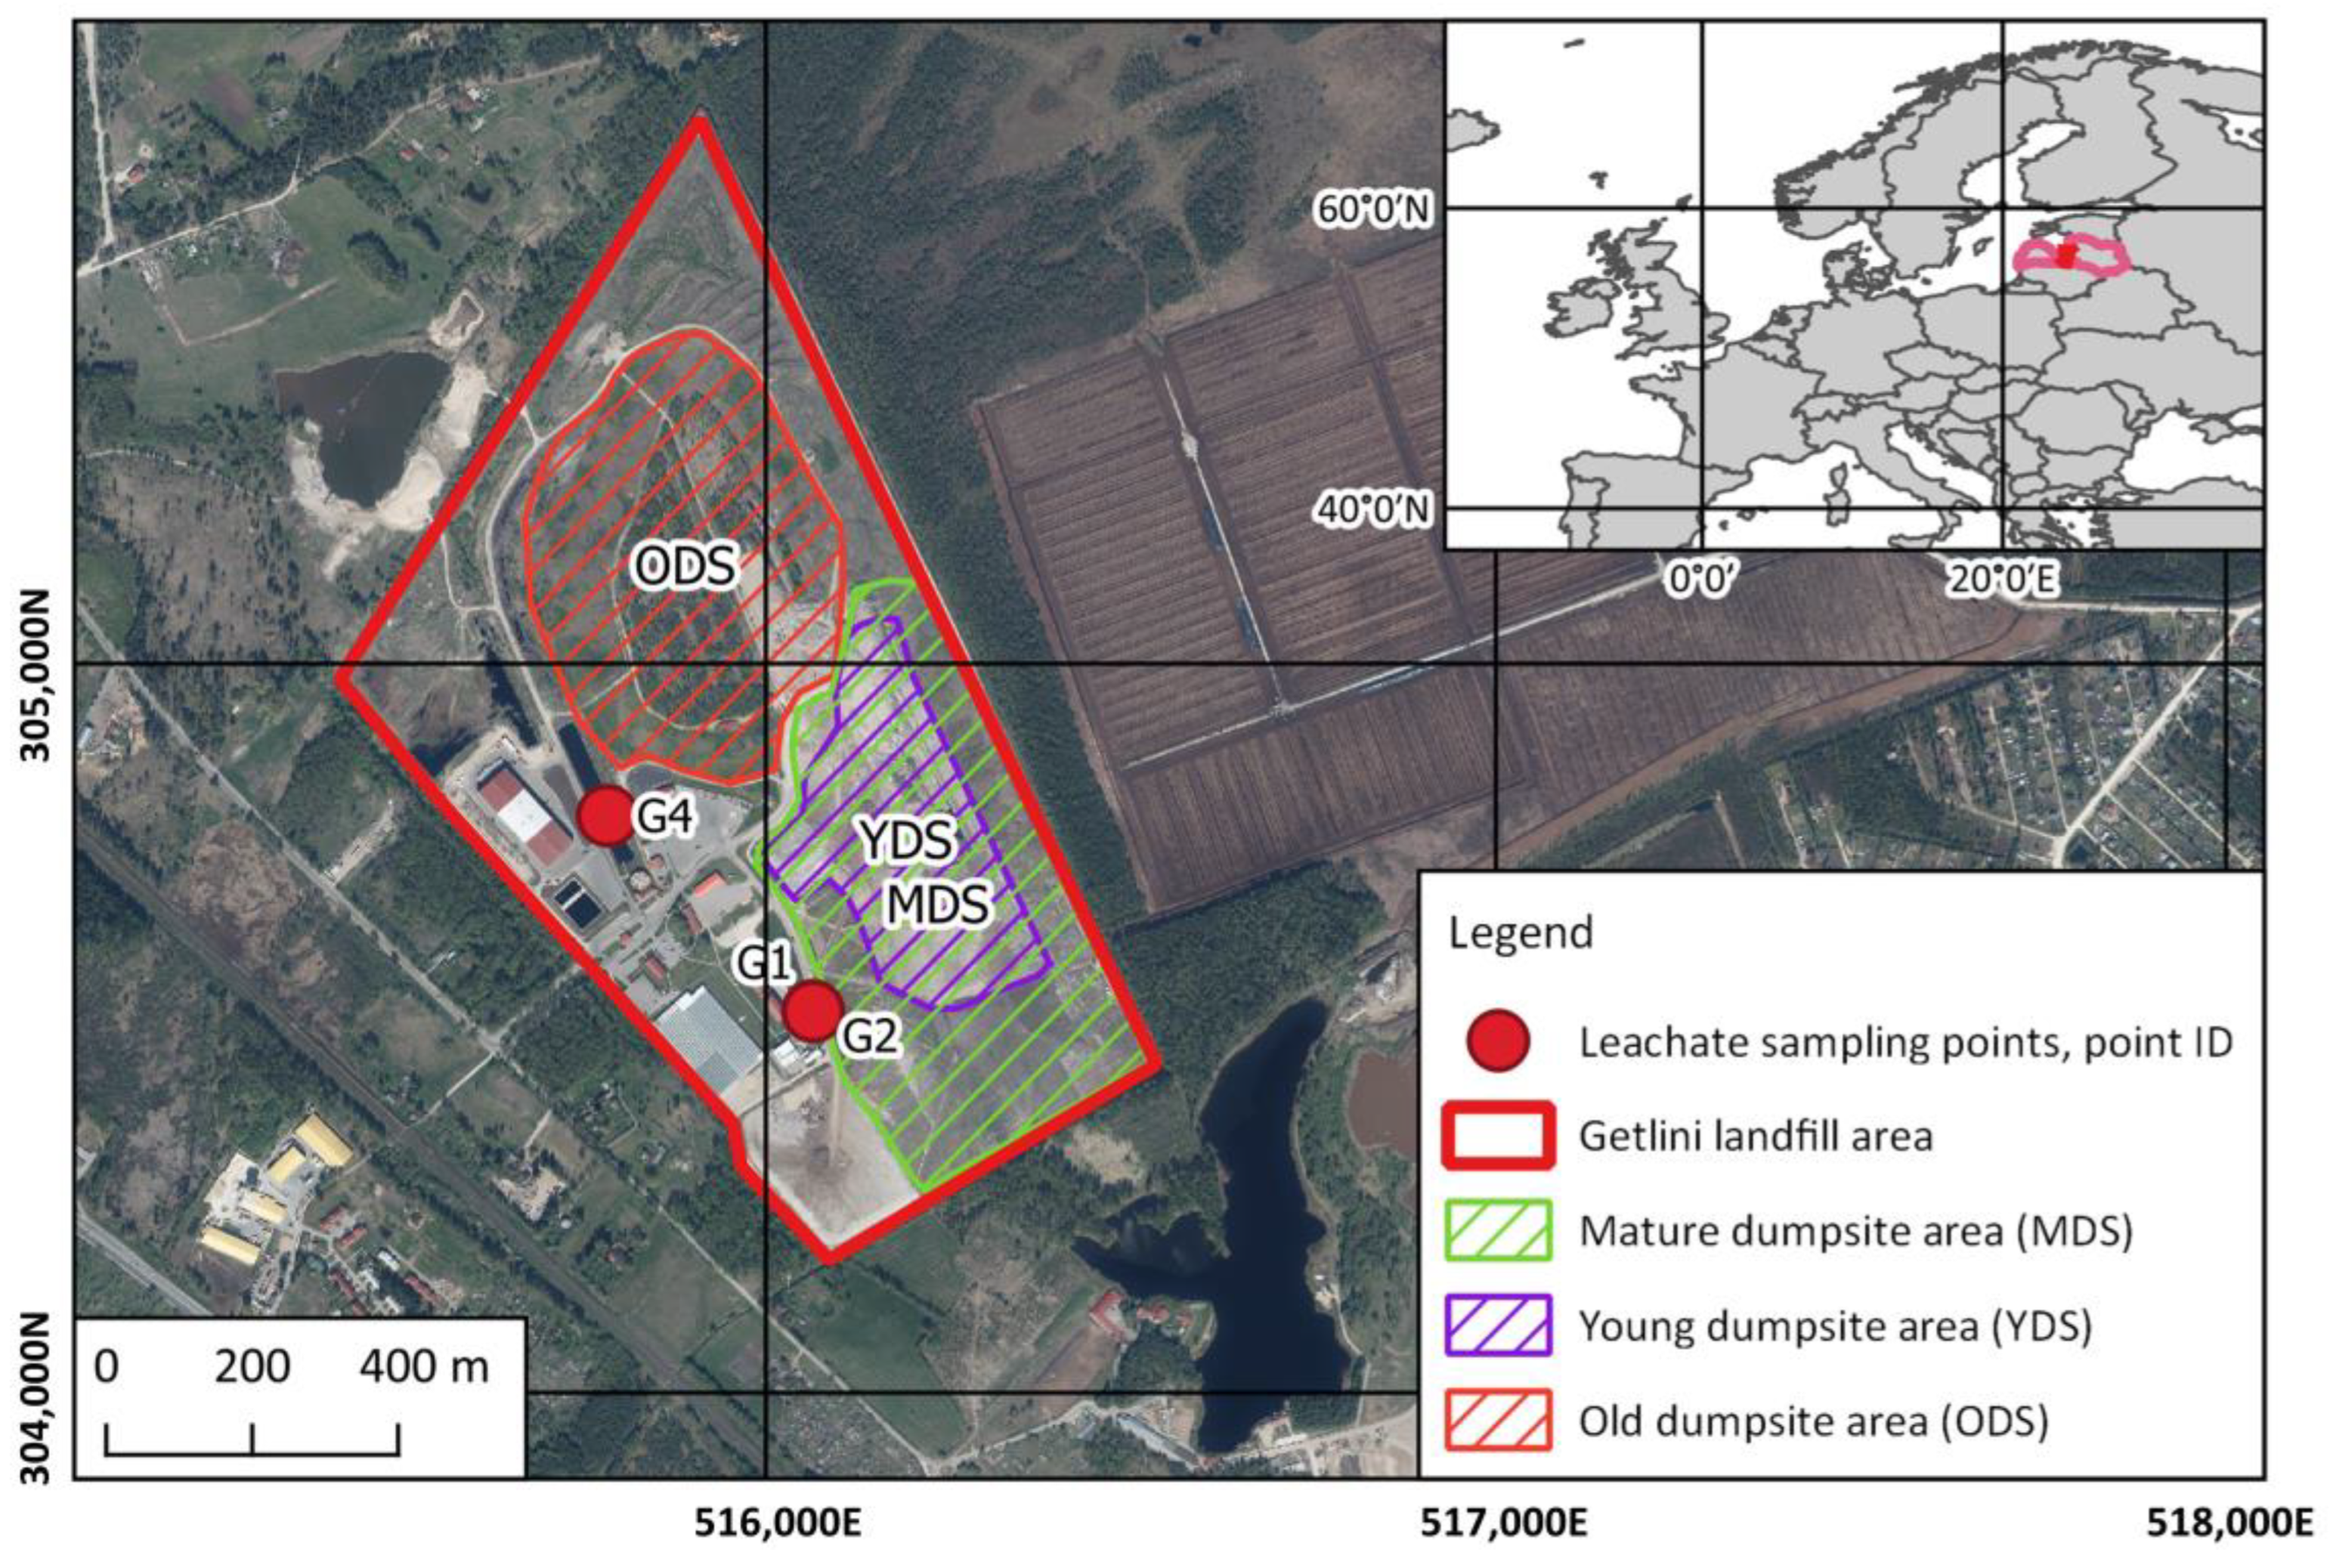
2.1. Characterization of the Getlini Landfill and Leachate Collection

Landfill leachates were obtained at the Getlini municipal solid waste landfill, which is managed by SIA Getlini EKO (Riga, Latvia) (Figure 1). Getlini MSW landfill area is 87 hectares, and it currently receives 700–1000 tons of waste daily, amounting to ~215 thousand tons per year. Getlini landfill operations started in 1973 as a municipal and industrial waste dumpsite for the city of Riga. The initial dumpsite was located in an abandoned sand quarry, but later, it expanded on the adjacent Getlini Bog. Major changes in the landfill operation started in 1996 when a project financed by the World Bank was launched. The project included the closure and remediation of the old dumpsite (ODS in Figure 1) and the construction of modern, environmentally responsible waste disposal cells with leachate and landfill gas collection systems. Nowadays, the Getlini landfill continuously implements solutions that are environmentally friendly and minimize the volume of landfilled waste. The old dumpsite area does not have a leachate collection system, but some of the leachate seeping from the “waste hill” is collected in the leachate collection pond, where it mixes with the leachate from waste cells (MDS and YDS areas—see Figure 1). The MDS and YDS differ by waste composition and the duration of operation. In particular, the MDS has received mixed municipal wastes, inert wastes, and treated wastes for 10 years, then closed for 13 years until the sampling time. In turn, the YDS has received biological waste and operated since 2015 until the sampling time, i.e., May 2020. Leachate samples were taken in a collector manhole where outlets from the MDS leachate collection system (sample G1) and the YDS leachate collection system (sample G2) are accessible. A sample containing a mixture of all leachates, including leachate seeping from the old dumpsite area, was taken from the leachate collection pond (sample G4) (Figure 1 and Figure A1). All three samples were taken on one day, and the composite samples were obtained from ten individual samples taken for one hour.

2.2. Physicochemical Testing of Leachates

The pH value and electrical conductivity (EC) were measured using a WTW Multi9620 IDS with the SenTix 940 P and TetraCon 925 electrodes, respectively. The total nitrogen concentration was measured by Koroleff’s method and reaction with DMP, using a WTW photoLab S12 and WTW CR 420 thermoreactor, as well as the Spectroquant Nitrogen (total) 10–150 mg/L N kit (1.14763.0001). For measuring the N-NH4, a Spectroquant Ammonium Cell Test 4.0–80.0 mg/L N-NH4 kit (1.14559.0001) was applied based on the reaction with hypochlorites in a strong alkaline solution, followed by photometric determination with sodium nitroprusside using WTW photoLab S12. The chemical oxygen demand (COD) was determined using the Spectroquant COD Cell test 300–3500 mg/L kit (1.14691.0001) based on the reaction with potassium dichromate, sulfuric acid, and mercury (II) sulfate at 148 °C for 2 h, using the WTW photoLab S12 and WTW CR 420 thermoreactor.

2.3. Analytical Determination of Micropollutants

PFASs were analyzed according to the method described in [29], with some modifications in order to extend the scope of the analysis. Modifications were made in the HPLC gradient program, and detailed gradient ramps are provided below. Briefly, 5 mL of the leachate sample was diluted to 200 mL with ultrapure water and spiked with a methanolic solution containing 13C-labeled PFAS surrogates (5 ng of each component). The resulting sample extract aliquots were added to Strata-X-AW 33 m 200 mg/3 mL SPE (Phenomenex, Torrance, CA, USA) cartridges that had been provisionally preconditioned with 3 mL of 1% NH4OH in MeOH, 3 mL of MeOH, and 3 mL of reagent grade water at a flow rate of less than 5 mL min−1. After loading the columns with the sample, they were washed with 2% formic acid (1 mL) and MeOH (3 mL), dried for 30 min under vacuum, and then the analytes were eluted with 6 mL of 1% NH4OH in MeOH into a 10 mL glass vial. Before the HPLC-Orbitrap-MS analysis, the eluted extracts were concentrated to dryness under a moderate nitrogen stream at 30 °C and reconstituted with MeOH (100 µL). High-performance liquid chromatography coupled with Orbitrap high-resolution mass spectrometry (HPLC-Orbitrap-HRMS) was used for PFAS analysis. A Kinetex-C18 reversed-phase column (50 mm × 3.0 mm, 1.7 µm) was used to separate the target analytes with an injection volume of 5 µL for standard solutions and sample extracts. Analyte separation was performed at 40 °C with a mobile phase consisting of (A) 10 mM ammonium formate, 0.2% formic acid, methanol/water (1:9, v/v), and (B) methanol/acetonitrile (50:50 v/v). The effective gradient began at the initial composition (A/B) of 90:10 (v/v), which was held for 1.0 min, and then linearly ramped to an A/B ratio of 5:95 (v/v) over an 8.0 min period, where it was held for 4.0 min before returning to the initial conditions over 0.5 min. The column was equilibrated with the initial A/B ratio of 85:15 (v/v) for 3.0 min between the runs. The mobile phase flow rate was held constant at 0.3 mL min−1. The heated electrospray interface (HESI-II) operating in negative ionization mode was applied for the analysis. The parameters of HESI-II were the following: capillary temperature, 250 °C; electrospray voltage, 4.5 kV; sheath gas flow rate, 20 arbitrary units (AU); auxiliary gas flow rate, 5 AU. The mass spectrometric ion detection was performed in parallel reaction monitoring (PRM) mode with a resolving power of 17,500 FWHM; automatic gain control (AGC), 1.0 × 10⁵ with a maximum injection time of 200 ms. Two m/zm/z transitions were used for each analyte. The isotopic peak ratios and retention periods of the monitored ion transitions were used to identify the analytes. The permissible range for the isotope ratio of the target and confirmation transitions was established at 30% of the average value attained for the calibration standards from the same sequence. Spiked samples and materials from earlier proficiency tests (PT) were routinely incorporated into the QC technique as well as each sample sequence to assess the continuous recovery of target analytes. In each sample sequence, procedural blanks with added internal standards were evaluated. These blanks were prepared without a matrix, using only the chemicals specified in the analytical protocol, and subjected to the full analytical procedure.
A previously described procedure was used to test the PC [30]. Briefly, SPE and dilute-and-shoot techniques were used for sample preparation. On a 2D-HPLC–MS/MS device operating in PRM mode, instrumental analysis was performed by scanning two ion transitions for each chemical. On deionized water, multiple-level procedural calibration was used for quantification. In the reconstitution process, internal standards of salbutamol-d3 and ibuprofen-d3 were employed to account for the matrix effects in LC-MS/MS studies.

2.4. Characterization of Culturable Microorganisms

Using Biolog EcoPlate™ (Biolog, Inc., Biolog, Hayward, CA, USA), the catabolic diversity of the microbial population in leachates was identified. With EcoPlate™, the redox indicator tetrazolium dye produces a color that may be used to assess the metabolism of the substrate. Leachates were inoculated (100 µL) into each well, diluted with a sterile 0.85% NaCl solution, and then incubated for 72 h at 23 °C with periodic shaking and measurement (once per 24 h) using a TECAN Infinite F50 microplate reader (Switzerland). The results of Biolog profiles were presented by the Shannon diversity index, which was calculated by the following Eq1: H′ = −Σ pj log2 pj, where pj = relative color intensity of the individual well [31]. The ratio of the usage of N-containing substrates in the EcoPlate™ to the overall substrate utilization was computed to determine the nitrogen use index (NUSE) [32,33].

2.5. Testing of Microbial DNA in Leachates

2.5.1. DNA Extraction and Shotgun Sequencing

Using the manufacturer’s instructions, the FastDNA SPIN Kit for Soil (MP Bio-Medicals, Irvine, CA, USA) was used to isolate DNA from the samples. Normalized to the initial library input of 500 ng, DNA samples for the shotgun metagenomic studies were then sheared with a Covaris S220 Focused Ultrasonicator (Covaris, Woburn, MA, USA) to achieve an average fragment size of 400 bp. Following the manufacturer’s instructions, libraries were created using the MGIEasy Universal DNA Library Prep Set V1.0 (MGI Tech Co., Shenzhen, China). Using the Agilent High Sensitivity DNA kit on an Agilent 2100 Bioanalyzer (Agilent Technologies, Santa Clara, CA, USA) and the Qubit High Sensitivity dsDNA assay kit on a Qubit 2.0 instrument (both from Thermo Fisher Scientific, Waltham, MA, USA), quality control of the libraries was performed. The depth of the sequence was calculated to be at least 20 million reads per sample (paired-end read length of 150 bp). In order to prepare DNA nanoballs (DNBs), pooled and circularized libraries were employed as templates. The PE150 flow cell was loaded with DNBs via an automated DNB loading method. According to the established protocol, the libraries were sequenced with the DNBSEQ-G400 sequencer using the DNBSEQ-G400RS High-Throughput Sequencing Set (MGI Tech Co., Shenzhen, China).

2.5.2. Shotgun Sequencing Data Analysis

Trimmomatic v.0.39 [34] was used to perform quality trimming on the collected raw paired-end reads. Sequences less than 36 nt were ignored, and the leading and trailing quality levels were set to Q30 and Q30, respectively. Sequences were first quality-filtered, after which they were matched to the human genome reference (hg19), and bowtie2 [35] v.2.3.5.1 was used to eliminate complementary sequences. Sequences were then separated into paired files using bedtools2 and sorted by reading names using samtools [36]. The Kraken2 [37] program and internal Kraken2 database, which comprise taxonomical reference data on bacterial, fungal, viral, and protozoan domains, were used to obtain the taxonomic profile. The R-based Pavian [38] v1.0 tool was used to perform taxonomical aggregation. MetaSPAdes [39] assembler was used to accomplish de novo read assembly into scaffolds. The generated assembly was evaluated using MetaQuast [40]. The assembly database and the local alignment of input reads to assembly were performed using Bowtie2.

2.5.3. Identification of Microbial Resistance Genes

The Resistance Gene Identifier (RGI) v.5.1.1, the Comprehensive Antibiotic Resistance Database (CARD) [41], and the DIAMOND [42] alignment tool were used to create scaffolds to predict the resistome profile in the samples. The heat map function of RGI was used to organize resistance genes according to the drug class, gene family, and resistance mechanism in order to gather results for each sample. Additionally, hierarchical clustering was carried out to group samples according to how similar they were.

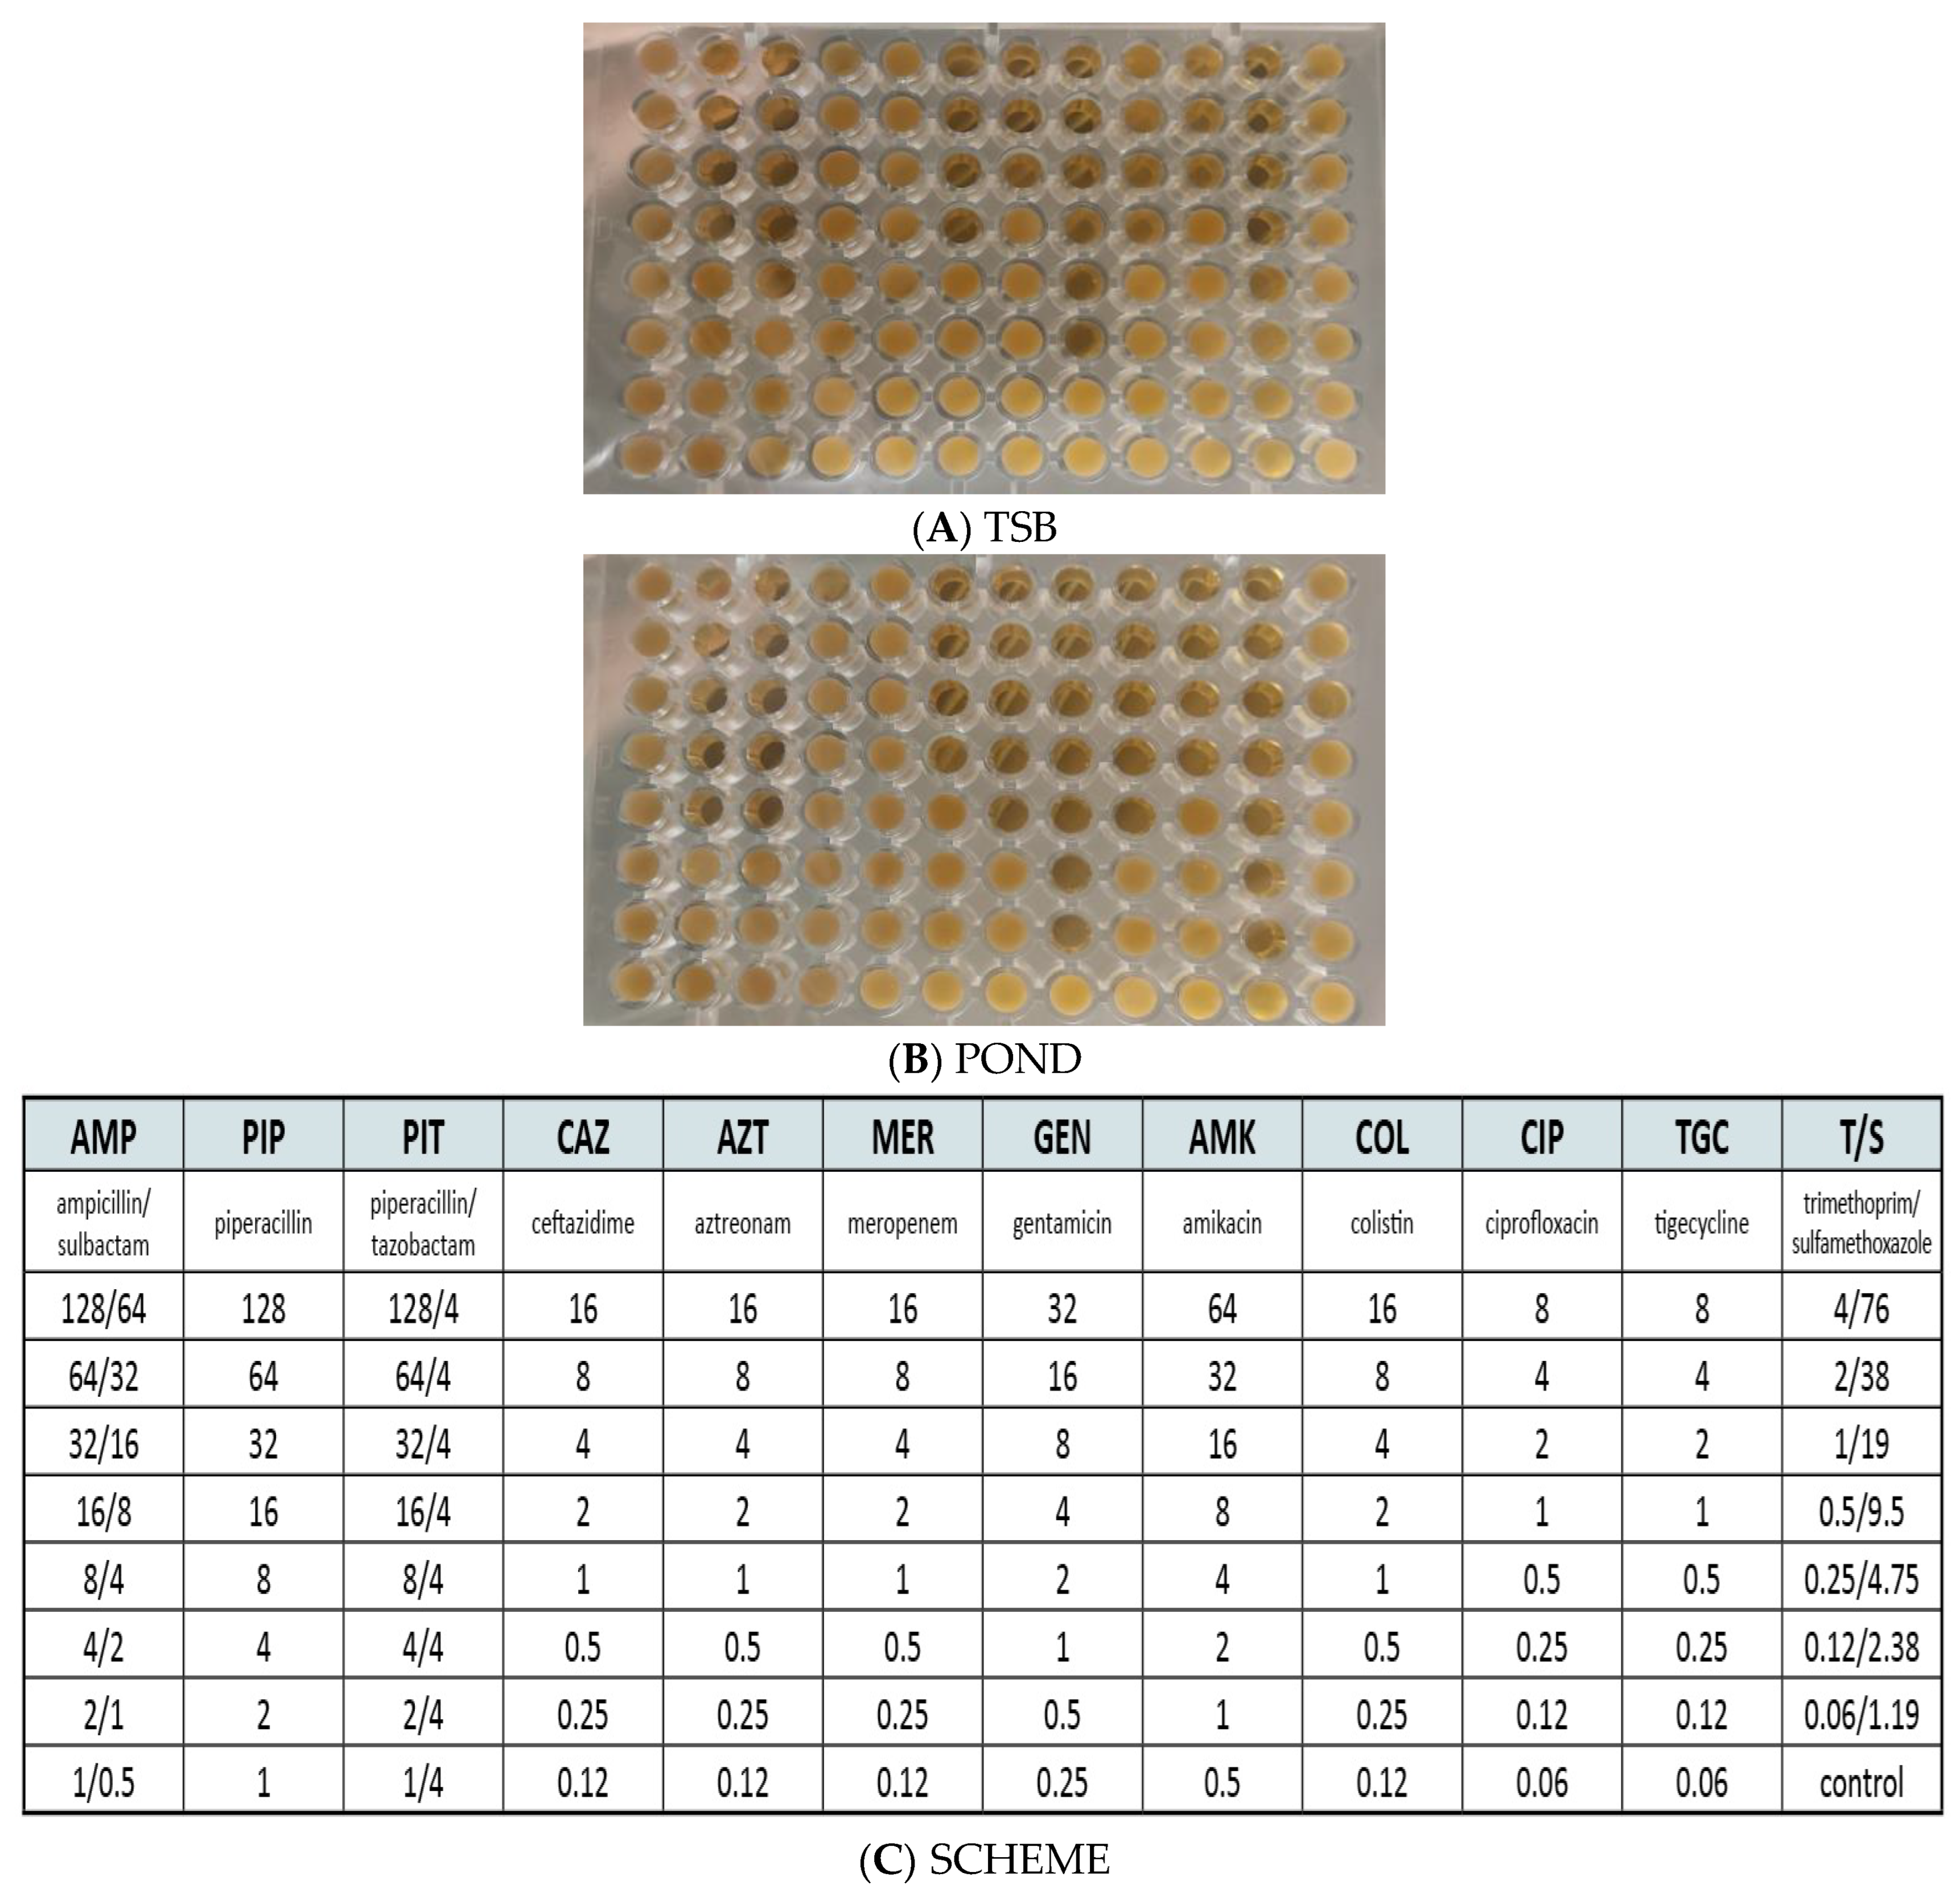
2.6. Risk of AMR Induction by Leachates

The changes in bacterial susceptibility to antibiotics after a 28-day incubation in leachates were tested. Leachate samples (MDS, YDS, and pond) were aseptically filtered using 0.22 μm syringe cellulose acetate filters (STARLAB International GmbH, Hamburg, Germany). A 24-hour-old culture of Pseudomonas putida MSCL 650 (previously obtained from the Microbial Strain Collection of Latvia (MSCL), University of Latvia) was used as a test bacterial culture. The inoculum was prepared in a liquid TSB broth with the following composition: g/L: tryptone 17.0 g; papaic digest of soybean meal 3.0 g; glucose 2.5 g; K2HPO4 2.5 g; NaCl 5.0 g. The pH value of the ready-to-use media at 25 °C was 7.3 ± 0.2. After 24 h cultivation at 28 °C with periodic shaking, the cells were collected by centrifugation at 10,000 rpm and rinsed twice with 0.85% NaCl. A suspension of P. putida with a cell concentration of 107 cells/mL was added to sterile leachate (1 mL inoculum and 9 mL leachate). Incubation was performed in sterile 15 mL screw-cap tubes at 28 °C with periodic shaking. An additional tube with TSB served as a positive control. After 28 days of incubation, the cells were collected and rinsed, as mentioned above. The susceptibility of P. putida cells to antibiotics was tested using the MICROLATEST MIC®, NEFERM kit (Cat. No. MLT00046, LACHEMA, Pliva, Czech Republic), according to the manufacturer’s instructions. Each determination consisted of 12 antibiotics at 8 concentrations (Figure A3C). The results were read manually after 20 h incubation at 28 °C and expressed as the minimum inhibitory concentration (MIC).

2.7. Microscopy Study

The samples were analyzed using a Leica DM RA-2 confocal laser scanning microscope (CLSM) (Wetzlar, Germany) equipped with a TCS-SL confocal scanning head. The cell culture was washed twice with a sterile 0.95% NaCl solution and centrifuged at 10,000 rpm, then fixed with 70% ethanol and afterward stained with 20 mM propidium iodide (PI). The PI was excited at the 488 nm band, and fluorescence was detected between 600 nm and 640 nm.

2.8. Statistical Analysis

The data are provided as mean values with standard deviations. The Student’s t-test and one-way analysis of variance (ANOVA) were used in an MS Excel 2308 environment to evaluate the differences between the treatments. The vegan v.2.5.6 package was used to compute the Chao1, Shannon, and Simpson indexes of alpha diversity, and the phyloseq v.1.30.0 program was used to visualize the results.

3. Results

3.1. Physicochemical Characterization of Leachates

The physicochemical characteristics of leachates are presented in Table 1. Leachates from MDS, YDS, and pond slightly differed by N-NH4+ and COD, with the lower values in YDS (Table 1).

3.2. Analytical Testing of Micropollutants

Two broad groups of micropollutants, i.e., PFAS and PC, were tested in the leachates. The abundance of PFAS in landfill leachates differed depending on the sampling site. In total, eight PFAS compounds were detected at the overall concentrations of 13.19, 7.16, and 11.14 μg/L in MDS, YDS, and pond, respectively (Figure 2A). Among the PFAS detected, PFBS prevailed in all three leachate samples, i.e., at 6.79, 2.73, and 5.28 μg/L levels in MDS, YDS, and pond, respectively. Other PFAS compounds varied in the range of 0.05 to 1.78 μg/L (Figure 2A). The testing of PC revealed an abundance of eleven compounds belonging to three drug classes, i.e., nonsteroidal anti-inflammatory drugs (NSAIDs), macrolides (clindamycin), and lincosamides (lincomycin), as well as sulfonamides. Among the PCs, NSAIDs were the most abundant in all three leachate samples. Particularly, the concentration of ibuprofen in MDS, YDS, and pond was 12.54, 12.81, and 13.13 μg/L, while diclofenac was 3.93, 4.52, and 6.08 μg/L, respectively (Figure 2B).

3.3. Characterization of Culturable Microorganisms

We conducted the EcoPlateTM test to characterize the functional diversity of culturable microorganisms in the environmental samples collected at the MDS, YDS, and pond collection sites. The results of the EcoPlateTM test and Shannon index calculation indicated that the highest Shannon index at the 24 h mark was at the MDS collection site. However, there was no notable increase in the Shannon index between 24 h and 96 h, only ranging from 1.96 to 2.00. This could indicate that the microbial community in the sample consistently utilized the available carbon sources, pointing to the lower level of variation in the functional diversity of the microbial community compared to the other ones. The YDS collection site had a notable Shannon index growth from the 24 h mark to the 96 h mark, ranging from 1.33 to 1.82, although it was not as significant as the growth in samples from the pond collection site. The highest functional diversity of the microbial community was from the pond collection site, where the Shannon index ranged from 1.59 to 3.23, suggesting a diverse utilization of carbon sources by the microorganisms (Figure 3A). The nitrogen use index NUSE remained stable in leachates from YDS and ponds upon 96 h incubation, while in leachates from MDS, the NUSE was 0%, 57%, 36%, and 42% after 24 h, 48 h, 72 h, and 96 h, respectively (Figure 3B).

3.4. Taxonomic Profile of Leachate Samples

Bacterial DNA was found to be prevalent among the categorized reads in the metagenome at rates ranging from 28.94% to 10.20%, while viral and fungal reads were in the ranges of 0.01–0.02 and 0.04–0.05%, respectively. Over 25% of the reads in the treated samples remained unclassified. The distribution of bacteria, archaea, eukaryotes, and viruses in the three leachate samples was as follows: 85.15–88.04%, 9.13–12.29%, 2.20–2.68%, and 0.12–0.15%, respectively. The overall abundance of microbial phyla in MDS, YDS, and ponds slightly varied. The main phyla present in leachate samples were Proteobacteria, i.e., 43.76, 54.70, and 53.32%, respectively. A relatively high abundance of Firmicutes (8.51–13.11%) and Euryarchaeota (9.37–12.53%) was also detected in leachate samples (Figure 4A). The phylum of Proteobacteria at the order level was represented in MDS, YDS, and pond by Pseudomonadales (20.50, 11.81, and 15.53%, respectively) and Campylobacterales (1.62, 16.63, and 1.53%, respectively) (Figure 4B). At the genus level, Proteobacteria were represented mostly by Pseudomonas (1.02, 1.14, and 1.25%, respectively) and Psychrobacter (0.16, 0.73, and 3.71%, respectively) (Figure 4C), whereas at the species level, Pseudomonas sp. C27 (2019) dominated (9.15, 5.19, and 8.51%, respectively) (Figure 4D). Regarding archaea, Euryarchaeota at the phylum level (12.17, 12.53, and 9.36%, respectively) and Methanomicrobiales (10.49, 11.46, and 2.27%, respectively) at the order level were represented in higher abundance in MDS and YDS compared to the pond. In turn, at the species level, Methanoculleus sp. MAB1, Methanoculleus bourgensis, Methanoculleus marisnigri, and Methanothermobacter wolfeii were detected at a relative abundance above 1% (Figure 3).
Regarding the alpha diversity of samples, the highest Chao1 measure was obtained for YDS—8885.95, followed by MDS and pond. On the contrary, the richness estimator, e.g., the Shannon index, was highest for the pond—7.23, followed by YDS and MDS. Similarly, the highest value of the evenness estimator—the Simpson index—was observed for the pond—0.99, followed by YDS and MDS (Figure 5).
In the context of AMR, the species/genera/families from the list of antibiotic-resistant “priority pathogens” [43] have been selected from the sequencing results and summarized in Table A1. The most abundant family from this list was Enterobacteriaceae, found in MDS, YDS, and ponds at concentrations of 1.294, 0.984, and 1.324% (relative abundance). Also, the relative abundance of Campilobacter spp. exceeded 1% in the YDS leachate (Table A1). The abundance of viruses in the tested leachates is summarized in Table A2.

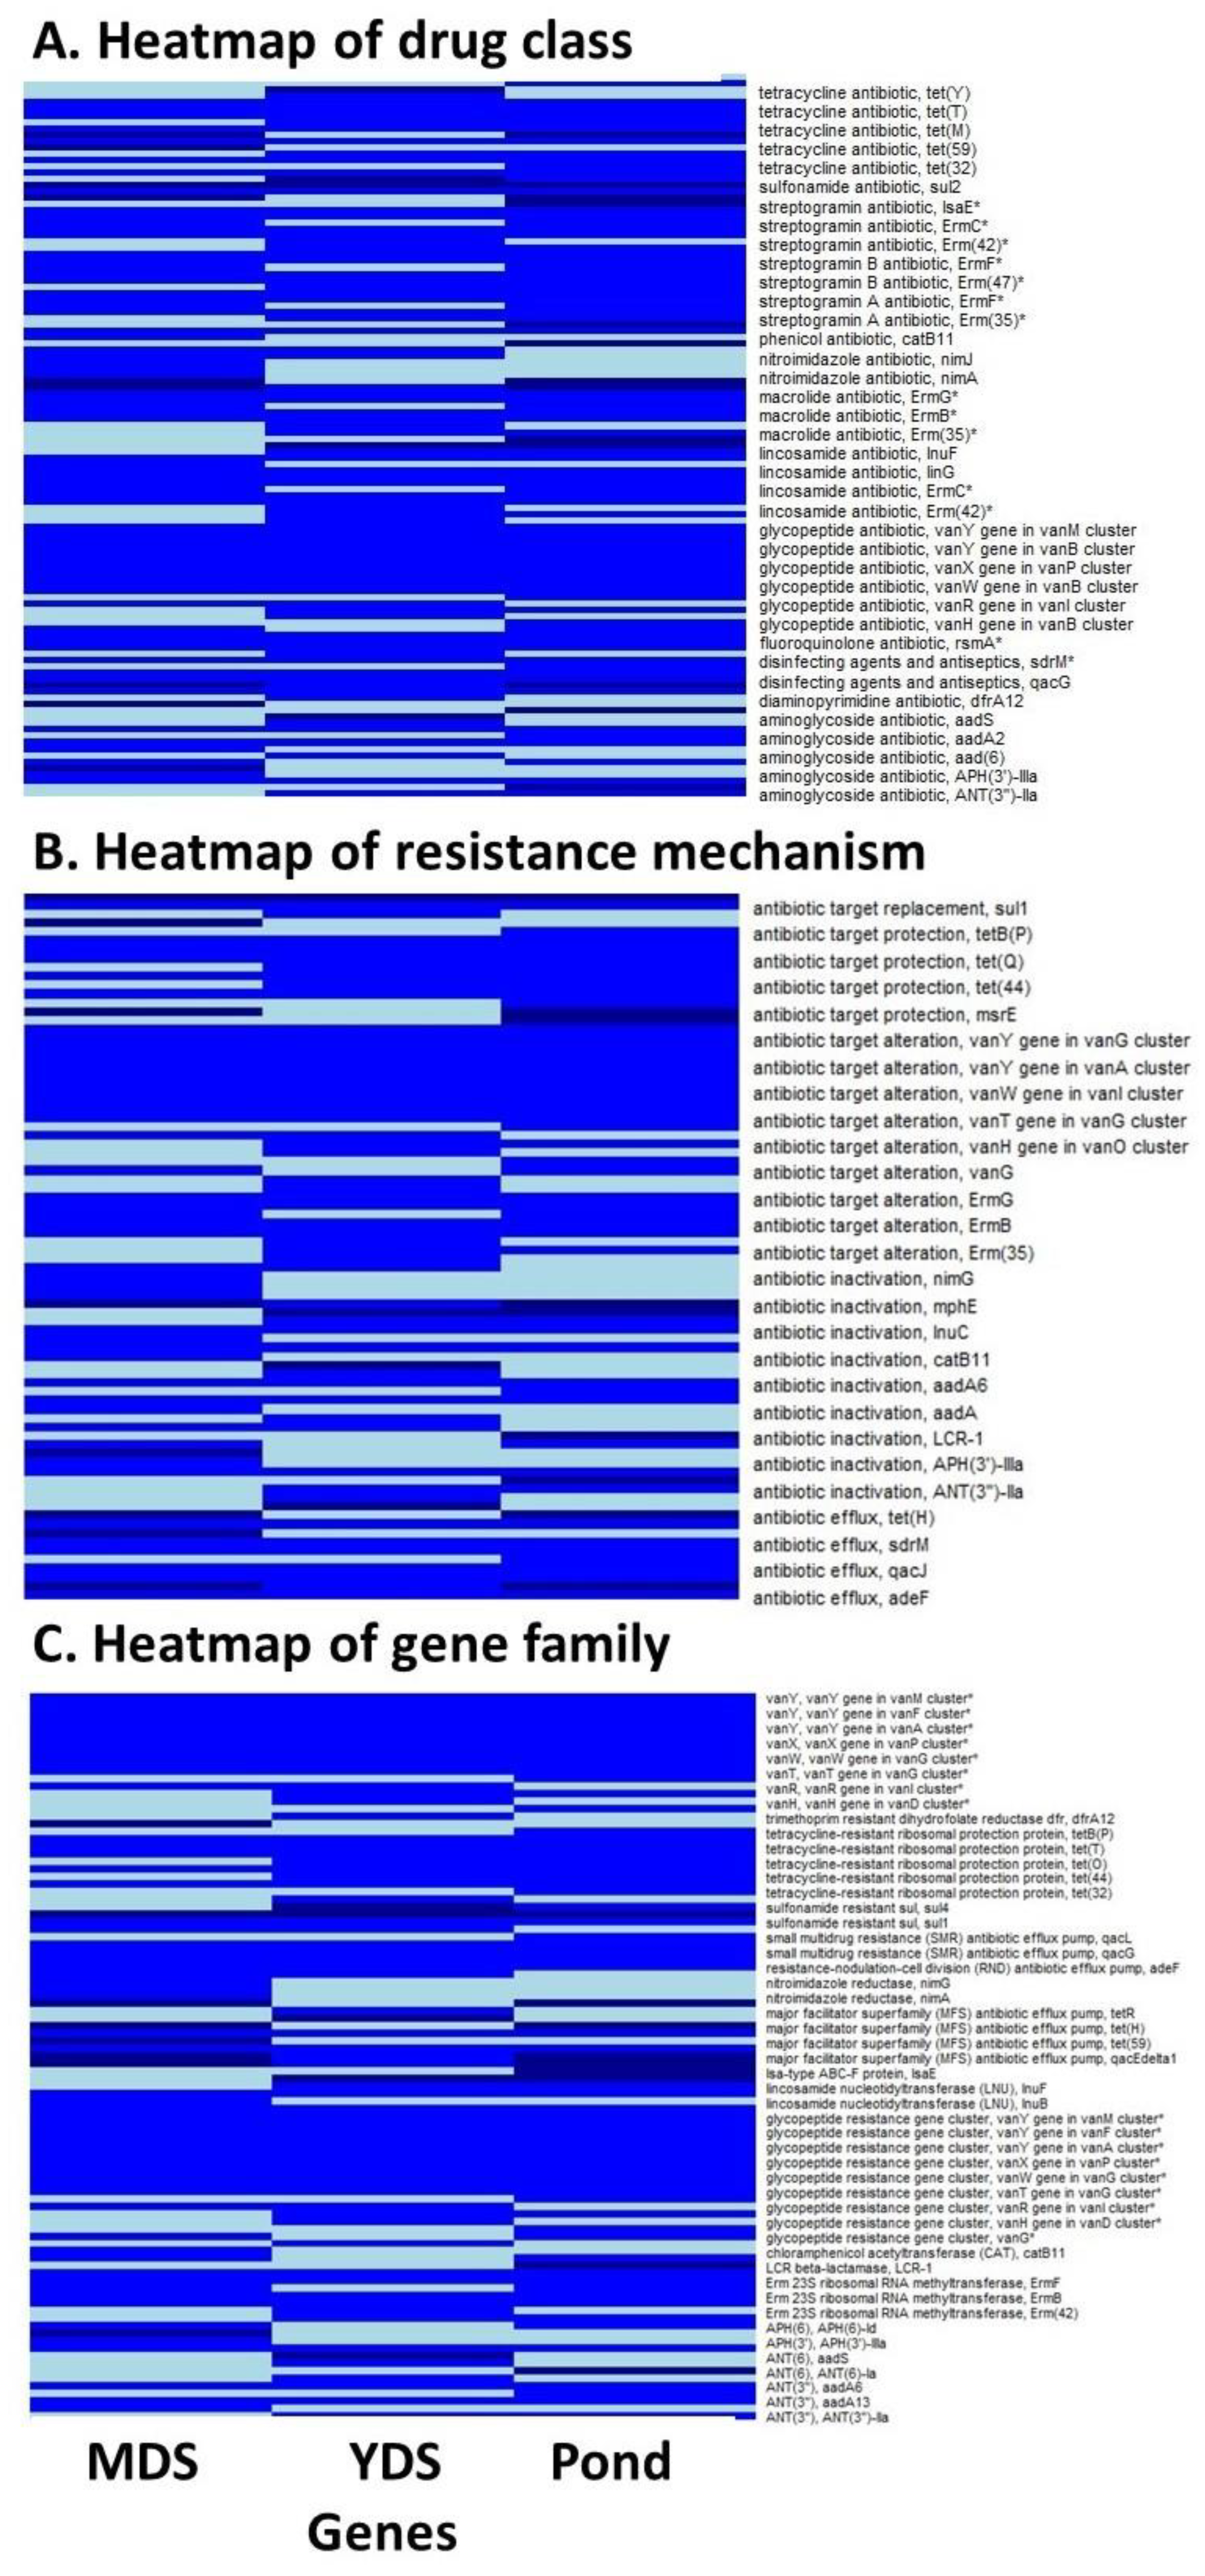
Antimicrobial Resistance Genes in Metagenomic Data

In the metagenomic analysis, we identified 31 distinct families of antimicrobial resistance genes (ARG), such as Erm 23S ribosomal RNA methyltransferase, glycopeptide resistance gene cluster, lincosamide nucleotidyltransferase, and tetracycline-resistant ribosomal protection protein, among others (Figure A1B). Collectively, these families encompass a total of 80 ARG genes, including aadA13, linG, mphE, qacEdelta1, adeF, sul2, and others. These ARG genes can be classified into five mechanism groups associated with resistance: antibiotic efflux, antibiotic inactivation, antibiotic target alteration, and antibiotic target replacement (Figure A1A). Furthermore, they confer resistance against 19 different classes of antibiotics, such as aminoglycosides, glycopeptides, fluoroquinolones, lincosamides, macrolides, streptogramins, and tetracyclines, as well as disinfecting agents and antiseptics (Figure A1C).
Consistent with the findings of analytical approaches (Section 3.2), sulfonamides were identified in all samples (Table 2). Specifically, we detected a total of 13 genes associated with the alteration of lincosamide antibiotics. The highest number of these genes (n = 11) was observed in the pond, with such exemplars as Erm(35), ErmB, and lnuB, among others, followed by YDS (n = 10) with ARG genes, including Erm(42), ErmF, and lnuC. In contrast, the lowest number of lincosamide antibiotic-altering genes was detected in MDS (n = 8). In terms of sulfonamides, we were able to identify three ARG genes that modify the efficacy of sulfonamide antibiotics, namely sul1, sul2, and sul3. All three genes were consistently detected across the analyzed samples, except for MDS, which contained only sul1 and sul2 (Table 2).

3.5. Risk of AMR Induction by Leachates

Our testing of P. putida MSCL650 after 28-day incubation in sterile leachate from the pond has revealed a decreased MIC for piperacillin (8 mg/L), amikacin (2 mg/L), colistin (1 mg/L), and ciprofloxacin (1 mg/L) by two times. Additionally, the MIC for gentamicin (2 mg/L) decreased by four times and tigecycline (0.12 mg/L) by eight times, respectively, compared to the bacterial culture incubated in the TSB (Figure A3). The cells of P. putida did not show any growth activity after incubation in the MDS and YDS leachates. These results indicate that MDS and YDS leachates inhibited the physiological activity of P. putida cells, including their antibiotic resistance mechanisms.
Cell cultures incubated in different leachate samples and TSB slightly differed also by cell morphology. Specifically, the average cell length in the culture of P. putida after incubation in TSB was 1.07 ± 0.36 μm, while after incubation in leachates from MDS, YDS, and pond, the cell length was 1.11 ± 0.48 μm, 1.49 ± 0.50 μm, and 0.72 ± 0.34 μm, respectively (Figure 6). In the preparations with pond and MDS leachates, some long cells/chains were detected (up to 4.62 and 6.92 μm, respectively). However, these cells were not included in the counting of average cell length.

4. Discussion

The leachates generated at landfills differ greatly due to the heterogeneity of waste composition, treatment technologies, landfill/waste age, climatic conditions, and other parameters. The leachates derived from waste deposits aged <5 years, 5–10 years, and >15 years are considered acetogenic, intermediate, and methanogenic leachates, respectively, and differ by physicochemical characteristics [44,45].
Recently, it has been shown that pH values, the presence of nitrogen compounds, COD, and integrons are variables playing an important role in the abundance of ARGs [46].
Landfills represent a significant source of toxic substances in the environment [22]. In our study, an emphasis was placed on two large groups of micropollutants, i.e., PFAS and PC, as they are known to concentrate in leachates [23,24].
Among PFAS, perfluorobutane sulfonic acid (PFBS) prevailed. This compound is proposed for National Primary Drinking Water Regulations by the US Environmental Protection Agency [47]. A correlation between the physicochemical properties (i.e., alkalinity, total organic carbon, and ammonia) and the PFAS concentration in landfill leachates derived from 39 landfill facilities in Florida, USA, has been described [48].
The number and concentration of PCs in leachates can vary greatly, being site-specific. The concentration of PCs in the leachates in China varied in the range of 0.1 to 100 μg/L [25]. Masoner et al. [23] analyzed leachates from 22 landfills in 12 states of the USA, and PCs were found in every sample, ranging in number from 1 to 58. The concentration of PCs was greater in leachates from active landfills compared to closed, unlined landfills [23]. In our study, one dumping site (MDS) was closed by the sampling time, while another (YDS) was active. Furthermore, these sites differed by waste composition. Nevertheless, no considerable differences between MDS and YDS were found.
The prevalence of ibuprofen among PCs in the tested leachate samples corroborates with other studies worldwide. The concentration range of ibuprofen in leachates from dumping sites of different ages was from 3.0 to 48.7 μg/L [26,49], while in hospital effluent, it was 3.9 μg/L [49]. It was recently reported that ibuprofen, along with other non-antibiotic pharmaceuticals in therapeutically and environmentally relevant quantities, greatly increased the spread of ARGs via plasmid-borne bacterial conjugation [50].
Thus, the testing results on PFAS and PCs in leachates obtained at the Getlini landfill in Latvia corroborated those reported from other countries.
A metagenomic approach for the characterization of microbial biodiversity has revealed Proteobacteria as the dominant phylum in all three leachate samples tested (up to 50%). These data are in good agreement with reports by other authors who studied leachates and their aerobic treatment [28,51,52,53,54]. Importantly, the majority of bacterial species mentioned in the list of antibiotic-resistant “priority pathogens” [43] belong to Proteobacteria (Table A1). In a study on soil bacterial communities, Proteobacteria was also emphasized as the most dominant phylum in the transconjugant pools in terms of horizontal transfer of ARGs [55].
Among important factors for ARG transmission, the viral [21,56] and archaea [57,58] community structures in landfill leachates should be emphasized. Thus, the physicochemical and microbial diversity in leachates provides a broad spectrum of mechanisms responsible for ARG transmission, including horizontal gene transfer [27]. The genes sulI and sulII, found in MDS, YDS, and pond, have been mentioned by other authors as the most abundant antibiotic-resistance genes in leachates [51]. In the studies where dynamic trends in the abundance of ARG in leachates were monitored, considerable variations were found. For example, the levels of sulI, tetO, and tetW in 2017 were reported to be 100 times higher than in 2018 [27].
The presence of ARGs in leachates may represent potential risks to public health and the environment, which are not yet fully understood. Mobile genetic elements can be released into local rivers and other receiving aquifers, where bacteria may quickly acquire antibiotic resistance [1,59].
ARGs are mobilized and transported primarily by hydrological processes such as runoff and infiltration [60]. Furthermore, community access to drinking water and sanitation has a great impact on antibiotic resistance in humans [61].
Regarding the Watch List of Substances for Union-wide Monitoring in the Field of Water Policy, which was recently published by the EU Commission [62], only clindamycin has been detected in the tested leachates. Importantly, clindamycin was not detected in the pond, which confirms the efficiency of the primary treatment.
Among the limitations of our study, the absence of data on seasonal variables and differences over the years should be noted. Additionally, we lacked data on the concentration of additional micropollutant categories (e.g., heavy metals). Another limitation is the absence of standardized methods for sampling. These limitations can result in an underestimation of the abundance of ARGs and stress factors that promote their horizontal transfer.

5. Conclusions

By analyzing the chemical, biochemical, and microbiological composition of landfill leachates, we were able to characterize the abundance of micropollutants, ARGs, taxonomic groups of bacteria, viruses, and archaea, as well as compare leachates derived from solid waste dumping sites of different ages. The following conclusions were made:
  • Metagenomic analysis showed a prevalence of Proteobacteria (43.76–54.70%), followed by Firmicutes (8.51–13.11%) and Euryarchaeota (9.37–12.53%) in all three leachate samples. Regarding the inner diversity of samples, the highest Chao1 measure was obtained for YDS—8885.95, followed by MDS and pond, whereas the richness estimator, e.g., Shannon index, was the highest for pond—7.23, followed by YDS and MDS. Similarly, the highest value of the evenness estimator—the Simpson index—was observed for the pond—0.99, followed by YDS and MDS.
  • The number and composition of specific ARGs found in leachate samples derived from MDS, YDS, and ponds slightly varied. In total, 80 ARGs belonging to 31 distinct ARG families were identified. These ARGs are known to confer resistance against 19 different classes of antibiotics, such as aminoglycosides, glycopeptides, fluoroquinolones, lincosamides, macrolides, streptogramins, and tetracyclines, as well as disinfecting agents and antiseptics.
  • The incubation of P. putida MSCL650 in sterilized leachate derived from the pond resulted in a decrease in MIC for several antibiotics compared to the control. This effect can be explained by the high concentration of toxic compounds in leachates. Leachates from MDS and YDS totally inhibited the cells of P. putida.
  • A comparison of two dumping sites tested in the study, which differed by waste composition and treatment and the duration of operations, did not reveal considerable differences in the microbial community structure and ARG abundance. The lower ecotoxicity in the leachate from the pond compared to those from MDS and YDS pointed to the effectiveness of solid waste treatment.

Author Contributions

Conceptualization, O.M. and A.G.; methodology, D.G., D.F. and D.Z.; software, D.G.; validation, D.F., V.B. and O.M.; formal analysis, K.V.; investigation, M.B., D.G., D.Z., L.Ž., K.V. and T.S.; writing—original draft preparation, M.B., D.G., O.M. and A.D.; writing—review and editing, O.M.; visualization, T.S.; supervision, O.M., D.F. and V.B. All authors have read and agreed to the published version of the manuscript.

Funding

This study was funded by the “State research project in the field of biomedicine, medical technologies, and pharmacy” VPP-EM-BIOMEDICĪNA-2022/1-001 (Y3-VPP32f-ZR-N-090); “Optimization of biotechnological processes for effective utilization of renewable resources” Y5-AZ20-ZF-N-270; and SAM 8.2.2. The third-round project is “Strengthening the capacity of the doctoral program of the University of Latvia in the framework of the new doctoral program model”.

Data Availability Statement

Raw sequencing data have been deposited at the European Nucleotide Archive under study accession No. PRJEB64323.

Acknowledgments

The authors are grateful to Janis Jaunbergs for suggested manuscript revisions.

Conflicts of Interest

The authors declare no conflict of interest.

Appendix A

Table A1. The relative abundance of bacterial species in leachates that are mentioned in the list of antibiotic-resistant “priority pathogens” [43]. * MDS—matured dumpsite, YDS—young dumpsite.
Priority GroupRelative Abundance *, %
1. CriticalMDSYDSPond
Acinetobacter baumannii, carbapenem-resistant0.0460.0340.037
Pseudomonas aeruginosa, carbapenem-resistant0.2330.1740.222
Enterobacteriaceae, carbapenem-resistant, ESBL-producing1.2940.9841.324
2. High
Enterococcus faecium, vancomycin-resistant0.0150.0120.020
Salmonellae, fluoroquinolone-resistantn.d.n.d.n.d.
Staphylococcus aureus, methicillin-resistant, vancomycin-intermediate and resistantn.d.n.d.n.d.
Helicobacter pylori, clarithromycin-resistant0.0320.0490.032
Campylobacter spp., fluoroquinolone-resistant0.4701.3050.385
Neisseria gonorrhoeae, cephalosporin-resistant, fluoroquinolone-resistant0.0010.0010.002
3. Medium
Streptococcus pneumoniae, penicillin-non-susceptible0.0110.0090.009
Haemophilus influenzae, ampicillin-resistantn.d.n.d.n.d.
Shigella spp., fluoroquinolone-resistant0.0020.0040.005
Table A2. The abundance (OTUs number) of viruses in leachates sampled at the matured dumpsite (MDS), young dumpsite (YDS), and pond. Only the taxons with OTUs ≥ 100 in at least one sample are shown.
NameMDSYDSPondLineage
Pandoravirus neocaledonia4089267Viruses > unclassified viruses > unclassified DNA viruses > unclassified dsDNA viruses > Pandoravirus
Alteromonas phage vB_AmaP_AD45-P113159193Viruses > Duplodnaviria > Heunggongvirae > Uroviricota > Caudoviricetes > Caudovirales > Podoviridae > unclassified Podoviridae
Aeromonas phage phiAS5215173Viruses > Duplodnaviria > Heunggongvirae > Uroviricota > Caudoviricetes > Caudovirales > Myoviridae > Tevenvirinae > unclassified Tevenvirinae
Brevibacillus phage Sundance1566162Viruses > Duplodnaviria > Heunggongvirae > Uroviricota > Caudoviricetes > Caudovirales > Siphoviridae > unclassified Siphoviridae
Yersinia virus phiR2011139149Viruses > Duplodnaviria > Heunggongvirae > Uroviricota > Caudoviricetes > Caudovirales > Demerecviridae > Markadamsvirinae > Haartmanvirus
Halovirus HRTV-8337145Viruses > Duplodnaviria > Heunggongvirae > Uroviricota > Caudoviricetes > Caudovirales > Myoviridae > unclassified Myoviridae
Paramecium bursaria Chlorella virus AR1581845131Viruses > Varidnaviria > Bamfordvirae > Nucleocytoviricota > Megaviricetes > Algavirales > Phycodnaviridae > Chlorovirus > unclassified Chlorovirus
Megavirus chiliensis9410091Viruses > Varidnaviria > Bamfordvirae > Nucleocytoviricota > Megaviricetes > Imitervirales > Mimiviridae > Mimivirus > unclassified Mimivirus
Orpheovirus IHUMI-LCC28115080Viruses > Varidnaviria > Bamfordvirae > Nucleocytoviricota > Megaviricetes > Algavirales > Phycodnaviridae > unclassified Phycodnaviridae
Moumouvirus11624063Viruses > Varidnaviria > Bamfordvirae > Nucleocytoviricota > Megaviricetes > Imitervirales > Mimiviridae > unclassified Mimiviridae
Cafeteria roenbergensis virus10212763Viruses > Varidnaviria > Bamfordvirae > Nucleocytoviricota > Megaviricetes > Imitervirales > Mimiviridae > Cafeteriavirus
Lymphocystis disease virus—isolate China1063146Viruses > Varidnaviria > Bamfordvirae > Nucleocytoviricota > Megaviricetes > Pimascovirales > Iridoviridae > Alphairidovirinae > Lymphocystivirus > unclassified Lymphocystivirus
Bacillus virus G9512945Viruses > Duplodnaviria > Heunggongvirae > Uroviricota > Caudoviricetes > Caudovirales > Myoviridae
Aureococcus anophagefferens virus4814538Viruses > Varidnaviria > Bamfordvirae > Nucleocytoviricota > Megaviricetes > Algavirales > Phycodnaviridae > unclassified Phycodnaviridae
Chrysochromulina ericina virus2514237Viruses > Varidnaviria > Bamfordvirae > Nucleocytoviricota > Megaviricetes > Algavirales > Phycodnaviridae > unclassified Phycodnaviridae
Mimivirus terra27210926Viruses > Varidnaviria > Bamfordvirae > Nucleocytoviricota > Megaviricetes > Imitervirales > Mimiviridae > Mimivirus > unclassified Mimivirus
Escherichia virus JSE11101Viruses > Duplodnaviria > Heunggongvirae > Uroviricota > Caudoviricetes > Caudovirales > Myoviridae > Tevenvirinae > Krischvirus
Arthrobacter virus Coral12100Viruses > Duplodnaviria > Heunggongvirae > Uroviricota > Caudoviricetes > Caudovirales > Siphoviridae > Coralvirus
Figure A1. Sampling of the leachates at Getlini solid waste landfill.
Water 15 03349 g0a1
Figure A2. The differences in specific ARG family presence in the leachates sampled at the matured dumpsite (MDS), young dumpsite (YDS), and pond. Dark blue color—100% sequence match, bluish color—>90% match, bright color—not identified. Genes with asterisks (*) appear multiple times because they belong to more than one AMR gene family category in the Antibiotic Resistance Ontology.
Water 15 03349 g0a2
Figure A3. The susceptibility of P. putida MSCL650 to antibiotics was tested by the MICROLATEST MIC® kit, NEFERM. The results were read after 20 h incubation at 28 °C in TSB (A) and leachate from the pond (B). (C) the concentrations of antibiotics in the plate.
Water 15 03349 g0a3

References

  1. Nava, A.R.; Daneshian, L.; Sarma, H. Antibiotic Resistant Genes in the Environment-Exploring Surveillance Methods and Sustainable Remediation Strategies of Antibiotics and ARGs. Environ. Res. 2022, 215, 114–212. [Google Scholar] [CrossRef] [PubMed]
  2. Saha, S.; Xiong, J.-Q.; Patil, S.M.; Ha, G.-S.; Hoh, J.-K.; Park, H.-K.; Chung, W.; Chang, S.W.; Khan, M.A.; Park, H.B.; et al. Dissemination of Sulfonamide Resistance Genes in Digester Microbiome during Anaerobic Digestion of Food Waste Leachate. J. Hazard. Mater. 2023, 452, 131200. [Google Scholar] [CrossRef]
  3. Sun, H.; Bjerketorp, J.; Levenfors, J.J.; Schnürer, A. Isolation of Antibiotic-Resistant Bacteria in Biogas Digestate and Their Susceptibility to Antibiotics. Environ. Pollut. 2020, 266, 115265. [Google Scholar] [CrossRef]
  4. European Commission. A European One Health Action Plan against Antimicrobial Resistance (AMR); European Commission: Brussels, Belgium, 2017. [Google Scholar]
  5. Taing, L.; Bhatia, H.; Kaiser, R.A.; Qadir, M.; Mehmood, H. A Rapid Review of Environmental Health Gaps in Antimicrobial Resistance and Water-Related Research from 1990–2020. Int. J. Environ. Res. Public Health 2022, 19, 6549. [Google Scholar] [CrossRef] [PubMed]
  6. Liguori, K.; Keenum, I.; Davis, B.C.; Calarco, J.; Milligan, E.; Harwood, V.J.; Pruden, A. Antimicrobial Resistance Monitoring of Water Environments: A Framework for Standardized Methods and Quality Control. Environ. Sci. Technol. 2022, 56, 9149–9160. [Google Scholar] [CrossRef] [PubMed]
  7. Burch, T.R.; Newton, R.J.; Kimbell, L.K.; LaMartina, E.L.; O’Malley, K.; Thomson, S.M.; Marshall, C.W.; McNamara, P.J. Targeting Current and Future Threats: Recent Methodological Trends in Environmental Antimicrobial Resistance Research and Their Relationships to Risk Assessment. Environ. Sci. 2022, 8, 1787–1802. [Google Scholar] [CrossRef]
  8. Irfan, M.; Almotiri, A.; AlZeyadi, Z.A. Antimicrobial Resistance and Its Drivers—A Review. Antibiotics 2022, 11, 362. [Google Scholar] [CrossRef]
  9. Bai, Y.; Xu, R.; Wang, Q.P.; Zhang, Y.R.; Yang, Z.H. Sludge Anaerobic Digestion with High Concentrations of Tetracyclines and Sulfonamides: Dynamics of Microbial Communities and Change of Antibiotic Resistance Genes. Bioresour. Technol. 2019, 276, 51–59. [Google Scholar] [CrossRef]
  10. Ehsan, M.N.; Riza, M.; Pervez, M.N.; Khyum, M.M.O.; Liang, Y.; Naddeo, V. Environmental and Health Impacts of PFAS: Sources, Distribution and Sustainable Management in North Carolina (USA). Sci. Total Environ. 2023, 878, 163123. [Google Scholar] [CrossRef]
  11. Li, Y.-J.; Yuan, Y.; Tan, W.-B.; Xi, B.-D.; Wang, H.; Hui, K.-L.; Chen, J.-B.; Zhang, Y.-F.; Wang, L.-F.; Li, R.-F. Antibiotic Resistance Genes and Heavy Metals in Landfill: A Review. J. Hazard. Mater. 2023, 2023, 132395. [Google Scholar] [CrossRef]
  12. Vlaanderen, E.J.; Ghaly, T.M.; Moore, L.R.; Focardi, A.; Paulsen, I.T.; Tetu, S.G. Plastic Leachate Exposure Drives Antibiotic Resistance and Virulence in Marine Bacterial Communities. bioRxiv 2023, 15, 121558. [Google Scholar] [CrossRef] [PubMed]
  13. Nguyen, A.Q.; Vu, H.P.; Nguyen, L.N.; Wang, Q.; Djordjevic, S.P.; Donner, E.; Yin, H.; Nghiem, L.D. Monitoring Antibiotic Resistance Genes in Wastewater Treatment: Current Strategies and Future Challenges. Sci. Total Environ. 2021, 783, 146964. [Google Scholar] [CrossRef] [PubMed]
  14. Xu, R.; Yang, Z.H.; Zheng, Y.; Wang, Q.P.; Bai, Y.; Liu, J.B.; Zhang, Y.R.; Xiong, W.P.; Lu, Y.; Fan, C.Z. Metagenomic Analysis Reveals the Effects of Long-Term Antibiotic Pressure on Sludge Anaerobic Digestion and Antimicrobial Resistance Risk. Bioresour. Technol. 2019, 282, 179–188. [Google Scholar] [CrossRef] [PubMed]
  15. Vestel, J.; Caldwell, D.J.; Tell, J.; Constantine, L.; Häner, A.; Hellstern, J.; Journel, R.; Ryan, J.J.; Swenson, T.; Xei, W. Default Predicted No-Effect Target Concentrations for Antibiotics in the Absence of Data for the Protection against Antibiotic Resistance and Environmental Toxicity. Integr. Environ. Assess. Manag. 2022, 18, 863–867. [Google Scholar] [CrossRef]
  16. Brunn, H.; Arnold, G.; Körner, W.; Rippen, G.; Steinhäuser, K.G.; Valentin, I. PFAS: Forever Chemicals—Persistent, Bioaccumulative and Mobile. Reviewing the Status and the Need for Their Phase out and Remediation of Contaminated Sites. Environ. Sci. Eur. 2023, 35, 20. [Google Scholar] [CrossRef]
  17. Backhaus, T. Commentary on the EU Commission’s Proposal for Amending the Water Framework Directive, the Groundwater Directive, and the Directive on Environmental Quality Standards. Environ. Sci. Eur. 2023, 35, 22. [Google Scholar] [CrossRef]
  18. Thompson, K.A.; Mortazavian, S.; Gonzalez, D.J.; Bott, C.; Hooper, J.; Schaefer, C.E.; Dickenson, E.R.V. Poly- and Perfluoroalkyl Substances in Municipal Wastewater Treatment Plants in the United States: Seasonal Patterns and Meta-Analysis of Long-Term Trends and Average Concentrations. ACS Environ. Sci. Technol. Water 2022, 2, 690–700. [Google Scholar] [CrossRef]
  19. Tiwari, A.; Kurittu, P.; Al-Mustapha, A.I.; Heljanko, V.; Johansson, V.; Thakali, O.; Mishra, S.K.; Lehto, K.M.; Lipponen, A.; Oikarinen, S.; et al. Wastewater Surveillance of Antibiotic-Resistant Bacterial Pathogens: A Systematic Review. Front. Microbiol. 2022, 13, 977106. [Google Scholar] [CrossRef]
  20. Chique, C.; Cullinan, J.; Hooban, B.; Morris, D. Mapping and Analysing Potential Sources and Transmission Routes of Antimicrobial Resistant Organisms in the Environment Using Geographic Information Systems—An Exploratory Study. Antibiotics 2019, 8, 16. [Google Scholar] [CrossRef]
  21. Lin, X.; Yang, S.; Gong, Z.; Ni, R.; Shi, X.; Song, L. Viral Community in Landfill Leachate: Occurrence, Bacterial Hosts, Mediation Antibiotic Resistance Gene Dissemination, and Function in Municipal Solid Waste Decomposition. Sci. Total Environ. 2022, 853, 158561. [Google Scholar] [CrossRef]
  22. Garcete, L.A.A.; Martinez, J.E.R.; Barrera, D.B.V.; Bonugli-Santos, R.C.; Passarini, M.R.Z. Biotechnological Potential of Microorganisms from Landfill Leachate: Isolation, Antibiotic Resistance and Leachate Discoloration. Anal. Acad. Bras. Cienc. 2022, 94, e20210642. [Google Scholar] [CrossRef] [PubMed]
  23. Masoner, J.R.; Kolpin, D.W.; Furlong, E.T.; Cozzarelli, I.M.; Gray, J.L. Landfill Leachate as a Mirror of Today’s Disposable Society: Pharmaceuticals and Other Contaminants of Emerging Concern in Final Leachate from Landfills in the Conterminous United States. Environ. Toxicol. Chem. 2016, 35, 906–918. [Google Scholar] [CrossRef]
  24. Masoner, J.R.; Kolpin, D.W.; Cozzarelli, I.M.; Smalling, K.L.; Bolyard, S.C.; Field, J.A.; Furlong, E.T.; Gray, J.L.; Lozinski, D.; Reinhart, D.; et al. Landfill Leachate Contributes Per-/Poly-Fluoroalkyl Substances (PFAS) and Pharmaceuticals to Municipal Wastewater. Environ. Sci. 2020, 6, 1300–1311. [Google Scholar] [CrossRef]
  25. Pisharody, L.; Gopinath, A.; Malhotra, M.; Nidheesh, P.V.; Kumar, M.S. Occurrence of Organic Micropollutants in Municipal Landfill Leachate and Its Effective Treatment by Advanced Oxidation Processes. Chemosphere 2022, 287, 132216. [Google Scholar] [CrossRef]
  26. Rezaei Adaryani, A.; Keen, O. Occurrence of Pharmaceuticals and Plasticizers in Leachate from Municipal Landfills of Different Age. Waste Manag. 2022, 141, 1–7. [Google Scholar] [CrossRef] [PubMed]
  27. Wang, Y.; Zhang, R.; Lei, Y.; Song, L. Antibiotic Resistance Genes in Landfill Leachates from Seven Municipal Solid Waste Landfills: Seasonal Variations, Hosts, and Risk Assessment. Sci. Total Environ. 2022, 853, 158677. [Google Scholar] [CrossRef]
  28. Zhao, R.; Liu, J.; Feng, J.; Li, X.; Li, B. Microbial Community Composition and Metabolic Functions in Landfill Leachate from Different Landfills of China. Sci. Total Environ. 2021, 767, 144861. [Google Scholar] [CrossRef] [PubMed]
  29. Zacs, D.; Bartkevics, V. Trace Determination of Perfluorooctane Sulfonate and Perfluorooctanoic Acid in Environmental Samples (Surface Water, Wastewater, Biota, Sediments, and Sewage Sludge) Using Liquid Chromatography—Orbitrap Mass Spectrometry. J. Chromatogr. A 2016, 1473, 109–121. [Google Scholar] [CrossRef]
  30. Pugajeva, I.; Ikkere, L.E.; Jansons, M.; Perkons, I.; Sukajeva, V.; Bartkevics, V. Two-Dimensional Liquid Chromatography—Mass Spectrometry as an Effective Tool for Assessing a Wide Range of Pharmaceuticals and Biomarkers in Wastewater-Based Epidemiology Studies. J. Pharm. Biomed. Anal. 2021, 205, 114–295. [Google Scholar] [CrossRef] [PubMed]
  31. Gabor, E.M.; De Vries, E.J.; Janssen, D.B. Efficient Recovery of Environmental DNA for Expression Cloning by Indirect Extraction Methods. FEMS Microbiol. Ecol. 2003, 44, 153–163. [Google Scholar] [CrossRef]
  32. Sala, M.M.; Pinhassi, J.; Gasol, J.M. Estimation of Bacterial Use of Dissolved Organic Nitrogen Compounds in Aquatic Ecosystems Using Biolog Plates. Aquat. Microb. Ecol. 2006, 42, 1–5. [Google Scholar] [CrossRef]
  33. Urakawa, H.; Ali, J.; Ketover, R.D.J.; Talmage, S.D.; Garcia, J.C.; Campbell, I.S.; Loh, A.N.; Parsons, M.L. Shifts of Bacterioplankton Metabolic Profiles along the Salinity Gradient in a Subtropical Estuary. Oceanography 2013, 12, 410814. [Google Scholar] [CrossRef]
  34. Bolger, A.M.; Lohse, M.; Usadel, B. Trimmomatic: A Flexible Trimmer for Illumina Sequence Data. Bioinformatics 2014, 30, 2114–2120. [Google Scholar] [CrossRef] [PubMed]
  35. Langmead, B.; Salzberg, S.L. Fast Gapped-Read Alignment with Bowtie 2. Nat. Methods 2012, 9, 357–359. [Google Scholar] [CrossRef]
  36. Dale, R.K.; Pedersen, B.S.; Quinlan, A.R. Pybedtools: A Flexible Python Library for Manipulating Genomic Datasets and Annotations. Bioinformatics 2011, 27, 3423–3424. [Google Scholar] [CrossRef]
  37. Wood, D.E.; Lu, J.; Langmead, B. Improved Metagenomic Analysis with Kraken 2. Genome Biol. 2019, 20, 257. [Google Scholar] [CrossRef]
  38. Breitwieser, F.P.; Salzberg, S.L. Pavian: Interactive Analysis of Metagenomics Data for Microbiome Studies and Pathogen Identification. Bioinformatics 2020, 36, 1303–1304. [Google Scholar] [CrossRef]
  39. Nurk, S.; Meleshko, D.; Korobeynikov, A.; Pevzner, P.A. MetaSPAdes: A New Versatile Metagenomic Assembler. Genome Res. 2017, 27, 824–834. [Google Scholar] [CrossRef]
  40. Mikheenko, A.; Saveliev, V.; Gurevich, A. MetaQUAST: Evaluation of Metagenome Assemblies. Bioinformatics 2016, 32, 1088–1090. [Google Scholar] [CrossRef]
  41. Alcock, B.P.; Raphenya, A.R.; Lau, T.T.Y.; Tsang, K.K.; Bouchard, M.; Edalatmand, A.; Huynh, W.; Nguyen, A.L.V.; Cheng, A.A.; Liu, S.; et al. CARD 2020: Antibiotic Resistome Surveillance with the Comprehensive Antibiotic Resistance Database. Nucleic Acids Res. 2020, 48, D517–D525. [Google Scholar] [CrossRef]
  42. Buchfink, B.; Xie, C.; Huson, D.H. Fast and Sensitive Protein Alignment Using DIAMOND. Nat. Methods 2014, 12, 59–60. [Google Scholar] [CrossRef]
  43. WHO Publishes List of Bacteria for Which New Antibiotics Are Urgently Needed 2017. Available online: https://www.who.int/news/item/27-02-2017-who-publishes-list-of-bacteria-for-which-new-antibiotics-are-urgently-needed (accessed on 21 September 2023).
  44. Mukherjee, S.; Mukhopadhyay, S.; Hashim, M.A.; Gupta, B. Sen Contemporary Environmental Issues of Landfill Leachate: Assessment and Remedies. Crit. Rev. Environ. Sci. Technol. 2015, 45, 472–590. [Google Scholar] [CrossRef]
  45. Wijekoon, P.; Koliyabandara, P.A.; Cooray, A.T.; Lam, S.S.; Athapattu, B.C.L.; Vithanage, M. Progress and Prospects in Mitigation of Landfill Leachate Pollution: Risk, Pollution Potential, Treatment and Challenges. J. Hazard. Mater. 2022, 421, 126627. [Google Scholar] [CrossRef]
  46. Wu, D.; Wang, B.H.; Xie, B. Validated Predictive Modelling of Sulfonamide and Beta-Lactam Resistance Genes in Landfill Leachates. J. Environ. Manag. 2019, 241, 374. [Google Scholar] [CrossRef]
  47. EPA. Technical Fact Sheet: Drinking Water Health Advisories for Four PFAS (PFOA, PFOS, GenX Chemicals, and PFBS). 2022. Available online: https://www.epa.gov/system/files/documents/2022-06/technical-factsheet-four-PFAS.pdf (accessed on 21 September 2023).
  48. Zhang, H.; Chen, Y.; Liu, Y.; Bowden, J.A.; Tolaymat, T.M.; Townsend, T.G.; Solo-Gabriele, H.M. Relationships between Per- and Polyfluoroalkyl Substances (PFAS) and Physical-Chemical Parameters in Aqueous Landfill Samples. Chemosphere 2023, 329, 138541. [Google Scholar] [CrossRef] [PubMed]
  49. Lachassagne, D.; Soubrand, M.; Casellas, M.; Gonzalez-Ospina, A.; Dagot, C. Impact of Sludge Stabilization Processes and Sludge Origin (Urban or Hospital) on the Mobility of Pharmaceutical Compounds Following Sludge Landspreading in Laboratory Soil-Column Experiments. Environ. Sci. Pollut. Res. 2015, 22, 17135–17150. [Google Scholar] [CrossRef] [PubMed]
  50. Wang, Y.; Lu, J.; Zhang, S.; Li, J.; Mao, L.; Yuan, Z.; Bond, P.L.; Guo, J. Non-Antibiotic Pharmaceuticals Promote the Transmission of Multidrug Resistance Plasmids through Intra- and Intergenera Conjugation. ISME J. 2021, 15, 2493–2508. [Google Scholar] [CrossRef] [PubMed]
  51. Wan, S.; Xia, M.; Tao, J.; Pang, Y.; Yu, F.; Wu, J.; Chen, S. Metagenomics Analysis Reveals the Microbial Communities, Antimicrobial Resistance Gene Diversity and Potential Pathogen Transmission Risk of Two Different Landfills in China. Diversity 2021, 13, 230. [Google Scholar] [CrossRef]
  52. Wen, P.; Huang, Y.; Qiu, Z.; Li, Q. Microbial Response during Treatment of Different Types of Landfill Leachate in a Semi-Aerobic Aged Refuse Biofilter. Chemosphere 2021, 262, 127822. [Google Scholar] [CrossRef] [PubMed]
  53. Saxena, V.; Padhi, S.K.; Pattanaik, L.; Bhatt, R. Simultaneous Removal of Carbon, Nitrogen, and Phosphorus from Landfill Leachate Using an Aerobic Granular Reactor. Environ. Technol. Innov. 2022, 28, 102657. [Google Scholar] [CrossRef]
  54. González-Cortés, J.J.; Valle, A.; Ramírez, M.; Cantero, D. Characterization of Bacterial and Archaeal Communities by DGGE and Next Generation Sequencing (NGS) of Nitrification Bioreactors Using Two Different Intermediate Landfill Leachates as Ammonium Substrate. Waste Biomass Valorization 2022, 13, 753–766. [Google Scholar] [CrossRef]
  55. Fan, X.T.; Li, H.; Chen, Q.L.; Zhang, Y.S.; Ye, J.; Zhu, Y.G.; Su, J.Q. Fate of Antibiotic Resistant Pseudomonas Putida and Broad Host Range Plasmid in Natural Soil Microcosms. Front. Microbiol. 2019, 10, 194. [Google Scholar] [CrossRef] [PubMed]
  56. Subirats, J.; Sànchez-Melsió, A.; Borrego, C.M.; Balcázar, J.L.; Simonet, P. Metagenomic Analysis Reveals That Bacteriophages Are Reservoirs of Antibiotic Resistance Genes. Int. J. Antimicrob. Agents 2016, 48, 163–167. [Google Scholar] [CrossRef]
  57. Dridi, B.; Fardeau, M.L.; Ollivier, B.; Raoult, D.; Drancourt, M. The Antimicrobial Resistance Pattern of Cultured Human Methanogens Reflects the Unique Phylogenetic Position of Archaea. J. Antimicrob. Chemother. 2011, 66, 2038–2044. [Google Scholar] [CrossRef] [PubMed]
  58. Wolak, I.; Czatzkowska, M.; Harnisz, M.; Jastrzębski, J.P.; Paukszto, Ł.; Rusanowska, P.; Felis, E.; Korzeniewska, E. Metagenomic Analysis of the Long-Term Synergistic Effects of Antibiotics on the Anaerobic Digestion of Cattle Manure. Energies 2022, 15, 1920. [Google Scholar] [CrossRef]
  59. Chen, Q.L.; Li, H.; Zhou, X.Y.; Zhao, Y.; Su, J.Q.; Zhang, X.; Huang, F.Y. An Underappreciated Hotspot of Antibiotic Resistance: The Groundwater near the Municipal Solid Waste Landfill. Sci. Total Environ. 2017, 609, 966–973. [Google Scholar] [CrossRef]
  60. Gwenzi, W.; Musiyiwa, K.; Mangori, L. Sources, Behaviour and Health Risks of Antimicrobial Resistance Genes in Wastewaters: A Hotspot Reservoir. J. Environ. Chem. Eng. 2020, 8, 102220. [Google Scholar] [CrossRef]
  61. Fuhrmeister, E.R.; Harvey, A.P.; Nadimpalli, M.L.; Gallandat, K.; Ambelu, A.; Arnold, B.F.; Brown, J.; Cumming, O.; Earl, A.M.; Kang, G.; et al. Evaluating the Relationship between Community Water and Sanitation Access and the Global Burden of Antibiotic Resistance: An Ecological Study. Lancet Microbe 2023, 4, e591–e600. [Google Scholar] [CrossRef]
  62. European Commission. Commission Implementing Decision (EU) 2022/1307. Off. J. Eur. Union 2022, L197, 117–121. [Google Scholar]
Figure 1. Location of sampling sites at the Getlini landfill.
Water 15 03349 g001
Figure 2. The concentrations of per- and polyfluoroalkyl substances (PFAS) (A) and pharmaceutical compounds (B) in the leachates sampled at the matured dumpsite (MDS), young dumpsite (YDS), and pond. PFBS—perfluorobutanesulfonic acid; PFOS—perfluorooctanesulfonic acid; PFNA—perfluorononanoic acid; PFOA—perfluorooctanoic acid; PFHpA—perfluoroheptanoic acid; PFHxA—perfluorohexanoic acid; PFPeA—perfluoro-n-pentanoic acid; PFBA—perfluorobutanoic acid.
Water 15 03349 g002
Figure 3. Changes in the functional diversity of the microbial community over a 96-h period in the three sources of infiltration: matured dumpsite (MDS), young dumpsite (YDS), and the pond. (A) Shannon diversity index; (B) NUSE index. The data are presented as the average of three replicate wells for each carbon substrate in EcoPlateTM.
Water 15 03349 g003
Figure 4. The microbial community structure at the phylum (A), order (B), genus (C), and species (D) levels in the leachates sampled at the matured dumpsite (MDS), young dumpsite (YDS), and pond. Only the taxon yields ≥ 1% in at least one sample are shown.
Water 15 03349 g004
Figure 5. Alpha diversity (E) is measured by the Chao1, Shannon, and Simpson indices.
Water 15 03349 g005
Figure 6. Confocal laser scanning micrographs of Pseudomonas putida LMKK650 after 28-day incubation in TSB (A), as well as leachate sampled at the pond (B), young dumpsite (YDS) (C) and matured dumpsite (MDS) (D). The scale bar is 15 μm.
Water 15 03349 g006
Table 1. Physicochemical characterization of leachates.
ParameterMDSYDSPond
pH8.158.168.15
EC (mS/cm)28.227.026.9
N (mg/L)262025602620
N-NH4 (mg/L)240016742238
COD (mg/L)788050156425
Table 2. The presence of AMR genes in the landfill leachate samples.
Antibiotic ClassCompounds Belonging to the Class of AntibioticsAMR GeneResistance MechanismPresence of AMR Gene
MDSYDSPond
LincosamidesLincomycin and clindamycinErm(35)antibiotic target alteration-XX
Erm(42)-X-
Erm(47)XXX
ErmBXXX
ErmCX-X
ErmFXXX
ErmGXXX
linGantibiotic inactivationXXX
lnuBX--
lnuCXXX
lnuF-XX
lnuG-XX
lsaEantibiotic target protection--X
SulfonamidesSulfisomidin, sulfathiazole, sulfapyridine, sulfamerazine, sulfadimidine, sulfadiazine, and phthalylsulfathiazolesul1antibiotic target replacementXXX
sul2XXX
sul4-XX
Disclaimer/Publisher’s Note: The statements, opinions and data contained in all publications are solely those of the individual author(s) and contributor(s) and not of MDPI and/or the editor(s). MDPI and/or the editor(s) disclaim responsibility for any injury to people or property resulting from any ideas, methods, instructions or products referred to in the content.

