
Application of Sustainability Index of Tidal River Management (SITRM) in the Lower Ganges–Brahmaputra–Meghna Delta


 , ,
, ,
Abstract
:1. Introduction
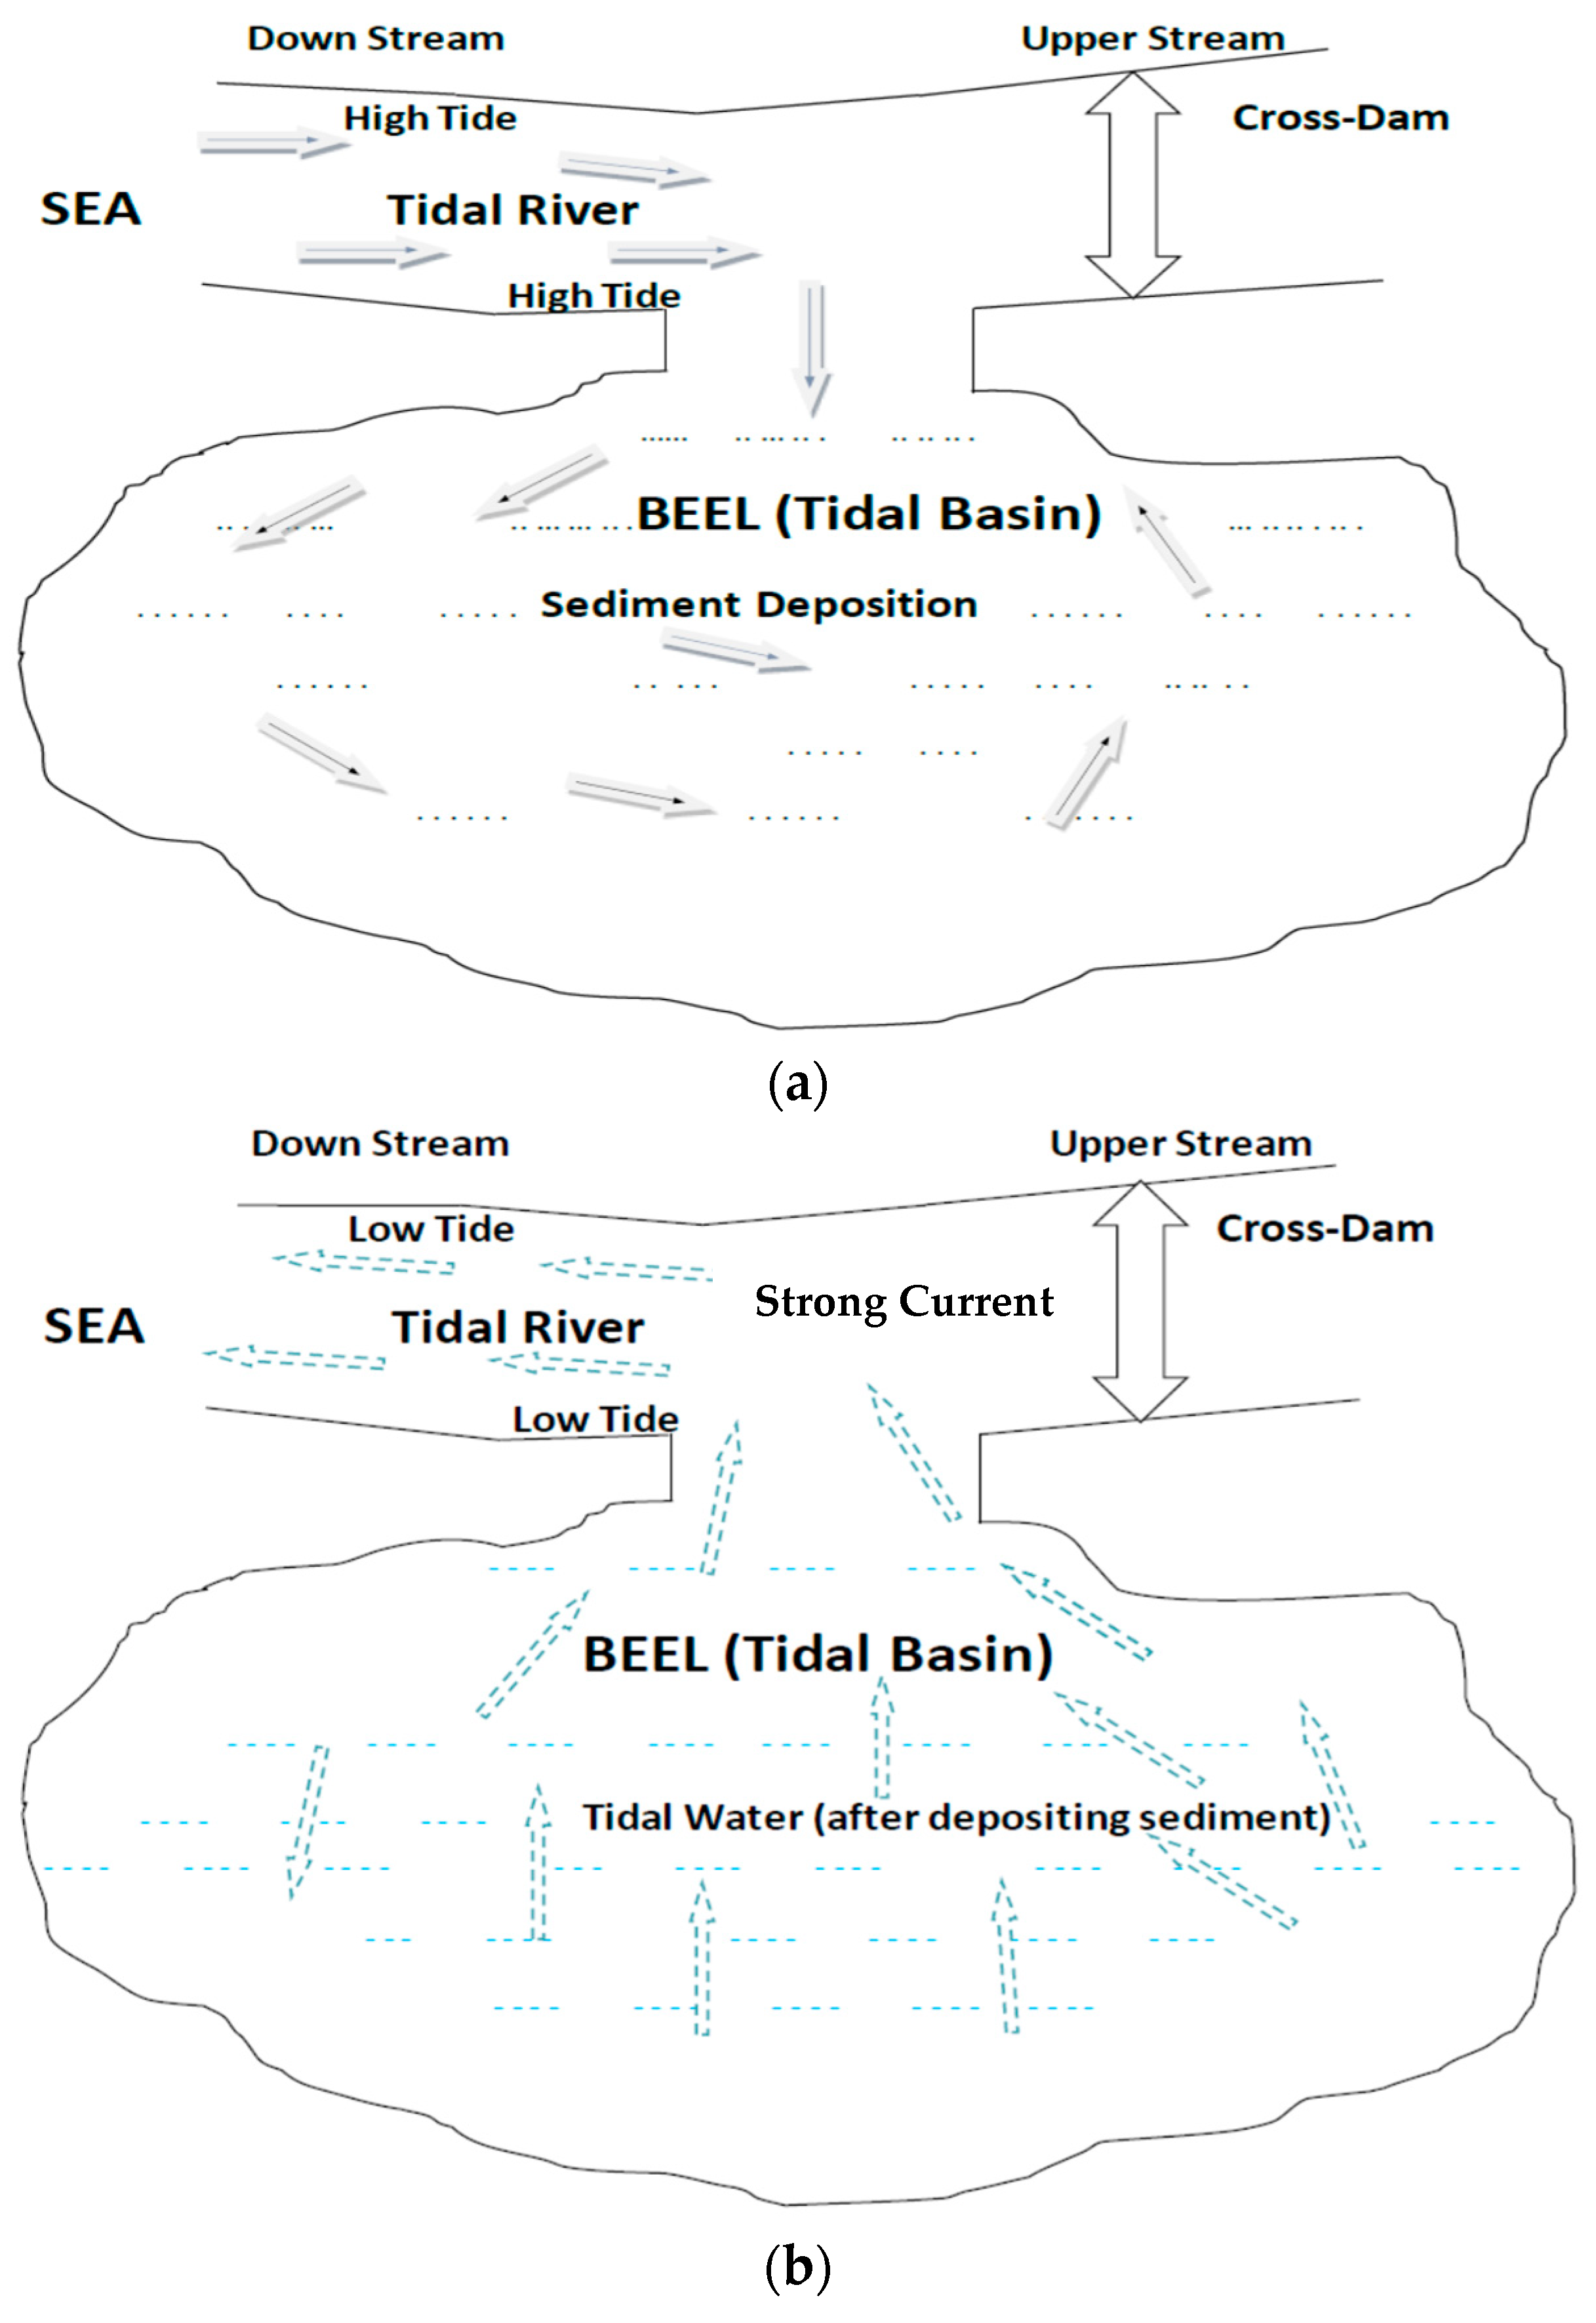
- (a)
- Comprehensive approach: This study aims to address the limitations of previous studies [5,13,14] by taking a comprehensive approach to examine the sustainability of TRM in the Southwest coastal region of Bangladesh. By considering all socio-economic, environmental, and institutional factors that contribute to TRM sustainability, this study provides a more holistic view of the challenges and opportunities that exist for achieving sustainable water resource management in the region.
- (b)
- Quantitative data: This study seeks to collect quantitative data on various sustainability indicators to provide a more rigorous assessment of TRM sustainability. This approach will enable policymakers and planners to measure the effectiveness of TRM in reducing flood susceptibility, managing sedimentation, maintaining water availability, improving drainage capacity, preserving biodiversity, etc.
- (c)
- Integrated water resource management: This study considers TRM within the broader context of integrated water resource management (IWRM), which emphasizes a holistic and systems-based approach to water resource management. By examining how TRM fits into the larger IWRM framework, this study provides insights into how TRM can contribute to socially fair, economically feasible, and environmentally sensitive water resource management in the region.
- What are the quantitative results of SITRM indicators?
- How is the sustainability of TRM measured by the SITRM?
1.1. Theoretical Background
1.2. The Components and Indicators of SITRM
2. Materials and Methods
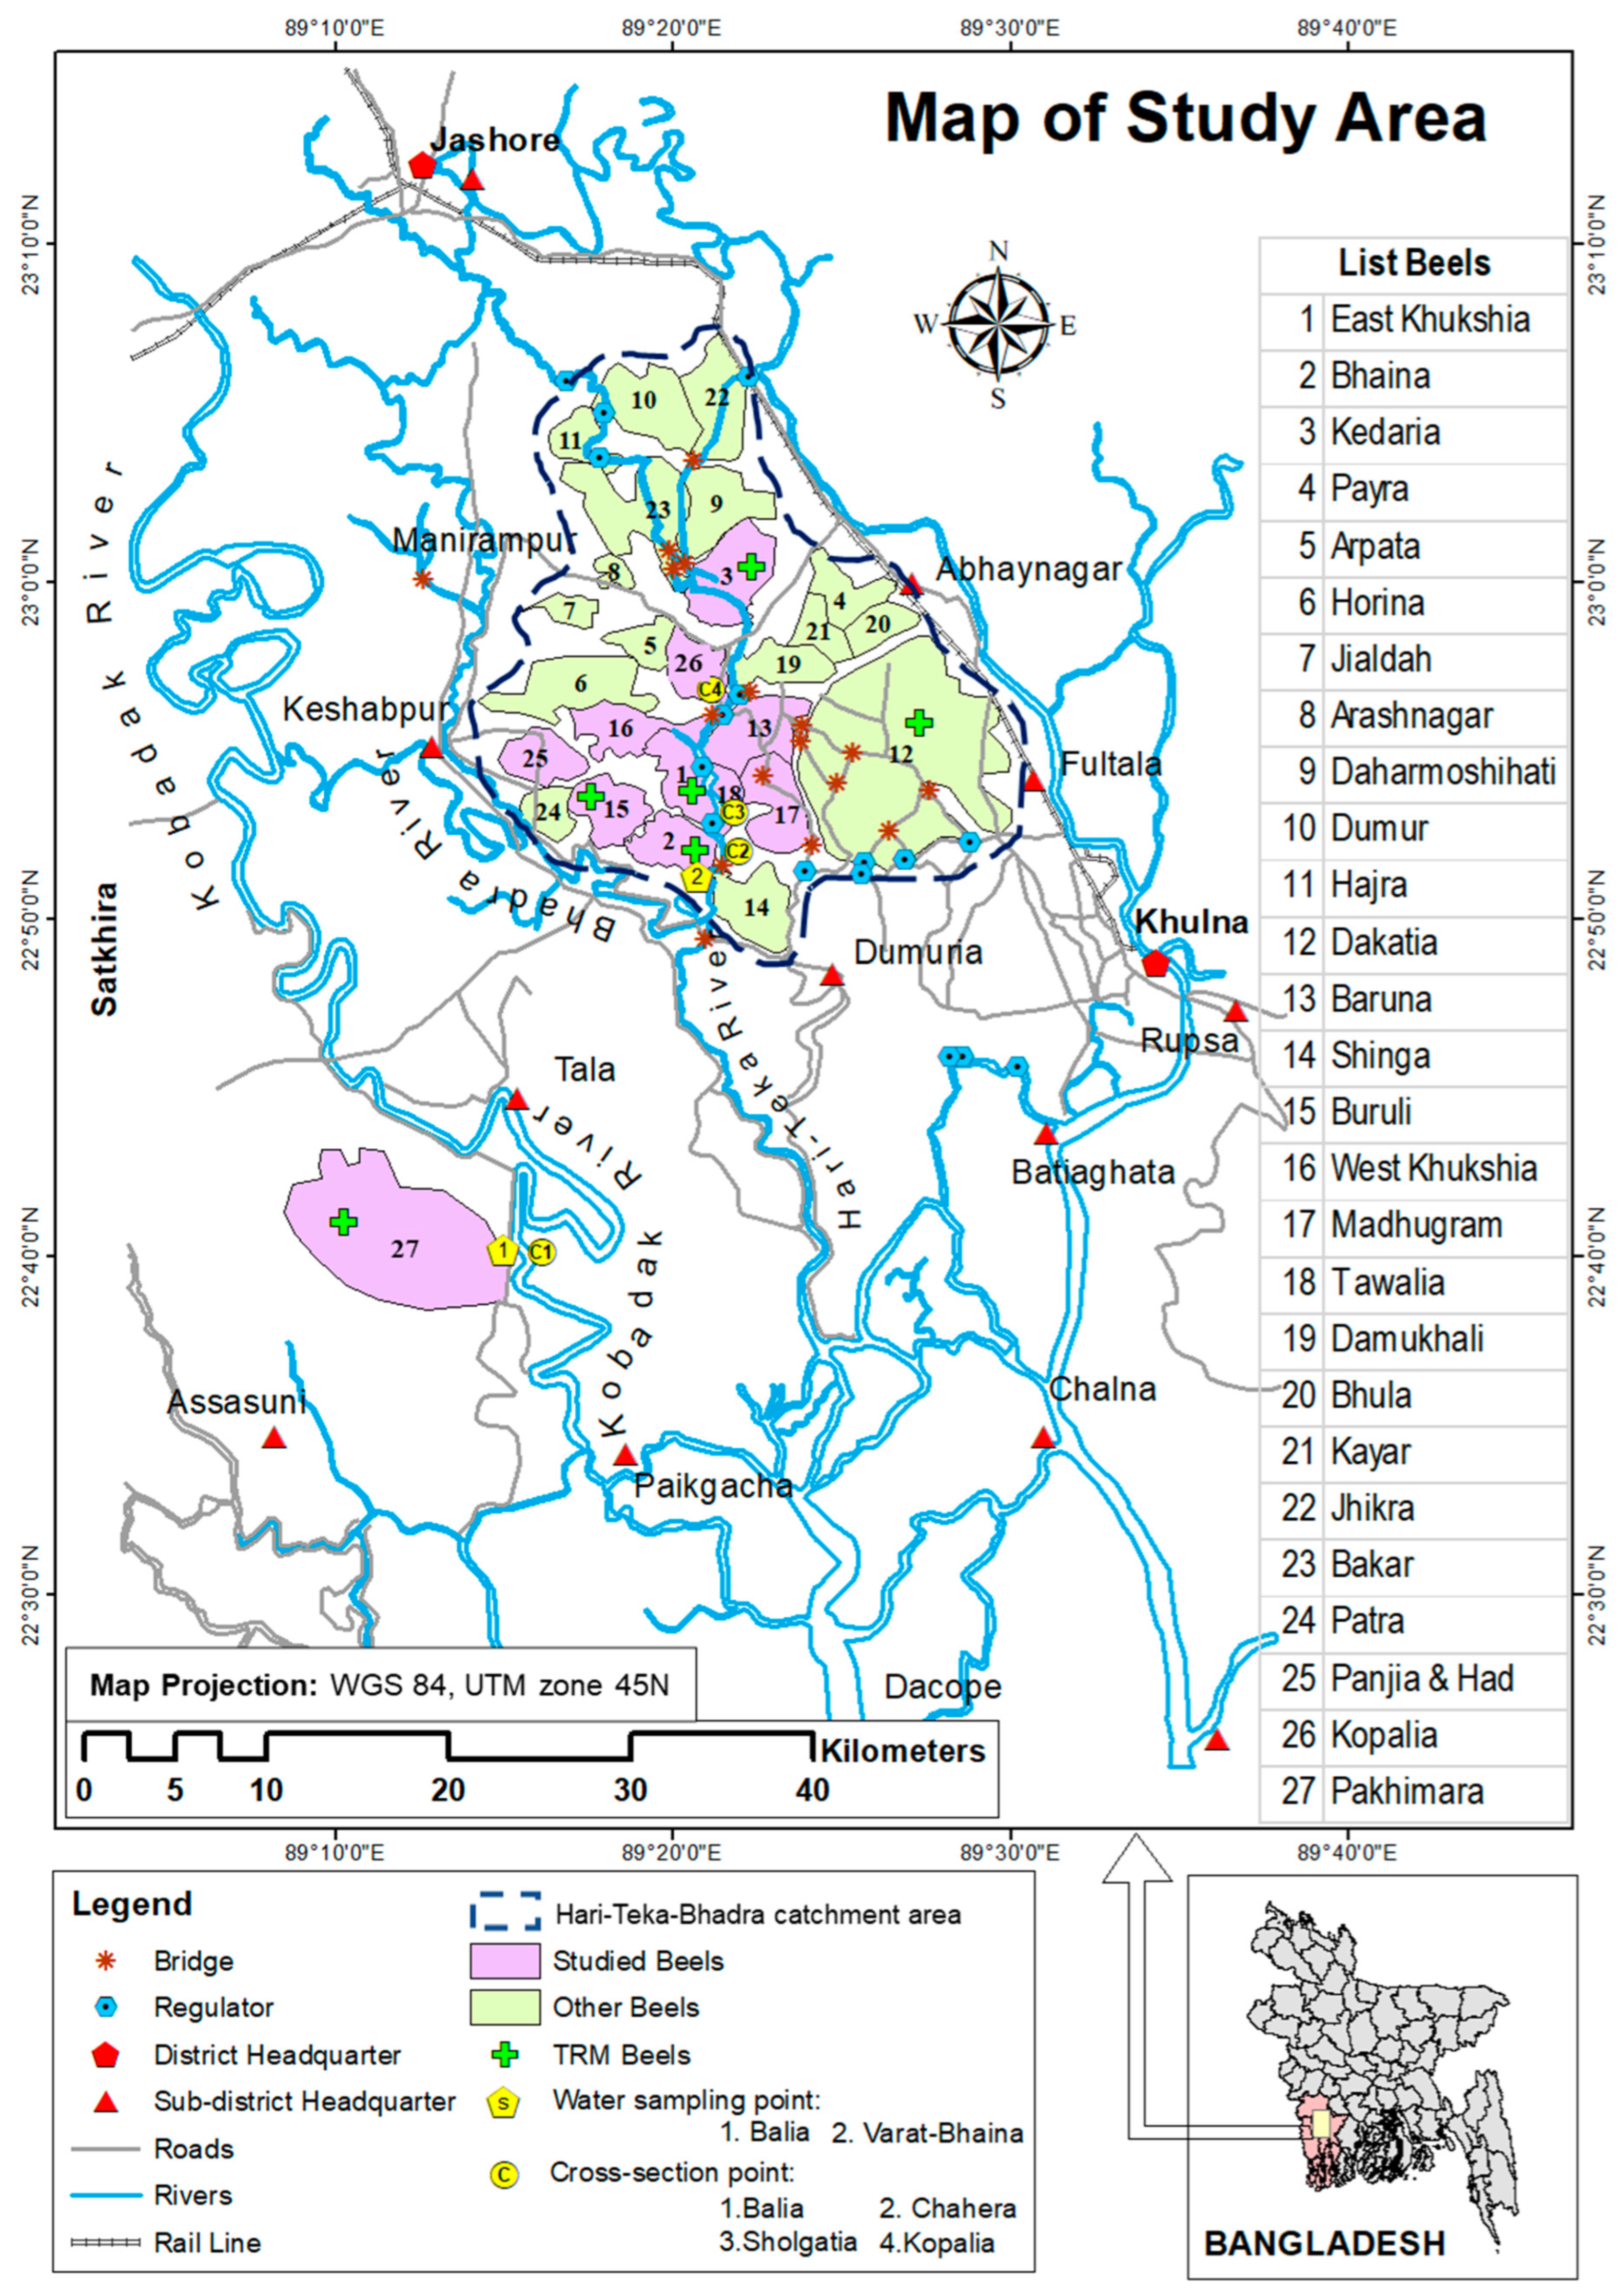
2.1. Study Area
2.1.1. Estimating the Land Elevation of the Tidal Basin
- Ge = the average land elevation of the tidal basin by TRM (m)
- SDB = the total quantity of sediment deposition on the tidal basin (m3)
- AL = the total area of land where sediment is deposited (ha).
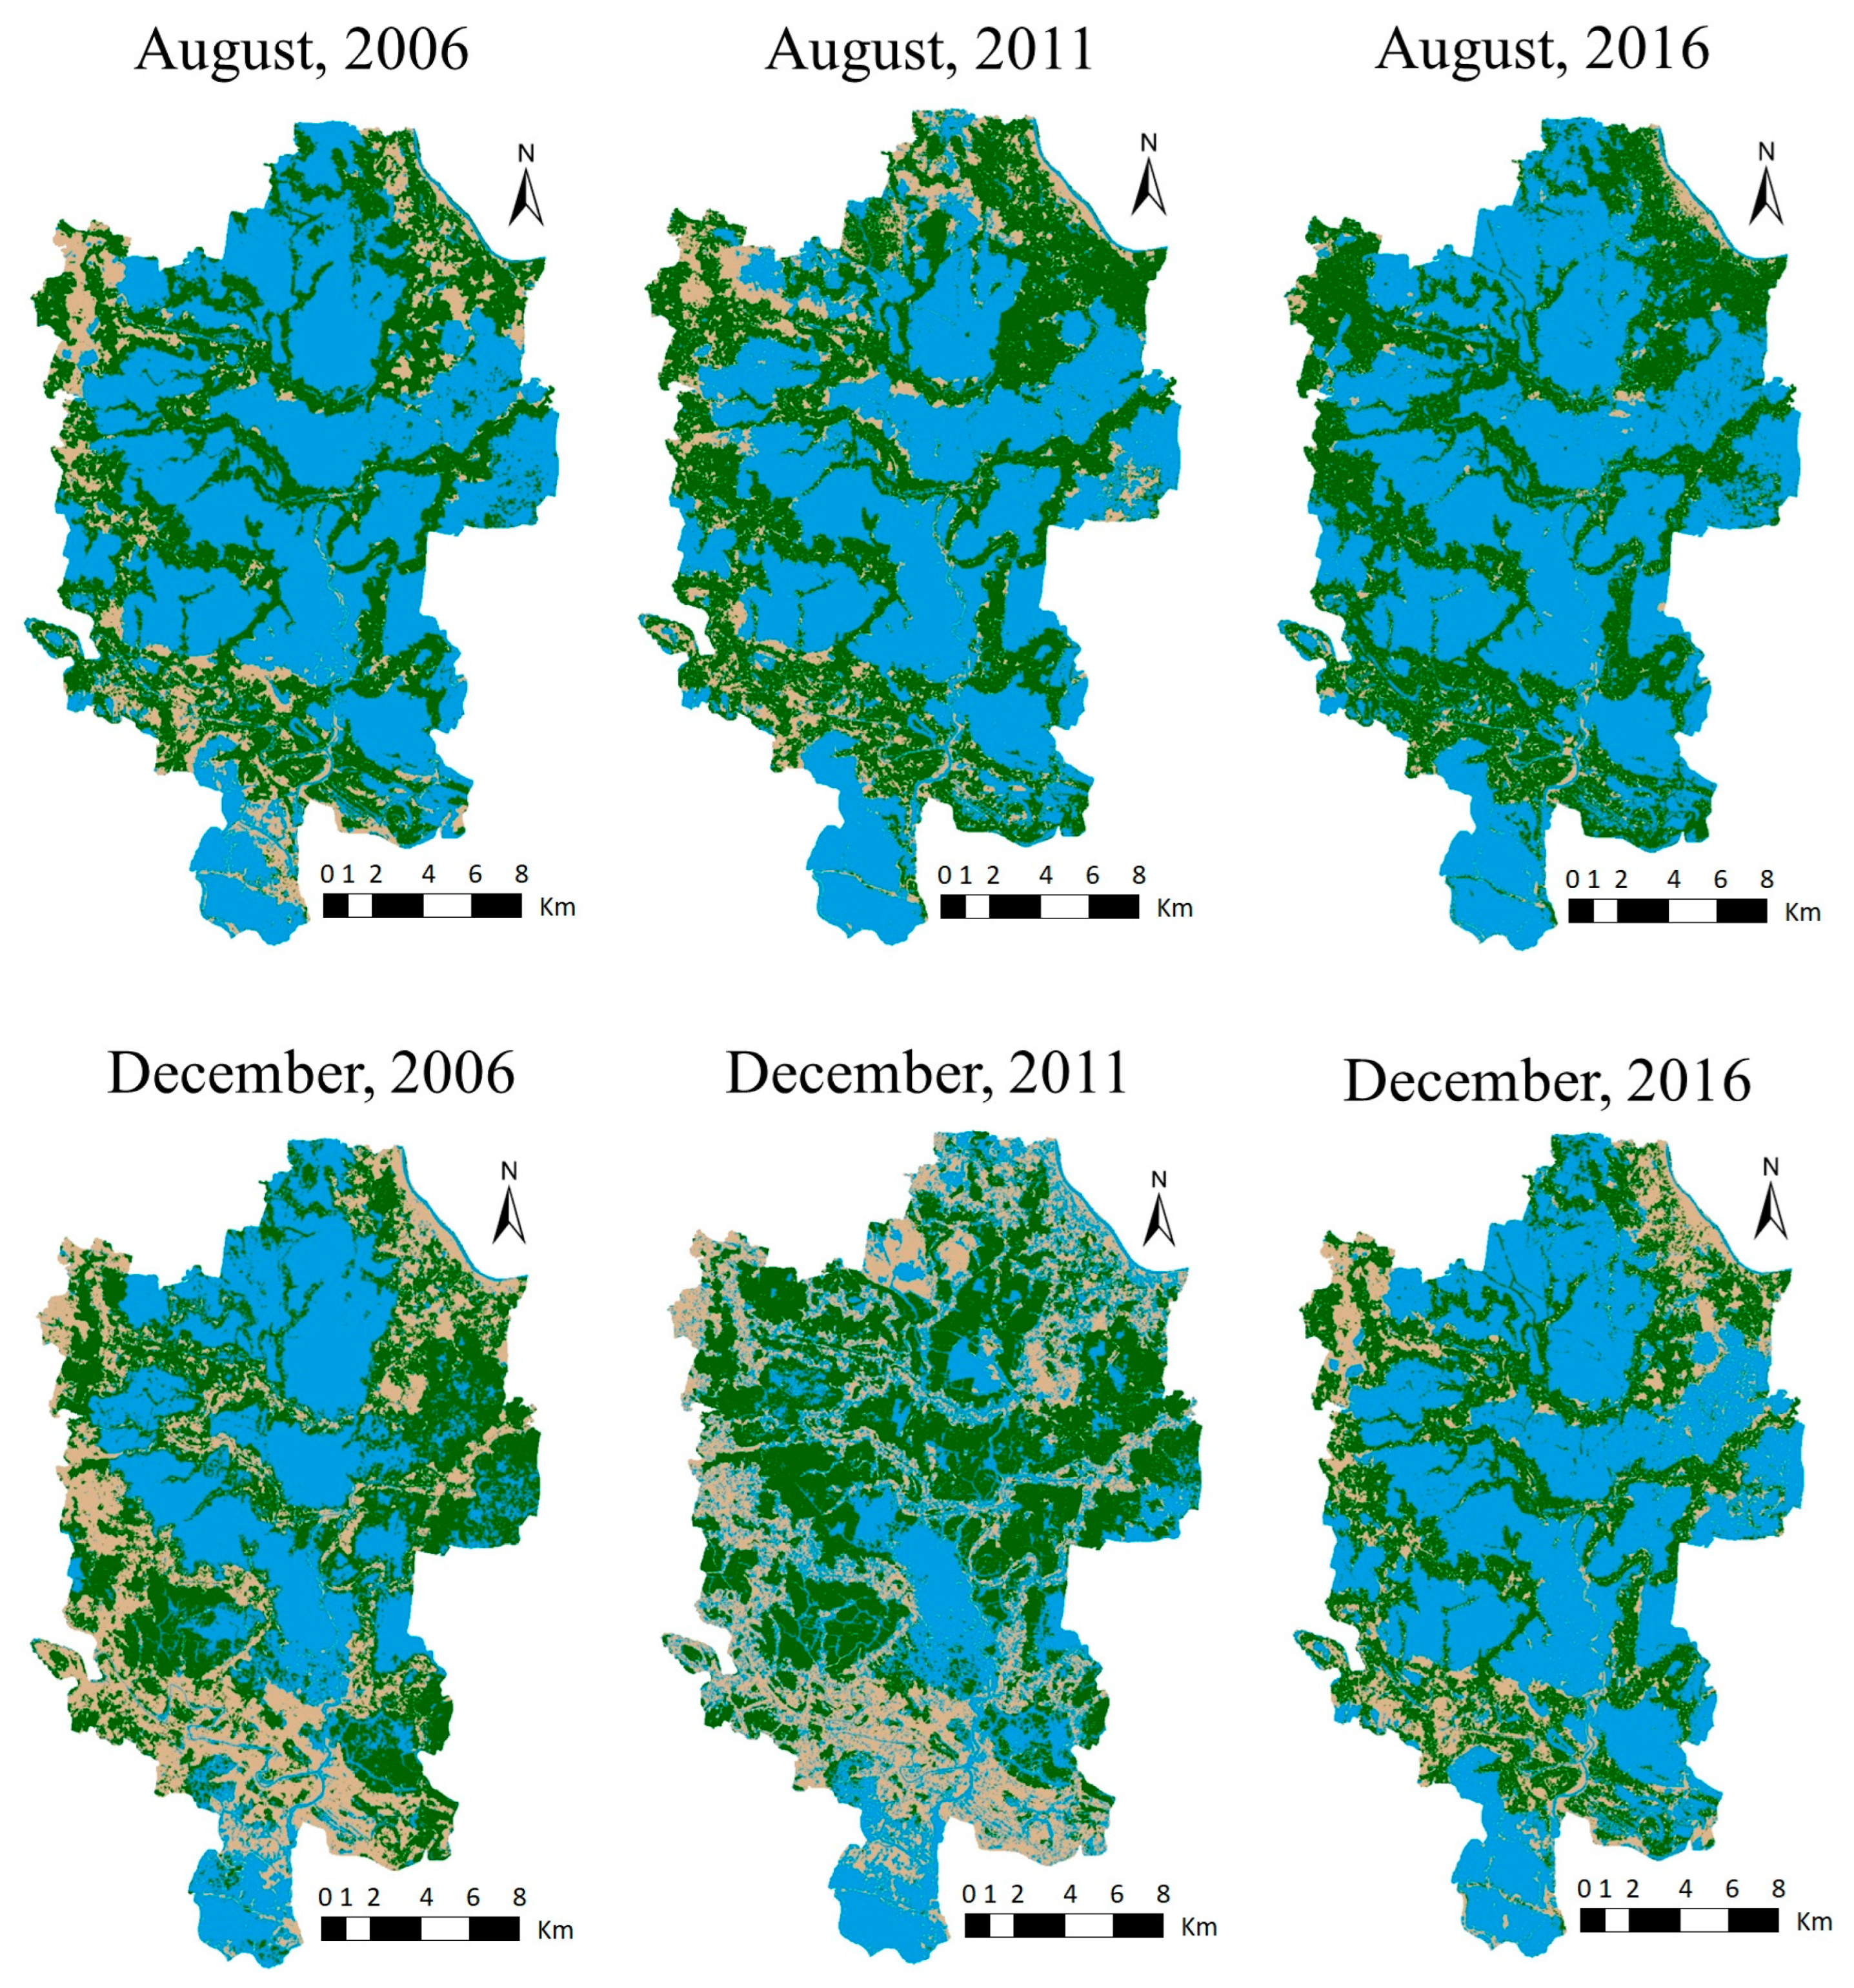
2.1.2. Assessing the LUC in the Hari–Teka–Bhadra Catchment
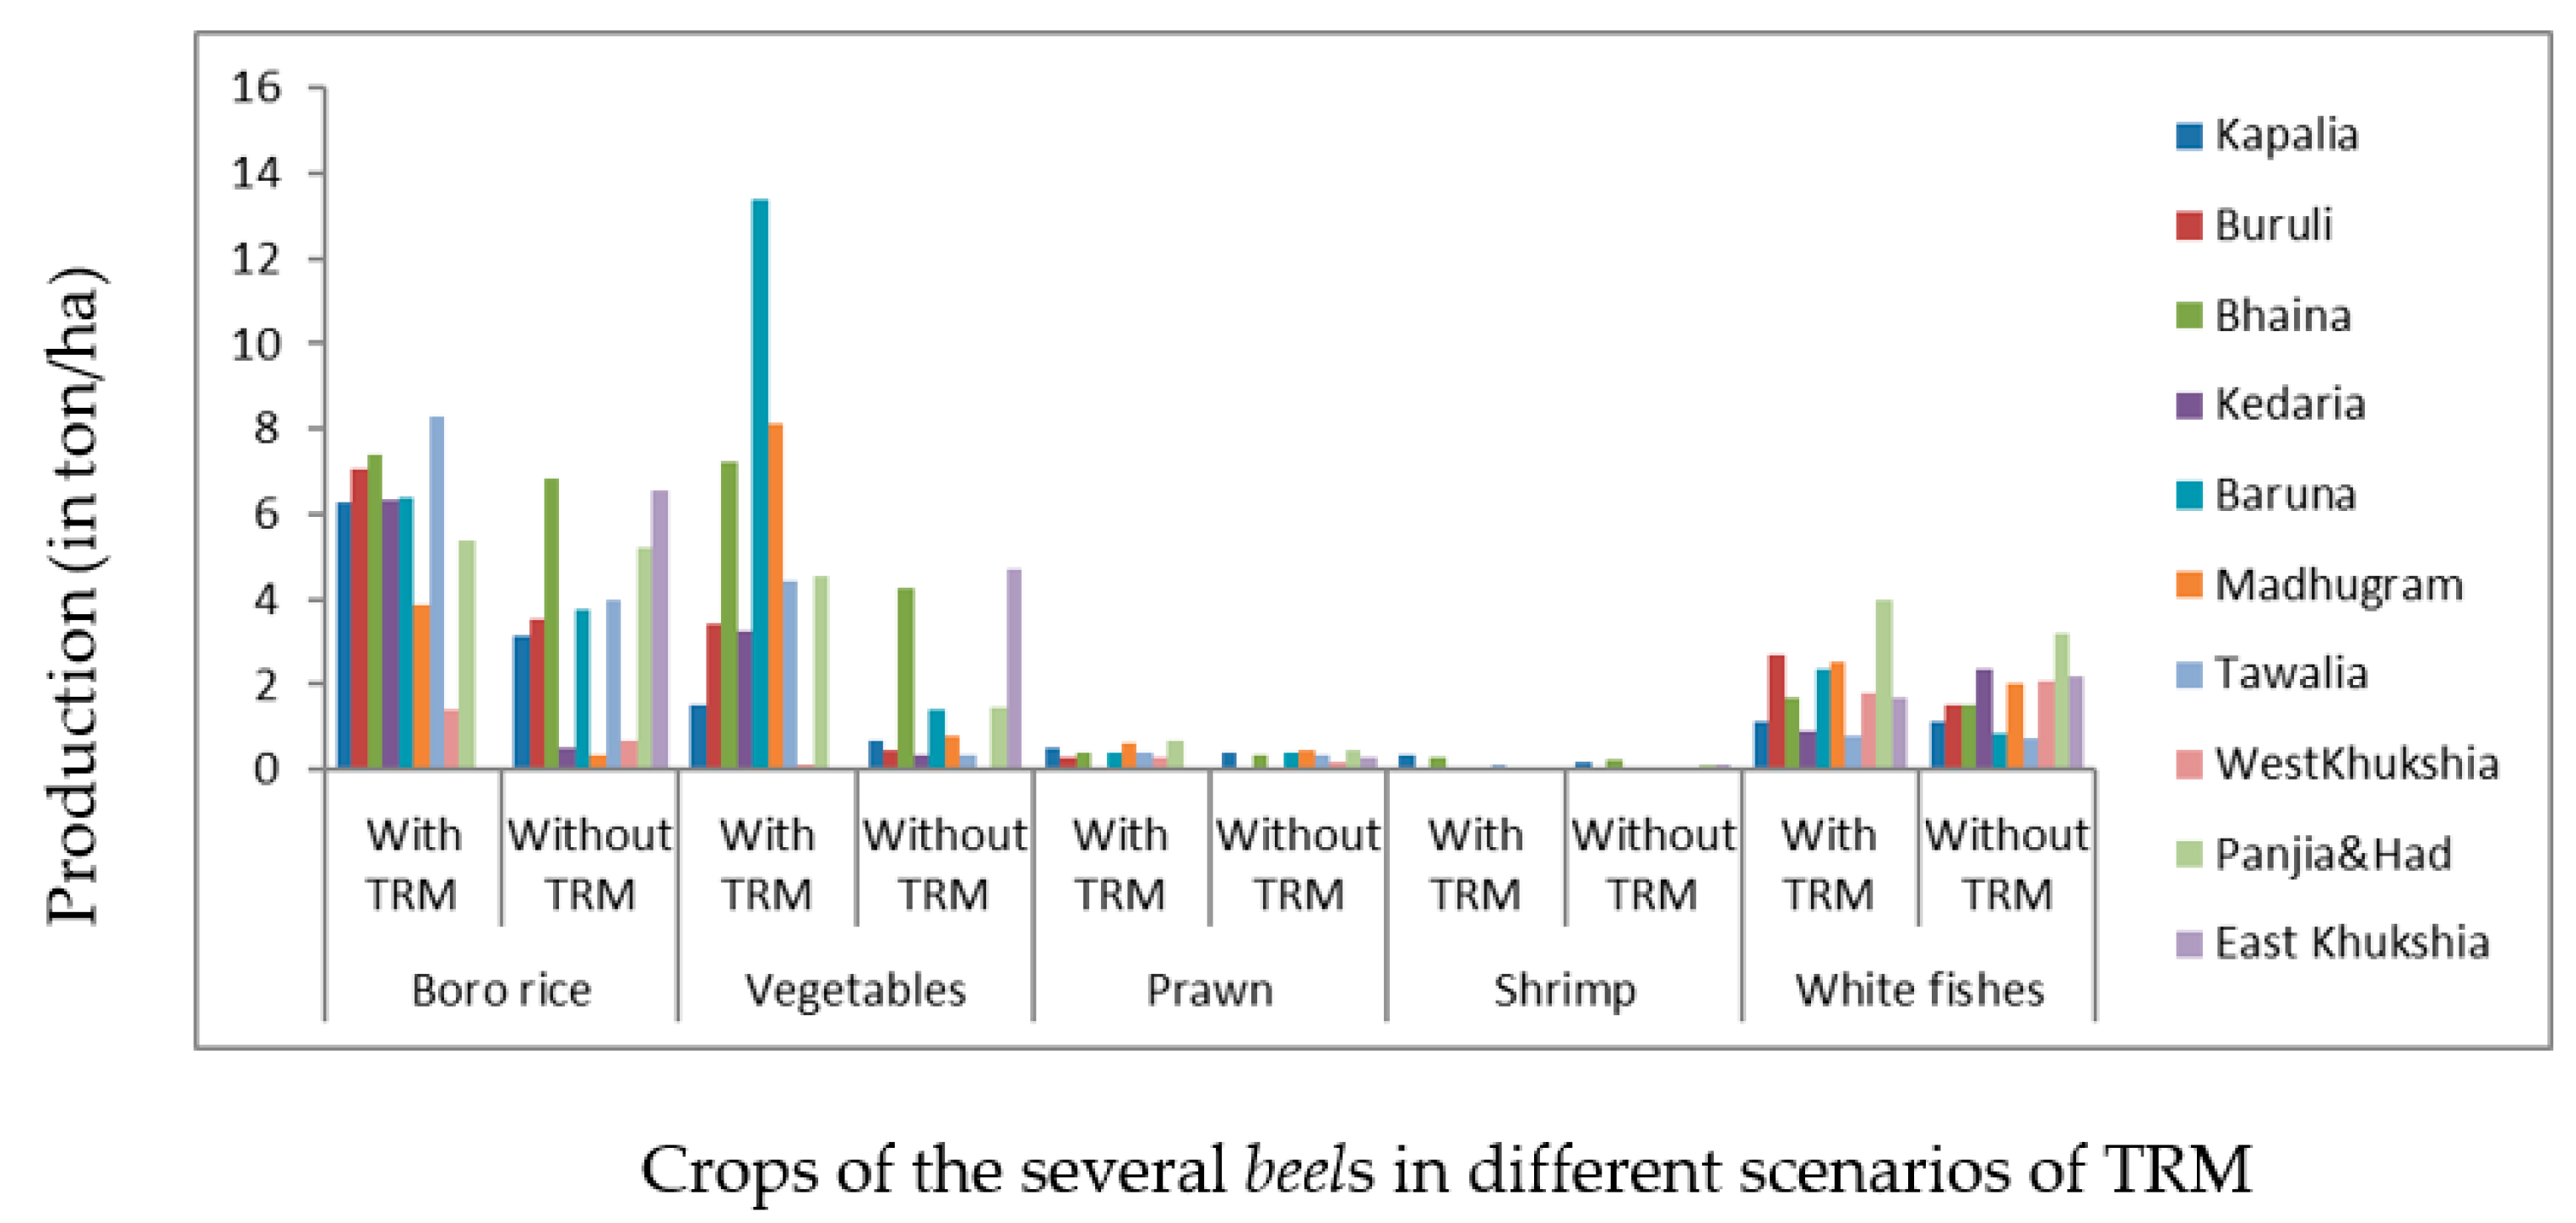
2.1.3. Assessing Changes in Crop Production in the Hari–Teka–Bhadra Catchment
2.1.4. Assessing the Changes in Livestock and Trees, Employment, and Health Impact in the Hari–Teka–Bhadra Catchment
2.1.5. Assessing SITRM Indicators through the Likert Scale
2.1.6. Assessing the Sustainability of TRM Using the SITRM Framework
3. Results
3.1. Assessment of the SITRM Indicators
3.1.1. Estimation of Land Elevation of Tidal Basins
3.1.2. Assessment of the LUC in the Hari–Teka–Bhadra Catchment
3.1.3. Assessment of the Changes in Agricultural Production of the Hari–Teka–Bhadra Catchment
3.1.4. Assessment of the Changes in Terrestrial Biodiversity, Employment, Health Impact, and Migration of the Hari–Teka–Bhadra Catchment
3.1.5. Assessment of SITRM Indicators through the Likert Scale
3.1.6. Assessment of Land Reclamation, Compensation, and Alternative Livelihood Issues of Hari–Teka–Bhadra Catchment
3.2. Measurement of the Sustainability of TRM by the SITRM Framework
4. Discussion
5. Conclusions
Policy Recommendations
Supplementary Materials
Author Contributions
Funding
Data Availability Statement
Conflicts of Interest
Abbreviations
| SI | Sustainability index |
| TRM | Tidal River Management |
| WMP | Watershed Management Plan |
| SITRM | Sustainability index of tidal river management |
| GBM | Ganges–Brahmaputra–Meghna |
| USGS | United States Geological Survey |
| WSI | Watershed Sustainability Index |
| CWSI | Canadian Water Sustainability Index |
| WJWSI | West Java Water Sustainability Index |
| WPI | Water Poverty Index |
| SES | Social–ecological system |
| KII | Key informant interviews |
| CBOs | Community-based organizations |
| NGOs | Non-governmental organizations |
| GOs | Government offices |
| IWRM | Integrated Water Resource Management |
References
- Masud, M.M.A.; Moni, N.N.; Azadi, H.; Van Passel, S. Sustainability impacts of tidal river management: Towards a conceptual framework. Ecol. Indic. 2018, 85, 451–467. [Google Scholar] [CrossRef]
- Zevenbergen, C.; Khan, S.A.; van Alphen, J.; Terwisscha van Scheltinga, C.; Veerbeek, W. Adaptive delta management: A comparison between the Netherlands and Bangladesh Delta Program. Int. J. River Basin Manag. 2018, 16, 299–305. [Google Scholar] [CrossRef]
- Sanaullah, M. Delta Plan 2100: Dynamics in Bangladesh Development. The Daily Sun (A National Newspaper of Bangladesh), 22 June 2021. [Google Scholar]
- Adnan, M.S.G.; Talchabhadel, R.; Nakagawab, H.; Hall, J.W. The potential of tidal river management for flood alleviation in South-western Bangladesh. Sci. Total Environ. 2020, 731, 138747. [Google Scholar] [CrossRef] [PubMed]
- Islam, M.F.; Middelkoop, H.; Schot, P.P.; Dekker, S.C.; Griffioen, J. Enhancing effectiveness of tidal river management in southwest Bangladeshpolders by improving sedimentation and shortening inundation time. J. Hydrol. 2020, 590, 125228. [Google Scholar] [CrossRef]
- Salam, M.T.B.; Amin, A.I.; Afroz, T.; Masud, M.M.A. Environmental and Institutional Impacts of Tidal River Management: A Case Study on Pakhimara Tidal Basin in Southwestern Bangladesh. Caraka Tani. J. Sustain. Agric. 2021, 36, 295–307. [Google Scholar] [CrossRef]
- Masud, M.M.A.; Azad, A.K.; Islam, M.S. The Challenges of Sediment Management in Tidal Basin: Application of Indigenous Knowledge for Tidal River Management in the Southwest Coastal Bangladesh. People’s Pref. 2018, 1, 217–237. [Google Scholar]
- Masud, M.M.A.; Azad, A.K. The role of tidal river management for sustainable agriculture. In Proceedings of the 2nd International Conference on Sustainable Development, Dhaka, Bangladesh, 16–18 February 2018; pp. 189–200. [Google Scholar]
- Seijger, C.; Datta, D.K.; Douvena, W.; van Halsema, G.; Khan, M.F. Rethinking sediments, tidal rivers and delta livelihoods: Tidal river management as a strategic innovation in Bangladesh. Water Policy 2019, 21, 108–126. [Google Scholar] [CrossRef]
- Gain, A.K.; Ashik-Ur-Rahman, M.; Vafeidis, A. Exploring human-nature interaction on the coastal floodplain in the Ganges-Brahmaputra delta through the lens of Ostrom’s social-ecological systems framework. Environ. Res. Commun. 2019, 1, 051003. [Google Scholar] [CrossRef]
- Mutahara, M.; Warner, J.; Khan, M.S.A. Analyzing the coexistence of conflict and cooperation in a regional delta management system: Tidal River Management (TRM) in the Bangladesh delta. Environ. Policy Gov. 2019, 29, 326–343. [Google Scholar] [CrossRef]
- Ionus, O.M. Watershed Sustainability Index Development and Application: Case Study of the Motru River in Romania. Pol. J. Environ. Stud. 2017, 26, 2095–2105. [Google Scholar] [CrossRef]
- GoB. Bangladesh Delta Plan 2100 Formulation Project, Inception Report; Planning Commission, Government of Bangladesh (GoB): Dhaka, Bangladesh, 2014. [Google Scholar]
- Guerra, J.D.P. How to Match Real-World Problems with Solutions in Bangladesh. Master’s Thesis, Delft University of Technology, Delft, The Netherlands, 2018. [Google Scholar]
- Paul, A.; Nath, B.; Abbas, M.R. Tidal River Management and its implication in disaster management: A geospatial study on Hari-Teka river basin, Jashore, Bangladesh. Int. J. Geom. Geosci. 2013, 4, 125–135. [Google Scholar]
- Mutahara, M. Turning the Tide? The Role of Participation and Learning in Strengthening Tidal River Management in the Bangladesh Delta. Ph.D. Thesis, Wageningen School of Social Science, Wageningen University, Wageningen, The Netherlands, 2018. [Google Scholar]
- Ladi, T.; Mahmoudpour, A.; Sharifi, A. Assessing impacts of the water poverty index components on the human development index in Iran. Habitat Int. 2021, 113, 102375. [Google Scholar] [CrossRef]
- Koirala, S.; Fang, Y.; Dahal, N.M.; Zhang, C.; Pandey, B.; Shrestha, S. Application of Water Poverty Index (WPI) in Spatial Analysis of Water Stress in Koshi River Basin, Nepal. Sustainability 2020, 12, 727. [Google Scholar] [CrossRef]
- Attari, J.; Mojahedi, S.A.; Sarraf, A. Assessing of canadian water sustainability ındex (CWSI) in ahwaz county located in south west of Iran. J. Biodivers. Environ. Sci. 2014, 5, 183–194. [Google Scholar]
- Juwana, I.; Muttil, N.; Perera, B.J.C. Application of west java water sustainability index to three water catchments in west java. Indones. Ecol. Indic. 2016, 70, 401–408. [Google Scholar] [CrossRef]
- Masud, M.M.A. Tidal River Management and Its Impacts in the Southwest Region of Bangladesh. Ph.D. Thesis, Environmental Science Discipline, Khulna University, Khulna, Bangladesh, 2019. [Google Scholar]
- Boori, M.S.; Voženílek, V.; Choudhary, K. Land use/cover disturbance due to tourism in Jeseníky Mountain, Czech Republic: A remote sensing and GIS based approach. Egypt. J. Remote Sens. Space Sci. 2015, 18, 17–26. [Google Scholar] [CrossRef]
- Butt, A.; Shabbir, R.; Ahmad, S.S.; Aziz, N.; Nawaz, M.; Shah, M.T.A. Land cover classification and change detection analysis of Rawal watershed using remote sensing data. J. Biodivers. Environ. Sci. 2015, 6, 236–248. [Google Scholar]
- Rawat, J.S.; Biswas, V.; Kumar, M. Changes in land use/cover using geospatial techniques: A case study of Ramnagar town area, district Nainital, Uttarakhand, India. Egypt. J. Remote Sens. Space Sci. 2013, 16, 111–117. [Google Scholar] [CrossRef]
- Rawat, J.S.; Kumar, M. Monitoring land use/cover change using remote sensing and GIS techniques: A case study of Hawalbagh block, district Almora, Uttarakhand, India. Egypt. J. Remote Sens. Space Sci. 2015, 18, 77–84. [Google Scholar] [CrossRef]
- Alam, A.; Bhat, M.S.; Maheen, M. Using Landsat satellite data for assessing the land use and land cover change in Kashmir valley. GeoJournal 2020, 85, 1529–1543. [Google Scholar] [CrossRef]
- Tewabe, D.; Fentahun, T. Assessing land use and land cover change detection using remote sensing in the Lake Tana Basin, Northwest Ethiopia. Cogent Environ. Sci. 2020, 6, 1778998. [Google Scholar] [CrossRef]
- Wan, Z.; Dai, J.; Pan, L.; Han, J.; Li, Z.; Dong, K. Simulation Study on Nitrogen Pollution in Shallow Groundwater in Small Agricultural Watersheds in the Huixian Wetland. Water 2022, 14, 3657. [Google Scholar] [CrossRef]
- BWDB. Salinity Level Dataset, Hydrology Section; Bangladesh Water Development Board (BWDB): Dhaka, Bangladesh, 2018. [Google Scholar]
- IWM. Special Monitoring of Rivers and Tidal Basin For tidal River Management, Draft Final Report; Institute of Water Modelling (IWM): Dhaka, Bangladesh, 2002; Volume II. [Google Scholar]
- Paola, C.; Twilley, R.R.; Edmonds, D.A.; Kim, W.; Mohrig, D.; Parker, G.; Viparelli, E.; Voller, V.R. Natural Processes in Delta Restoration: Application to the Mississippi Delta. Annu. Rev. Mar. Sci. 2011, 3, 67–91. [Google Scholar] [CrossRef] [PubMed]
- Gain, A.K.; Benson, D.; Rahman, R.; Datta, D.K.; Rouillard, J.J. Tidal river management in the south west Ganges-Brahmaputra delta in Bangladesh: Moving towards a transdisciplinary approach? Environ. Sci. Policy 2017, 75, 111–120. [Google Scholar] [CrossRef]
- McDowell, G.; Koppes, M. Robust adaptation research in high mountains: Integrating the scientific, social, and ecological dimensions of glacio-hydrological change. Water 2017, 9, 739. [Google Scholar] [CrossRef]
- Hossain, M.S.; Dearing, J.; Rahman, M.M.; Salehin, M. Recent changes in ecosystem services and human well-being in the Bangladesh coastal zone. Reg. Environ. Chang. 2016, 16, 429–443. [Google Scholar] [CrossRef]
- Van der Deijl, E.C.; Van der Perk, M.; Middelkoop, H. Factors controlling sediment trapping in two freshwater tidal wetlands in the Biesbosch area, The Netherlands. J. Soils Sediments 2017, 17, 2620–2636. [Google Scholar] [CrossRef]
- Vollmer, D.; Regan, H.M.; Andelman, S.J. Assessing the sustainability of freshwater systems: A critical review of composite indicators. Ambio 2016, 45, 765–780. [Google Scholar] [CrossRef] [PubMed]
- De Die, L. Tidal River Management: Temporary Depoldering to Mitigate Drainage Congestion in the Southwest Delta of Bangladesh. Master’s Thesis, Wageningen University, Wageningen, The Netherlands, 2013. [Google Scholar]
- Juwana, I. Development of a Water Sustainability Index for West Java, Indonesia. Ph.D. Thesis, School of Engineering and Science Faculty of Health, Engineering and Science, Victoria University, Melbourne, Australia, 2012. [Google Scholar]
- Kothari, C.R. Research Methodology: Methods & Techniques, 2nd ed.; Wishwa Prakashan: New Delhi, India, 2004. [Google Scholar]
- Ahuchaogu, I.I.; Ewemoje, T.A.; Isaiah, P.S. Estimation of Watershed Sustainability Index of University of Uyo Watershed Using UNESCO-IHP Help Tool. J. Eng. Res. Rep. 2019, 8, 1–9. [Google Scholar] [CrossRef]

| Component | Indicator | Sub-Indicator | Threshold Values | ||||||
|---|---|---|---|---|---|---|---|---|---|
| Standard Values | With-TRM | Score | |||||||
| Max | Min | Max | Min | Earned | Fixed | ||||
| Tidal River | Tidal flow | High tide | 600 a | <550 b | 649 | 612 | 2.5 | 2.5 | |
| Low tide | 250 a | <200 b | 252 | 224 | 2.5 | 2.5 | |||
| Drainage capacity | Depth | 12 a | <10 b | 13 | - | 2.5 | 2.5 | ||
| Width | 75 a | <70 b | 77 | - | 2.5 | 2.5 | |||
| Riverbank erosion | - | 1 a | 0 b | 0.48 | - | 2.4 | 5 | ||
| Sediment Management | Sedimentation | - | >5 b | 0 a | - | 0 | 5 | 5 | |
| Waterlogging | Monsoon | 55 a | <50 b | 53 | - | 1.5 | 2.5 | ||
| Post-monsoon | 70 a | <35 b | 72 | - | 2.5 | 2.5 | |||
| Land reclamation | - | 100 a | 0 b | 40 | - | 2 | 5 | ||
| Environment | Crop production | Paddy (Boro) | 3.5 a | <3 b | 3.54 | - | 1.5 | 1.5 | |
| Vegetables | 4.5 a | <3.5 b | 4.6 | - | 1.5 | 1.5 | |||
| Shrimp + Prawn | 0.5 a | <0.4 b | 0.45 | - | 1 | 2 | |||
| Vegetation with settlement | Monsoon | 15 a | <12 b | 16 | - | 2.5 | 2.5 | ||
| Post-monsoon | 30 a | <25 b | 33 | - | 2.5 | 2.5 | |||
| Rising sea levels | - | 0.5 a | <0.4 b | 1.1 | 0 | 5 | 5 | ||
| Employment | - | 25 a | <20 b | 23 | - | 3 | 5 | ||
| Salinity | - | >2 b | <1 a | 1.2 | 0.8 | 4.5 | 5 | ||
| Terrestrial biodiversity | Livestock | Birds | 10 a | 0 b | 23.6 | - | 1 | 1 | |
| 4-legged | 5 a | 0 b | 2.3 | - | 2 | 2 | |||
| Trees | Fruit | 10 a | 0 b | 17 | - | 1 | 1 | ||
| Timber | 15 a | 0 b | 25.2 | - | 1 | 1 | |||
| Migration | Temporary | >30 b | 10 a | 13 | - | 2.1 | 2.5 | ||
| Permanent | >1 b | 0 a | 0.5 | - | 1.3 | 2.5 | |||
| Human Health | Health impact | - | >100 b | 0 a | 29 | - | 3.6 | 5 | |
| Institution (Community participation) | Awareness and coordination | Awareness | 100 a | 0 b | 78 | - | 2 | 2.5 | |
| Coordination | 100 a | 0 b | 48 | - | 1.2 | 2.5 | |||
| Compensation | Marginal farmers | 100 a | 0 b | 13 | 0.5 | 4 | |||
| Other farmers | 100 a | 0 b | 58 | - | 0.6 | 1 | |||
| LUC | Paddy (Boro) | 80 a | <60 b | 77 | - | 2.1 | 2.5 | ||
| Vegetables | 50 a | <40 b | 52 | - | 2.5 | 2.5 | |||
| Alternative livelihoods | - | 100 a | 0 b | - | 0 | 0 | 5 | ||
| Institution (Governance) | Rotation of TRM | - | 1 a | 0 b | 0.48 | - | 2.4 | 5 | |
| Water Governance | - | 1 a | 0 b | 0.72 | - | 3.6 | 5 | ||
Disclaimer/Publisher’s Note: The statements, opinions and data contained in all publications are solely those of the individual author(s) and contributor(s) and not of MDPI and/or the editor(s). MDPI and/or the editor(s) disclaim responsibility for any injury to people or property resulting from any ideas, methods, instructions or products referred to in the content. |
© 2023 by the authors. Licensee MDPI, Basel, Switzerland. This article is an open access article distributed under the terms and conditions of the Creative Commons Attribution (CC BY) license (https://creativecommons.org/licenses/by/4.0/).
Share and Cite
Masud, M.M.A.; Azadi, H.; Azad, A.K.; Goli, I.; Pietrzykowski, M.; Dogot, T. Application of Sustainability Index of Tidal River Management (SITRM) in the Lower Ganges–Brahmaputra–Meghna Delta. Water 2023, 15, 3159. https://doi.org/10.3390/w15173159
Masud MMA, Azadi H, Azad AK, Goli I, Pietrzykowski M, Dogot T. Application of Sustainability Index of Tidal River Management (SITRM) in the Lower Ganges–Brahmaputra–Meghna Delta. Water. 2023; 15(17):3159. https://doi.org/10.3390/w15173159
Chicago/Turabian StyleMasud, Md. Mahedi Al, Hossein Azadi, Abul Kalam Azad, Imaneh Goli, Marcin Pietrzykowski, and Thomas Dogot. 2023. "Application of Sustainability Index of Tidal River Management (SITRM) in the Lower Ganges–Brahmaputra–Meghna Delta" Water 15, no. 17: 3159. https://doi.org/10.3390/w15173159
APA StyleMasud, M. M. A., Azadi, H., Azad, A. K., Goli, I., Pietrzykowski, M., & Dogot, T. (2023). Application of Sustainability Index of Tidal River Management (SITRM) in the Lower Ganges–Brahmaputra–Meghna Delta. Water, 15(17), 3159. https://doi.org/10.3390/w15173159