Article

Study on the Analysis of Pile Foundation Deformation and Control Methods during the Excavation of Deep and Thick Sludge Pits

1
HFUT Design Institute (Group) Co., Ltd., Hefei 230051, China
2
School of Civil Engineering, Lanzhou University of Technology, Lanzhou 730050, China
*
Author to whom correspondence should be addressed.
Water 2023, 15(17), 3121; https://doi.org/10.3390/w15173121
Submission received: 19 July 2023 / Revised: 13 August 2023 / Accepted: 28 August 2023 / Published: 30 August 2023
(This article belongs to the Special Issue Risk Management Technologies for Deep Excavations in Water-Rich Areas)

Abstract

:
This study aims to apply performance-based safety-assessment methods to the monitoring and numerical simulation of excavation engineering projects in order to comprehensively enhance engineering risk management and decision support. In this paper, a deep excavation project in Hefei with thick silty clay layers was studied. The analysis included the surface settlement, the deformation of support structures, the vertical and horizontal displacements of pile tops, axial forces in steel braces, settlement, and the horizontal displacement of a gravity retaining wall on the south side of the excavation using field-monitoring data. A refined three-dimensional finite element model was established to further analyze the distribution of uplift displacement at the bottom of the excavation, horizontal displacement, and bending moments of piles based on simulation results. The research findings indicate that phased excavation can reduce the spatial extent of disturbance to the surrounding soil caused by excavation. Additionally, the closer the location to the excavation and the thicker the underlying silty clay layer, the faster the rate of settlement change and the greater the surface settlement. The spatial structure formed by steel braces and pile foundations effectively reduced the horizontal displacement of the engineering piles. The study’s use of field monitoring and finite element simulation provided valuable insights into the deformation of support structures and the response of the surrounding soil to excavation, confirming the rationality and applicability of the support structure in this paper. The proposed method can serve as a reference for similar complex stratum excavation design and construction. The performance-based safety assessment is introduced, and the monitoring data, numerical simulation results, and performance targets are comprehensively analyzed to provide a reliable scientific basis for engineering decision making.

1. Introduction

With the growth of the population and the advancement of science and technology, some areas need more construction land. Therefore, establishing engineering projects in complex geological formations and complicated surroundings has become inevitable. These projects often face significant risks during the excavation phase of deep excavations. A large excavation area, considerable depth, complex geometry, diverse support forms, and high construction risk coefficients are common characteristics of complex geological formations and complicated environmental conditions in deep excavation projects [1,2,3,4,5,6]. The structural performance of deep excavations is influenced by the physical and mechanical properties of the soil, spatial distribution patterns, support structure forms, and construction sequences [7,8]. Studying the deformation patterns of support structures and their impact on the surrounding environment caused by deep excavation in complex geological formations and complicated environmental conditions, as well as summarizing the successful experiences of special complex projects, is of great significance in guiding deep excavation projects in such challenging conditions.
Field monitoring, theoretical analysis, and numerical simulation are the primary research methods for studying the response of the surrounding soil and support structures for deep excavation [9,10,11,12,13,14,15]. In recent years, the combination of field monitoring and numerical simulation has become a prerequisite for studying complex deep excavation projects, thanks to advancements in field-monitoring technology, the availability of monitoring equipment, the rapid development of the computer industry, and the mature application of finite element algorithms. Field monitoring and numerical simulation are now the main methods for studying the deformation of support structures and the impact on the surrounding environment during complex deep excavation [1,16,17]. They provide real-time monitoring data and quantitative predictions, aiding in understanding the mechanical response of the support structure deformation and surrounding soil during excavation. The comprehensive use of field monitoring and numerical simulation allows for obtaining comprehensive information, optimizing excavation design and support schemes, and improving the safety and reliability of engineering projects. This integrated analysis method provides a scientific basis and practical guidance for the planning and construction of complex deep excavation projects. In the selection of deep excavation support schemes and the design of support structures, numerical simulation analysis serves as an important tool for designers and engineers in decision making. To accurately capture the main characteristics of excavation behavior, it is necessary to establish a refined finite element model that can accurately represent the main features of the actual project and the true mechanical response of the structures and surrounding soil.
Extensive research has been conducted on complex deep excavation, and researchers widely adopt the combination of field-monitoring data and numerical simulation [18,19,20]. Field-monitoring data can be analyzed in depth to provide timely feedback on the deformation development of deep excavations during construction. Analyzing the monitoring data enables the implementation of measures to proactively control construction risks and prevent accidents. Field monitoring offers real-time feedback to design professionals during the excavation process and provides valuable case histories for future reference [20]. Numerical simulation is a valuable tool for evaluating and analyzing the selection of support structures, design calculations, and the optimization of construction sequencing in complex site conditions, thereby reducing engineering risks.
There have been numerous studies on the influence of deep excavation on adjacent pile foundations, while research on the effects on engineering piles within the excavation is relatively limited [21]. The study of integrating support structures with the main underground structures in basement engineering is still in its early stages. Due to significant differences in loading and deformation characteristics between column piles and general engineering piles, there are complex engineering problems that require further investigation. Cui et al. [22] conducted a study on reinforcement engineering in a densely developed urban area. They used finite element simulation and field measurements to investigate the deformation characteristics of bored piles and inclined steel support retaining structures. They also examined the relationship between the measured lateral displacement at the top of bored piles and the excavation depth. Furthermore, they observed the influence of excavation on the lateral displacement of bored piles and ground movement at the corners of the excavation. Liu et al. [9] developed a Timoshenko beam model based on the Vlazov model to simulate pile–soil interaction. They derived explicit solutions using the finite difference method and validated the proposed method through numerical analysis and field case studies. Dong et al. [23] conducted a parameter study on the applicability of finite element models for complex excavation projects. They investigated the types of structural element models, the determination of appropriate material parameters, and simulation methods for soil–structure interface interaction. The results of this parameter study provided guidance for the development of finite element models that meet practical design requirements. Goh et al. [24] performed a series of two-dimensional (2D) and three-dimensional (3D) finite element analyses using the hardening-soil (HS) model. They studied the effects of soil properties, wall stiffness, excavation length, excavation depth, and clay thickness on excavation and wall deflection. Based on the finite element simulation results, they established an equation for wall deflection considering 3D effects and obtained an empirical formula for estimating the maximum wall deflection. Wu et al. [25] evaluated the excavation support scheme of a complex deep excavation project in Lanzhou using automatic monitoring technology and finite element simulation. They identified potential risks and weak links in the support system to ensure safe construction. Ye et al. [26] studied the influence of excavation on adjacent subway tunnels and underground pipelines based on a deep excavation project in Lanzhou. They combined automatic monitoring technology with the finite element analysis software PLAXIS 3D (2020 version) to simulate the entire excavation process. Guo et al. [27] analyzed the displacement and stress of deep excavation support structures considering asymmetric surcharge effects. They used the finite difference method (FDM) to analyze the horizontal displacement and bending moment of the underground diaphragm wall, as well as the bending moment and axial force of the piles, considering lateral ground movement. The FDM method was validated by comparing the results with field-monitoring data, showing good agreement in yield wall displacement and bending moment. Mei et al. [28] studied the deformation characteristics of the water table, axial force, surface settlement, and lateral displacement of retaining walls in an irregular deep excavation in soft clay in Hangzhou. They simulated the excavation process using Midas GTS NX software and conducted a comprehensive comparative analysis with field measurements. Despite the extensive research on the combined analysis of field-monitoring data and finite element simulation to study the response of surrounding soil and deformation of support structures during excavation, the current project site presents additional complexities. These complexities include significant stiffness variations in the subsoil layers beneath the foundation, a large excavation area, diverse surrounding support structures, and a high risk of pile inclination. The investigation of support schemes and construction methods for this excavation project holds practical significance for researchers and designers. A comprehensive examination of this specific project is necessary to provide valuable insights for similar excavation projects in comparable site conditions.
By introducing performance objectives and indicators, we have defined the requirements for engineering safety and stability, enabling us to quantify and measure the performance of the engineering in key aspects [29,30]. By utilizing displacement monitoring, settlement monitoring, and finite element numerical simulations, we collect and analyze monitoring data in real time and then compare them with performance objectives. Introducing performance-based safety assessment, we comprehensively analyze monitoring data, numerical simulation results, and performance objectives to provide reliable scientific foundations for engineering decision making. This paper presents a study conducted on a large excavation project situated at the edge of a “bowl-shaped” deep pit in Hefei, Anhui Province, China. The pit was previously a quarry that has been abandoned, and it contains thick layers of deep sludge. The sludge exhibits high water content, significant compressibility, and strong flowability, posing challenges in handling it. To improve the bearing capacity of the soil foundation and establish favorable construction conditions, deep soil-mixing piles were initially employed to reinforce the soil layers below a depth of 5 m beneath the excavation. To prevent the flow of sludge and water infiltration from the sludge into the excavation, a gravity retaining wall, measuring 10 m in depth and 6 m in width, was constructed on the south side of the excavation. During the excavation process, the flow of sludge exerts lateral forces on the pile foundation, which can lead to pile inclination and affect the load-carrying capacity of the pile foundation in the long term. To mitigate this issue, the design team proposed a layered excavation method with horizontal and inclined steel bracing between the pile foundations. This approach creates a spatial structure that connects the pile foundations with the steel bracing, aiming to reduce the horizontal displacement of the pile foundation. The steel bracing installed at the excavation’s base remains in position and is seamlessly incorporated into the basement floor structure. A comprehensive analysis was conducted using a combination of field monitoring and finite element simulation to examine various factors related to the large excavation project. These factors include ground settlement around the excavation, settlement and horizontal displacement of the gravity retaining wall on the south side of the excavation, settlement and horizontal displacement of the pile foundations within the excavation, and deep-level horizontal displacement and bending moments in the Y-direction of the pile foundation. By studying this unique engineering project, valuable insights were gained into the behavior of deep excavations in complex geological conditions and the surrounding environments. These findings serve as valuable references for the design and construction of similar complex excavation projects in challenging site conditions. Based on performance-based safety assessment methods, we do not confine ourselves to the collection of monitoring data, but we also closely integrate them with performance objectives. This integration enables us to effectively contrast the actual state of the engineering with the safety requirements. Through real-time monitoring technology and numerical simulation methods, we gain a deeper understanding of the engineering behavior. By employing performance-based safety assessment methods, we have conducted a more comprehensive evaluation of the engineering’s safety and stability.

2. Project Overview

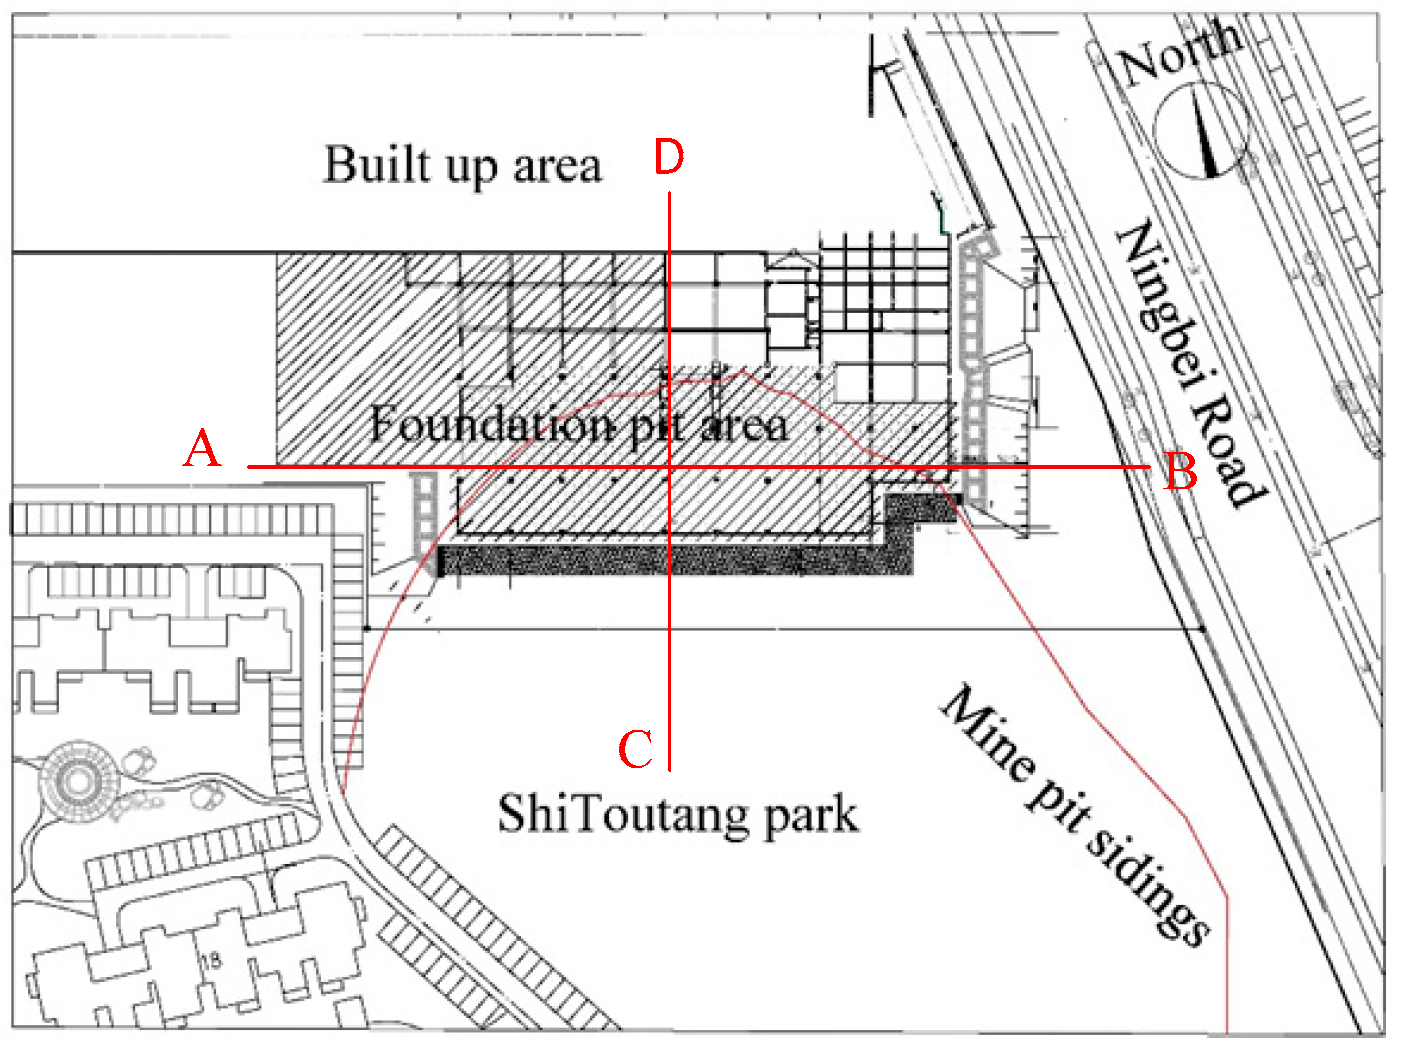
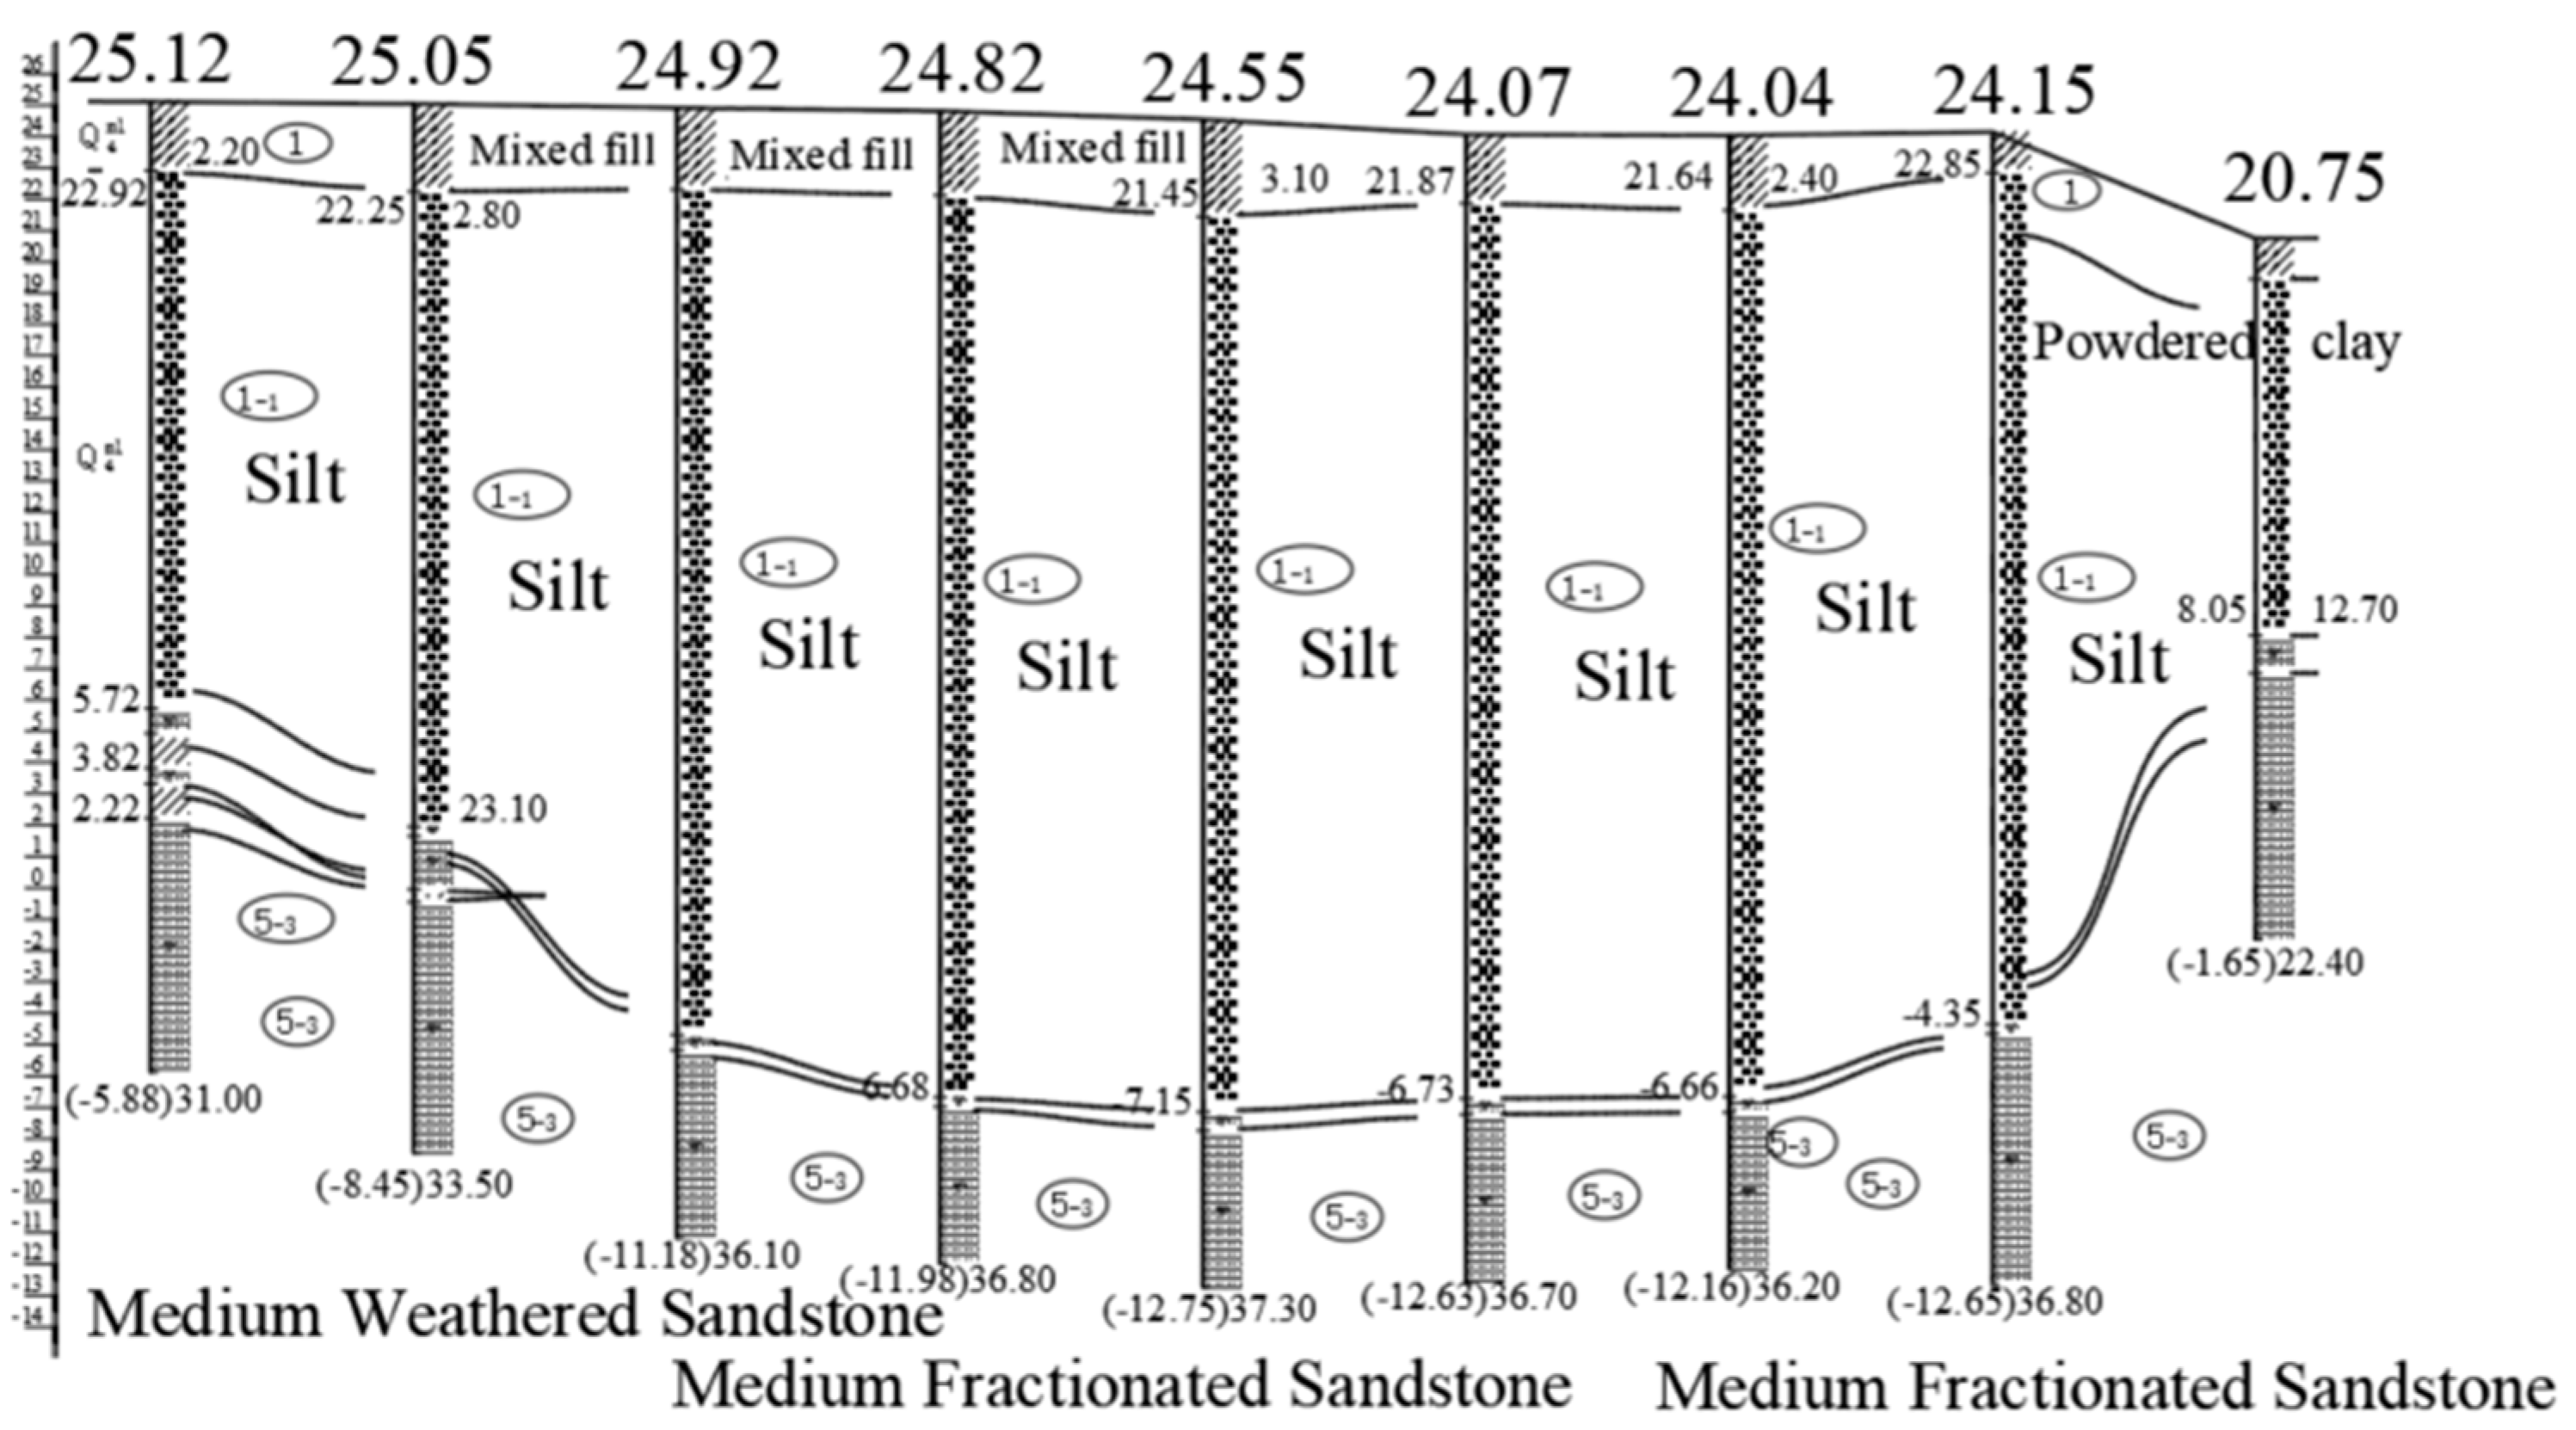
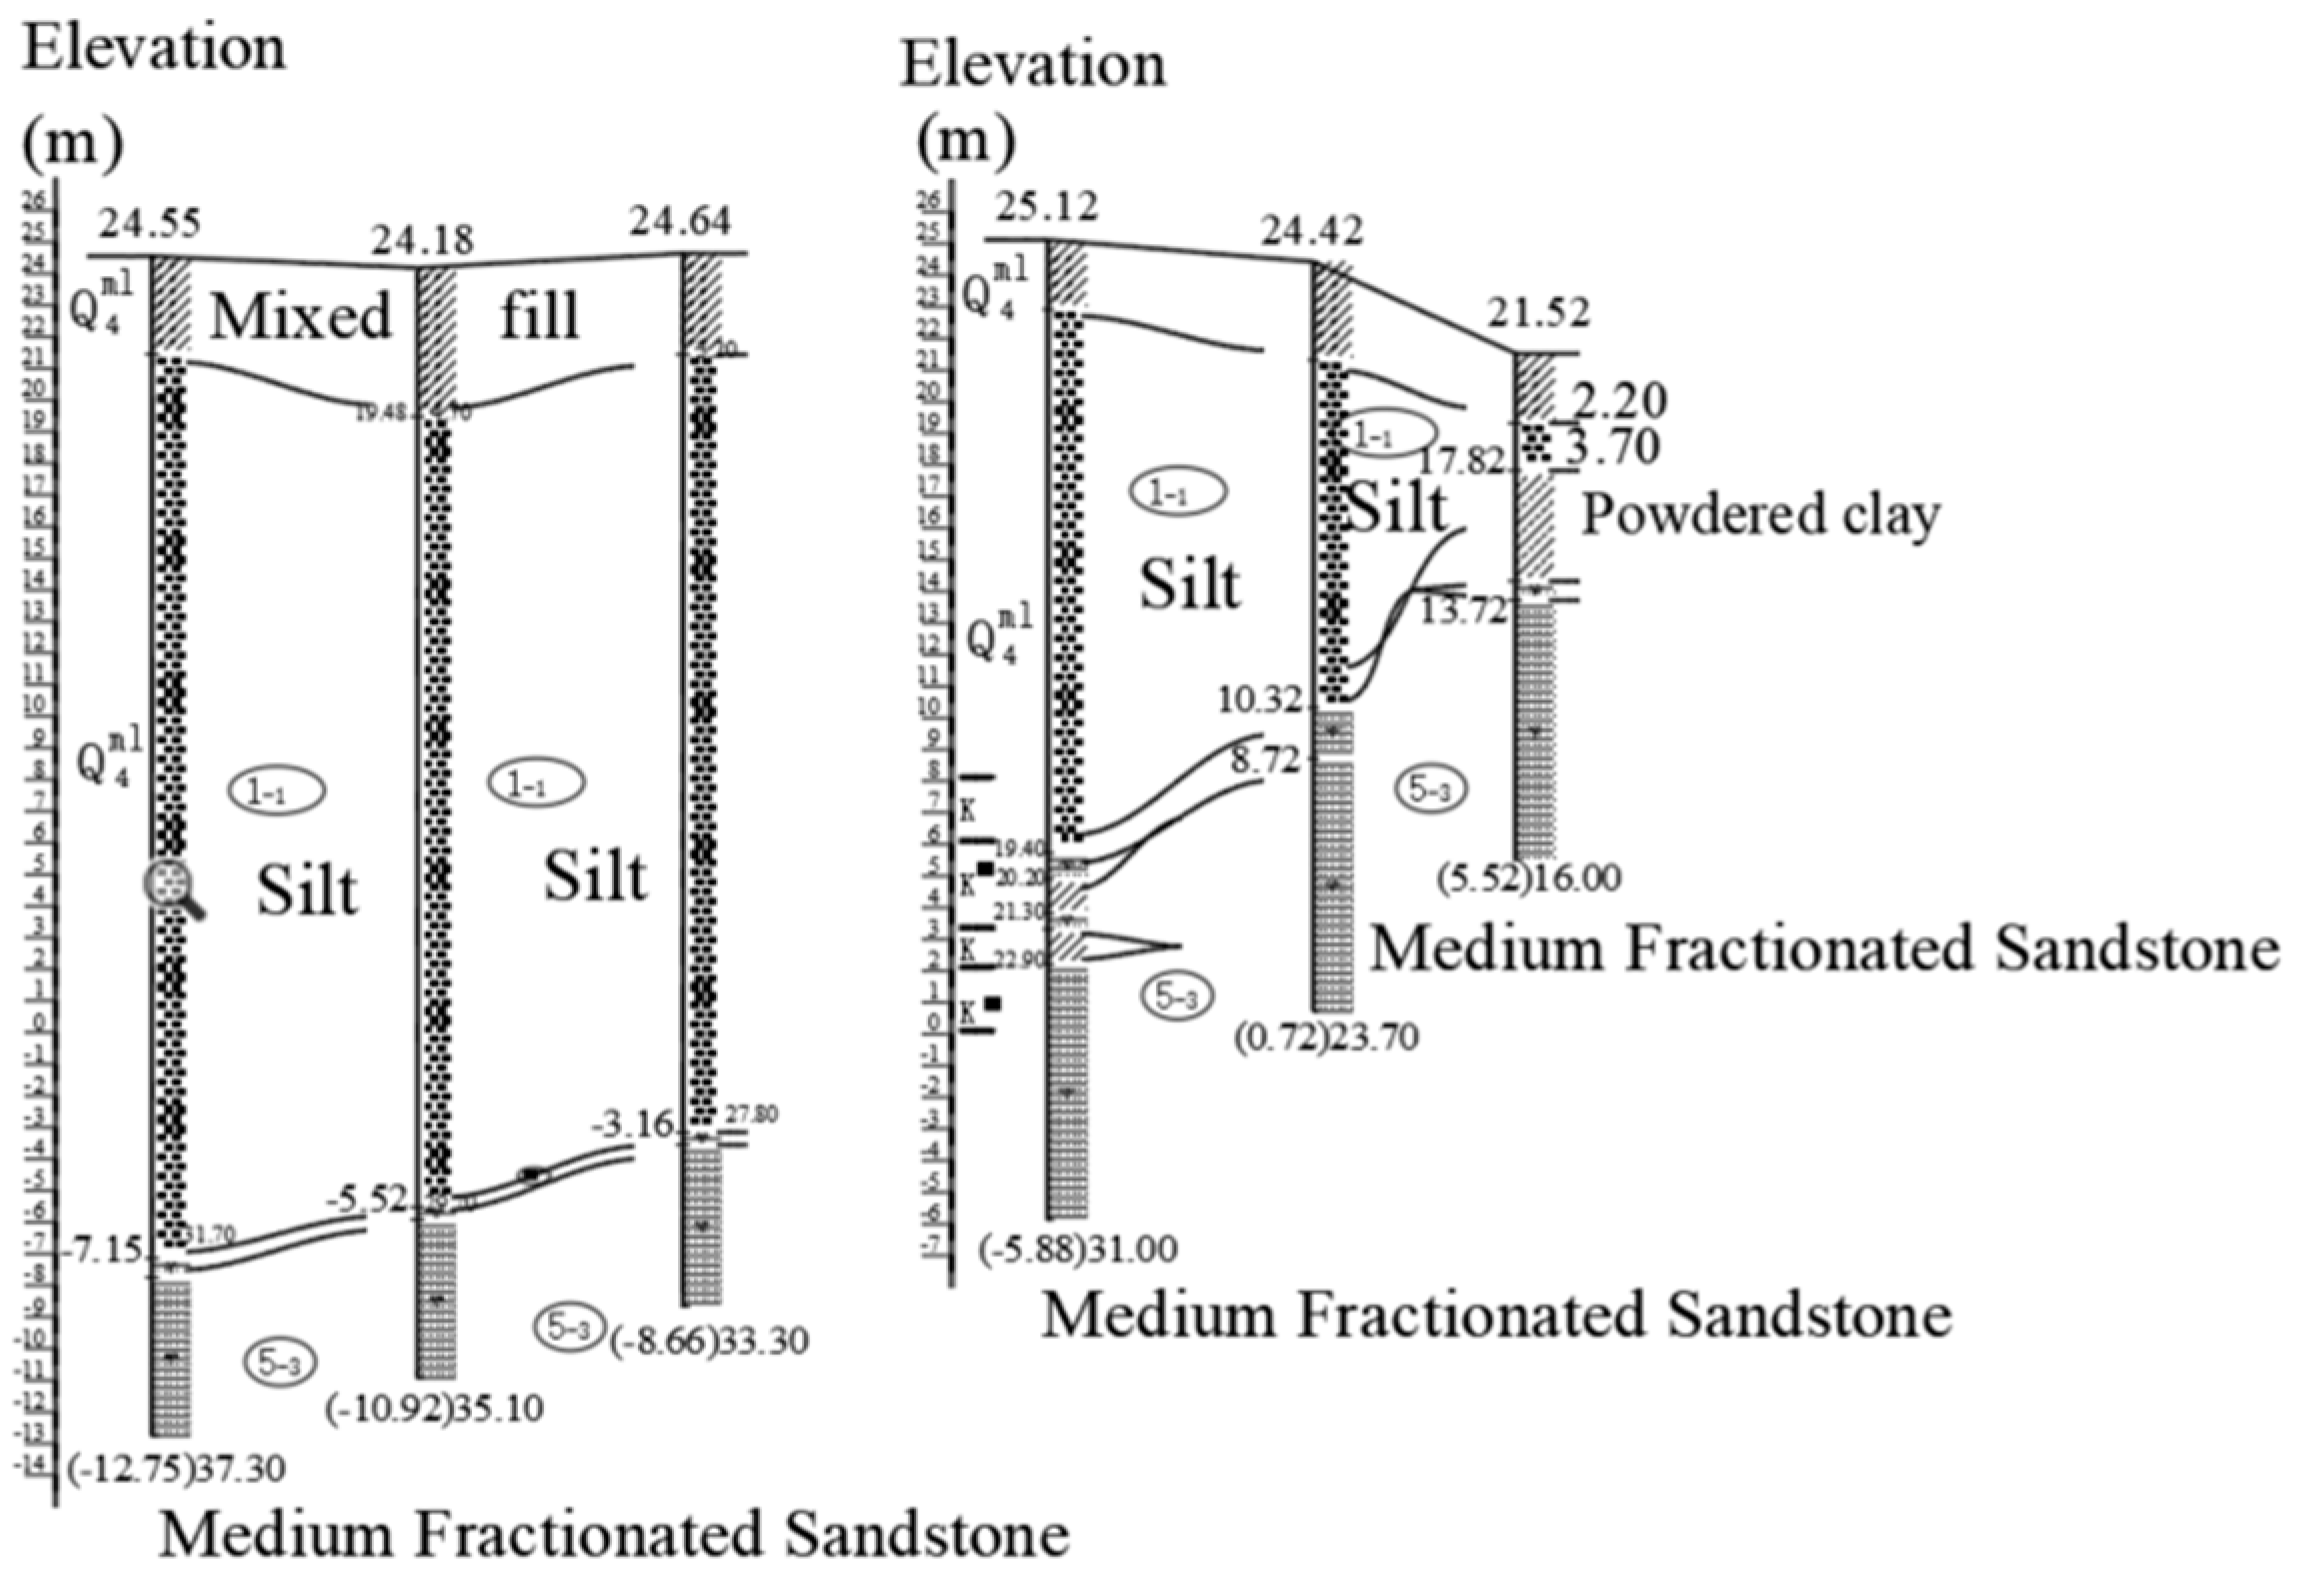
2.1. Introduction to Surrounding Environment and Site Geology

2.1.1. Project Introduction

The proposed site is located in the southwest corner of the intersection of Fanwa Road and Ningbei Road, Hefei City, Anhui Province. The site is bordered by Ningbei Road to the west, Stone Pond Park to the south, and residential and recreational facilities to the southwest. The planned land area for this project is 18,390.31 m2, with a total construction area of 68,090.00 m2. It includes the construction of two management service buildings, with 15 to 18 floors aboveground and 2 floors belowground. The foundation type is a pile foundation, and the superstructure consists of frame–shear-wall structure. Due to the complex geological conditions at the project site, the construction is divided into two phases. The first phase involves the construction of management service buildings, and the structural construction has been completed. The built project shown in Figure 1 represents the first phase of the project. A-B stands for east-west direction and C-D stands for north-south direction. In addition, there are plans to construct an administrative center with four floors aboveground and two floors belowground. The foundation will be a pile foundation, and the superstructure will be a frame structure. The excavation site is located on the edge of a large quarry, which contains a significant amount of silty soil with high water content and insufficient bearing capacity. As an artificial quarry, the inclination and dip angle of the weathered bedrock surface vary greatly and irregularly. Some locations of the bedrock surface at the pile’s ends.

2.1.2. Composition and Engineering Characteristics of Subsoil and Rock

Figure 2 illustrates the geological cross-section of the excavation project in the east–west direction, while Figure 3 presents the geological cross-section in the north–south direction. Table 1 shows the soil parameters from top to bottom in the field stratum. The upper fill thickness at the site exhibits significant variation and poor uniformity. The distribution of cohesive soil in the lower section is discontinuous. The overall assessment suggests that the soil and rock layers at the site lack uniformity and belong to non-uniform subsoil. The soil layers, from top to bottom, are as follows:
① Layer of miscellaneous fill soil (Q4ml): gray-brown, wet, loose, predominantly composed of silt, containing a large amount of debris such as rubble and bricks. Widely distributed in the site area, with a thickness of 1.50–13.00 m and an average of 6.21 m.
② Layer of silty clay: gray-black, highly plastic, containing organic matter, mainly distributed on the south side of the site, with a thickness of 8.00–31.70 m, a bottom elevation of −24.04 to −8.28 m, and a burial depth of 17.50–33.20 m.
③ Layer of silty clay (Q4al+pl): yellow-brown, in a plastic state, with a thickness of 1.90–7.00 m, a bottom elevation of −1.53 to 4.02 m, and a burial depth of 5.20–11.00 m.
④ Layer of clay (Q3al+pl): yellow-brown, hard plastic, locally containing silt, with a thickness of 1.00–7.00 m, a bottom elevation of −3.72 to 4.10 m, and a burial depth of 4.50–13.00 m.
⑤ Layer of highly weathered sandstone (J): brown-red, locally weathered into soil-like material, with a thickness of 1.20–3.30 m, a bottom elevation of −5.56 to 2.60 m, and a burial depth of 6.00–15.00 m. The average SPT N-value from standard penetration tests is 58.
⑥ Layer of moderately weathered sandstone (J): gray-red, with a relatively fragmented rock mass, maximum exposed thickness of 7.00 m, characterized as relatively soft rock, and the degree of rock mass intactness is relatively fragmented.

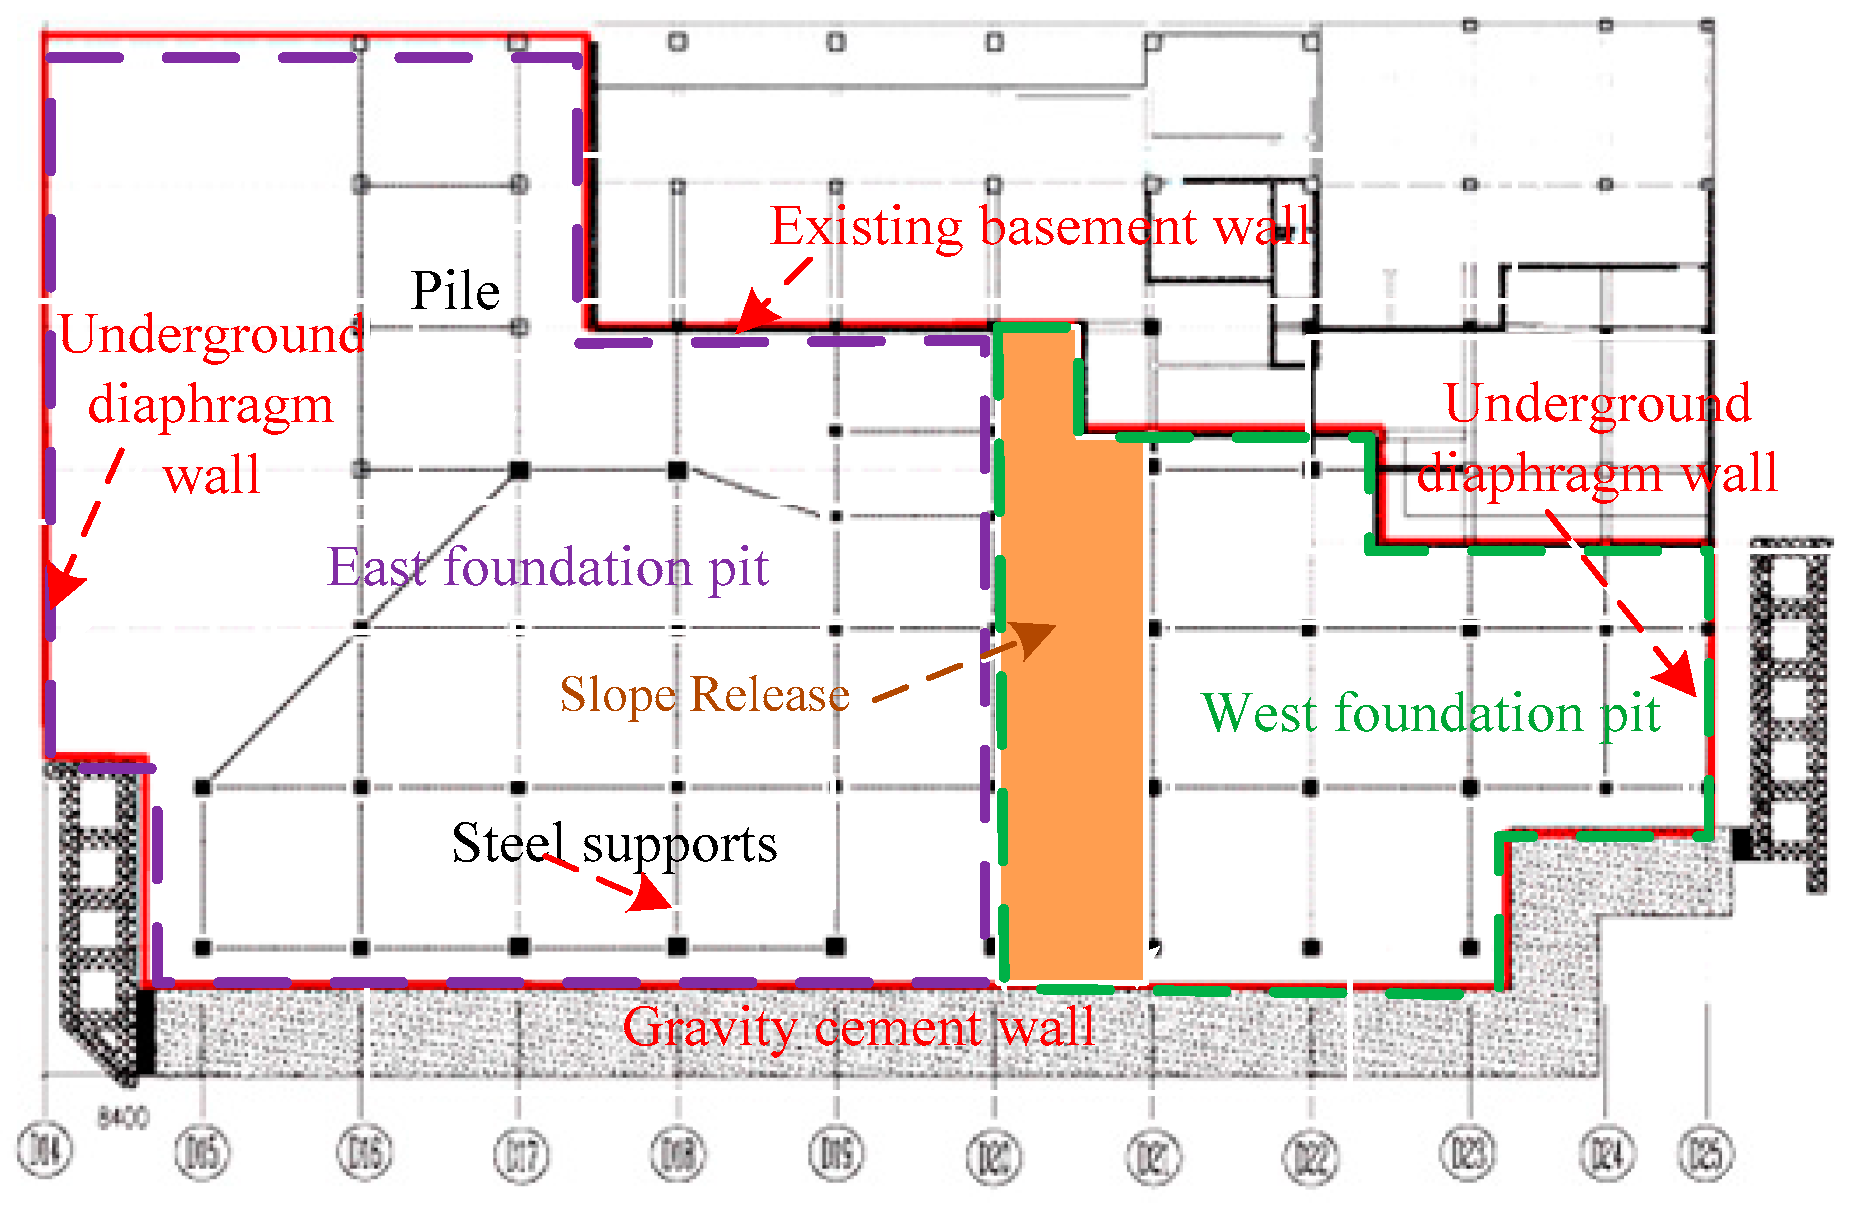
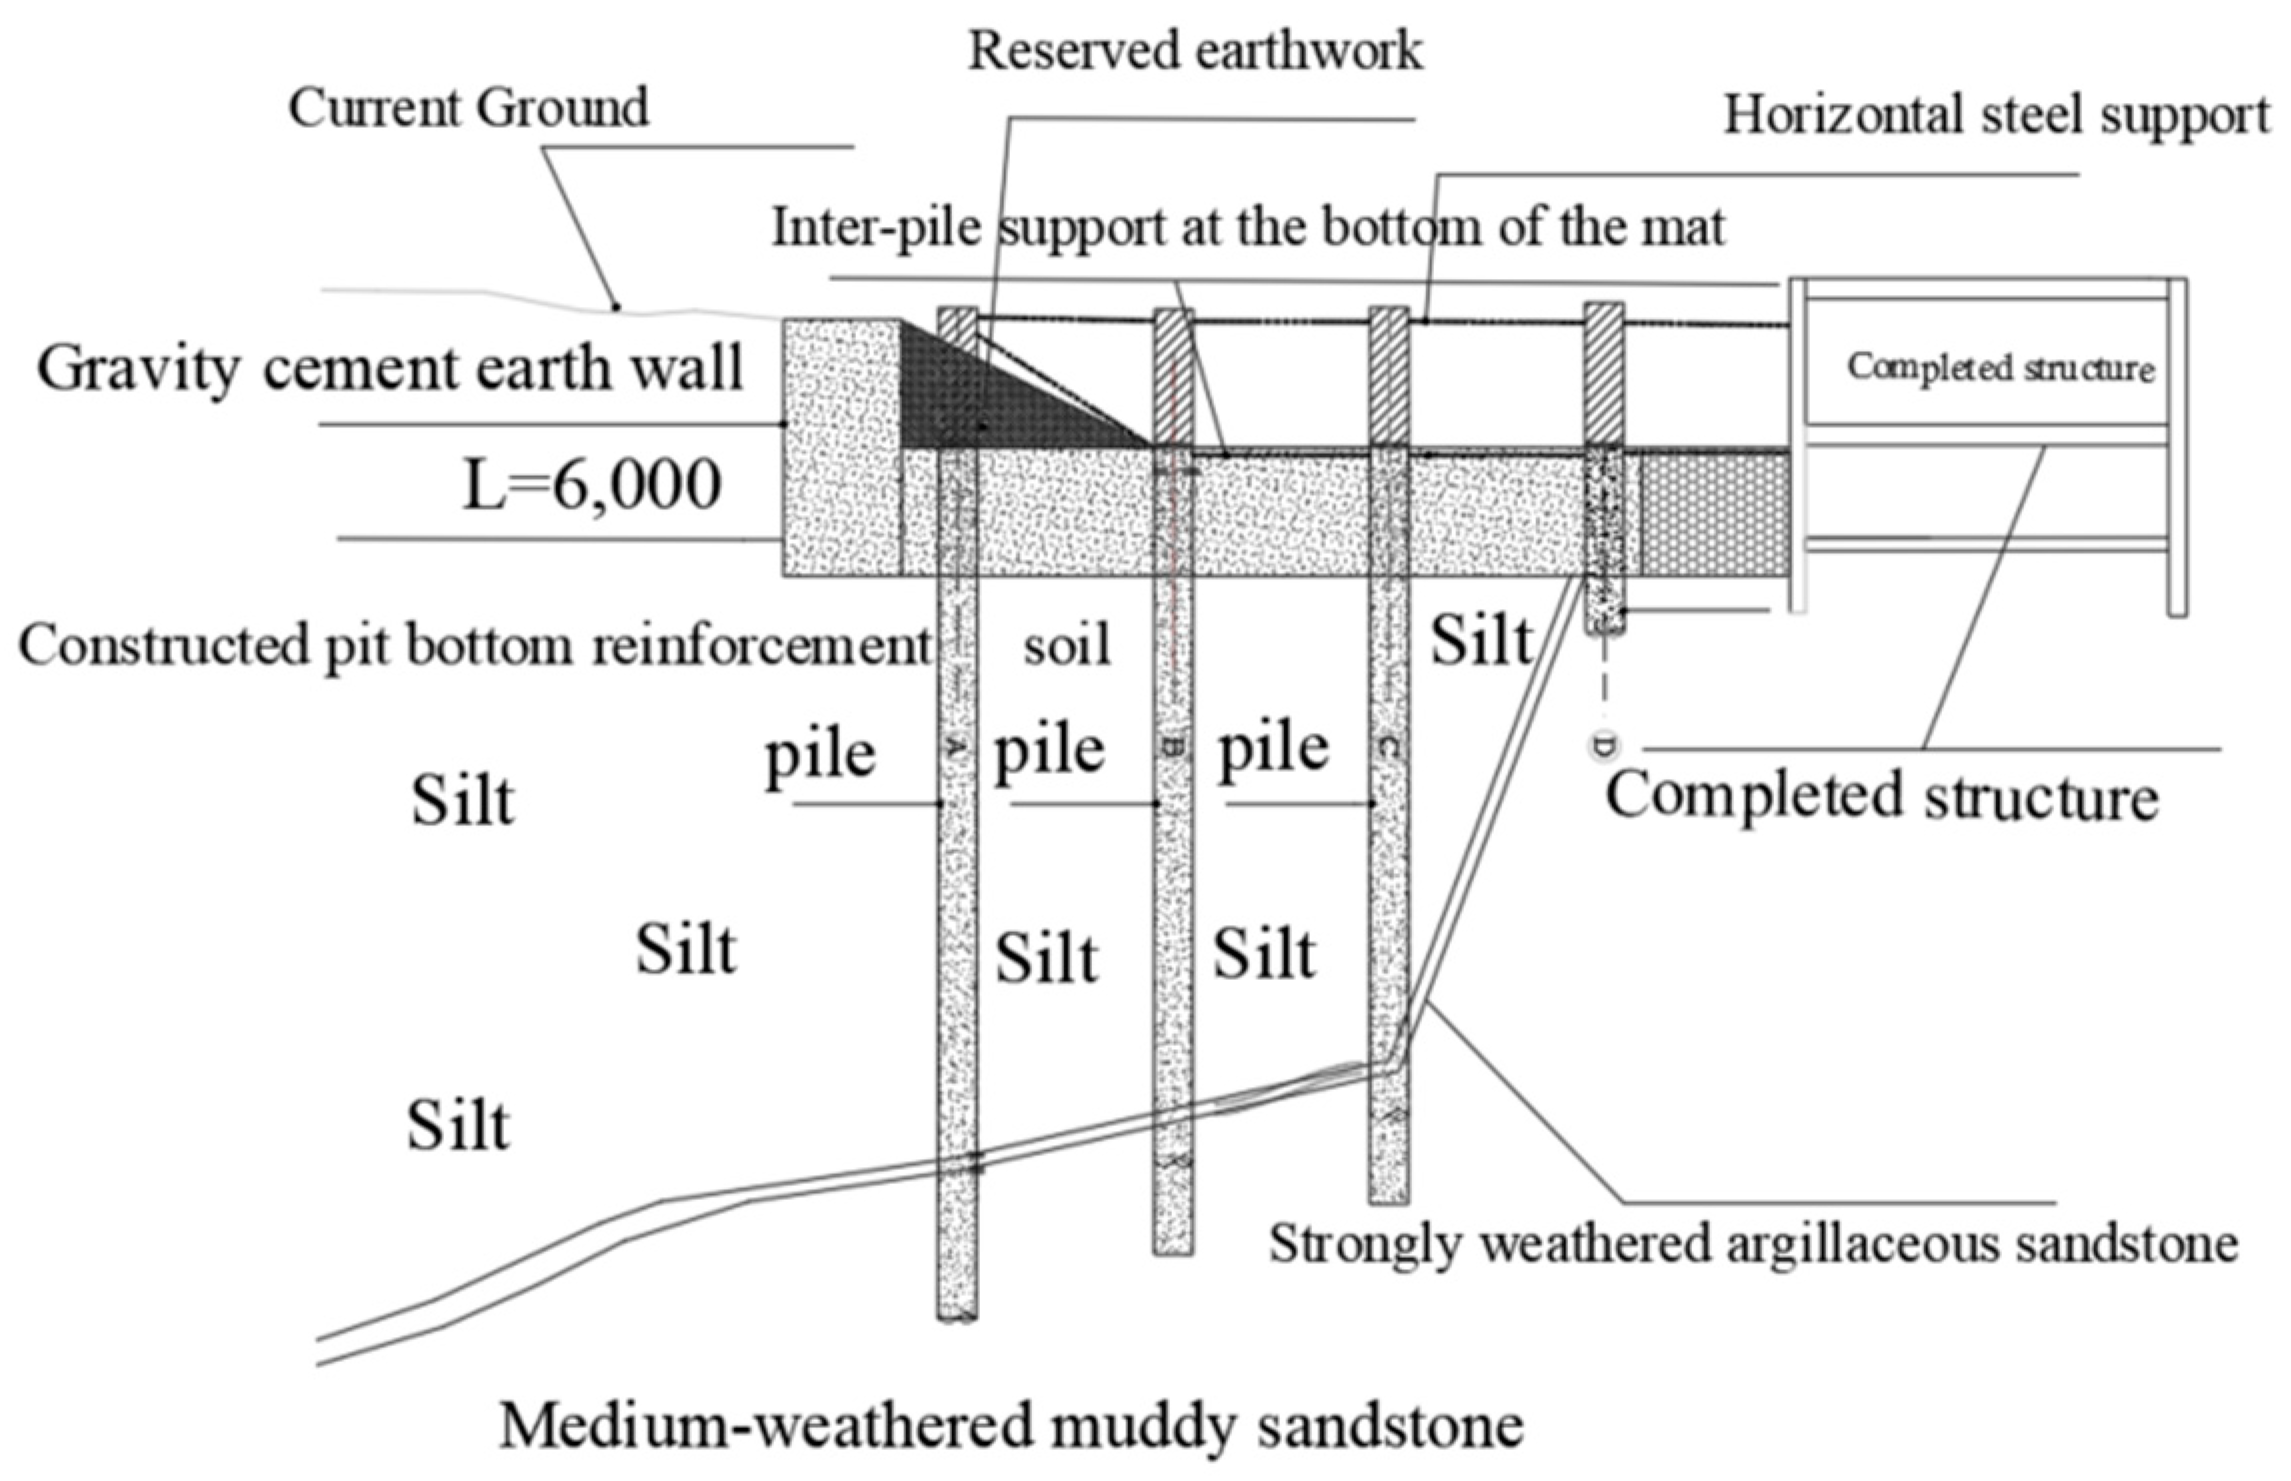
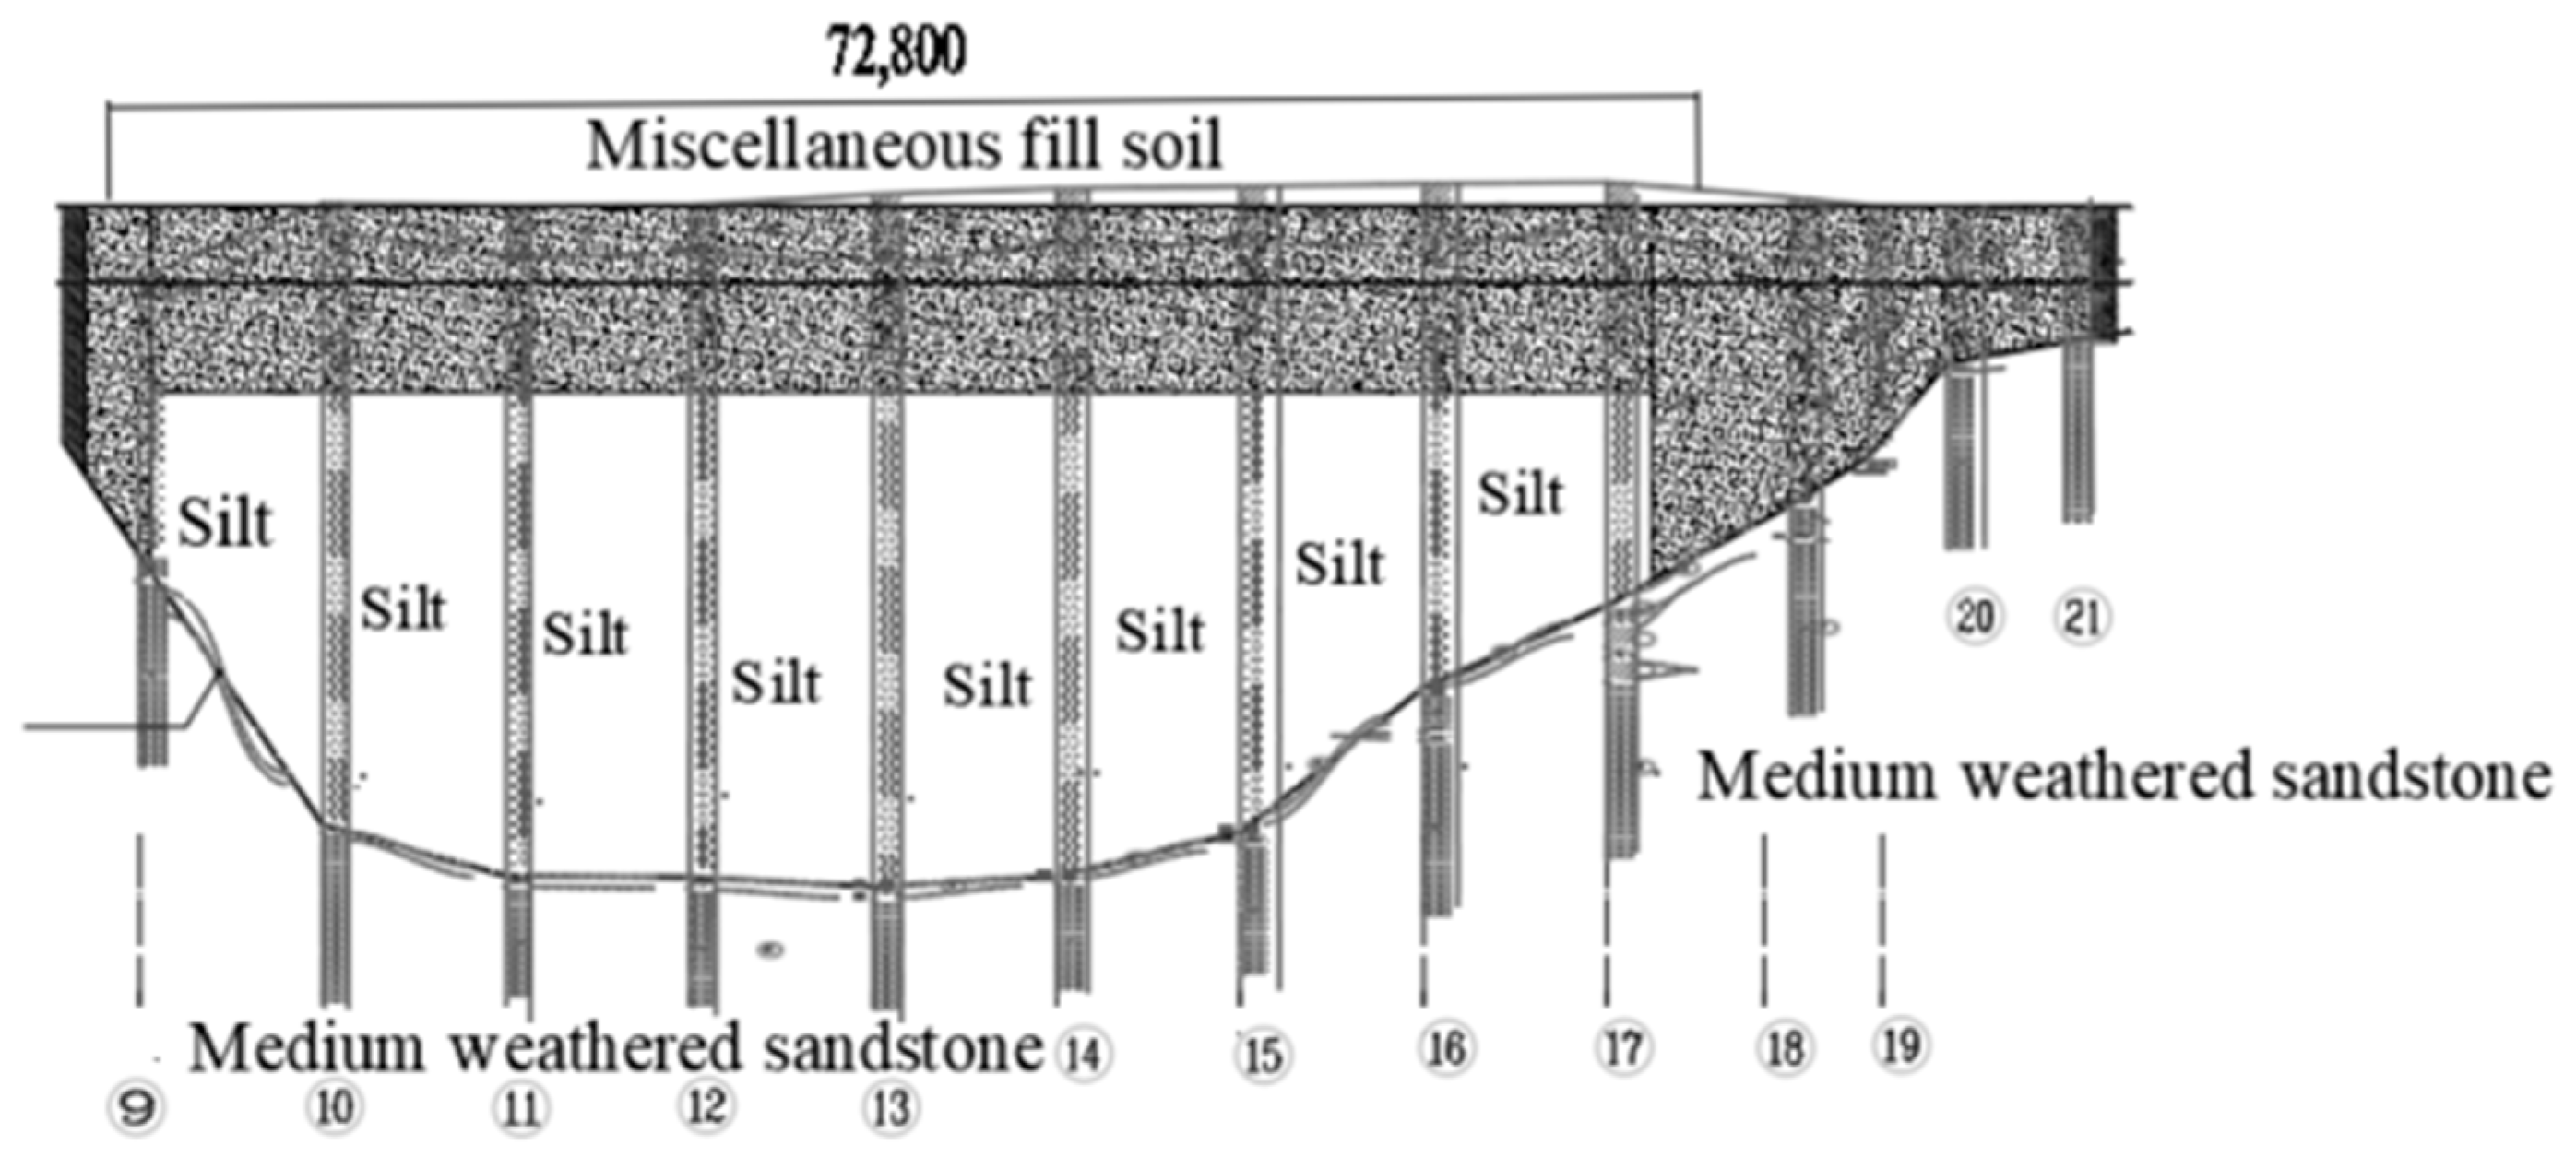
3. Excavation Support Plan and Construction Plan

Excavation Support Plan

The foundation pit measures 82 m in length in the east–west direction and has an irregular shape in the north–south direction, with a maximum width of 40 m and a minimum width of 20 m. The project site presents complex geological conditions, with the southern side of the excavation bordering an abandoned quarry. The quarry consists of deep silt with a high water content, considerable compressibility, and low bearing capacity, necessitating reinforcement for construction purposes. To mitigate these challenges, the silt within the excavation undergoes treatment using deep soil-mixing piles before proceeding with pile foundation construction, thereby improving the bearing capacity of the silt at the bottom of the excavation. A gravity-type cemented soil wall, measuring 6 m in width and 10 m in depth, is erected on the southern side of the excavation. On the northern side of the excavation, there is a pre-existing underground basement, and the irregularly shaped outer wall of the basement serves as the existing support structure. Double-layered sheet pile support structures are employed on both the eastern and western sides of the excavation. Figure 4 illustrates the excavation site, and Figure 5 depicts the plan view of the support plan.
Once the mud soil at the bottom of the foundation pit has been reinforced, the construction of the pile foundation will begin. Each pile has a diameter of 1.5 m and lengths that vary between 35 m and 10 m. The piles are embedded into the moderately weathered sandy claystone rock to a depth of 3.5 m. The pile foundation employs concrete with a compressive strength of 30 MPa. Steel supports will be installed between the piles to prevent excessive bending moments and tilting of the pile foundation during the excavation of the foundation pit. The supports, made of Q235 steel, have a square cross-section measuring 350 mm on each side and a thickness of 8 mm.
The construction steps are as follows. Step 1: First, excavate the east area of the foundation pit for 5 m at a time, and then construct the steel support of the west area of the foundation pit at the bottom of the foundation pit, which is set above the excavation surface of the foundation pit, and the west area has only one steel support. Step 2: Apply the first steel support to the top of the pile in the east area of the foundation pit, and then carry out earthwork excavation in the west area of the foundation pit, first digging down for 3 m, and then digging for 2 m. The value shows that due to the deep silt in the foundation pit on the south side of the foundation pit, the first row of piles on the south side of the foundation pit is subjected to lateral horizontal force during the excavation process, which causes the pile foundation to tilt and affects the bearing capacity of the pile foundation in the later stage. Therefore, when excavating the west side of the foundation pit, it is necessary to leave the soil between the gravity cement soil wall on the south side of the foundation pit and the second row of piles on the south side of the foundation pit. See Figure 6 for the reserved earthwork location area. See Figure 7 for the reinforced soil at the bottom of the foundation pit.
Table 2 presents the construction sequence and duration of each construction activity for the foundation pit project. The subsequent sections will establish finite element models according to this construction sequence.

4. Engineering Monitoring Scheme and Monitoring Results Analysis

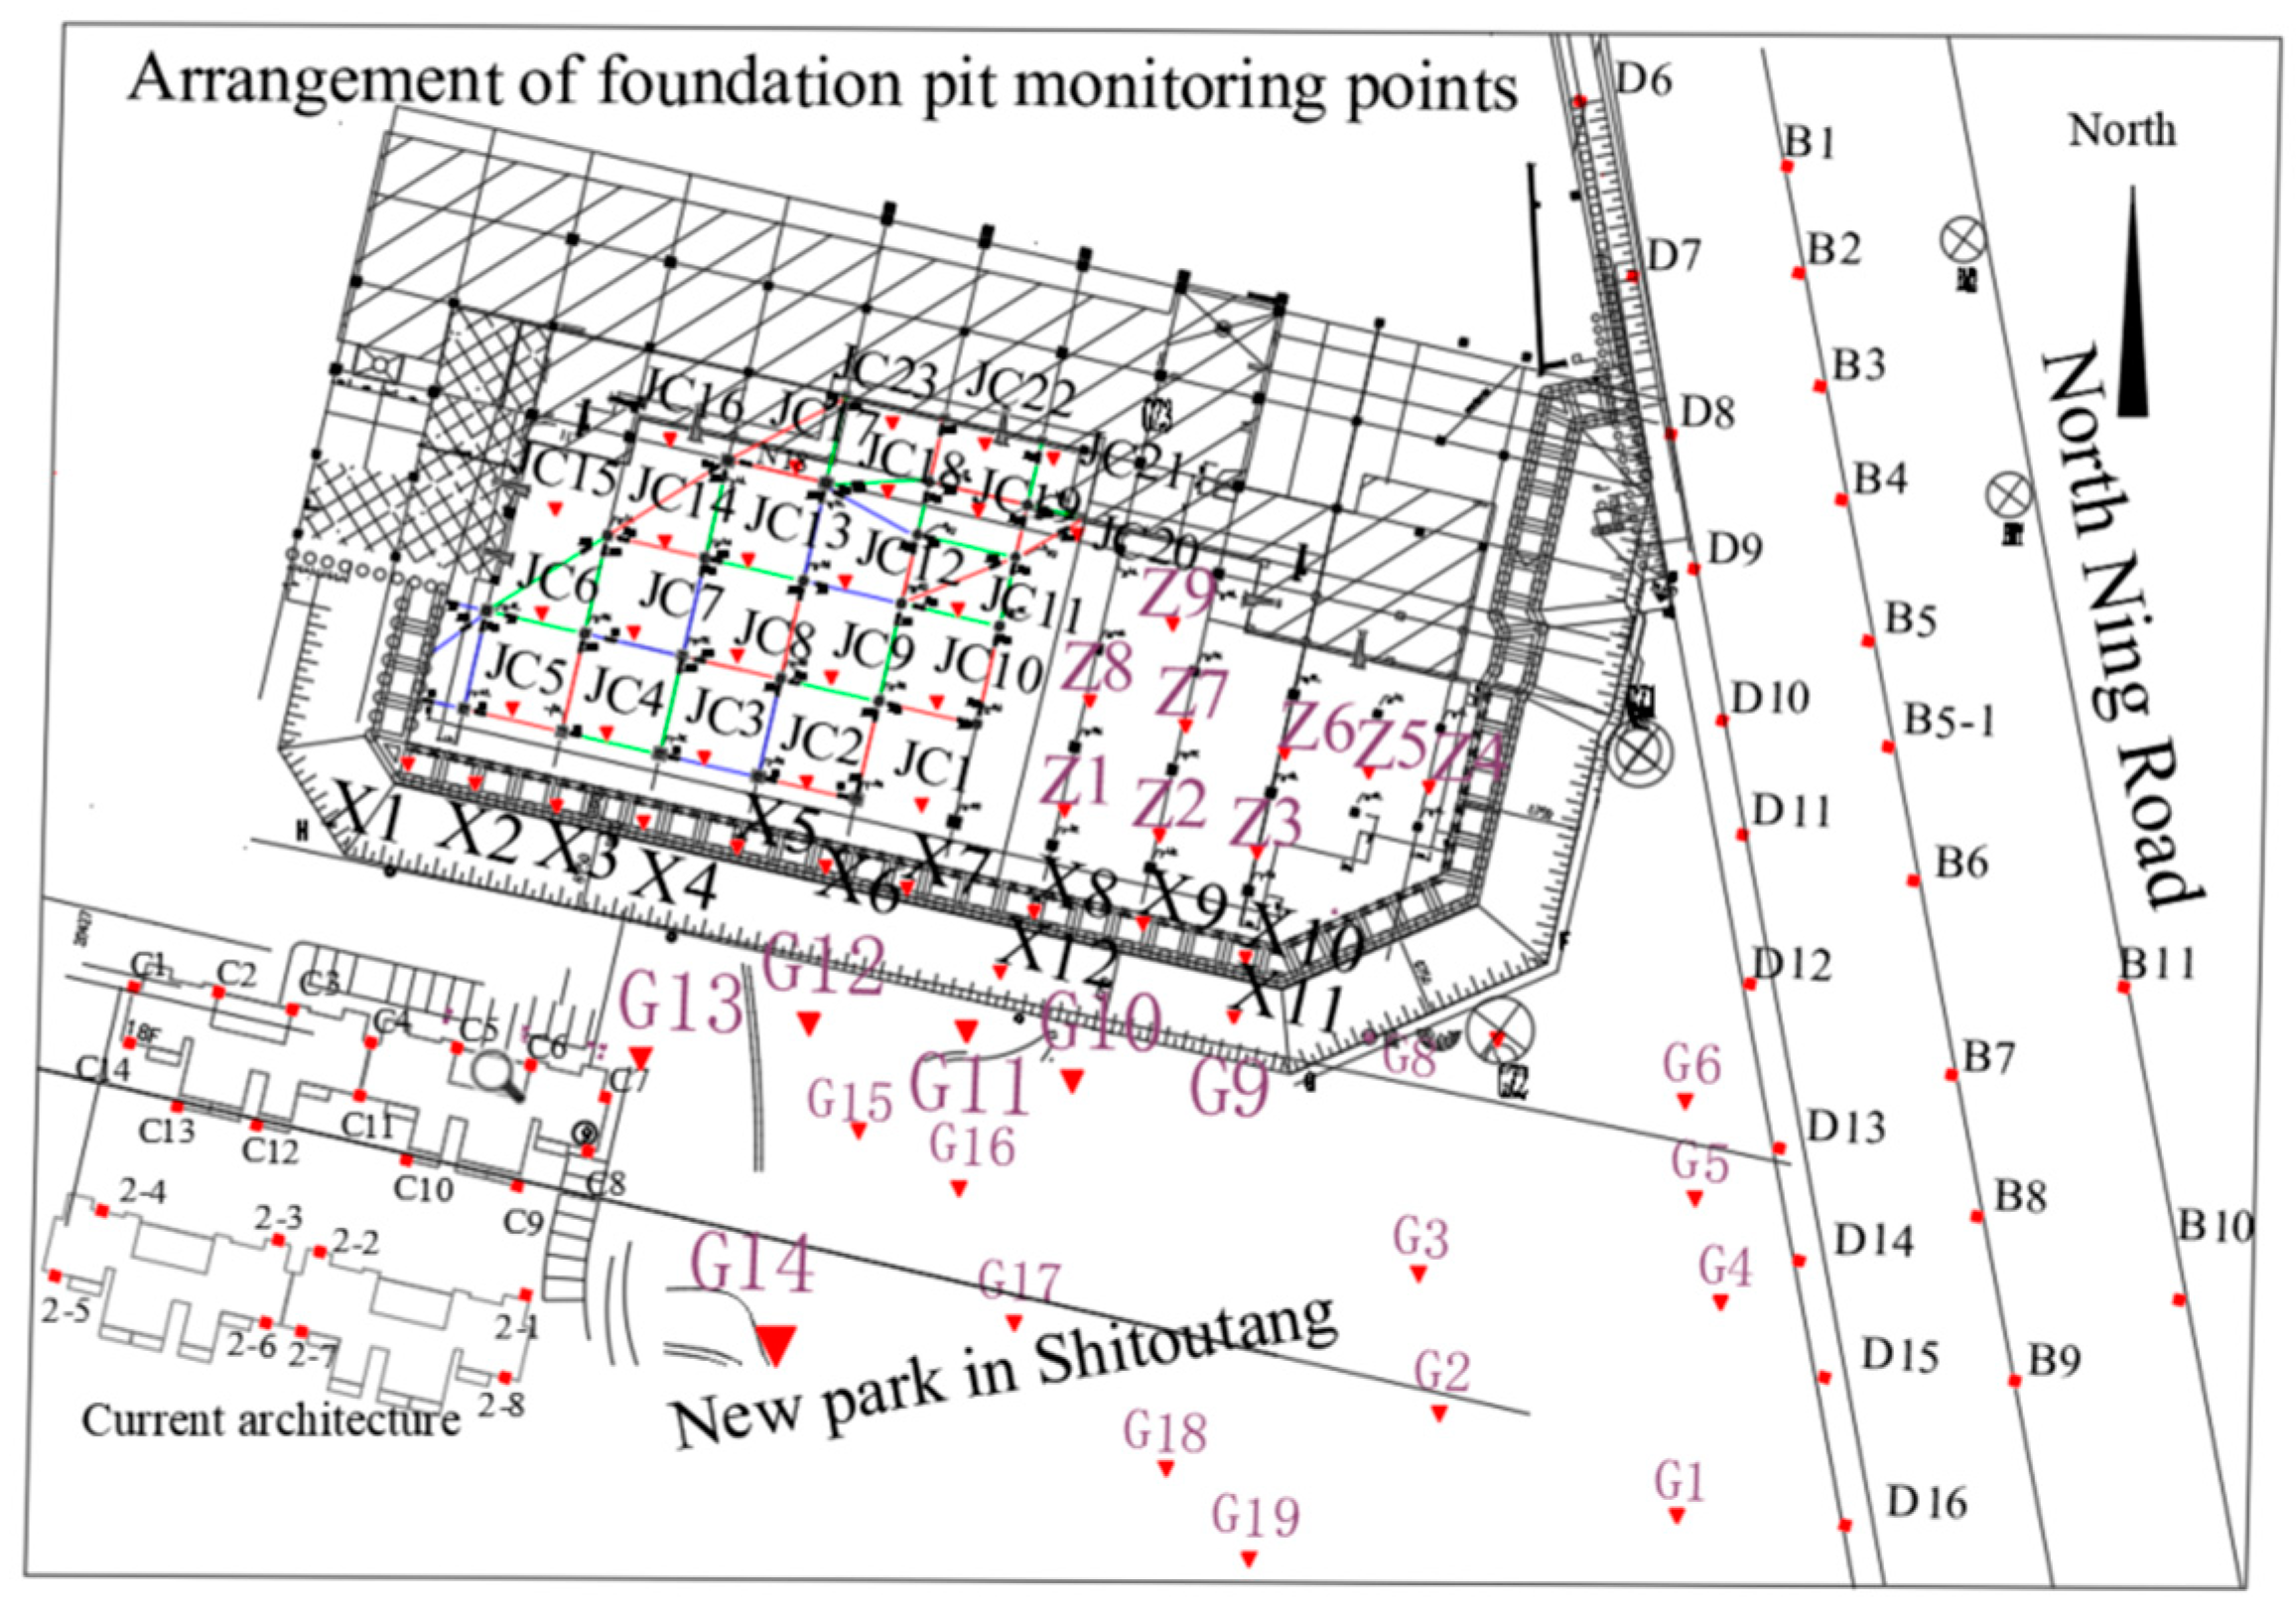
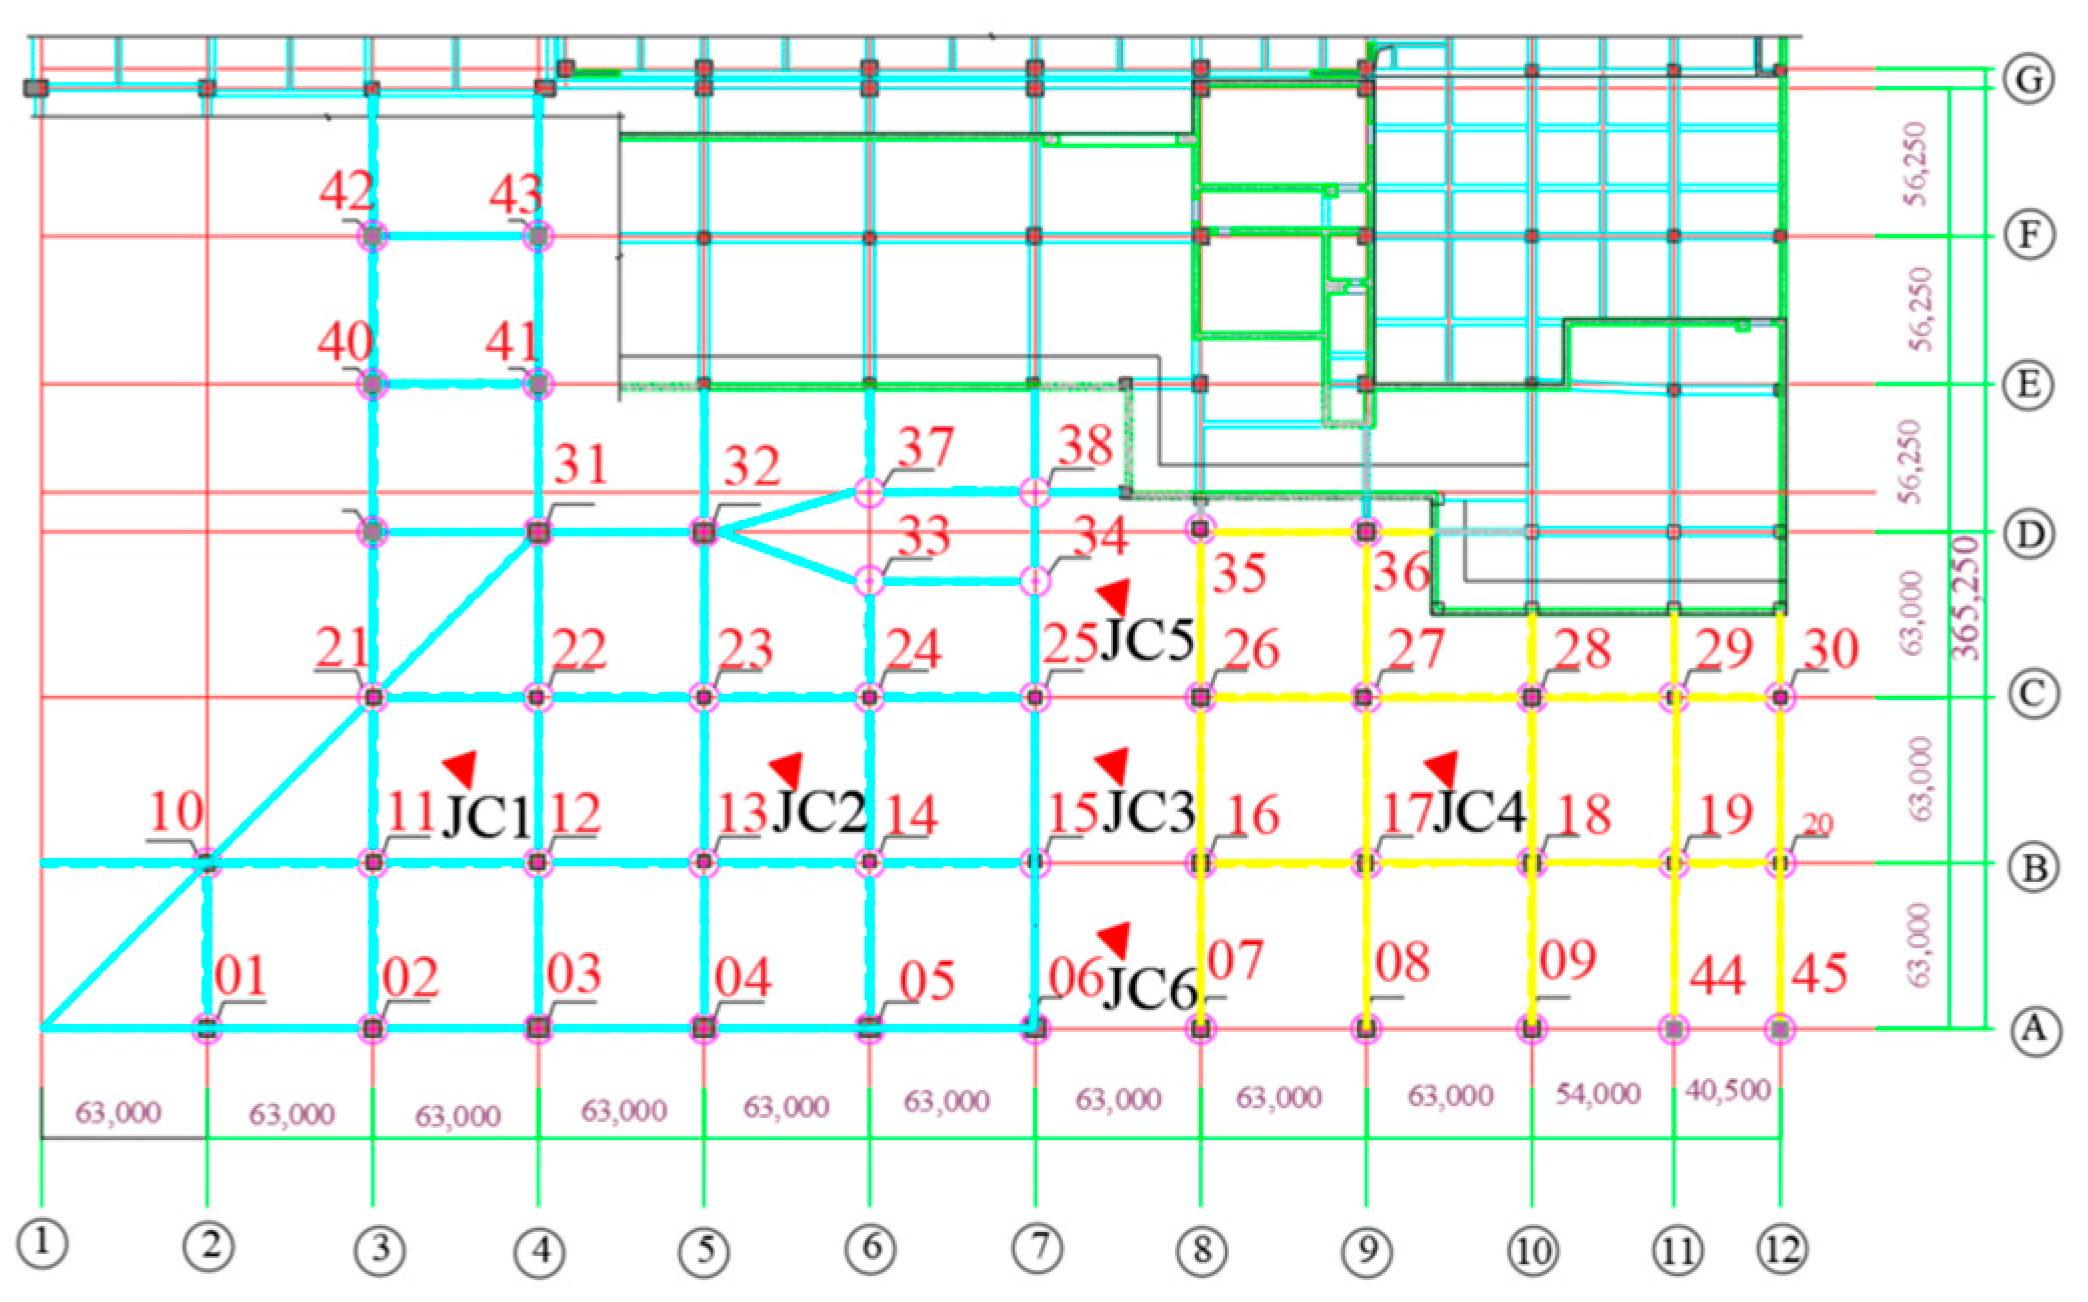
4.1. Monitoring Point Layout and Monitoring Content

Figure 8 depicts the layout plan of monitoring points, where G1–G19 represent the monitoring points for park settlement, D6–D16 and B1–B11 represent the monitoring points for road settlement along Ningbei Road, Z1–Z9 represent the displacement-monitoring points for soil between piles on the east side of the foundation pit, JC1–JC23 represent the settlement-monitoring points for soil between piles on the east side of the foundation pit, N1–N54 represent the axial force-monitoring points for the second row of steel supports on the west side of the foundation pit, N60–N85 represent the axial force-monitoring points for the second row of steel supports on the east side of the foundation pit, and w01–w45 represent the monitoring points for horizontal and vertical displacements at the tops of the piles. The identification numbers of displacement-monitoring equipment correspond to the numbering of pile foundations. For example, w01 refers to the displacement-monitoring equipment placed at the pile top of pile foundation #1. C1–C14 and 2-1-2-8 represent the monitoring points for building settlement. The specific arrangement of the monitoring equipment can be seen in Figure 8 and Figure 9. For the requirements for the arrangement of monitoring points for excavation support structures and surrounding soil displacement, monitoring parameters, monitoring frequency, and performance indicators, refer to the standards [31,32].

4.2. Performance-Based Security Assessment Protocol

4.2.1. Background and Purpose

This agreement aims to ensure comprehensive monitoring, accurate assessment, and effective control of key factors such as the south-side gravity retaining wall, the settlement of the south-side park, surrounding building settlements, the settlement of the eastern access road, the deformation of pile foundations within the excavation pit, and axial forces on steel supports in the excavation project. By integrating performance-based safety-assessment methods, real-time monitoring techniques, and finite element numerical simulations, we will ensure the safety, stability, and sustainability of the engineering project.

4.2.2. Performance Objectives and Indicators

To achieve the safety and stability of the engineering project, we will establish clear performance goals and indicators to quantitatively assess standards. Specifically, we will focus on the following key indicators:
① South-side gravity retaining wall displacement: Limit the displacement of the retaining wall in the X- and Y-directions, ensuring its stability and staying within the specified maximum displacement limits. The maximum limit is 100 mm.
② Manage the park land subsidence to ensure it remains within the predefined limit and uphold the park’s overall usability. The maximum limit is 200 mm.
③ Settlement of surrounding buildings: Monitor the settlement of neighboring buildings, ensuring their deformations remain within a safe range and preserving the structural integrity of the buildings. The maximum limit is 30 mm.
④ Settlement of eastern access road: Restrict road settlement to ensure safe traffic passage and prevent adverse impacts. The maximum limit is 60 mm.
⑤ Deformation of pile foundations within the excavation pit: Thoroughly monitor the deformation of the pile foundations within the excavation pit, ensuring they stay within specified limits, controlling pile head displacements and pile body inclinations and maintaining the later-stage bearing capacity of the piles. The maximum limit is 80 mm.
⑥ Axial forces on steel supports: Continuously monitor changes in axial forces on steel supports, ensuring they remain within acceptable ranges and guaranteeing the reliability of the support system. The maximum limit is 400 KN.

4.2.3. Monitoring Methods and Techniques

To achieve the performance goals, we will comprehensively utilize the following monitoring methods and technologies: ① Displacement-monitoring instruments: Install high-precision displacement-monitoring instruments at key locations to continuously record the displacements of the retaining wall, park, buildings, roads, and other structures. ② Settlement-monitoring system: Deploy settlement-monitoring instruments to conduct real-time monitoring and data collection of settlements in the park, buildings, and roads. ③ Finite element numerical simulation: Utilize finite element simulation technology to model the deformation process of the excavation project at various stages, providing validation and support for actual monitoring data. ④ Axial-force-monitoring instruments: Place axial-force-monitoring instruments on the steel supports of displacement piles to monitor changes in axial forces. By integrating these monitoring methods and technologies, we aim to ensure the performance goals are met, accurately assess the project’s behavior, and take necessary actions for effective control.

4.2.4. Data Acquisition and Analysis

We will periodically collect the data generated by the monitoring instruments, carry out processing and analysis of data, and compare them with the performance goals and indicators. Through data analysis, we will be able to promptly identify any abnormal situations, thus providing a scientific basis for decision making.

4.2.5. Performance-Based Security Assessment

Since it will integrate monitoring data, numerical simulation results, and performance objectives, the basis of performance-based safety assessment will be crucial in evaluating the engineering project’s safety and stability. Through this assessment, we can ascertain whether the actual performance of the project aligns with expectations and take appropriate measures in response.

4.2.6. Continuous Monitoring and Improvement

Throughout the entire lifecycle of the engineering project, we will sustain continuous monitoring activities and make timely adjustments and improvements based on monitoring results. Real-time monitoring, data analysis, and performance assessment will ensure our ability to promptly address potential risks and provide robust support for the successful implementation of the project.

4.2.7. Conclusions

Through the implementation of this agreement, we will comprehensively utilize performance-based safety-assessment methods, real-time monitoring technologies, and numerical simulations to comprehensively understand the project’s risk profile, ensuring its stability and safety. Continuous monitoring, analysis, improvement, and learning will ensure our ability to promptly respond to potential risks. Through the collaboration outlined in this agreement, we offer a dependable safeguard for the smooth execution of the engineering project.

4.3. Analysis of Monitoring Results

4.3.1. Settlement Analysis of Park on the South Side of Foundation Pit

The vertical settlement-time–history curves of different monitoring points in the park on the south side of the foundation pit at different excavation stages are shown in Figure 10.
Excavation of the foundation pit results in stress release in the surrounding soil, causing soil movement toward the interior of the pit. Settlement occurs on the surface of the park on the south side of the foundation pit, and the settlement increases with greater excavation depth. From Figure 8, it can be observed that during excavation in the eastern area of the foundation pit, the monitoring point G16 experiences the greatest settlement and the highest settlement rate, followed by G9, G10, and G11. This is because the location of G16 coincides with the center of the park, directly below which lies a deep layer of silt. Therefore, during the excavation of the soil in the foundation pit, this area undergoes the most significant deformation and experiences the greatest settlement. The positions of G9, G10, and G11 are located in the southern excavation area on the western side of the foundation pit, closer to the edge of the pit, resulting in relatively large settlements at these points. Prior to the excavation in the western area of the pit, the settlement at monitoring point G12 is relatively small. However, as construction progresses in the eastern area of the pit, the settlements at G12 and G13, being the closest to the excavation zone, increase. The maximum settlement at G12 reaches 117 mm. Therefore, Figure 10 illustrates that the excavation of the foundation pit has a spatial effect on the surrounding soil, with greater surface settlement occurring closer to the excavation area. Zone excavation can effectively mitigate the impact of large-scale excavation on the surrounding environment.

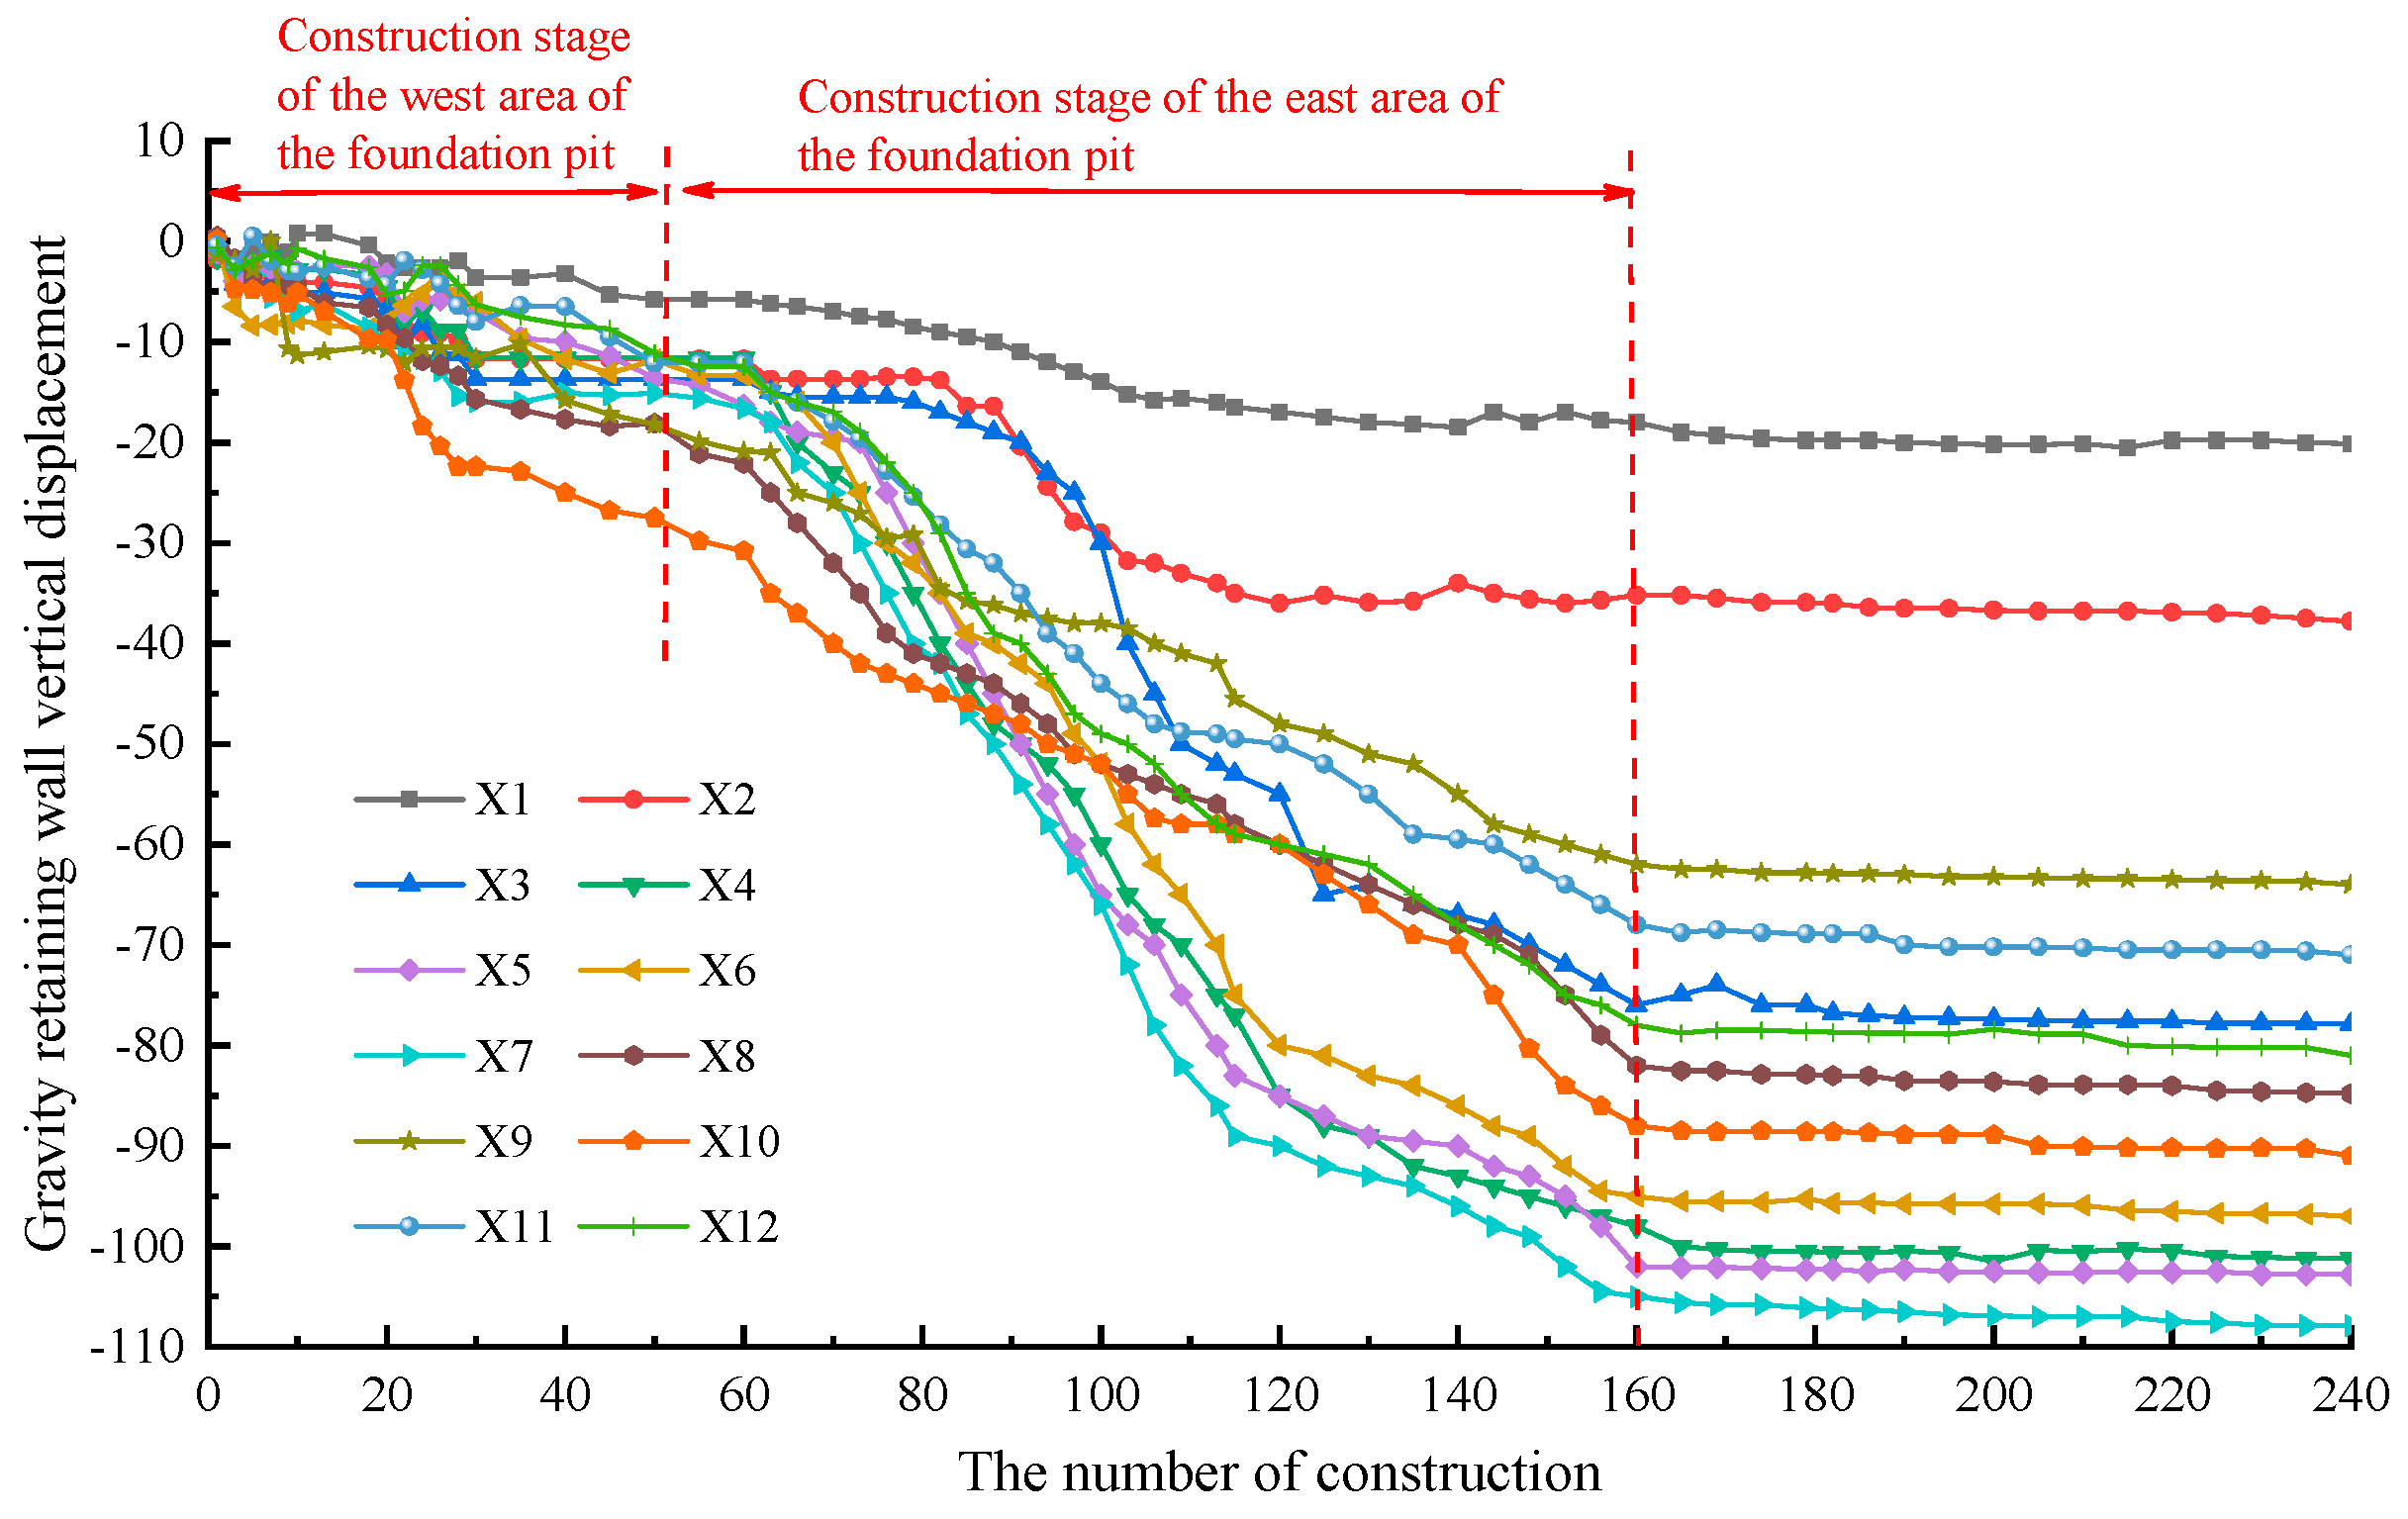
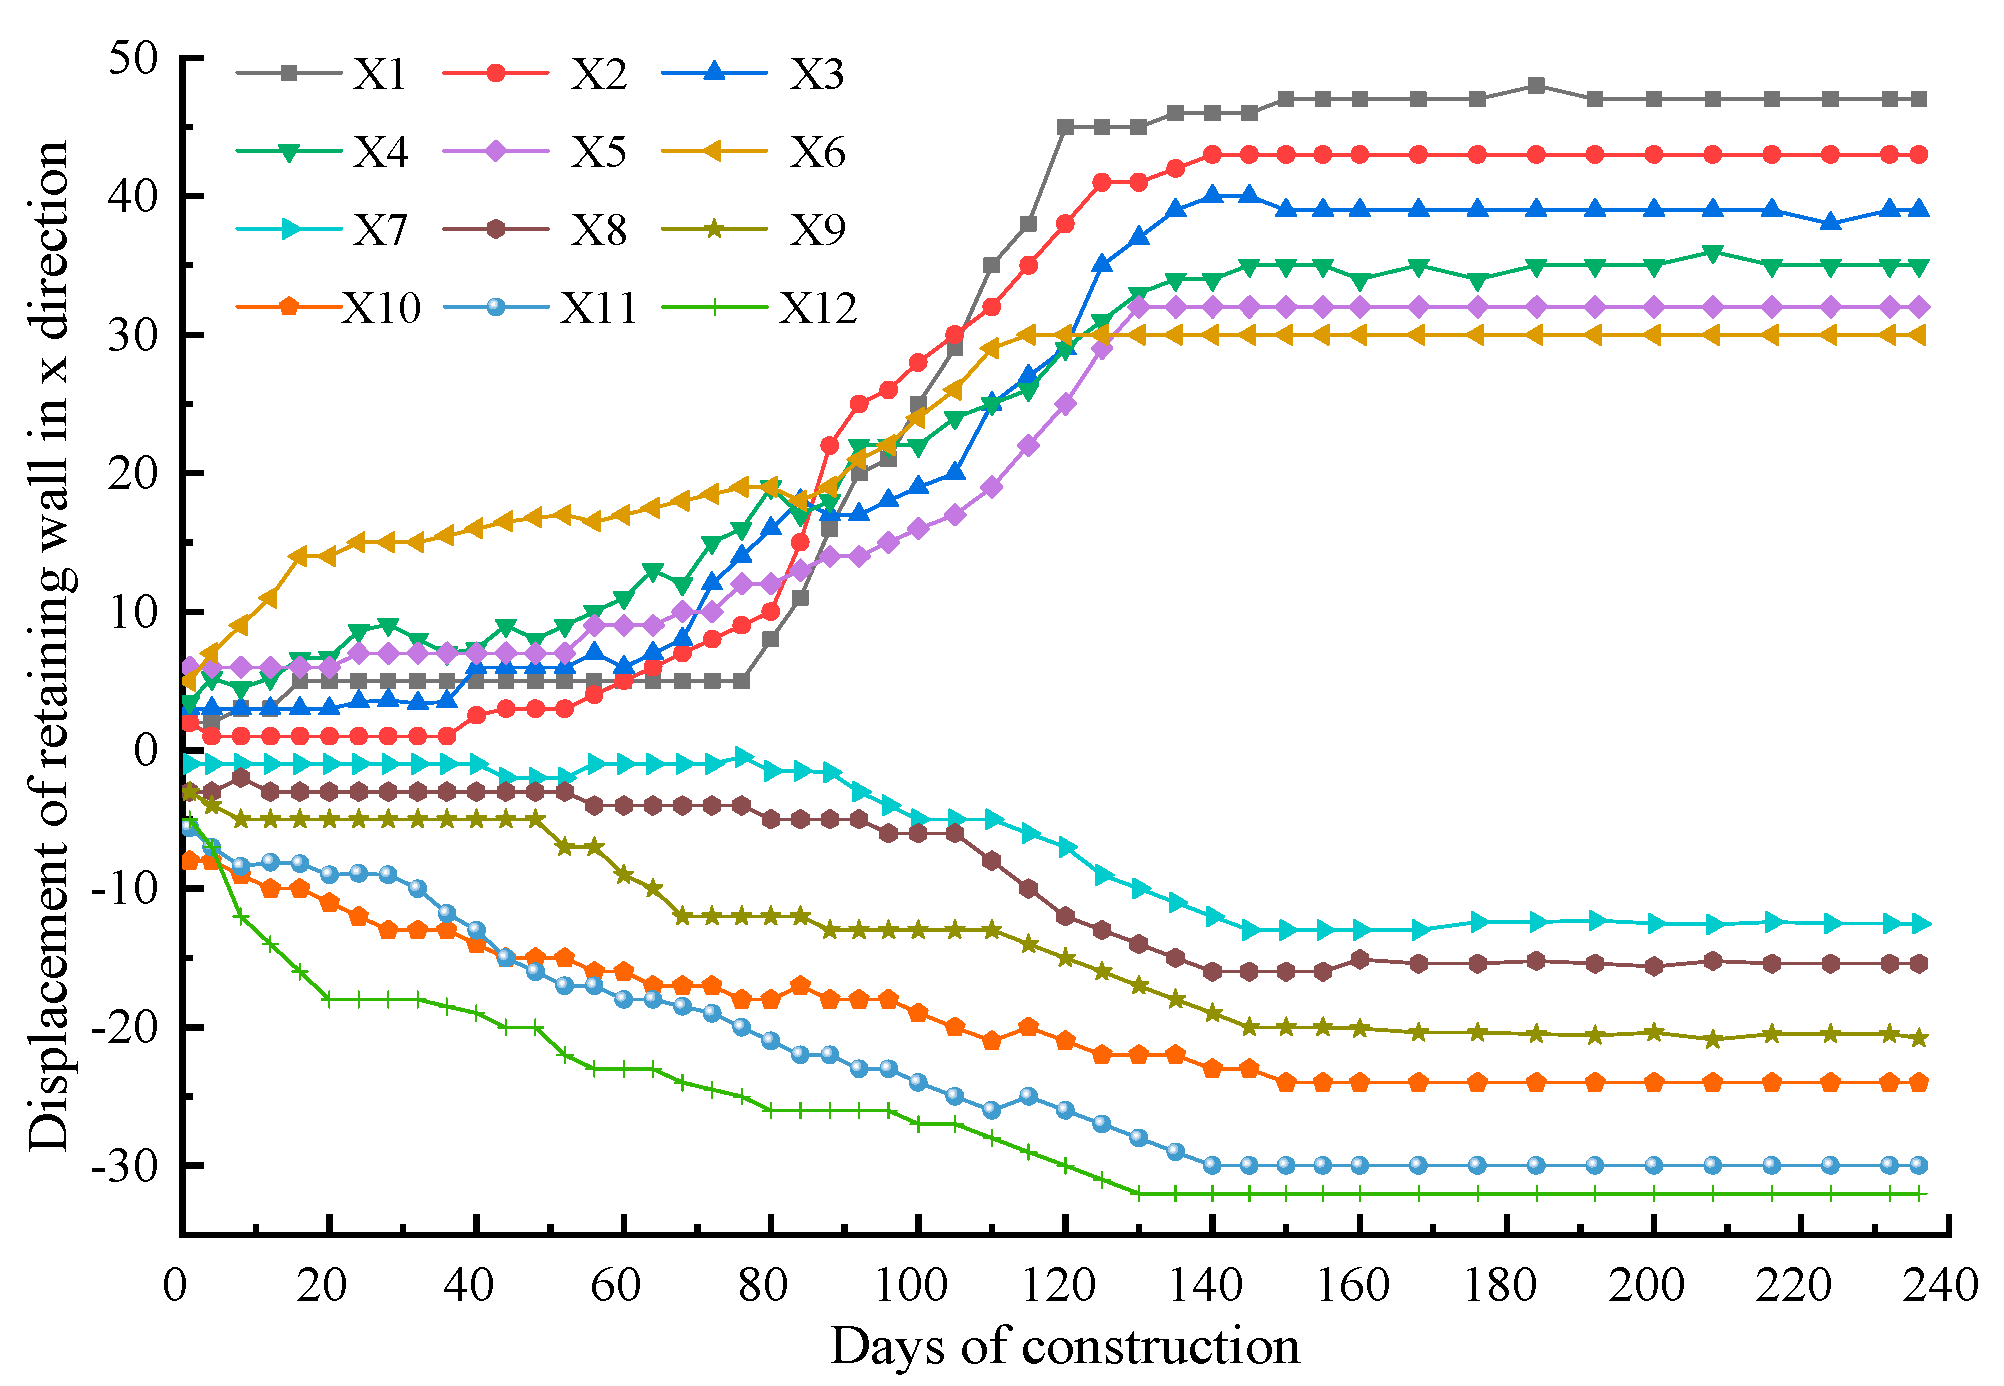
4.3.2. Analysis of Monitoring Results of Gravity Retaining Wall

During the entire excavation phase of the foundation pit, the time–history curves of vertical displacements at monitoring points X1–X12 of the gravity retaining wall on the south side of the pit can be seen in Figure 11. The locations of monitoring points X1–X12 are shown in Figure 8. During the excavation phase in the eastern area of the foundation pit, special attention was given to the vertical displacements at monitoring points X8, X9, X10, X11, and X12. Similarly, during the excavation phase in the western area of the foundation pit, focus was placed on the vertical displacements at monitoring points X3, X4, X5, X6, and X7. The displacement-monitoring results in the X-direction (east–west direction) at points X1–X12 can be seen in Figure 12, while the displacement-monitoring results in the Y-direction (north–south direction) of the gravity retaining wall can be seen in Figure 13. It should be noted that in the X-direction, positive values represent movement toward the east, while in the Y-direction, positive values represent movement toward the north.
According to Figure 11, during the excavation in the east area of the foundation pit, the maximum vertical settlement of the gravity retaining wall occurred at monitoring point X10, while after the excavation in the west area of the foundation pit, the maximum settlement of the south side retaining wall was observed at monitoring point X7. Throughout the excavation process, the minimum settlement was recorded at monitoring point X1.
Based on Figure 12, it can be observed that during different stages of the excavation process, the monitoring points moved in different directions. During the excavation in the east area of the foundation pit, monitoring points X1 to X6 moved eastward, with monitoring point X6 showing the largest eastward displacement and monitoring point X1 exhibiting the smallest eastward displacement. On the other hand, monitoring points X7 to X12 moved westward, with monitoring point X7 experiencing the smallest westward displacement and monitoring point X12 showing the largest westward displacement. After the excavation of the soil in the western area of the foundation pit, the eastward displacement increased for monitoring points X1 to X6, and the westward displacement increased for monitoring points X7 to X12. Ultimately, monitoring point X6 had the smallest eastward displacement, measuring 28 mm, while monitoring point X1 had the largest eastward displacement, measuring 46 mm. Monitoring point X7 had the smallest westward displacement, measuring 13 mm, while monitoring point X12 had the largest westward displacement, measuring 32 mm. In conclusion, during the excavation of the foundation pit, the horizontal displacement of the gravity retaining wall in the east–west direction followed a pattern of moving from both sides towards the center, with larger displacements observed at greater distances from the center and smaller displacements closer to the center in the X-direction of the retaining wall. This is due to the flow of silt beneath the gravity retaining wall toward the interior of the foundation pit after the excavation of the surrounding soil, resulting in the uplift of the foundation pit bottom and the settlement of the central portion of the gravity retaining wall, causing the eastward movement of monitoring points X1 to X6 and the westward movement of monitoring points X7 to X12.
According to Figure 13, throughout the entire excavation process of the foundation pit, monitoring point X5 initially moved southward and then moved northward. The monitoring points X6, X7, and X8 in the central portion of the retaining wall exhibited larger displacements, with monitoring point X7 showing the maximum northward displacement of 100 mm. This is attributed to the northward movement of the retaining wall induced by the soil pressure in the central portion of the wall, with the maximum displacement occurring at this section, which is consistent with the deformation pattern observed in typical excavation projects.

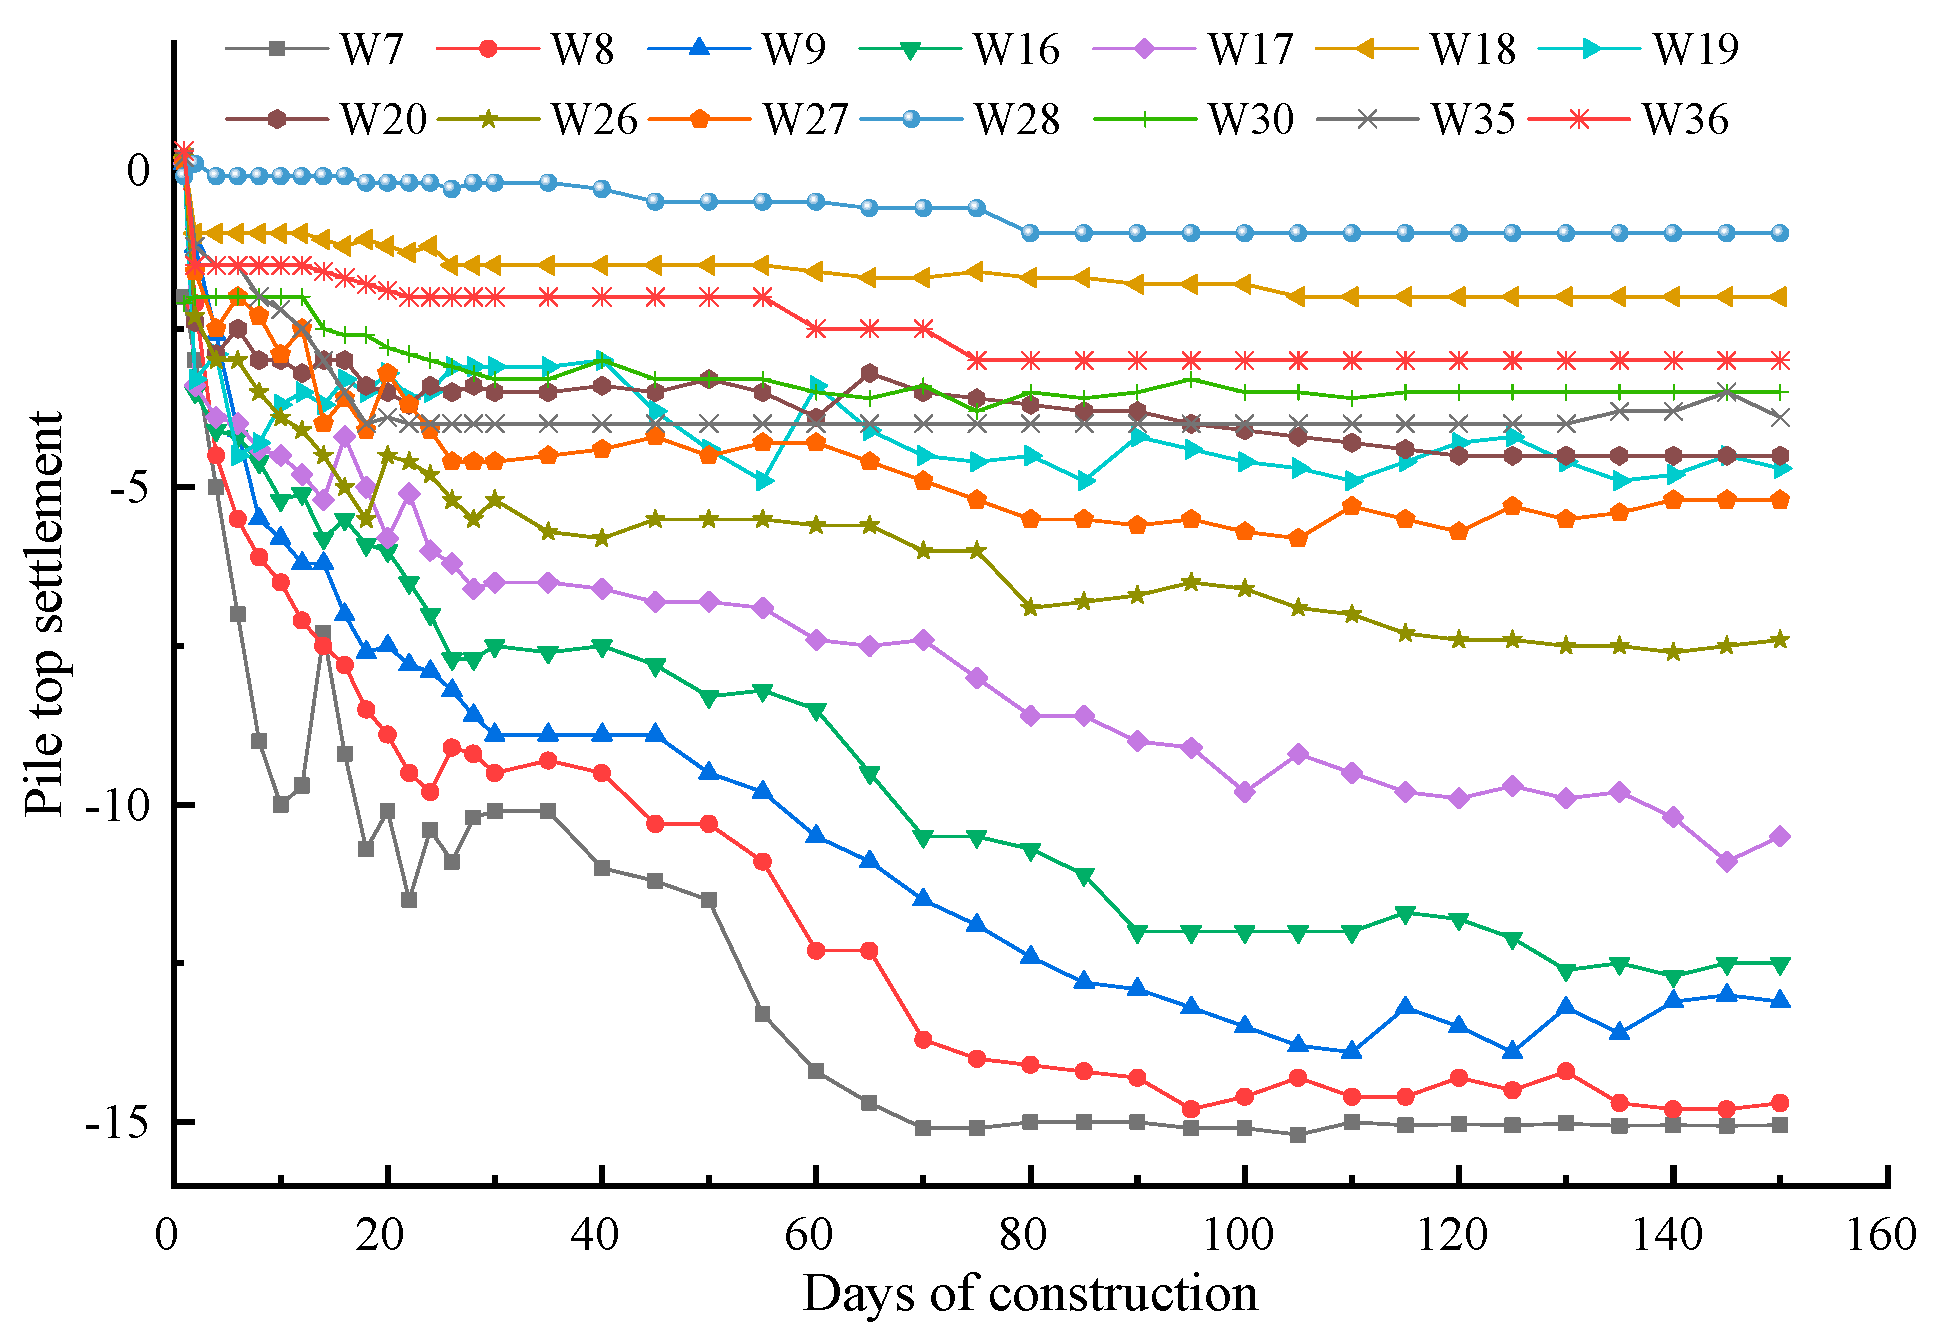
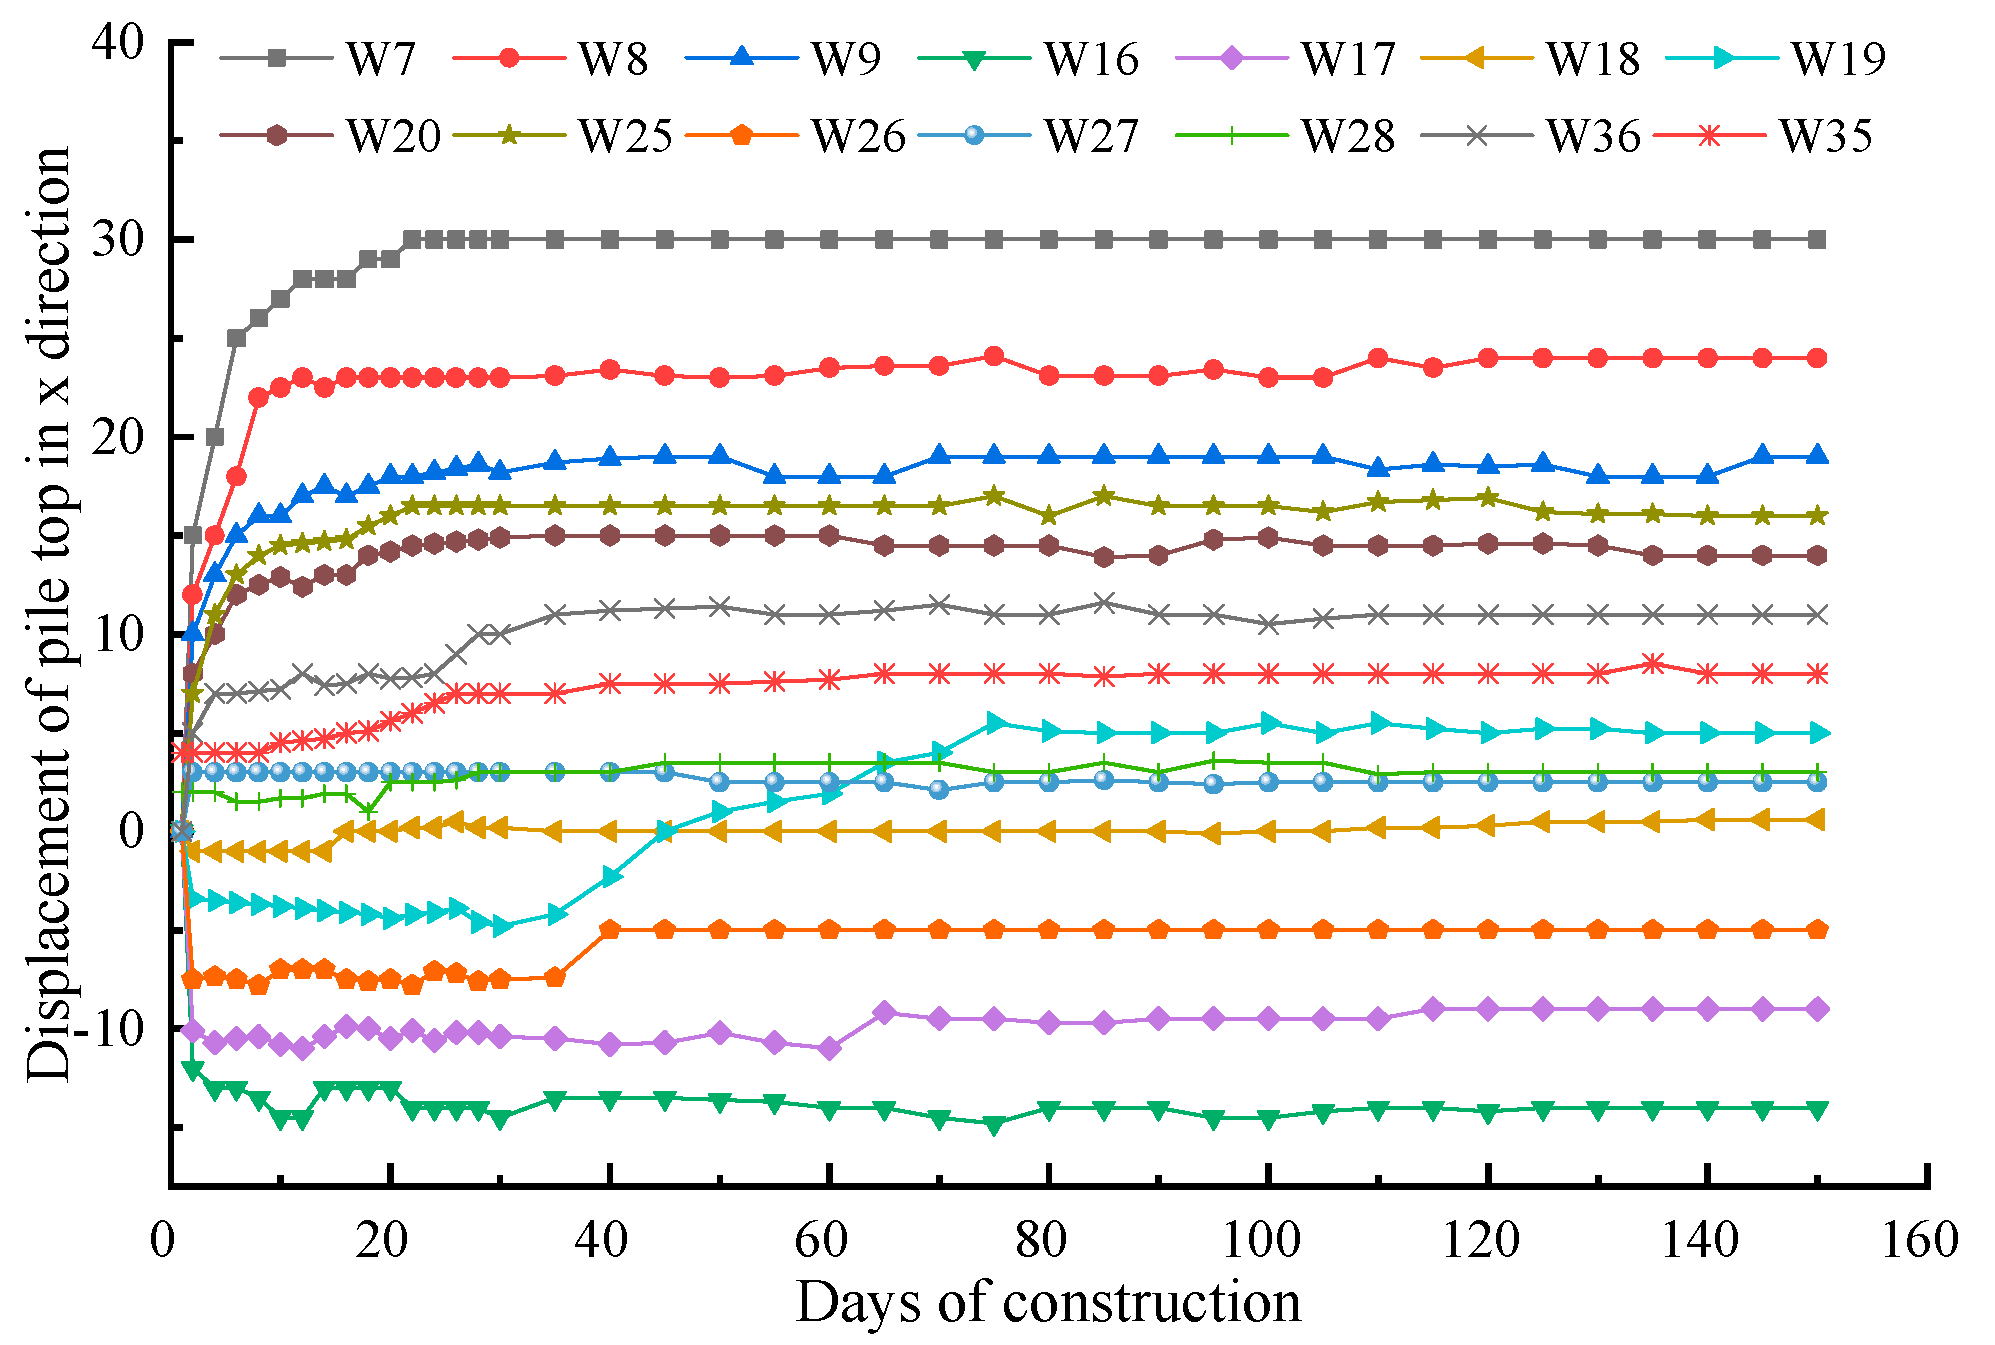
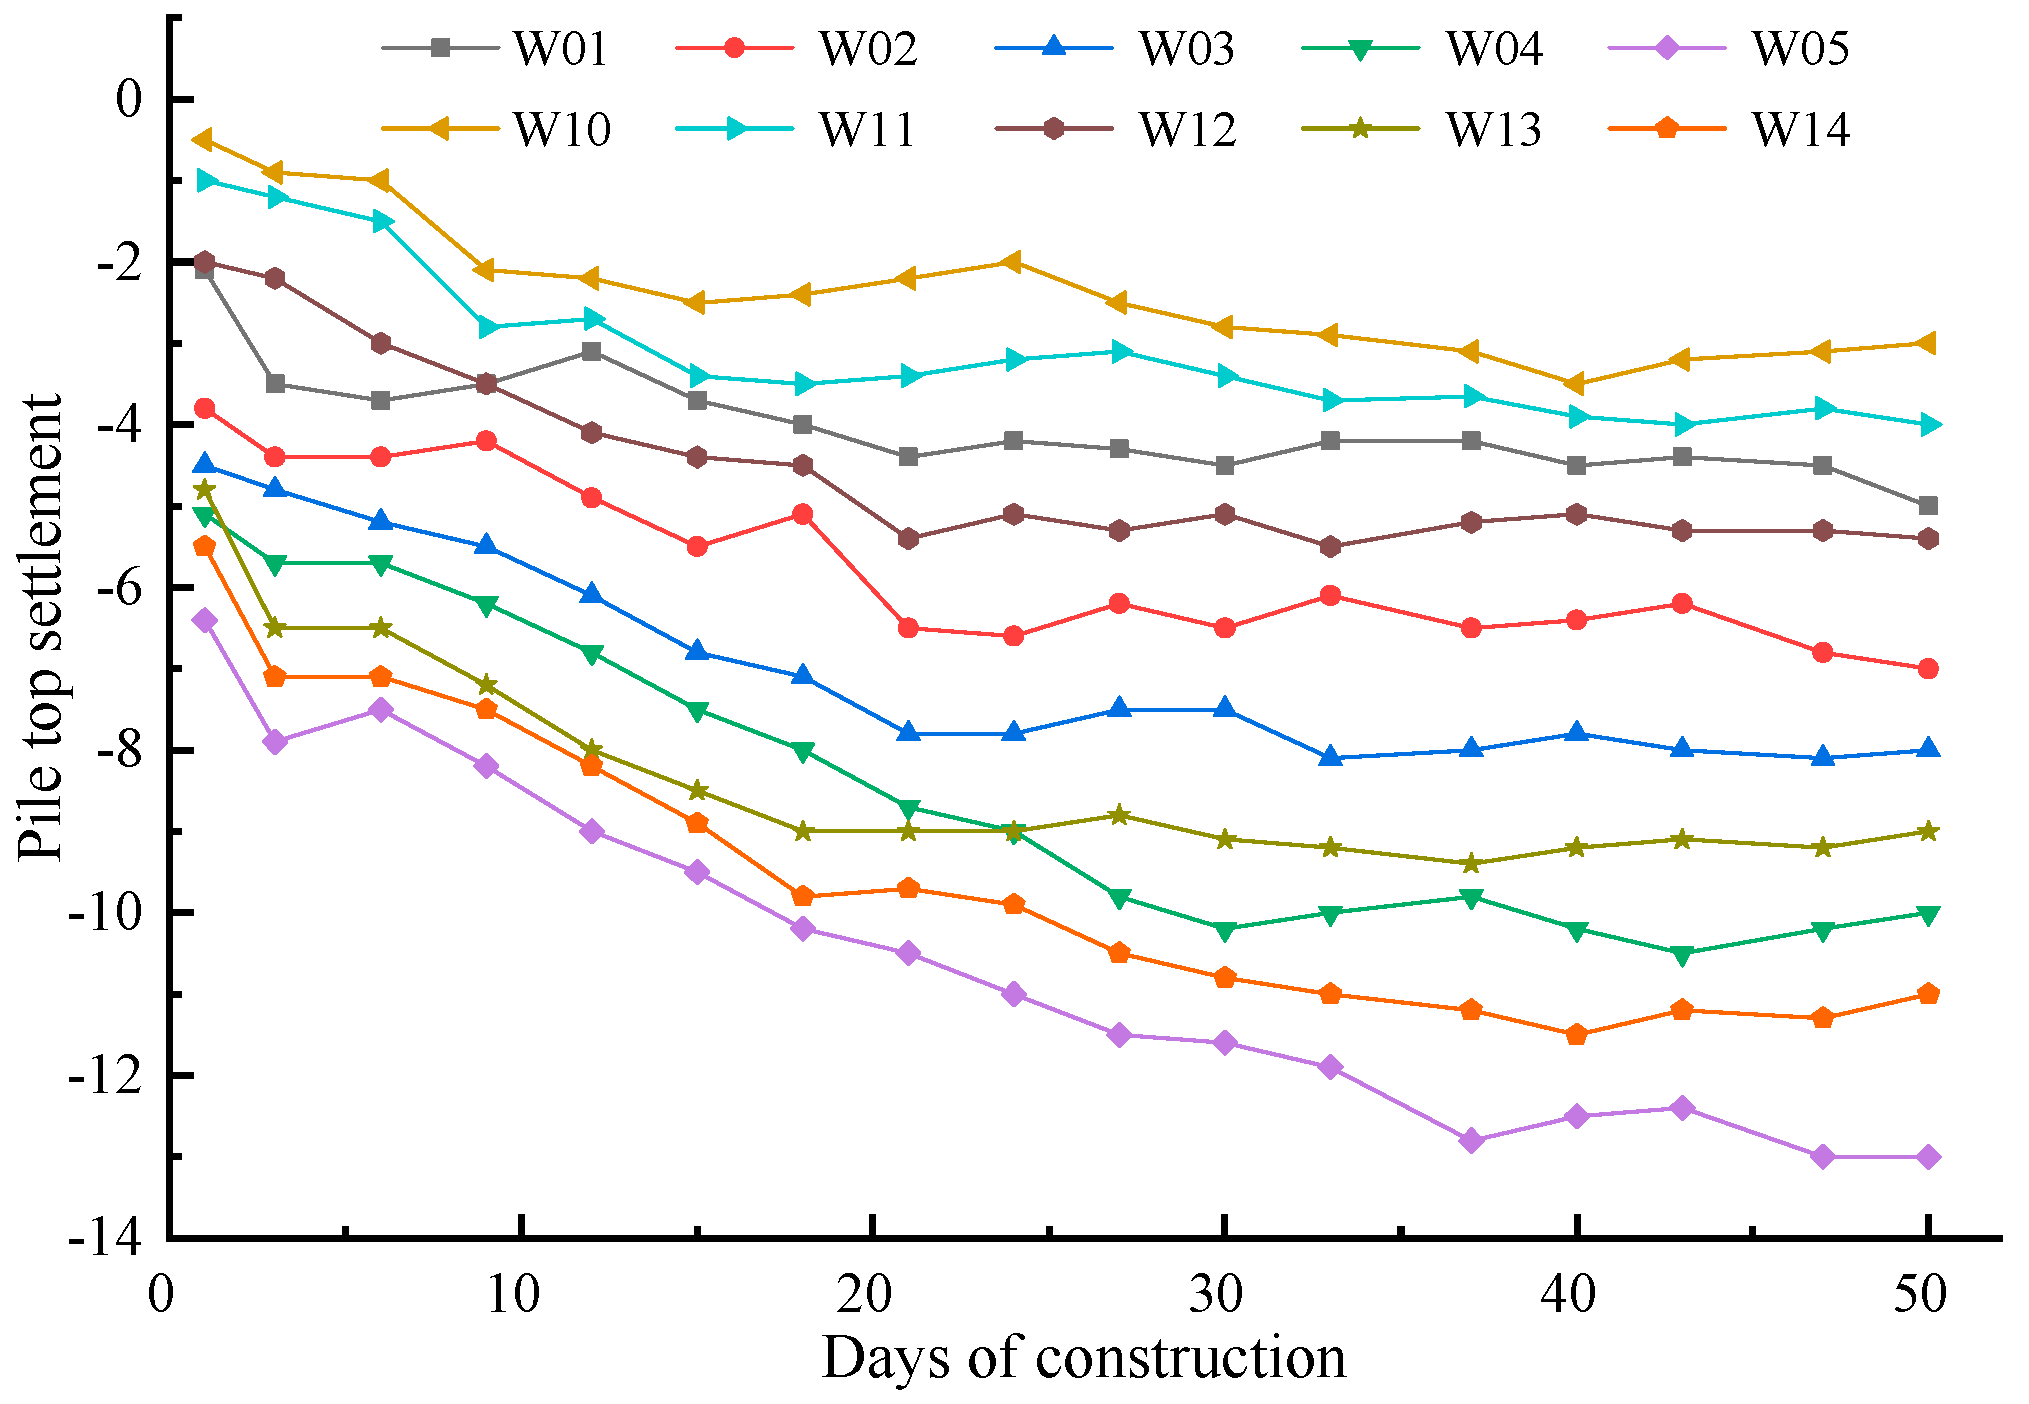
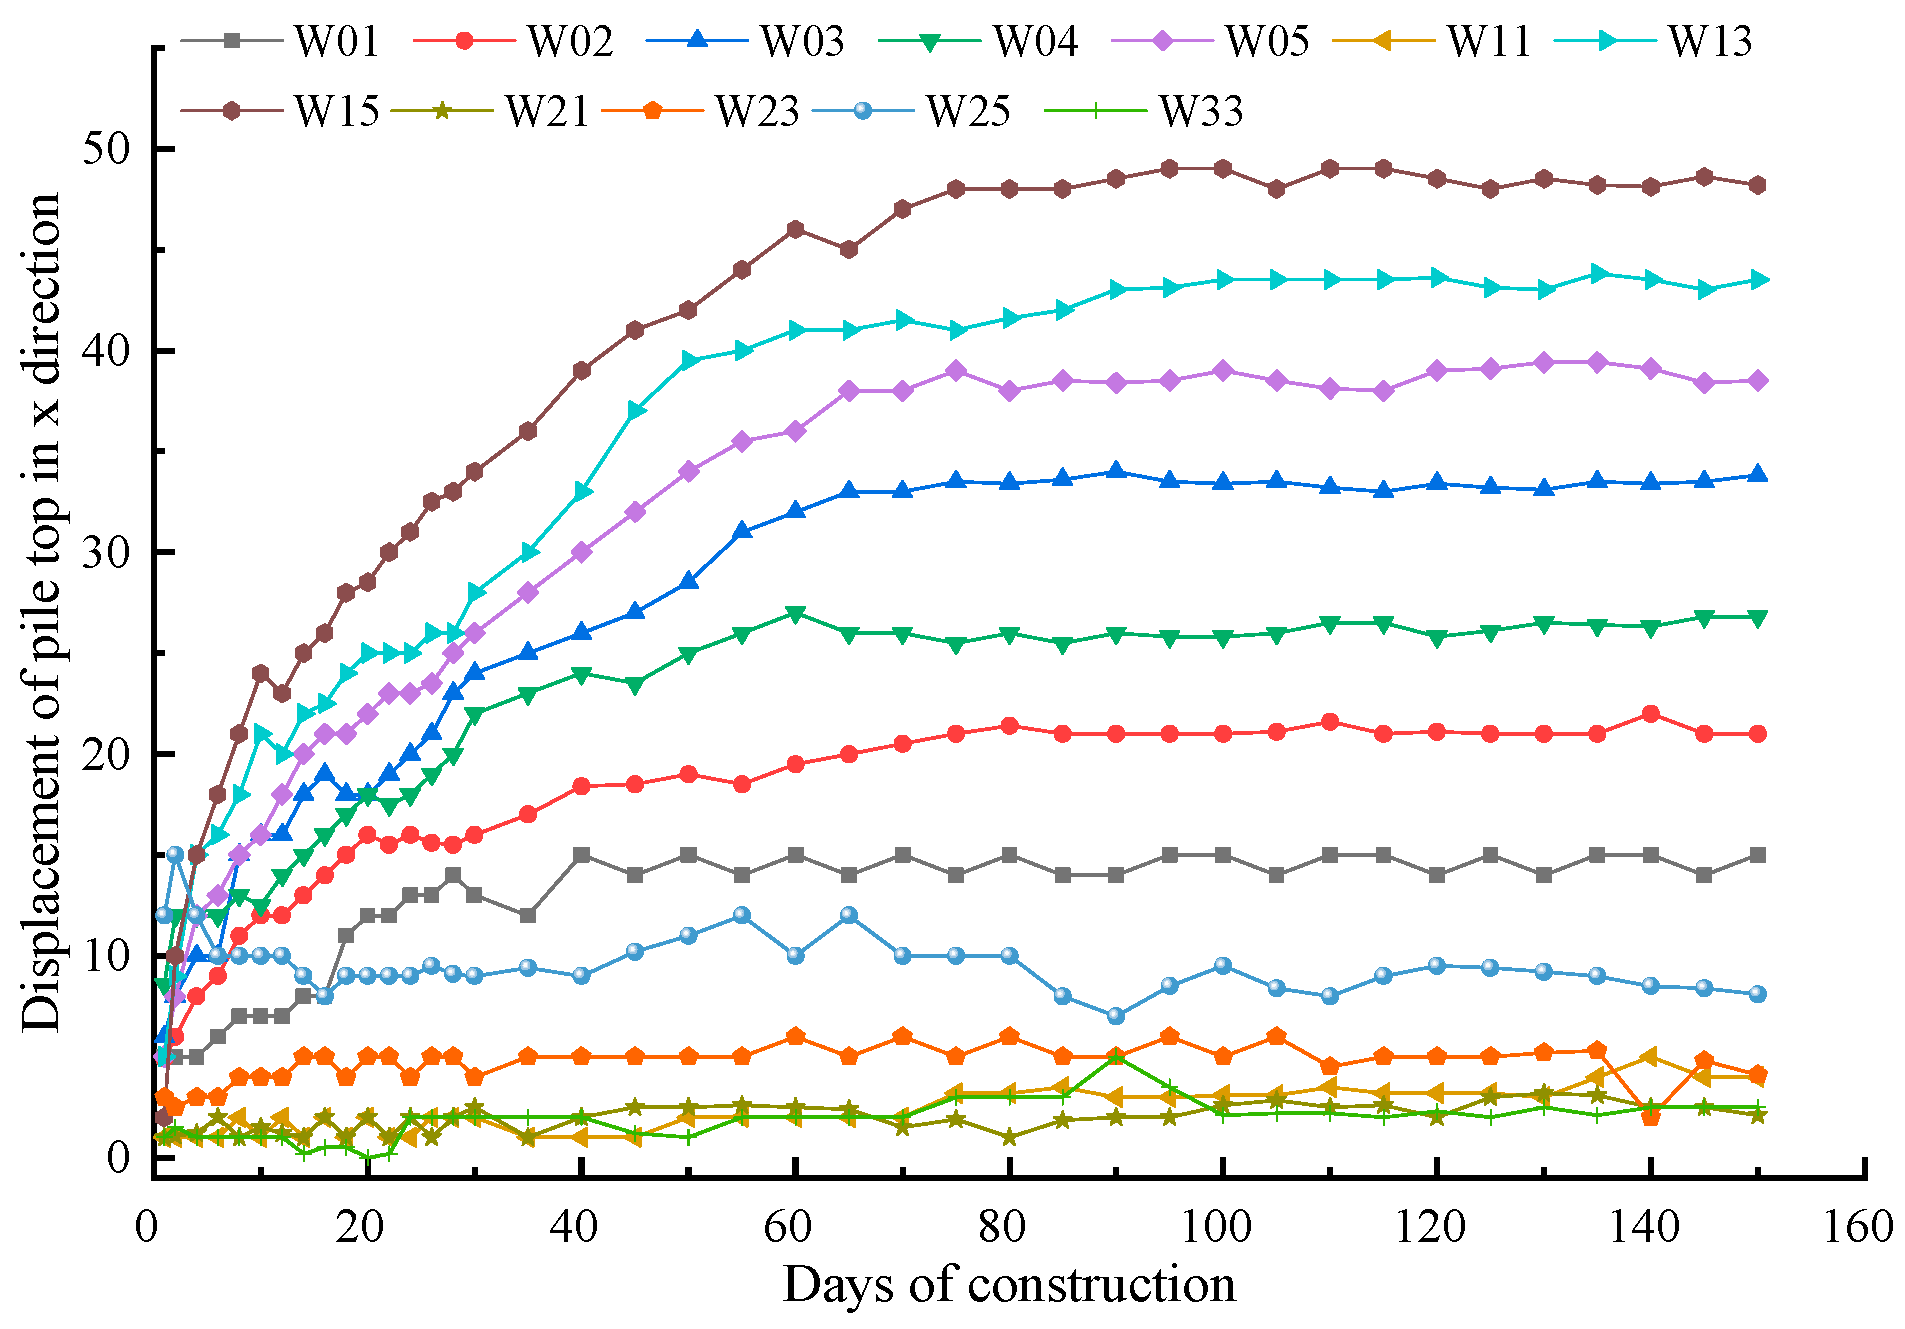
4.3.3. Analysis of Deformation Monitoring Results of Pile Foundation in the Foundation Pit

(1) The time–history curves of the settlement, X-direction displacement (east–west), and Y-direction displacement (north–south) at the top of selected pile foundations in the eastern area of the foundation pit are shown in Figure 14, Figure 15 and Figure 16, respectively. For the definition of positive directions, the eastward movement is considered positive in the X-direction, the northward movement is considered positive in the Y-direction, and the upward movement is considered positive in the Z-direction.
From Figure 14, it can be observed that during different stages of excavation, the pile foundations experience varying degrees of settlement. Among all the pile foundations in the eastern area of the foundation pit, Pile #7 exhibits the maximum settlement at the top of the pile, with a magnitude of 14.5 mm, while Pile #28 shows the minimum settlement, with a magnitude of 2.5 mm. The settlement of other pile foundations falls within the range of 2.5 mm to 14.5 mm.
From Figure 15, it can be observed how the pile foundations in the eastern area of the foundation pit deform in the east–west direction. During the 25 days of excavation in the eastern area, the pile top’s horizontal displacement of the eastern area’s pile foundations shows significant variations. However, after the installation of the eastern steel supports, the pile foundations exhibit slower horizontal displacements. Piles #7, #8, and #9 experience notable eastward displacements, with Pile #7 showing the largest eastward displacement of 30 mm. On the other hand, Piles #16, #17, and #26 exhibit westward displacements, with Pile #16 exhibiting the largest westward displacement of 15 mm.
Figure 16 reveals the deformation behavior of the pile foundations in the north–south direction in the eastern area of the foundation pit. Prior to the installation of steel supports, the pile foundations in the western area of the pit, except for Piles #27, #28, #19, and #35, move in a southward direction, while the remaining pile foundations move in a northward direction. Combining this information with the pile foundation numbering in Figure 9, it can be observed that the pile foundations located in the central area of the pit move northward, whereas those near the perimeter of the pit eventually move southward.
Figure 15 and Figure 16 demonstrate that, prior to the installation of steel supports, the pile foundations in the eastern area of the foundation pit experienced significant horizontal displacements at the pile tops. However, after the installation of steel supports, the rate of change in horizontal displacements decreased noticeably, indicating the effectiveness of the steel supports in reducing the horizontal displacements at the tops of the pile. This approach proves to be effective in mitigating pile top horizontal displacements and preventing pile foundation movements and tilting in excavations involving deep cohesive silt layers.
(2) The settlement, horizontal displacement in the X-direction (east–west direction), and horizontal displacement in the Y-direction (north–south direction) of the selected pile foundations in the western area of the foundation pit are presented in the time–history curves shown in Figure 17, Figure 18 and Figure 19.
From Figure 17, it can be observed that in the western area of the foundation pit, the maximum settlement is recorded at Pile #5, with a settlement of 13 mm, followed by Pile #15 with a settlement of 9 mm, and the minimum settlement is observed at Pile #10 with a settlement of 2.1 mm. Referring to the layout of the pile settlement monitoring points in Figure 9, it can be inferred that Piles #5, #13, and #4 are located in the central part of the foundation pit, with larger pile lengths and a thicker layer of underlying silt. Consequently, the excavation of surrounding soil results in varying degrees of settlement at the pile tops due to self-weight effects.
Figure 18 reveals that during the excavation of the western area of the foundation pit, Piles #15, #13, and #5 experience significant eastward displacement, with horizontal displacements of 49 mm, 46 mm, and 38 mm, respectively. Piles #21, #11, and #23, on the other hand, demonstrate smaller eastward displacement, measuring 1.5 mm, 1.8 mm, and 2 mm, respectively. Referring to Figure 9, it can be observed that in the central part of the foundation pit where Piles #15, #13, and #5 are located, there is a rapid increase in the pile top displacement before the implementation of steel support in the western area of the foundation pit. However, after the installation of steel support, the growth rate of the pile top’s horizontal displacement decreases, exhibiting a diminishing trend. The presence of steel support between the piles effectively reduces the horizontal displacement of the piles.
Based on Figure 19, it can be observed that during the initial 50 days, there is a slow variation in the north–south displacement of the pile foundations in the western area of the foundation pit prior to excavation. However, once the construction in the western area of the foundation pit begins, the pile foundations in this area rapidly shift northward. Following the implementation of steel support in the western area, the northward displacement of the pile foundations gradually decreases and stabilizes. Ultimately, Pile #13 exhibits the largest displacement, moving 25 mm northward, followed by Piles #15 and #3 with displacements of 24 mm and 20 mm, respectively. Pile #1 demonstrates the smallest north–south horizontal displacement, with a movement of 10 mm northward. This behavior can be attributed to the construction of a steel support prior to the excavation in the western area of the foundation pit, resulting in minimal horizontal displacement of the piles during excavation.

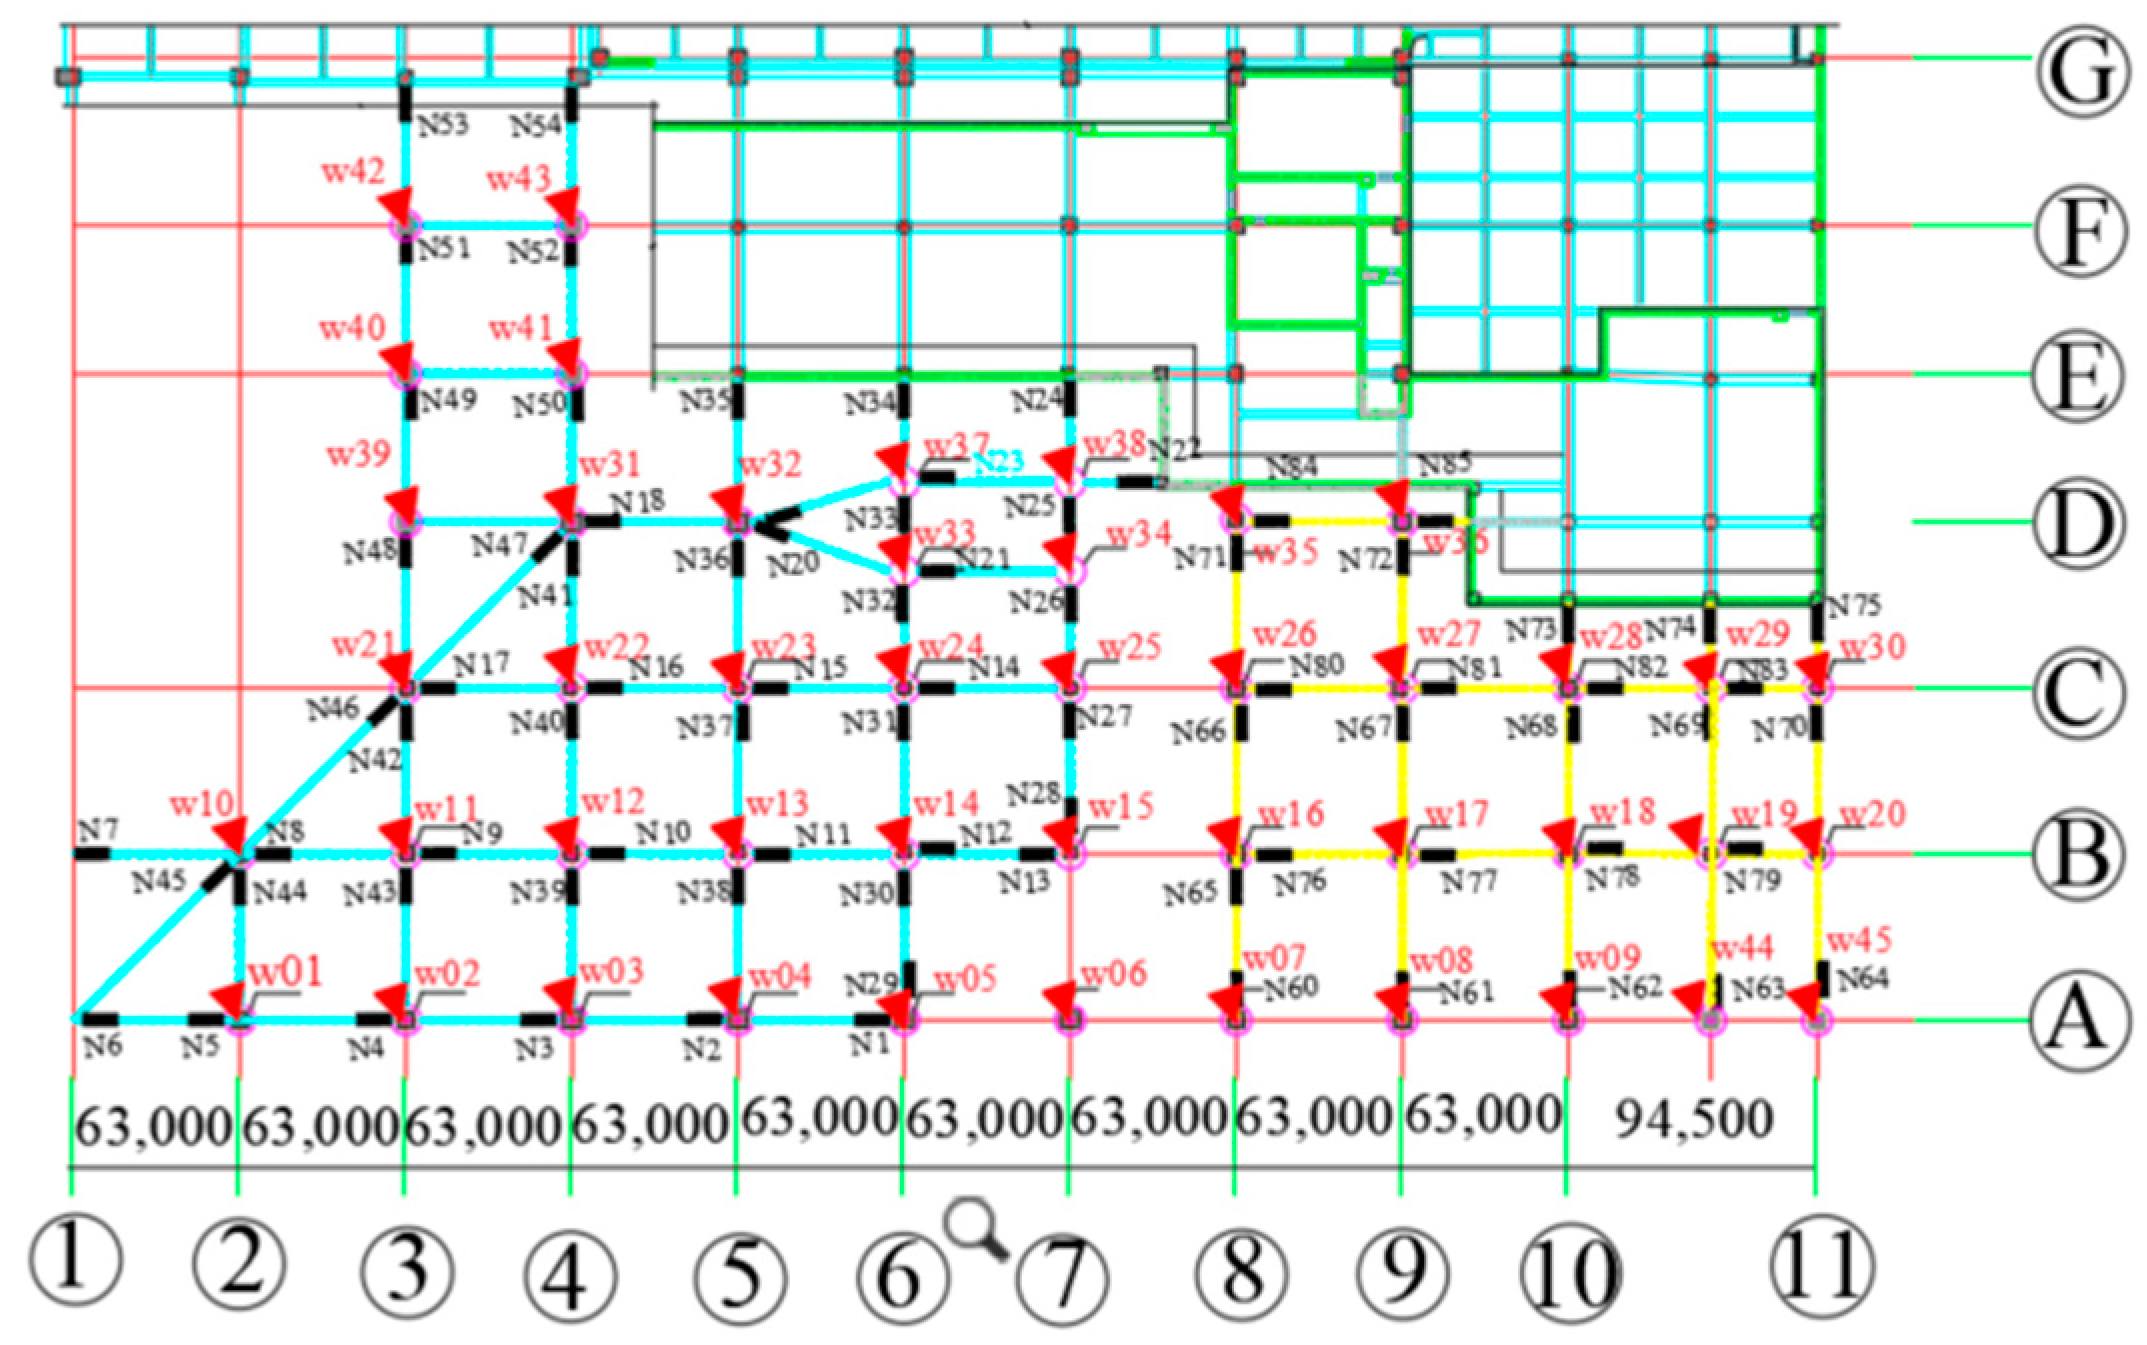
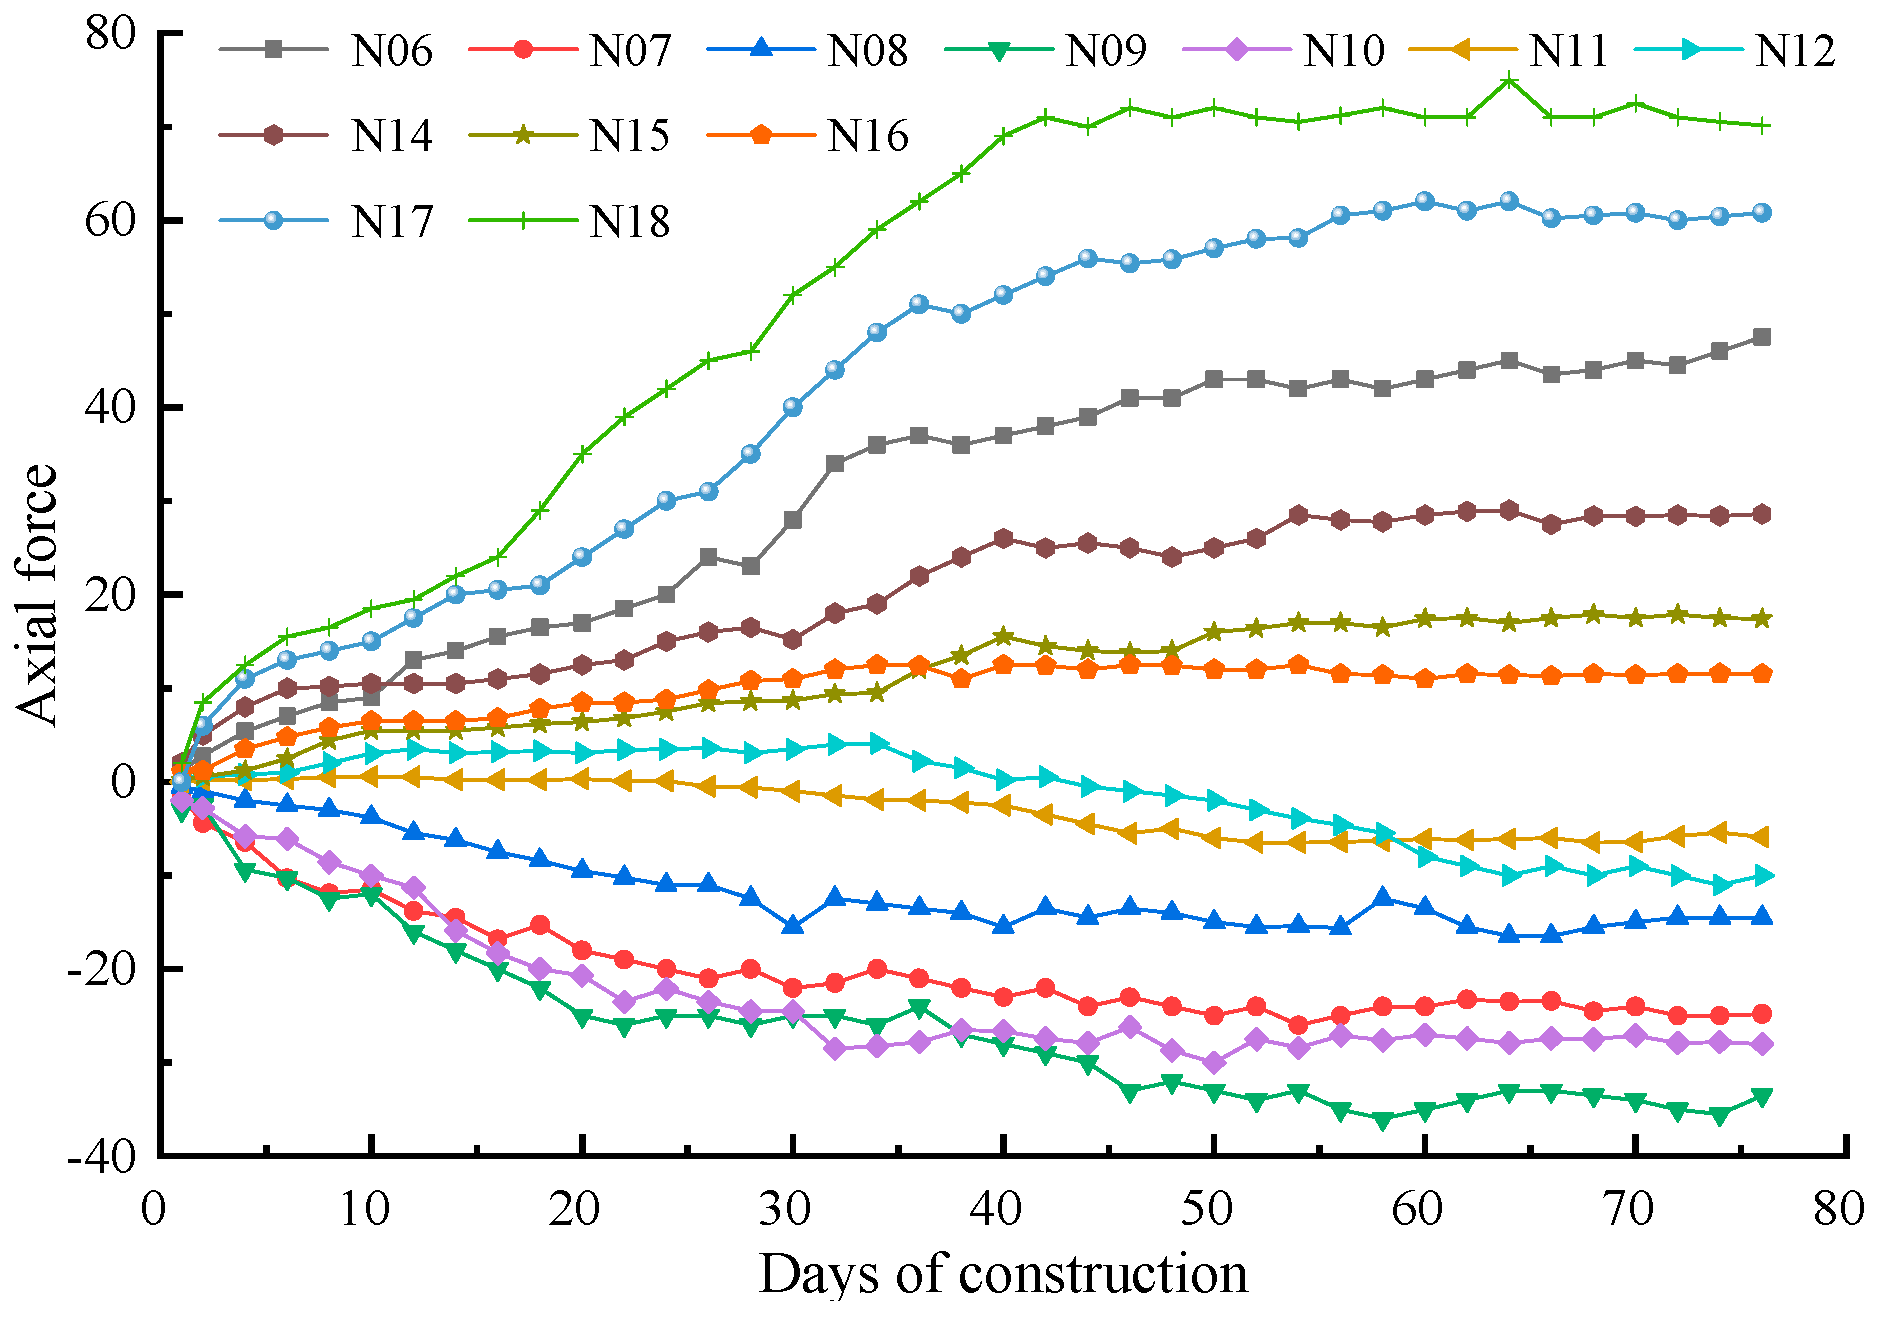
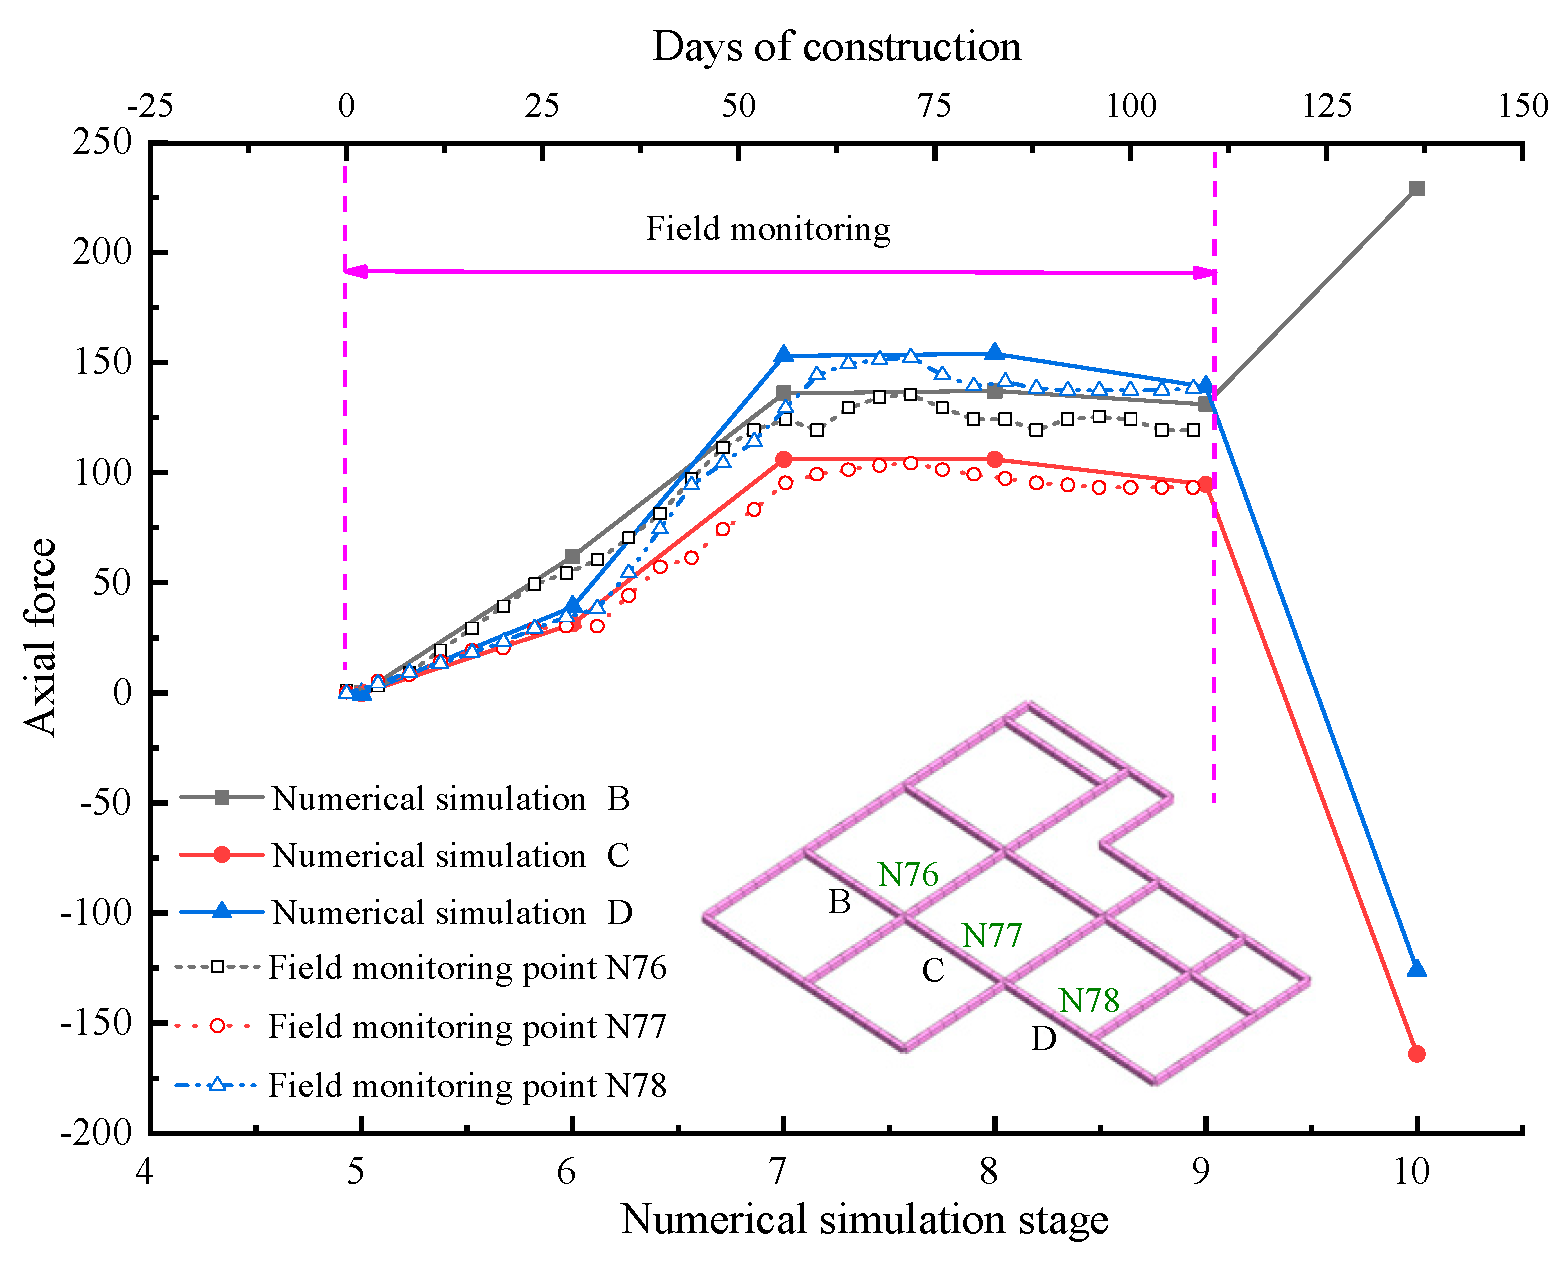
4.3.4. Analysis of Monitoring Results of Axial Force of Steel Support

The direction of axial force is defined as positive tension and negative pressure. See Figure 9 for the number of steel supports and the specific location of axial force-monitoring points.
(1) Axial force of steel support in the east area of the foundation pit
From Figure 20, it can be observed that the steel supports N71, N77, and N73 at the bottom of the eastern area of the foundation pit are subjected to compressive forces, while the remaining steel supports experience tensile forces. Among them, the steel support N71 experiences the highest compressive force, measuring 300 KN, and the steel support N76 experiences a maximum compressive force of 135 KN. The steel support N74 experiences the smallest axial force. This is because the N74 steel support is located at the northeast corner of the foundation pit, where the horizontal displacement of the pile foundation is small, resulting in minimal force on the N74 steel support.
(2) Analysis of monitoring results of axial force of the first steel support in the west area of the foundation pit (upper steel support)
From Figure 21, it can be observed that after the construction of the upper steel supports in the western area of the foundation pit, a spatial structure is formed between the steel supports and the pile foundation. During the excavation of the soil in the western area of the foundation pit, the steel supports can reduce the horizontal displacement of the pile foundation, and the axial force gradually increases. Some steel supports experience compressive forces, while others experience tensile forces. Ultimately, the N18 steel support experiences the highest tensile force, with a magnitude of 70 KN, and the N09 steel support experiences the smallest compressive force, measuring 36 KN.
(3) Analysis of monitoring results of the inclined steel support between gravity retaining wall and piles on the south side of the west area of the foundation pit
According to Figure 22, after the excavation of the soil in the western area, the inclined struts experience axial compression. Among them, the inclined strut between #6 and #15 experiences the highest axial compression, measuring 280 KN, while the inclined strut between #1 and #10 experiences the lowest axial compression, measuring 10 KN. Combining this information with Figure 9, it can be observed that the N1-1 steel support is located at the southwestern corner of the foundation pit, where the horizontal displacement between the retaining wall and the pile top is small, resulting in the smallest axial compression in the N1-1 steel support. On the other hand, the N6-1 steel support is located in the middle of the foundation pit, where the southern retaining wall undergoes significant deformation toward the interior of the foundation pit, leading to a higher axial compression in the N6-1 steel support compared to other inclined steel supports.

4.3.5. The Eastern Side of the Excavation Site Is Adjacent to a Road

Monitoring points D06-D16 are positioned along the road’s edge near the excavation site, while monitoring points B01-B11 are placed along the road’s central axis, as illustrated in Figure 8. Figure 23 depicts the settlement-monitoring time–history curve along the road’s edge, while Figure 24 displays the settlement-monitoring time–history curve along the road’s central axis.
From Figure 23, it is evident that the settlement at monitoring point D07 is the smallest, with a stable value of 0.2 mm during the excavation of the west side of the excavation area. The maximum settlement occurs at monitoring point D12, with a stable settlement value of 60 mm. Following this, monitoring points D13 and D14 exhibit significant settlements, measuring 55 mm and 46 mm, respectively.
From Figure 24, it can be observed that along the central axis of the road, monitoring points B01, B02, B03, B04, and B09 exhibit relatively smaller settlements, likely due to their greater distance from the excavation edge of the pit. Conversely, monitoring points B05, B05-1, B06, and B07 show larger settlement values. Referring to the layout plan in Figure 8, it becomes apparent that monitoring points B05, B05-1, B06, and B07 are situated closer to the excavation pit’s edge, leading to the larger settlements observed.
Comparing and analyzing Figure 22 and Figure 23, it is evident that the maximum settlement displacement at the road’s edge occurs at monitoring point D12, with a settlement value of 64 mm. On the road’s central axis, the largest settlement is at monitoring point B05-1, measuring 81 mm. The reason for the larger settlement at monitoring point B05-1 compared to monitoring point D12 is attributed to the vehicular load on both sides of the road’s central axis. At monitoring point D12, the smaller effect of the eastern pit support and the lesser vehicular load near the road’s edge result in a smaller settlement value. This is why the settlement at monitoring point B05-1 is greater than that at monitoring point D12.

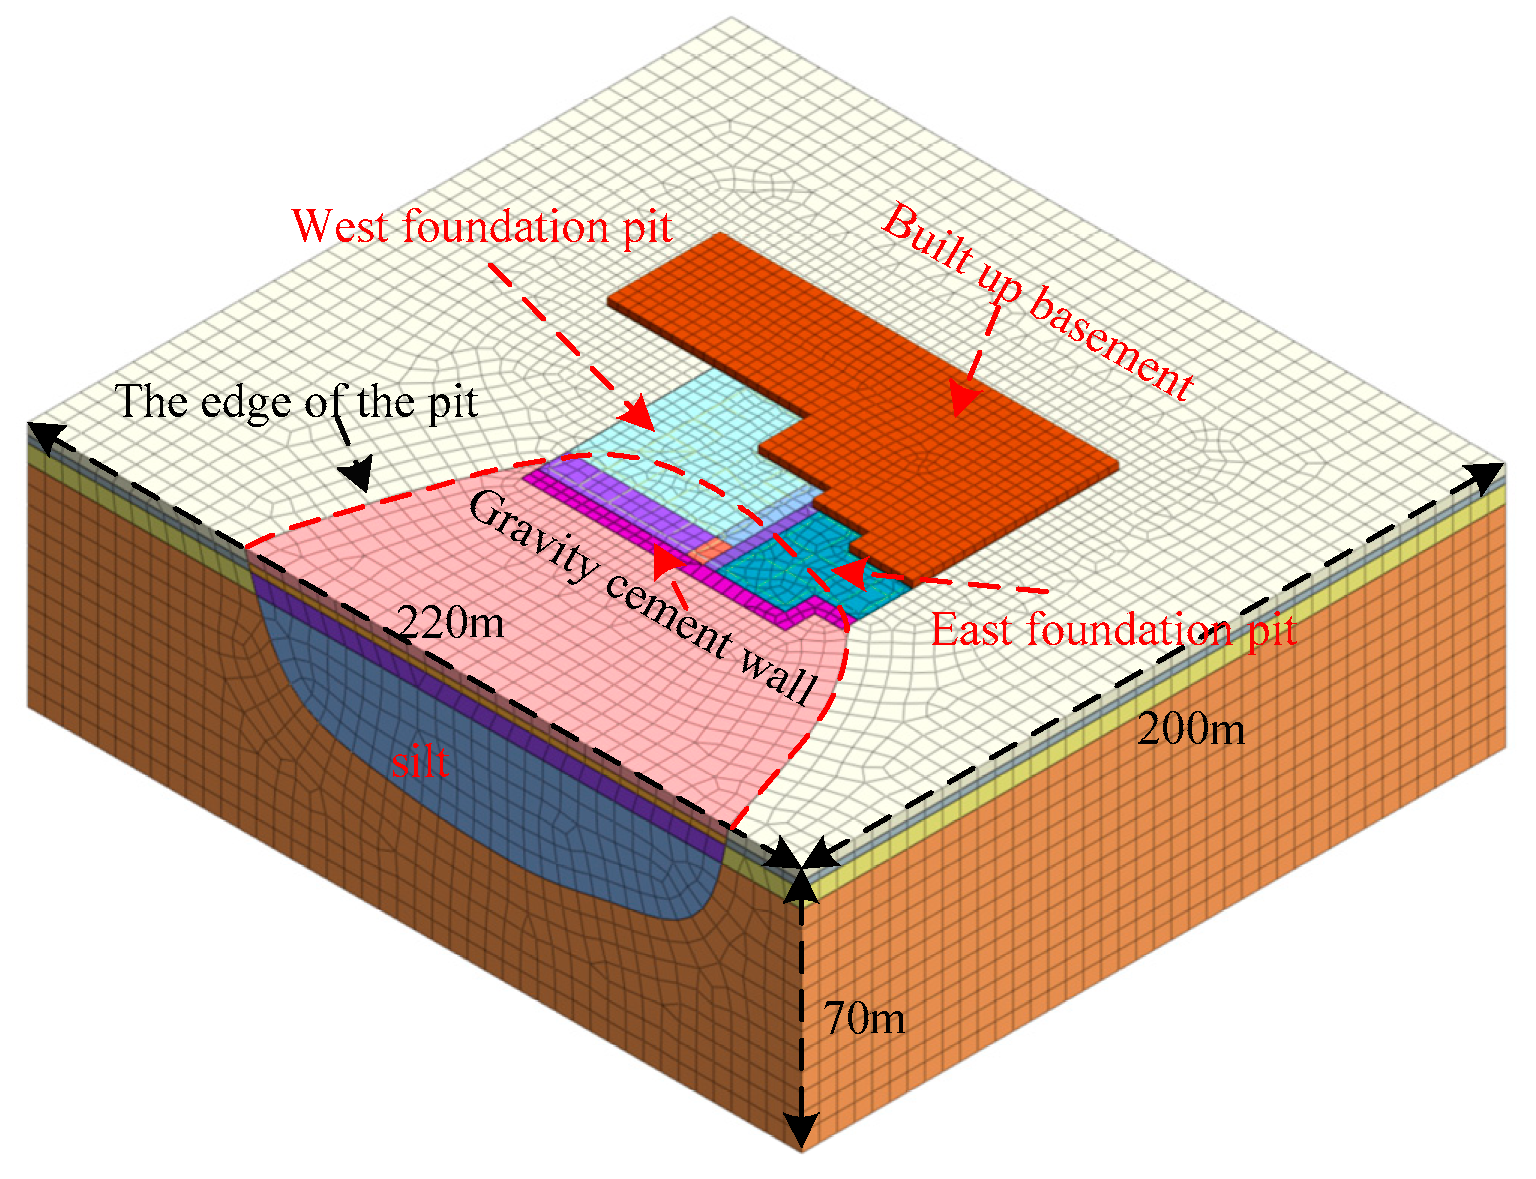
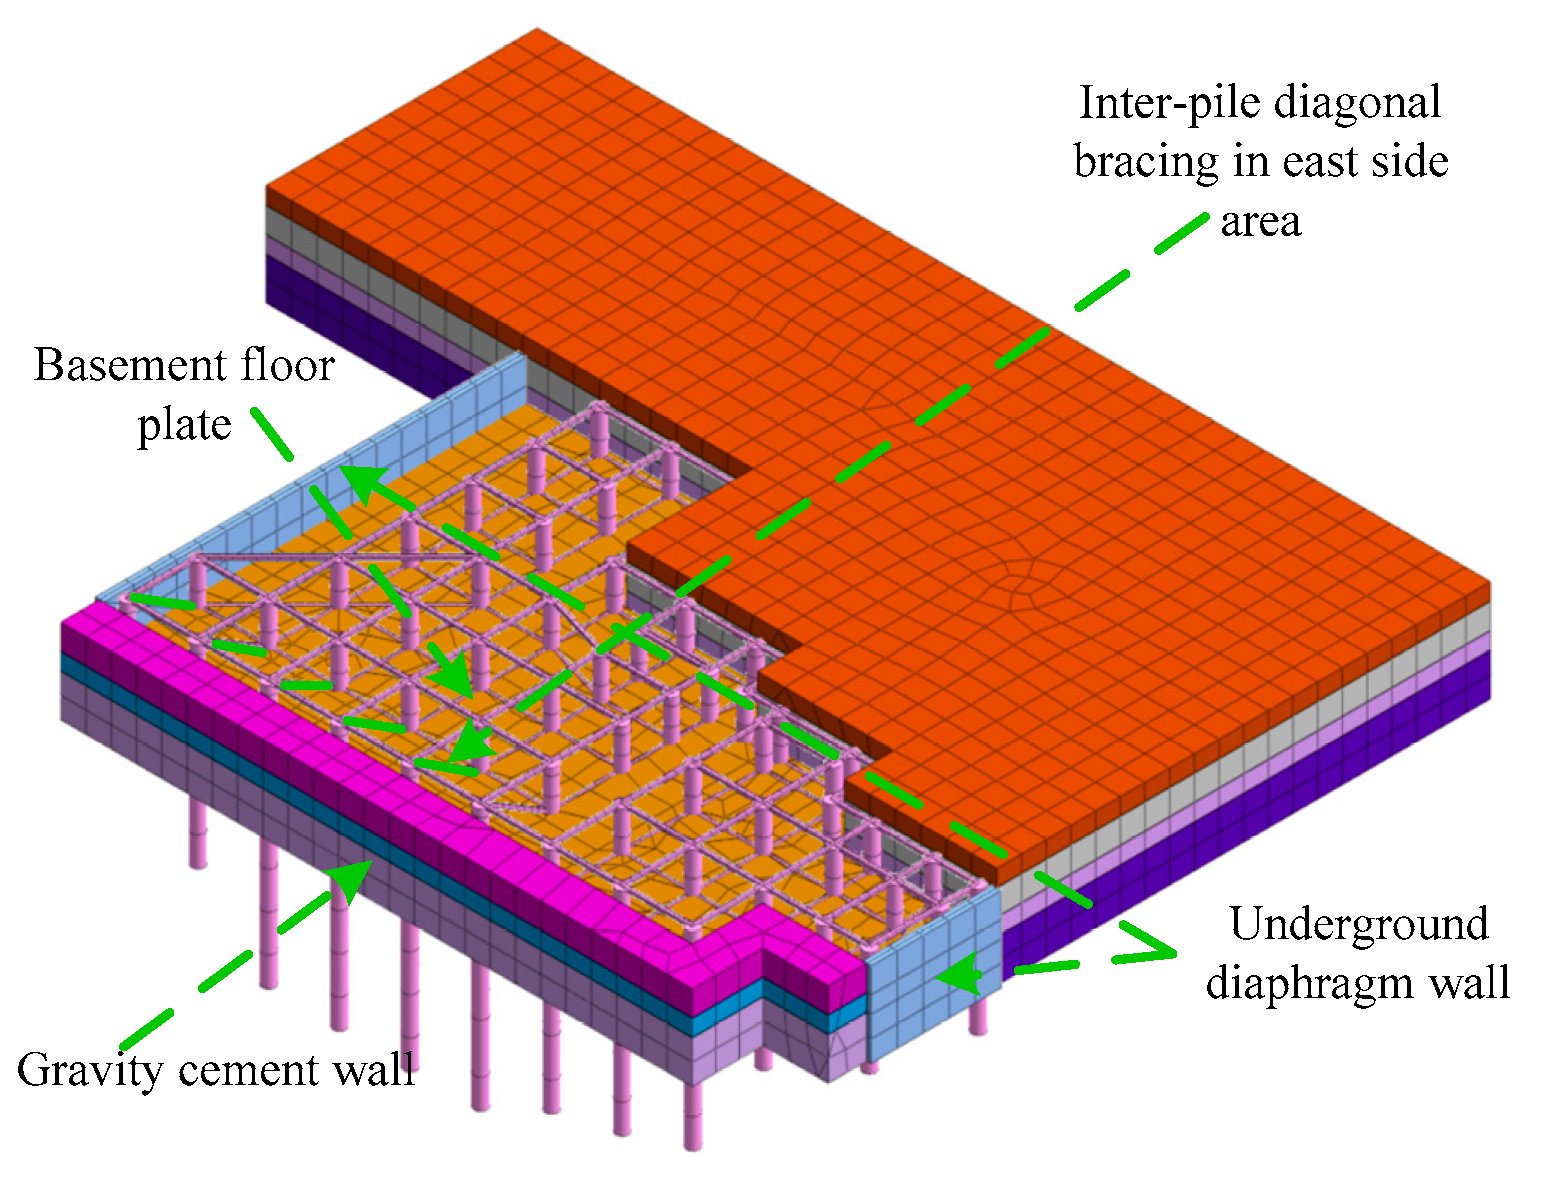
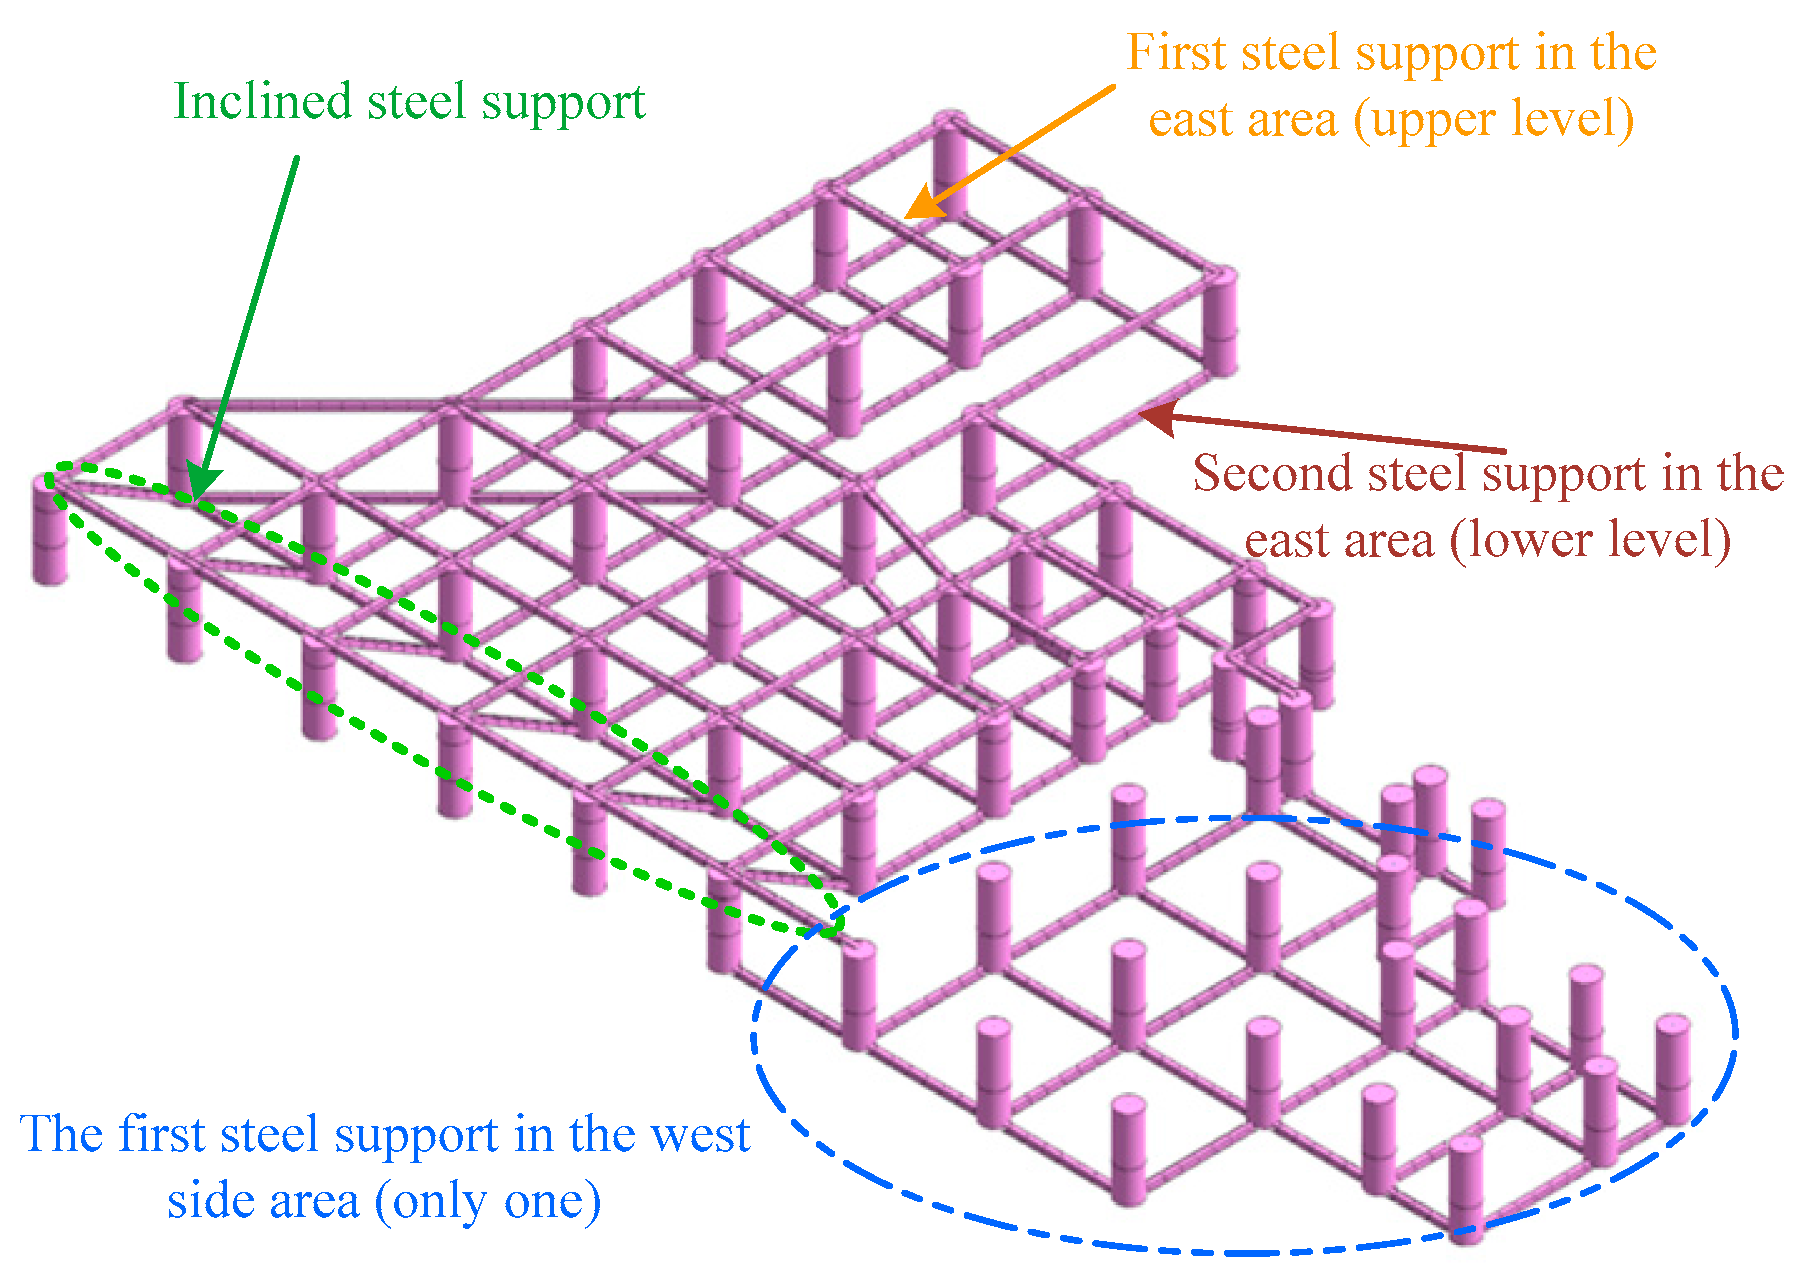
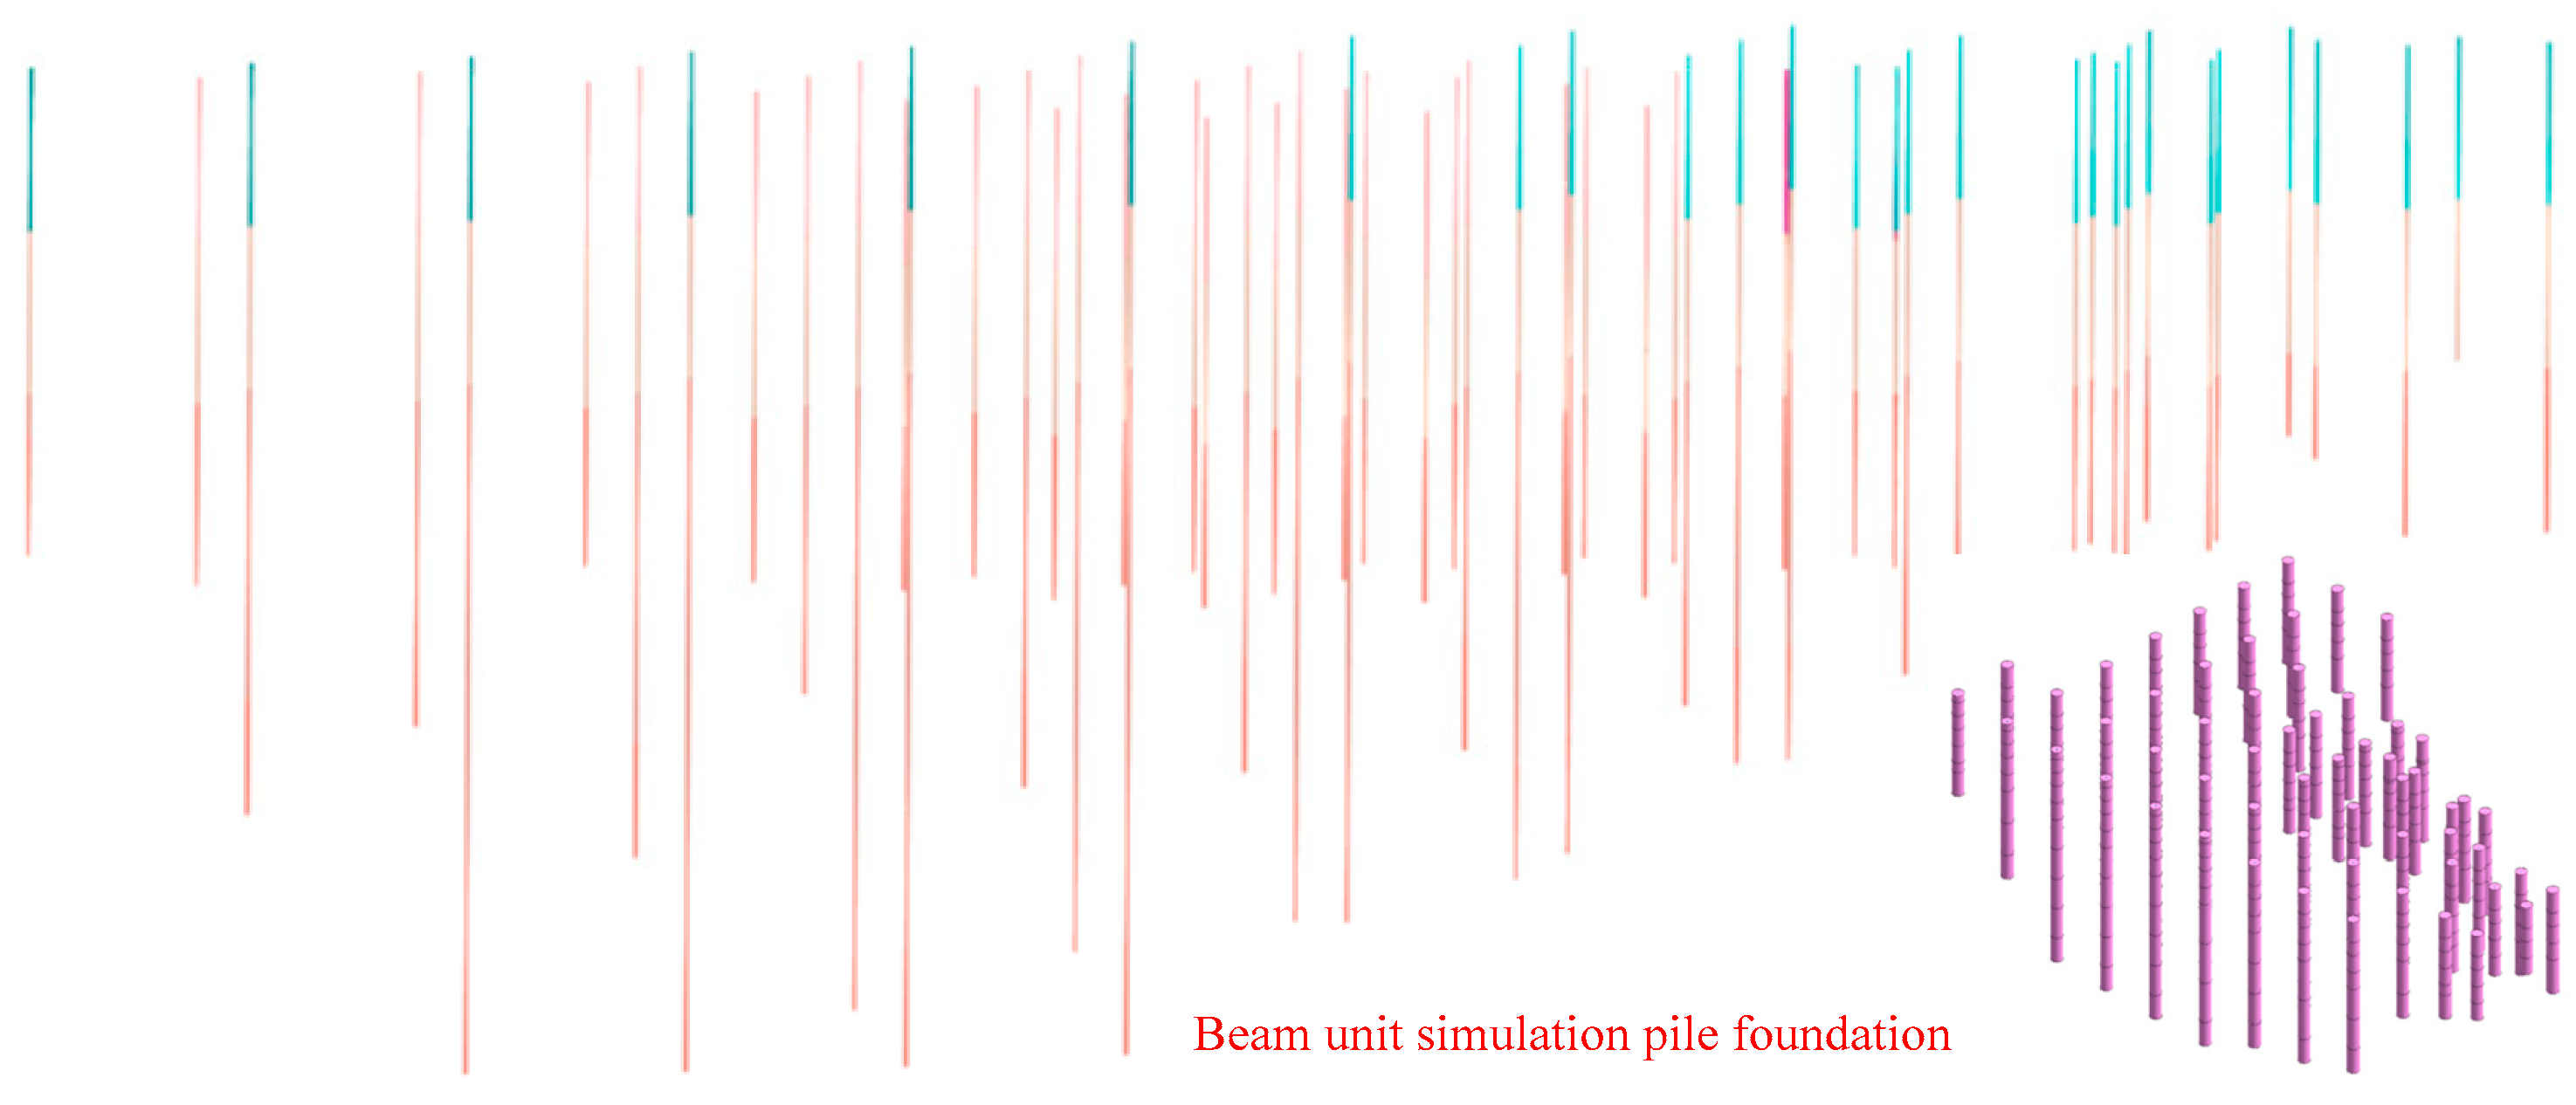
5. Finite Element Simulation Analysis

5.1. Establishment of Finite Element Model

The 3D model was established using the Midas GTS NX (2022 version) specialized finite element software to simulate the impact of excavation on the surrounding environment and the deformation response of the support structure during the excavation phase. To eliminate the influence of boundary effects, the model dimensions were set to 220 × 200 × 70 m in length, width, and height, respectively. According to the actual distribution of soil layers, the soil outside the pit was divided into four layers from top to bottom: 3 m of loose fill soil, 2 m of clay, 5 m of strongly weathered sandstone, and a bottom layer of rock with a thickness of 60 m. Inside the pit, the soil was divided into three layers: 3 m of loose fill soil, 2 m of clay, and an uneven thickness of silt layer, with a rock layer beneath it. The 3D finite element model is shown in Figure 25. The support structure model for the pit is shown in Figure 26, while the steel supports on the east and west sides of the pit are shown in Figure 27. See Figure 28 for the location of excavated slope on the west side and reserved soil on the east side of the foundation pit. The pile foundation model can be seen in Figure 29.
The pile foundation and steel supports were simulated using one-dimensional beam elements, while the underground retaining walls and basement floor on the east and west sides of the pit were simulated using two-dimensional plate elements. The remaining soil layers were simulated using three-dimensional solid elements. The constitutive model chosen for the soil was the Mohr–Coulomb model, while the structural elements were assumed to follow linear elastic behavior. The parameters for the soil and structural elements can be found in Table 3.
Since a part of the pit is situated on an existing quarry, which has an irregular spatial surface, a three-dimensional surface was created based on the contour lines of the quarry using the software. The surface layers were established using the 3D solid segmentation function. The boundaries of the quarry and the extent of the silt layer can be observed in the model shown in Figure 25. The entire excavation area of the pit was divided into east and west regions, with the east region being excavated first, followed by the west region. In the east region, a 5 m excavation was conducted, and a slope with a gradient of 1:1.25 was formed at the junction between the east and west regions. In the east region, the soil between the southern retaining wall and the pile foundation was preserved during excavation, and the slope and reserved soil displacement can be seen in Figure 28.

5.2. Definition of Numerical Simulation Construction Stage

According to the actual construction sequence and excavation steps of the foundation pit, the finite element model is divided into the following 10 construction stages. Each stage aims to simulate the most critical locations under different working conditions, taking field-monitoring data into account. The study investigates the variation patterns of pile bending moment, horizontal displacement, steel support axial force, displacement of the southern cement soil wall, and deformation characteristics of the surrounding soil during different excavation stages.
(1) Stage 1: Initial stress equilibrium stage—Activate all soils, structures, and reset displacements to zero. (2) Stage 2: Construction of gravity retaining wall, continuous wall, and pile foundations—Reset displacements to zero. (3) Stage 3: Excavation of 5 m of eastern soil, with the eastern pile foundations reaching the bottom of the excavation. (4) Stage 4: Construction of steel support in the eastern area of the pit (below the bottom of the excavation after reaching the bottom with the eastern pile’s foundations). This support is independent and not connected to the western area. (5) Stage 5: Construction of the first steel support in the western area of the pit. (6) Stage 6: Excavation of upper-level western soil, with a depth of 3 m, requiring the retention of soil. (7) Stage 7: Excavation of lower-level western soil, with a depth of 2 m, requiring the retention of soil. (8) Stage 8: Construction of the second steel support in the western area (including inclined braces on the southern side). The second steel support is at the same elevation as the eastern steel support. (9) Stage 9: Removal of the first steel support in the western area, trimming the pile foundations to the bottom, and excavation of the retained soil. (10) Stage 10: Construction of the basement floor in the eastern and western areas of the pit, applying a simulated vertical load of 6000 KN on the pile foundations to simulate deformations under the vertical load from the upper structure.

5.3. Analysis of Numerical Simulation Results

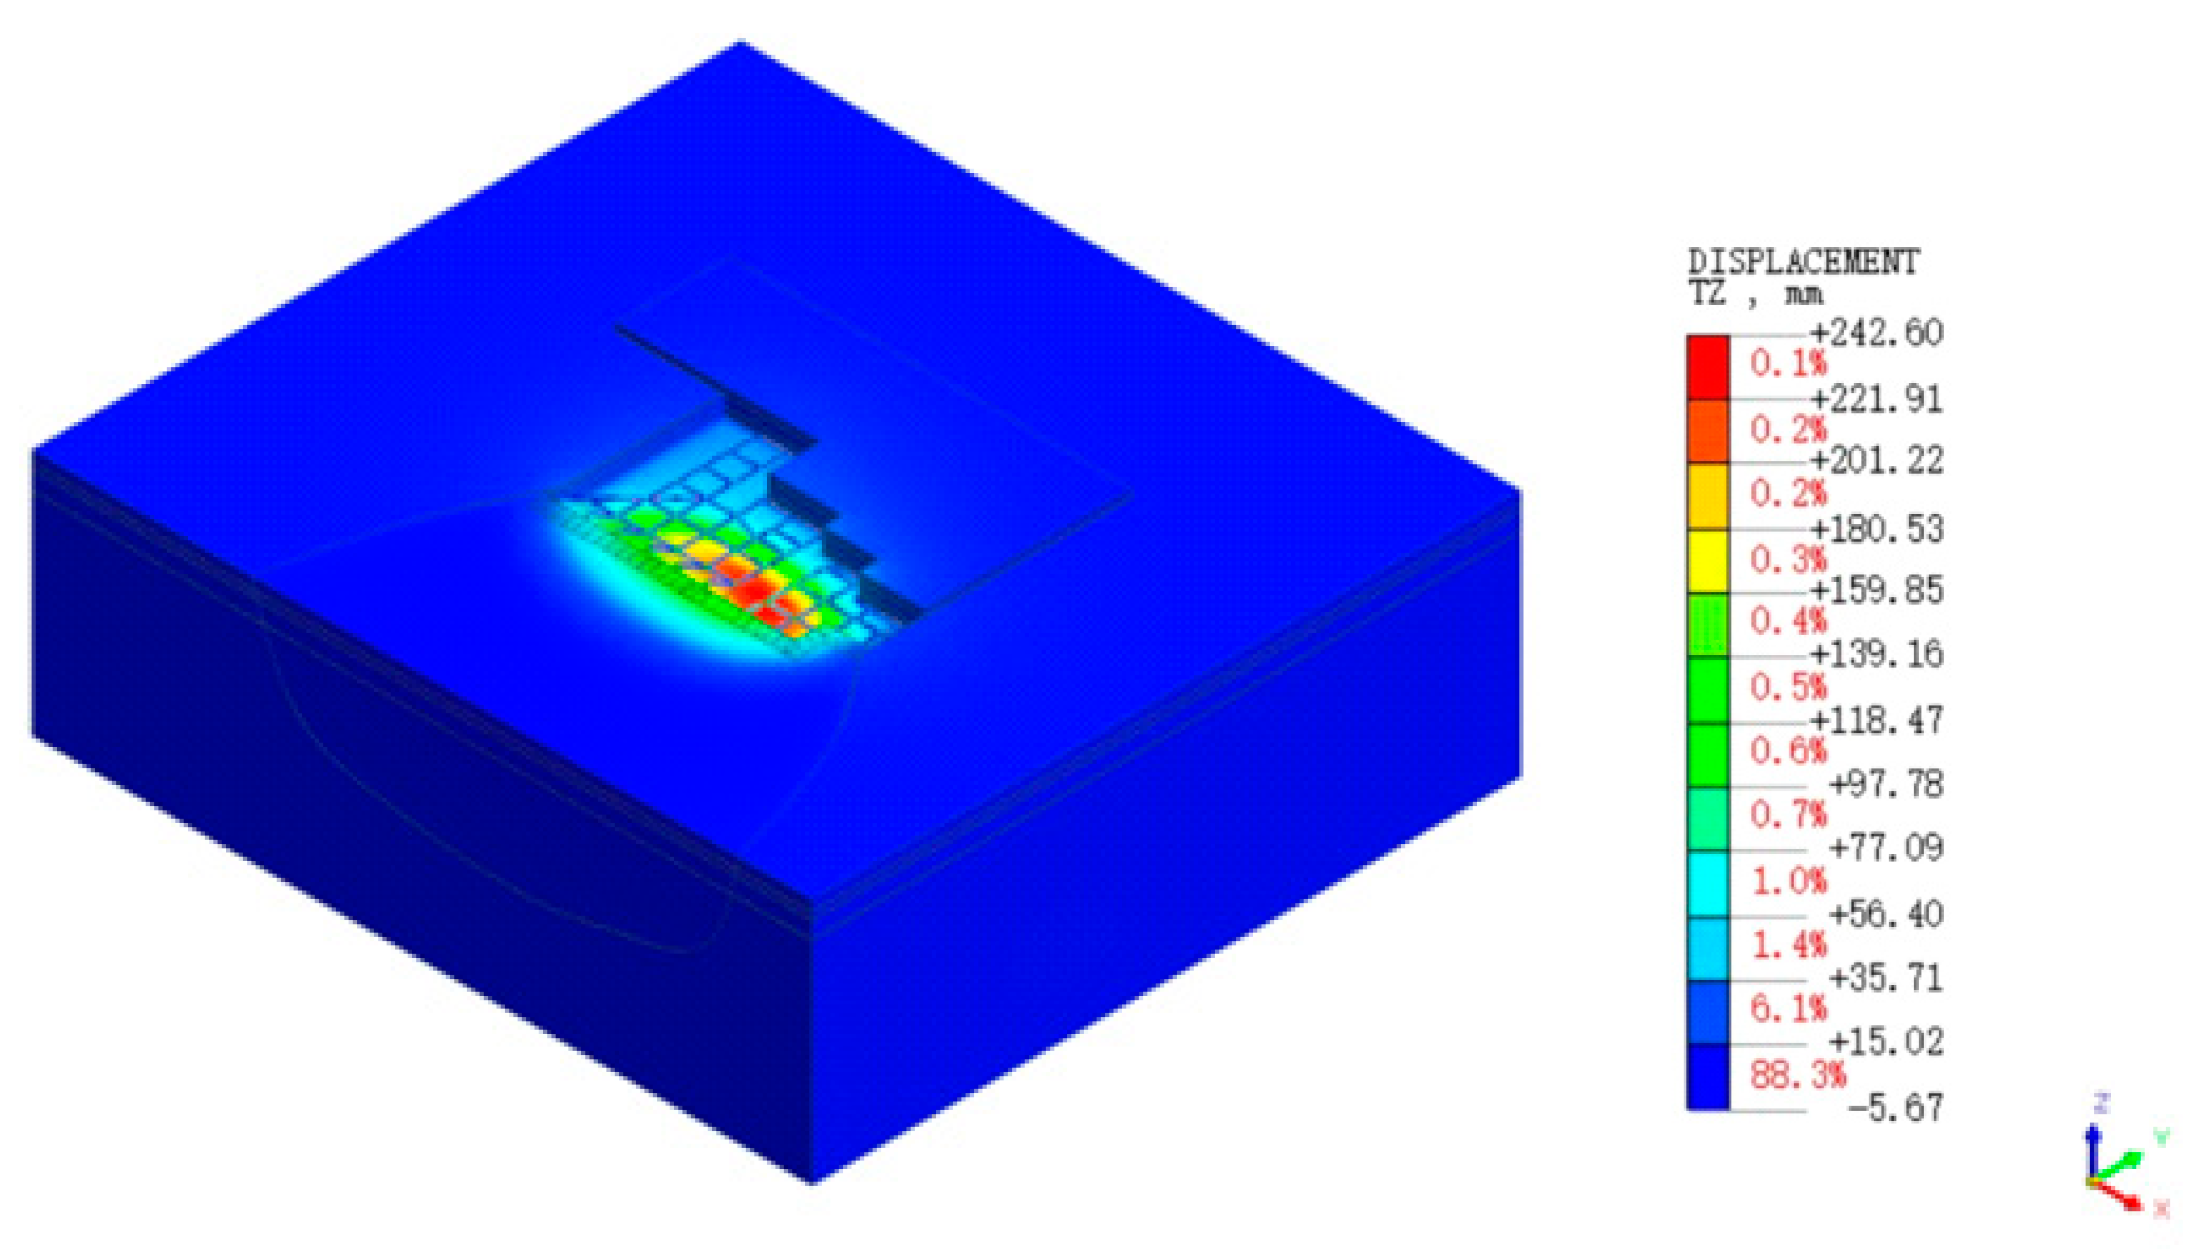
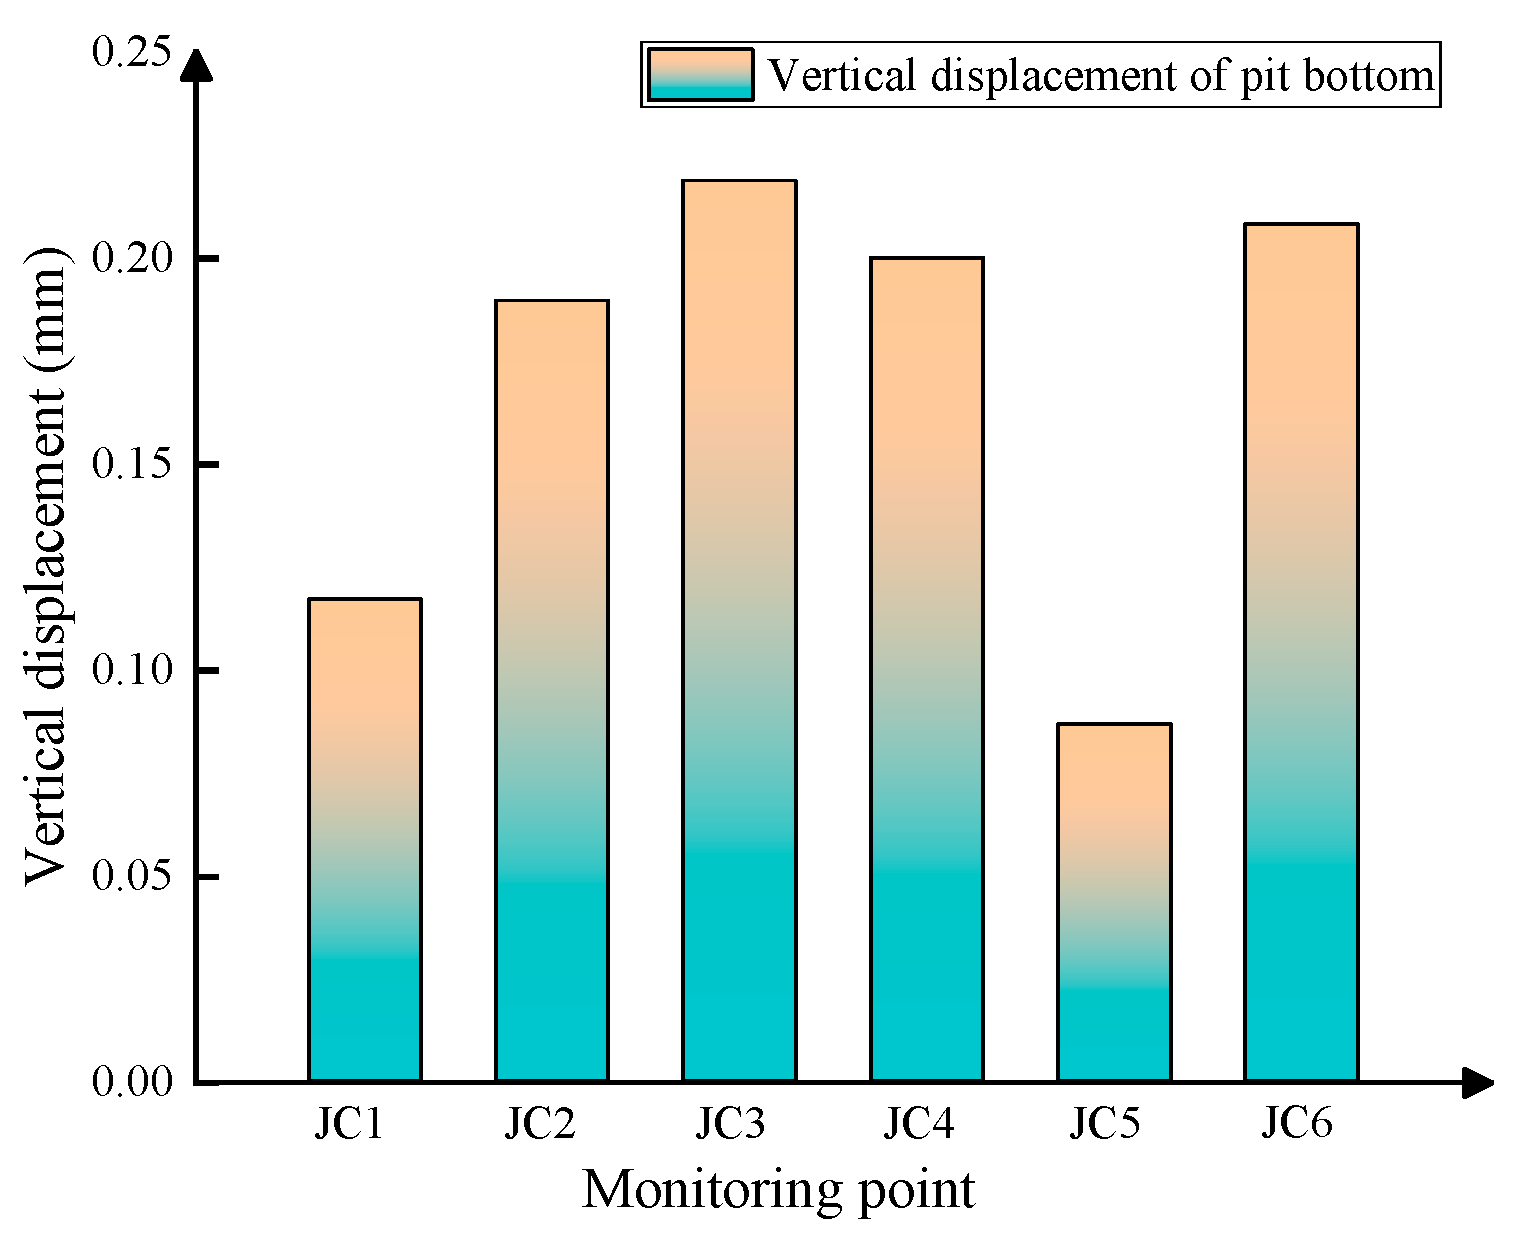
5.3.1. Vertical Displacement Analysis of Soil at the Bottom of Foundation Pit

Figure 30 shows the nephogram of vertical displacement in the ninth stage, and Figure 31 shows the position of monitoring points at the bottom of the foundation pit.
From Figure 30, it can be observed that there is significant heave at the bottom of the excavation during Stage 9. Therefore, selected monitoring points are analyzed to assess the heave at the bottom of the excavation. The locations of the monitoring points can be found in Figure 31. Figure 32 presents the vertical displacements of the soil at the bottom of the excavation at these monitoring points. It can be observed from Figure 32 that monitoring points JC3 and JC6 exhibit larger vertical displacements, while JC1 and JC5 have smaller vertical displacements. Considering the positions of the monitoring points shown in Figure 32, it can be concluded that in the east–west direction, the soil at the bottom of the excavation in the central area experiences larger vertical displacements, while in the north–south direction, the closer the excavation is to the south side, the larger the vertical displacements of the soil at the bottom of the excavation. This can be attributed to the specific distribution of soil layers in the excavation. The central and southern parts of the excavation are characterized by deep layers of soft soil. After the excavation of the soil, the bottom of the excavation experiences rebound, and under the influence of the self-weight stress of the overlying soil in the southern part, the deep soft soil moves toward the excavation, resulting in uneven heave at the bottom of the excavation.

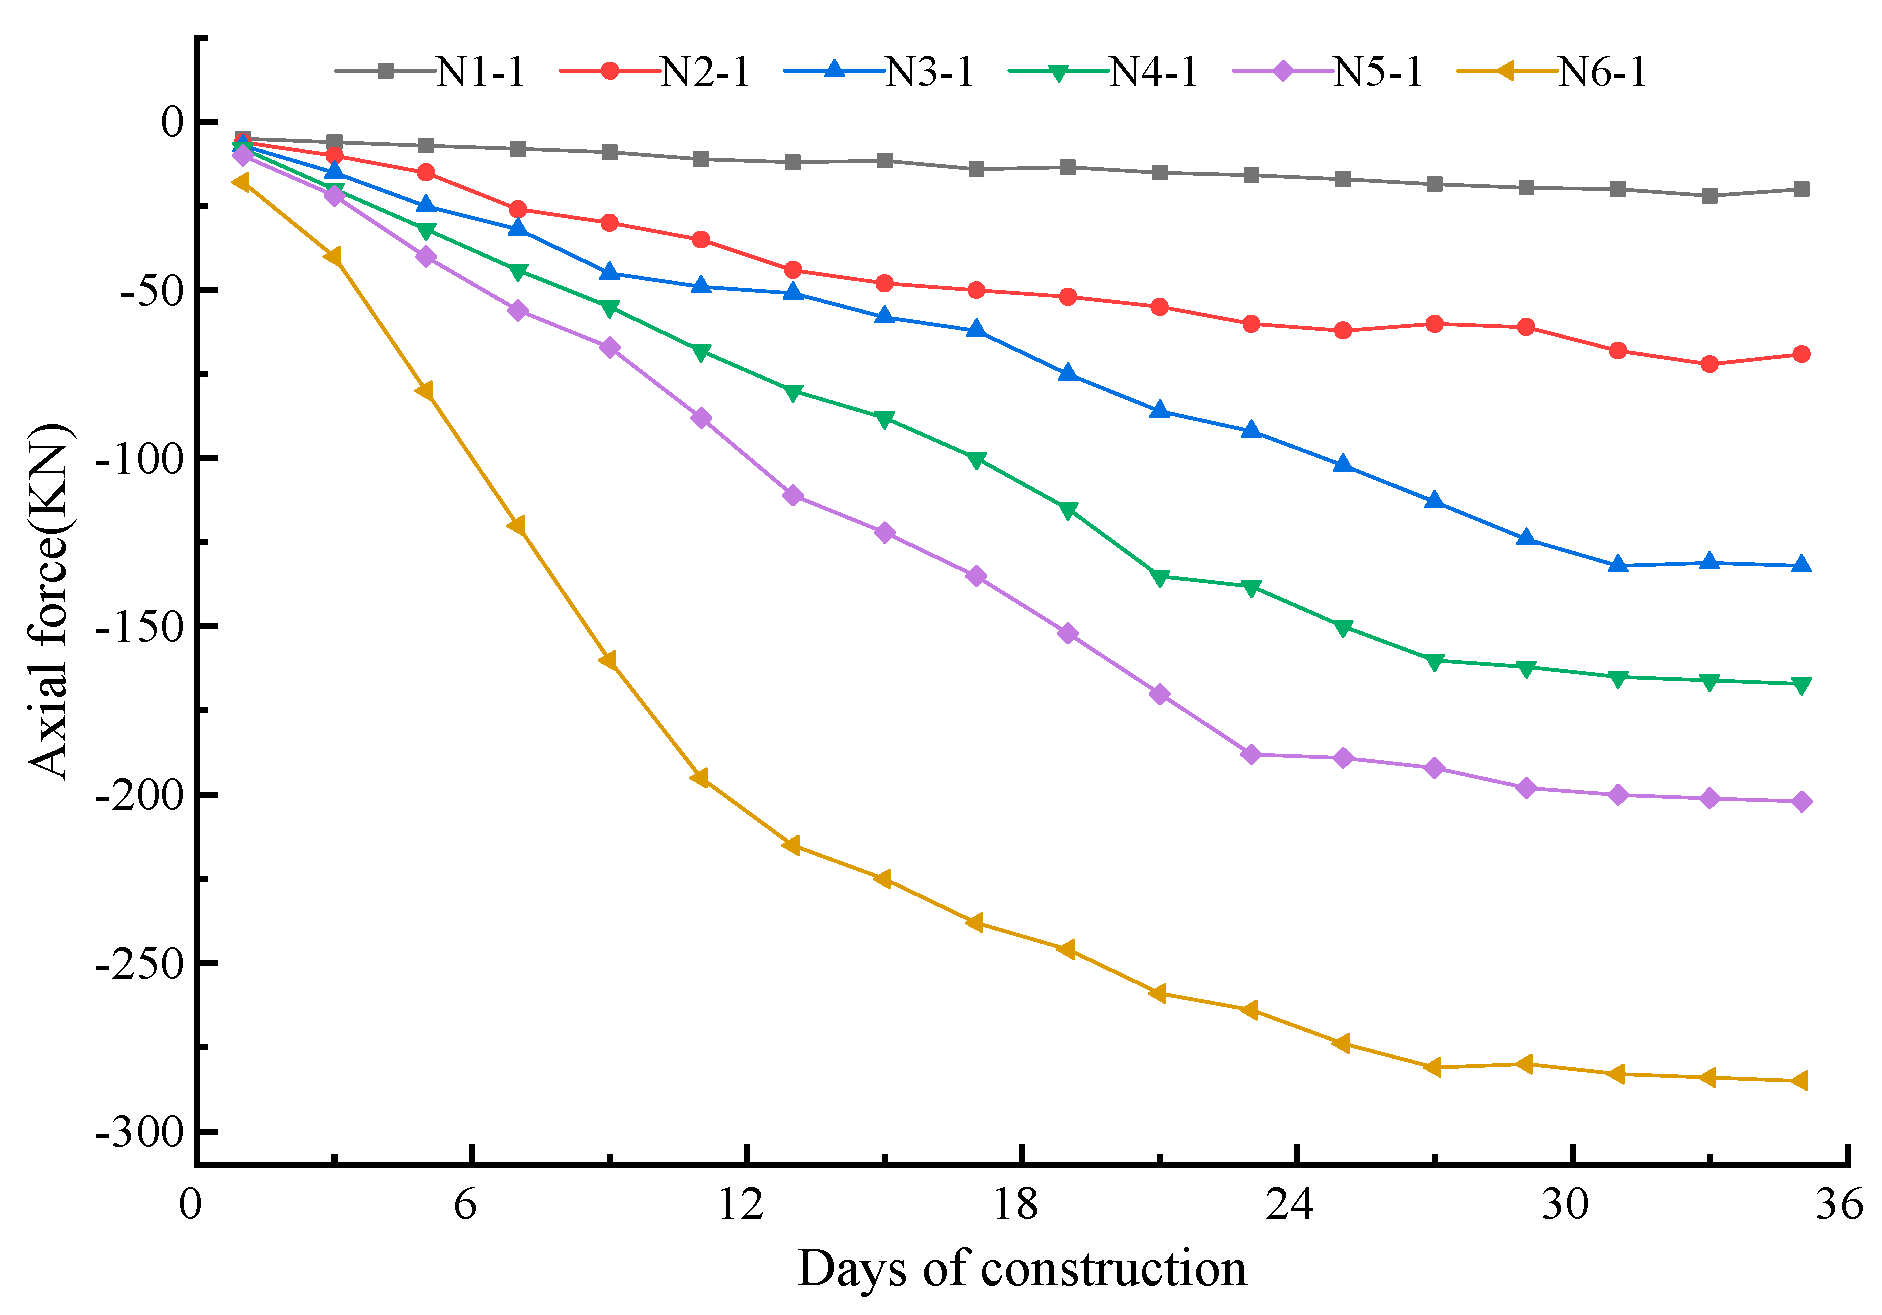
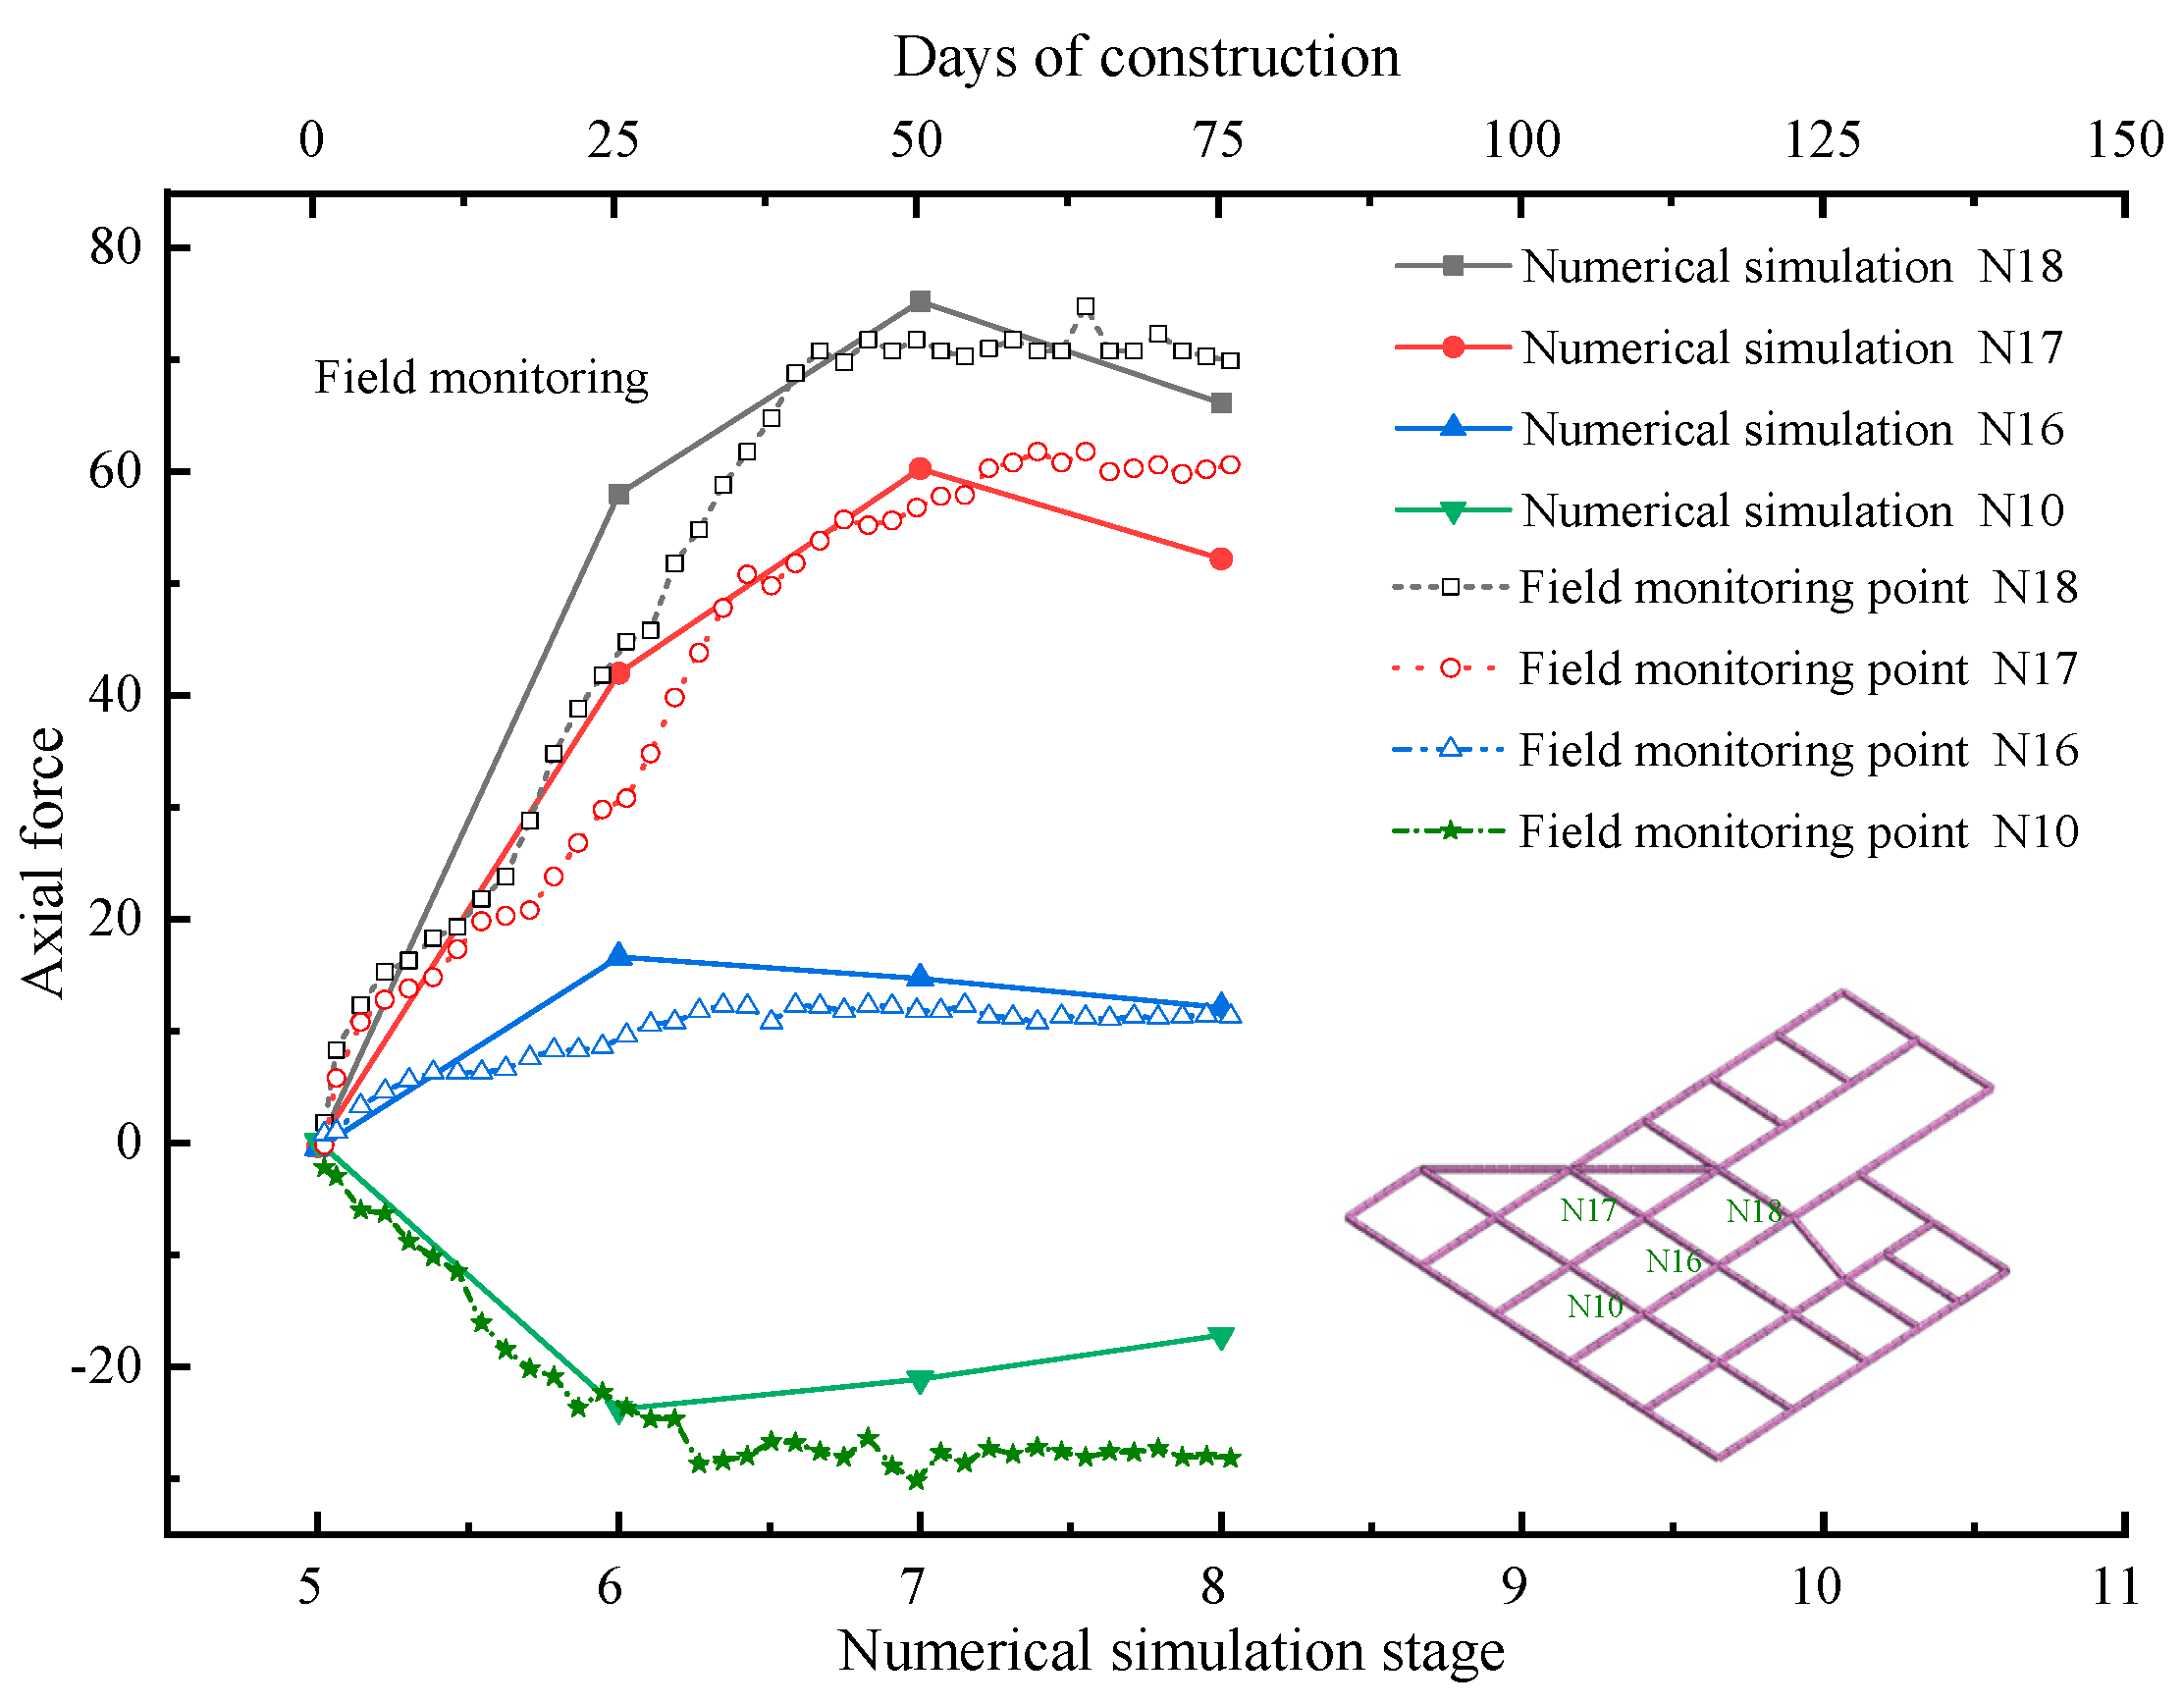
5.3.2. Comparative Analysis of Axial Force of Steel Support and Numerical Simulation

(1) Comparative analysis of the monitoring value and numerical simulation of the axial force of steel support in the east area of the foundation pit.
From Figure 33, it can be observed that the numerical simulation results align well with the measured data at monitoring points N76, N77, and N78, which are located at the steel support in the eastern region of the excavation. This confirms the reliability of the monitoring data and the reasonableness of the numerical simulation results. Additionally, the accuracy of the numerical simulation results meets the engineering requirements. It is important to note that the available field-monitoring data only cover a period of 110 days, from the construction of the steel support in the eastern region to the construction of the basement floor. Based on the numerical simulation results, it is evident that significant changes occur in the axial forces of the steel support after the construction of the basement floor, and these changes occur in different directions.
(2) Comparative analysis of axial-force-monitoring value and numerical simulation of the first steel support on the west side of the foundation pit. The comparison between the monitored axial force of the steel support and numerical simulation results is shown in Figure 34.
From Figure 34, the field-monitoring data for the upper steel support in the western region of the excavation cover a period of 75 days, corresponding to stages 5–8 of the numerical simulation. By comparing the measured data from four monitoring locations, namely N18, N17, N16, and N10, with the simulated values, it is observed that the numerical simulation results closely match the field measurements. This indicates that numerical simulation can be effectively combined with field monitoring to analyze and study complex excavation projects, providing a basis for design decisions. Additionally, it can serve as a supplement to data in cases where on-site monitoring is not conducted.
(3) Numerical simulation of axial force of lower-layer steel support on the west side of foundation pit.
In the entire excavation area, the steel supports at the bottom of the excavation are not removed. After the construction of the basement floor at the bottom of the excavation, there are no measured axial force data for the steel supports. Figure 35 shows the simulated axial force values of the steel supports under vertical loads from the upper main structural elements after the construction of the basement floor. From Figure 35, it can be observed that M9 experiences axial tension with a magnitude of 1700 kN, M9 experiences axial compression with a magnitude of 1400 kN, M4 experiences the smallest axial compression with a value of 210 kN, and M11 experiences the smallest axial tension with a value of 400 kN.

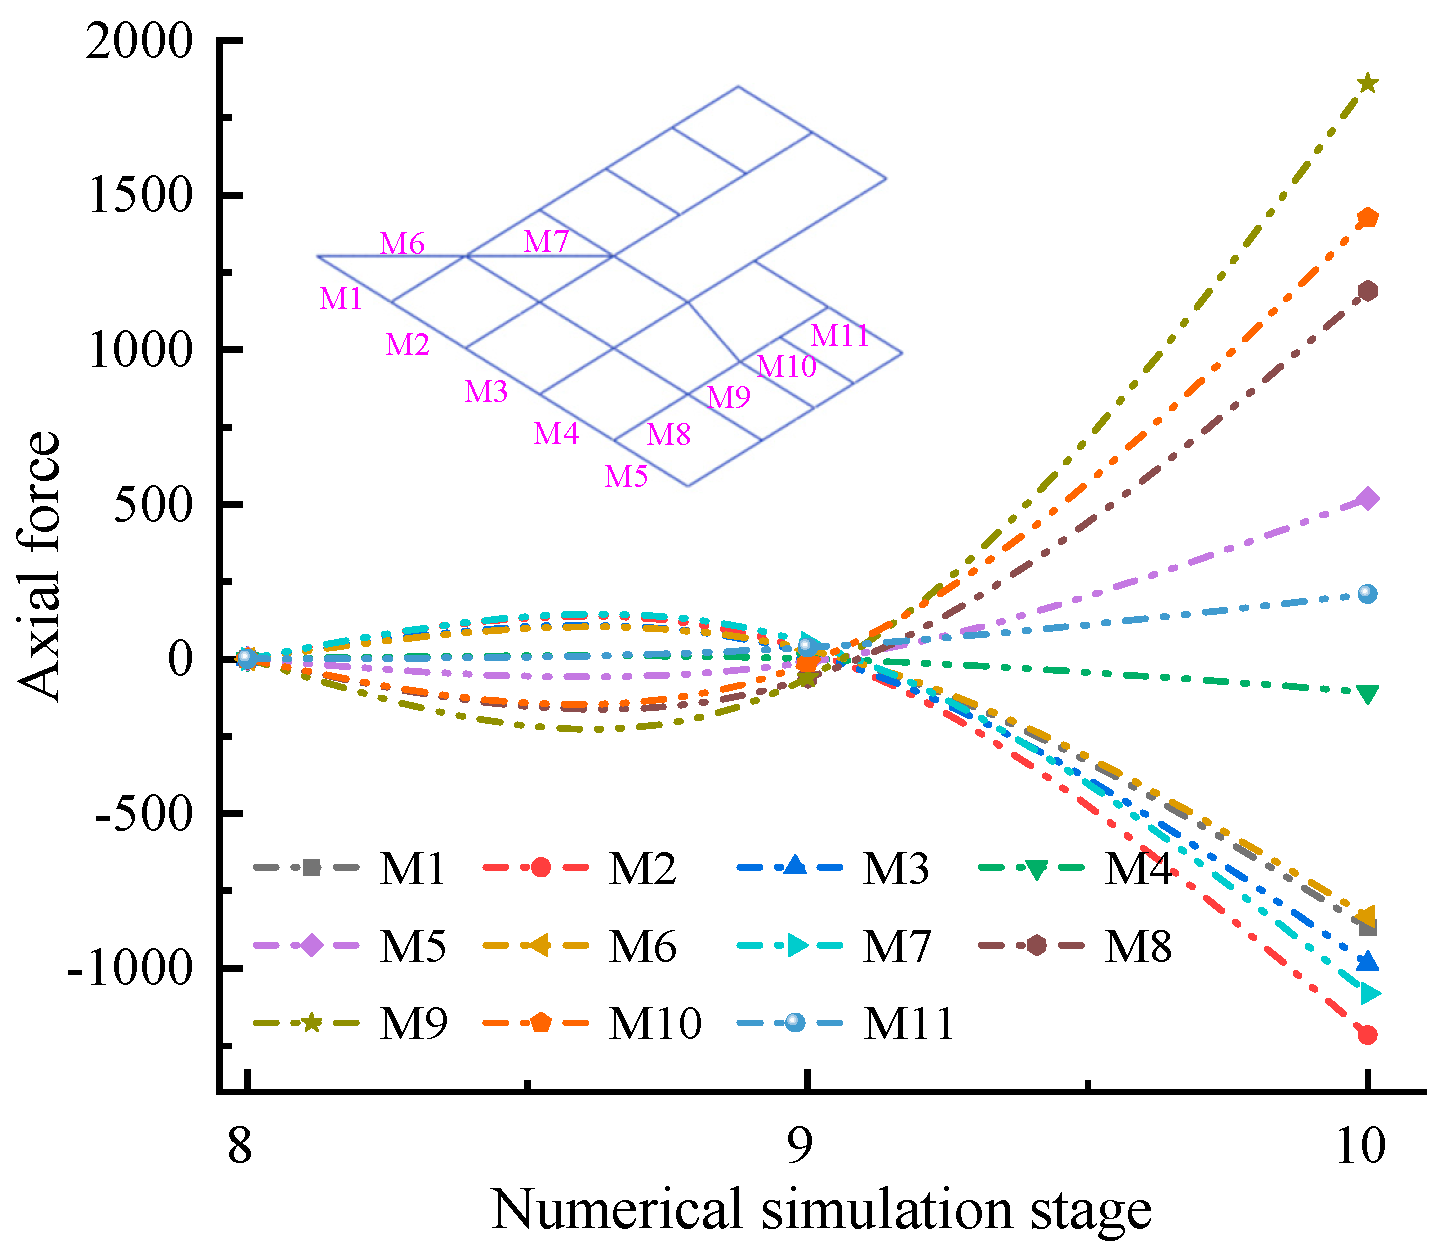
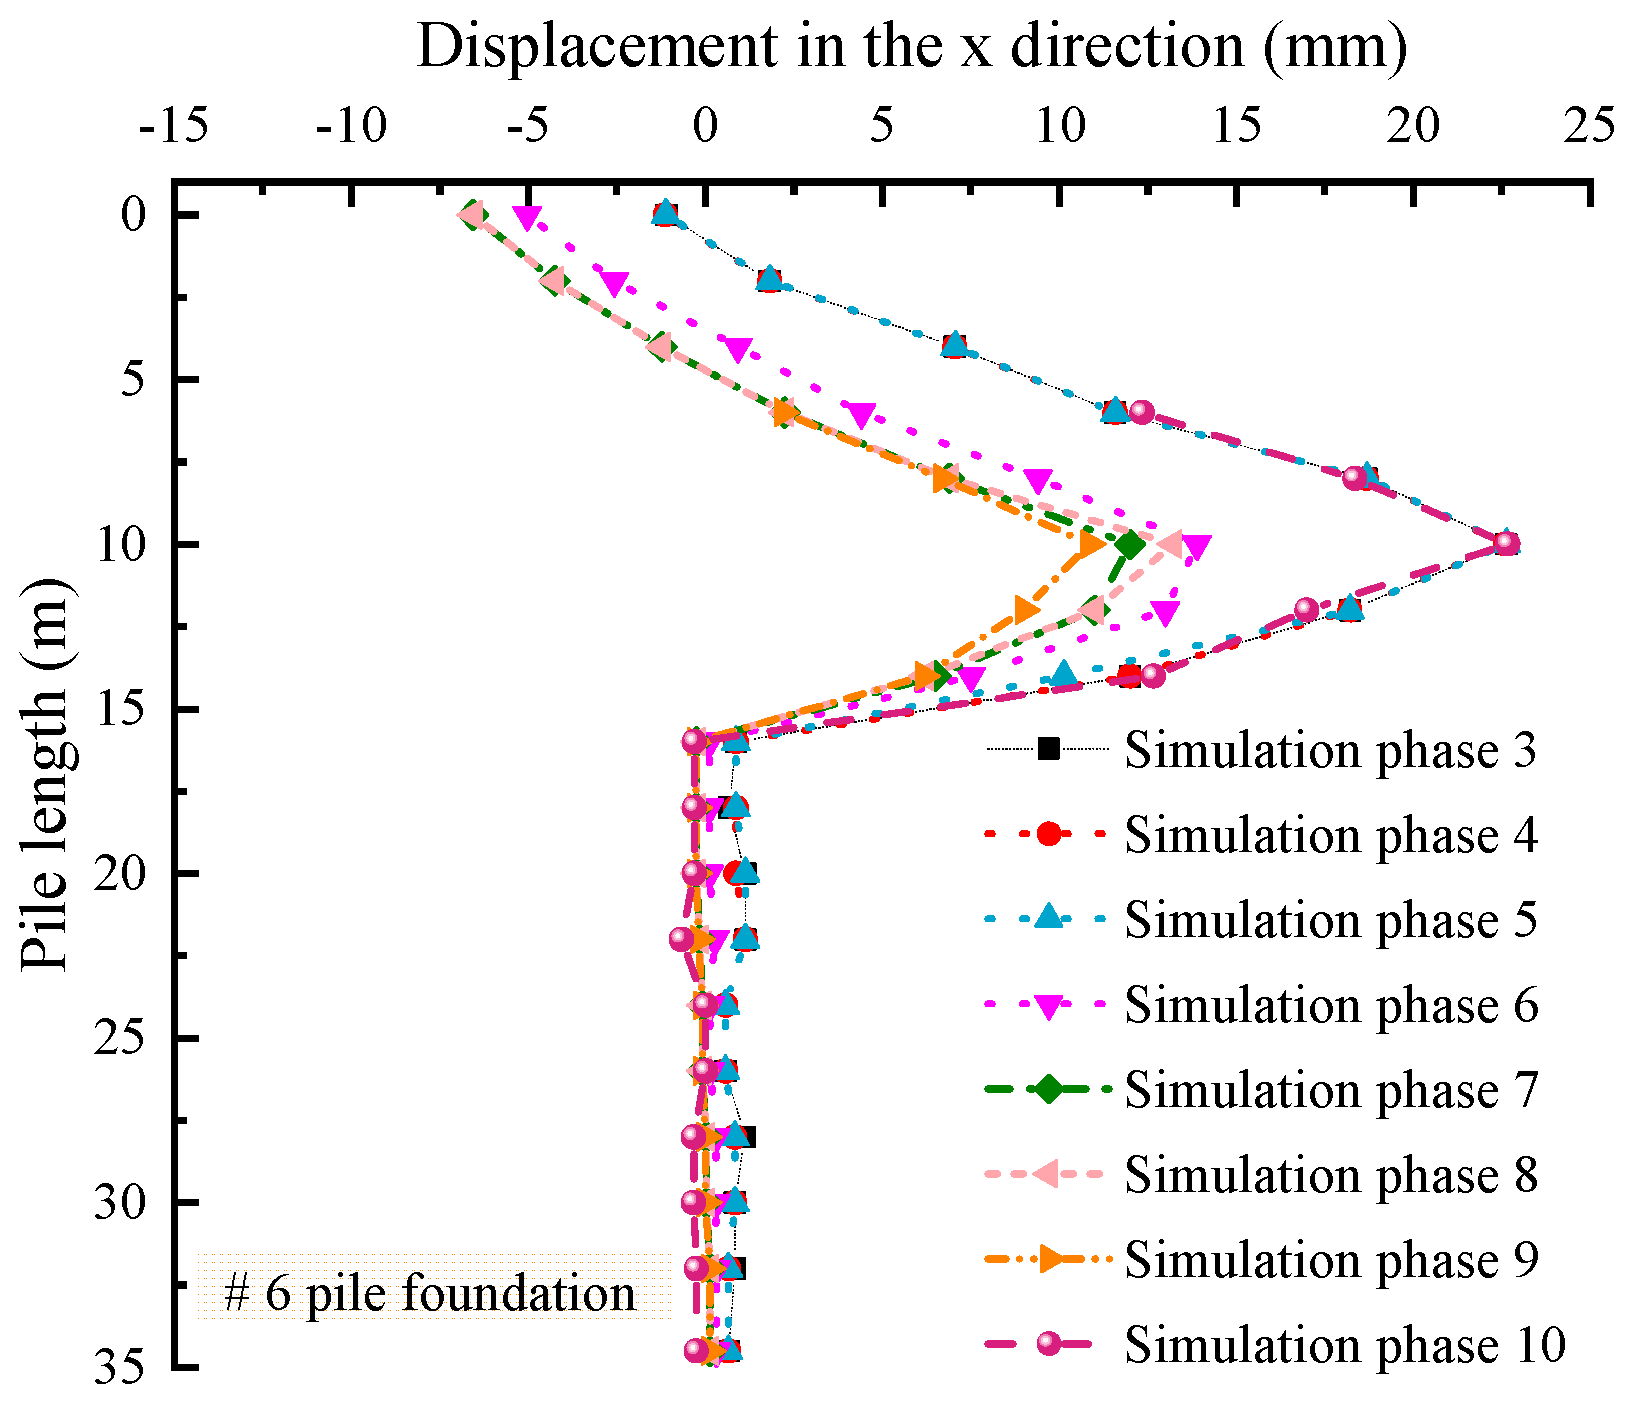
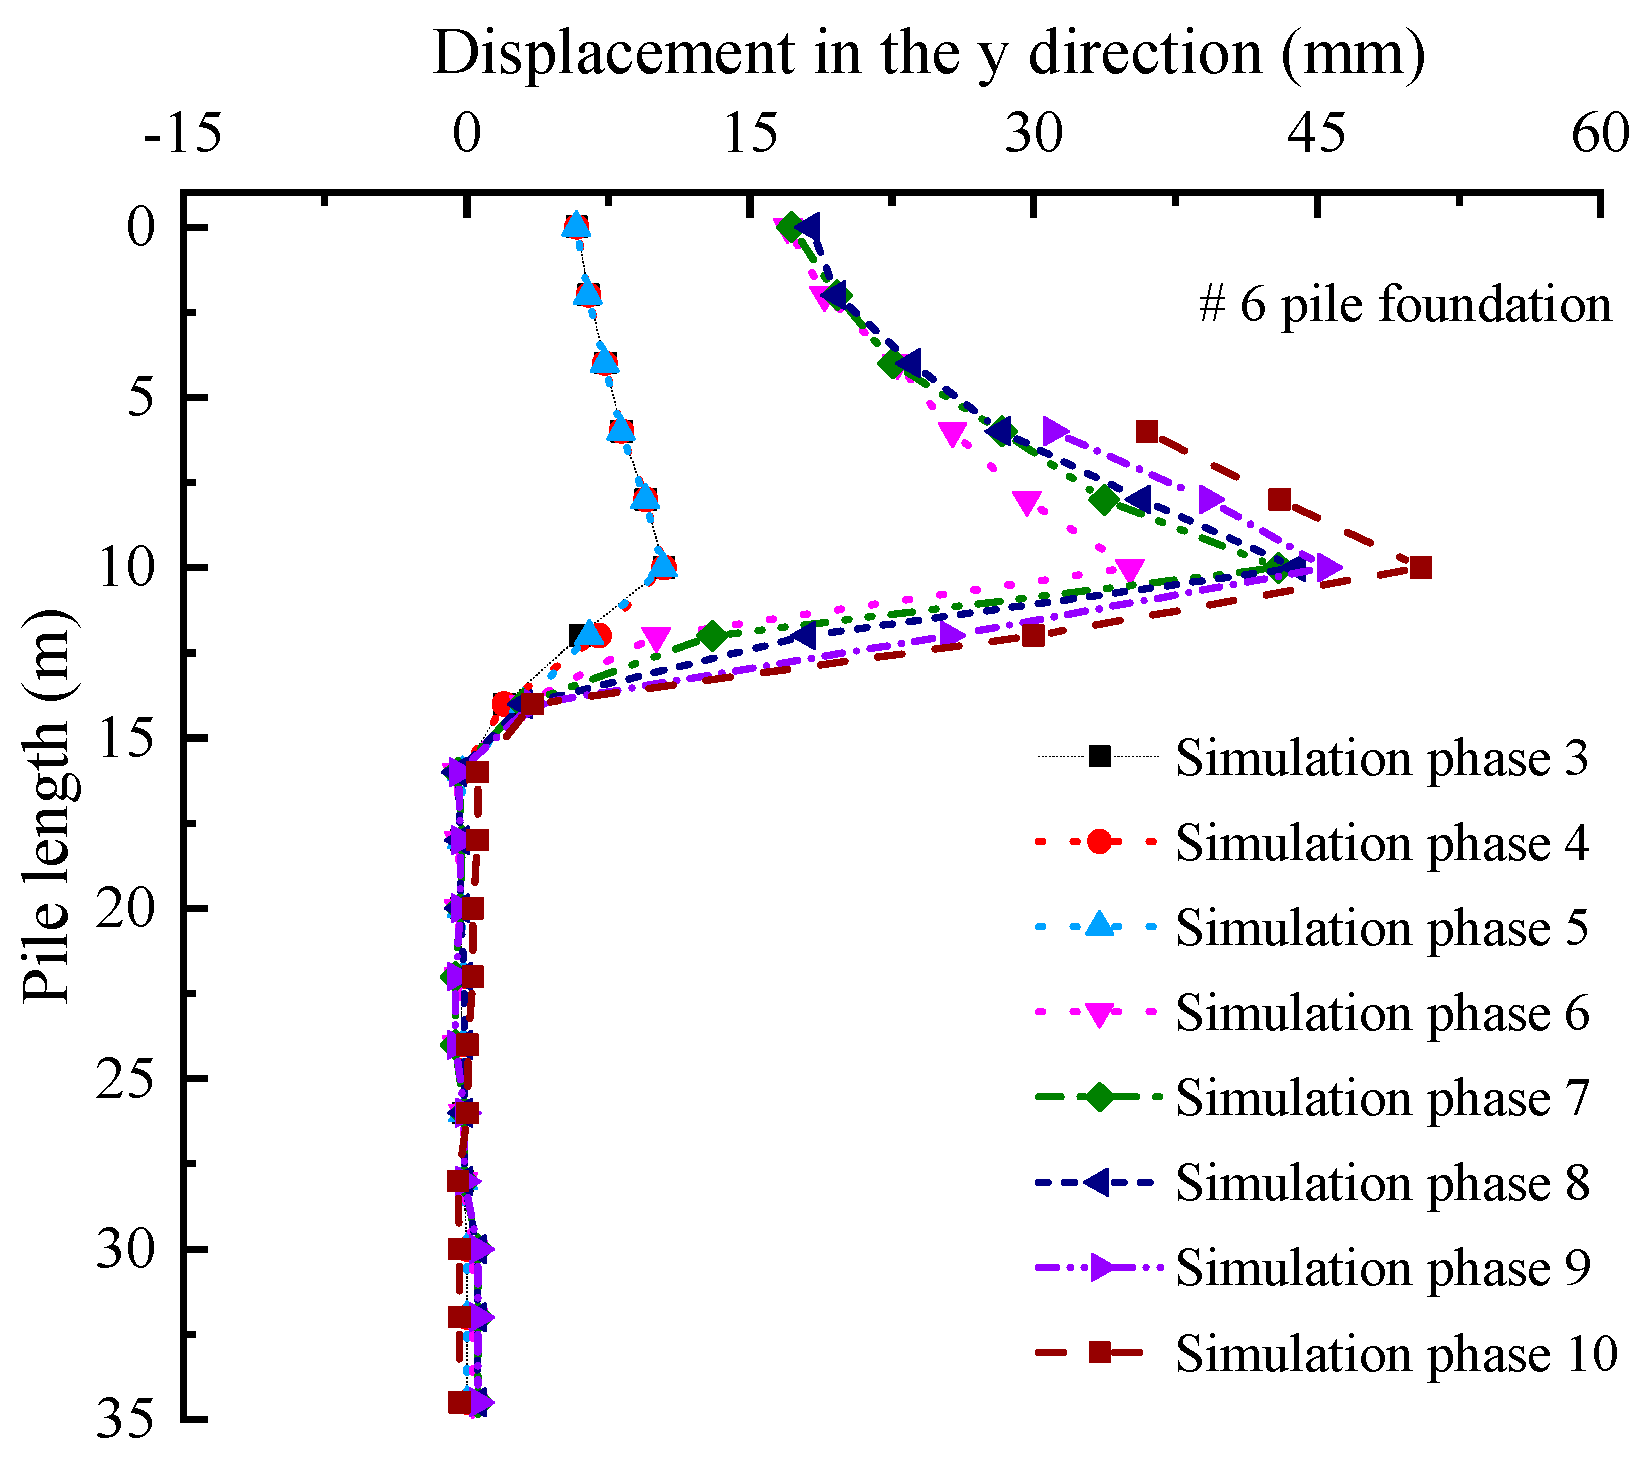
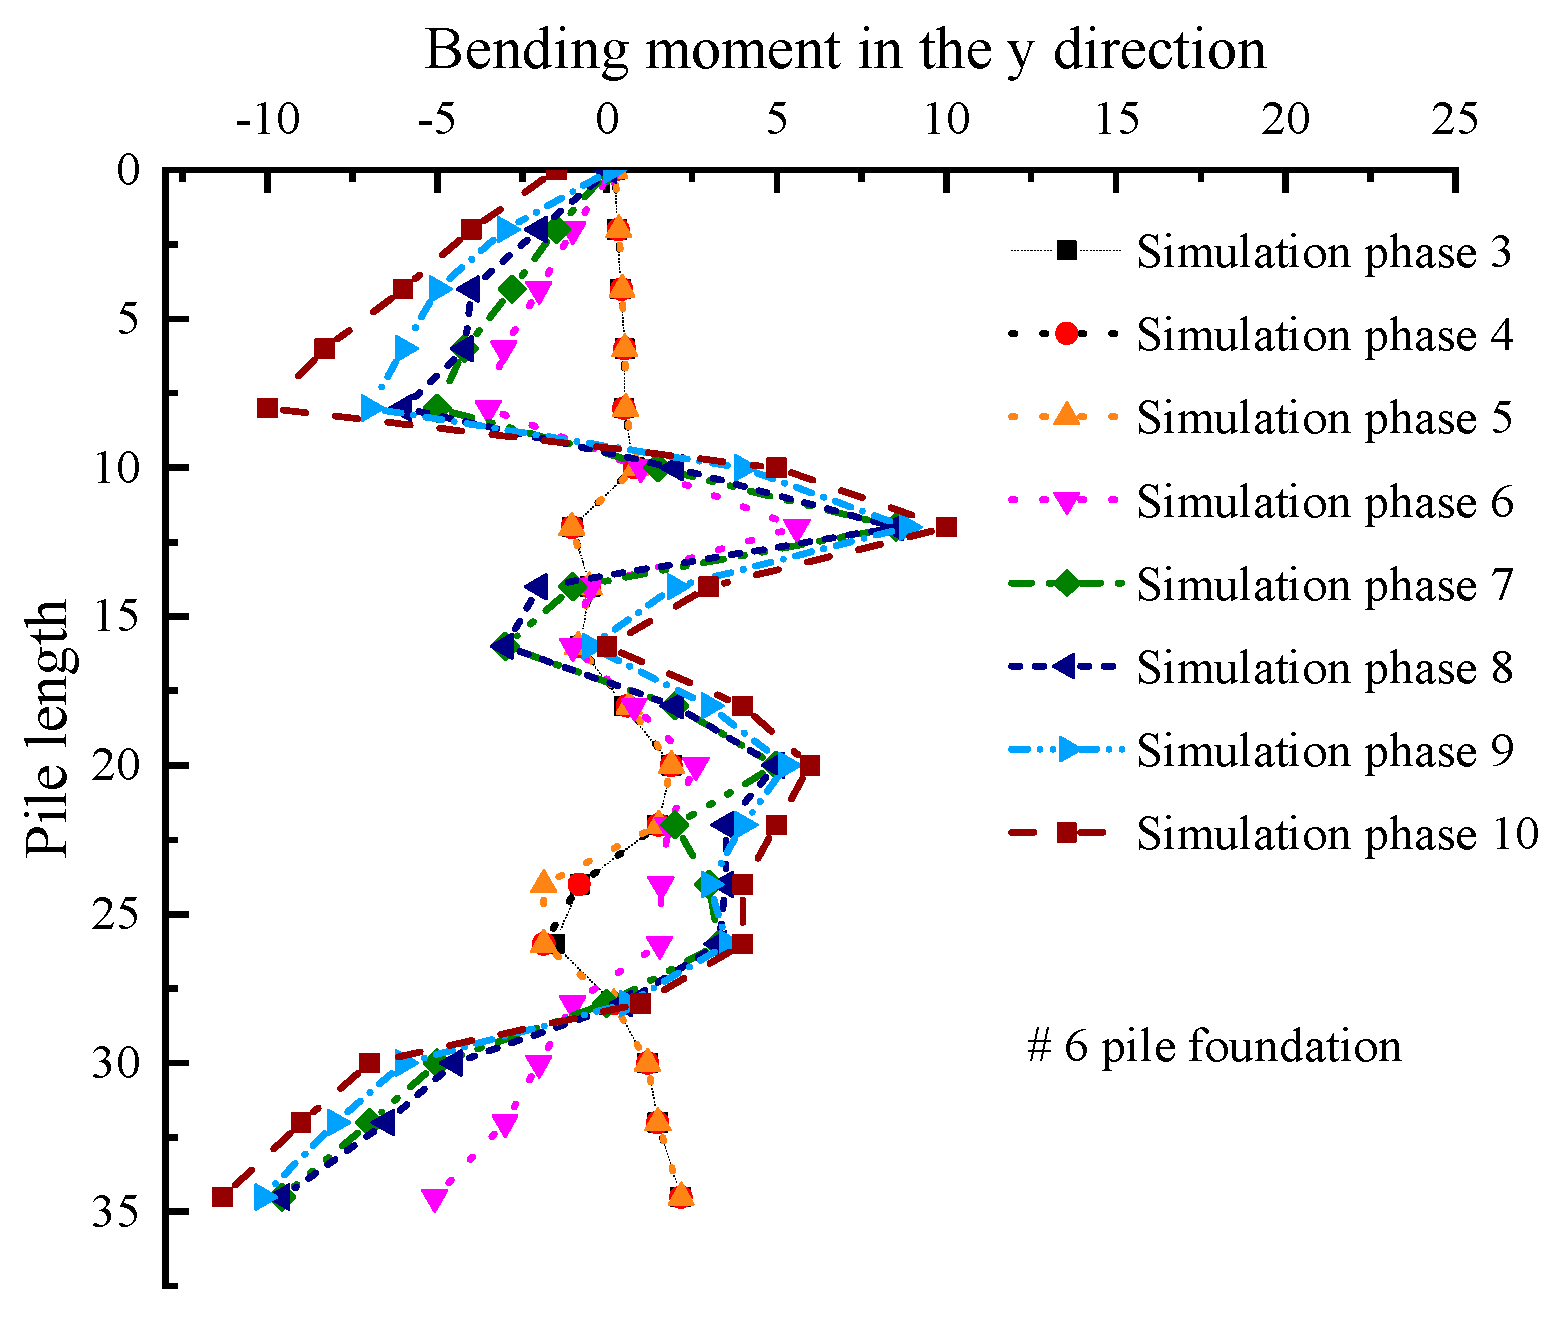
5.3.3. Analysis of Displacement and Bending Moment of Pile Foundation

Figure 36 shows the relationship curve between the displacement of the #6 pile in the middle of the first row of piles on the south side of the excavation and the X-direction. Figure 37 depicts the relationship curve between the displacement of the #6 pile and the Y-direction. Lastly, Figure 38 illustrates the relationship curve between the #6 pile and the bending moment in the Y-direction. Please refer to Figure 9 for the specific location of the #6 pile in the pile foundation.
From Figure 36 and Figure 37, it can be observed that before the pile top is cut off at 5 m, the #6 pile exhibits maximum horizontal displacement in both the X- and Y-directions at a depth of 10 m below the pile top. Below 15 m, the deep horizontal displacements in the X- and Y-directions of the pile foundation are close to zero. After the pile is cut off in the ninth stage, the pile top displacements are 12 mm in the X-direction and 35 mm in the Y-direction. At a depth of 5 m below the bottom of the excavation, the horizontal displacements of the pile foundation in the X- and Y-directions reach their maximum values, with 26 mm displacement in the X-direction and 52 mm displacement in the Y-direction.
From Figure 38, it can be observed that the pile bending moment varies at different construction stages. In stages 3–5, the pile bending moment is relatively small, while in stages 6–10, the bending moment increases. The maximum bending moment occurs at 8 m and at the pile tip, with a magnitude of 10 kN·m. During the construction of the basement slab, the steel support is cast in place together with the pile top, resulting in a non-zero bending moment at the top of the pile.
After integrating the principles of performance-based risk assessment, the authors conclude that both the deformation of the excavation support structure and the deformation of the foundation piles within the pit remain within the specified performance limits. This indicates the rationality of the engineering design and construction plan, confirming the feasibility of measures taken to control pit deformation.
Key performance indicators that were closely monitored include the displacement in the Y-direction of the gravity retaining wall, the horizontal displacement of foundation piles within the pit, and the axial forces in the steel supports. The monitoring results demonstrate that the maximum displacement in the Y-direction for the gravity retaining wall is 100 mm. Additionally, for the foundation piles within the pit, the maximum horizontal displacements are 30 mm and 70 mm in the X- and Y-directions, respectively, for the eastern area, and 49 mm and 25 mm for the X- and Y-directions, respectively, for the western area. The maximum settlement in the southern park area of the pit is 117 mm. The axial force in the steel supports on the eastern side of the pit is 300 KN, while the upper-layer steel supports on the western side have a maximum axial force of 70 KN and the lower-layer steel supports have a maximum axial force of 280 KN. Notably, the maximum values of the key monitoring parameters do not exceed the performance indicators established based on the principles of performance-based assessment.
In this study, we have successfully integrated the concept of performance-based safety assessment into the monitoring and numerical simulation of excavation projects, providing a more comprehensive and scientifically grounded assurance for the engineering’s safety and stability. The objective of this paper is to ensure a thorough monitoring, accurate assessment, and effective control of multiple critical aspects of the engineering project, including the performance of the south-side gravity retaining wall, the settlement of the south-side park within the excavation, the settlement of the road on the east side, the deformation of the foundation piles within the excavation, and the axial forces in the steel supports. By combining on-site monitoring data, numerical simulation results, and performance-based safety assessment, our intention is to provide a more reliable foundation for engineering decision-making and risk management. The incorporation of performance targets and indicators enables us to measure the engineering’s safety and stability with greater precision. Building on the foundation of monitoring and numerical simulation, we integrate real-world data with performance standards, providing a more comprehensive and accurate understanding of the actual conditions of the engineering. By comprehensively considering measured data, numerical simulation, and performance requirements, we can better comprehend the engineering’s actual performance and potential risks. Supported by real-time monitoring technology and numerical simulation methods, the performance-based safety assessment approach offers us a more precise and comprehensive means of engineering analysis.

6. Conclusions

The performance-based safety-assessment method offers new perspectives and approaches to our research, ensuring a more reliable guarantee for the safety and stability of excavation engineering projects. In future engineering practices, we will continue to promote the application of this method, continually refining our methodologies and processes and making further contributions to safety management and risk control in the field of engineering.
(1) Layered and zonal excavation can effectively reduce the impact of internal stress release in the soil due to the excavation of surrounding structures and the minimization of the spatial disturbance. This method is an effective approach to mitigate the effects on the surrounding environment during excavation in complex geological conditions and complex excavation projects. When there are differences in elevation or varying construction sequences at the boundaries between different regions, slope construction needs to be implemented in different excavation areas within the excavation pit.
(2) Controlling the tilting and displacement of pile foundations is a challenging aspect of this excavation project. This paper proposes the solution of applying steel bracing between pile foundations in different layers. The study reveals that the steel bracing experiences both compression and tension and that the axial forces vary with the depth of excavation. By introducing steel bracing between the engineering piles, the pile’s foundations are interconnected, forming a spatial skeletal structure. This approach effectively reduces the horizontal displacement of the pile foundations and resolves the issue of pile tilting caused by lateral forces during excavation due to the flow of silt. The proposed solution in this paper can serve as a reference for similar excavation projects.
(3) In cases where the bearing capacity requirements or construction conditions of the soil at the bottom of the excavation pit are not met, it is possible to reinforce the soil at the bottom of the pit before excavation. In this paper, prior to pile construction and soil excavation, deep mixing piles are constructed in the silt layer below 5 m from the bottom of the pit to strengthen the pit soil. Practice and research have shown that using deep mixing piles to reinforce the silt at the bottom of the excavation pit can effectively reduce the deep horizontal displacement of pile foundations. Additionally, it improves the bearing capacity of the soil at the bottom of the pit and reduces the seepage of water in the silt, creating favorable and dry construction conditions.
(4) Field monitoring provides real-time and dynamic responses to the surrounding environment during excavation, while finite element analysis is an effective method for analyzing and evaluating construction plans and sequences. The data obtained from finite element simulations serve as a valuable supplement to data that cannot be monitored or are difficult to monitor in the field. The combination of numerical simulation and field monitoring is an effective approach for analyzing and studying complex excavation projects. By utilizing both field monitoring and finite element simulation, comprehensive information can be obtained, leading to optimized pit design and support solutions, thereby improving the safety and reliability of the project. This integrated analysis approach provides scientific guidance and practical insights for the planning and construction of complex excavation projects.
(5) This study adopted an integrated research methodology involving field monitoring and numerical simulation to analyze the deformation behavior of pile foundations and support structures within a complex geological and environmental context during the excavation of deep pits in locations characterized by substantial and thick silt layers. The study explored the deformation patterns of pile foundations and support structures within the excavated pit, proposed effective strategies for managing pile-foundation deformation, and validated the soundness and practicality of these methods through empirical validation. Nevertheless, with the anticipated rise in environmental complexity, exclusive dependence on numerical simulation and monitoring approaches remains inherently restrictive. The development of theoretically robust analytical methods would enable comprehensive analyses and calculations for excavations in analogous site pits if realized. The fusion of these theoretical analytical methods with numerical simulation tools can furnish robust safety assurances and elevate the overall quality of pit-construction endeavors. Thus, the establishment of a robust theoretical analysis method becomes imperative. Going forward, a theoretical analysis approach could be adopted to investigate how pit excavation affects the internal pile foundation of the excavation site. This entails examining forces and deformations and formulating a comprehensive and pragmatic methodology for analyzing and mitigating pile foundation deformations.

Author Contributions

D.W.: Conceptualization, Methodology, Software, Validation, Formal analysis, Writing—review and editing. S.Y.: Conceptualization, Methodology, Supervision, Writing—review and editing, Funding acquisition, Project administration. L.X.: Methodology, Validation, Data curation, Writing—review and editing, Software. All authors have read and agreed to the published version of the manuscript.

Funding

This research was funded by National Natural Science Foundation of China (No. 52168050).

Data Availability Statement

Due to legal issues and trade secrets, the monitoring data in this article cannot be provided free of charge. Nevertheless, all concepts and data are explained in the submitted studies, and some studies are available upon request.

Acknowledgments

The authors gratefully acknowledge the financial support provided by National Natural Science Foundation of China (No. 52168050).

Conflicts of Interest

The authors declare that they have no known competing financial interests or personal relationships that could have appeared to influence the work reported in this paper.

References

  1. Whittle, A.J.; Hashash, Y.M.A.; Whitman, R.V. Analysis of Deep Excavation in Boston. J. Geotech. Eng. 1993, 119, 69–90. [Google Scholar] [CrossRef]
  2. Schäfer, R.; Triantafyllidis, T. Modelling of Earth and Water Pressure Development during Diaphragm Wall Construction in Soft Clay: Pore pressure development during wall construction. Int. J. Numer. Anal. Methods Geomech. 2004, 28, 1305–1326. [Google Scholar] [CrossRef]
  3. Likitlersuang, S.; Surarak, C.; Wanatowski, D.; Oh, E.; Balasubramaniam, A. Finite Element Analysis of a Deep Excavation: A Case Study from the Bangkok MRT. Soils Found. 2013, 53, 756–773. [Google Scholar] [CrossRef]
  4. Li, D.; Li, Z.; Tang, D. Three-Dimensional Effects on Deformation of Deep Excavations. Proc. Inst. Civ. Eng. Geotech. Eng. 2015, 168, 551–562. [Google Scholar] [CrossRef]
  5. Lee, F.-H.; Hong, S.-H.; Gu, Q.; Zhao, P. Application of Large Three-Dimensional Finite-Element Analyses to Practical Problems. Int. J. Geomech. 2011, 11, 529–539. [Google Scholar] [CrossRef]
  6. Chheng, C.; Likitlersuang, S. Underground Excavation Behaviour in Bangkok Using Three-Dimensional Finite Element Method. Comput. Geotech. 2018, 95, 68–81. [Google Scholar] [CrossRef]
  7. Tan, Y.; Wang, D. Characteristics of a Large-Scale Deep Foundation Pit Excavated by the Central-Island Technique in Shanghai Soft Clay. I: Bottom-Up Construction of the Central Cylindrical Shaft. J. Geotech. Geoenviron. Eng. 2013, 139, 1875–1893. [Google Scholar] [CrossRef]
  8. Li, Z. Displacement Monitoring during the Excavation and Support of Deep Foundation Pit in Complex Environment. Adv. Civ. Eng. 2021, 2021, 5715306. [Google Scholar] [CrossRef]
  9. Liu, J.; Shi, C.; Cao, C.; Lei, M.; Wang, Z. Improved Analytical Method for Pile Response Due to Foundation Pit Excavation. Comput. Geotech. 2020, 123, 103609. [Google Scholar] [CrossRef]
  10. Zhang, W.; Goh, A.T.C.; Xuan, F. A Simple Prediction Model for Wall Deflection Caused by Braced Excavation in Clays. Comput. Geotech. 2015, 63, 67–72. [Google Scholar] [CrossRef]
  11. Arai, Y.; Kusakabe, O.; Murata, O.; Konishi, S. A Numerical Study on Ground Displacement and Stress during and after the Installation of Deep Circular Diaphragm Walls and Soil Excavation. Comput. Geotech. 2008, 35, 791–807. [Google Scholar] [CrossRef]
  12. Zdravkovic, L.; Potts, D.M.; St John, H.D. Modelling of a 3D Excavation in Finite Element Analysis. Géotechnique 2005, 55, 497–513. [Google Scholar] [CrossRef]
  13. Finno, R.J.; Harahap, I.S. Finite Element Analyses of HDR-4 Excavation. J. Geotech. Eng. 1991, 117, 1590–1609. [Google Scholar] [CrossRef]
  14. Song, G.; Xu, J.; Marshall, A.M. Numerical Study on the Effect of Protective Wall Depth in Reducing Structure Deformations Caused by Tunnelling. Comput. Geotech. 2023, 158, 105374. [Google Scholar] [CrossRef]
  15. Sugimoto, M.; Sramoon, A. Theoretical Model of Shield Behavior During Excavation. I: Theory. J. Geotech. Geoenviron. Eng. 2002, 128, 138–155. [Google Scholar] [CrossRef]
  16. Finno, R.J.; Blackburn, J.T.; Roboski, J.F. Three-Dimensional Effects for Supported Excavations in Clay. J. Geotech. Geoenviron. Eng. 2007, 133, 30–36. [Google Scholar] [CrossRef]
  17. Finno, R.J.; Bryson, S.; Calvello, M. Performance of a Stiff Support System in Soft Clay. J. Geotech. Geoenviron. Eng. 2002, 128, 660–671. [Google Scholar] [CrossRef]
  18. Orazalin, Z.Y.; Whittle, A.J.; Olsen, M.B. Three-Dimensional Analyses of Excavation Support System for the Stata Center Basement on the MIT Campus. J. Geotech. Geoenviron. Eng. 2015, 141, 05015001. [Google Scholar] [CrossRef]
  19. Tan, Y.; Wei, B. Observed Behaviors of a Long and Deep Excavation Constructed by Cut-and-Cover Technique in Shanghai Soft Clay. J. Geotech. Geoenviron. Eng. 2012, 138, 69–88. [Google Scholar] [CrossRef]
  20. Liu, G.B.; Ng, C.W.; Wang, Z.W. Observed Performance of a Deep Multistrutted Excavation in Shanghai Soft Clays. J. Geotech. Geoenviron. Eng. 2005, 131, 1004–1013. [Google Scholar] [CrossRef]
  21. Pile Foundation Analysis and Design: Poulos, H G; Davis, E H New York: Wiley, 1980, 397P. Int. J. Rock Mech. Min. Sci. Geomech. Abstr. 1981, 18, 100. [CrossRef]
  22. Cui, X.; Ye, M.; Zhuang, Y. Performance of a Foundation Pit Supported by Bored Piles and Steel Struts: A Case Study. Soils Found. 2018, 58, 1016–1027. [Google Scholar] [CrossRef]
  23. Dong, Y.P.; Burd, H.J.; Houlsby, G.T. Finite Element Parametric Study of the Performance of a Deep Excavation. Soils Found. 2018, 58, 729–743. [Google Scholar] [CrossRef]
  24. Goh, A.T.C.; Zhang, F.; Zhang, W.; Zhang, Y.; Liu, H. A Simple Estimation Model for 3D Braced Excavation Wall Deflection. Comput. Geotech. 2017, 83, 106–113. [Google Scholar] [CrossRef]
  25. Wu, J.; Ye, S.; Wang, Z.; Yang, D. Application and Automatic Monitoring and Analysis of Hybrid Support Structure in Ultra-DEEP Foundation Pit Engineering in the Lanzhou Area under Complex Environmental Conditions. Water 2023, 15, 1335. [Google Scholar] [CrossRef]
  26. Ye, S.; Zhao, Z.; Wang, D. Deformation Analysis and Safety Assessment of Existing Metro Tunnels Affected by Excavation of a Foundation Pit. Undergr. Space 2021, 6, 421–431. [Google Scholar] [CrossRef]
  27. Guo, P.; Gong, X.; Wang, Y. Displacement and Force Analyses of Braced Structure of Deep Excavation Considering Unsymmetrical Surcharge Effect. Comput. Geotech. 2019, 113, 103102. [Google Scholar] [CrossRef]
  28. Mei, Y.; Wang, L.; Zhou, D.; Fu, L. Displacement Characteristics of a Deep Excavation in Hangzhou Soft Clay. Adv. Civ. Eng. 2022, 2022, 5469471. [Google Scholar] [CrossRef]
  29. Huang, Y.; Zhu, C.Q. Safety Assessment of Antiliquefaction Performance of a Constructed Reservoir Embankment. I: Experimental Assessment. J. Perform. Constr. Facil. 2017, 31, 04016101. [Google Scholar] [CrossRef]
  30. Zhu, C.Q.; Huang, Y. Safety Assessment of Antiliquefaction Performance of a Constructed Reservoir Embankment. II: Numerical Assessment. J. Perform. Constr. Facil. 2017, 31, 04016102. [Google Scholar] [CrossRef]
  31. GB 50497-2019; Technical Standard for Monitoring of Building Excavation Engineering. National Standardization Administration of China: Beijing, China, 2019.
  32. JGJ 106-2014; Technical Specification for Testing of Building Foundation Piles. Ministry of Housing and Urban-Rural Development of the People’s Republic of China: Beijing, China, 2014.
Figure 1. Schematic of the surrounding environment of the site.
Water 15 03121 g001
Figure 2. East-west geological profile diagram.
Water 15 03121 g002
Figure 3. Geological profile at different sections in the north-south direction of the foundation pit.
Water 15 03121 g003
Figure 4. Foundation pit excavation site.
Water 15 03121 g004
Figure 5. Layout of foundation pit supporting structure.
Water 15 03121 g005
Figure 6. North–south elevation of foundation pit.
Water 15 03121 g006
Figure 7. East-west elevation of foundation pit bottom.
Water 15 03121 g007
Figure 8. Layout plan of monitoring points.
Water 15 03121 g008
Figure 9. Layout of pile foundation displacement monitoring and steel support axial force monitoring.
Water 15 03121 g009
Figure 10. Settlement-time-history curve of monitoring points in the park.
Water 15 03121 g010
Figure 11. Settlement-time-history curves of vertical displacements at monitoring points of the gravity retaining wall.
Water 15 03121 g011
Figure 12. Time-history curve of displacement in the X-direction at monitoring point of gravity retaining wall.
Water 15 03121 g012
Figure 13. Time-history curve of the Y-direction displacement of monitoring point of gravity retaining wall.
Water 15 03121 g013
Figure 14. Time-history curve of pile top settlement in the east area of foundation pit.
Water 15 03121 g014
Figure 15. Time–history curve of displacement of pile top in the X-direction in the east area of foundation pit.
Water 15 03121 g015
Figure 16. Time-history curve of displacement of pile top in Y-direction in the east area of foundation pit.
Water 15 03121 g016
Figure 17. Time-history curve of pile top settlement in the west area of foundation pit.
Water 15 03121 g017
Figure 18. Time-history curve of displacement of pile top in the X-direction in the west area of foundation pit.
Water 15 03121 g018
Figure 19. Time-history curve of displacement of pile top in the Y-direction in the west area of foundation pit.
Water 15 03121 g019
Figure 20. Axial force monitoring of steel support in the east area of foundation pit.
Water 15 03121 g020
Figure 21. Axial force monitoring of steel support in the west area of the foundation pit.
Water 15 03121 g021
Figure 22. Axial force monitoring of inclined steel support.
Water 15 03121 g022
Figure 23. Settlement time-history curve along the road’s edge.
Water 15 03121 g023
Figure 24. Settlement time-history curve along the road’s center.
Water 15 03121 g024
Figure 25. Three-dimensional finite element model.
Water 15 03121 g025
Figure 26. Model of foundation pit supporting structure.
Water 15 03121 g026
Figure 27. Steel support model of foundation pit.
Water 15 03121 g027
Figure 28. Location map of excavation slope on the west side of foundation pit and reserved soil on the east side.
Water 15 03121 g028
Figure 29. Beam element simulation pile foundation.
Water 15 03121 g029
Figure 30. Cloud diagram of vertical displacement of foundation pit excavation.
Water 15 03121 g030
Figure 31. Numerical simulation monitoring points at the bottom of foundation pit.
Water 15 03121 g031
Figure 32. Vertical displacement of pit bottom.
Water 15 03121 g032
Figure 33. Comparison between monitoring value and numerical simulation of axial force of steel support on the east side of the foundation pit.
Water 15 03121 g033
Figure 34. Comparison between monitoring value and numerical simulation of axial force of the upper steel support on the west side of foundation pit.
Water 15 03121 g034
Figure 35. Numerical simulation value of the axial force of the lower-layer steel support on the west side of foundation pit.
Water 15 03121 g035
Figure 36. Displacement of pile body in the X-direction.
Water 15 03121 g036
Figure 37. Displacement of pile in the Y-direction.
Water 15 03121 g037
Figure 38. Bending moment in Y-direction of the pile body.
Water 15 03121 g038
Table 1. Soil Parameters of the Excavation Site.
Name of SoilThe Natural Unit Weight γ (kN/m3)Cohesive Strength Ck (kPa)Internal Friction Angle φk( )Compressive Modulus ES1-2
(MPa)
Permeability Coefficient
k (cm/s)
① Miscellaneous fill soil17.512.010.04.55.0 × 10−3
② Silt17.95.05.02.03.0 × 10−5
③ Silty clay19.242.012.27.03.0 × 10−6
④ Clay19.650.016.511.06.0 × 10−7
⑤ Highly weathered
sandy claystone
20.010.020.020.02.0 × 10−5
⑥ Moderately weathered
sandy claystone
22.530.040.05002.0 × 10−6
Table 2. Construction Process and Duration.
StageConstruction AreaConstruction Duration DaysConstruction Content
Before excavationNorth side of foundation pit-North building basement
South side of the foundation pit-Gravity retaining wall construction
The whole foundation pit area-Pile foundation construction
Under excavationEast and west sides of the foundation pit-Diaphragm wall construction
East area of foundation pit20Excavate to 5 m.
East area of foundation pit30Pile cutting-steel support construction
East area of foundation pit10The first steel support construction
East area of foundation pit25Excavation of the first layer of soil
East area of foundation pit25Excavation of the second layer of soil
East area of foundation pit25The second steel support construction
East area of foundation pit25Demolition of steel support
South side of foundation pit10Basement floor construction
After excavation---
Table 3. Soil mass and structural parameters of finite element model.
Structure/Soil Massγ (103KN/m3)E (Mpa) φ ( ) v Unit Type
Miscellaneous fill18.520150.40Entity unit
Clay1930200.35Entity unit
Silt18650.45Entity unit
Strongly weathered sandstone267.0 × 104450.31Entity unit
Rock281.8 × 105500.30Entity unit
Reinforcement soil at pit bottom2045360.32Entity unit
Gravity cement soil wall19.550 × 104400.30Entity unit
Concrete diaphragm wall254.5 × 104-0.30Entity unit
Pile foundation/basement floor253.25 × 104-0.28Beam/plate element
Steel support782.1 × 105-0.26Beam element
Disclaimer/Publisher’s Note: The statements, opinions and data contained in all publications are solely those of the individual author(s) and contributor(s) and not of MDPI and/or the editor(s). MDPI and/or the editor(s) disclaim responsibility for any injury to people or property resulting from any ideas, methods, instructions or products referred to in the content.

