Article

Geochemical Characteristics and Formation Mechanisms of the Geothermal Waters from the Reshui Area, Dulan of Qinghai, China

1
Department of Geological Engineering, Qinghai University, Xining 810016, China
2
Key Lab of Cenozoic Resource & Env. in North Margin of the Tibetan Plateau, Xining 810016, China
*
Author to whom correspondence should be addressed.
Water 2023, 15(17), 3084; https://doi.org/10.3390/w15173084
Submission received: 30 July 2023 / Revised: 22 August 2023 / Accepted: 23 August 2023 / Published: 28 August 2023
(This article belongs to the Section Hydrogeology)

Abstract

:
The Reshui area, located to the northeast of the Qinghai–Tibet Plateau, exhibits complex geological conditions, well-developed structures, and strong hydrothermal activities. The distribution of hot springs within this area is mainly controlled by faults. In this paper, five hot springs from the area were taken as the research object. We comprehensively studied the geochemical characteristics and genetic mechanism of the geothermal water by conducting a field investigation, hydrogeochemistry and environmental isotopic analysis (87Sr/86Sr, δ2H, δ18O, 3H). The surface temperature of the geothermal water ranges from 84 to 91 °C. The geothermal water in the area exhibits a pH value ranging between 8.26 and 8.45, with a total dissolved solids’ (TDS) concentration falling between 2924 and 3140 mg/L, indicating a weakly alkaline saline nature. It falls into the hydrochemical type CI-Na and contains a relatively high content of trace components such as Li, Sr, B, Br, etc., which are of certain developmental value. Ion ratio analysis and strontium isotope characteristics show that the dissolution of evaporite minerals and carbonate minerals serves as a hot spring for the main source of solutes. Hydrogen and oxygen stable isotope characteristics findings indicate that the geothermal water is primarily recharged via atmospheric precipitation. Moreover, the tritium isotopic data suggest that the geothermal water is a mixture of both recent water and ancient water. Moreover, the recharge elevation is estimated to be between 6151 and 6255 m. and the recharge area is located in the Kunlun Mountains around the study area. The mixing ratio of cold water, calculated using the silicon enthalpy equation, is approximately 65% to 70%. Based on the heat storage temperature calculated using the silicon enthalpy equation and the corrected quartz geothermal temperature scale, we infer that the heat storage temperature of geothermal water in the area ranges from 234.4 to 247.8 °C, with a circulation depth between 7385 and 7816 m. The research results are highly valuable in improving the research level concerning the genesis of high-temperature geothermal water in Reshui areas and provide essential theoretical support for the rational development and protection of geothermal resources in the area.

1. Introduction

As a result of the global energy crisis and growing environmental concerns, there is an increasing focus on the development and utilization of clean and renewable energy sources [1]. Geothermal energy, as a traditional, important, and renewable clean energy, has been used for thousands of years. It offers the potential to reduce atmospheric carbon emissions and mitigate global warming, making it an attractive option in the quest for sustainable energy solutions [2]. Geothermal energy can be harnessed from both hydrothermal systems and hot dry rock formations [3]. The hydrothermal system involves various factors such as heat storage lithology, temperature, mineral–water chemical equilibrium state, heat source, and chemical components that influence geothermal fluid [4]. Understanding these factors is crucial for the sustainable development of geothermal resources. In recent years, the sustainable utilization of geothermal resources has become a new challenge for the scientific community. To continue developing and effectively utilizing geothermal resources, it is essential to gain a deeper understanding of the genetic mechanisms underlying geothermal water. By elucidating the processes and interactions that lead to the formation of geothermal water, researchers can develop more effective strategies for harnessing geothermal energy while ensuring its responsible and sustainable use [5]. This knowledge is vital for meeting the growing energy demands in an environmentally friendly manner and reducing our dependence on fossil fuels.
Hydrogeochemistry and isotope methods have always been effective approaches for analyzing the genetic mechanisms of geothermal water. The chemical characteristics of geothermal fluids not only reveal the hydrochemical composition and ion sources of groundwater, as well as water–rock interactions, but also explain the mechanisms of hydrothermal circulation, estimate the temperature of thermal reservoirs, and calculate the mixing proportions of deep-origin hot water and shallow cold water [6,7,8,9]. Procesi et al.’s [10] study evaluates the geothermal energy potential in Mozambique’s Tete region using thermal springs’ geochemical analysis, confirming meteoric origin, ruling out magmatic connections, and proposing a viable circulation model. With reservoir temperatures of 90–120 °C, low salinity, and an absence of corrosive elements, the research highlights its suitability for both direct and indirect uses, offering valuable insights for sustainable energy development. Apollaro et al.’s [11] study analyzes altered volcanic rocks from active hydrothermal sites on Lipari Island using petrography, geochemistry, and reaction path modeling. It identifies two types of altered rocks, rich in silicates or sulphates, and validates a model that attributes alteration to steam condensation-induced acid solution. The findings highlight the role of hydrothermal steam condensation in rock alteration, rather than magmatic fluids. Environmental isotopes can trace the origin of groundwater and determine its age, with D-O isotopes being particularly important for tracing the supply sources of geothermal water and calculating the elevation in groundwater recharge [12,13].
In the latter half of the 20th century, Chinese geologists conducted preliminary research on geothermal resources in the northern part of the Qinghai–Tibet Plateau. They conducted surveys on the basic geological conditions and geothermal geological conditions of the northern region of the Qinghai–Tibet Plateau, summarizing and compiling information on natural hot springs’ occurrence, distribution, and basic physical properties such as temperature and flow rate [14]. The northeastern part of Qinghai Province is one of the major geothermal anomaly areas in the northern Qinghai–Tibet Plateau, with abundant geothermal resources concentrated in the mountainous areas around Dulan County, Gonghe County, and their surrounding regions [15,16,17]. Zhang et al. [18] investigates the hydrogeochemical characteristics of geothermal water in the Woka graben basin and establishes a conceptual model for the underground geothermal system. The estimated reservoir temperature ranges from 120 to 200 °C, with cold water contributing to 70% to 83% of the mixture. Zhou et al.’s [19] study investigates the geochemical characteristics of hot springs in the Litang Fault Zone (LFZ) and establishes a conceptual model of ground fluid circulation. It identifies three different geothermal systems and their relation to rock lithology and water–rock interactions. The research provides insights into regional hydrogeological environments and offers a scientific basis for understanding geothermal fluid movement in fault zones. Zhang et al. [20] presents a significant breakthrough in exploring geothermal resources in the northeastern Tibetan Plateau, identifying two distinct types of high-temperature geothermal resources and providing valuable insights for future searches in China. Saibi et al.’s [21] study examines two low-enthalpy geothermal fields in the UAE, analyzing water chemistry and isotopes to calculate geothermal reservoir temperatures using cation and silica geothermometers. It reveals that the hot waters are recharged by rainwater through deep circulation and fault structures. The research innovates by estimating geothermal energy potential for direct-use applications and geothermal electricity using stochastic Monte Carlo simulations, highlighting sustainable utilization possibilities for the Mubazzarah-Ain Faidha and Ain Khatt geothermal fields. Ayadi et al.’s [22] study employs major element concentrations, stable, and radiogenic isotopes to trace groundwater processes and sources in Sfax, Tunisia’s semi-arid region. It identifies salinity origins as water–rock interactions and delineates groundwater types based on chemistry and isotopic signatures, revealing insights into recharge mechanisms and historical climatic conditions. Nitrate contamination and tritium/carbon-14 data provide evidence of anthropogenic influence and historical recharge patterns.
Currently, the research on geothermal water in Reshui Township, Qinghai, is limited, and there is a lack of understanding regarding water–rock interactions and thermal reservoir characteristics, leading to unclear mechanisms of spring water formation and hindering the development of geothermal resources in southeastern Qinghai. This study analyzes the geological background, tectonics, and hydrogeology of the thermal field, and combines hydrogeochemical and isotopic analyses to elucidate the hydrogeochemical evolution of the hot springs, investigating water–rock interactions, mixing processes, and reservoir conditions. This study also estimates the temperature and depth of the thermal reservoir, aiming to provide theoretical support and scientific basis for the development and utilization of geothermal resources in Qinghai Province.

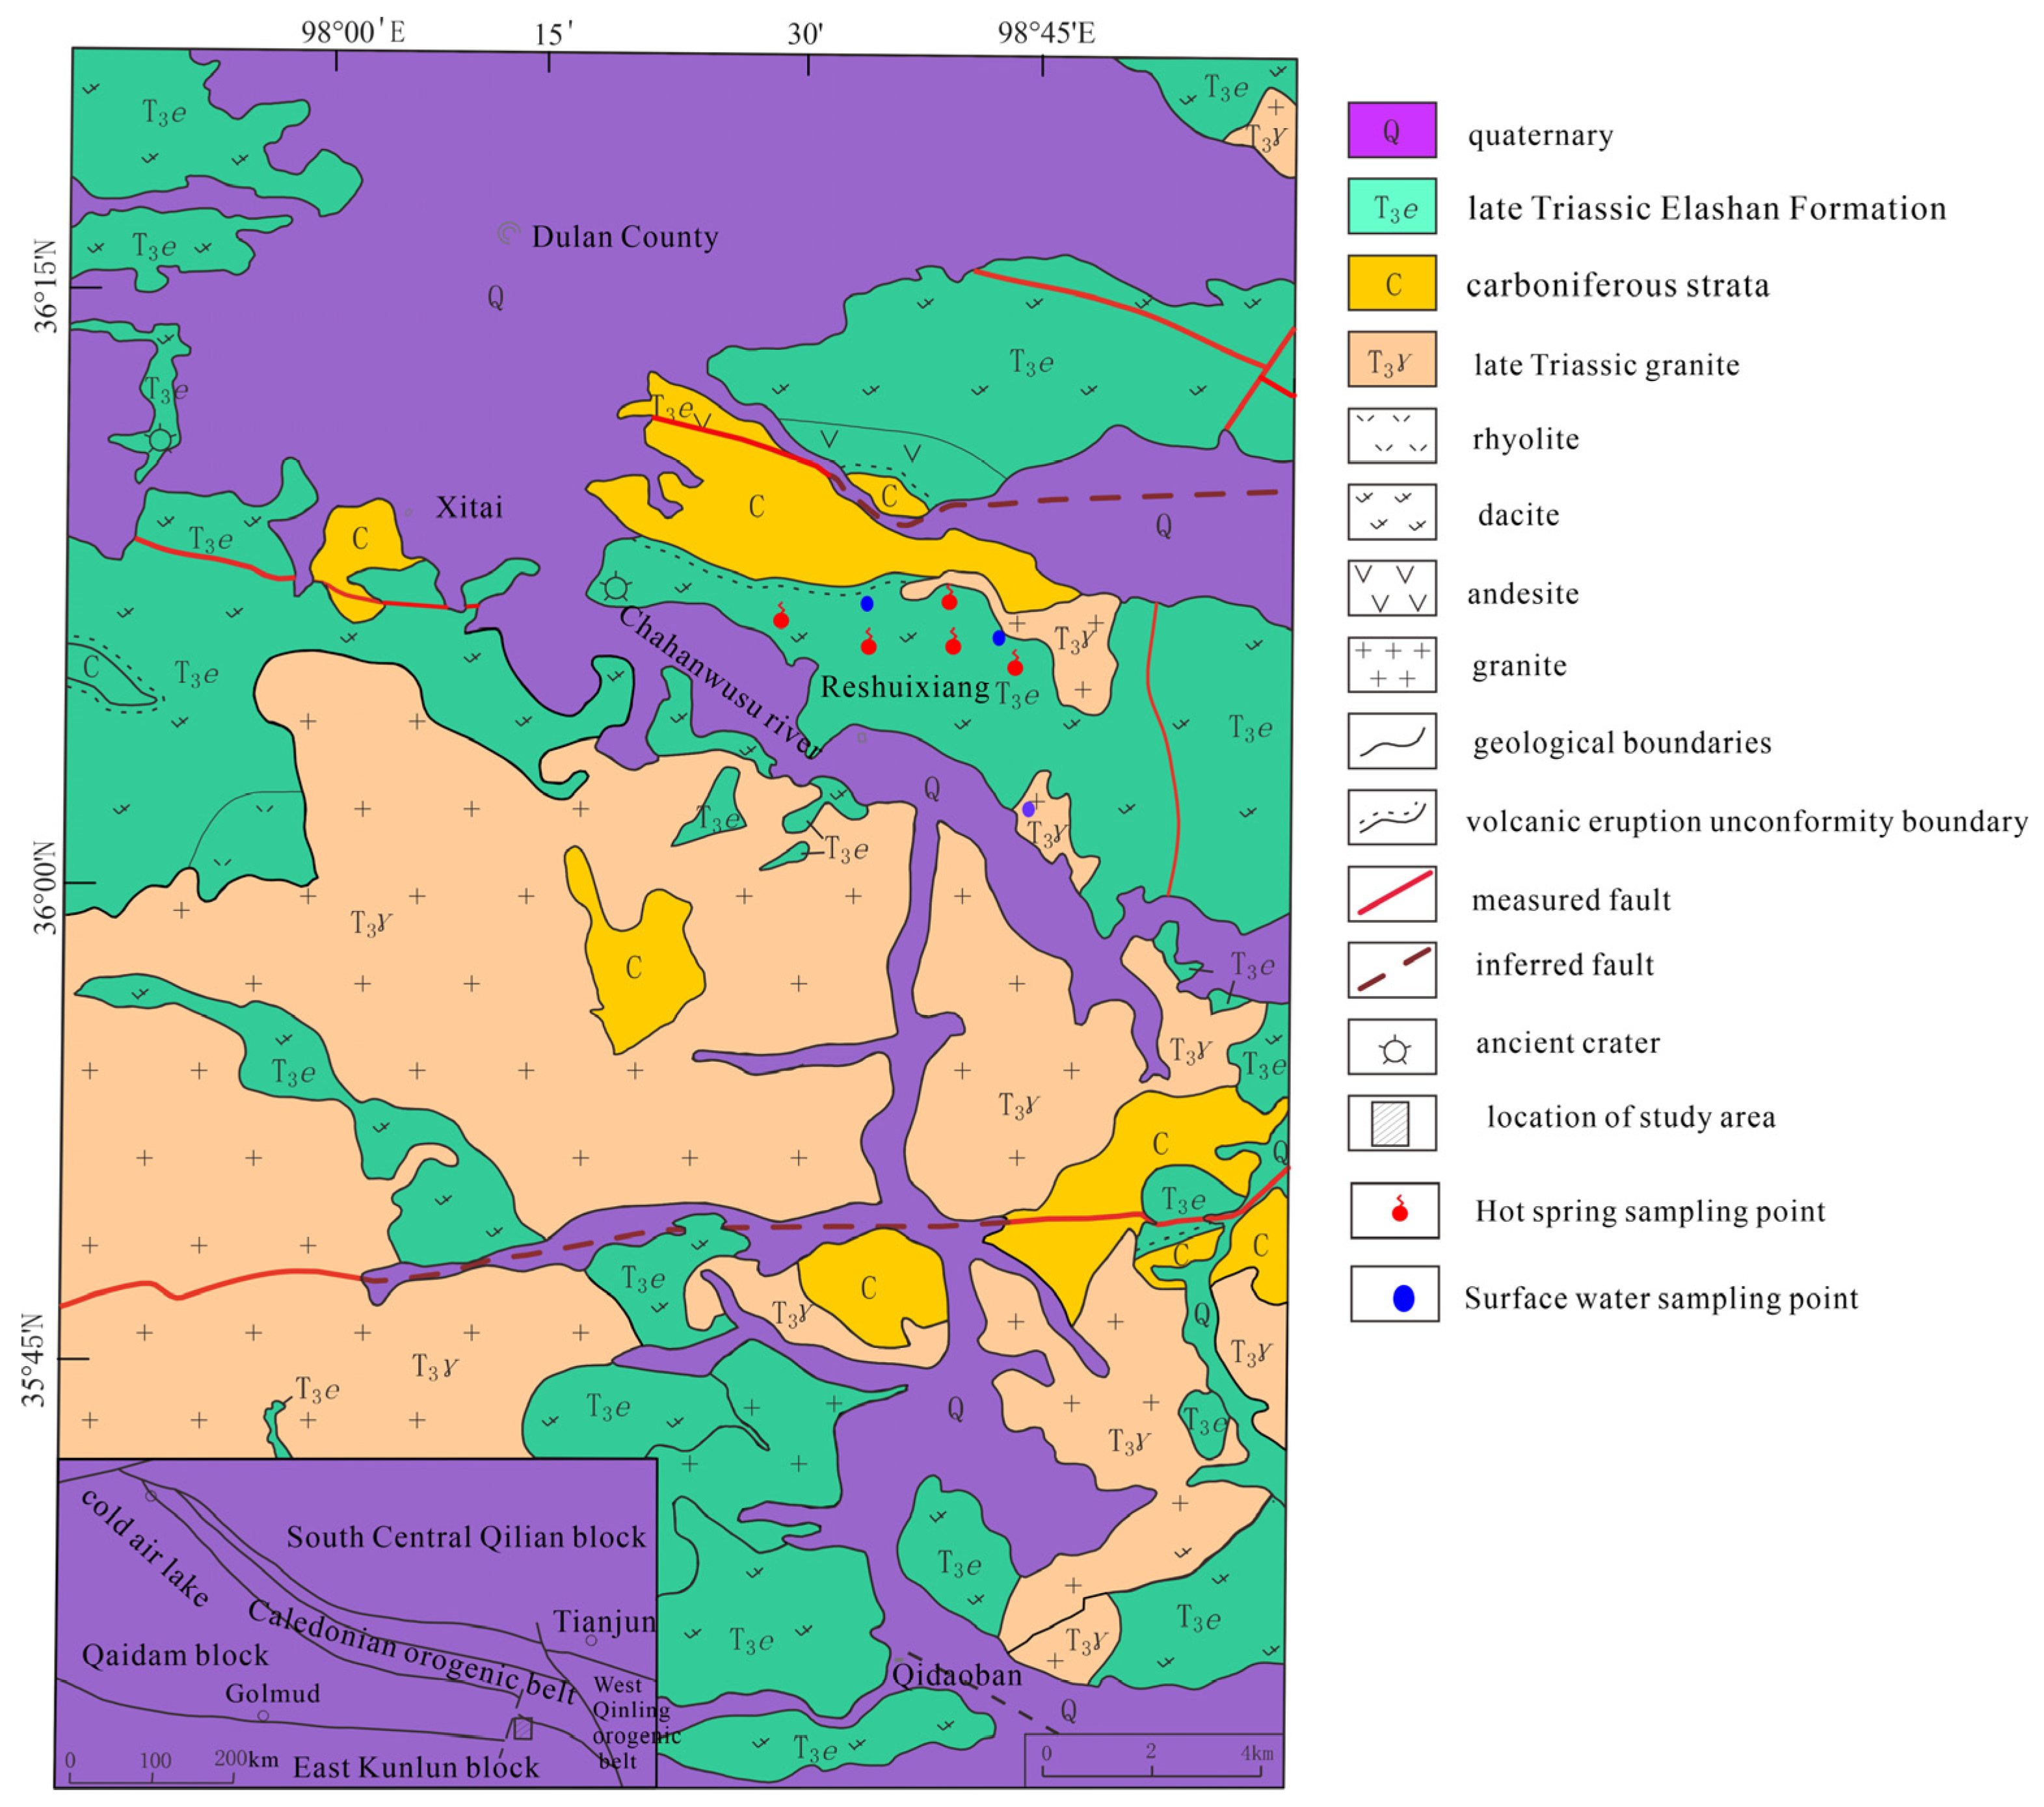
2. Geological Setting

Dulan County is situated in the central part of Qinghai Province, at the eastern end of the Kunlun Mountains orogenic belt and the southeastern margin of the Qaidam Basin (Figure 1). It is part of the Kunlun–Qimantag–Dulan mineralization belt, characterized by strong tectonic activity, frequent volcanic activity, and relatively abundant metallic mineral resources [23]. The area is well known for the development of northwest to northeast trending faults, which create pathways for rock intrusion and establish a favorable geological environment for the occurrence and transportation of geothermal resources. The Dulan block spans approximately 70 km in length and 30 km in width, primarily consisting of Precambrian metamorphic rocks, including various intermediate to high-grade schists such as garnet schist, biotite and muscovite schist, marble, and a small amount of lenses and blocks of aluminous mudstone-hosted olivine rock, garnet-bearing schist, and eclogite [24,25,26]. Quartz primarily occurs as mineral inclusions in zircon from schist and eclogite. Additionally, a significant amount of granite has intruded into these Proterozoic metamorphic rocks, showing clear intrusive contact relations with the host schist and locally exhibiting hybridization. Based on the differences in aquifer media and hydraulic properties, the underground water types in the Qaidam Basin can be classified into Quaternary unconfined aquifer, confined aquifer, and bedrock fissure water. Common clay minerals include montmorillonite, illite, kaolinite, and halloysite [27].
The Qaidam Basin is located on the northern side of the Qinghai–Tibet Plateau, in the middle of the Qinling–Qilian–Kunlun metallogenic belt. It takes the shape of an irregular diamond with a northwest-southeast axis and a drainage area of approximately 25.5 × 10⁴ km2 [28]. The basin is filled with thick Mesozoic–Cenozoic clastic sediments, mainly distributed in the western part during the Paleogene–Neogene, and extending eastward during the Neogene, eventually covering the entire basin during the Quaternary. The Quaternary saline deposits evolved from the Paleogene and Neogene salt lakes. The Reshui region is situated at the junction of the Qinling, Qilian, and Kunlun mountain belts, mainly in the northern magmatic arc of the eastern Kunlun block [29]. Its northeast corner is the Garide belt of the Chaibei margin during the Early Paleozoic. It is bounded by the concealed faults of the Maoniushan–Xiangride and extends westward into the Qaidam block. This region is characterized by intense tectonic superposition resulting from interactions between different tectonic units. It has experienced multiple periods of sedimentary construction, magmatic activity, and deformation-metamorphism with different tectonic attributes, such as the Himalayan and Indosinian periods, making it one of the significant tectonic knots in western China [30].
The exposed strata in the area are primarily from the Upper Triassic E’la Shan Formation, followed by Carboniferous strata. The E’la Shan Formation consists of terrestrial, acidic volcanic rocks, mainly composed of andesite, dacite, rhyolite, and their volcaniclastic counterparts. It is distributed around Dulan County town, Reshui Township, and QidaoBan in Qinghai Province. The Carboniferous strata include the Lower Carboniferous Dagangou Formation and Upper Carboniferous Diaosu Formation, both of which are composed of carbonate and terrigenous clastic rocks resulting from coastal–continental interactions. They mainly consist of limestone, dolomite, and sandstone and are distributed sporadically. These strata are unconformably overlain by the volcanic E’la Shan Formation and are in contact with it. The main type of igneous rocks in the area is Upper Triassic granite, which includes a complete sequence of granites such as diorite, quartz-diorite, granodiorite, syenogranite, and monzogranite. The isotopic ages of the granite bodies are almost identical to those of the volcanic rocks, but they also maintain obvious intrusive contacts with them, i.e., the granite bodies intrude into the volcanic rocks. This phenomenon constitutes the unique spatial and temporal structure of the E’raoshan magmatic belt [30,31,32]. The main structural form in the area is the fault structure, which can be divided into three groups of faults with different orientations. The earliest formed faults are the NE–SW and NW–SE faults, which are mostly north-dipping reverse faults. The north–south faults formed later, mainly consist of west-dipping normal faults, showing characteristics of multiple periods of activity and active faults. The northeast–southeast faults appear in volcanic rocks and are conjugate with the north–south faults. The rock types mainly consist of intermediate gabbro, medium-to-high-acidity granodiorite, acidic diorite, and plagioclase granite.

3. Sampling and Analytical Methods

In July 2022, the research team conducted an investigation and sample collection in Reshui Township, Dulan County, Qinghai Province, the location of the research area. A total of 5 groups of hot spring water samples were collected during this period, which included 3 groups of river water and snow water samples. The sampling locations are indicated in Figure 1. Before sampling, the sampling bottle should be rinsed with distilled water and then washed three times with the water sample to be collected. For the analysis of cations (Ca2+, Mg2+, Na+, K+), a 500 mL polyethylene bottle is used, and nitric acid is added to acidify the sample to pH < 2. For the analysis of anions (HCO3, SO42−, Cl, NO3), a 500 mL polyethylene bottle is used, and no reagent is added. On-site measurements of pH, water temperature (T), and total dissolved solids (TDS) are conducted using a portable multi-parameter water quality tester (DZB-718), while other indicators are tested within 2 weeks of water sample collection. The analysis of cation and anion species as well as trace elements in geothermal water samples was quantified using inductively coupled plasma mass spectrometry (ICP-MS) and Inductively Coupled Plasma Optical Emission Spectroscopy (ICP-OES) at the State Key Laboratory of Plateau Ecology and Agriculture, Three-River Source Region, Qinghai University. These methods have an analytical precision better than 0.1%. Unfiltered water samples were analyzed for major anions (F, Cl, and SO4) using ion chromatography (IC; Dionex 120, Dionex, Sunnyvale, CA, USA) with an uncertainty of <±5%. Major anions (HCO3 and CO3) were determined via hydrochloric acid titration using phenolphthalein and a mixed solution of methylene blue and methyl red as indicators (with an uncertainty <±1%). The stable isotopic ratios of hydrogen and oxygen were measured using a Flash HT2000-MAT253 isotope ratio mass spectrometer at the Institute of Hydrogeology and Environmental Geology, Chinese Academy of Sciences, with a precision of δ2H < 0.5‰ and δ18O < 0.1‰. The “3H” content was measured using an ultra-low background liquid scintillation counter Quantulus 1220, with a detection limit of 0.1TU. Strontium isotopes were measured using a Thermal Ionization Mass Spectrometer (Model 9444 Phoenix), with the notation of 87Sr/86Sr, at the Analytical Testing Center of Beijing Institute of Geology. For all water samples, the IB (%) values varied from 0.79 to 4.75% (Table 1), and therefore, we consider these analyses reliable. The test results of the samples are shown in Table 1. All sample data were analyzed using SPSS 20, and graphing and analysis were performed with Origin 2021, Piper, and CorelDRAW 2022.

4. Results and Discussion

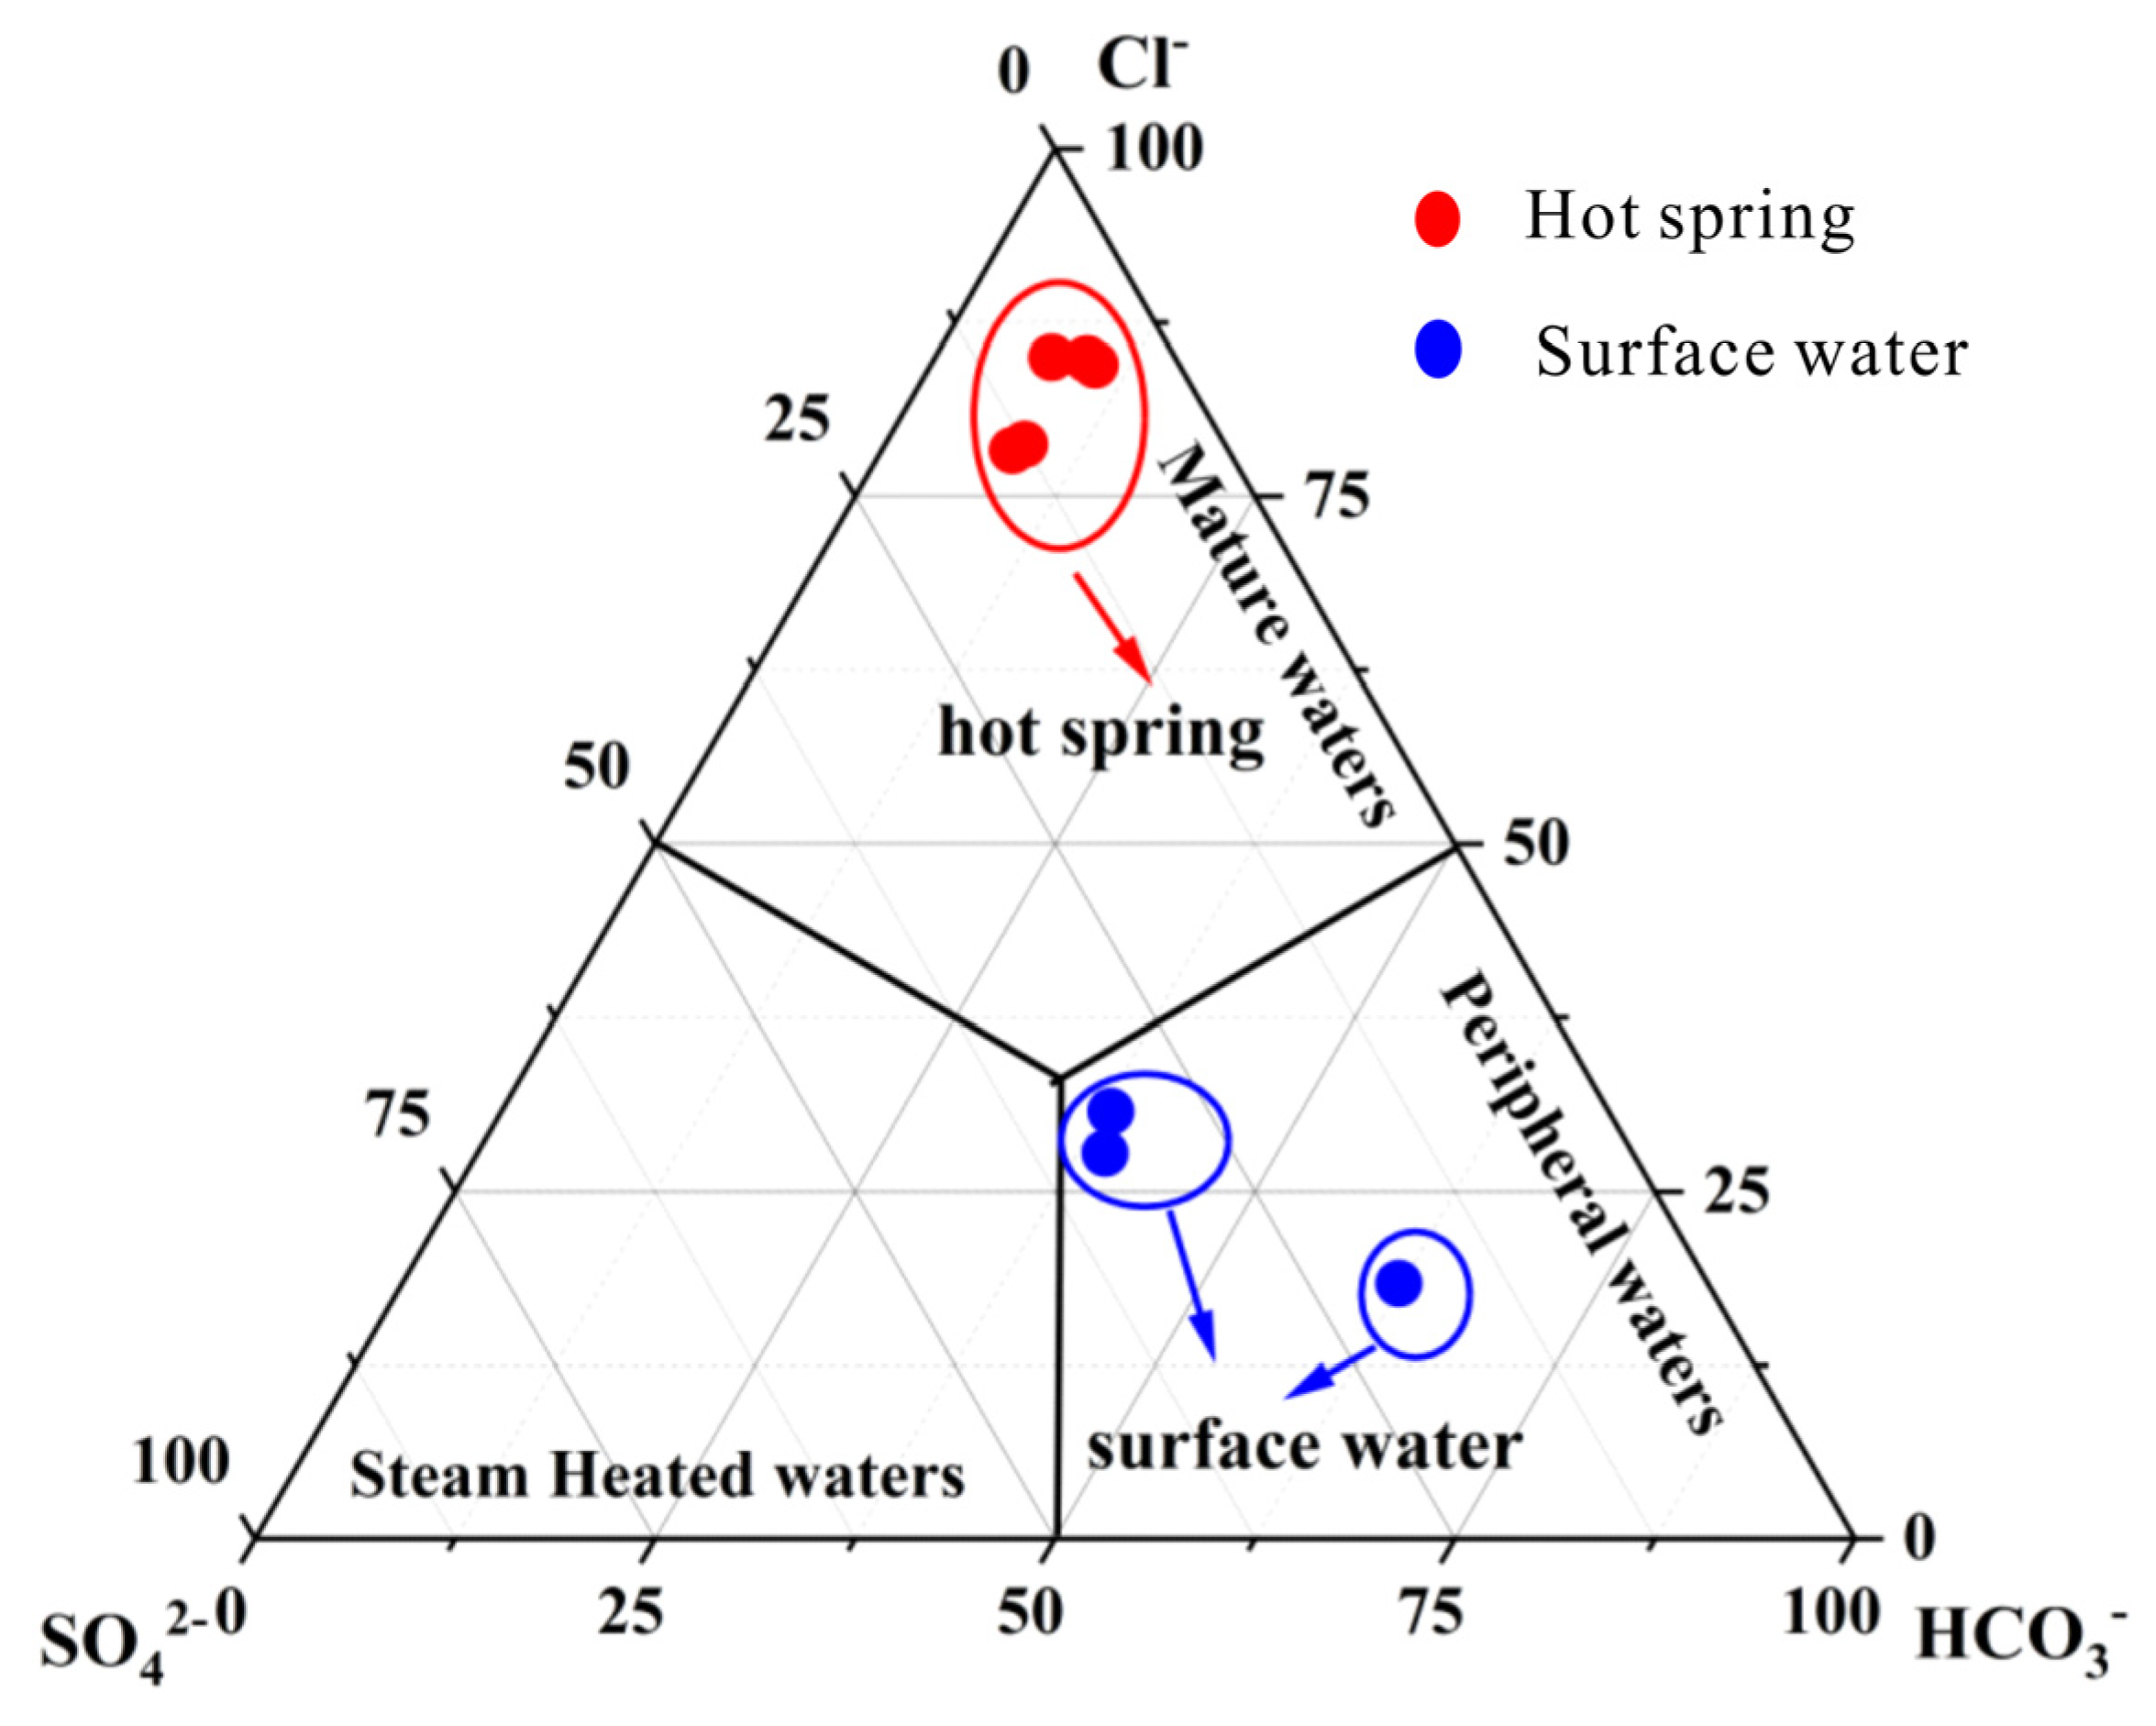
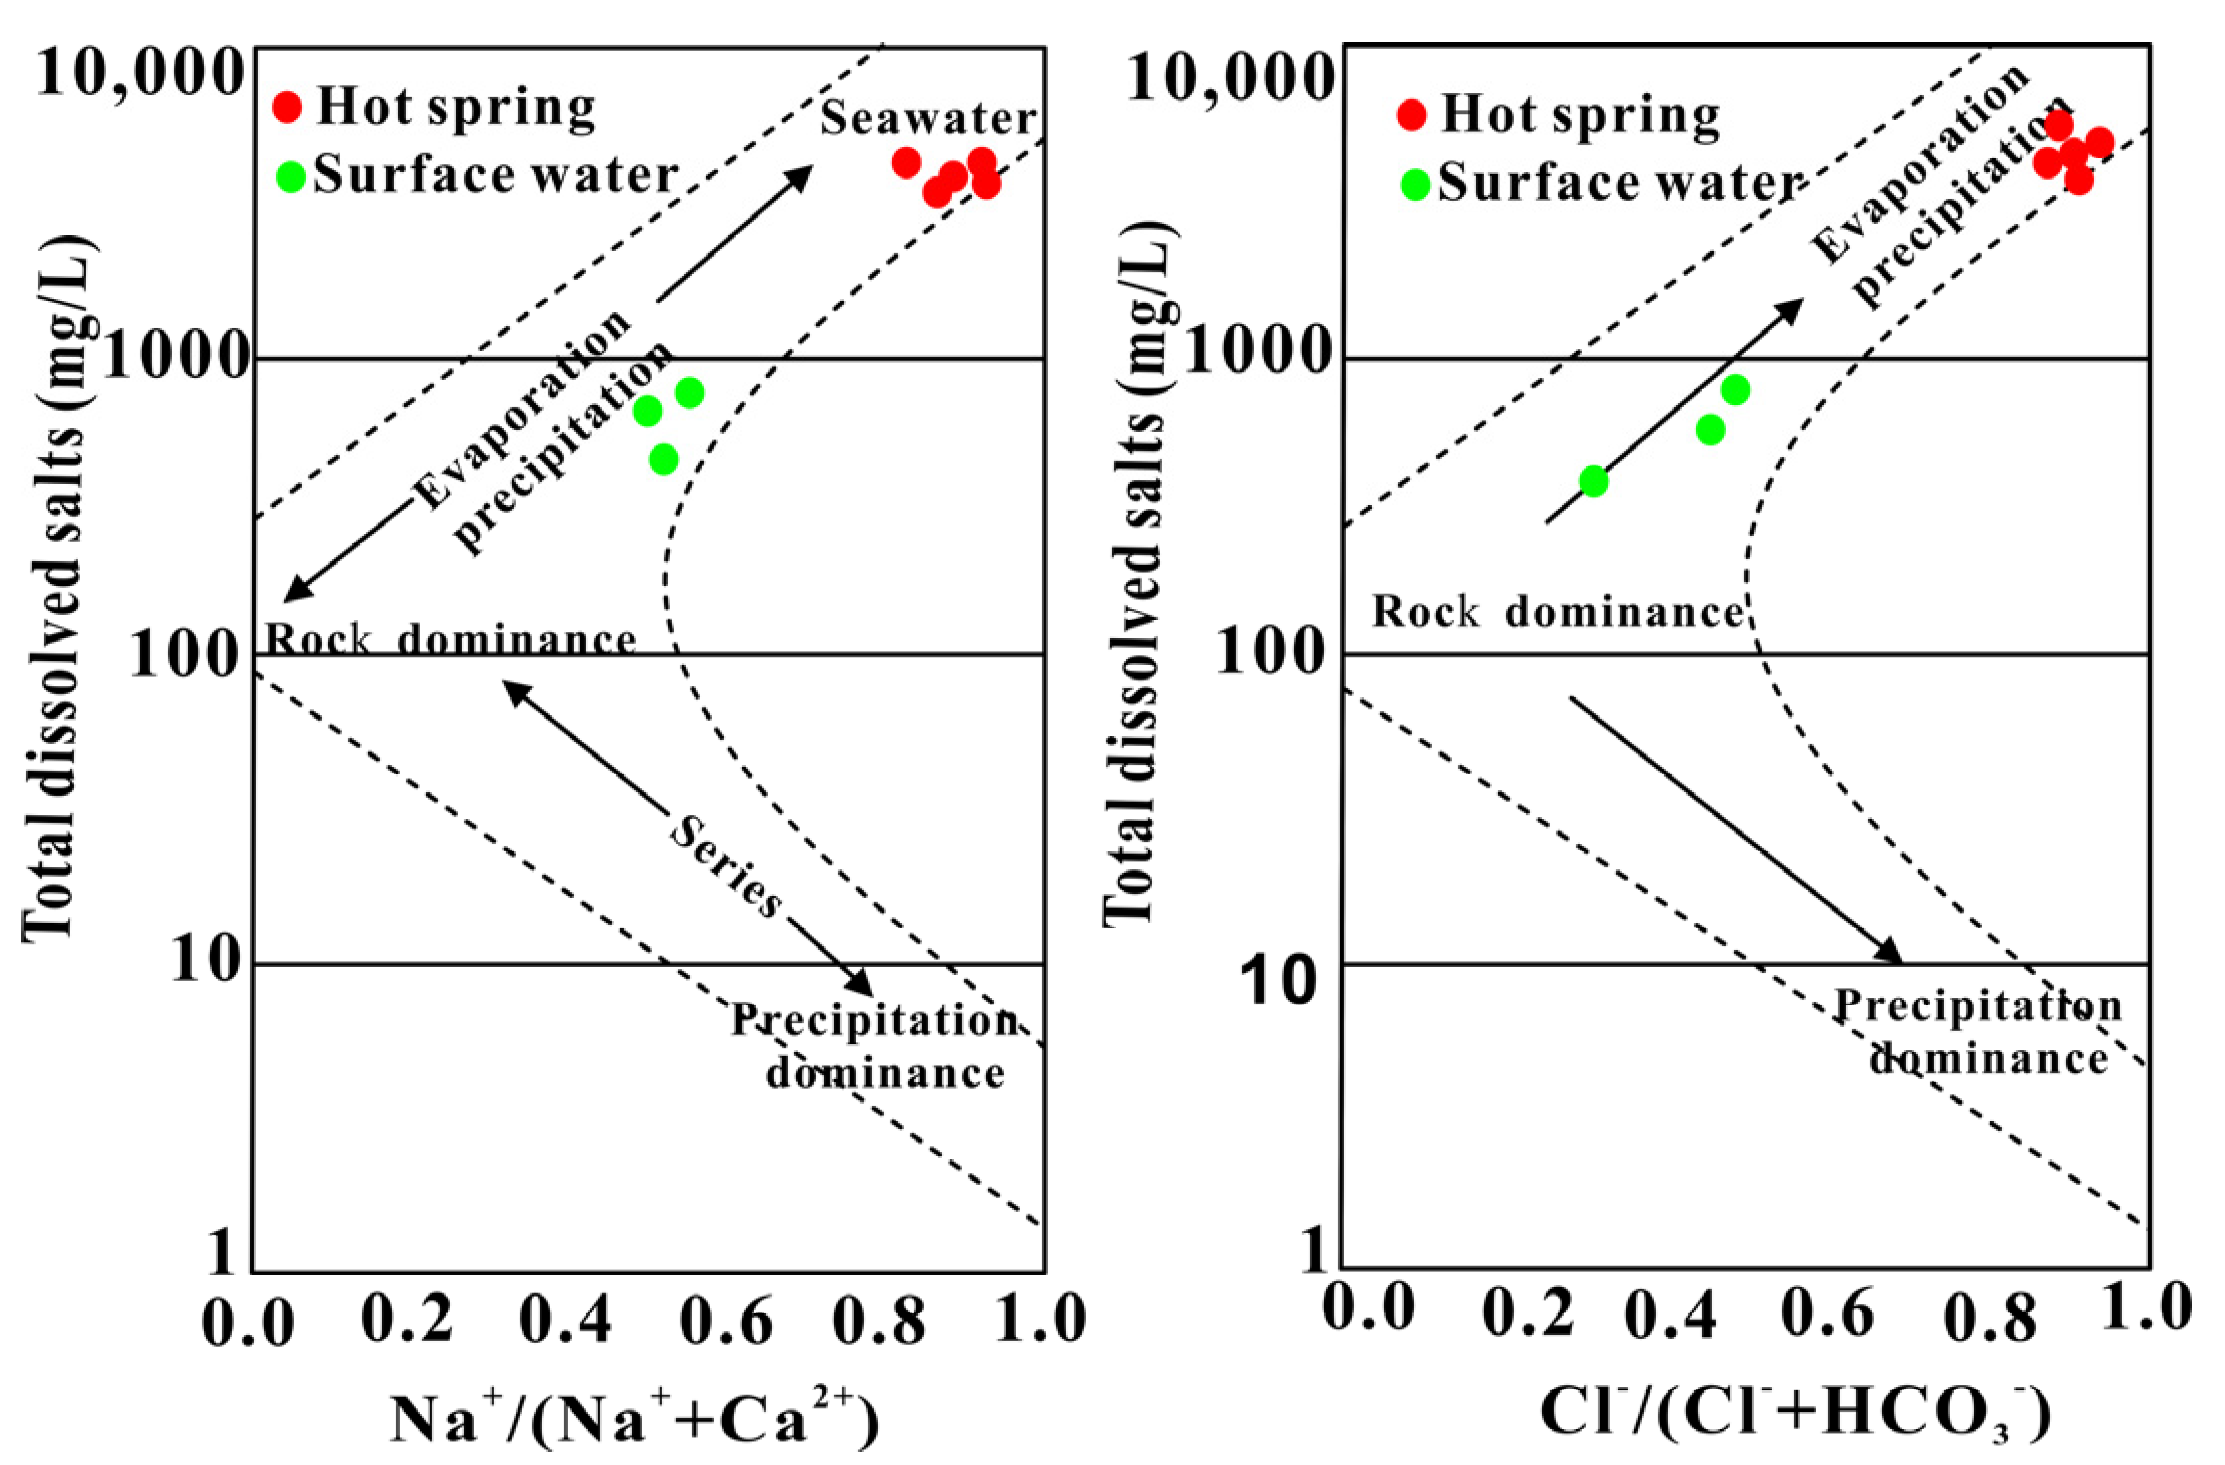
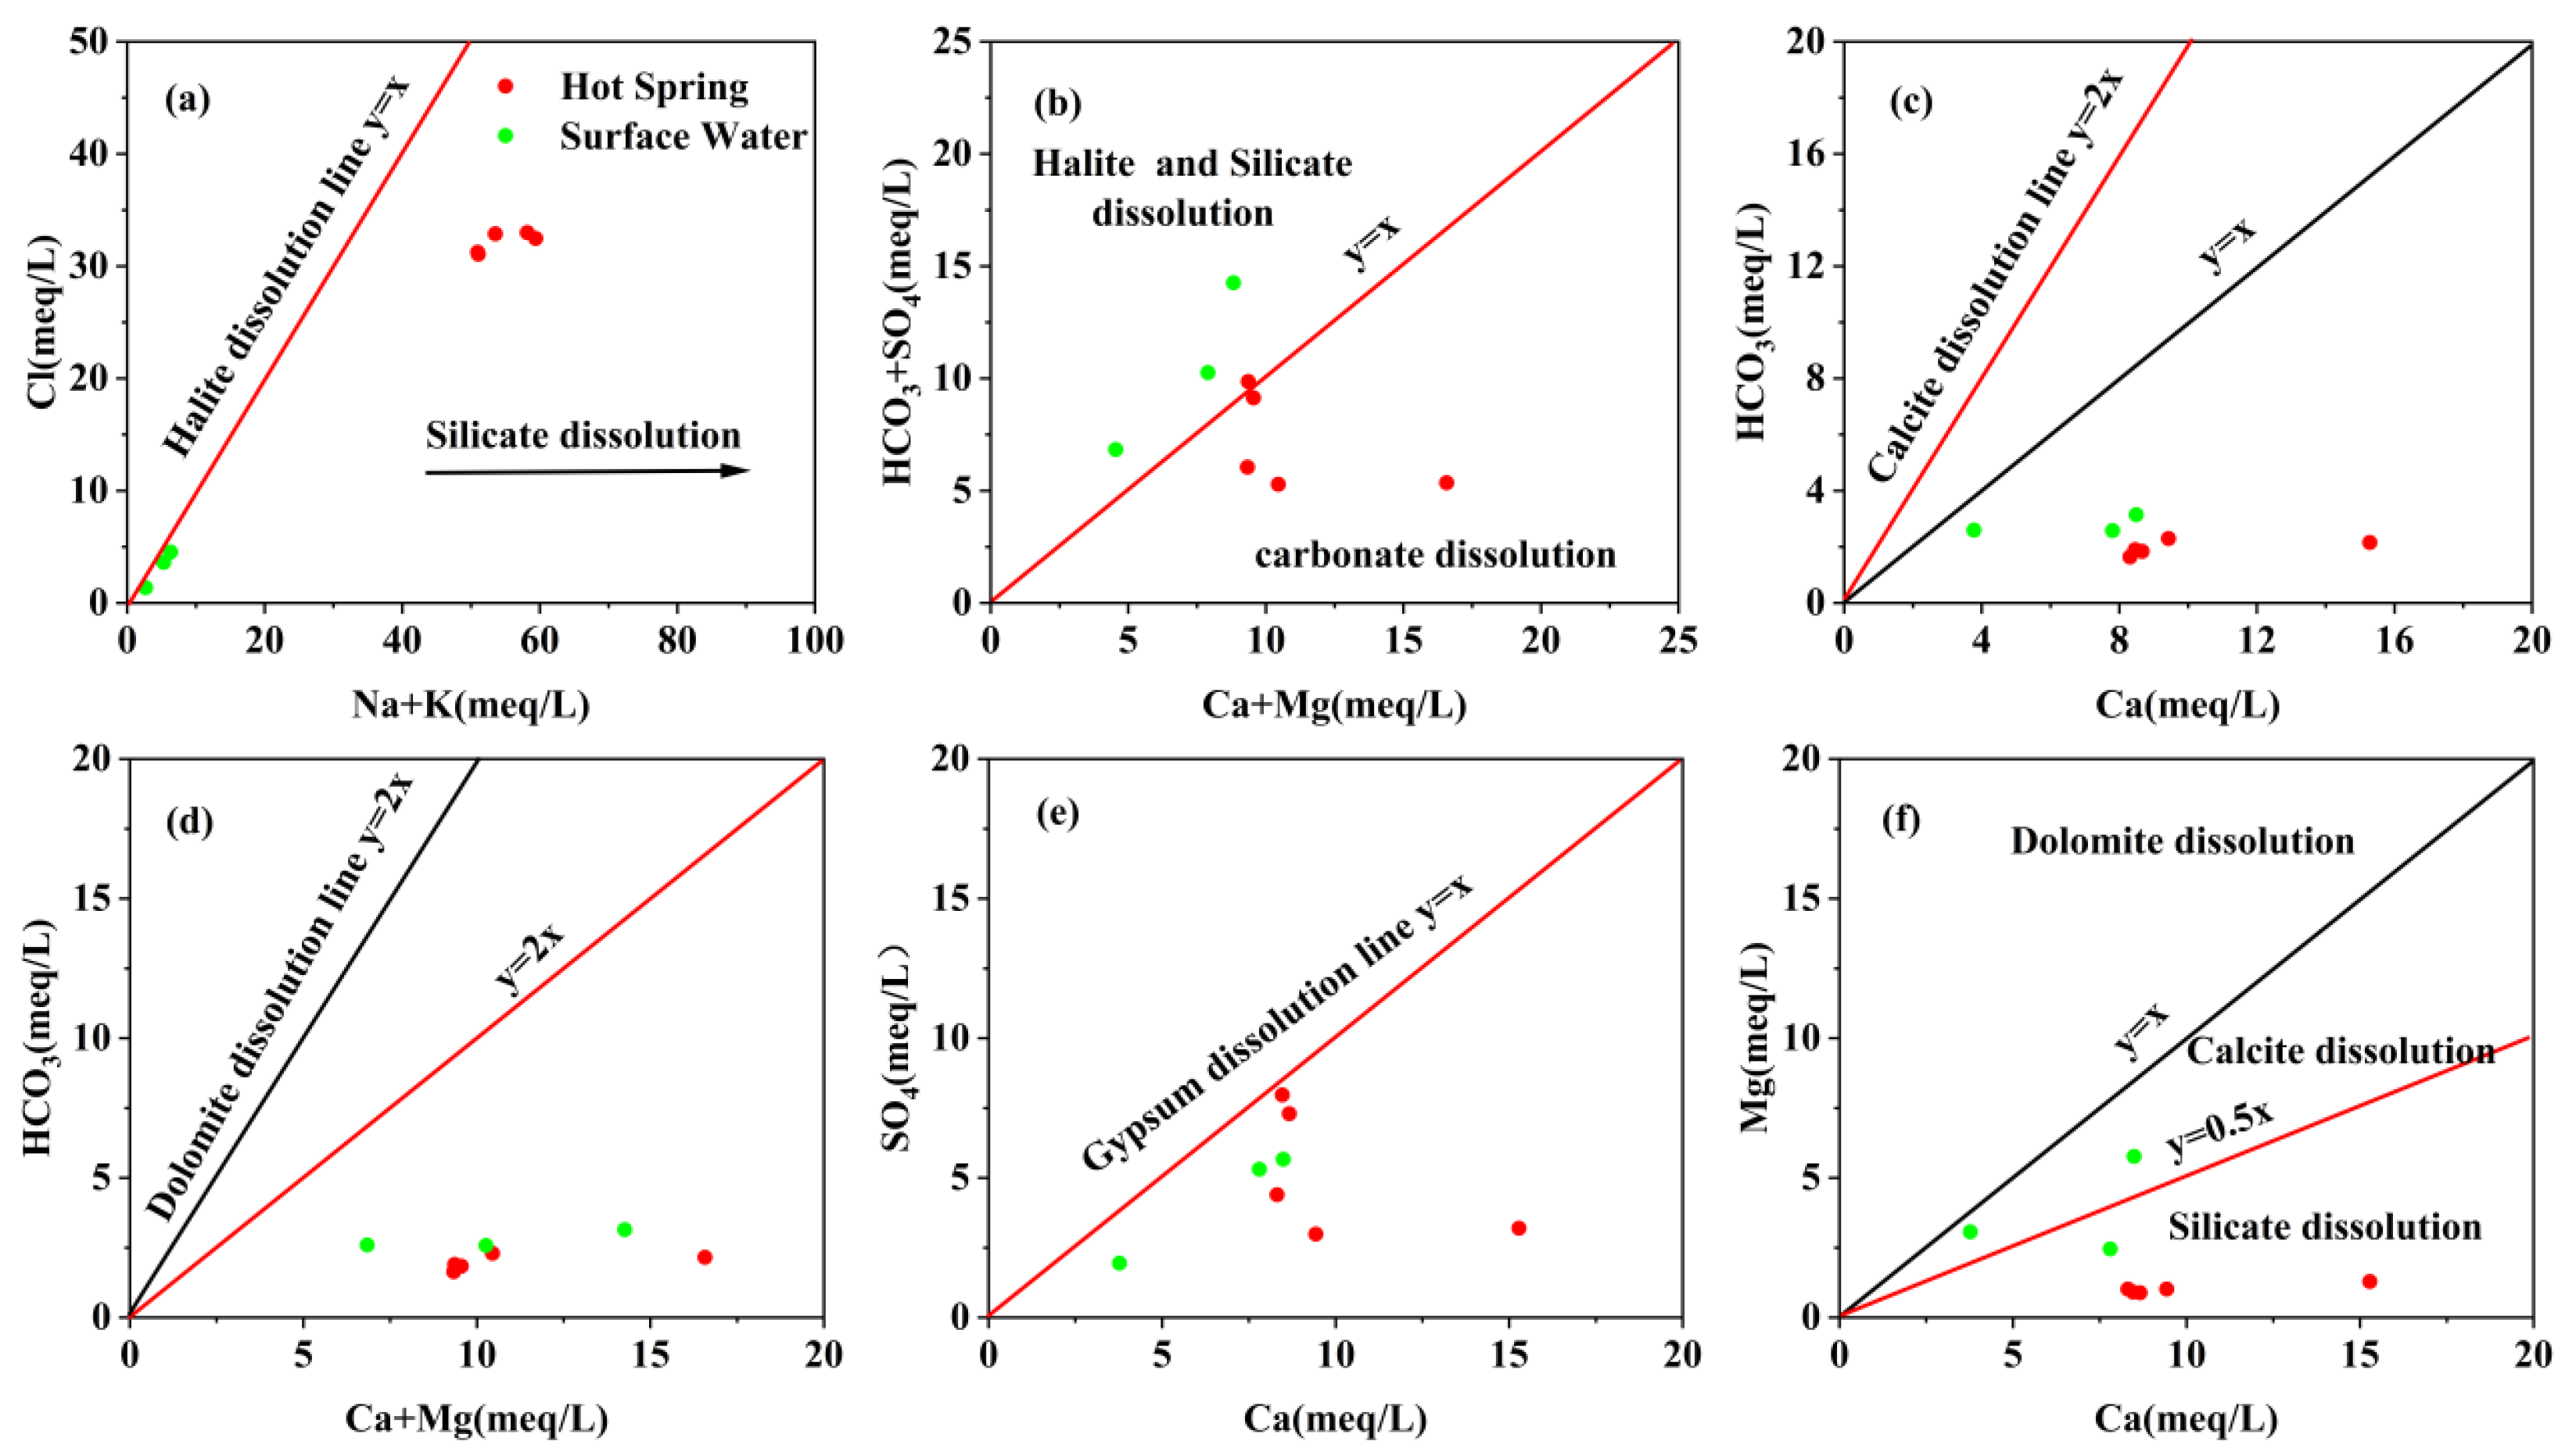
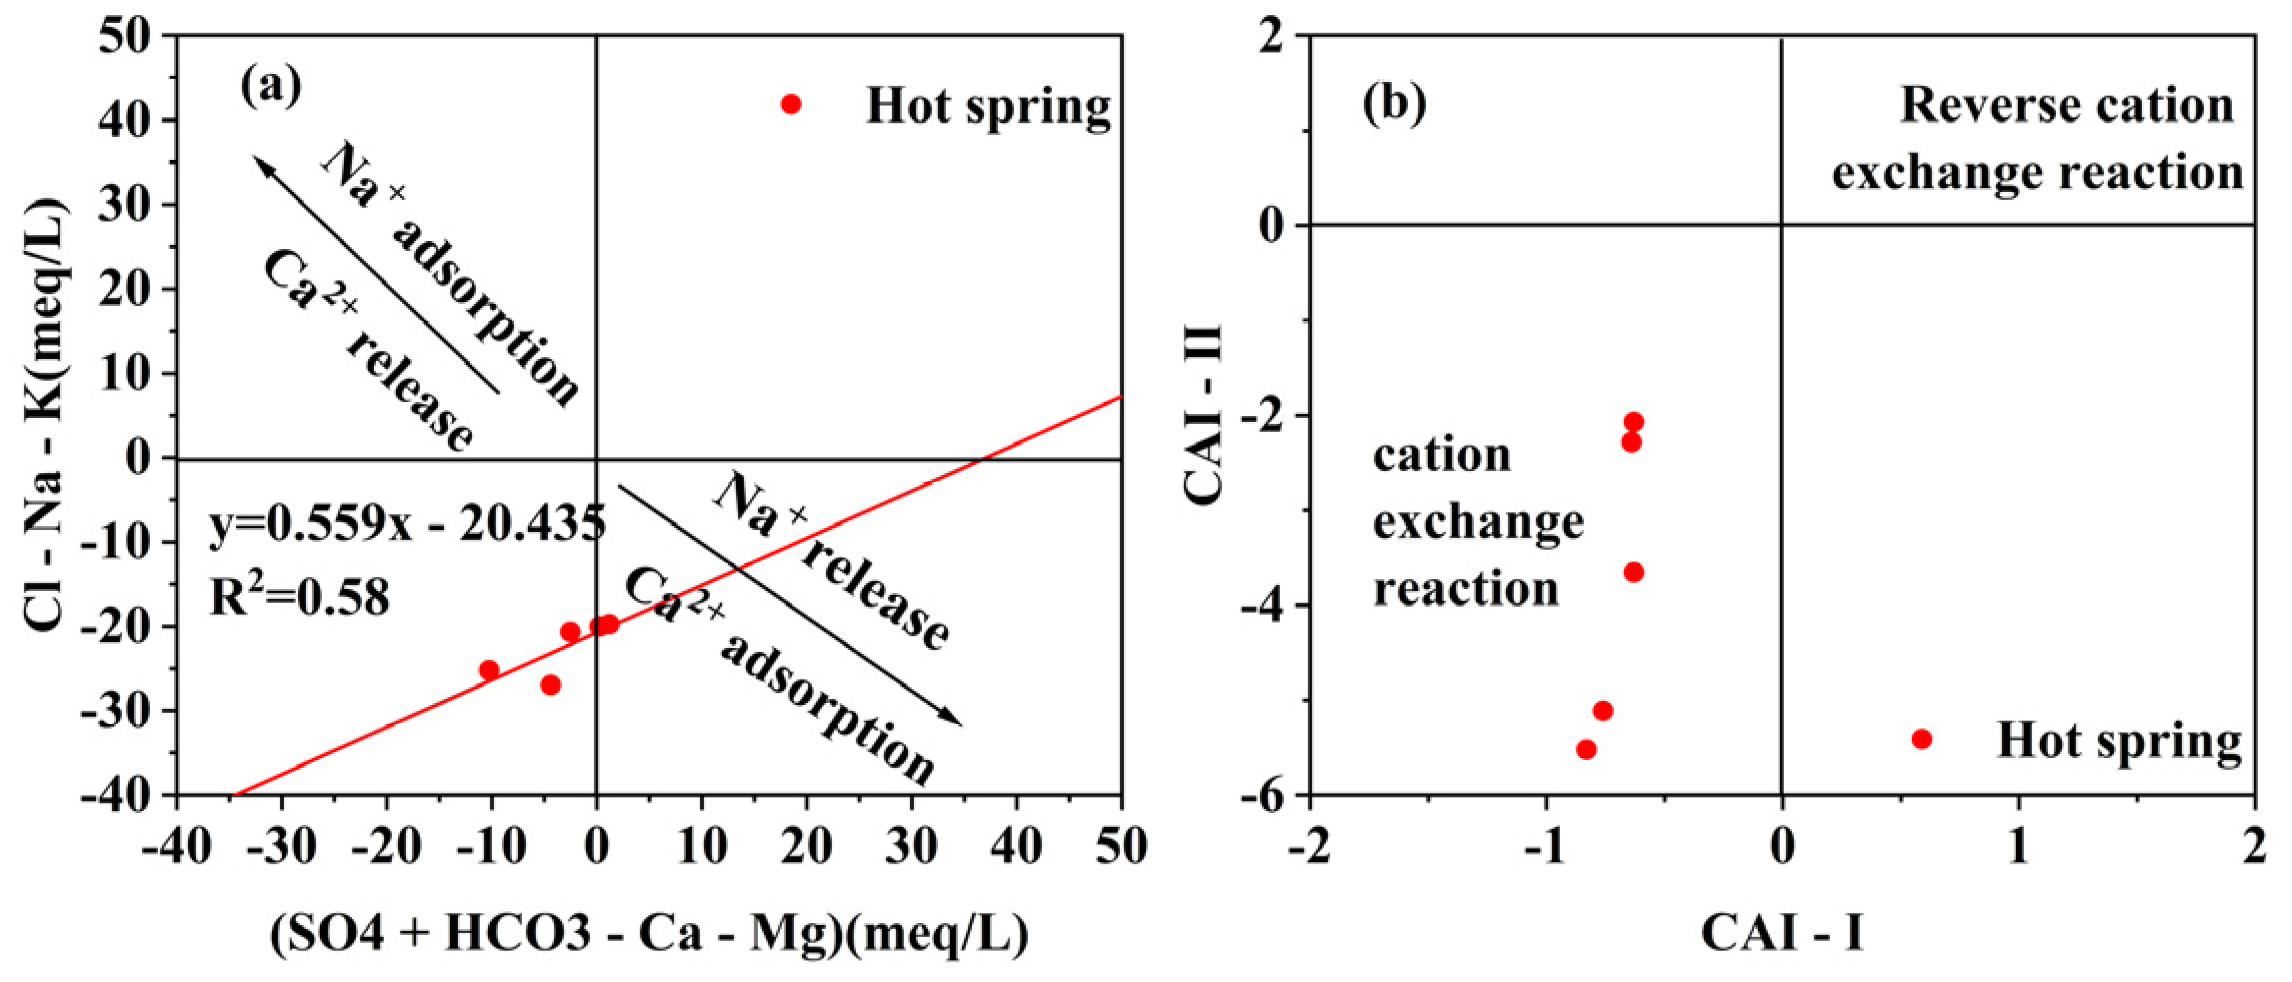
4.1. Hydrochemical Characteristics

The analysis of water sample testing in the study area (Table 1) reveals that the hot springs in Reshui Township have high temperatures ranging from 84 to 91 °C, with a pH value of 8.26 to 8.45. The total dissolved solids (TDS) in the hot springs are between 2924 and 3140 mg/L, categorizing them as weakly alkaline hot mineral water. The hydrochemical type of geothermal water in the study area is classified as Cl-Na type, with Na+ being the dominant cation and Cl- being the primary anion in the water samples (Figure 2). The relative abundance of major cations in the study area is as follows: Na+ > K+ > Ca2+ > Mg2+. Similarly, the major anions are ranked as follows: Cl >HCO3 > SO42− > NO3 (Figure 3). The TIS salinity plot is a crucial index for hydrochemistry classification, representing the sum of the concentrations of the major anions and cations expressed in meq/L [33]. As shown in Figure 4, the content of Na+ and K+ was higher than that of Ca2+ + Mg2+ on the whole, and the hot spring has very high ionic salinity which ranged from 100 to 140 meq/L. Figure 5 illustrates the location of the geochemical samples from the study area on the Cl-SO4-HCO3 ternary diagram [34]. The geothermal waters in the study area fall within the mature water field, suggesting a possible influence from magmatic intrusions. This indicates that the hydrochemical composition of the geothermal water is affected by interactions with subsurface rocks, including the intrusion of magmatic materials, which contribute to the mineral content and overall chemistry of the geothermal water in the region.
The Gibbs diagram can be employed to qualitatively analyze the influencing factors of water chemical composition in a water body and reveal the ion origin of the water [35]. From Figure 6, it is evident that the groundwater sample points in the study area mainly fall within the area where rock weathering is the dominant type. This indicates that the main source of groundwater ions is the weathering and dissolution of rocks, signifying that the hydrochemistry of groundwater in the area is controlled by the weathering and dissolution of rocks. Regarding the hot spring samples in Reshui Township, they are situated in the transition zone between the water–rock interaction area and the evaporation area, far away from the atmospheric precipitation area. This indicates that the chemical composition of geothermal water in the study area is mainly controlled by water–rock interaction and evaporation. The dissolution process of rock minerals plays a key role in controlling the hydrochemical characteristics of geothermal water, with the dissolution of evaporite minerals being the most significant hydrogeochemical process (Figure 7). Compared with surface water, the composition of geothermal water exhibits a significantly lower Ca2+/Na+ ratio. In addition to being controlled by the dissolution of silicate rock and evaporite rock, it may also be affected by the process of mineral precipitation and cation exchange, particularly when the geothermal water circulates to the deep and passes through the deep clay rocks, leading to the dissolution of feldspar and mica minerals.
The molar ratio relationship between (Na + K) and Cl is often used to reveal the source of Na and K in groundwater through rock salt dissolution [36]. Figure 8a shows that the geothermal water sample points in the study area slightly deviate from the y = x line, tending towards the Na + K axis. This suggests that there is rock salt dissolution in the geothermal water, but Na and K may also be provided by the dissolution of other minerals, such as silicate minerals (sodium, potassium feldspar, etc.). To determine the main source of Ca and Mg, the molar ratio of Ca and Mg is analyzed. The geothermal water sample points in the study area are located on and below the y = x line, indicating that the Ca and Mg mainly come from the dissolution of carbonates and some rock salts and carbonates (Figure 8b). The molar ratios between Ca and HCO3 and (Ca + Mg) and HCO3 are used to assess the influence of carbonate rock dissolution on the main ion components in water (Figure 8c,d). The high HCO3 content in the geothermal water in the study area may come from deep CO2 dissolution, and the relatively high content of Ca and Mg may be attributed to carbonate dissolution. The molar ratio of Ca and Mg further indicates the dissolution of carbonate, with an additional effect of silicate dissolution on Ca in geothermal water (Figure 8f). Regarding the molar ratio between Ca and SO4, which shows a linear relationship of y = x, it indicates that Ca and SO4 in groundwater are derived from the dissolution of gypsum (Figure 8e). However, the geothermal water samples in the study area deviate from the gypsum dissolution line, suggesting that the dissolution of gypsum minerals has a limited effect on Ca and SO4 in the geothermal water.
The ratio diagram of (S04 + HCO3-Ca-Mg) and (Cl-Na-K) is widely used to illustrate the impact of ion exchange on groundwater [37]. Figure 9a shows that all geothermal water samples in the study area are closely aligned with the ion exchange line, indicating the presence of cation exchange. To further determine the cation exchange type, the Schoeller indices CAI-I = (Cl-Na-K)/Cl and CAI-II = (Cl-Na-K)/(HCO3 + SO4-CO3 + NO3) were analyzed. In this study, the CAI-I and CAI-II values of all geothermal water samples were below zero (Figure 9b), indicating that positive cation exchange occurred. This resulted in an increase in Na and K content and a decrease in Ca and Mg content in the geothermal water.

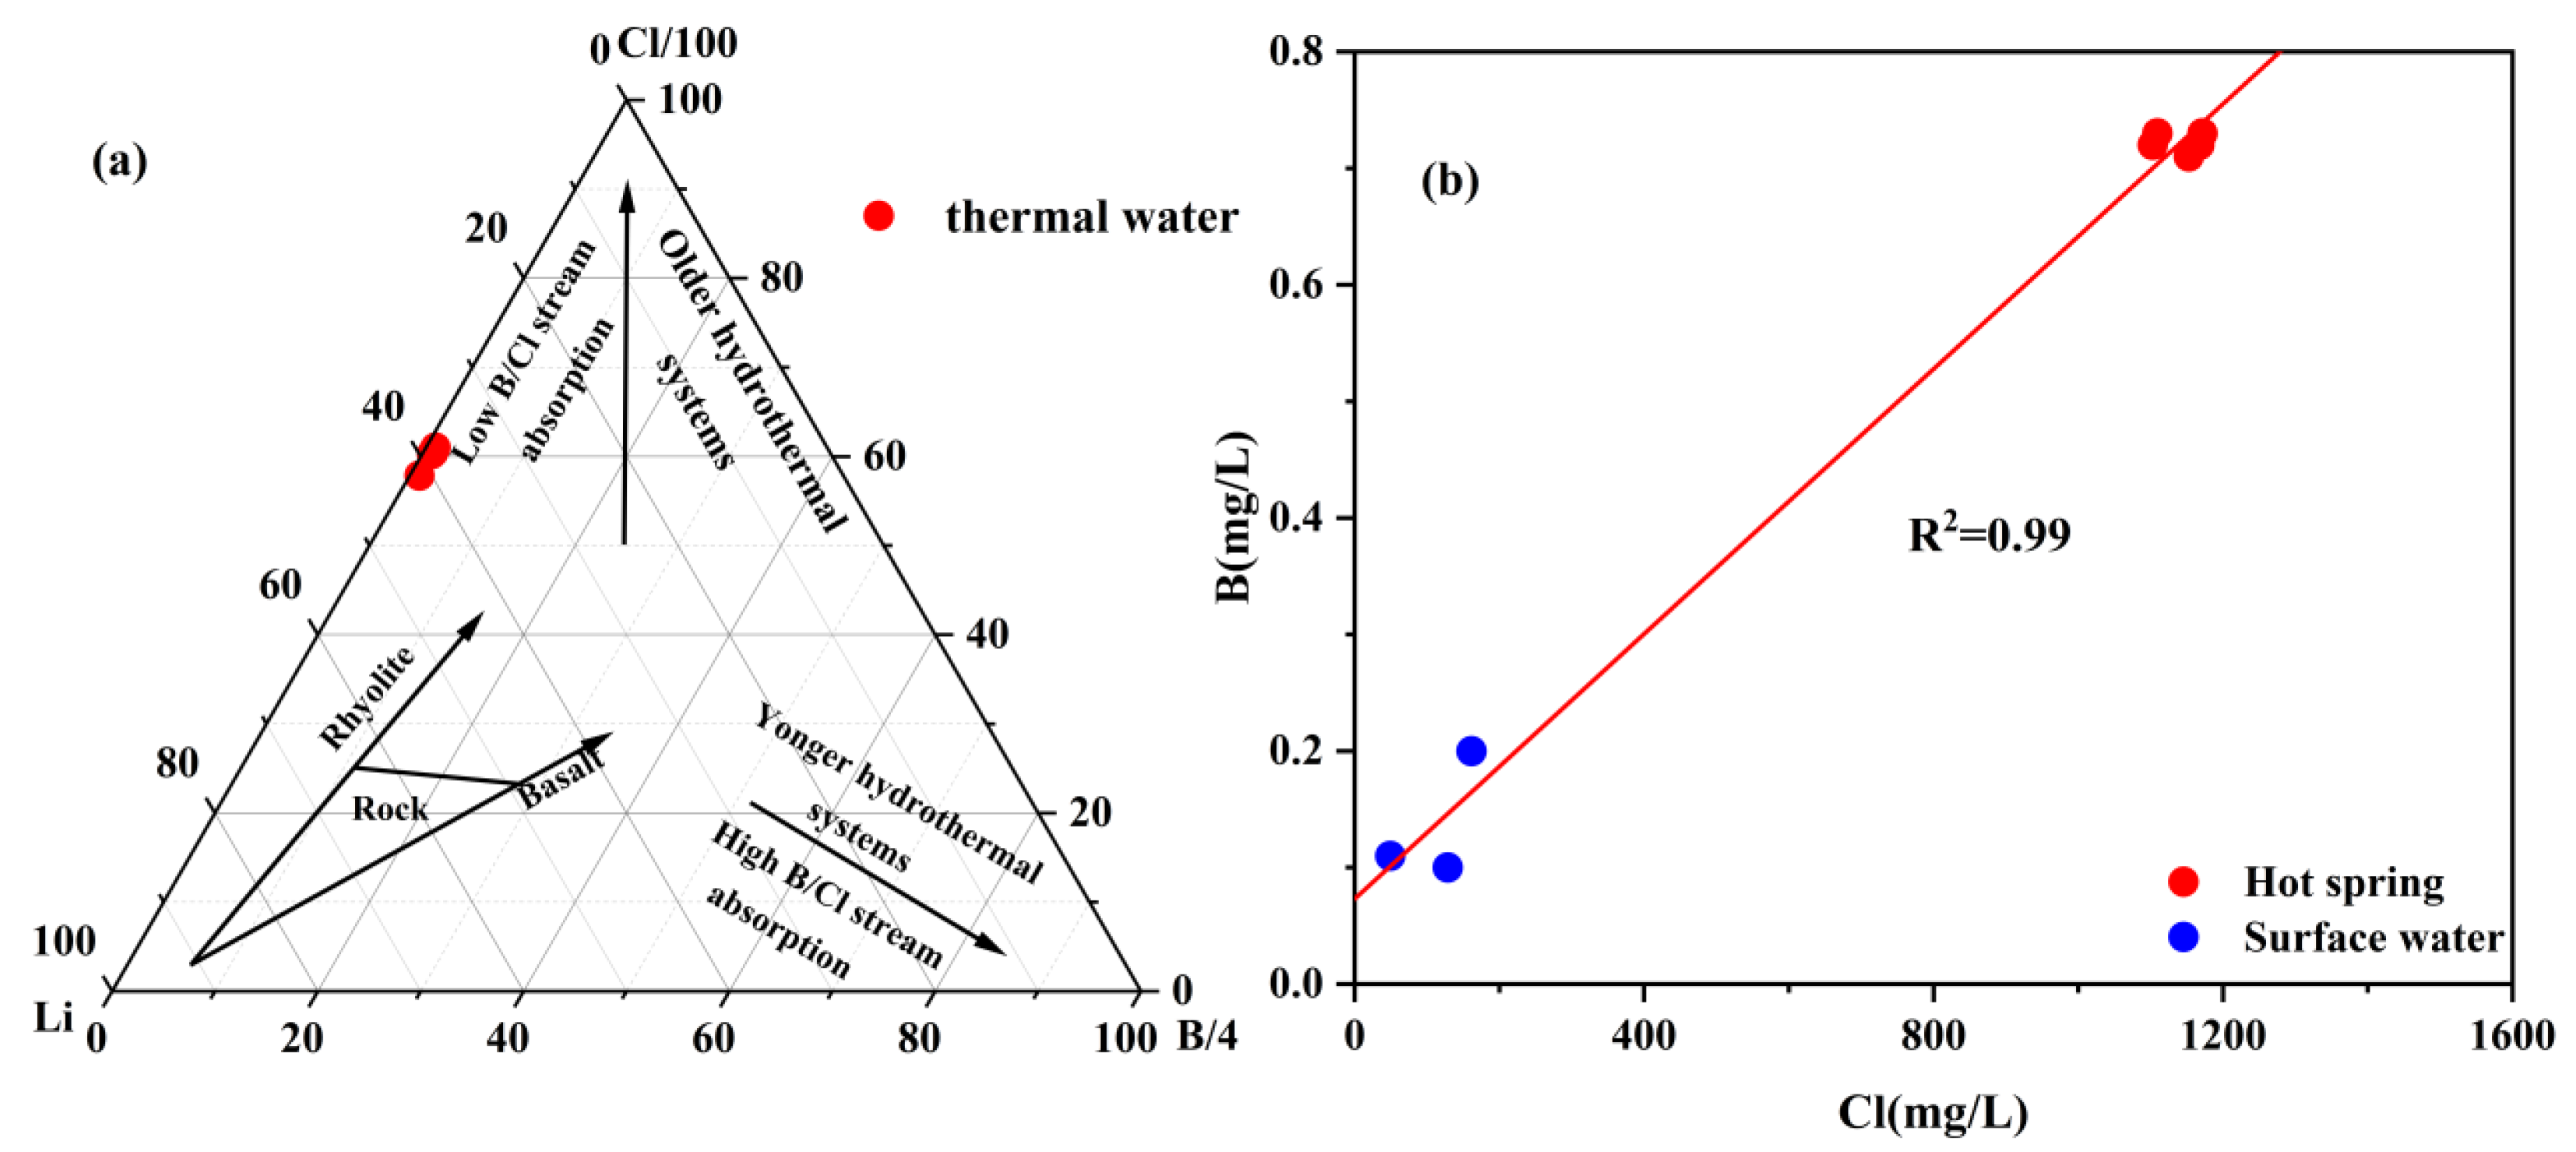
4.2. Characteristics of Trace Elements in Geothermal Water

The main trace elements studied in the geothermal water of the research area are F, B, Sr, and Li. The F content in the geothermal water in the study area is relatively high, with a concentration range of 2.5–6.72 mg/L, while the F content in surface water is relatively low, with a concentration range of 0.3–0.38 mg/L. The F content in geothermal water in the study area is much higher than 2 mg/L and can be classified as fluorine water, but it cannot be directly consumed. According to the ternary diagram of Cl-Li-B, it can be inferred that the geothermal water samples are located above the plagioclase porphyry area in the crust, indicating that the geothermal water in the study area is mainly composed of steam rich in Cl and B, which provides abundant sources of solutes for the geothermal water (Figure 10a). Additionally, a high positive correlation (R2 = 0.99) between B and Cl concentrations in the thermal and surface waters (Figure 10b) indicates mixing between the thermal and cold waters.

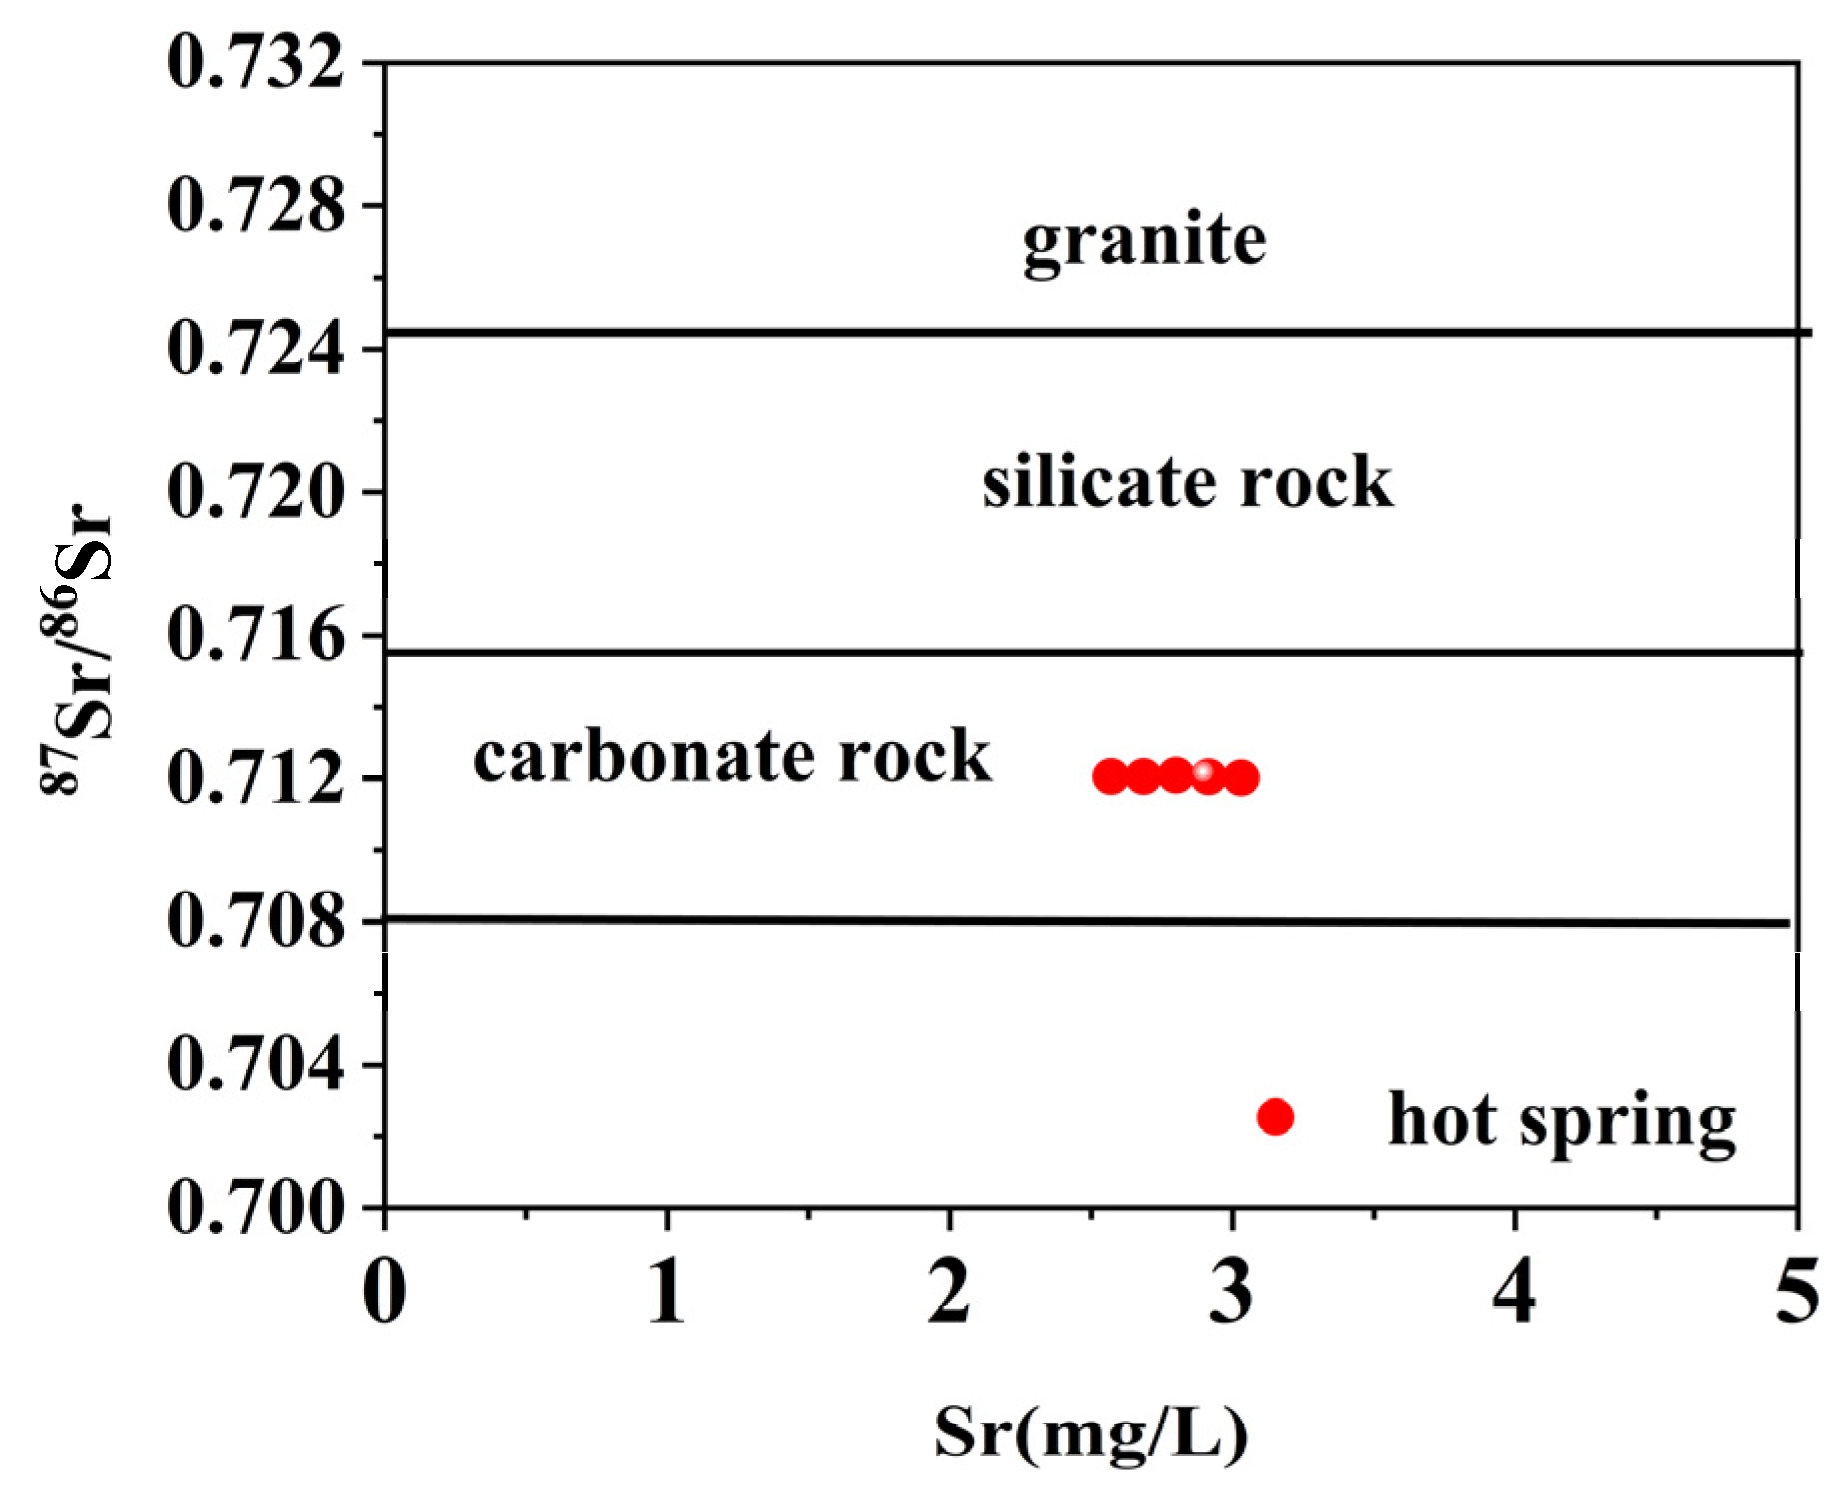
4.3. Strontium Isotope Analysis

Strontium is an element widely distributed on the Earth’s surface, existing in four isotopic forms, 84Sr, 86Sr, 87Sr, and 88Sr, with relative abundances of 0.56%, 9.86%, 7.02%, and 82.56%, respectively [39]. The radioactivity of strontium isotopes enables the study of water–rock interactions between groundwater and surrounding rocks, thus exploring the relationship between shallow and deep groundwater. From the analysis results presented in Table 2, it is evident that the 87Sr/86Sr ratio of geothermal water in the study area falls within the range of 0.712028 to 0.712054. The 87Sr/86Sr ratio in different lithologies also exhibits slight variations: 0.7245 in granite, 0.7088 in carbonate rock, and usually greater than 0.715 in silicate rock [40,41]. Notably, the Sr isotope ratio 87Sr/86Sr of hot spring water in the study area is numerically closer to the 87Sr/86Sr ratio found in carbonate rocks, and is smaller than the ratio in granites. This indicates that the reservoirs are dominated by carbonate rocks (Figure 11).

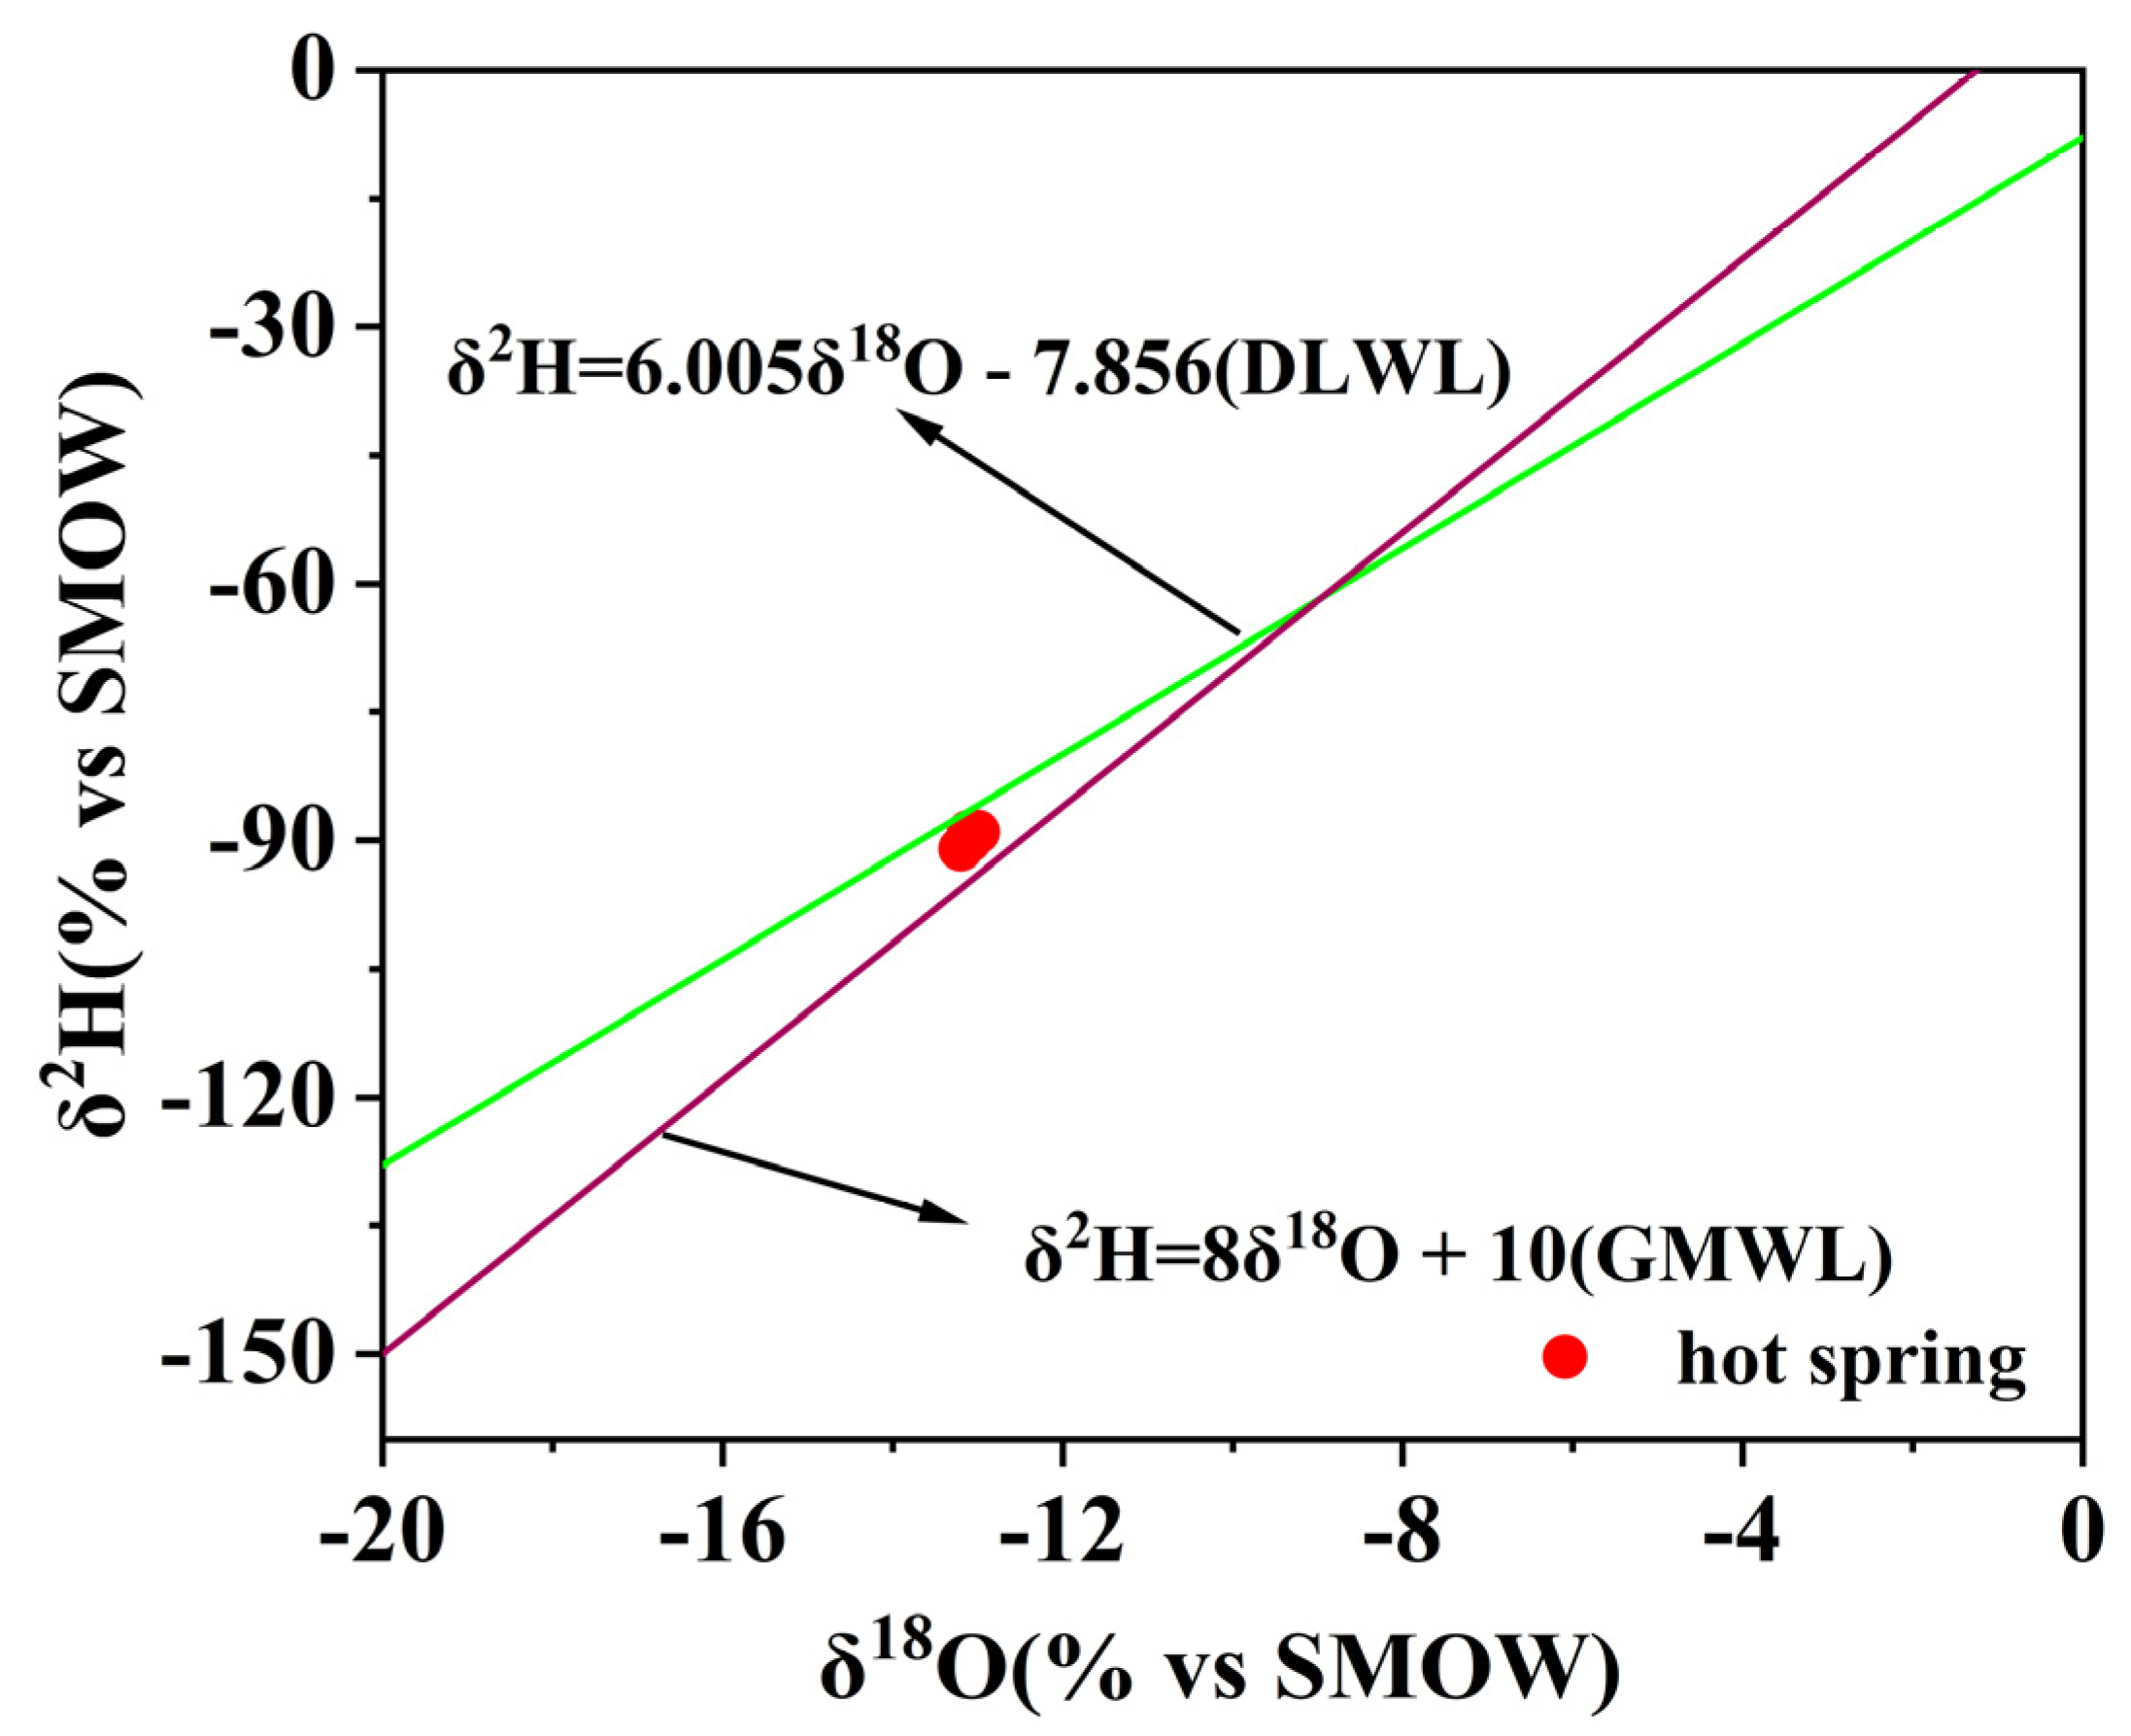
4.4. Hydrogen and Oxygen Isotope Characteristic

4.4.1. Recharge Source of Geothermal Water

Identifying the source of geothermal water recharge is of great significance for understanding the evolution process of the geothermal water cycle, and the analysis of hydrogen and oxygen stable isotope composition can effectively reveal the source and mixing process of geothermal water [41,42,43]. When the hydrogen and oxygen isotope results of the water samples in the research area are plotted on a graph (Figure 12), the hot spring water samples of Reshuixiang are located near the local atmospheric precipitation line and are positioned at the lower right. This suggests that geothermal water in this area may be recharged by both atmospheric precipitation and snowmelt water.
The δ18O content in hot water is much smaller than that of oxygen-containing minerals, such as δ18O of carbonate minerals, which is around 29‰, and δ18O of silicate minerals, which is in the range of 8–12‰ VSMOW [44]. As a result of isotope exchange, the δ18O in water significantly increases, leading to δ18O oxygen drift. However, the content of δ2H in rock-forming minerals is very low, and feldspar, for example, does not contain hydrogen. Only a small amount of hydrogen-containing rock-forming minerals, such as biotite and hornblende, have δD content in granite and primary silicate of less than 10%. Thus, in the study area, the isotope exchange of δ2H is not significant. When δ18O is enriched due to water–rock isotope exchange reactions, the value of δ2H remains relatively unchanged.
Dansgaard (1964) first defined the parameter “d” on the precipitation line, which is called the deuterium excess parameter (d = δ2H—8δ18O) [45]. The d value of geothermal water in the study area ranges from 14.6‰ to 15.8‰, with an average of 15.2‰, indicating that the geothermal water in the study area flows relatively slowly and remains in the aquifer for an extended period.
Figure 12.18O – δ2H) plot for thermal waters from study area. (GMWL: the global meteoric water line, δ2H = 8δ18O + 10 [46]. DLWL: The dulan atmospheric precipitation line δ2H = 6.005δ18O – 7.865 [47]).
Water 15 03084 g012

4.4.2. Recharge Elevation in Geothermal Water

With the increase in altitude, the content of hydrogen and oxygen isotopes in the atmosphere undergoes changes characterized by a decrease in δ18O and δ2H values in atmospheric precipitation [48]. By utilizing this feature, the elevation in atmospheric precipitation from the source of hot spring recharge, namely, the elevation in groundwater recharge, can be calculated. The calculation formula is as follows:
H = δ G δ P K + h
where H is the recharge elevation (m), h is the reference point’s elevation (m), δG is the δ18O value of sampled geothermal waters (‰), Take −6.65‰ this time, K is the isotopic elevation gradient (‰/100 m), This study takes −0.29‰/100 m [49,50].
The calculated result from Equation (1) indicates that the geothermal water recharge elevation in the study area is about 6151–6255 m (Table 2). The study area belongs to the typical East Kunlun orogenic belt, with surrounding mountainous areas ranging from 6000 to 8000 m in elevation. Therefore, the area where the surrounding mountains rise between 6151 and 6255 m constitutes a widely supplied area of geothermal water in the region.

4.4.3. Geothermal Water Recharge Temperature

The temperature of the recharge area can be estimated based on the temperature effect of the δ2H and δ18O values of atmospheric precipitation. Based on this effect, domestic and foreign scholars have established a linear relationship between the δ2H and δ18O values of atmospheric precipitation and air temperature [51,52,53]:
δ 18 O = 0.521 T 14.96
δ 2 H = 3 T 92
Equation (2) is the relationship between the δ18O of atmospheric precipitation in the Northern Hemisphere established by Yurtsever and the average temperature, where t represents the monthly average temperature. Equation (3) is the relationship between Chinese atmospheric precipitation and average temperature established by Zhou et al, where T represents the monthly average temperature. The temperatures of the recharge area calculated using Equations (2) and (3) are shown in Table 2. The results obtained using the two methods are quite close, and the average temperature between them is taken as the recharge area temperature of the geothermal water within the area, which is between 3.8 and 5.9 °C.

4.5. Residence Time of Geothermal Water

The tritium isotope value can provide a rough estimate of the time of geothermal water formation [54]. According to the empirical estimation method proposed by J.CH, tritium values within the range of 0–5 TU indicate a dominance of “ancient water” from approximately 40 years ago, while values between 5 and 40 TU suggest a mixing effect between newly infiltrated water and ancient water. When tritium values exceed 40 TU, it indicates a dominance of newly infiltrated water [55]. In many cases, this estimation method proves to be of practical value. In the study area, the tritium value of the geothermal water ranges from 5 to 7.5 TU, with values closer to 5 TU. This suggests that the geothermal water is a mixture of recent and ancient water, with ancient water being dominant and recent water showing less replenishment.

4.6. Estimation of Reservoir Temperatures

Cation thermometers and silica solute thermometers are commonly used to estimate the thermal reservoir temperature of geothermal water [56]. However, accurate estimation of the temperature in geothermal hydrothermal reservoirs requires understanding the equilibrium state of the water sample. The Na-K-Mg diagram is widely employed to assess the equilibrium state of hot water [57]. As shown in Figure 13, the surface water in the study area represents typical immature water, while most of the hot spring water is partially balanced water, and a small portion remains immature water. These findings indicate that the water–rock interaction in the geothermal water of the study area has not reached complete balance and is influenced by various factors. Consequently, the thermal storage temperature estimated using cationic geothermal scales has limitations. On the other hand, the silica thermometer is significantly affected by the precipitation–dissolution balance and the mixing of silica. This leads to a notable distortion of the heat storage temperature when applying the thermometer to hot water mixed with cold water. In contrast, the Na-K thermometer is less influenced by mixing and evaporation. While minerals like albite and microplagioclase undergo a rebalancing process during the cooling of hot water, the Na-K ratio remains unaffected by boiling and conduction cooling [58]. As a result, the Na-K thermometer may record the temperature of the deeper heat storage. Therefore, this paper uses the silicon enthalpy model, SiO2 geothermal temperature scale, multi-mineral balance method, and Na-K, Na-K-Ca and Na-Li thermometers to evaluate the heat storage temperature of groundwater in the study area from multiple angles. By comparing the thermal storage temperature range estimated using different calculation methods, a more accurate geothermal reservoir temperature can be obtained.

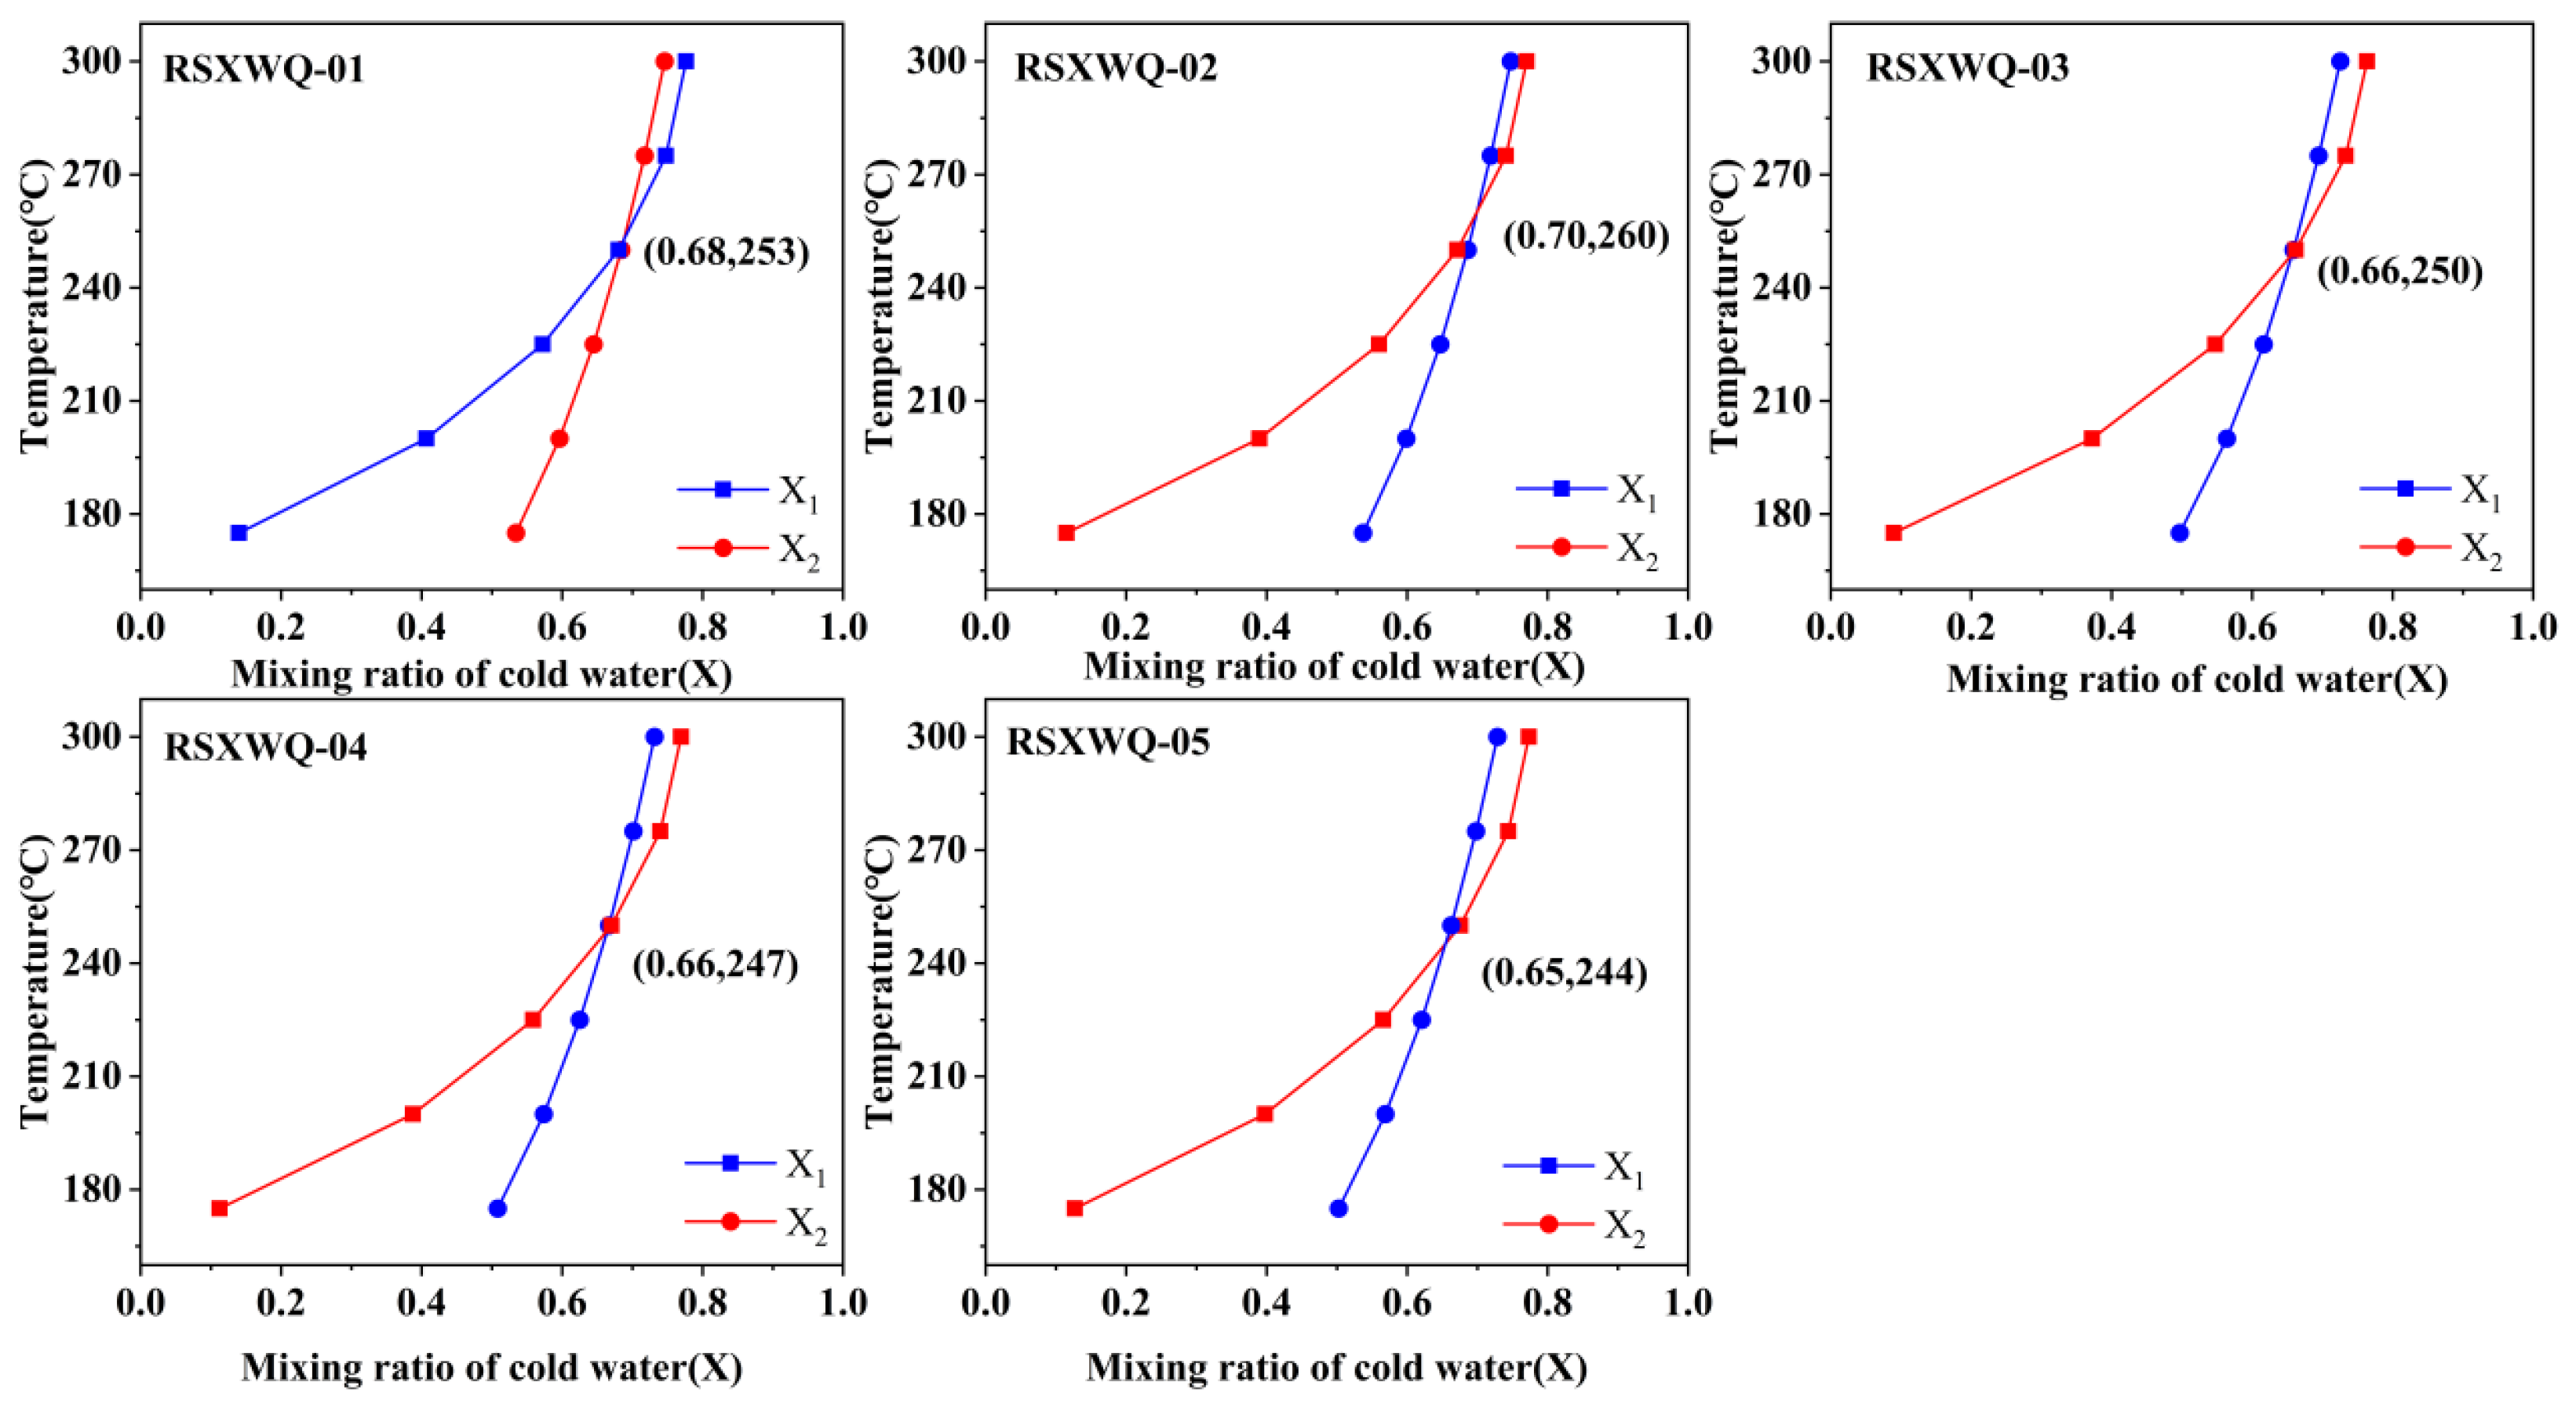
4.6.1. Mixing Ratio of Hot and Cold Water

This article employs the silica enthalpy equation method to estimate the mixing ratio of cold water, which is based on the quartz solubility curve and the enthalpy value curve of hot water to calculate the mixing ratio of cold water and the reservoir temperature. The formula for this calculation is as follows [59]:
H c X + H h ( 1 X ) = H S S i O 2 c X + S i O 2 h ( 1 X ) = S i O 2 S
where HC is the enthalpy of the cold water (J), Hh is the enthalpy of the deep thermal water (J), HS is the enthalpy of the spring water (J), SiO2C is the SiO2 concentration of the cold groundwater (mg/L), SiO2h is the SiO2 concentration of the deep thermal water (mg/L), and SiO2S is the SiO2 concentration of the springs (mg/L). By sequentially substituting the relationship data between hot water temperature, enthalpy, and SiO2 content into the equations, the curve of their changes with temperature can be obtained (Figure 14). The values corresponding to the intersection point of the two curves are the cold water mixing ratio and the hot storage temperature. This method provides valuable insights into the contribution of cold water and the thermal characteristics of the geothermal water in the study area. From Figure 12, it can be seen that the thermal storage temperature range of geothermal water is 244–253 °C, and the mixing ratio of cold water is 65–70%.

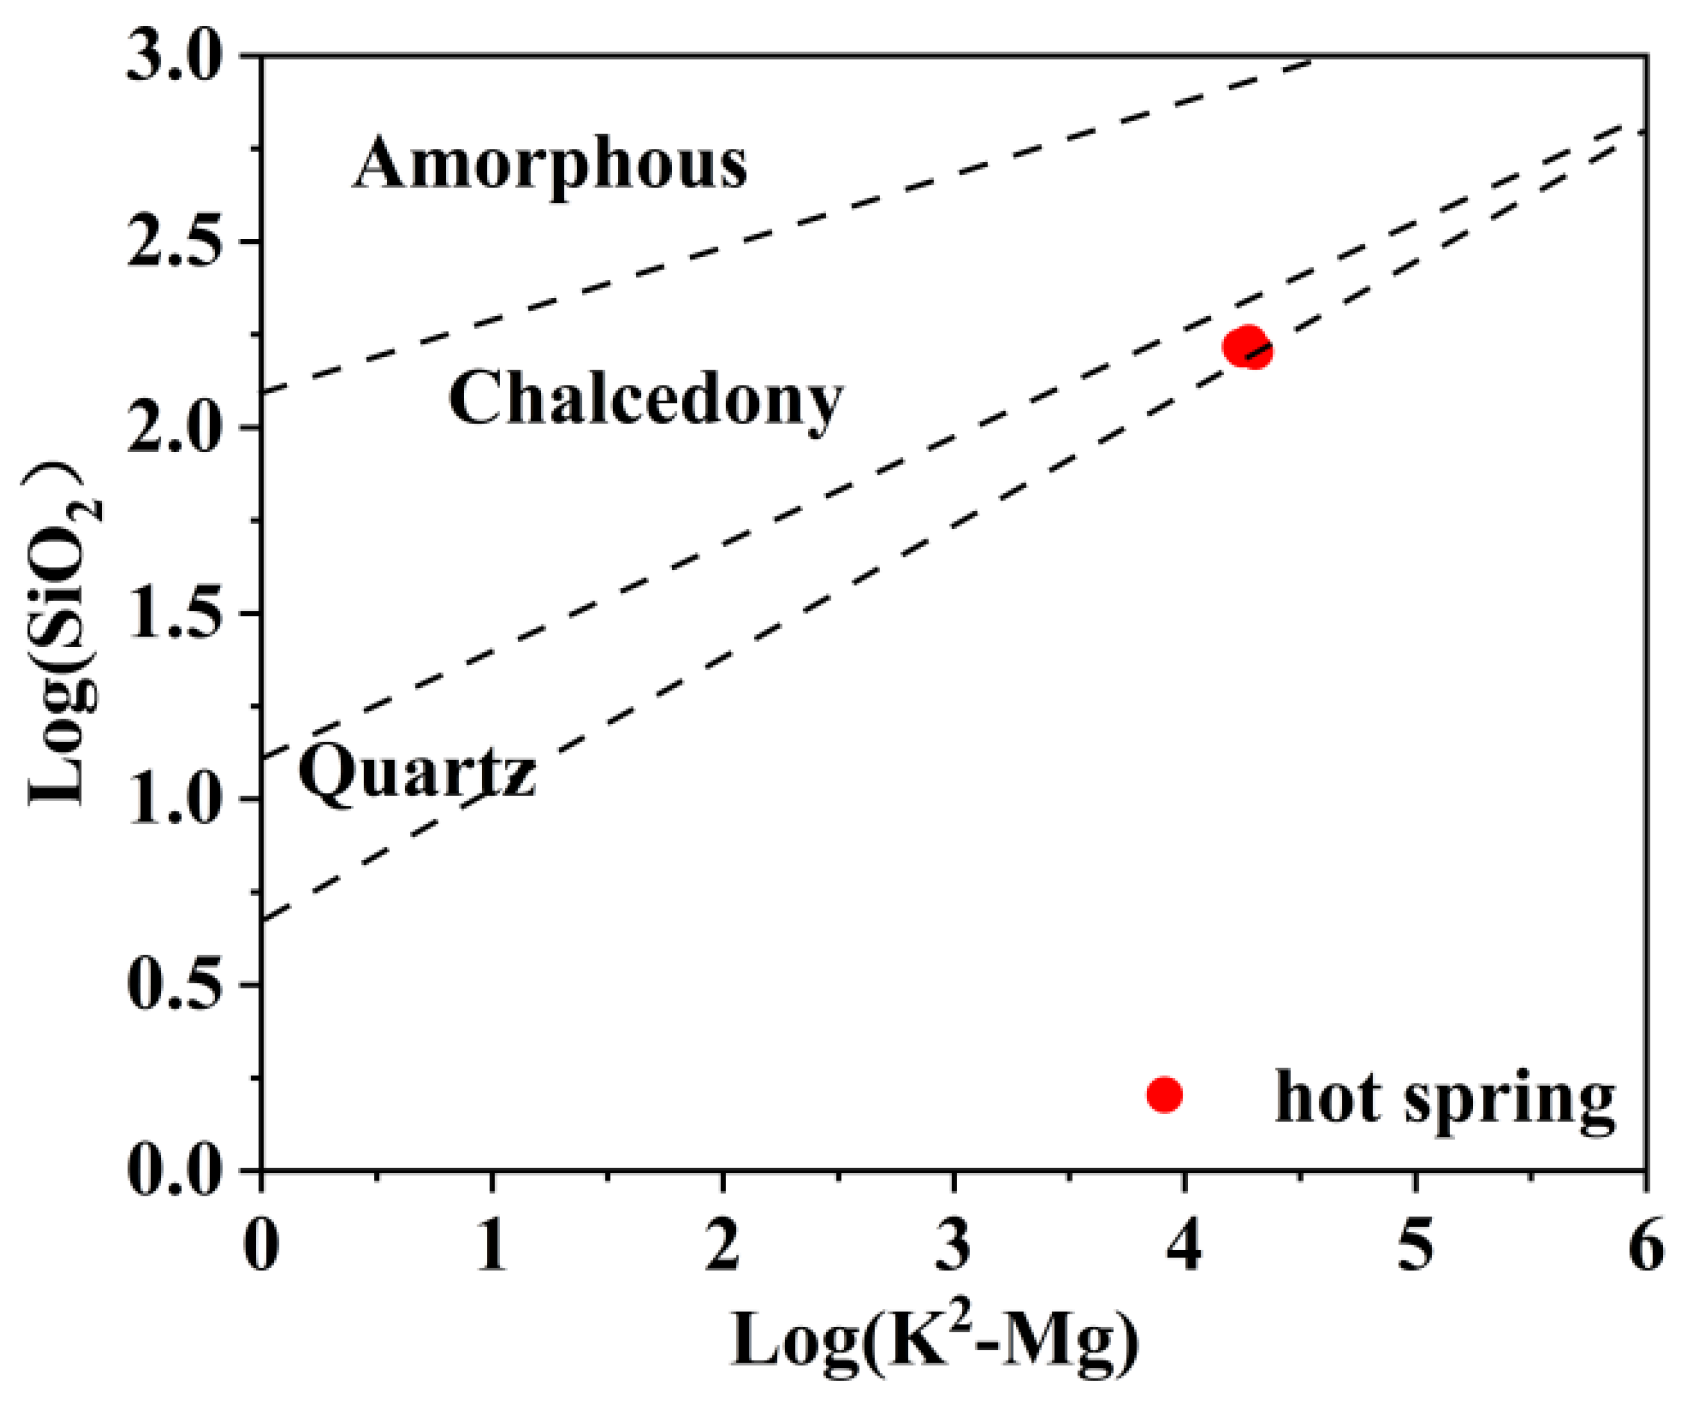
4.6.2. SiO2 Geothermal Temperature Scale

Based on the analysis above, this paper utilizes the SiO2 geothermal temperature standard to calculate the thermal reservoir temperature of geothermal water in the area. The usual calculation formula is as follows: [60,61,62,63,64]:
T Q u a r t z n o = 1309 5.19 log S iO 2 273.15 ( 25 250   ° C )
T Q u a r t z max = 1522 5.72 log S i O 2 ( 25 250   ° C )
T C h a l c e d o n y = 1032 4.69 log S i O 2 273.15 ( 0 250   ° C )
T C a l i b r a t e   silicon = 42.198 + 0.28831 S i O 2 3.6686 × 10 4 ( S i O 2 ) 2 + 3.1665 × 10 7 ( S i O 2 ) 3 + 77.034 log S i O 2
The temperature of the geothermal reservoir in the area under study has been determined utilizing Formulas (5) to (8) and is presented in Table 3. The solubility curve of SiO2 can indicate the dissolution state of minerals and which mineral controls the SiO2 content in the solution [65]. As shown in Figure 15, all geochemical samples from the study area fall within the quartz field, indicating that quartz may be the mineral controlling the SiO2 content in the underground hot water. Therefore, using a quartz geothermometer to calculate the geothermal reservoir temperature of underground hot springs is a more practical reference point. As a result of the significant mixing of hot and cold water in the research area, SiO2 levels in hot springs experienced a significant reduction. Therefore, the geothermal reservoir temperature calculated using the SiO2 geothermometer is much lower than that calculated using the silicon-enthalpy equation method that considers mixing effects. To accurately determine the temperature of the geothermal water reservoir in the area, this paper calculates the geochemical composition of hot water without mixing it with cold water. The SiO2 temperature scale method is then used to estimate the thermal reservoir temperature. The corrected SiO2 temperature scale method produces a thermal reservoir temperature range of 245–261 °C.

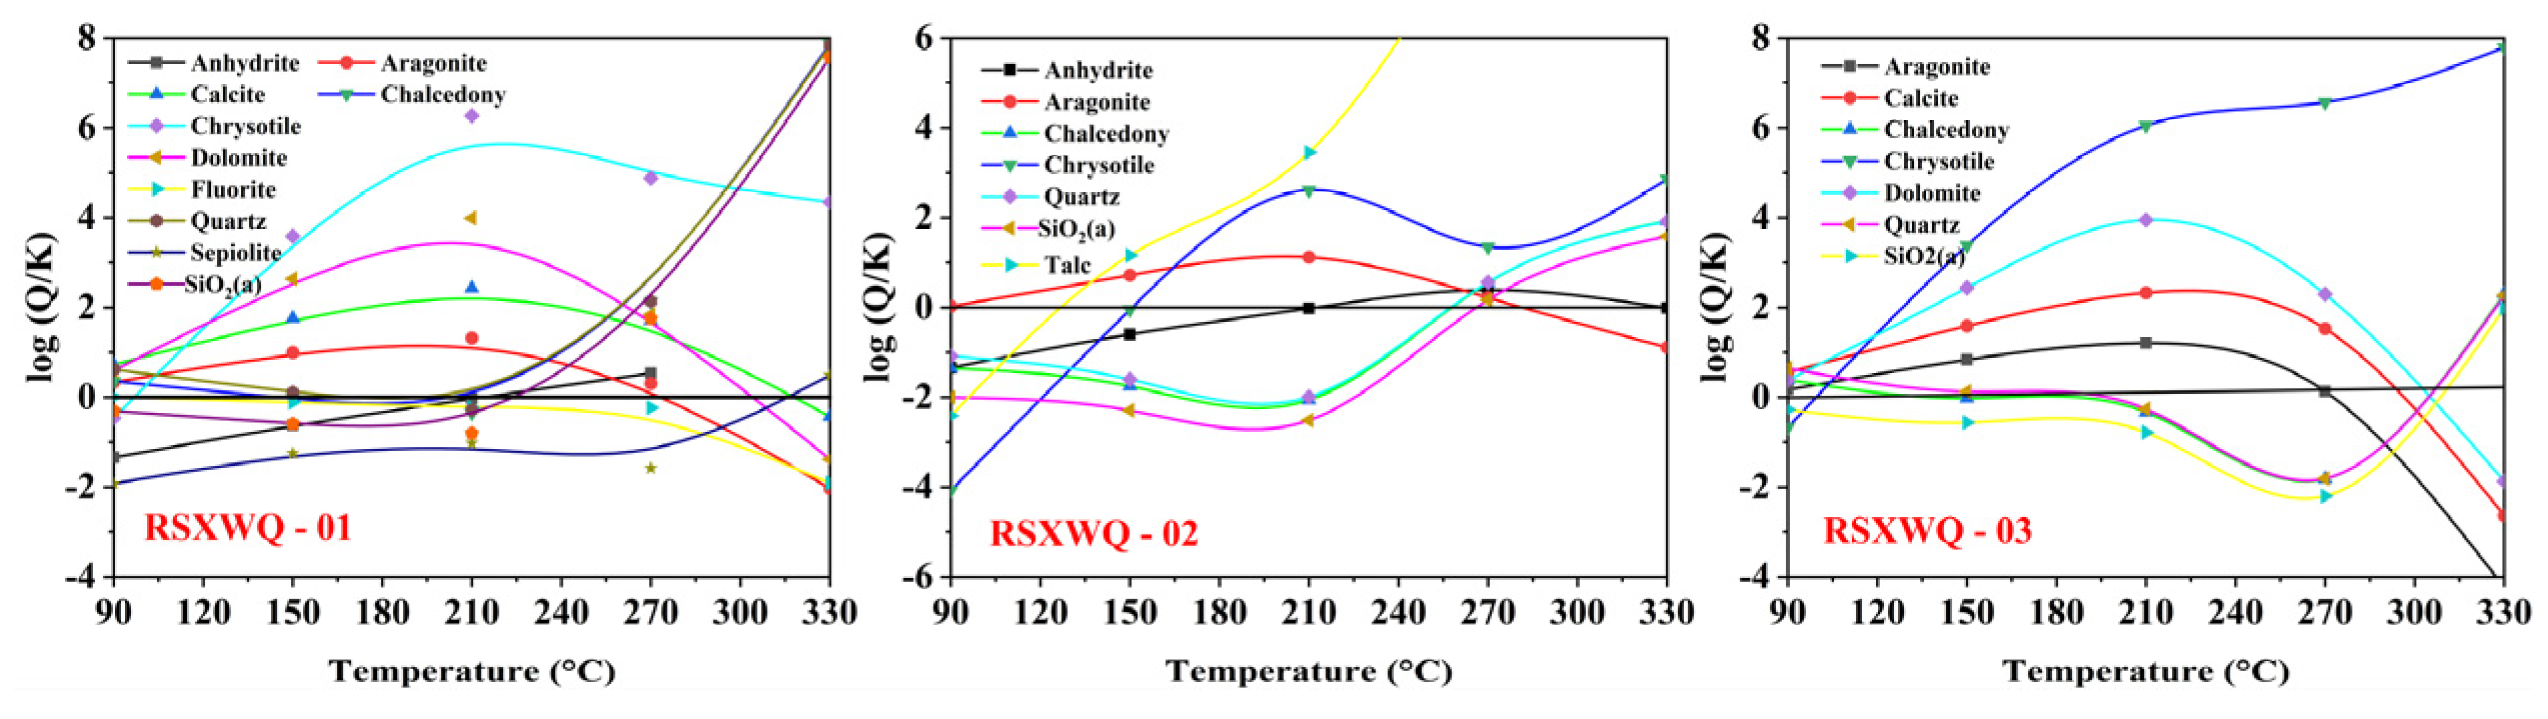
4.6.3. Multi-Mineral Equilibrium Method

The multi-mineral equilibrium method can be used to determine the chemical balance between minerals and geothermal fluids [66]. Considering the tendency of minerals to dissolve according to temperature, if a group of minerals reaches equilibrium at a given temperature, then the geothermal fluid also reaches equilibrium with these minerals [67]. The temperature in equilibrium at this point represents the temperature of the geothermal reservoir. The saturation index (SI) is a parameter used to determine the level of mineral saturation. When SI = 0, the mineral is saturated; if SI > 0, the mineral is oversaturated; and if SI < 0, the mineral is undersaturated. By using PHREEQC software to calculate the saturation index of various minerals and plot a graph showing the mineral–hydrothermal saturation index at equilibrium, it is possible to ascertain the thermal storage temperature of the geothermal field at that time. According to Figure 16, the thermal reservoir temperature of geothermal water ranges from 129 °C to 329 °C. However, the degree of convergence among various minerals at a particular temperature is weak; therefore, the temperature estimated using the multi-mineral equilibrium method is only indicative.

4.6.4. Other Thermometers

Na-K, Na-K-Ca, and Na-Li thermometers are of great significance for estimating the heat storage temperature of high-temperature geothermal systems [68]. In order to make the calculation results more realistic, we also chose the above thermometers to calculate the heat storage temperature of geothermal water. The calculations are carried out as follows:
Na - K : T = 1217 log N a K + 1.483 273.15
Na - K - Ca : T = 1647 log N a K + β ( log C a N a + 2.06 ) + 2.47 273.15
Na - Li : T = 1509 log ( N a L i ) + 0.779 273.15
The calculation results are summarized in Table 4. In conclusion, the geothermal heat storage temperature estimated using the silicon enthalpy model is approximately 244–260 °C, and the geothermal heat storage temperature estimated using the SiO2 geothermal temperature scale is about 245–261 °C. The multi-mineral balance method gives a wide range of estimated heat storage temperatures, ranging from 129 to 329 °C, but it should be considered as a reference due to the significant mixing with cold water. The heat storage temperature estimated by the Na-K thermometer is about 223.0–234.0 °C, while the Na-K-Ca thermometer gives an estimate of about 206–214 °C. On the other hand, the heat storage temperature estimated by the Na-Li thermometer is about 254.0–270.0 °C. We found that the temperature range estimated by the quartz temperature scale, silicon enthalpy model, and Na-Li thermometers is basically the same. Considering the influence of mixing with cold water in the geothermal water, this study takes the average value of the calculation results from the above three methods as the heat storage temperature of geothermal water in the study area, which is 234.4–247.8 °C.

4.7. Geothermal Water Circulation Depth

The geothermal water in the study area is heated primarily through deep circulation processes. As a result, the following formula can be used to calculate its depth of circulation [69]:
Z = G ( T T 0 ) + Z 0
Z represents the depth of circulation (m); Z0 represents the depth of the isothermal zone (m), which is taken as 35 m in this paper; T represents the temperature of the geothermal reservoir (°C); T0 represents the temperature of the isothermal zone (°C), which is taken as 8 °C in this paper; G represents the geothermal gradient (°C/100 m), which is taken as 3.08 °C/100 m in this paper [70]. In summary, the geothermal water in the study area undergoes a complex process as it ascends to deeper depths. The circulation depth is estimated to be between 7385 and 7816 m. During this ascent, the geothermal water experiences cooling, conduction, and mixing with cold water. Additionally, it interacts with the surrounding rocks, leading to changes in its hydrochemical characteristics. The culmination of these processes results in a reservoir temperature range of 234.4–247.8 °C at the mentioned depths of 7385–7816 m.

4.8. Geological Genetic Model of the Geothermal Fluids

The East Kunlun fault zone is located in the second largest regional gravity gradient zone of China and serves as a crucial boundary for crustal structure. It is classified as a highly active fault zone [71,72]. The dominant ion source in the local geothermal water is attributed to the dissolution of carbonate minerals and rock salts, as demonstrated by ion ratio analysis and hydration characteristics. Hydrogen and oxygen stable isotope characteristic findings indicate that the geothermal water is primarily recharged by atmospheric precipitation. Moreover, the tritium isotopic data suggest that the geothermal water is a mixture of both recent water and ancient water. Based on the provided analysis, the geothermal water formation process in this region can be summarized as follows: Over the past decade, rainwater from nearby mountains has infiltrated the hot reservoir via cracks or fissures, undergoing deep circulation. Throughout this process, rocks are continuously heated by the deep-seated heat flow emanating from the fault below, causing minerals such as rock salt, calcite, and gypsum to dissolve and filter into the surrounding rocks, producing geothermal water with a Cl-Na chemical composition. The circulation depth ranges between 7385 and 7816 m, and reservoir temperatures span from 234.4 to 247.8 °C. The water then rises along the fault, mixing with a substantial amount of cold groundwater during its ascent, with a mixing ratio of 65% to 70%. Finally, it emerges at favorable locations, forming hot springs, as depicted in Figure 17.

5. Conclusions

(1)
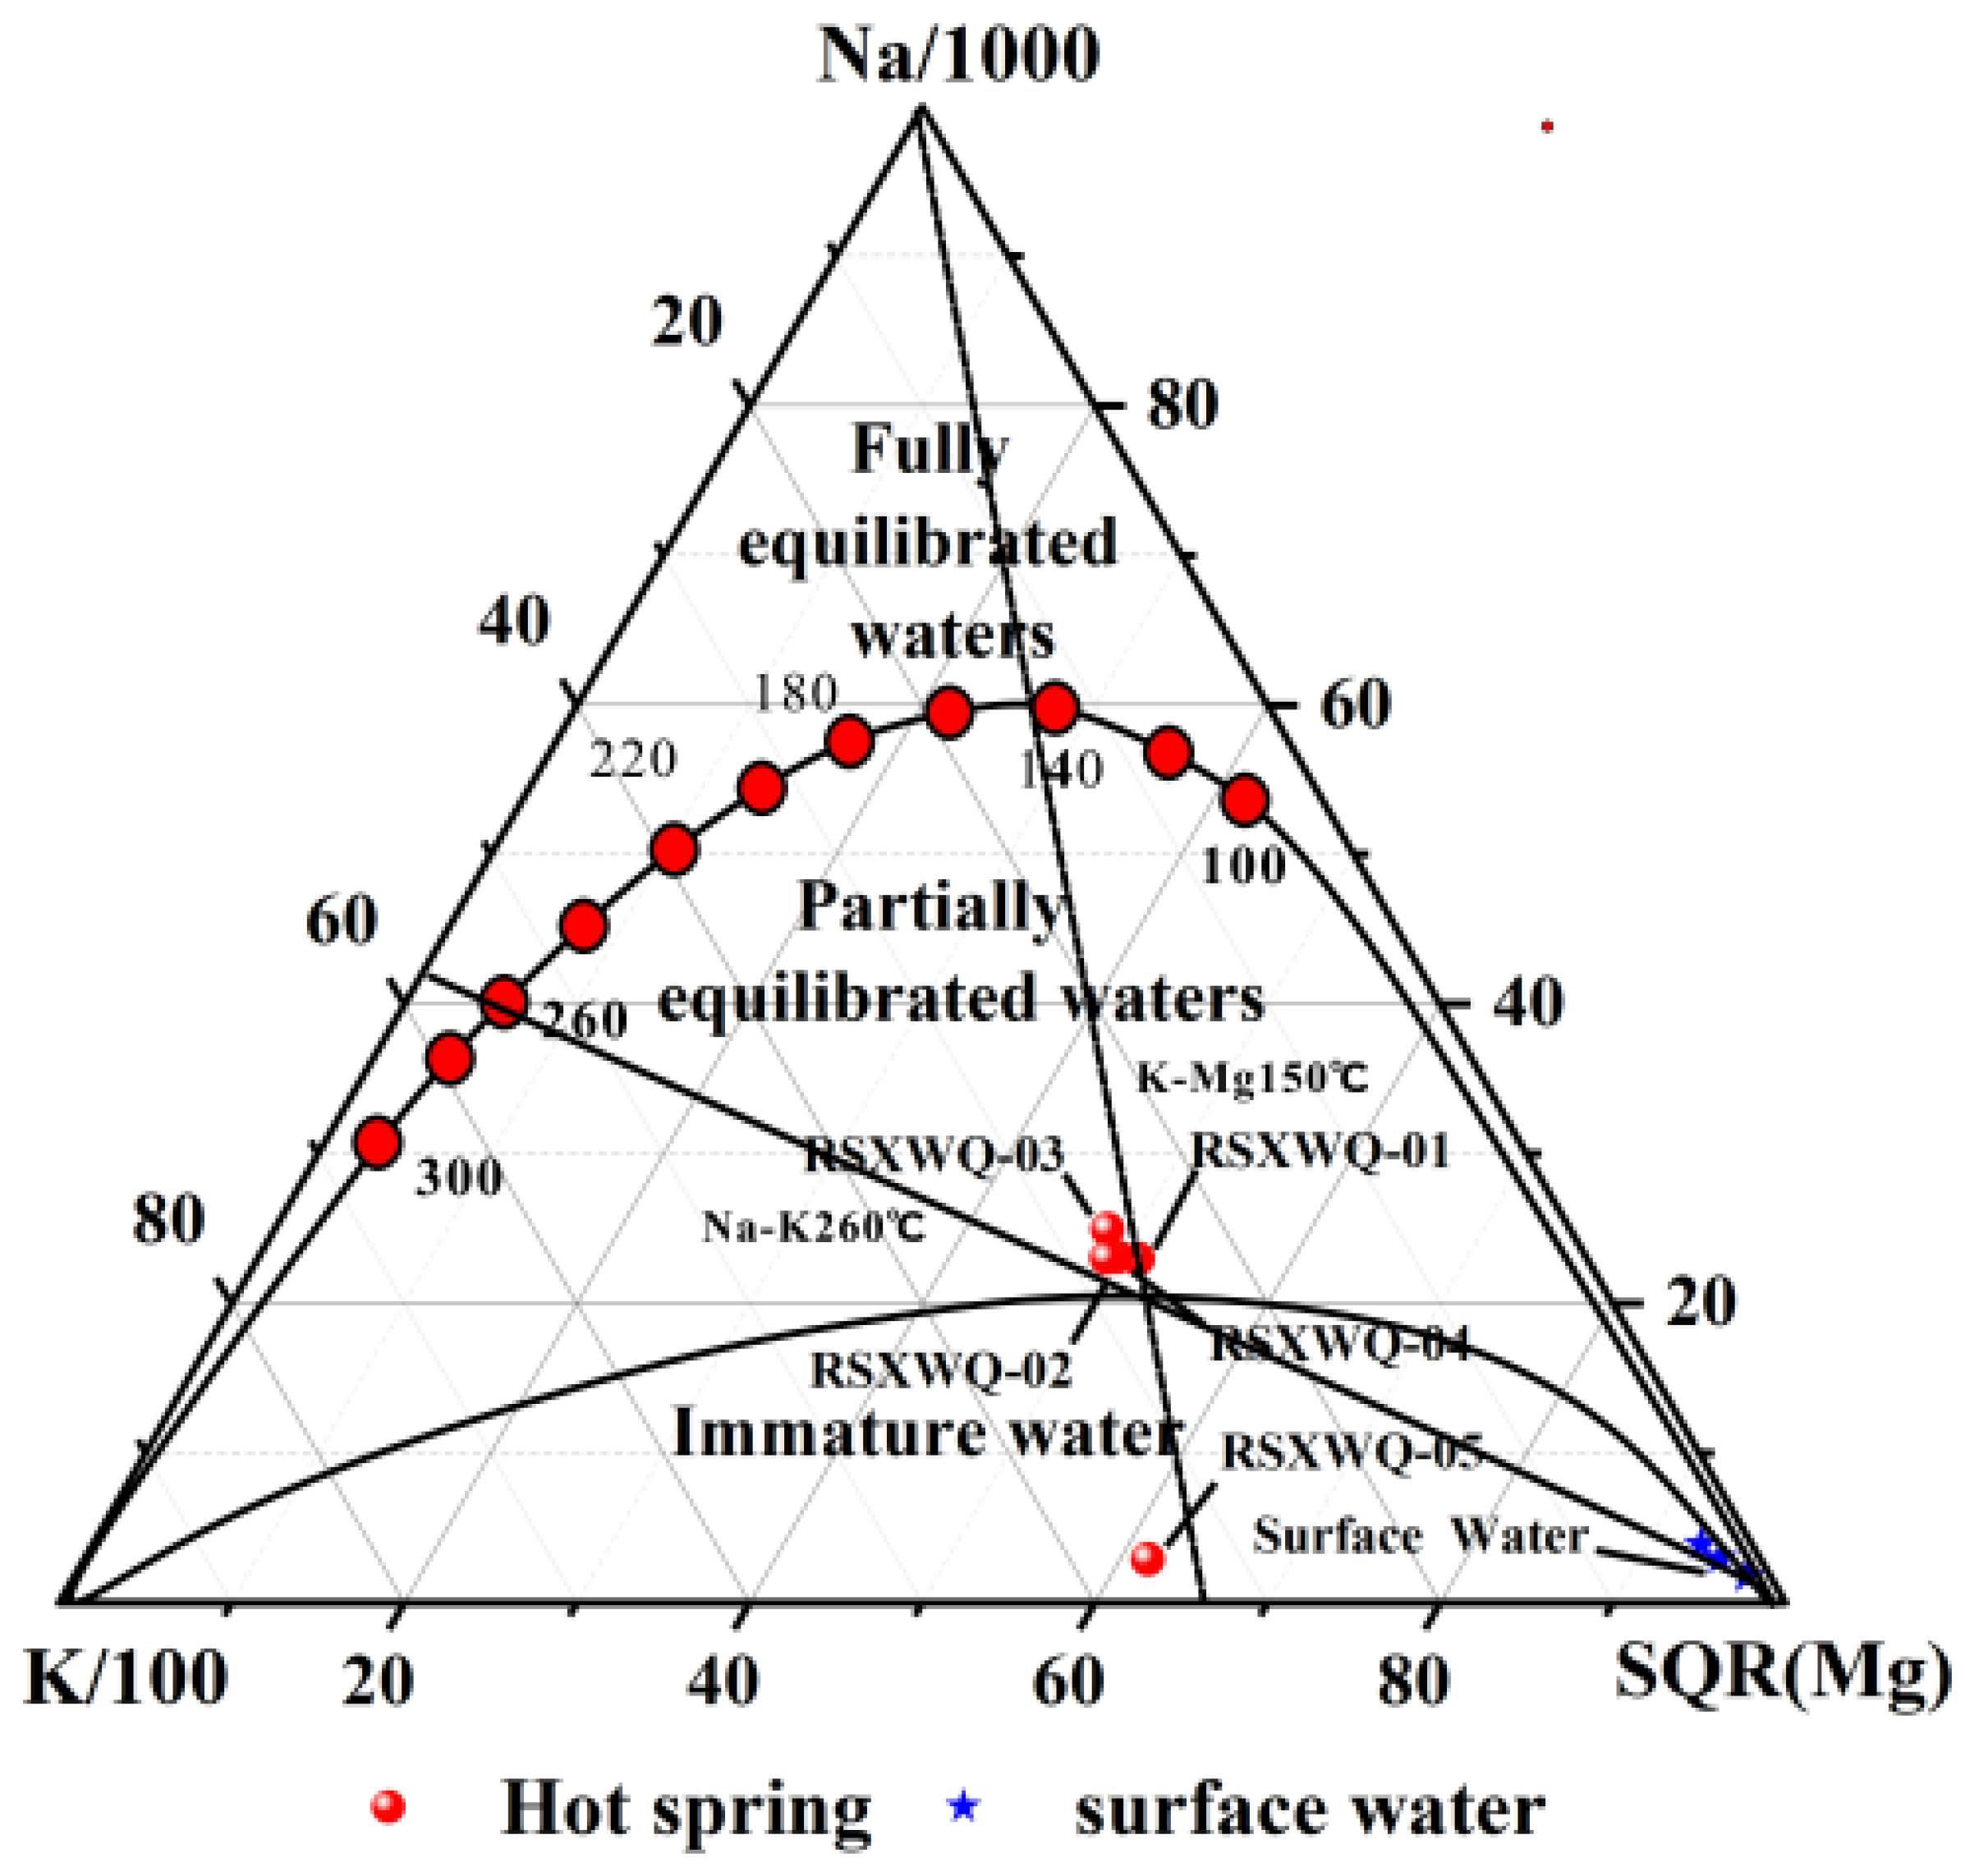
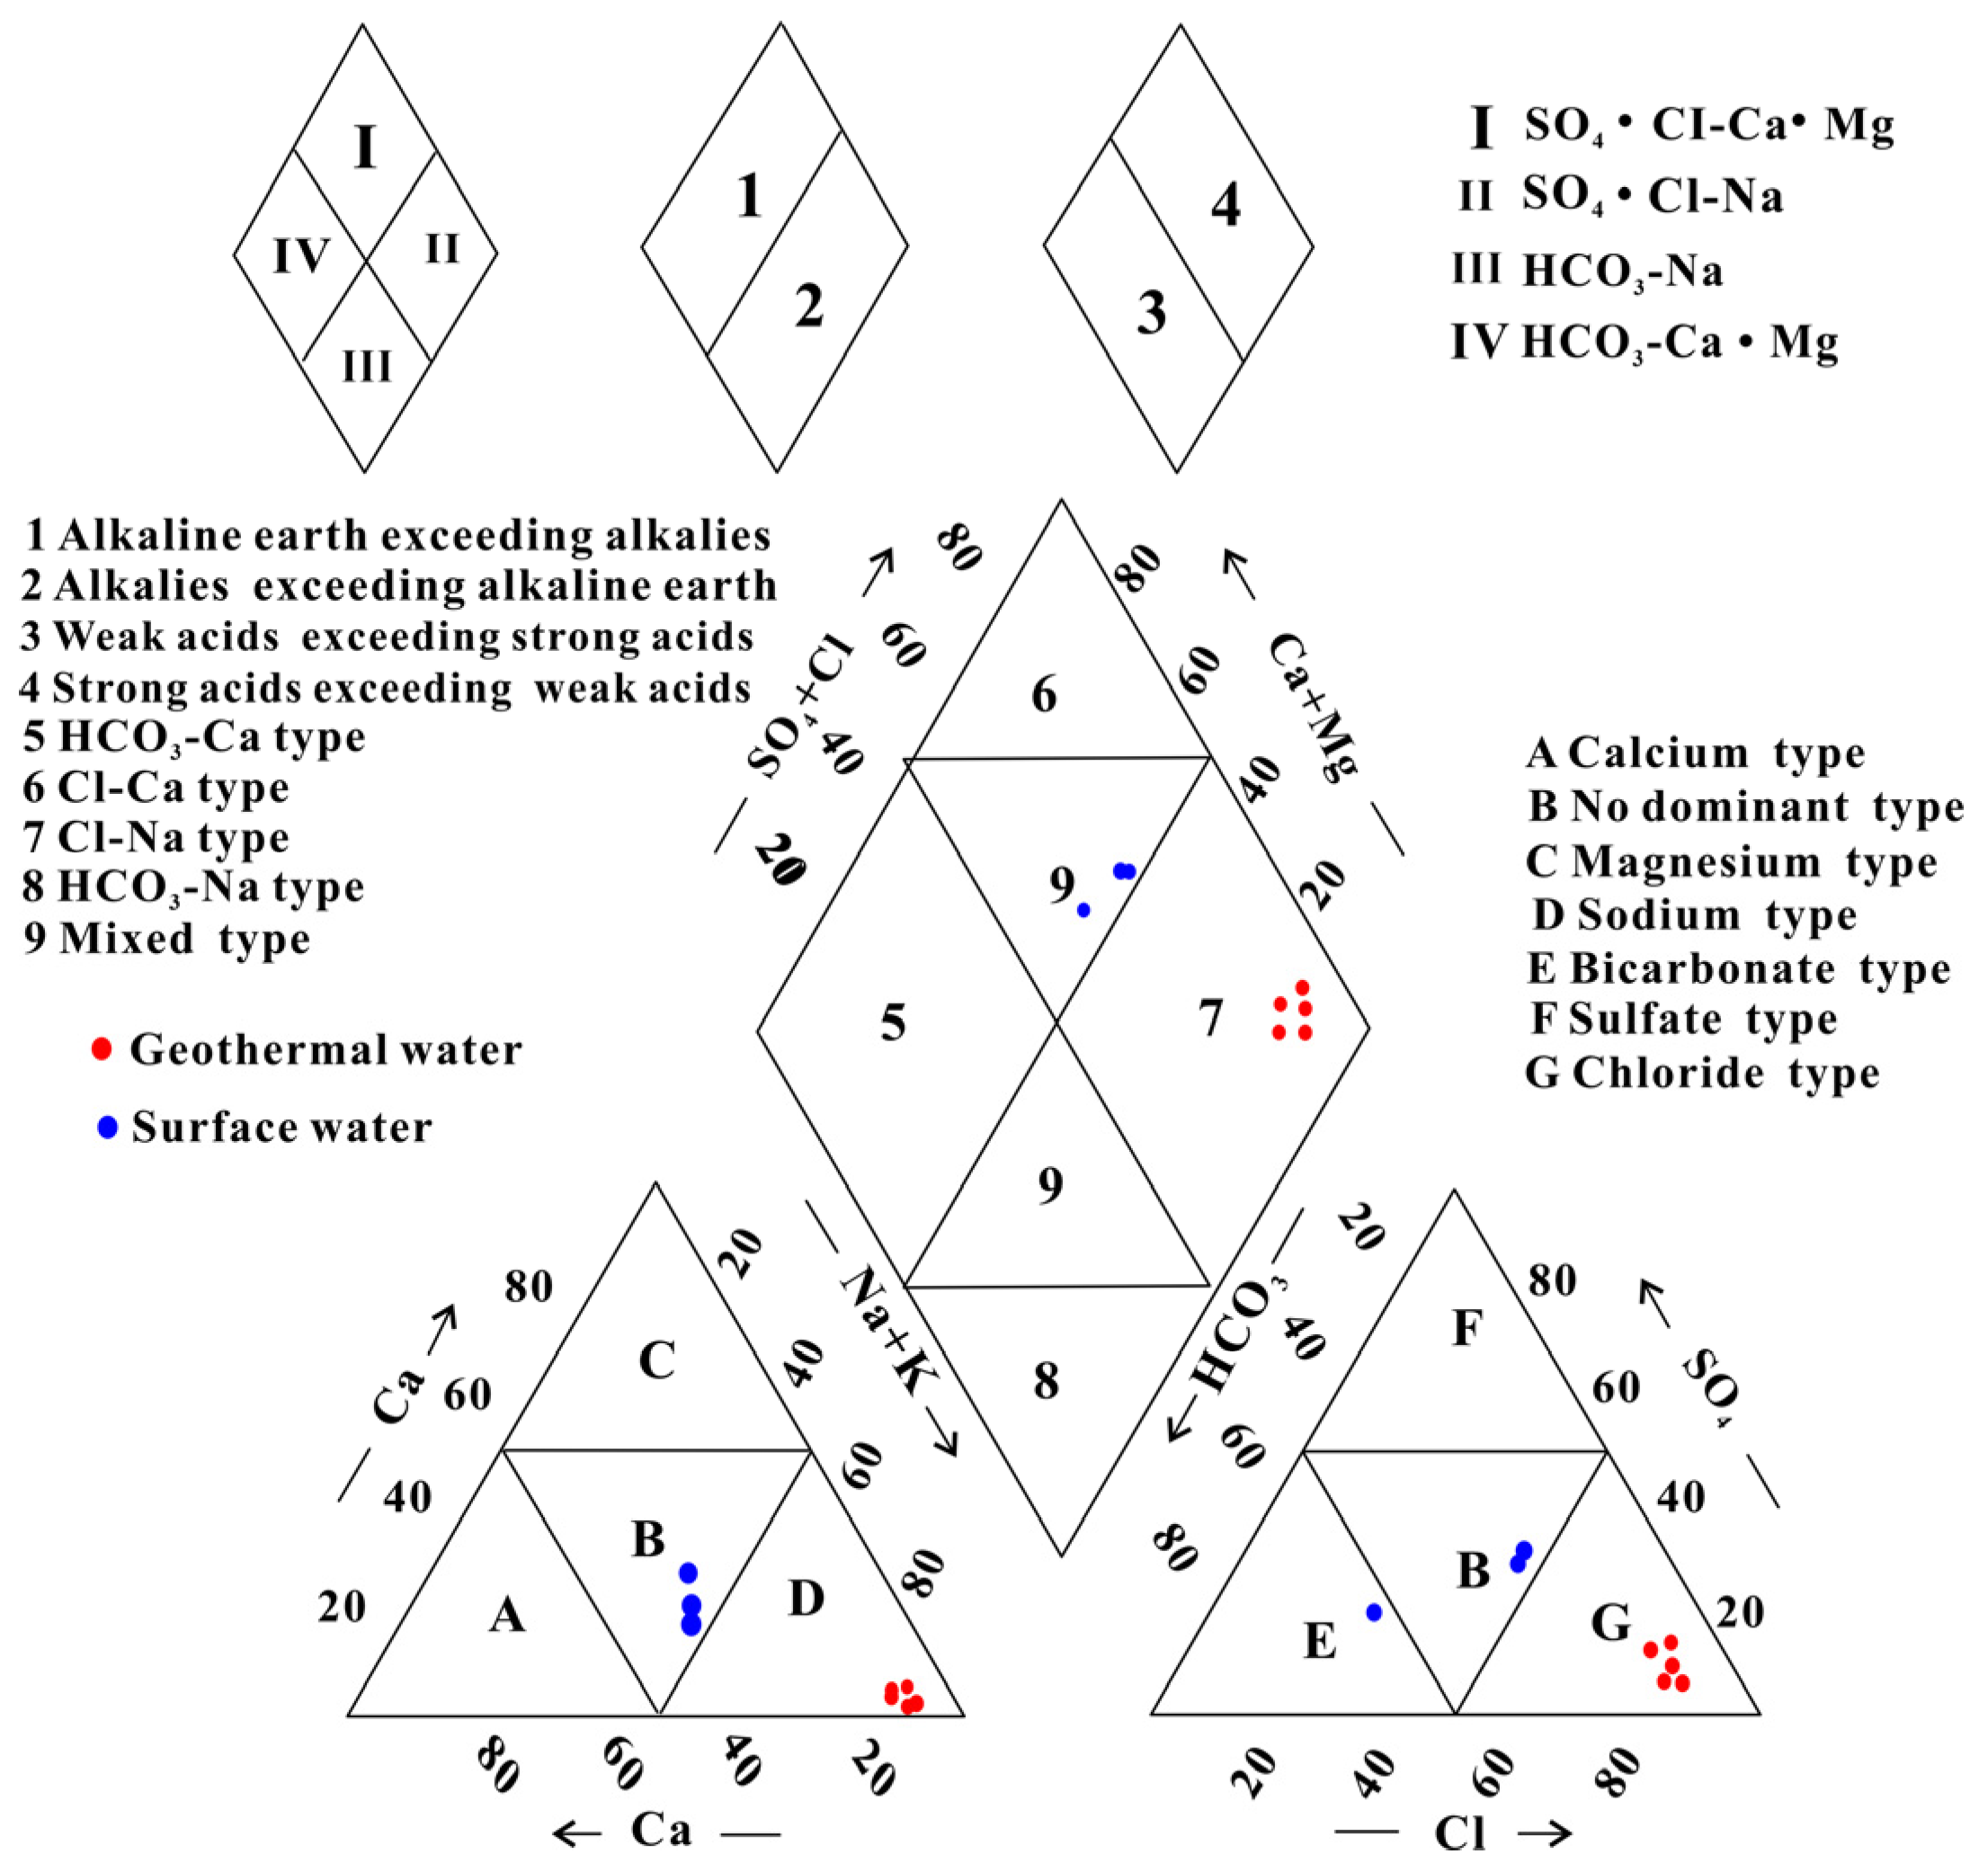
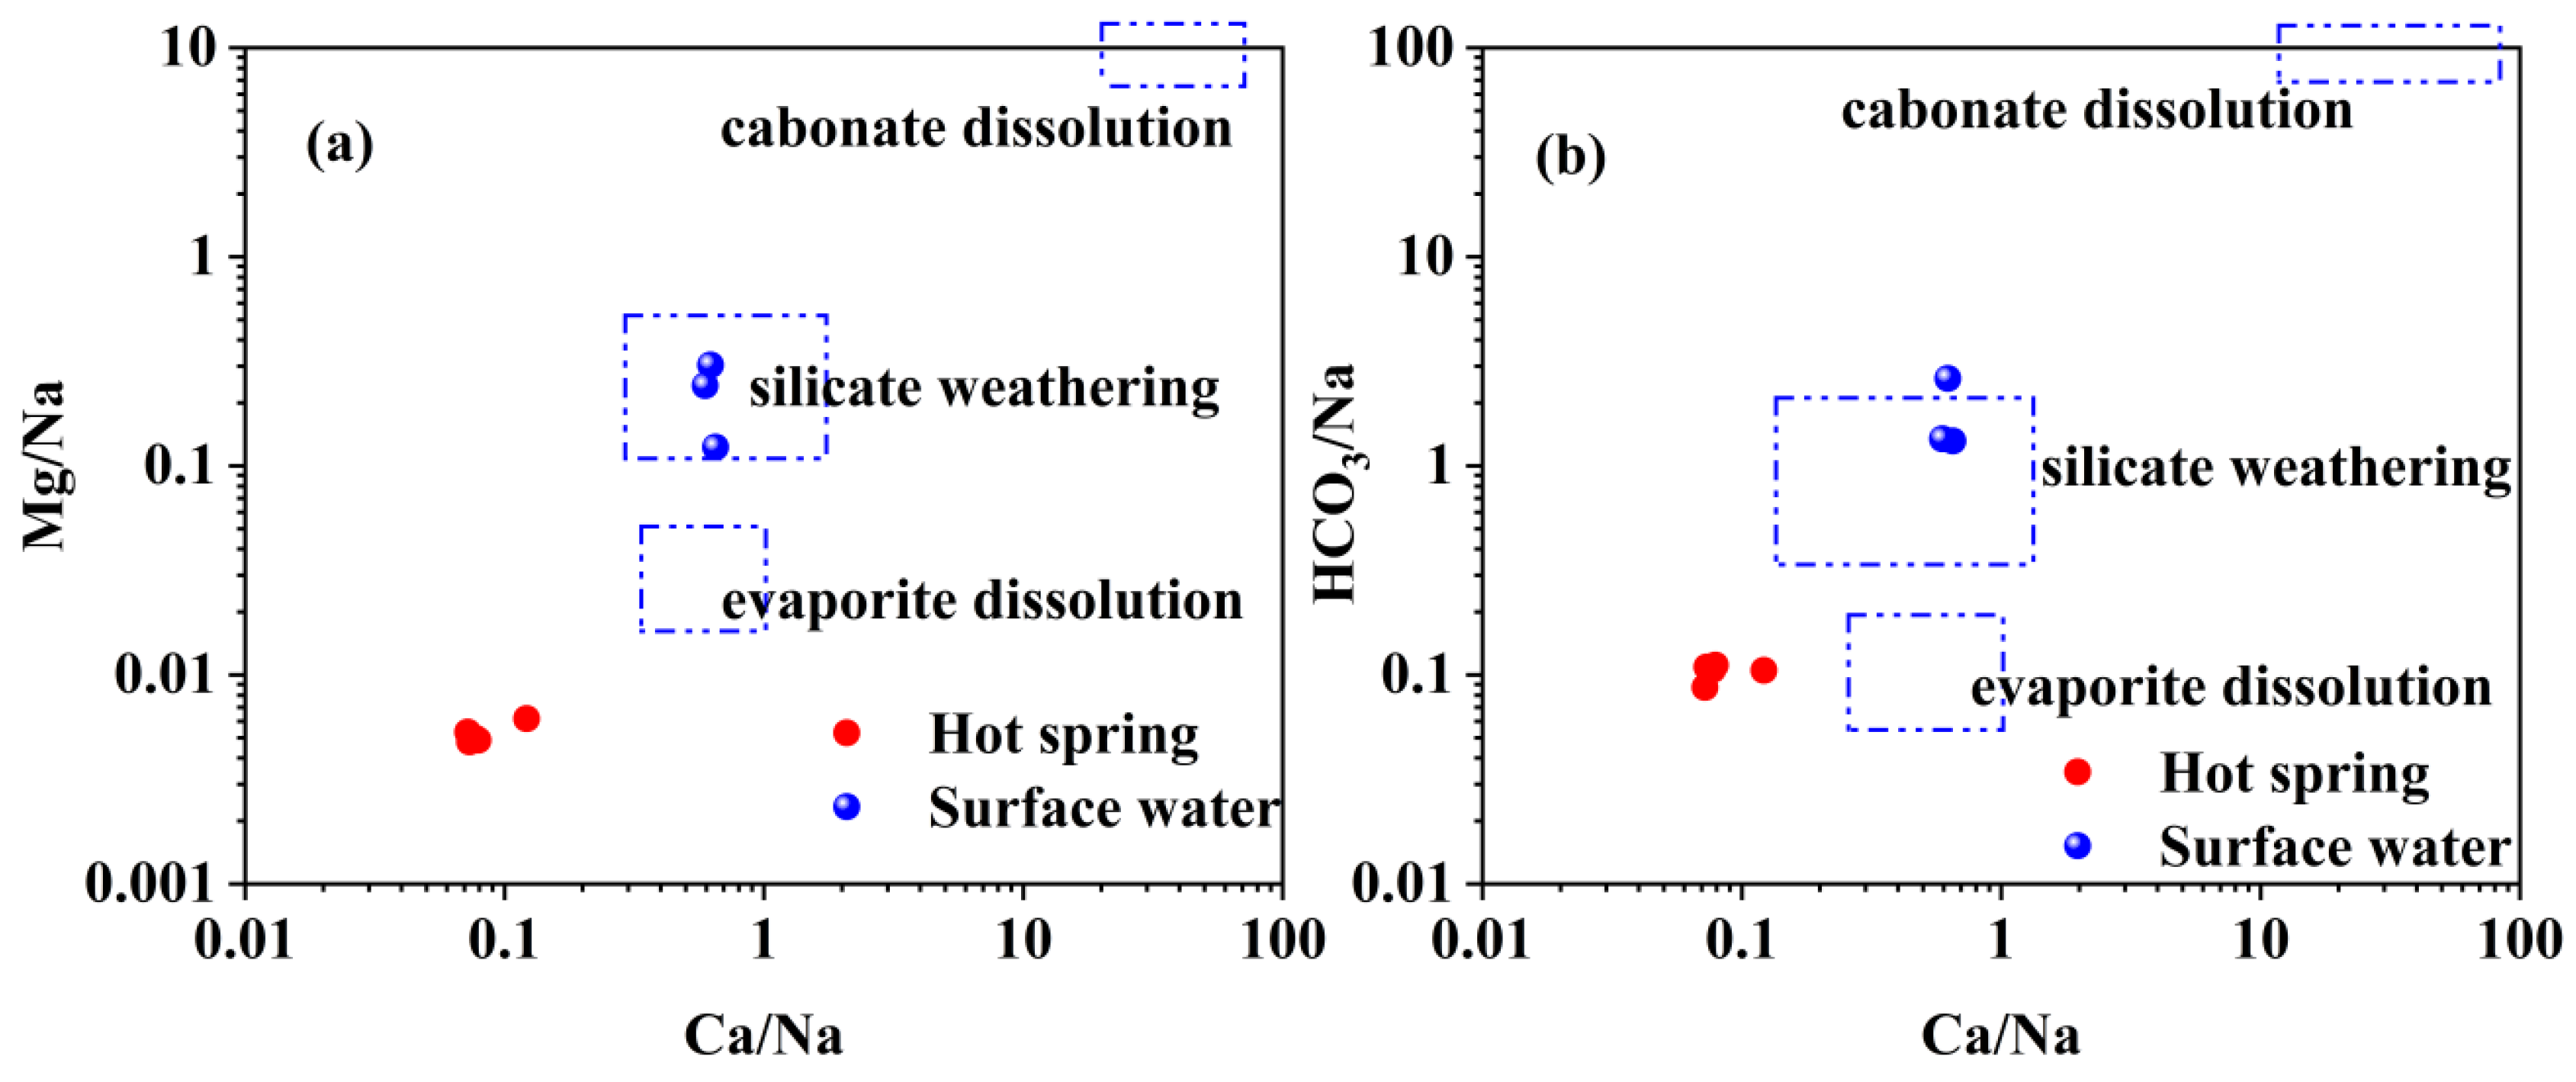
The geothermal water of Reshui area has a pH value ranging between 8.11 and 8.29, and TDS ranges from 2924 to 3140 mg/L. The hydrochemical type of hot spring is Cl-Na type, and its hydrochemical composition is mainly controlled by the interaction between water and rock, as well as ion exchange. Among the water–rock interactions, carbonate dissolution and evaporite dissolution are the most significant. The geothermal water in the research area contains a Li content of 7.08–7.85 mg/L and Sr content of 0.15–3.03 mg/L, meeting the standard for drinking natural mineral water and holding a certain development value.
(2)
Hydrogen and oxygen stable isotope characteristic findings indicate that the geothermal water is primarily recharged by atmospheric precipitation, with a supply altitude ranging from 6150 to 6255 m. The proportion of cold water mixing, calculated using the silica enthalpy equation, is estimated to be between 65% and 70%. By performing a comprehensive calculation using the silica enthalpy equation and the corrected quartz geothermal temperature scale, the geothermal reservoir temperature of the geothermal water within the area is determined to be 234.4–247.8 °C, and the calculated circulation depth is between 7385 and 7818 m.
(3)
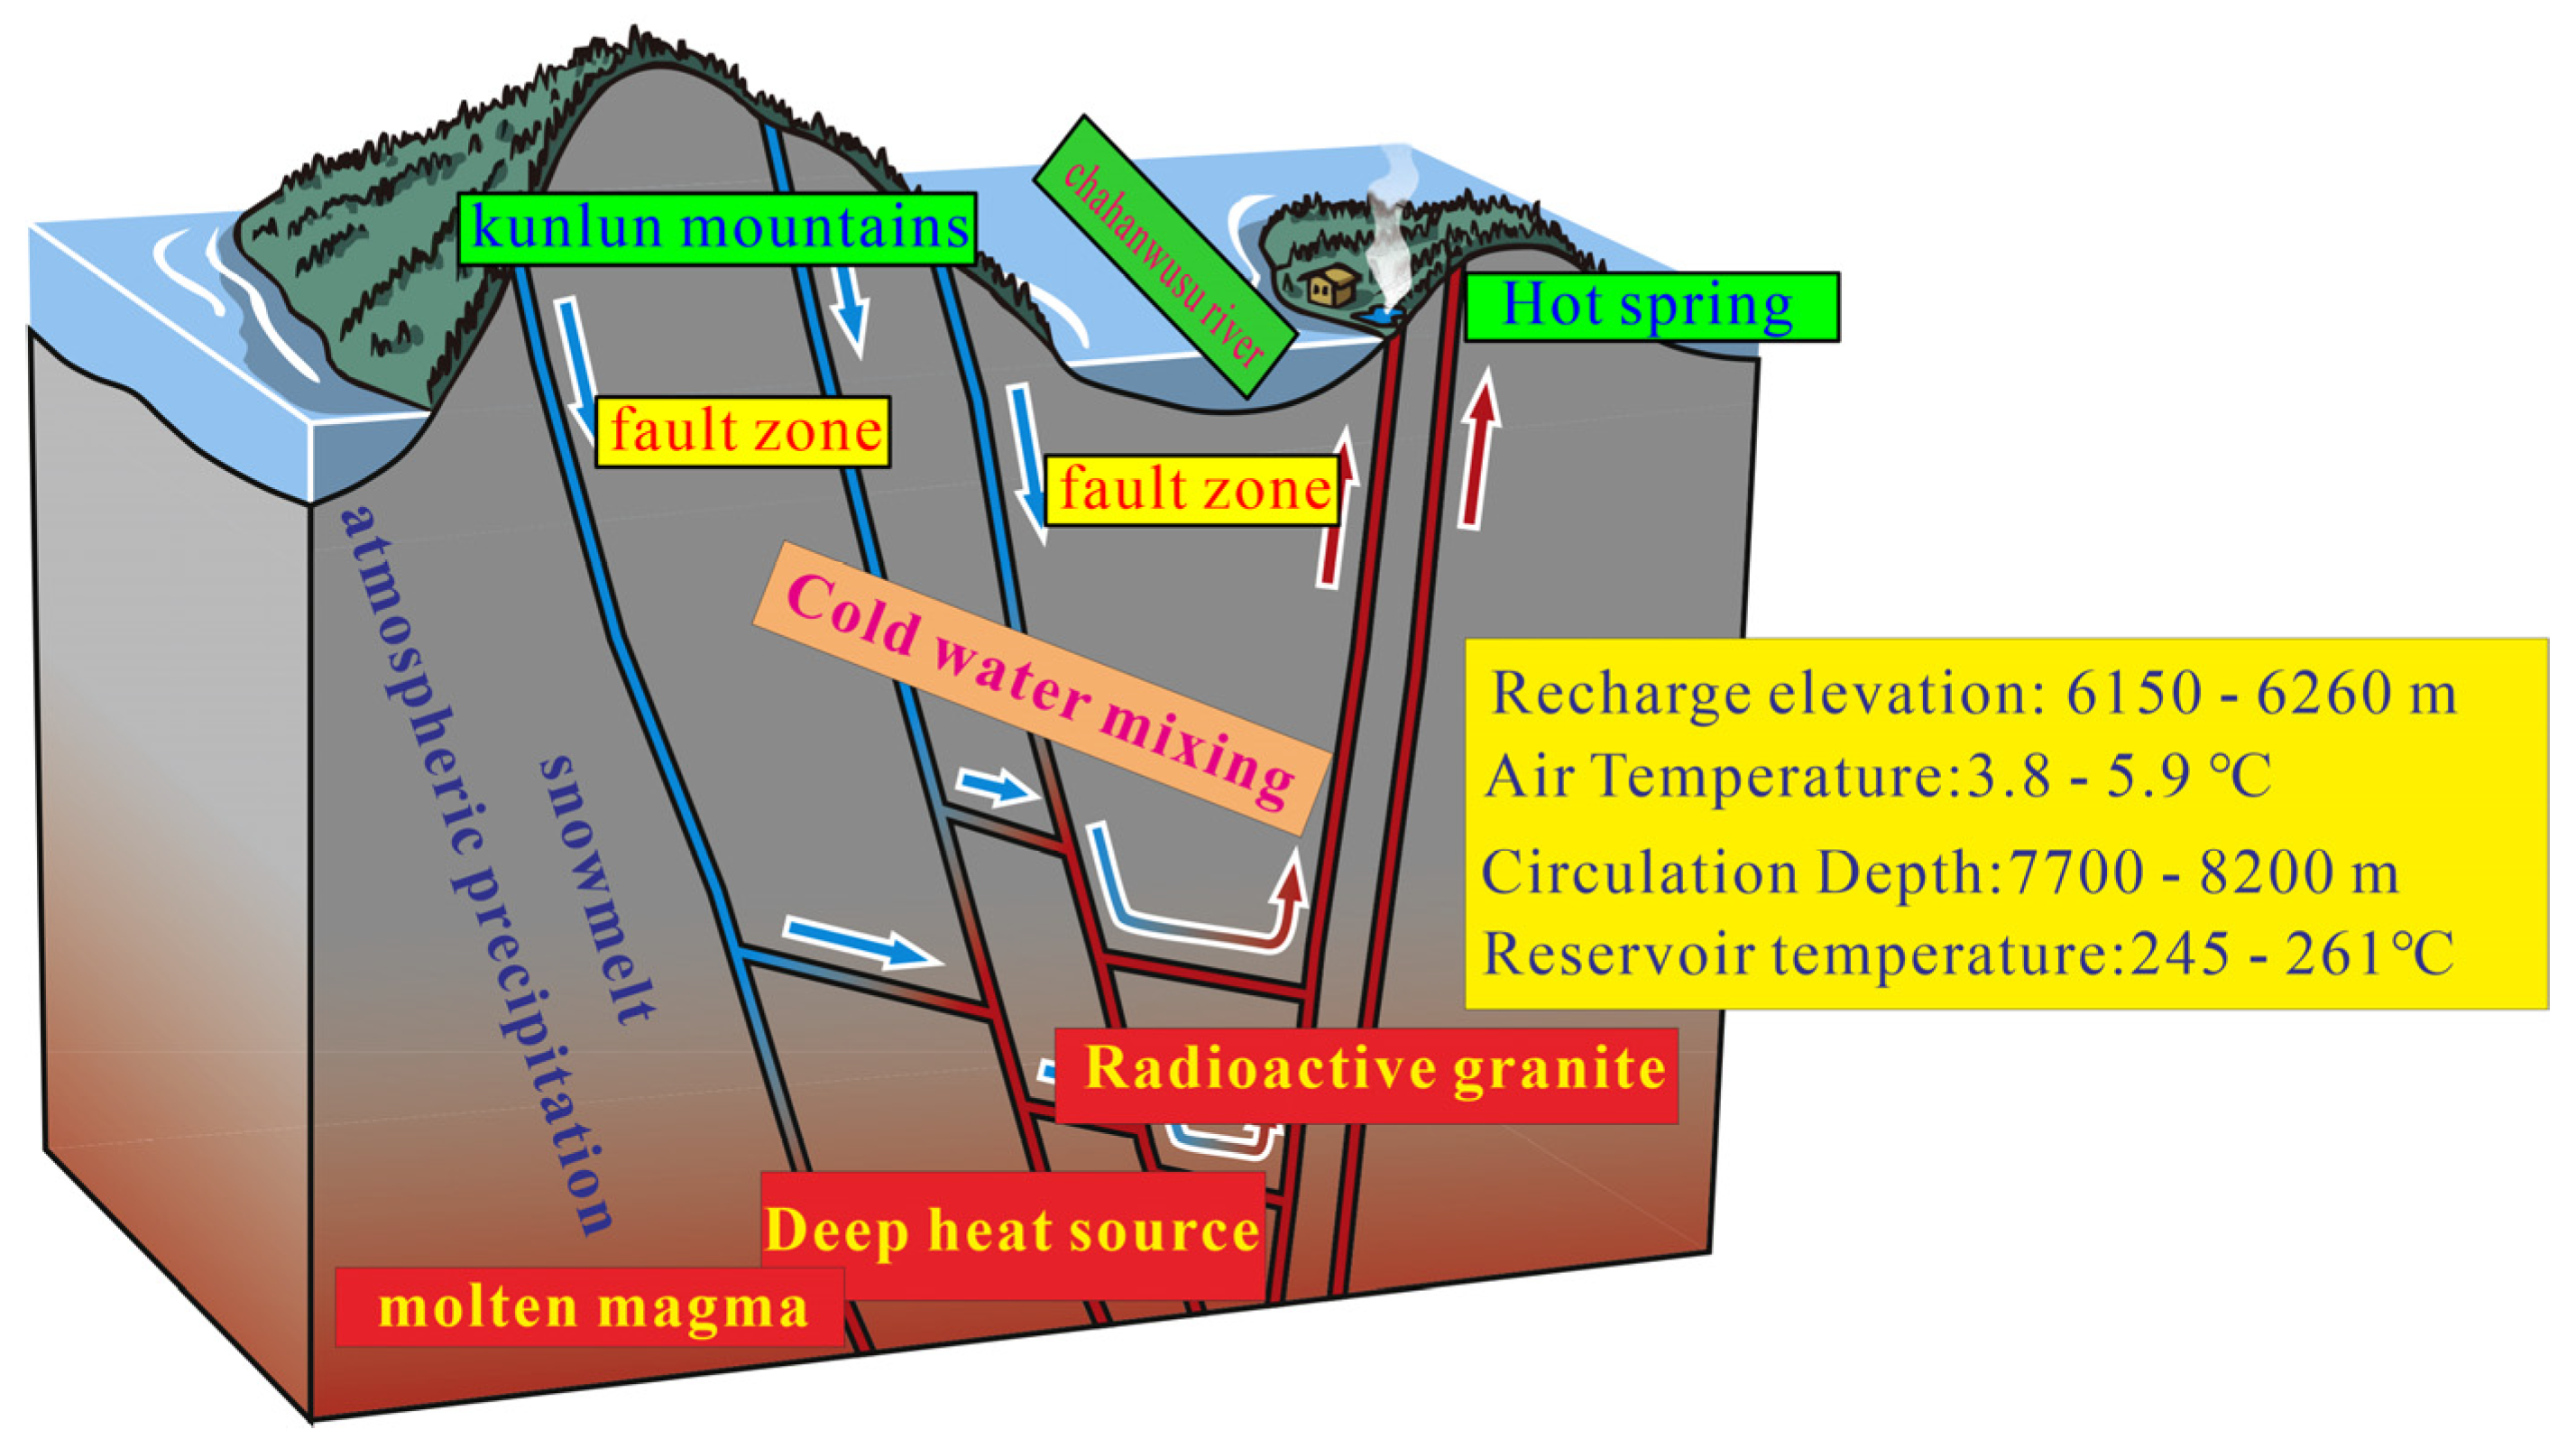
Based on regional hydrogeological conditions and the results of hydrochemical and isotopic analyses, a conceptual model of the geothermal water cycle and evolution in the Reshui area was constructed. This model comprehensively reveals that geothermal water is influenced by underground heat conduction and diffusion under the control of faults, naturally exposed in fractured zones, and constantly affected by mixing with cold groundwater during its ascent, which influences its temperature and hydrochemical characteristics.

Author Contributions

B.W.: Wrote the manuscript and interpreted the results. X.Q. and E.R.: Designed the study, wrote the manuscript, and interpreted and geological application. N.F. and S.Y.: Sampling and data analyses. W.L.: Field investigation and sampling. Z.J. and G.L.: Direction. All authors have read and agreed to the published version of the manuscript.

Funding

This research was funded by the Qinghai Science and Technology Department (Grant No. 2021–ZJ–937Q).

Data Availability Statement

All the data are presented in the tables.

Conflicts of Interest

The authors declare no conflict of interest.

References

  1. Shi, H.; Wang, G.; Zhang, W.; Ma, F.; Lin, W.; Ji, M. Predicting the Potential of China’s Geothermal Energy in Industrial Development and Carbon Emission Reduction. Sustainability 2023, 15, 7508. [Google Scholar]
  2. Panwar, N.L.; Kaushik, S.C.; Kothari, S. Role of renewable energy sources in environmental protection: A review. Renew. Sustain. Energy Rev. 2011, 15, 1513–1524. [Google Scholar]
  3. Wang, G.L.; Zhang, W.; Ma, F.; Lin, W.J.; Liang, J.Y.; Zhu, X. Overview on hydrothermal and hot dry rock researches in China. China Geol. 2018, 1, 273–285. [Google Scholar] [CrossRef]
  4. Nicholson, K. Geothermal Fluids: Chemistry and Exploration Techniques; Springer Science & Business Media: Berlin/Heidelberg, Germany, 2012. [Google Scholar]
  5. Tirrell, M.; Hubbard, S.; Sholl, D.; Peterson, E.; Tsapatsis, M.; Maher, K.; Runkles, K. Basic Research Needs for Energy and Water: Report of the Office of Basic Energy Sciences Basic Research Needs Workshop for Energy and Water; USDOE Office of Science: Germantown, MD, USA, 2017. [Google Scholar]
  6. Mao, X.; Zhu, D.; Ndikubwimana, I.; He, Y.; Shi, Z. The mechanism of high-salinity thermal groundwater in Xinzhou geothermal field, South China: Insight from water chemistry and stable isotopes. J. Hydrol. 2021, 593, 125889. [Google Scholar]
  7. Yuan, R.; Zhang, W.; Gan, H.; Liu, F.; Wei, S.; Liu, L. Hydrochemical Characteristics and the Genetic Mechanism of Low–Medium Temperature Geothermal Water in the Northwestern Songliao Basin. Water 2022, 14, 2235. [Google Scholar] [CrossRef]
  8. Pauwels, H.; Fouillac, C.; Fouillac, A.M. Chemistry and isotopes of deep geothermal saline fluids in the Upper Rhine Graben: Origin of compounds and water-rock interactions. Geochim. Cosmochim. Acta 1993, 57, 2737–2749. [Google Scholar] [CrossRef]
  9. Zhang, W.; Tan, H.; Zhang, Y. Boron geochemistry from some typical Tibetan hydrothermal systems: Origin and isotopic fractionation. Appl. Geochem. 2015, 63, 436–445. [Google Scholar] [CrossRef]
  10. Procesi, M.; Marini, L.; Cinti, D.; Sciarra, A.; Basile, P.; Mazzoni, T.; Zarlenga, F. Preliminary fluid geochemical survey in Tete Province and prospective development of geothermics in Mozambique. Geotherm. Energy 2022, 10, 1–27. [Google Scholar]
  11. Apollaro, C.; Fuoco, I.; Gennaro, E.; Giuliani, L.; Iezzi, G.; Marini, L.; Vespasiano, G. Advanced argillic alteration at Cave di Caolino, Lipari, Aeolian Islands (Italy): Implications for the mitigation of volcanic risks and the exploitation of geothermal resources. Sci. Total Environ. 2023, 889, 164333. [Google Scholar]
  12. Kebede, S.; Travi, Y.; Alemayehu, T.; Ayenew, T. Groundwater recharge, circulation and geochemical evolution in the source region of the Blue Nile River, Ethiopia. Appl. Geochem. 2005, 20, 1658–1676. [Google Scholar] [CrossRef]
  13. Bretzler, A.; Osenbrück, K.; Gloaguen, R.; Ruprecht, J.S.; Kebede, S.; Stadler, S. Groundwater origin and flow dynamics in active rift systems–A multi-isotope approach in the Main Ethiopian Rift. J. Hydrol. 2011, 402, 274–289. [Google Scholar]
  14. Cheng, G.; Jin, H. Permafrost and groundwater on the Qinghai-Tibet Plateau and in northeast China. Hydrogeol. J. 2013, 21, 5. [Google Scholar]
  15. Zou, F.; Wu, C.; Deng, L.; Gao, D.; Gao, Y. Petrological and geochemical constraints on the petrogenesis of granitoids in the Gonghe geothermal basin, western Qinling (China). Appl. Geochem. 2022, 136, 105176. [Google Scholar]
  16. Liu, S.; Tang, X.; Han, X.; Zhang, D.; Wang, G. Hydrochemistry of the Geothermal in Gonghe Basin, Northeastern Tibetan Plateau: Implications for Hydro-Circulation and the Geothermal System. Water 2023, 15, 1971. [Google Scholar]
  17. Bai, L.; Li, J.; Zeng, Z.; Wang, K. Analysis of the Geothermal Formation Mechanisms in the Gonghe Basin Based on Thermal Parameters Inversion. Geophysics 2023, 88, 1–64. [Google Scholar]
  18. Hang, X.; Hao, H.; Liu, K.; Mao, W.; Xiao, Y.; Zhang, W. Hydrogeochemical characteristics and genetic model of Oiga Graben Geothermal Waters System in Tibet. Geol. China 2020, 47, 1702–1714, (In Chinese with English Abstract). [Google Scholar]
  19. Zhou, R.; Zhou, X.; Li, Y.; He, M.; Li, J.; Dong, J.; Luo, Z. Hydrogeochemical and Isotopic Characteristics of the Hot Springs in the Litang Fault Zone, Southeast Qinghai–Tibet Plateau. Water 2022, 14, 1496. [Google Scholar]
  20. Zhang, C.; Huang, R.; Qin, S.; Hu, S.; Zhang, S.; Li, S.; Wang, Z. The high-temperature geothermal resources in the Gonghe-Guide area, northeast Tibetan plateau: A comprehensive review. Geothermics 2021, 97, 102264. [Google Scholar] [CrossRef]
  21. Saibi, H.; Batir, J.F.; Pocasangre, C. Hydrochemistry and geothermometry of thermal waters from UAE and their energetic potential assessment. Geothermics 2021, 92, 102061. [Google Scholar]
  22. Ayadi, R.; Trabelsi, R.; Zouari, K.; Saibi, H.; Itoi, R.; Khanfir, H. Hydrogeological and hydrochemical investigation of groundwater using environmental isotopes (18O, 2H, 3H, 14C) and chemical tracers: A case study of the intermediate aquifer, Sfax, southeastern Tunisia. Hydrogeol. J. 2018, 26, 983–1007. [Google Scholar]
  23. Cheng, F.; Jolivet, M.; Guo, Z.; Wang, L.; Zhang, C.; Li, X. Cenozoic evolution of the Qaidam basin and implications for the growth of the northern Tibetan plateau: A review. Earth-Sci. Rev. 2021, 220, 103730. [Google Scholar]
  24. Song, S.; Yang, J.; Liou, J.G.; Wu, C.; Shi, R.; Xu, Z. Petrology, geochemistry and isotopic ages of eclogites from the Dulan UHPM Terrane, the North Qaidam, NW China. Lithos 2003, 70, 195–211. [Google Scholar] [CrossRef]
  25. Xiao, W.; Windley, B.F.; Yong, Y.; Yan, Z.; Yuan, C.; Liu, C.; Li, J. Early Paleozoic to Devonian multiple-accretionary model for the Qilian Shan, NW China. J. Asian Earth Sci. 2009, 35, 323–333. [Google Scholar]
  26. Yu, S.; Li, S.; Zhang, J.; Peng, Y.; Somerville, I.; Liu, Y.; Wang, Z.; Li, Z.; Yao, Y.; Li, Y. Multistage anatexis during tectonic evolution from oceanic subduction to continental collision: A review of the North Qaidam UHP Belt, NW China. Earth-Sci. Rev. 2019, 191, 190–211. [Google Scholar]
  27. Xie, X. Numerical Simulation and Resource Evaluation of Groundwater in the Duolanchong Alluvial Plain; China University of Geosciences: Beijing, China, 2015. [Google Scholar]
  28. Cheng, F.; Guo, Z.; Jenkins, H.S.; Fu, S.; Cheng, X. Initial rupture and displacement on the Altyn Tagh fault, northern Tibetan Plateau: Constraints based on residual Mesozoic to Cenozoic strata in the western Qaidam Basin. Geosphere 2015, 11, 921–942. [Google Scholar]
  29. Wu, C.; Gao, Y.; Li, Z.; Lei, M.; Qin, H.; Li, M.; Wooden, J.L. Zircon SHRIMP U-Pb dating of granites from Dulan and the chronological framework of the North Qaidam UHP belt, NW China. Sci. China Earth Sci. 2014, 57, 2945–2965. [Google Scholar]
  30. Qu, H.; Li, P.; Dong, Y.; Yang, B.; Chen, S.; Han, X.; Wang, K.; He, M. Development and distribution rules of the main Neoproterozoic source and reservoir strata in the Yangtze Block, Southern China. Precambrian Res. 2020, 350, 105915. [Google Scholar]
  31. He, D.; Dong, Y.; Liu, X.; Yang, Z.; Sun, S.; Cheng, B. Tectono-thermal events in East Kunlun, Northern Tibetan Plateau: Evidence from zircon U–Pb geochronology. Gondwana Res. 2016, 30, 179–190. [Google Scholar]
  32. Yu, M.; Dick, J.M.; Feng, C.; Li, B.; Wang, H. The tectonic evolution of the East Kunlun Orogen, northern Tibetan Plateau: A critical review with an integrated geodynamic model. J. Asian Earth Sci. 2020, 191, 104168. [Google Scholar]
  33. Oleiwi, A.S.; Al-Dabbas, M. Assessment of contamination along the Tigris River from Tharthar-Tigris canal to Azizziyah, middle of Iraq. Water 2022, 14, 1194. [Google Scholar] [CrossRef]
  34. Galley, A.G. Composite synvolcanic intrusions associated with Precambrian VMS-related hydrothermal systems. Miner. Depos. 2003, 38, 443–473. [Google Scholar]
  35. Haeri, A.; Porkhial, S.; Ashayeri, A.; Behrad, Y. Chemical analyses of hot springs in Sabalan Geothermal Area, NW Iran. In Proceedings of the World Geothermal Congress, Bali, Indonesia, 25–29 April 2010. [Google Scholar]
  36. Xiao-Mei, H.; Jin, Y.; Chao, L.; Xiao-Jun, F.; Yuan, Z. Analysis of hydrochemical characteristics and genesis of water-deficient rivers in China: A case study of the Ciyao River Basin in Shanxi Province. Qual. Assur. Saf. Crops Foods 2023, 15, 32–43. [Google Scholar]
  37. Bouderbala, A.; Gharbi, B.Y. Hydrogeochemical characterization and groundwater quality assessment in the intensive agricultural zone of the Upper Cheliff plain, Algeria. Environ. Earth Sci. 2017, 76, 1–17. [Google Scholar]
  38. Zang, B.; Zhao, D.; Zhou, P.; Qu, S.; Liao, F.; Wang, G. Hydrochemical characteristics of groundwater and dominant water–rock interactions in the Delingha Area, Qaidam Basin, Northwest China. Water 2020, 12, 836. [Google Scholar] [CrossRef]
  39. Liu, B.; Yu, S.; Zhang, Q.; Ye, Y.; Qu, J.; Liu, X. Efficient Removal of Strontium from Simulated Radioactive Wastewater by Using Mechanically Modified Dolomite as a Novel Environment-friendly Adsorbent. Acta Microsc. 2019, 28, 455–466. [Google Scholar]
  40. Pengq, H.; Huangx; Sunm, L. Hydrochemicalcharacteristics and genetic mechanism of ChakaQuzhuomugeothermal in southern Tibet. Sediment. Geol. Tethyan Geol. 2023, 43, 283–294. [Google Scholar]
  41. Capo, R.C.; Stewart, B.W.; Chadwick, O.A. Strontium isotopes as tracers of ecosystem processes: Theory and methods. Geoderma 1998, 82, 197–225. [Google Scholar]
  42. Duan, R.; Li, P.; Wang, L.; He, X.; Zhang, L. Hydrochemical characteristics, hydrochemical processes and recharge sources of the geothermal systems in Lanzhou City, northwestern China. Urban Clim. 2022, 43, 101152. [Google Scholar]
  43. Zhang, L.; Guo, L.; Zhou, X.; Yang, Y.; Shi, D.; Liu, Y. Temporal variations in stable isotopes and synchronous earthquake-related changes in hot springs. J. Hydrol. 2021, 599, 126316. [Google Scholar]
  44. Keesari, T.; Goyal, M.K.; Gupta, B.; Kumar, N.; Roy, A.; Sinha, U.K.; Goyal, R.K. Big data and environmental sustainability based integrated framework for isotope hydrology applications in India. Environ. Technol. Innov. 2021, 24, 101889. [Google Scholar]
  45. Longinelli, A.; Sighinolfi, G.; de Michele, V.; Selmo, E. δ18O and chemical composition of Libyan Desert Glass, country rocks, and sands: New considerations on target material. Meteorit. Planet. Sci. 2011, 46, 218–227. [Google Scholar]
  46. Craig, H. Isotopic Variations in Meteoric Waters. Science 1961, 133, 1702–1703. [Google Scholar] [CrossRef] [PubMed]
  47. Xing, X.; Chen, H.; Chen, T. Study of the water sources of Salsola abrotanoides under various precipitation conditions. J. Glaciol. Geocryol. 2015, 37, 1396–1405. [Google Scholar]
  48. Peng, H.; Mayer, B.; Harris, S.; Krouse, H.R. A 10-yr record of stable isotope ratios of hydrogen and oxygen in precipitation at Calgary, Alberta, Canada. Tellus B Chem. Phys. Meteorol. 2004, 56, 147–159. [Google Scholar] [CrossRef]
  49. Porowski, A.; Romanova, A.; Gebus-Czupyt, B.; Wach, B.; Radzikowska, M. Stable hydrogen and oxygen isotopic composition of bottled waters in Poland: Characterization in the context of different market categories and implications for the origin authentication and natural isotopic quality preservation. J. Geochem. Explor. 2021, 220, 106684. [Google Scholar]
  50. Yang, Q.; Wu, B.; Wang, S. Geology of Potassium Salt Deposit in Chaerhan Salt Lake; Geological Press: Beijing, China, 1993. [Google Scholar]
  51. Qian, Y.; Bihao, W.; Shengzu, W. Geology of Potassium Salt Deposit in Chaerhan Salt Lake; Collected Works of Chinese Academy of Geological Sciences; Chinese-English Bound Edition; Chinese Academy of Geological Sciences: Bejing, China, 1995. [Google Scholar]
  52. Yurtsever, Y. Worldwide Survey of Stable Isotopes in Precipitation; Rep. Sect. Isotope Hydrol.; IAEA: Vienna, Austria, 1975. [Google Scholar]
  53. Jieqing, W.; Xun, Z.; Xiaolu, L.; Mengmeng, W.; Ye, S.; Bin, F. Hydrochemistry and formation of the Yangchimi hot spring in the lanping Basin of Yunnan. Geoscience 2017, 31, 822. [Google Scholar]
  54. Ji, K.; Chen, X.; Aldahan, A.; Yi, P.; Murad, A.; Hussein, S.; Yu, Z. Chronology and characteristics of groundwater along the United Arab Emirates-Oman arid region: A guide for regional sustainability. J. Radioanal. Nucl. Chem. 2020, 323, 1055–1070. [Google Scholar] [CrossRef]
  55. Han, D.; Liang, X.; Currell, M.J.; Song, X.; Chen, Z.; Jin, M.; Han, Y. Environmental isotopic and hydrochemical characteristics of groundwater systems in Daying and Qicun geothermal fields, Xinzhou Basin, Shanxi, China. Hydrol. Process. 2010, 24, 3157–3176. [Google Scholar]
  56. Hamani, A.H.H.; Adamou, M.M.; Sandao, I.; Hado, H.A. Physico-Chemical and Isotopic (18O, 2H and 3H) Characterization of the Upper Dallol Maouri Watershed (Niger). Open J. Geol. 2022, 12, 613–639. [Google Scholar] [CrossRef]
  57. Shah, M.; Sircar, A.; Shaikh, N.; Patel, K.; Sharma, D.; Vaidya, D. Comprehensive geochemical/hydrochemical and geo-thermometry analysis of Unai geothermal field, Gujarat, India. Acta Geochim. 2019, 38, 145–158. [Google Scholar]
  58. Giggenbach, W.F. Geothermal solute equilibria. derivation of Na-K-Mg-Ca geoindicators. Geochim. Cosmochim. Acta 1988, 52, 2749–2765. [Google Scholar]
  59. Tang, J.; Zhou, X.; Zhang, Y.; Tian, J.; He, M.; Li, J.; Liu, K. Hydrogeochemistry of Fault-Related Hot Springs in the Qaidam Basin, China. Appl. Sci. 2023, 13, 1415. [Google Scholar]
  60. Liu, Y.; Zhou, X.; Deng, Z.; Fang, B.; Tsutomu, Y.; Zhao, J.; Wang, X. Hydrochemical characteristics and genesis analysis of the Jifei hot spring in Yunnan, southwestern China. Geothermics 2015, 53, 38–45. [Google Scholar]
  61. Fournier, R.O. Chemical geothermometers and mixing models for geothermal systems. Geothermics 1977, 5, 41–50. [Google Scholar] [CrossRef]
  62. Arnorsson, S. Application of the silica geothermometer in low temperature hydrothermal areas in Iceland. Am. J. Sci. 1975, 275, 763–784. [Google Scholar] [CrossRef]
  63. Fournier, R.O. A revised equation for the Na/K geothermometer. Trans. Geotherm. Resour. Counc. 1979, 3, 221–224. [Google Scholar]
  64. Pirlo, M.C. Hydrogeochemistry and geothermometry of thermal groundwaters from the Birdsville Track Ridge, Great Artesian Basin, South Australia. Geothermics 2004, 33, 743–774. [Google Scholar] [CrossRef]
  65. Sasaki, K.; Morita, J.; Iwaki, C.; Ueda, A. Geochemical evaluation of geothermal resources in Toyama Prefecture, Japan, based on the chemical and isotopic characteristics of hot spring waters. Geothermic 2021, 93, 102071. [Google Scholar]
  66. Fan, Y.; Pang, Z.; Liao, D.; Tian, J.; Hao, Y.; Huang, T.; Li, Y. Hydrogeochemical characteristics and genesis of geothermal water from the Ganzi geothermal field, eastern Tibetan Plateau. Water 2019, 11, 1631. [Google Scholar] [CrossRef]
  67. Tole, M.P.; Ármannsson, H.; Zhong-He, P.; Arnórsson, S. Fluid/mineral equilibrium calculations for geothermal fluids and chemical geothermometry. Geothermics 1993, 22, 17–37. [Google Scholar] [CrossRef]
  68. Guo, Q.; Pang, Z.; Wang, Y.; Tian, J. Fluid geochemistry and geothermometry applications of the Kangding high-temperature geothermal system in eastern Himalayas. Appl. Geochem. 2017, 81, 63–75. [Google Scholar] [CrossRef]
  69. Xu, C.; Yu, D.; Luo, Z. Recharge sources and genetic model of geothermal water in Tangquan, Nanjing, China. Sustainability 2021, 13, 4449. [Google Scholar] [CrossRef]
  70. Zhang, Y.; Hu, J.; Liu, C. Preliminary Analysis of Present Geothermal Characteristics in the Qaidam Basin. Chin. J. Geol. Sci. Acad. 1987, 13, 1–16. [Google Scholar]
  71. Ma, Z.J.; Gao, X.L.; Song, Z.F. Analysis and tectonic interpretation to the horizontal-gradient map calculated from Bouguer gravity data in the China mainland. Chin. J. Geophys. 2006, 49, 95–106. [Google Scholar]
  72. Zhang, P.Z. A review on active tectonics and deep crustal processes of the Western Sichuan region, eastern margin of the Tibetan Plateau. Tectonophysics 2013, 584, 7–22. [Google Scholar]
Figure 1. Tectonic map and regional geological map in the study area.
Water 15 03084 g001
Figure 2. The Piper triangle diagram of geothermal water in Reshiui region.
Water 15 03084 g002
Figure 3. Major anions and cations content bar chart of hot springs in the research area.
Water 15 03084 g003
Figure 4. Correlation diagram of Ca + Mg vs. Na + K for the groundwater samples. Isosalinity lines are drawn for reference.
Water 15 03084 g004
Figure 5. The Cl-SO4-HCO3 ternary diagram of geothermal water in Reshui region.
Water 15 03084 g005
Figure 6. Gibbs diagram for geothermal water in Reshui region.
Water 15 03084 g006
Figure 7. Ratio diagram of geothermal water (a) Ca/Na vs. Mg/Na and (b) Ca/Na vs. HCO3 /Na in Reshui area.
Water 15 03084 g007
Figure 8. Correlation of major anion and cations from the geothermal water in the study area. For the illustration of (bf), please refer to (a). Different colored lines represent different dissolution equilibria. Please refer to the text above each line.
Water 15 03084 g008
Figure 9. Ion combination ratio diagram of ion exchange. (a) (S04 + HCO3-Ca-Mg) VS (Cl-Na-K). (b) Schoeller determines the type of ion exchange.
Water 15 03084 g009
Figure 10. (a) Cl-Li-B ternary diagram [38]; (b) relationship between Cl and B. in the Reshuixiang thermal waters.
Water 15 03084 g010
Figure 11. Sr and 87Sr/86Sr ratio relationship diagram [40,41].
Water 15 03084 g011
Figure 13. Na-K-Mg ternary plot for the water samples in the study area.
Water 15 03084 g013
Figure 14. Silicon enthalpy equation method diagram of geothermal waters in Reshui area.
Water 15 03084 g014
Figure 15. The Log(SiO2)-Log(K2/Mg) diagram of geothermal water in Reshui.
Water 15 03084 g015
Figure 16. Variations of saturation indices of typical minerals in geothermal water at different temperatures in Reshui region.
Water 15 03084 g016
Figure 17. Schematic diagram of the genesis and mechanisms of geothermal systems in Reshui region.
Water 15 03084 g017
Table 1. Chemical composition of water samples in the study area.
Sample IDTypeLatitudeLongitudeAltitudeTpHTDSCa2+Mg2+Na+K+HCO3ClSO42−NO3SiO2IB
°°m°C mg/L(%)
RSXWQ-01Hot
Spring
36.0313061298.526568203996858.293140152.87.741254.5142131.81171.5776.6926.7160.14.75
RSXWQ-0236.0181003998.828125663961848.26295583.136.121151.5135.2100.31167.3105.7124.5164.50.79
RSXWQ-0336.0183530198.828510193961918.45309994.266.141285137.7140.11152.871.7825.61694.56
RSXWQ-0436.0183530198.828510193953898.30293484.585.441094.5132120.51109.18191.2220.21654.36
RSXWQ-0536.0180892598.828827453953908.25292486.65.341095.5133.2130.51102.91175.2523.13162.43.74
CHWSHSurface
Water
36.0180892598.82882745359012.58.1176884.8834.63142.94.2192.3161.54136.1-9.742.5
RSXXS-0135.9676052498.694747683764128.1864178.0114.75119.94.14157.5128.66127.332.557.423.41
RSXXS-0236.1486583197.18424421287488.3738037.7418.4160.541.8158.349.0746.732.844.113.63
Table 2. Trace element content, radioisotope data and temperature estimation results of geothermal water recharge elevation in the study area.
Sample IDLiBFSrBr86Sr/87Srδ18Oδ2Hd3HRecharge ElevationAir Temperature
mg/L Tum°C
RSXWQ-017.410.735.373.030.0250.712028−91−13.214.65.0 ± 0.562553.40.6
RSXWQ-027.290.725.672.80.0720.712102−89−13.0157.5 ± 0.561513.80.9
RSXWQ-037.420.716.372.570.0480.712043−90−13.114.85.7 ± 0.561863.60.7
RSXWQ-047.080.735.242.90.0480.712054−89−13.215.86.1 ± 0.561783.80.9
RSXWQ-057.850.726.282.820.0320.712061−87−13.415.85.1 ± 0.561783.60.7
Table 3. Thermal reservoir temperature evaluation with different solute thermometers in the study area.
Sample IDCalibration StatusSiO2 (mg/L)Tquartz-noTquartz-maxTcalibrate siliconTchalcedony
RSXWQ-01Uncorrected
State (cold water mixing effect is not eliminated)
160.1165.3159.8254.4142
RSXWQ-02164.5167161.2260.5144
RSXWQ-03169168.8162.7266.7146
RSXWQ-04165167.2161.4261.2144.2
RSXWQ-05162.4166.2160.5257.6143
160.1–169165.3–168.8159.8–162.7254.4–266.7142–146
RSXWQ-01Corrected state
(cold water mixing effect is eliminated)
500.3254.4230.7681.6245.2
RSXWQ-02548.3260.9237.4738.4255.3
RSXWQ-03497.1251.8230.2677.8244.5
RSXWQ-04485.3249.6228.5663.8241.8
RSXWQ-05464245.6225.3638.4236.9
464–500.3245.6–260.9225.3–237.4638.4–738.4236.9–255.3
Table 4. Calculation results of multi-index heat storage temperature in Reshuixiang geothermal field.
Sample IDNa-KNa-K-CaQuartz Temperature ScaleMultimineral Balance Silicon Enthalpy ModelNa-Li
°C
XSWQ-01227.84206.46254107–333253255.50
XSWQ-02231.14213.19261192–313260260.85
XSWQ-03222.98208.51252125–345250253.78
XSWQ-04233.59213.63249-247262.53
XSWQ-05234.33213.91246-244270.67
Disclaimer/Publisher’s Note: The statements, opinions and data contained in all publications are solely those of the individual author(s) and contributor(s) and not of MDPI and/or the editor(s). MDPI and/or the editor(s) disclaim responsibility for any injury to people or property resulting from any ideas, methods, instructions or products referred to in the content.

