Research on Ecological Protection and High-Quality Development of the Lower Yellow River Based on System Dynamics
Abstract
:1. Introduction
2. Overview of the Study Area and Research Methods
2.1. Overview of the Study Area
2.2. Research Methods
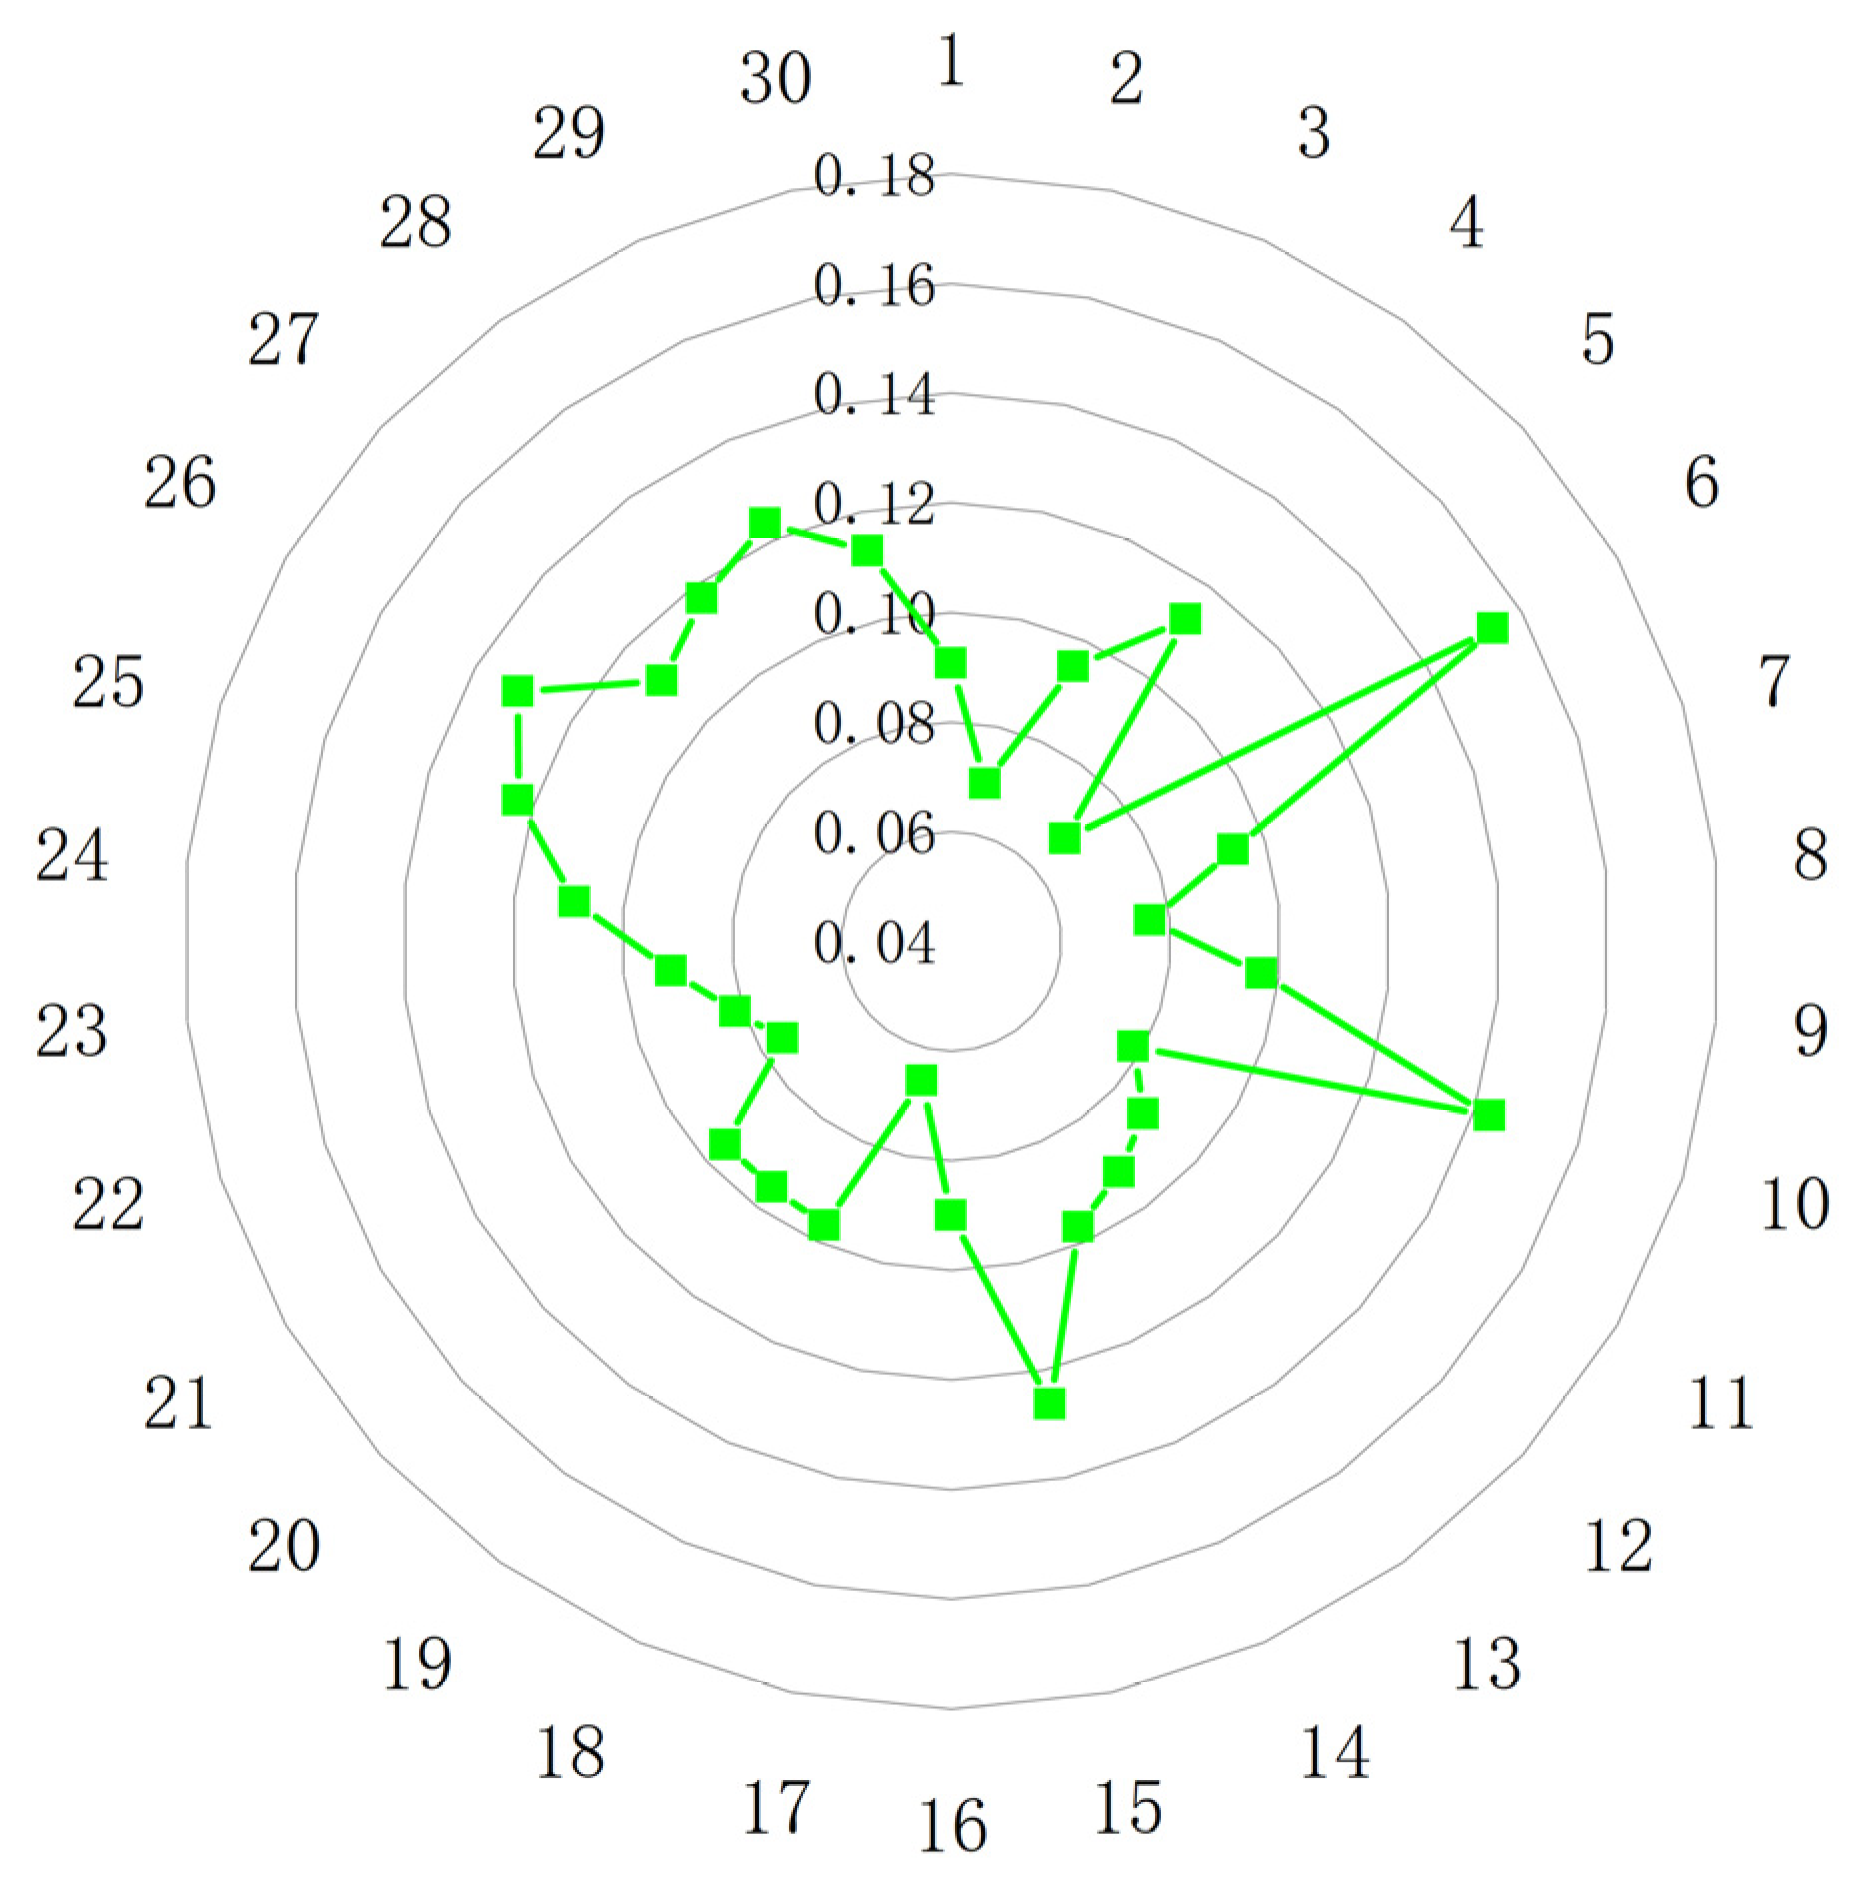
2.2.1. WEE Indicator System Construction
2.2.2. Modified AHP—CRITIC Combined Weighting Method
2.2.3. Coupled Coordination Evaluation Method
2.2.4. System Dynamics
- (1)
- Determining the system boundary of the study area, and defining the base year for the study and the simulation time.
- (2)
- Outlining the subsystems of the WEE coupled system, identifying the causal relationships among the variables, subsystems, and their associated equation groups.
- (3)
- Utilizing the Vensim-PLE 9.3.5 software to create a flow diagram of the WEE coupled system, based on the defined subsystems, and establishing the system dynamics model.
- (4)
- Conducting a simulation analysis according to the established system dynamics model, verifying the simulation accuracy with reference year variables, and determining parameter rates based on the verification results.
- (5)
- Short-term simulation predictions of coupled WEE systems under different development scenarios using the debugged system dynamics model.
2.3. Data Source
3. Result and Analysis
3.1. Coupled Coordination Analysis and Evaluation
- a.
- Water resources–economy coupling coordination analysis
- b.
- Water resources–environmental coupling coordination analysis
- c.
- Coupled economy–environmental coordination analysis
- d.
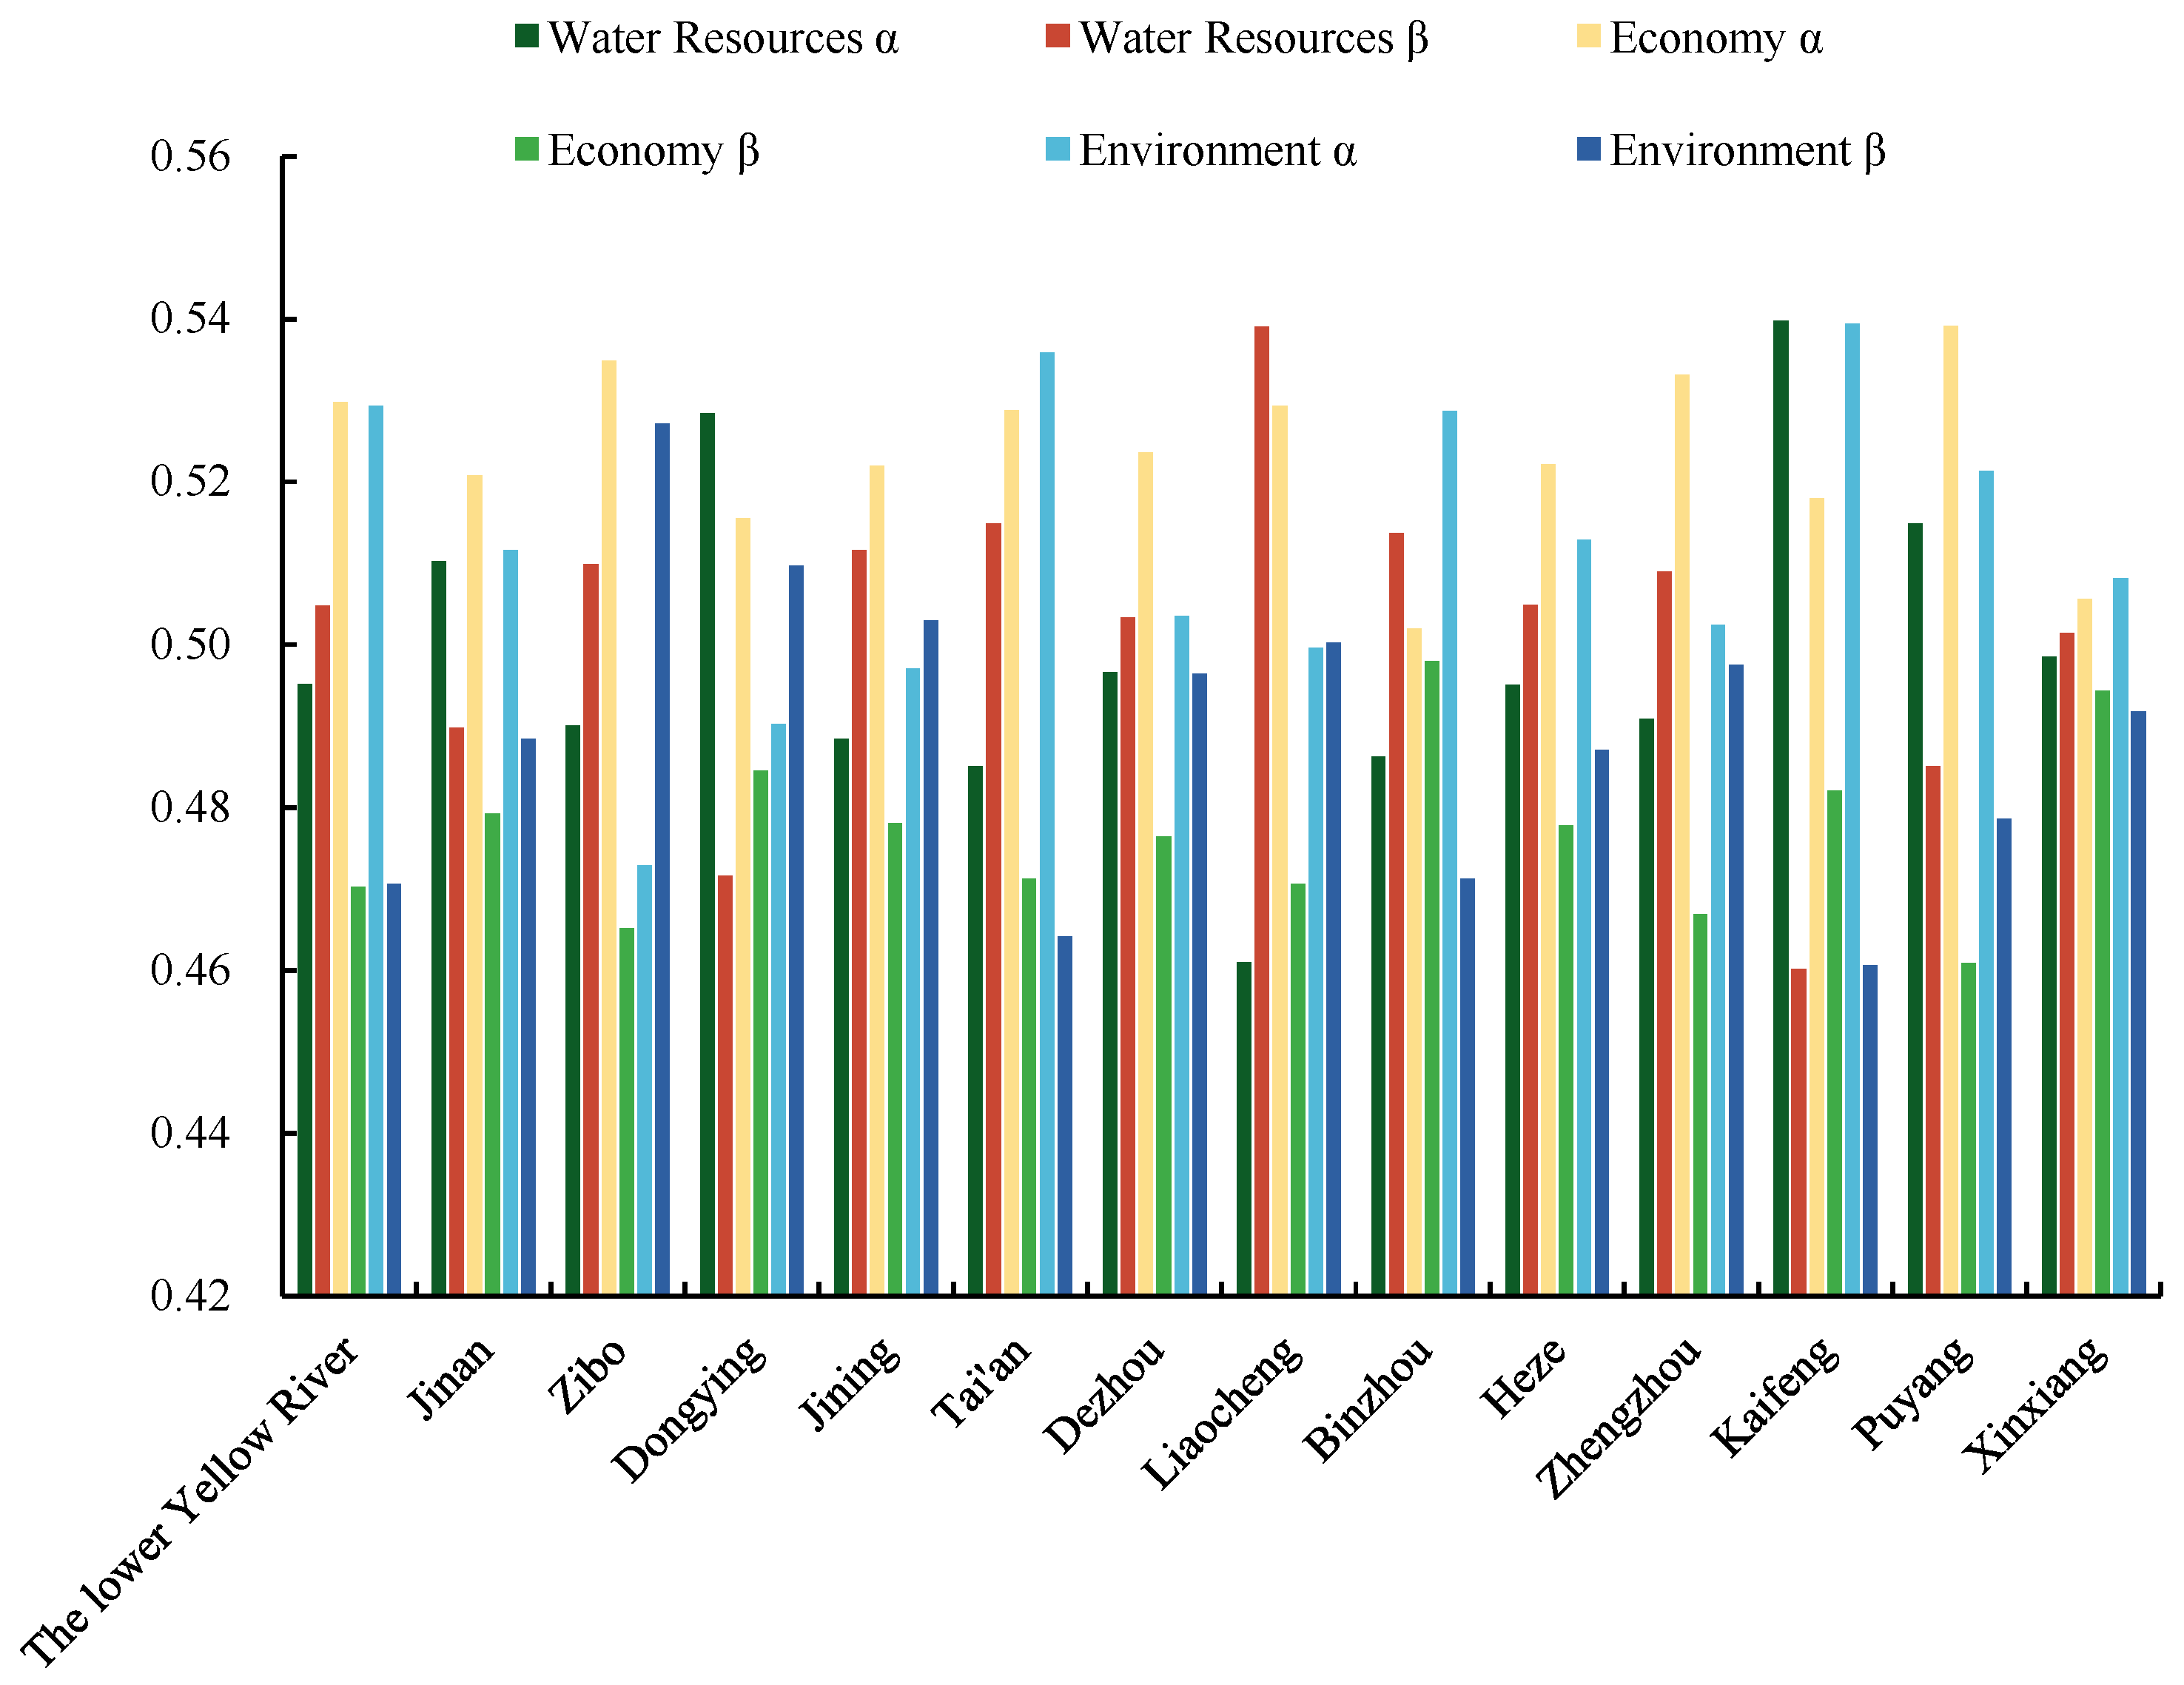
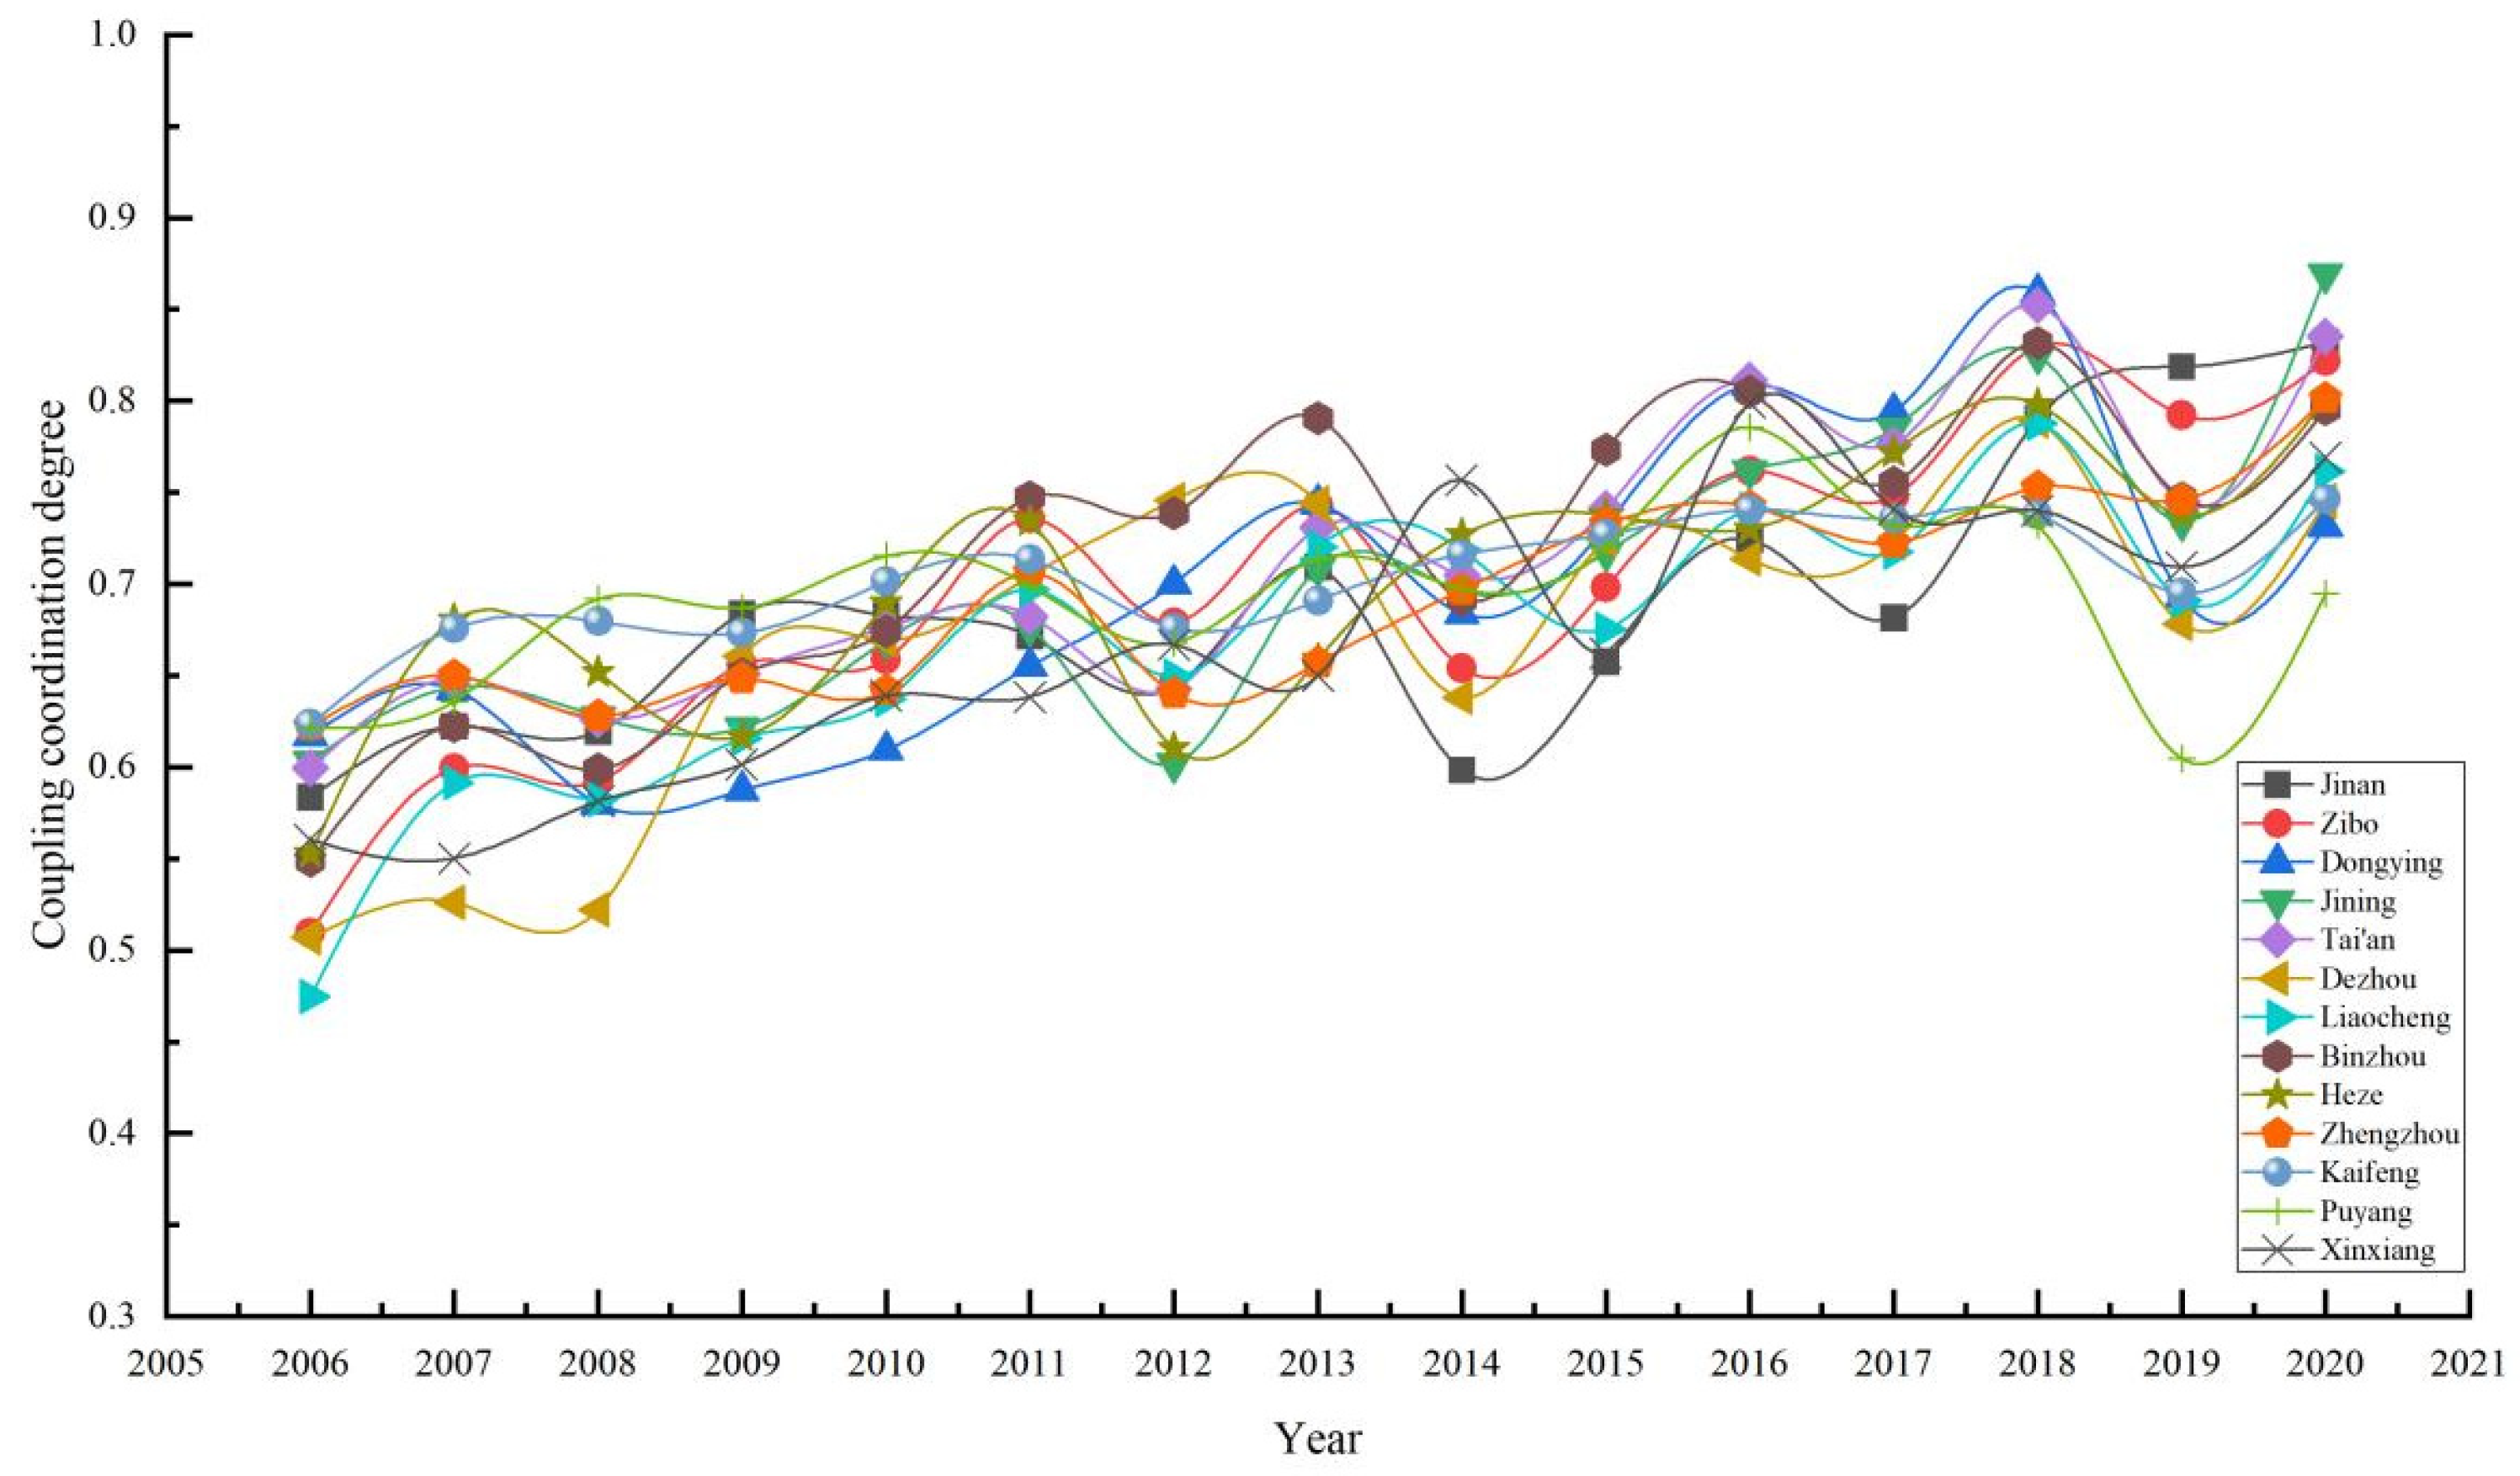
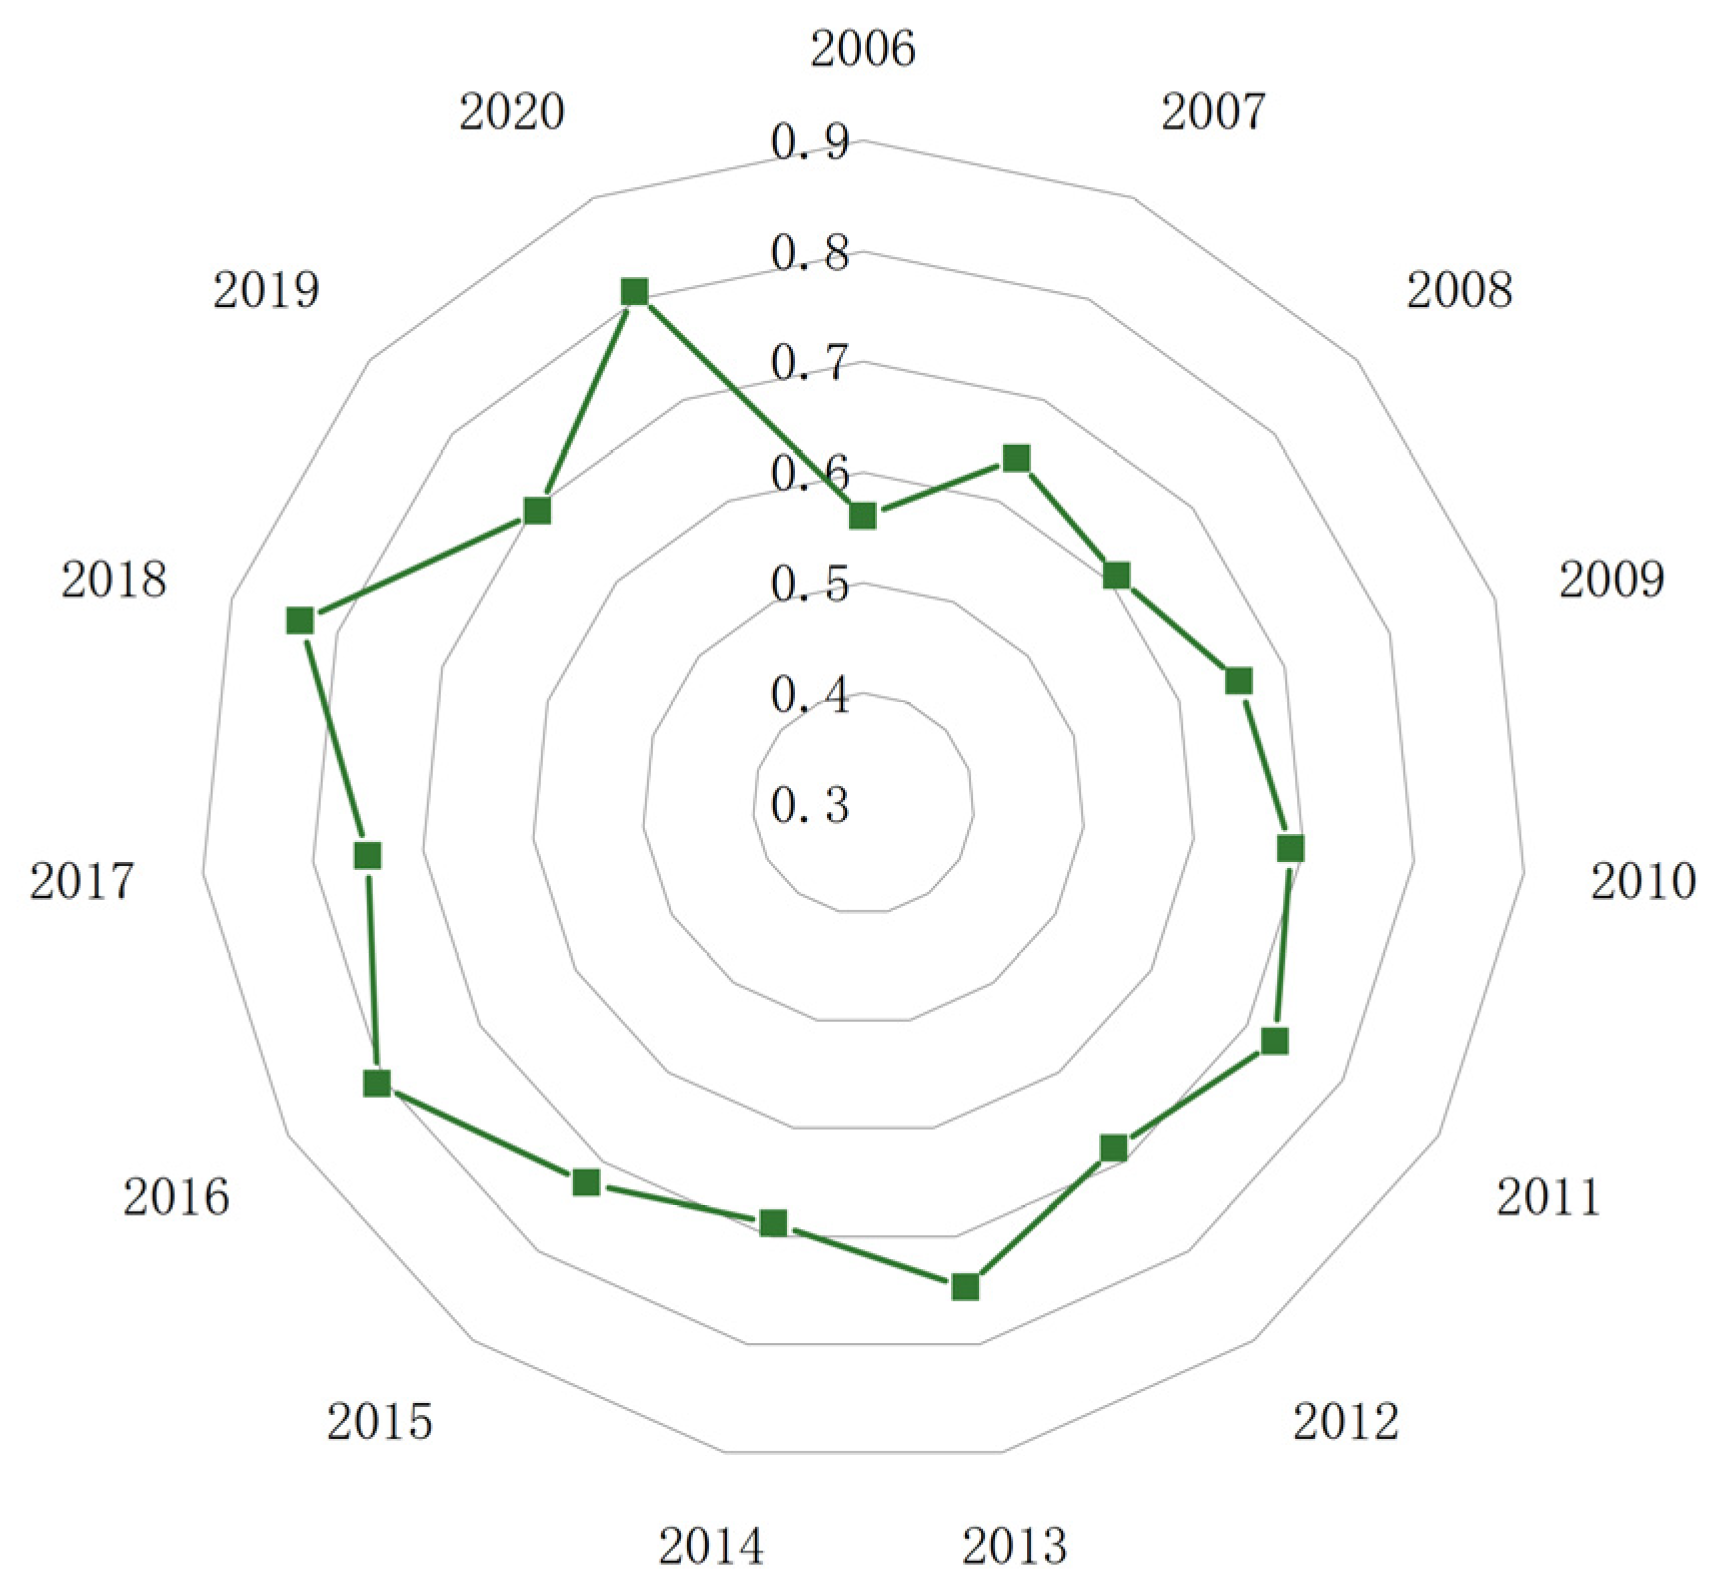
- Water resources–economy–environmental coupling coordination degree analysis
3.2. Coupling Coordination Prediction
- a.
- Flowchart creation
- b.
- Model accuracy verification
- c.
- Scenario assumptions and projections
4. Discussion
5. Conclusions
Author Contributions
Funding
Data Availability Statement
Conflicts of Interest
References
- Liu, J.; Dietz, T.; Carpenter, S.R.; Alberti, M.; Folke, C.; Moran, E.; Pell, A.N.; Deadman, P.; Kratz, T.; Lubchenco, J.; et al. Complexity of Coupled Human and Natural Systems. Science 2007, 317, 1513–1516. [Google Scholar] [CrossRef] [PubMed]
- Huang, S.; He, Y.; Yang, Z.; Ju, P.; Yang, X.; Wang, K.; Feng, Y.; Chen, H.; Wu, N. Construction of an ecosystem service value evaluation system for the Longquan Mountain Forest Park in Chengdu City Based on the Analytic Hierarchy Process. Chin. J. Appl. Environ. Biol. 2022, 28, 1635–1645. [Google Scholar]
- Chen, Y. The Evaluation of Regional Ecological and Economic Development is Studied Based on Entropy Method. J. Chongqing Univ. Technol. (Nat. Sci.) 2020, 34, 232–237. [Google Scholar]
- Yang, L.; Yang, D.; Zhang, Y.; Qiao, X.; Tang, H.; Wang, G. Grey associative analysis of infrastructure system and economic development coupling in Xinjiang. Prog. Geogr. 2009, 28, 345–352. [Google Scholar]
- Yang, X.; Yang, T.; Shi, P.; Wu, W.; Liu, H. Coupling effect of water resources-urbanization composite system in north west arid region of China: A case of Shiyang River Basin. Arid. Land Geogr. 2014, 37, 19–30. [Google Scholar]
- Radu, A.L.; Scrieciu, M.A.; Caracota, D.M. Carbon Footprint Analysis: Towards a Projects Evaluation Model for Promoting Sustainable Development. Procedia Econ. Financ. 2013, 6, 353–363. [Google Scholar] [CrossRef]
- Ott, W. Environmental Indices—Theory and Practice; Ann Arbor Science Publishers: Ann Arbor, MI, USA, 2016. [Google Scholar]
- Seferaj, K. Sustainable Development Aspects in Cross-Border Cooperation Programmes: The Case of Macedonia and Albania. Rom. J. Eur. Aff. 2014, 14, 18. [Google Scholar]
- Haken, H. Information; Springer: Berlin/Heidelberg, Germany, 1978; pp. 245–295. [Google Scholar]
- Smith, R. Development of the SEEA 2003 and Its Implementation. Ecol. Econ. 2007, 61, 592–599. [Google Scholar] [CrossRef]
- Juniah, R.; Mt, T.; Zakir, S.; Rahmi, H. Potential Economic Value of Water Resource Sustainability for Sustainable Environment: A Case Study in South Sumatra, Indonesia. Int. J. Adv. Sci. Eng. Inf. Technol. 2023, 13, 165–172. [Google Scholar] [CrossRef]
- Costanza, R.; Gottlieb, S. Modelling Ecological and Economic Systems with Stella: Part ΙΙ. Ecol. Model. 1998, 112, 81–84. [Google Scholar] [CrossRef]
- Mutisya, E.; Yarime, M. Moving Towards Urban Sustainability in Kenya: A Framework for Integration of Environmental, Economic, Social and Governance Dimensions. Sustain. Sci. 2014, 9, 205–215. [Google Scholar] [CrossRef]
- Gao, Z.; Cheng, L.; Zhang, X. Evaluation of the coupled economic development-ecological environment-water resources coordination level in the Yellow River Basin. Stat. Decis. 2022, 38, 123–127. [Google Scholar]
- Jiang, G.; Jing, J.; Zhou, X. Evaluation of the Coupled and Coordinated Development of Water Resources-Economic-Social-Ecological Environment System in the Yellow River Basin; China Water & Power Press: Beijing, China, 2018; pp. 120–125. [Google Scholar]
- Zhang, L.; Wang, Y.; Xia, Y.; Zhang, L. Research on the Coordinated Development of Resources, Environment, and Economy in the Yellow River Basin. Yellow River 2022, 44, 11–15. [Google Scholar]
- Zhao, J.; Tian, L.; Li, S.; Bai, Y.; Li, P. Research on the Coupling and Coordination Development of Energy and Environment-Economy-Ecology in the Yellow River Basin. Yellow River 2022, 44, 13–19. [Google Scholar]
- Morshed, J.; Kaluarachchi, J.J. Application of artificial neural network and genetic algorithm in flow and transport simulations. Adv. Water Resour. 1998, 22, 145–158. [Google Scholar] [CrossRef]
- Madani, K.; Marino, M.A. System Dynamics Analysis for Managing Iran’s Zayandeh-Rud River Basin. Water Resour. Manag. 2009, 23, 2163–2187. [Google Scholar] [CrossRef]
- Prodanovic, P.; Simonovic, R.P. An Operational Model for Support of Integrated Watershed Management. Water Resour. Manag. 2010, 24, 1161–1194. [Google Scholar] [CrossRef]
- Wang, X.; Wang, Z.; Song, W. Controlling Spatiotemporal Chaos in Coupled Systems Using Neural Networks. Control Theory Appl. 1999, 32, 3–5. [Google Scholar]
- Wang, J. Research of Modeling Methods and Control Strategies Based on Neural Networks. Ph.D. Thesis, Huazhong University of Science and Technology, Wuhan, China, 2004. [Google Scholar]
- Qi, D. Research on Control Theory of Continuous-Time Chaotic Dynamical Systems; Zhejiang University,: Hangzhou, China, 2002. [Google Scholar]
- Wu, Q.; Zhou, Y.; Dong, Y.; Zhang, J. Assessment model for evaluation of oil productivity based on coupling technology of GlS and ANN. J. China Univ. Pet. (Ed. Nat. Sci.) 2004, 23, 18–22. [Google Scholar]
- Wang, L.; Hou, B.; Zhou, Y.; Chen, X.; Wang, X.; Huang, Y. Research on the coupling coordinative degree in urban water-energy-food system. Hydro-Sci. Eng. 2021, 1, 9–17. [Google Scholar]
- Liu, Y.; Li, R.; Song, X. Analysis of the linkages between regional urbanization and ecological coupling in China. Acta Geogr. Sin. 2005, 126, 237–247. [Google Scholar]
- Xie, K.; Yang, B.; Xie, G. A probabilistic statistical algorithm based coupling degree analysis. J. Taiyuan Univ. Technol. 1999, 23, 3–5. [Google Scholar]
- Wang, Y.; Peng, S.; Zheng, X. Key scientific issues of water allocation plan optimization and comprehensive operation for Yellow River basin. Adv. Water Sci. 2018, 29, 614–624. [Google Scholar]
- Deng, W.; Zhang, S.; Zhang, H.; Peng, L.; Liu, Y. Transitional geospace from the perspective of human-nature coupling: Concept, connotations, attributes, and the research framework. Geogr. Res. 2020, 39, 761–771. [Google Scholar]
- Evrendilek, F.; Wali, M.K. Modelling Long-term C Dynamics in Croplands in the Context of Climate Change: A Case Study from Ohio. Environ. Model. Softw. 2001, 16, 361–375. [Google Scholar] [CrossRef]
- Bald, J.; Borja, A.; Muxika, I. A System Dynamics Model for the Management of the Gooseneck Barnacle (Pollicipes pollicipes) in the Marine Reserve of Gaztelugatxe (northern Spain). Ecol. Model. 2006, 194, 306–315. [Google Scholar] [CrossRef]
- Arquitt, S.; Johnstone, R. Use of System Dynamics Modelling in Design of an Environmental Restoration Banking Institution. Ecol. Econ. 2008, 65, 63–75. [Google Scholar] [CrossRef]
- Milik, A.; Prskawetz, A.; Feichtinger, G.; Sanderson, W.C. Slow-fast Dynamics in Wonderland. Environ. Model. Assess. 1996, 1, 3–17. [Google Scholar] [CrossRef]
- Robert, C.; Alexey, V. Modeling Ecological and Economic Systems with Stella: Part ΙΙΙ. Ecol. Model. 2001, 12, 12–24. [Google Scholar]
- Wang, Y.; Li, S.; Wu, Y.; Ding, F.; Huang, Z. Simulation Model of Sustainable Development System Dynamics in China—Social Component. Comput. Simul. 1998, 6, 3–5. [Google Scholar]
- Wu, Y.; Wang, Y.; Huang, Z.; Li, S.; Ding, F. Simulation Model for Sustainable Development System Dynamics in China—Energy Component. Comput. Simul. 1998, 13, 3–5. [Google Scholar]
- Wang, J.; Jiang, D.; Xiao, W.; Chen, Y.; Hu, P. Study on theoretical analysis of water resources carrying capacity: Definition and scientific topics. J. Hydraul. Eng. 2017, 48, 1399–1409. [Google Scholar]
- Han, C.; Wang, G.; Zhu, L. System dynamic model and scenario simulation of land carrying capacity for livestock and poultry manure. Trans. Chin. Soc. Agric. Eng. 2019, 35, 170–180. [Google Scholar]
- Li, Y.; Wang, K.; Cai, Q.; Wu, Y.; Zhang, D. County Forest Ecological Carrying Capacity Evaluation and Spatial Analysis in Zhejiang Province. Resour. Environ. Yangtze Basin 2019, 28, 554–564. [Google Scholar]
- Tang, J.; She, X.; Lin, N. A study on system dynamics model in eco-environment planning for Da’an of Jilin Province. Acta Ecol. Sin. 2005, 45, 1178–1183. [Google Scholar]
- Shadab, A.; Ahmad, S.; Said, S. Spatial forecasting of solar radiation using ARIMA model. Remote Sens. Appl. Soc. Environ. 2020, 20, 100427. [Google Scholar] [CrossRef]
- Cao, Q. A Study on Coupling Coordination Degree Model and Forecast of Oil-Economy-Environment System—Take the Western Region as an Example. Master’s Thesis, Chengdu University of Technology, Chengdu, China, 2015. [Google Scholar]
- Uyan, M. GIS-based solar farms site selection using analytic hierarchy process (AHP) in Karapinar region, Konya/Turkey. Renew. Sustain. Energy Rev. 2013, 28, 11–17. [Google Scholar] [CrossRef]
- Zhang, Y.; Wei, H. A CRITIC-based approach to multi-attribute decision combination weighting. Stat. Decis. 2012, 364, 75–77. [Google Scholar]
- Wang, Z.; Zhang, S.; Liu, Y. An Synthetic Approach to Determine Weights Based on the Identity of Subjective and Objective Weighted Attribute Value. Guangxi Sci. 2007, 55, 247–249. [Google Scholar]
- Zhang, H.; Zeng, J.; Qu, J.; Li, H.; Liu, L.; Wu, J.; Xu, L. Research on the Coupling Coordinative Degree among Water-energy-Food System in High-intensity Flow Areas—A Case Study of Beijing, Tianjin and Hebei Province. China Rural. Water Hydropower 2019, 2019, 17–21. [Google Scholar]
- Deng, P.; Chen, J.; Chen, D.; Shi, H.; Bi, B.; Liu, Z.; Yin, Y.; Cao, X. The evolutionary characteristics analysis of the coupling and coordination among water, energy and food: Take Jiangsu Province as an example. J. Water Resour. Water Eng. 2017, 28, 232–238. [Google Scholar]
- Zhou, L.; Xie, X.; Yu, L.; Kong, D. Water-Energy-Economy Coupling Relationship in Water Resources Management. Water Resour. Power 2019, 37, 144–147. [Google Scholar]
- Xu, H.; Wang, Y.; Zhang, Z.; Gao, Y.; Zhang, D. Coupling mechanism of water-energy-food and spatiotemporal evolution of coordinated development in the Yellow River Basin. Resour. Sci. 2021, 43, 2526–2537. [Google Scholar] [CrossRef]
- Yan, Y. Research on the Coordination of Water-Energy-Food Coupling System in Cities Along the Lower Yellow River. Master’s Thesis, North China University of Water Resources and Electric Power, Zhengzhou, China, 2021. [Google Scholar]
- Chen, Z.; Wei, S. Application of System Dynamics to Water Security Research. Water Resour. Manag. 2014, 28, 287–300. [Google Scholar] [CrossRef]
- Gao, Y. Study on the Resource and Environment Carrying Capacity of Urban Agglomeration in the Fujian River Deltas Based on the System Dynamics Model. Master’s Thesis, Xiamen University, Xiamen, China, 2018. [Google Scholar]
- Xie, H. Study on Water Environmental Carrying Capacity in The First Grade Water Source Protection Area of Miyun Reservoir. Master’s Thesis, Hebei Agricultural University, Baoding, China, 2012. [Google Scholar]
- Chen, L.; Zhang, A. Synergistic evaluation of water resources and social economy in the Yellow River Basin and analysis of influencing factors. Water Resour. Prot. 2023, 39, 1–8. [Google Scholar]
- Wu, C.; Wang, D.; Zhuang, X. Spatiotemporal Analysis of Economy-Resources-Environment Coupling Coordinationin the Yellow River Basin: A Case Study of Shandong Metropolitan Area. Ecol. Econ. 2022, 38, 159–166. [Google Scholar]

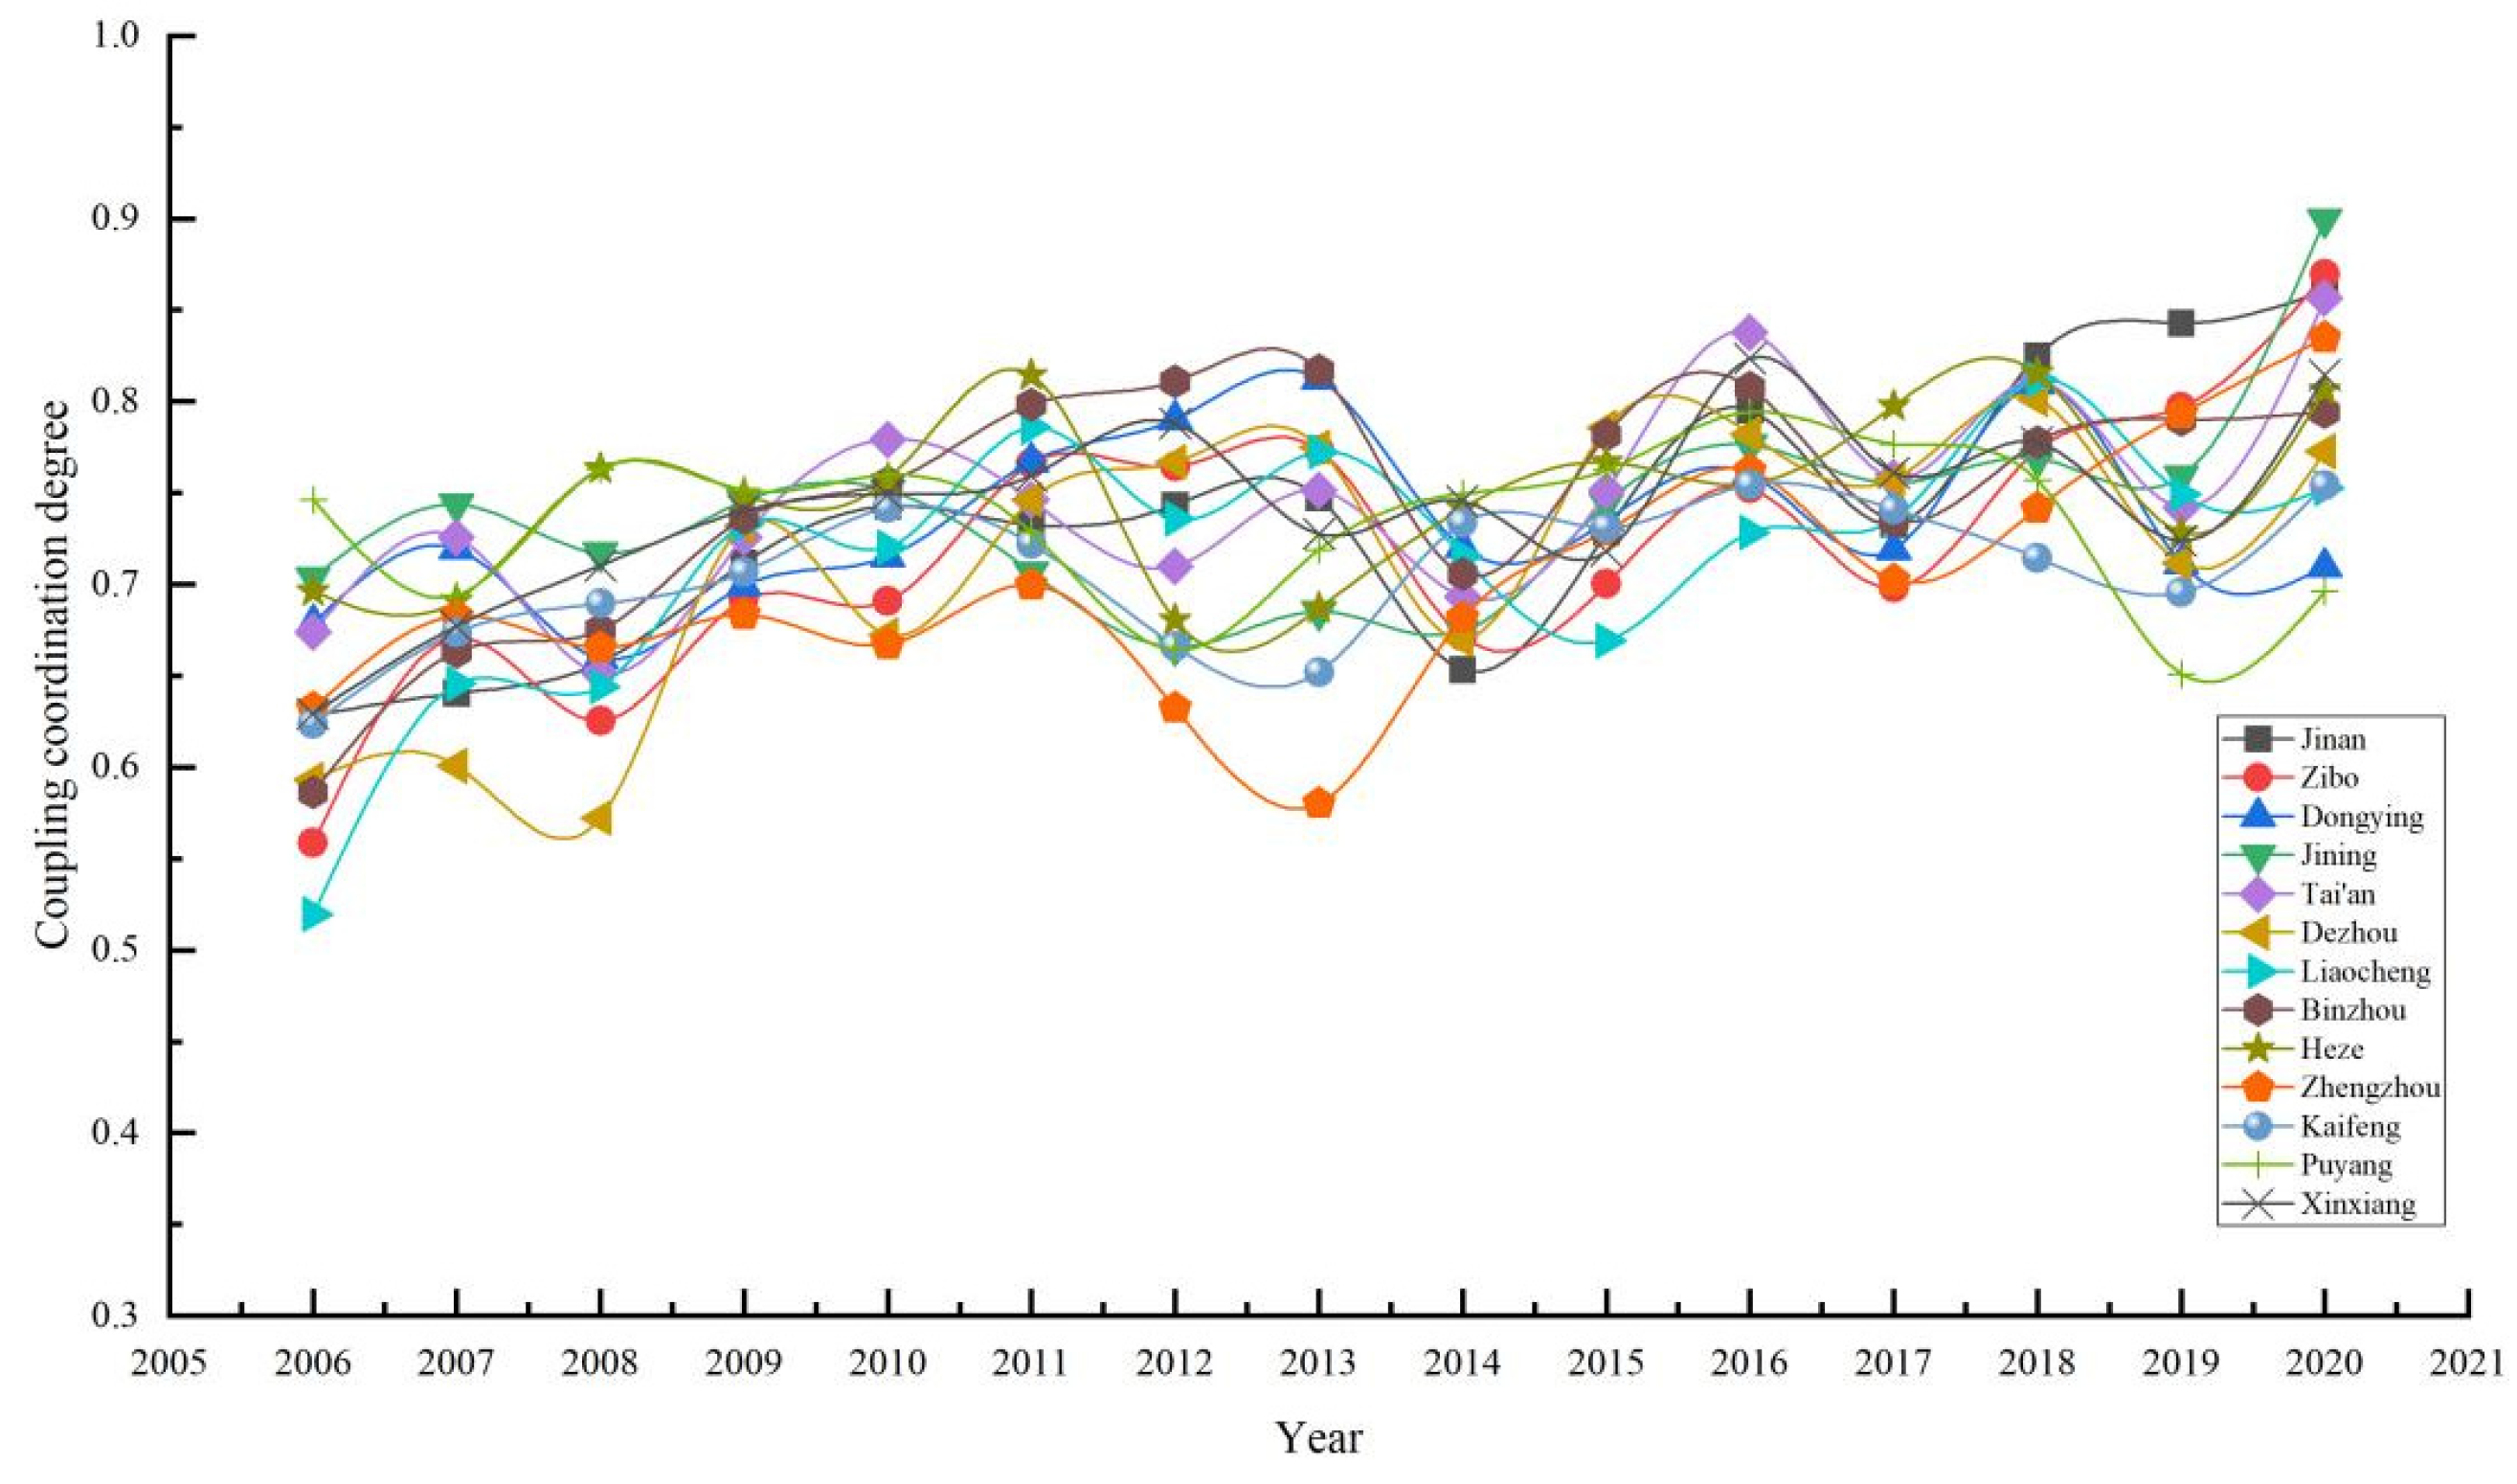
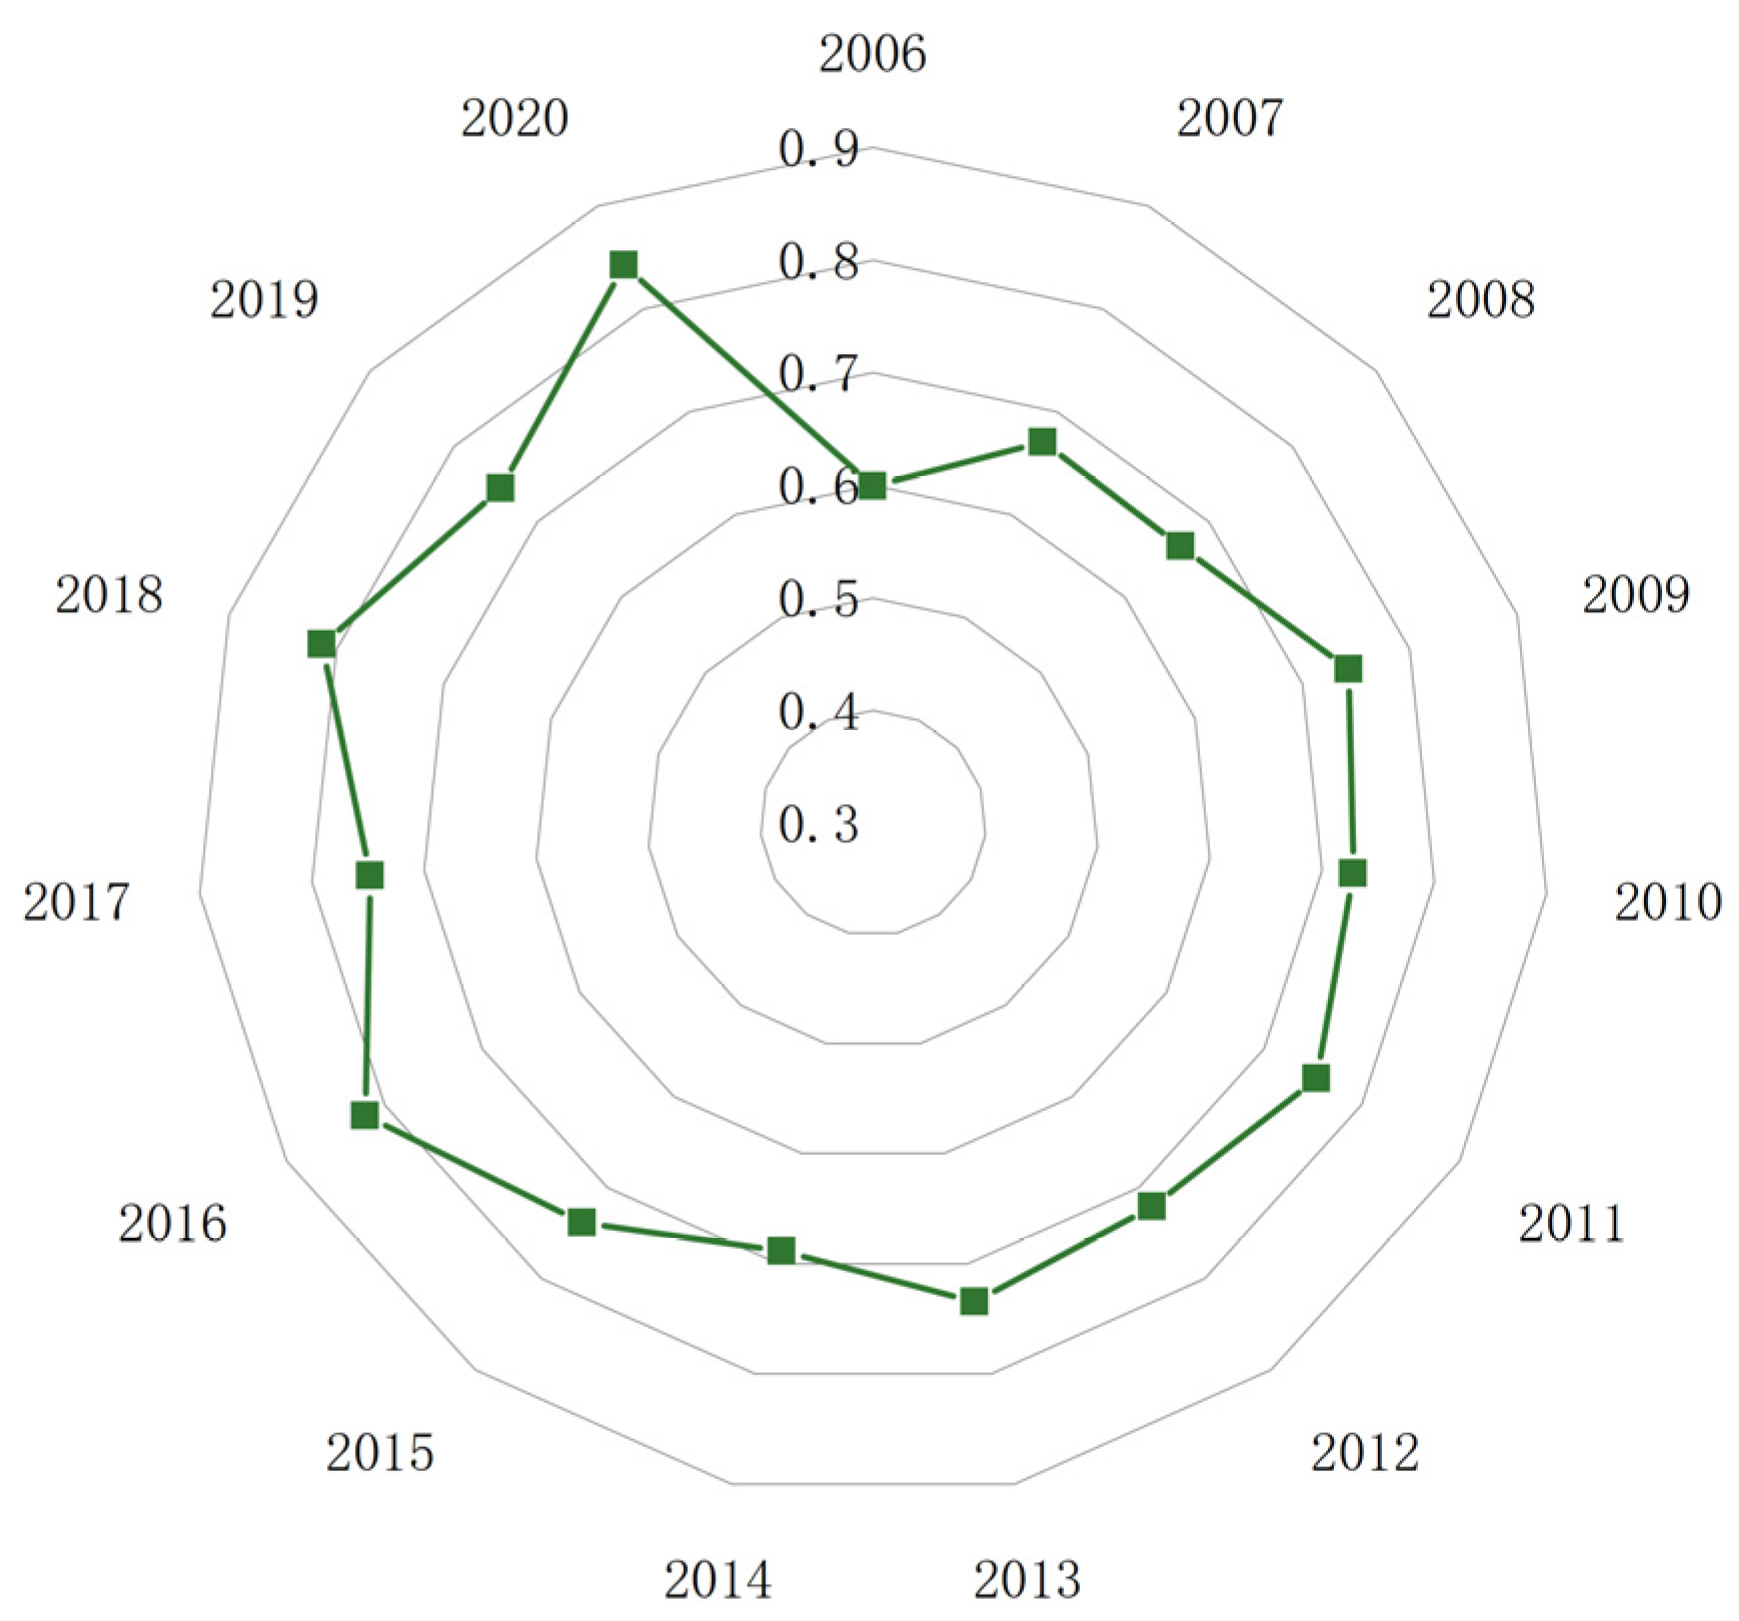
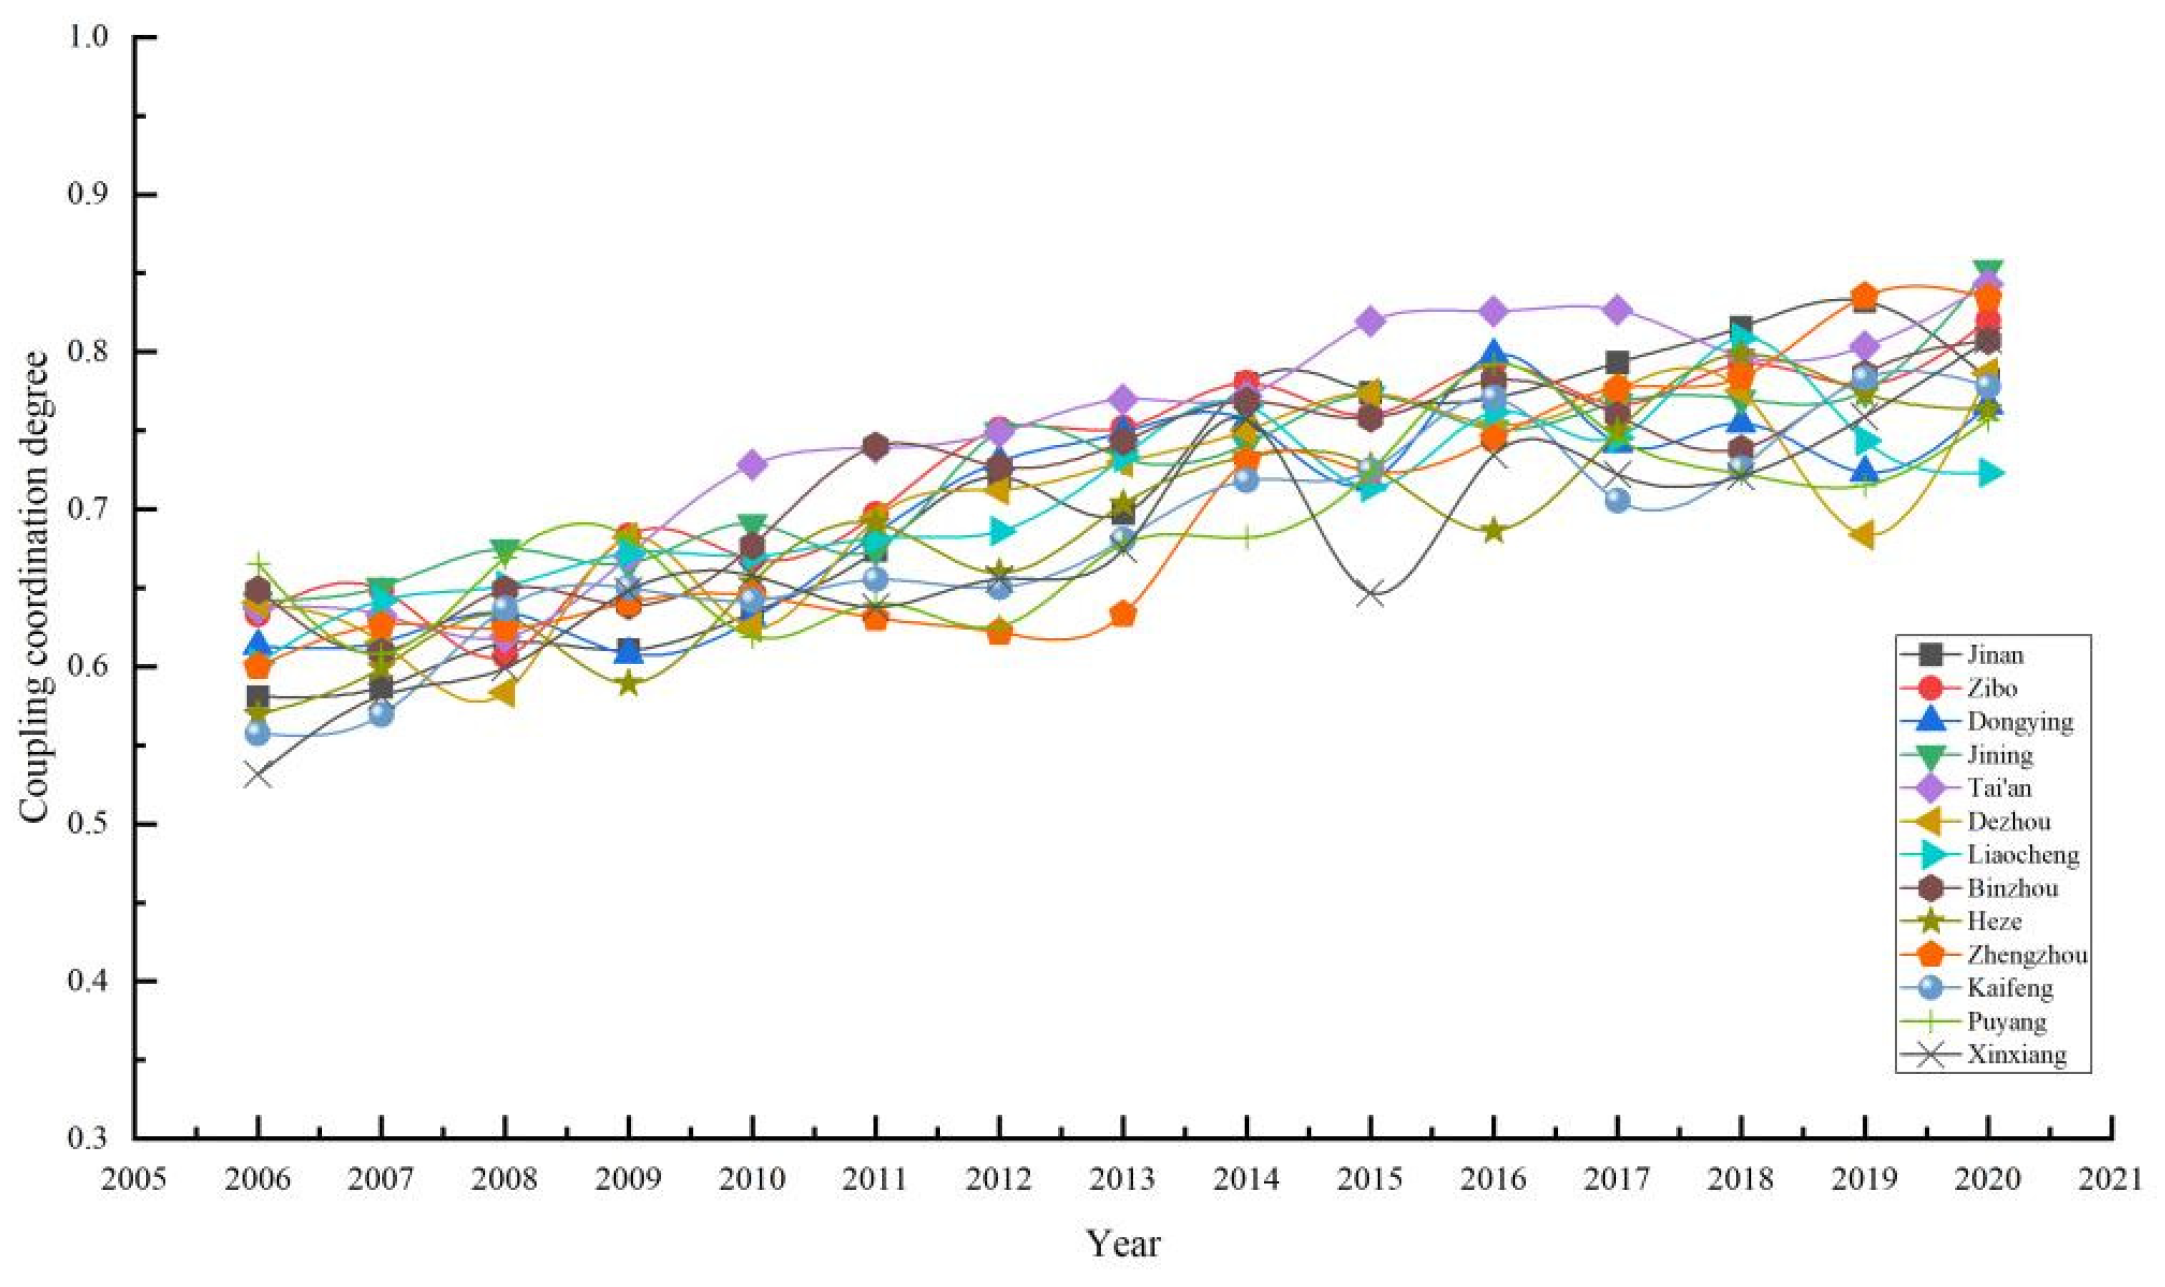
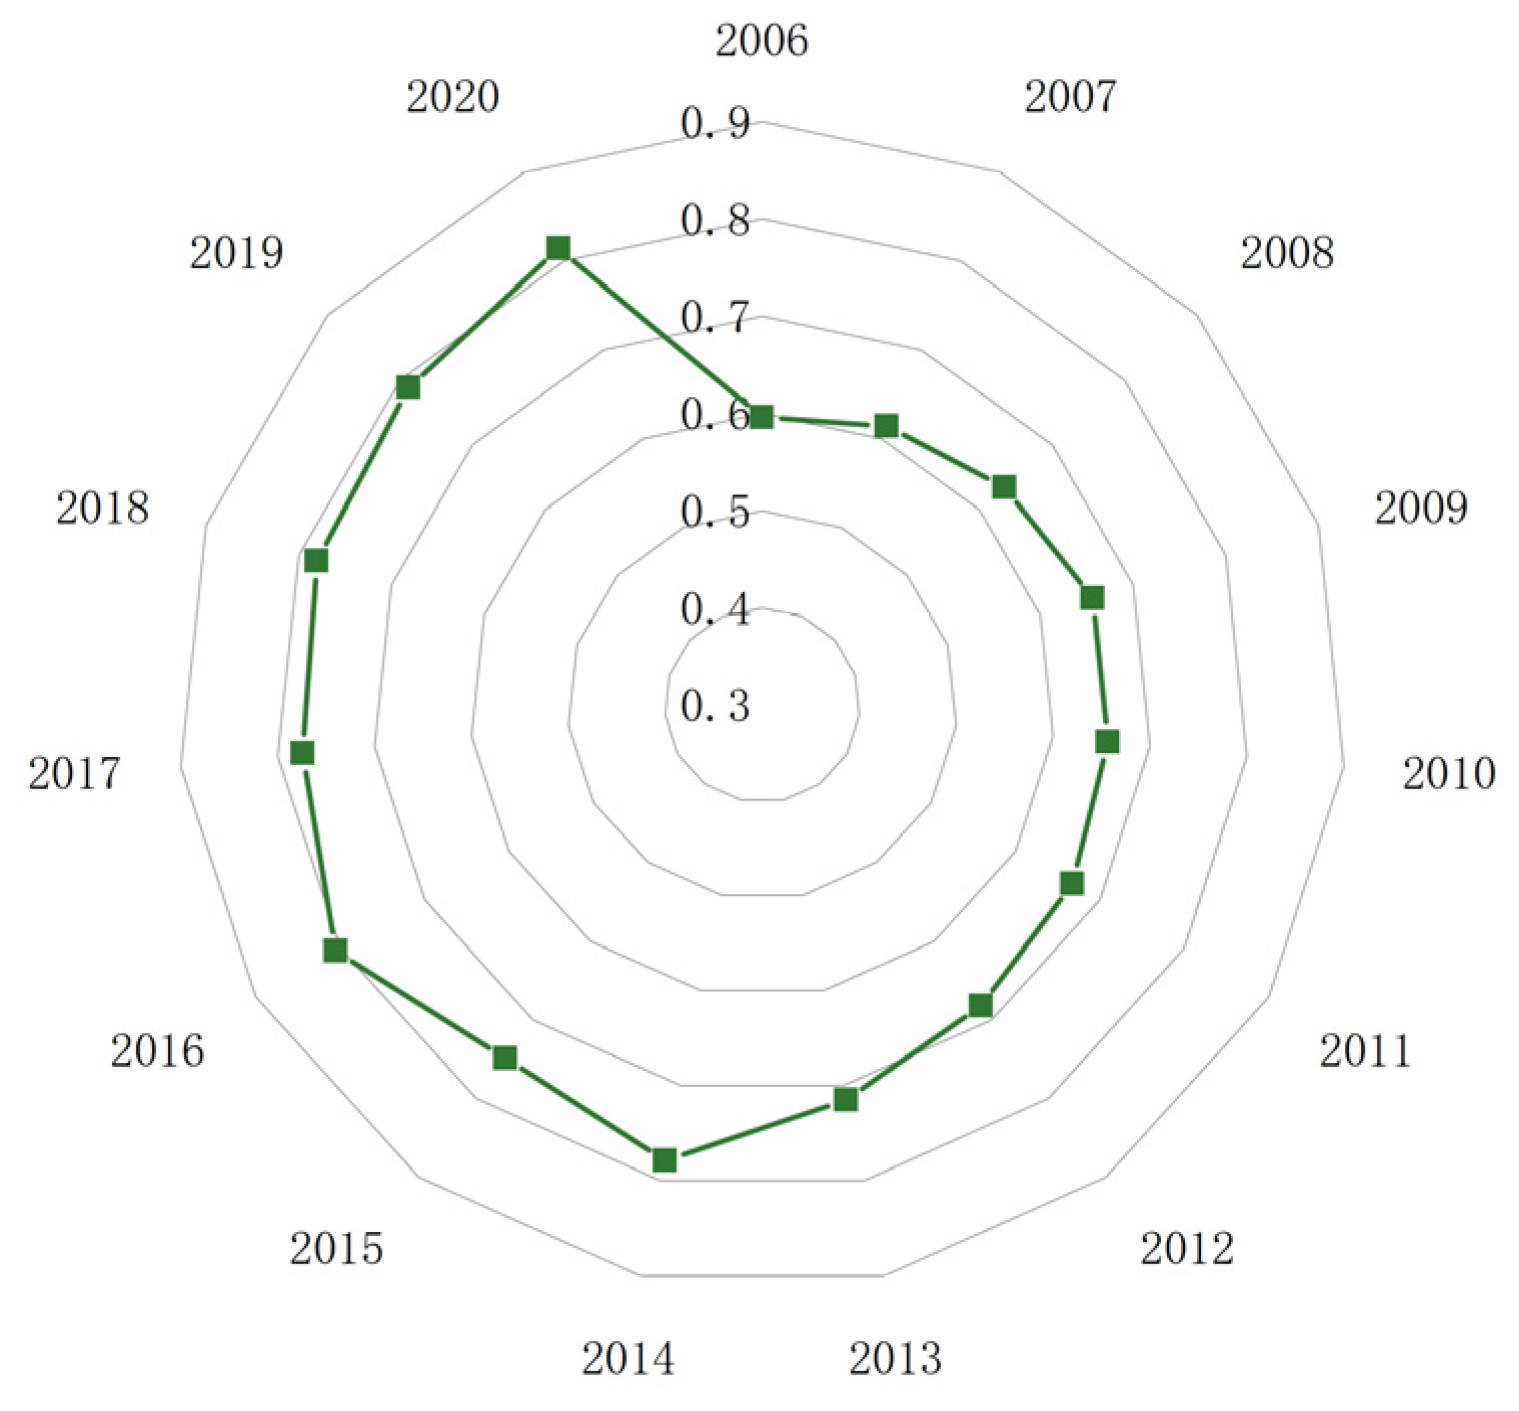


| Serial Number | System | Tier 1 Indicators | Tier 2 Indicators | Indicator Calculation | Unit |
|---|---|---|---|---|---|
| 1 | Water | Water supply capacity | Average annual rainfall | Multi-year rainfall/year | mm |
| 2 | Water resources per capita | Total water resources/total population | m3/person | ||
| 3 | Number of water production systems | Total water resources/total annual rainfall | - | ||
| 4 | Modulus of water supply | Water supply/land area | 106 m3/km2 | ||
| 5 | Water resources modulus | Total water resources/land area | 106 m3/km2 | ||
| 6 | Comprehensive production capacity of urban public water supply | Statistics | million m3/d | ||
| 7 | Water consumption | Total water consumption | Total annual water consumption | m3 | |
| 8 | Water resources development and utilization | Water consumption/total water resources | % | ||
| 9 | Water demand per capita | Water requirement/total population | m3/person | ||
| 10 | Water consumption of CNY 10,000 GDP | Water consumption/GDP | m3/million | ||
| 11 | Economy | Population development | Natural population growth rate | Birth rate-death rate | ‰ |
| 12 | Economic development | GDP per capita | GDP/total population | yuan/person | |
| 13 | GDP growth rate | (Current GDP-base year GDP)/base year GDP | % | ||
| 14 | Proportion of primary production | Ratio of primary industry output to GDP | % | ||
| 15 | Proportion of secondary production | Ratio of secondary industry output to GDP | % | ||
| 16 | Ratio of tertiary production | Ratio of tertiary sector output to GDP | % | ||
| 17 | General budget revenue | Statistics | Billion | ||
| 18 | Social development | City municipal utilities construction Fixed asset investment completion | Statistics | Billion | |
| 19 | Total retail sales of social consumer goods | Statistics | 1010 yuan | ||
| 20 | Balance of deposits in financial institutions at the end of the year | Statistics | 1010 yuan | ||
| 21 | Urbanization rate | Urban population/total population | % | ||
| 22 | Environment | Atmospheric environment | PM2.5 | Statistics | µg/m3 |
| 23 | Carbon dioxide emissions | Total gas supply, total electricity consumption, and total heat supply are summed by multiplying the carbon emission factors | million tons | ||
| 24 | Water environment | Wastewater discharge | Statistics | million m3 | |
| 25 | Sulfur dioxide emissions | Statistics | tons/year | ||
| 26 | Ecological environment | Ecological water use rate | Ecological water consumption/total water consumption | % | |
| 27 | Ecological attention | Government documents word frequency search | times | ||
| 28 | Social environment | Greening coverage of built-up areas | Greening coverage area/total area | % | |
| 29 | Harmless disposal rate of domestic waste | Amount of harmless disposal of domestic waste/total domestic waste | % | ||
| 30 | Sewage treatment rate | Wastewater treatment capacity/total sewage discharge | % |
| Degree of Coupling Category | Degree of Coupling Descriptor | Degree of Coupling Coordination Category | Type of Coupling Coordination |
|---|---|---|---|
| [0.0–0.3] | Low-level coupling | [0.0–0.1] | Extremely dysfunctional recession |
| (0.1–0.2] | Severe dysregulation recession | ||
| (0.3–0.5] | Low-level coupling | (0.2–0.3] | Moderate dysregulation recession |
| (0.3–0.4] | Mild dysregulation recession | ||
| (0.5–0.8] | Breaking-in coupling Breaking-in coupling | (0.4–0.5] | On the verge of dysfunctional recession |
| (0.5–0.6] | Barely coordinated development | ||
| (0.6–0.7] | Primary coordination development | ||
| (0.8–1.0] | High-level coupling | (0.7–0.8] | Intermediate coordination development |
| (0.8–0.9] | Good coordination development | ||
| (0.9–1.0] | High-quality coordinated development |
| Year | Total Water Consumption (Billion m3) | Water Resources per Capita (m3) | ||||
|---|---|---|---|---|---|---|
| Actual Value | Simulated Value | Relative Error % | Actual Value | Simulated Value | Relative Error % | |
| 2013 | 214.71 | 216.51 | 0.84 | 230.17 | 229.27 | −0.39 |
| 2014 | 206.84 | 211.62 | 2.31 | 134.95 | 133.87 | −0.80 |
| 2015 | 208.10 | 212.45 | 2.09 | 170.27 | 168.11 | −1.27 |
| 2016 | 210.37 | 215.58 | 2.48 | 218.90 | 214.71 | −1.91 |
| 2017 | 212.32 | 218.12 | 2.73 | 159.04 | 155.21 | −2.41 |
| 2018 | 217.51 | 223.7 | 2.85 | 252.46 | 245 | −2.95 |
| 2019 | 234.48 | 237.24 | 1.18 | 147.26 | 143.83 | −2.33 |
| 2020 | 225.19 | 229.68 | 1.99 | 225.59 | 226.3 | 0.31 |
| Year | GDP per Capita (CNY) | Total Retail Sales of Social Consumer Goods (1010 CNY) | ||||
|---|---|---|---|---|---|---|
| Actual Value | Simulated Value | Relative Error % | Actual Value | Simulated Value | Relative Error % | |
| 2013 | 50,302.95 | 50,103.7 | −0.40 | 11.60 | 12.075 | 4.07 |
| 2014 | 53,820.22 | 53,389.1 | −0.80 | 13.11 | 13.27 | 1.20 |
| 2015 | 56,202.34 | 55,482.8 | −1.28 | 14.70 | 14.465 | −1.57 |
| 2016 | 59,807.59 | 58,660.9 | −1.92 | 16.17 | 15.66 | −3.15 |
| 2017 | 64,860.85 | 63,300.8 | −2.41 | 17.88 | 16.855 | −5.75 |
| 2018 | 69,649.26 | 67,589.1 | −2.96 | 18.32 | 18.05 | −1.48 |
| 2019 | 65,662.32 | 64,134.4 | −2.33 | 19.45 | 19.245 | −1.03 |
| 2020 | 65,529.73 | 65,528.9 | 0.00 | 20.57 | 20.43 | −0.70 |
| Year | Ecological Attention (Times) | Wastewater Discharge (Million m3) | ||||
|---|---|---|---|---|---|---|
| Actual Value | Simulated Value | Relative Error % | Actual Value | Simulated Value | Relative Error % | |
| 2013 | 64,578.00 | 72,866.3 | 12.83 | 25,590.26 | 26,387.944 | 3.12 |
| 2014 | 68,540.00 | 73,443.6 | 7.15 | 26,979.38 | 27,412.683 | 1.61 |
| 2015 | 67,630.00 | 74,020.9 | 9.45 | 29,282.15 | 28,048.6 | −4.21 |
| 2016 | 77,231.00 | 74,598.2 | −3.41 | 26,245.46 | 28,205.257 | 7.47 |
| 2017 | 75,641.00 | 75,175.5 | −0.62 | 27,654.38 | 27,792.216 | 0.50 |
| 2018 | 74,721.00 | 75,752.8 | 1.38 | 28,460.92 | 26,719.039 | −6.12 |
| 2019 | 82,181.00 | 76,330.1 | −7.12 | 25,289.31 | 24,895.288 | −1.56 |
| 2020 | 80,556.00 | 76,907.4 | −4.53 | 21,410.23 | 22,230.525 | 3.83 |
Disclaimer/Publisher’s Note: The statements, opinions and data contained in all publications are solely those of the individual author(s) and contributor(s) and not of MDPI and/or the editor(s). MDPI and/or the editor(s) disclaim responsibility for any injury to people or property resulting from any ideas, methods, instructions or products referred to in the content. |
© 2023 by the authors. Licensee MDPI, Basel, Switzerland. This article is an open access article distributed under the terms and conditions of the Creative Commons Attribution (CC BY) license (https://creativecommons.org/licenses/by/4.0/).
Share and Cite
Wang, A.; Wang, S.; Liang, S.; Yang, R.; Yang, M.; Yang, J. Research on Ecological Protection and High-Quality Development of the Lower Yellow River Based on System Dynamics. Water 2023, 15, 3046. https://doi.org/10.3390/w15173046
Wang A, Wang S, Liang S, Yang R, Yang M, Yang J. Research on Ecological Protection and High-Quality Development of the Lower Yellow River Based on System Dynamics. Water. 2023; 15(17):3046. https://doi.org/10.3390/w15173046
Chicago/Turabian StyleWang, Aili, Shunsheng Wang, Shuaitao Liang, Ruijie Yang, Mingwei Yang, and Jinyue Yang. 2023. "Research on Ecological Protection and High-Quality Development of the Lower Yellow River Based on System Dynamics" Water 15, no. 17: 3046. https://doi.org/10.3390/w15173046
APA StyleWang, A., Wang, S., Liang, S., Yang, R., Yang, M., & Yang, J. (2023). Research on Ecological Protection and High-Quality Development of the Lower Yellow River Based on System Dynamics. Water, 15(17), 3046. https://doi.org/10.3390/w15173046


