Article

The Impact of Solar Intermittency on the Concentration Polarization Factor, Water Quality and Specific Energy Consumption in the Reverse Osmosis Process

by
Rosario Montoya-Pizeno
1,
Deemi Paola Morales-Mendivil
1,
Rafael Enrique Cabanillas-López
2 and
Germán Eduardo Dévora-Isiordia
1,*
1
Departamento de Ciencias del Agua y Medio Ambiente, Instituto Tecnológico de Sonora, Calle 5 de Febrero 818 Sur, Ciudad Obregón 85000, Sonora, Mexico
2
Departamento Ingeniería Química, Universidad de Sonora, Hermosillo 83000, Sonora, Mexico
*
Author to whom correspondence should be addressed.
Water 2023, 15(17), 3022; https://doi.org/10.3390/w15173022
Submission received: 23 June 2023 / Revised: 16 July 2023 / Accepted: 24 July 2023 / Published: 22 August 2023

Abstract

:
Water scarcity has prompted the use of desalination technologies such as reverse osmosis (RO) due to its low energy requirement and high production rate. In the present article, the concentration polarization factor (β) was evaluated in RO processes, in batch and continuous systems and with an alternating current (AC) and direct current (DC) to desalinate water with 10,000 mg L−1 of total dissolved solids (TDS). In DC, the power variation and its effect on β was evaluated by simulating intermittent solar photovoltaic radiation. The specific energy consumption (SEC) in kWh m−3, the water quality in mg L−1 of TDS and β were evaluated. In a batch process, 3.98 and 3.85 kWh m−3 were required for AC and DC, respectively. In a continuous process with AC, 3.79 kWh m−3 was required, and for DC, it decreased by 17.93%. The permeate water quality was evaluated with reference to the Mexican standard of 1000 mg L−1 in TDS. A TDS concentration of 1631 mg L−1 was found in batch–AC processes, and a TDS concentration of 747 mg L−1 was found in batch–DC processes. In continuous AC–DC processes, the TDS concentration did not exceed 1000 mg L−1. The permitted β limit was 1.2. The result of the batch process when using DC was 1.007, while for AC, it was 1.022. In continuous processes with AC, the β was 1.008, and in DC, it was 1.012. The results prove that the intermittency due to power variation is an alternative way to reduce the concentration polarization factor, with effects that include a reduction in the specific energy consumption and an improvement in the permeate water quality.

1. Introduction

Industrial development and rapid population growth require a high consumption of resources, which has led to around four billion people currently suffering from water and energy shortages [1,2,3,4]. The water problem has generated great concern, as it is a vitally important resource, which is why new supply technologies are being sought [1], including (RO) desalination. Although this technology is promising for obtaining drinking water from brackish or marine water for use in different sectors, such as industry, agroindustry and human consumption, its development has been questioned by environmental organizations due to its high electricity consumption and the controversy regarding the high concentration of wastewater and its handling and disposal into the marine environment [5]. For this reason, in recent years, the use of renewable energy (RE) has been promoted for the operation of RO plants [6,7,8,9,10].
As a technology based on the removal of colloids, heavy metals, suspended solids and mainly salts and other ions found in water, one of its main disadvantages is concentration polarization (CP). This phenomenon is the formation of a concentrated solute layer of rejected salts on a membrane surface (Figure 1), with severe repercussions to the process, including affecting the conversion efficiency (%), reducing the permeate flux (L m−2h−1), increasing the operating pressure (MPa) and increasing the specific energy cost (kWh m−3), in addition to reducing the membrane’s lifetime due to abrasive forcing and scaling [11]. One way to evaluate this phenomenon is by means of determining the concentration polarization factor (β) [12,13,14].
Compared to other desalination technologies, such as MSF, MED and MVC, RO plants require less energy consumption; however, since their inception, they have been powered by fossil fuels using alternating current (AC). It is estimated that, to produce 1 m3 of permeate water, the specific energy consumption (SEC) varies from 2 to 4 kWh m−3 [15] and depends on the plant’s design, such as the type of membranes used, the energy recuperators and the step–stage design, and the feed water characteristics, such as the total dissolved solid (TDS) concentration and fouling.
An economic and technical feasibility analysis of an RO process is based partly on the cost of water (USD per m−3), but mainly on the evaluation of the SEC (kWh m−3) required for the production of quality permeate water according to current regulations. Some authors state that, for RO plants with a large production capacity (100,000 to 320,000 m3 d−1), the water production cost varies from USD 0.45 to 0.66 per m3; for medium-sized RO plants with a production capacity of 15,000 to 60,000 m3 d−1, the production cost is USD 0.48 to 1.62 per m3; and in plants with a lower production capacity (1000 to 4800 m3 d−1), the cost is USD 0.7 to 1.72 per m3 [16,17].
Currently, the use of renewable energies as a source of direct current (DC) driving energy for RO processes is essential. Razeghi et al. [15] mentioned that such harnessing reduces the energy consumption and the environmental impact compared to other conventional desalination technologies such as deionization (DI), electrodialysis (ED) and the aforementioned thermal technologies (MSF, MED and MVC). Solar photovoltaic (PV) energy, due to its great boom, presents the ability to mitigate the incrustation of salts on membrane surfaces due to the effect of the intermittent solar irradiance throughout the day (clouds, sunshine and rain) and its incidence on the photovoltaic effect [18,19].
In Figure 2, the green and red circles indicate the start and stop of the pumping system, while the yellow circles indicate the power supplied to the RO process for a seawater feed of 34,500 mg L−1 of TDS, representing an operating pressure of 5.51 MPa ± 0.20 MPa and a power requirement of 1200 W. Three different scenarios in a reverse osmosis process are also schematized: (a) the operation of a high-pressure reverse osmosis pumping system with an alternating current, (b) the operation of a high-pressure reverse osmosis pumping system with a direct current on a sunny day and (c) the operation of a high-pressure reverse osmosis pumping system with a direct current during a cloudy–rainy–sunny period on the same day.
This intermittent DC power supplied to high- and low-pressure pumps in the RO process causes fluctuations in the power (W) and consequently changes in the operating pressure (MPa) and in the permeate flow obtained (m3 d−1), which favors the detachment of the CP, mainly on sunny days, by having higher and lower power supplies than required. Solar intermittency indirectly favors permeate water quality due to the mixture of different concentrations obtained, which decreases the use of post-treatment for remineralization [20,21]. This is different in the alternating current supply, where the power is constant over time, generating a continuous salt deposition on the membrane’s surface, with subsequent scaling problems.
As can be deduced, the application of intermittent pulses on the RO membranes with PV reduces the salt deposition and increases the permeate flux [6,20,22]. However, there are few studies relating solar energy intermittency with respect to concentration polarization and its effect on specific energy consumption. In this paper, the effect of solar intermittency on the concentration polarization factor (β), the specific energy consumption (SEC) and the permeate water quality was evaluated with two driving power supplies for the current pumping electrical system: AC and DC.

2. Materials and Methods

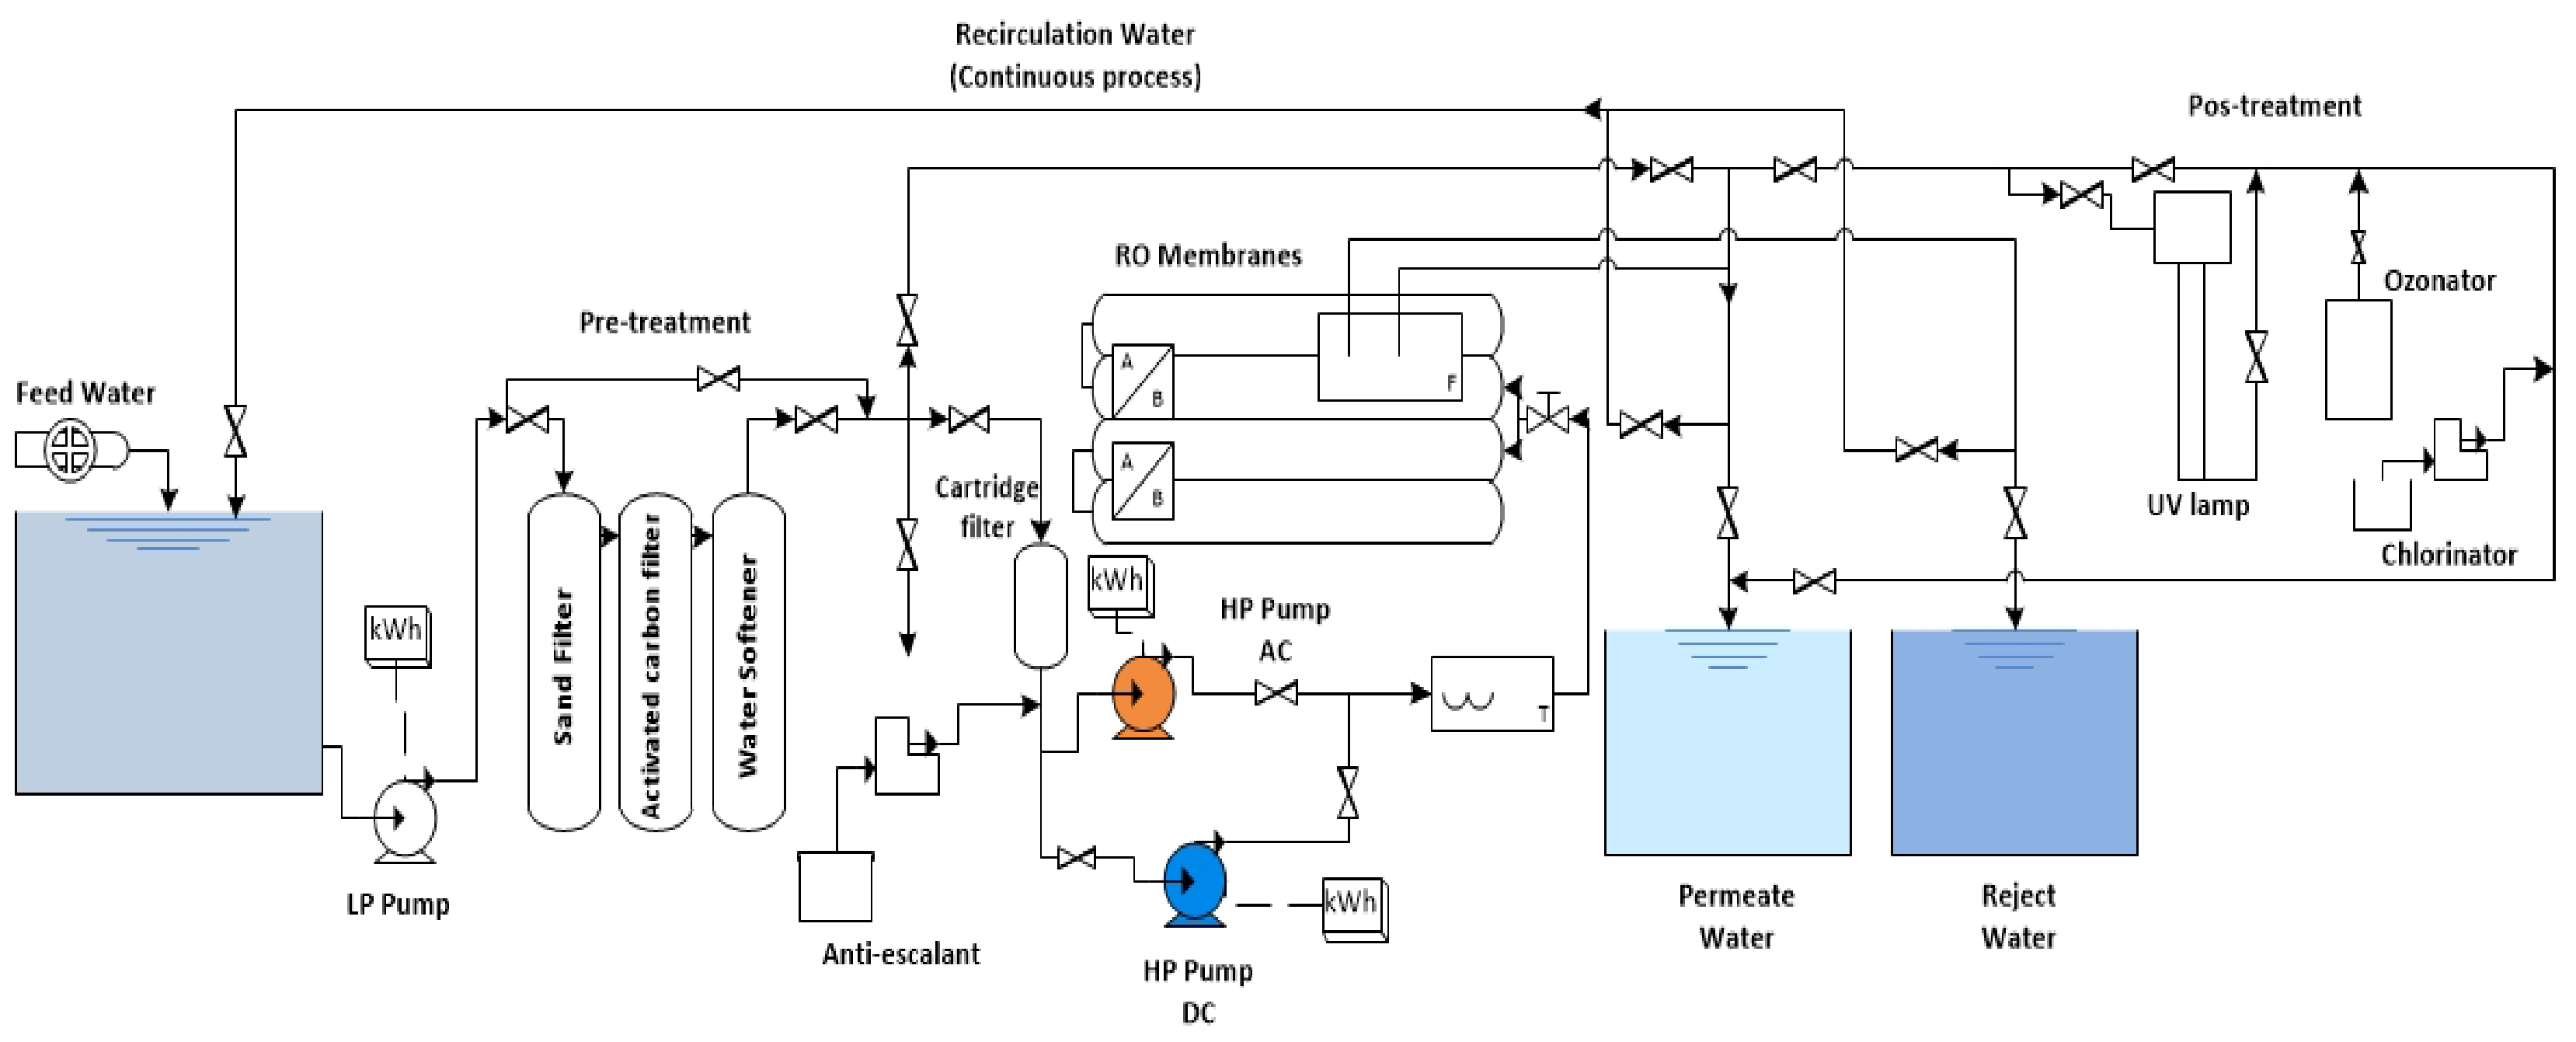
2.1. Description of Desalination Plant

An RO desalination plant was operated (see Figure 3), located at the Chemical Engineering and Food Research Laboratory (CEFR) at the Instituto Tecnológico de Sonora in Mexico, with coordinates latitude north 27.4934238° and longitude east −109.969945°. The desalination plant has a nominal capacity of 5.76 m3 d−1 and consists of four 4” * 40” commercial modules, and the model SWC4-MAX of the Hydranautics brand [14]. The membranes operate with a permeate flux of 27.3 m3 d−1, a salt rejection of 99.8%, an effective membrane area of 40.9 m2 and can withstand a maximum pressure of 8.27 MPa. This RO equipment does not have an energy recovery device (ERD). The pretreatment stage consists of a sand filter with a retention capacity of 30 µm, an activated carbon filter and a softener with a volume of 2.12 m3 with operating and backwashing heads, respectively. At the end of the pretreatment is a 5 µm cartridge filter. Water post-treatment was performed with ultraviolet (UV) rays (WEDECO UV Technologies Inc., Charlotte, NC, USA, Model NLR1845WS).

Desalination Performance of Membranes

A solution concentration of 10,000 mg L−1 of TDS was prepared by mixing municipal tap water and synthetic salt (Instant Ocean Sea Salt, Carolina Biological Supply Company, Burlington, NC, USA) containing all the elements of the sea. Membrane performance was evaluated by calculating inherent equations, which serve to determine membrane performance during the process [13,23,24,25,26].

2.2. Equations Inherent in the RO Process

The permeate flux was calculated using Equation (1).
J v = P T M Γ p Γ f μ f R m
where PTM is the transmembrane pressure in Pa s; Γ f   y   Γ p correspond to the osmotic pressure of feed and permeate water in Pa s; μ a is feed water viscosity in Pa s and R m is membrane resistance in m−1.
The conversion percentage was calculated using Equation (2).
( % ) R = Q p Q f 100
where Q p   y   Q f represent the permeate and feed water flow rate (m3 s−1), respectively.
The permeance was obtained by means of Equation (3).
L p = J v P T M
where J v is flux in m s−1 and PTM is the transmembrane pressure in Pa s.
The percentage of salt rejection was obtained using Equation (4).
%   S R = 1 C p C f 100
where C f   y   C p are the concentration of salts in feed and permeate water in mg L−1.
Last but not least, the polarization factor β was calculated by means of Equation (5)
β = e J v k m t
where J v is flux in m s−1 and k m t is the mass transfer coefficient.

Determination of the Specific Energy Consumption of the Desalination Plant

To determine the specific energy consumption (SEC) in kWh m−3, the following equation was applied [27,28]:
S E C = C H P P + C L P P t Q p 1000
where C H P P   y   C L P P represent the energy consumption of the high- and low-pressure pump motor in kWh, respectively, t is the process time in minutes and Q p is the permeate flow rate in m3 s−1.
Finally, an analysis of the pH, electrical conductivity (mS cm−1), residual chlorine (mg L−1), turbidity (UTN) and hardness (mg L−1) was performed to compare the quality of permeate water with the permissible limits of the Mexican standard in order to evaluate whether it is suitable for human use and consumption. This required multiparameter equipment model YSI 556 MPS (YSI Environmental, Yellow Springs, OH, USA) to measure the TDS, electrical conductivity and pH; a chlorine analyzer kit (Pentair water pool and spa, inc., Hawkins NC, USA); a nephelometer to measure turbidity (Allmendgrun, Ortenberg, Germany) and a Pentair kit to measure total hardness (Pentair water pool and spa, Inc., Hawkins NC, USA) [28].

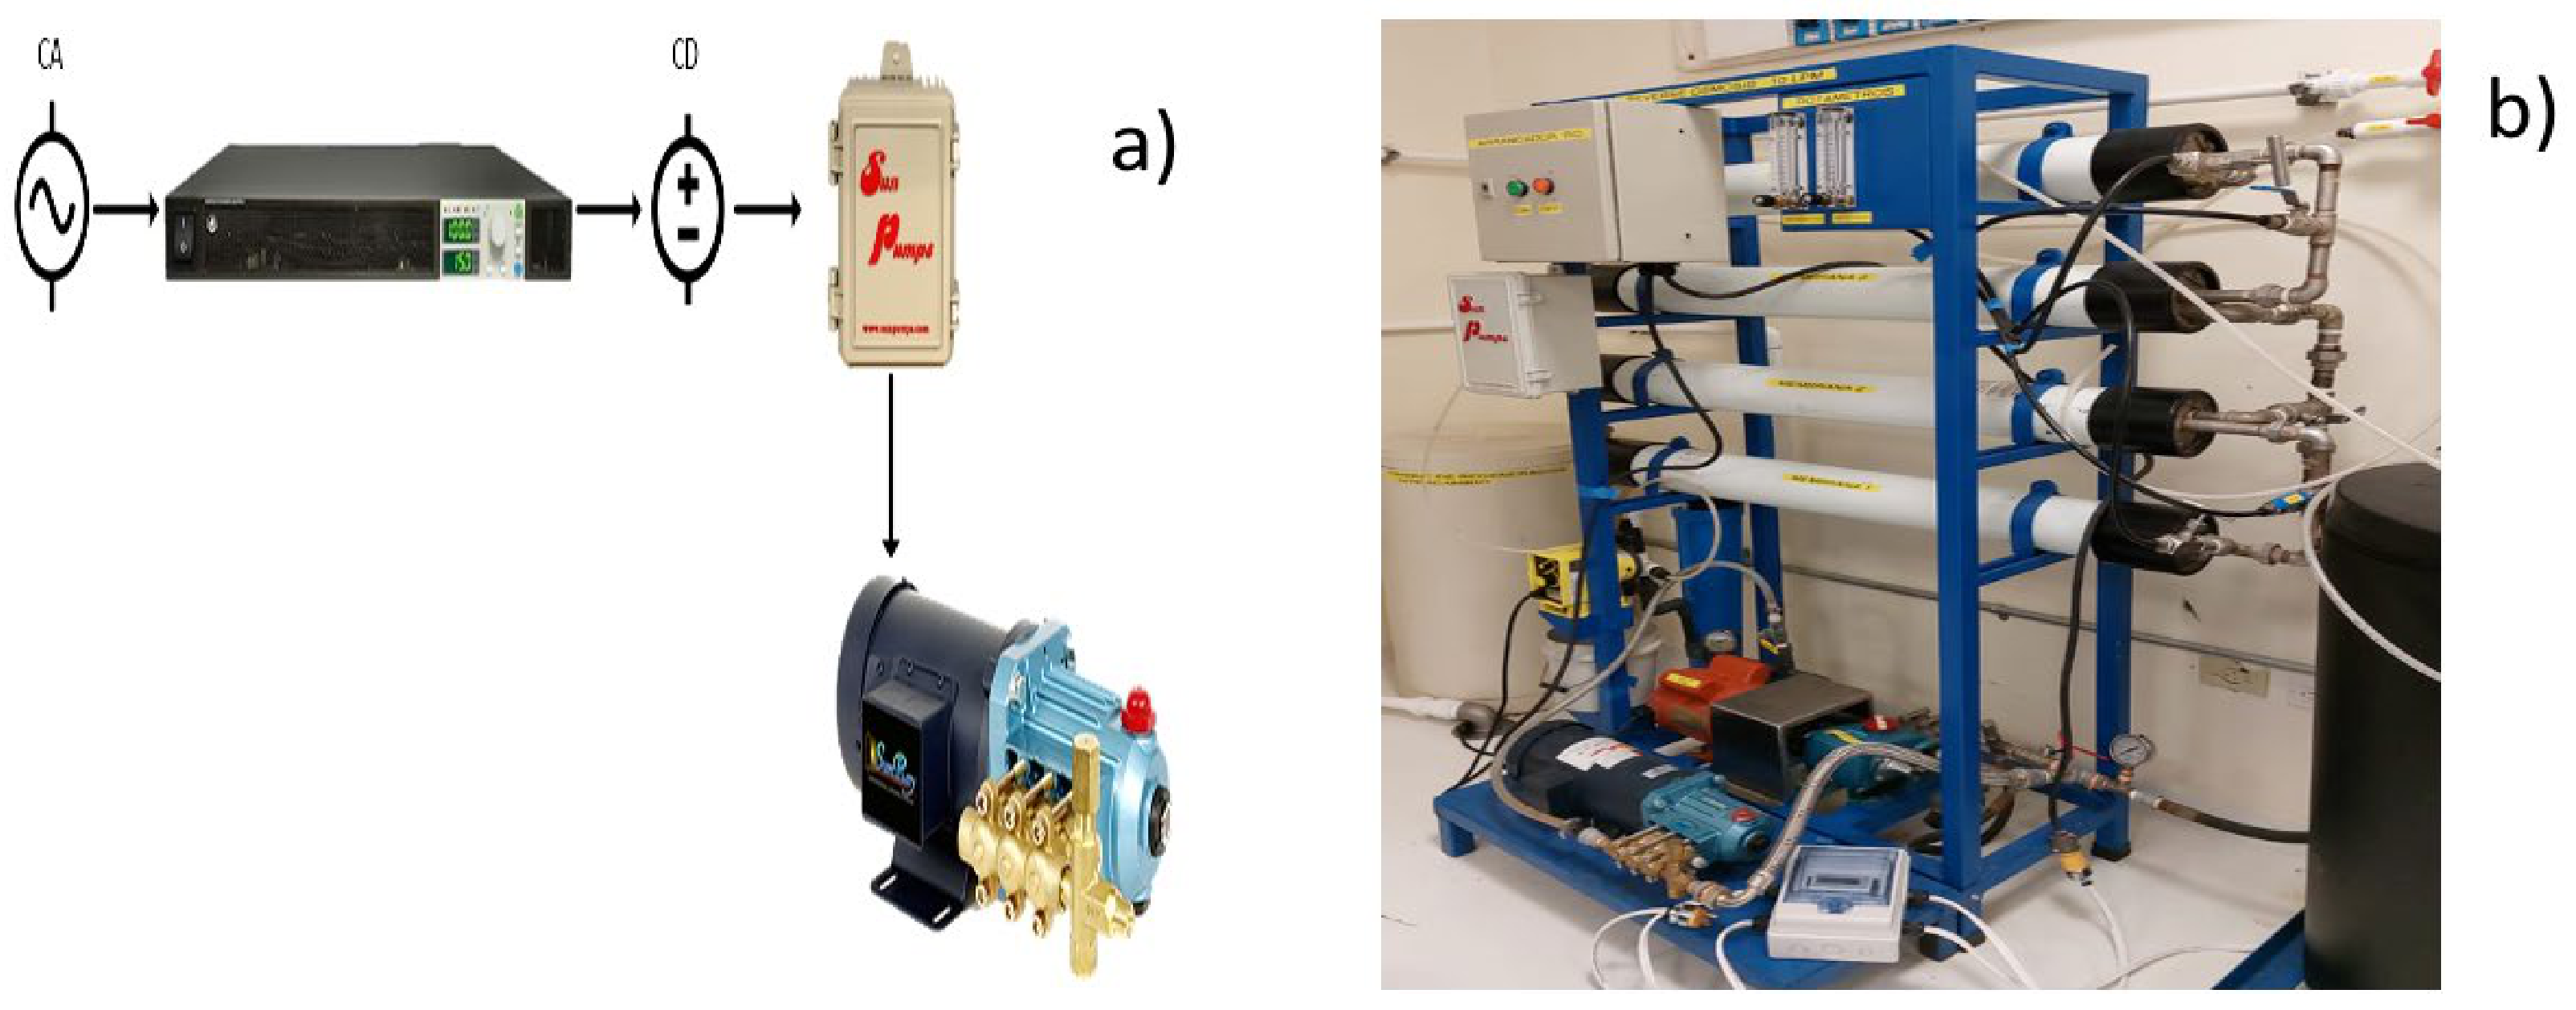
2.3. AC and DC Electrical Equipment Used in RO Process

For direct current, the electrical equipment required to carry out the RO process are as follows: KEPCO power supply model KLN 150-10 (Kepco, Naju-si, South Jeolla Province, Republic of Korea) with an output of 1500 W to power the high-pressure pump motor in DC; Sun Pumps PCC-BT-M2 controller (Sunpumps, Inc., Safford, AZ, USA) as intelligent power control for the water pumping system SIJ 2.4-900P-180 BT (SunPumps, Inc., Safford, AZ, USA), with an efficiency at 150 V of 66% (Figure 4); SIEMENS model 1RF3 058-4YB41 single-phase AC high-pressure motor pump with a nominal efficiency of 84% and a flow rate of 10 L min−1; and, finally, a TECNO15 3M model low-pressure centrifugal motor pump (Flotec, Delavan, WI, USA). For alternating current, a 2 HP high-pressure pump motor (SIEMENS 1RF3 058-4YB41, Siemens, Munich, Germany) was used to increase the pressure of the feed water with a nominal efficiency of 84% and a flow rate of 10 L min−1.

2.4. Experimental Design

The experimentation to obtain the concentration polarization factor (β) was performed in triplicate and was divided into two stages, batch and continuous, for two power supply currents in AC and DC, for a total of 18 tests. For the batch case, the desalting process was operated for 24 min, which was the time when the feed tank was emptied. The desalination process was also operated continuously for 60 min, for which the permeate and reject water were recirculated to the feed tank in order to evaluate the effect of salt deposition on the active surface of the membrane, with respect to the operation time of the RO process (see Figure 3).

2.4.1. Evaluation of β, SEC and Water Quality in a Batch RO Process

The operation of the batch RO process was carried out in 24 min. The polarization factor, specific energy consumption and water quality parameters were evaluated. AC and DC were used in each process. In the case of AC, the samples were taken at a constant power of 382.04 W, while in the DC supply, different powers were applied (Table 1). For both currents, 5 samples were taken at times of 8, 12, 16, 20 and 24 min.

2.4.2. Evaluation of β, SEC and Water Quality in a Continuous RO Process

In the continuous reverse osmosis process operation, permeate and reject water were recirculated for 60 min (sunny day) and 240 min (sunny and cloudy day) to evaluate the polarization factor, specific energy consumption and water quality parameters. AC and DC were used in each process. Sampling was performed every 5 min (see Table 2). In the case of AC, the power remained constant at 405 W, while in DC, the power varied with the power supply.

3. Results and Discussion

The relevant results regarding the specific energy consumption, water quality and concentration polarization are visualized and explained in Figure 5, Figure 6, Figure 7 and Figure 8.

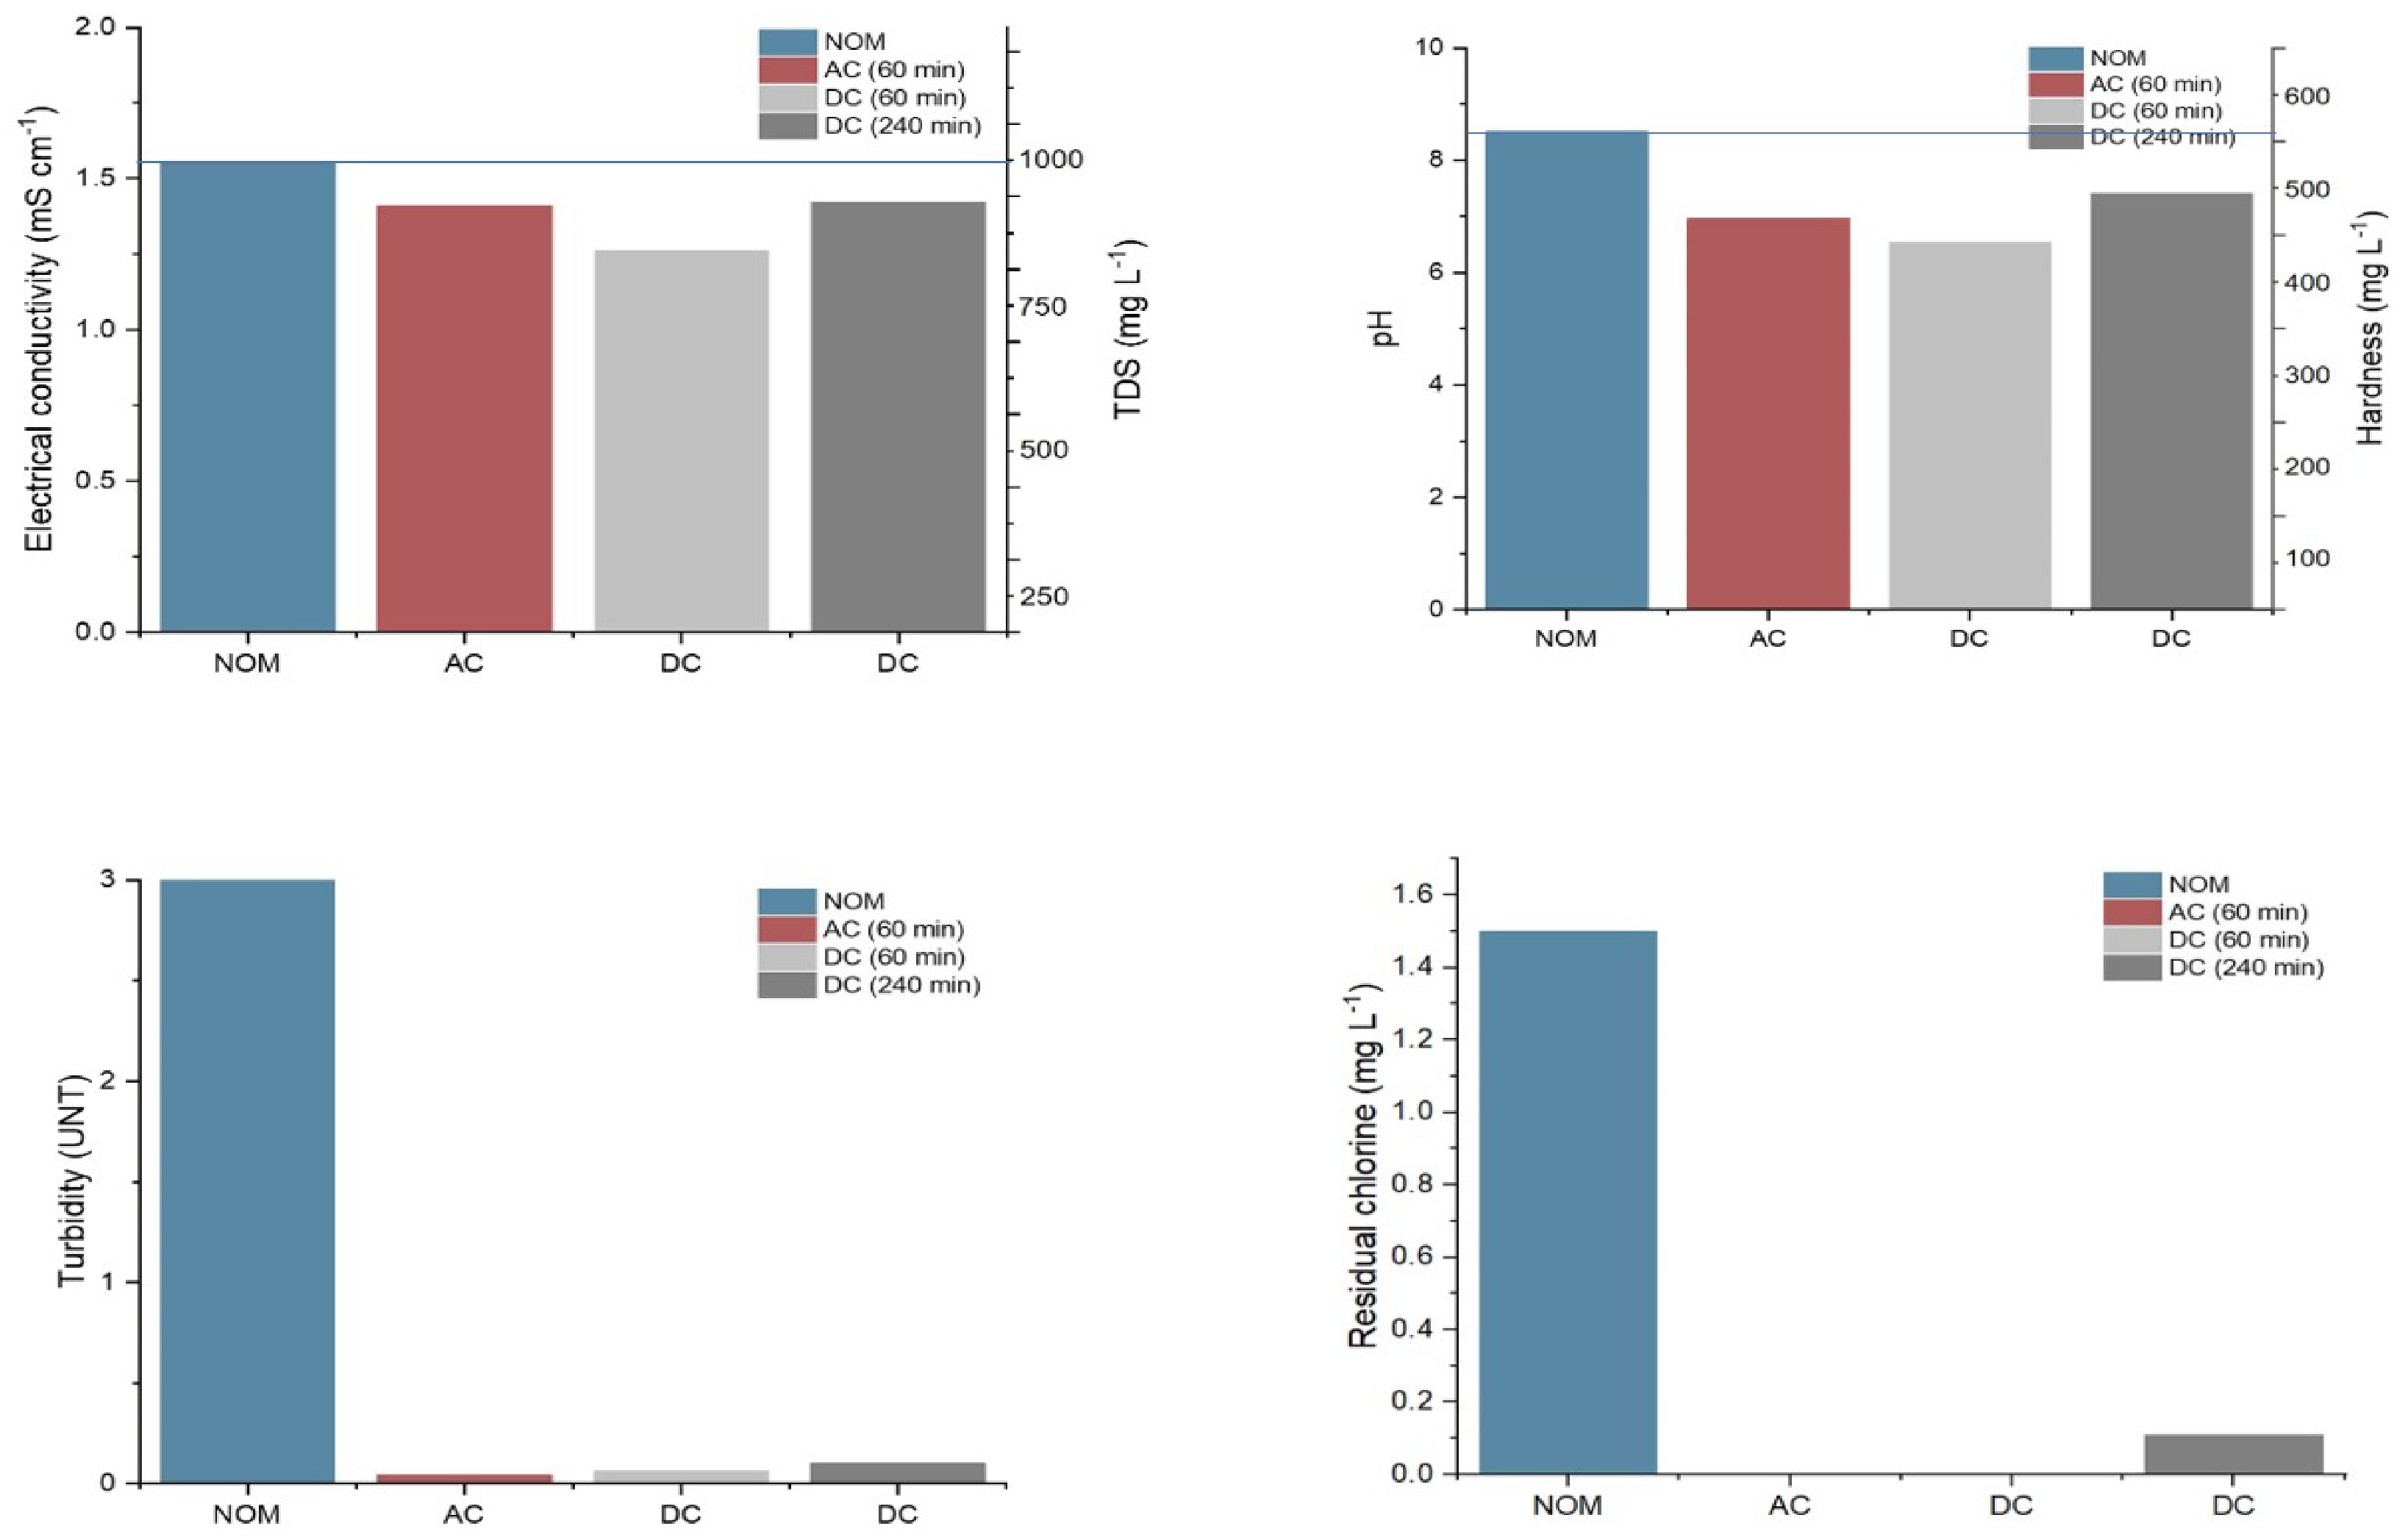
3.1. Permeate Water Quality vs. Official Mexican Standard

The water quality evaluation was performed only in a continuous process during the RO plant operation in 60–240 min of operation (see Figure 5).
Figure 5. Comparison of permeate water quality vs. maximum limits of NOM-127.
Water 15 03022 g005
The values obtained in each analysis comply with NOM-127-SSA1-2021, which establishes the permissible limits for water quality for human use and consumption [29]. The maximum limits are as follows: for TDS, the limit is 1000 mg L−1; for EC, the limit is 1.55 mS cm−1; for pH, the limit is in the range of 6.5–8.5; for residual chlorine, the limit is in the range of 0.2–1.5 mg L−1; for turbidity, the limit is 3 and for hardness, the limit is 500 mg L−1. These values coincide with those reported in [30] for an evaluation of water quality at different feed concentrations using PV-activated RO. For the 240 min experiments with respect to the other times studied, a slight increase in the water quality was observed without exceeding the permissible limits, which was mainly caused by solar intermittency, since the power was intentionally lowered by placing a greater variability in the power source than in the supplied power to observe its effect (see Table 2) [22].
The permeate concentration in the stage and continuous process is shown in Figure 6. In the batch process, when using DC, a power of 432.35 W was required to produce permeate water of 747.51 mg L−1 of TDS, unlike in AC, which had a concentration of 1631 mg L−1 of TDS, which is a value outside of the Mexican official standard. On the other hand, in the continuous process in both streams, the permeate concentration was within the permissible limits. It should be noted that the higher the power, the better the quality of the permeate water [31].
Figure 6. Permeate concentration in relation to the power demanded.
Water 15 03022 g006
Authors such as Freire et al. [30] mention that during solar hours of operation in RO plants activated with photovoltaic modules, better quality permeate water is obtained due to fluctuations in solar radiation that favor obtaining better quality permeate water by mixing high- and low-concentration permeate water flows. These fluctuations cause a vibration on the active surface of the membrane, which is interpreted as a sudden movement in mass transport that prevents the deposition of salts, mainly silica precipitates, silicates and calcium sulfate, because they are strongly insoluble [32]. The concentration of permeate water at the end of the solar hours reduces the remineralization process, which is an advantage of DC over CA [21].
The above is visualized during the batch and continuous processes using DC, since in both cases, the permeate water quality is lower at 747.51 and 814.27 mg L−1 of TDS, with respect to the continuous process using AC at 1631.45 and 913.83 mg L−1 of TDS [14,33]. In the 240 min experiments, a slight increase in the permeate water concentration (947 mg L−1 and 968 mg L−1) is observed due to the power reduction caused by solar intermittency during the longer running time. Thus, the effect of time and climatic conditions on the salt deposition on the active membrane surface can be inferred [34].

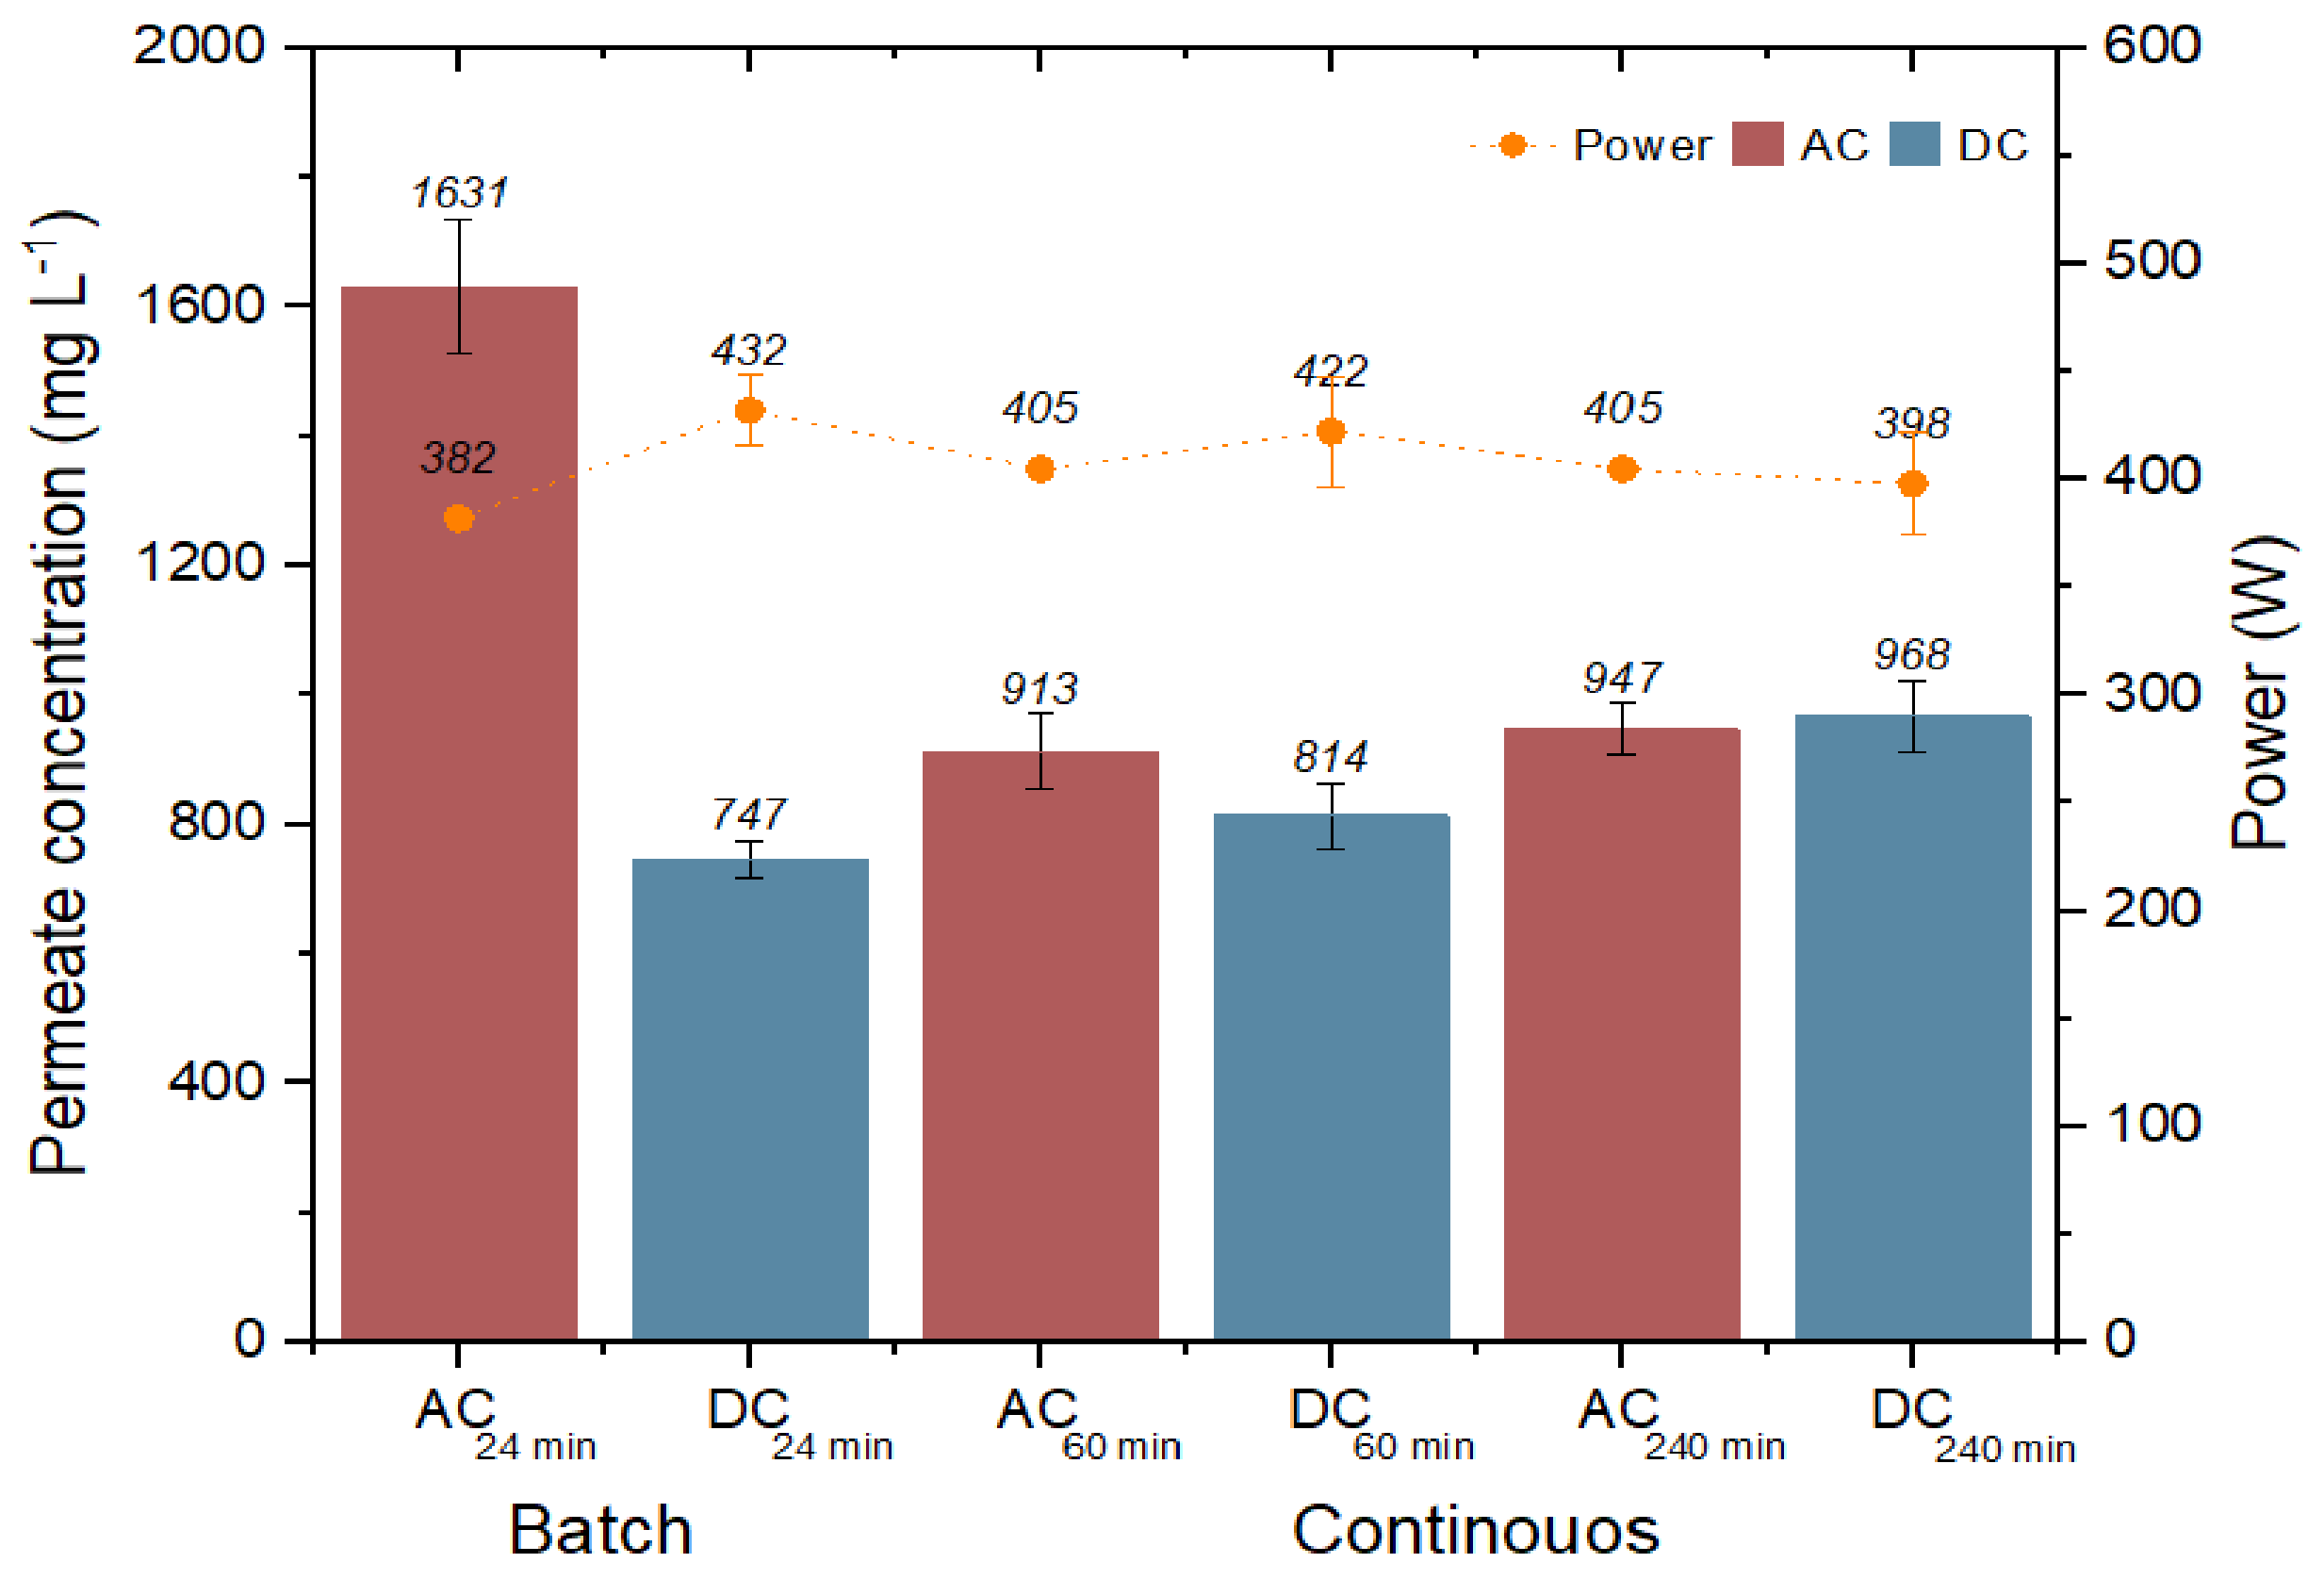
3.2. Specific Energy Consumption (SEC)

The specific energy consumption of each process in relation to the required operating pressure is shown in Figure 7. A higher-pressure differential is observed in the batch process (0.67 MPa) than in the continuous process (0.33 Mpa); it is evident that a longer operation time and a longer pulsation time due to the solar intermittency effect are beneficial in reducing the specific energy consumption. The above is evident since the SEC values for the batch and continuous processes using DC are lower (3.79 and 3.02 kWh m−3) with respect to the SEC values when using the AC current (3.98 and 3.68 kWh m−3), which are higher.
Figure 7. Specific energy consumption in batch and continuous processing.
Water 15 03022 g007
The six total SEC values obtained in the batch as well as continuous processes show normal values for the small and medium RO systems, in which a range of 3 to 7 kWh m−3 is handled [16,17]. The average of the six SEC values is 3.61 kWh m−3. Values between 3 and 4.9 kWh m−3 indicate the correct operation of the RO process for small plants [28], but values between 5 and 7 kWh m−3 indicate that there are not any good operating conditions during the process, or that the energy recovery is not used [35]. The operating pressure and SEC values will then depend directly on the concentration of salts in the feed water. The higher the concentration in the feed water to the RO process, the higher the SEC and operating pressure [9,30,36].
It is observed that the SEC in DC 240min is lower than its DC of 60min due to the lower power, which is due to cloudy weather and the power increase on a sunny day, which represents higher vibrations of greater intensity (during the same day), which is interpreted as a decrease in the salt deposition [34]. Another observation is that no antiscalant was dosed at the AC-DC times of 60min and 240min. This is novel and promising for the reduction in process chemical consumption without increasing the SEC outside of the Mexican official standard of 1.2.

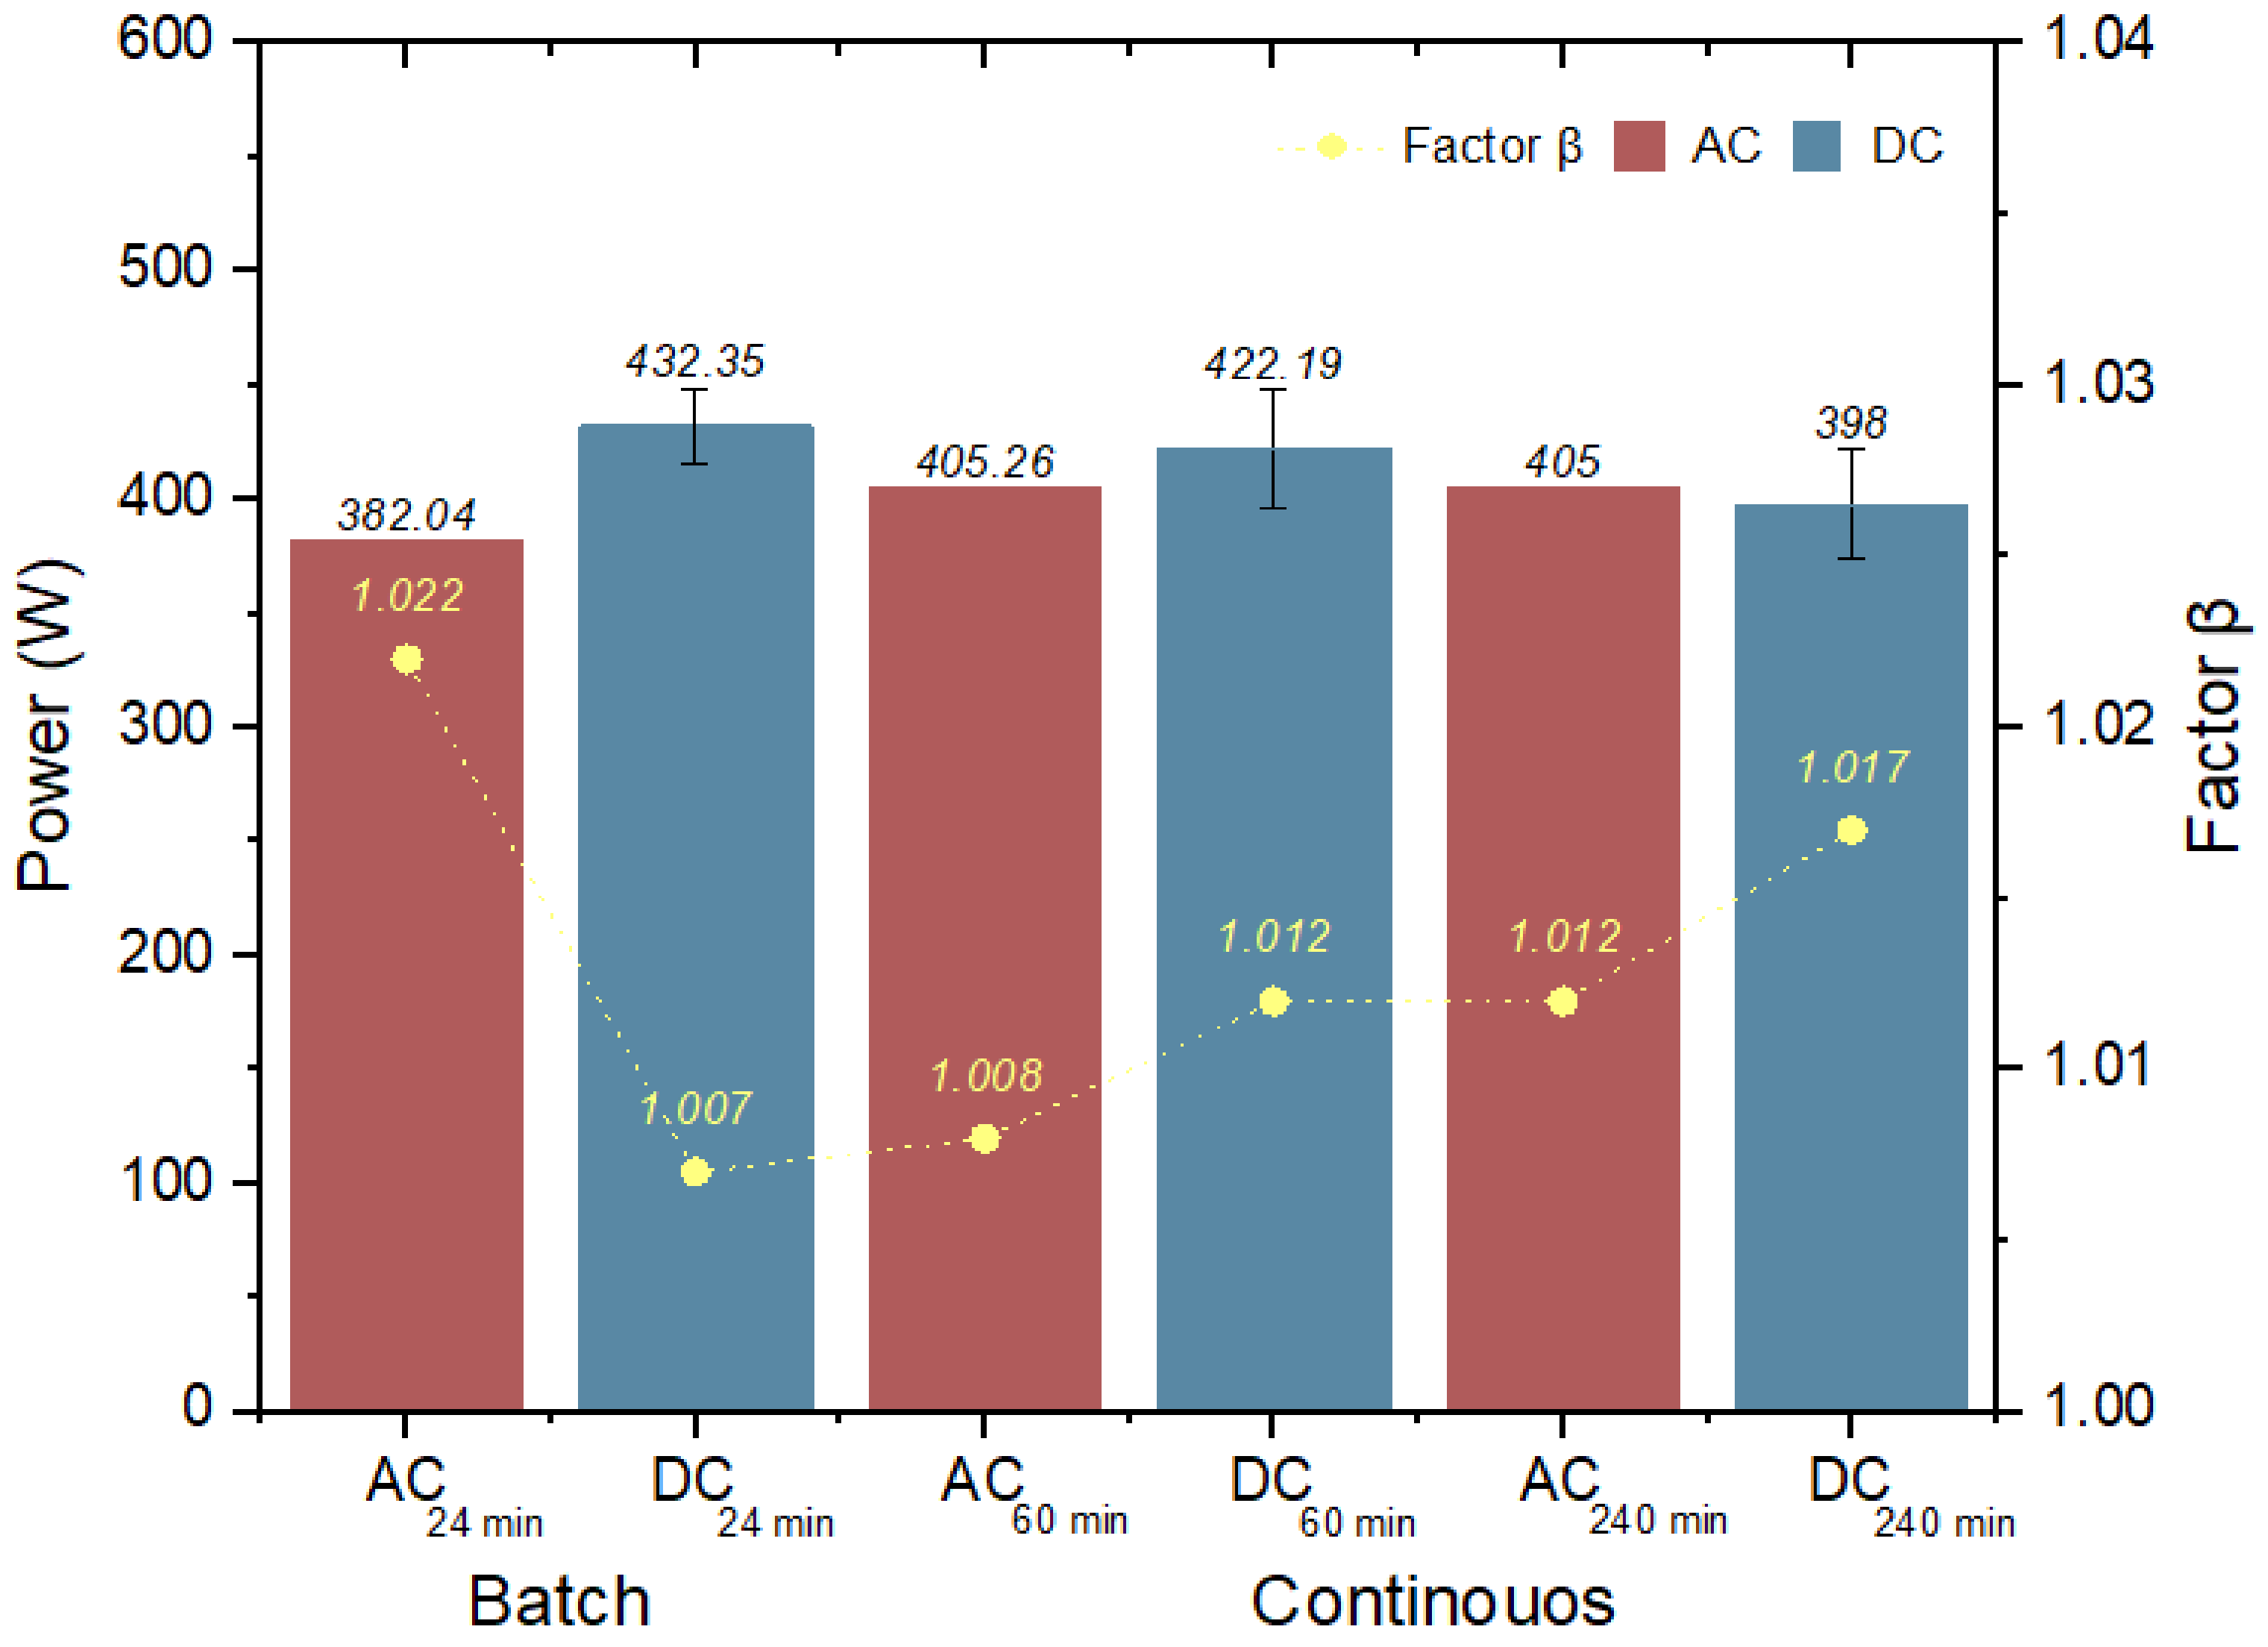
3.3. Concentration Polarization Factor (β)

Figure 8 shows the obtained β values. In both experimentations (batch and continuous), the value of β is less than 1.2, which is the value recommended by Kucera [11], so they are within the limit.
Figure 8. Concentration polarization factor (β).
Water 15 03022 g008
In the batch stage, β decreased from 1.022-AC to 1.007-DC. This decrease was due to the pulses applied and the dosing of the antiscalant during the 24 min. In the continuous stage, β increases in DC; however, it is important to highlight that the antiscalant dosing was stopped in order to observe the effect of the different pulses applied during the 60 min of experimentation. There are several factors that influence the formation of concentration polarization [14,32,33]; however, the variation in the solar radiation or, for this research, the pulses applied at the membrane inlet, remove the salt incrustation so that less salt deposition is obtained on the active surface of the membrane [34,37]. This is related to the deposition time, which is defined as “The time required for an aqueous solution to begin to precipitate salts or minerals on a surface” [38]. This is notorious in batch processing as a lower β value is obtained. In the case of AC-DC at the times of 60min and 240min, power reduction is observed due to solar intermittency, but without significantly increasing the SEC. A maximum value of 1.2 in the SEC is reported [11].

4. Conclusions

The evaluation of water quality parameters (pH, Cl, turbidity, TDS, EC and hardness) obtained in the continuous RO process complies with the normative standards of NOM-127-SSA1-2021. It is highlighted that the applied pulses benefit the final concentration of permeate water, being lower in DC with values of 747.51 and 814.27 mg L−1 of TDS.
The specific energy consumption (SEC) values were always lower when using DC (3.79 and 3.02 kWh m−3) with respect to the values when using the AC current (3.98 and 3.68 kWh m−3), which were higher. It should be noted that the values of the SEC in the batch and continuous processes are within the recommended range for small and medium RO desalination plants.
The value of β in all cases is within the recommended value to identify salt incrustation (1.2). In the batch process, the effect of applying variable powers on β is observed when using DC, where a value of 1.007 is obtained, while in AC, a value of 1.022 is obtained. In the continuous process with AC, a higher β value was obtained, but without the application of an antiscalant, which shows the effect of the pulses applied for the detachment of salts in the active layer of the membrane.
Therefore, the use of renewable energies as an activation source in small RO plants suggests a feasibility mainly on sunny days. In the case of cloudy days, storage is proposed in two different ways, energy storage by means of batteries and water storage in the anticipation of rainfall, which guarantees the operation of the process and/or water supply. Also, the variability of power is promising to reduce the phenomenon of concentration polarization in RO membranes; however, care must be taken to achieve the necessary power for the operation of high-pressure pumps of the RO process. In this way, an efficient process is obtained with quality product water that is capable of supplying the needs in areas where there is unlimited access to this resource.

Author Contributions

Conceptualization, G.E.D.-I., R.M.-P., D.P.M.-M. and R.E.C.-L.; methodology, G.E.D.-I. and R.M.-P.; software, G.E.D.-I. and R.M.-P.; validation, G.E.D.-I., R.M.-P. and R.E.C.-L.; formal analysis, D.P.M.-M. and R.E.C.-L.; investigation, G.E.D.-I., R.M.-P., D.P.M.-M. and R.E.C.-L.; resources, G.E.D.-I. and R.E.C.-L.; writing—original draft preparation, G.E.D.-I. and R.M.-P.; writing—review and editing, G.E.D.-I., R.M.-P., D.P.M.-M. and R.E.C.-L.; visualization, G.E.D.-I. and R.M.-P.; supervision, G.E.D.-I. and R.E.C.-L.; project administration, G.E.D.-I. and R.E.C.-L.; funding acquisition, G.E.D.-I. and R.E.C.-L. All authors have read and agreed to the published version of the manuscript.

Funding

This research was funded by the Instituto Tecnológico de Sonora through a PROFAPI fund (projects 2023-0444 and 2023-0445). This research was also funded by CONAHCYT through the PRONACE project: Energy, water, and food security for native peoples in semiarid coastal regions of northern Mexico. Grant number: 319483.

Data Availability Statement

Not applicable.

Acknowledgments

The authors would like to thank the University of Sonora for providing the power source to carry out the RO process with a direct current.

Conflicts of Interest

The authors declare no conflict of interest.

Nomenclature

ECElectrical conductivitymS cm−1
ClResidual chlorinemg L−1
J v Permeate fluxm s−1
P T M Transmembrane pressurePa s
Γ f Osmotic pressure feed waterPa s
Γ p Osmotic pressure permeate waterPa s
μ f Viscosity feed waterPa s
R m Membrane resistancem−1
% R Recovery%
Q f Feed water flow ratem3 s−1
Q p Permeate water flow ratem3 s−1
% S R Salt rejection%
C f Feed water concentrationmg L−1
C p Permeate water concentrationmg L−1
C H P P Energy consumption of high-pressure pumpkWh
C L P P Energy consumption of low-pressure pumpkWh
t Operation timeminutes
TTurbidityNTU
HHardnessmg L−1
ROReverse osmosis
RERenewable energies
CPConcentration polarization
ACAlternating current
DCDirect current
SECSpecific energy consumption
TDSTotal dissolved solids
PVPhotovoltaic
pHPotential hydrogen
L p Permeance
β Concentration polarization factor
k m t Mass transfer coefficient
MSFMulti-stage flash
MEDMultiple-effect distillation
MVCMechanical vapor compression
DIDeionization
EDElectrodialysis
CEFRLChemical Engineering and Food Research Laboratory

References

  1. Dévora-Isiordia, G.E.; López-Mercado, M.E.; Fimbres-Weihs, G.A.; Álvarez-Sánchez, J.; Astorga-Trejo, S. Desalación Por Ósmosis Inversa y Su Aprovechamiento En Agricultura En El Valle Del Yaqui, Sonora, México. Tecnol. Cienc. Del Agua 2016, 7, 155–169. [Google Scholar]
  2. Ríos-Arriola, J.; Velázquez, N.; Aguilar-Jiménez, J.A.; Dévora-Isiordia, G.E.; Cásares de la Torre, C.A.; Corona-Sánchez, J.A.; Islas, S. State of the Art of Desalination in Mexico. Energies 2022, 15, 8434. [Google Scholar] [CrossRef]
  3. Salehi, M. Global Water Shortage and Potable Water Safety; Today’s Concern and Tomorrow’s Crisis. Env. Int. 2022, 158, 106936. [Google Scholar] [CrossRef] [PubMed]
  4. Mishra, B.K.; Kumar, P.; Saraswat, C.; Chakraborty, S.; Gautam, A.; Smardon, C. Water Security in a Changing Environment: Concept, Challenges and Solutions. Water 2021, 13, 490. [Google Scholar] [CrossRef]
  5. Ghaffour, N.; Bundschuh, J.; Mahmoudi, H.; Goosen, M. Renewable Energy-Driven Desalination Technologies: A Comprehensive Review on Challenges and Potential Applications of Integrated Systems. Desalination 2015, 356, 94–114. [Google Scholar] [CrossRef]
  6. Shokri, A.; Sanavi Fard, M. A Sustainable Approach in Water Desalination with the Integration of Renewable Energy Sources: Environmental Engineering Challenges and Perspectives. Environ. Adv. 2022, 9, 100281. [Google Scholar] [CrossRef]
  7. Shemer, H.; Semiat, R. Sustainable RO Desalination—Energy Demand and Environmental Impact. Desalination 2017, 424, 10–16. [Google Scholar] [CrossRef]
  8. Kasaeian, A.; Rajaee, F.; Yan, W.-M. Osmotic Desalination by Solar Energy: A Critical Review. Renew Energy 2019, 134, 1473–1490. [Google Scholar] [CrossRef]
  9. Uppu, A.; Chaudhuri, A.; Prasad Das, S. Numerical Modeling of Particulate Fouling and Cake-Enhanced Concentration Polarization in Roto-Dynamic Reverse Osmosis Filtration Systems. Desalination 2019, 468, 114053. [Google Scholar] [CrossRef]
  10. Kucera, J. Reverse Osmosis, 2nd ed.; Wiley: Hoboken, NJ, USA, 2015. [Google Scholar]
  11. Jang, E.S.; Mickols, W.; Sujanani, R.; Helenic, A.; Dilenschneider, T.J.; Kamcev, J.; Paul, D.R.; Freeman, B.D. Influence of Concentration Polarization and Thermodynamic Non-Ideality on Salt Transport in Reverse Osmosis Membranes. J. Memb. Sci. 2019, 572, 668–675. [Google Scholar] [CrossRef]
  12. Razeghi, M.; Hajinezhad, A.; Naseri, A.; Noorollahi, Y.; Farhan Moosavian, S. Multi-Criteria Decision-Making for Selecting a Solar Farm Location to Supply Energy to Reverse Osmosis Devices and Produce Freshwater Using GIS in Iran. Sol. Energy 2023, 253, 501–514. [Google Scholar] [CrossRef]
  13. Al-Karaghouli, A.; Kazmerski, L.L. Energy Consumption and Water Production Cost of Conventional and Renewable-Energy-Powered Desalination Processes. Renew. Sustain. Energy Rev. 2013, 24, 343–356. [Google Scholar] [CrossRef]
  14. Kumarasamy, S.; Narasimhan, S.; Narasimhan, S. Optimal Operation of Battery-Less Solar Powered Reverse Osmosis Plant for Desalination. Desalination 2015, 375, 89–99. [Google Scholar] [CrossRef]
  15. Boussouga, Y.A.; Richards, B.S.; Schäfer, A.I. Renewable Energy Powered Membrane Technology: System Resilience under Solar Irradiance Fluctuations during the Treatment of Fluoride-Rich Natural Waters by Different Nanofiltration/Reverse Osmosis Membranes. J. Memb. Sci. 2021, 617, 118452. [Google Scholar] [CrossRef]
  16. Su, X.; Li, W.; Palazzolo, A.; Ahmed, S. Concentration Polarization and Permeate Flux Variation in a Vibration Enhanced Reverse Osmosis Membrane Module. Desalination 2018, 433, 75–88. [Google Scholar] [CrossRef]
  17. Jack, G.; Eliyahu, K. Method and System for Increasing Recovery and Preventing Precipitation Fouling in Pressure Driven Membrane Processes. U.S. Patent 8,137,539, 20 March 2012. [Google Scholar]
  18. Yu, W.; Song, D.; Chen, W.; Yang, H. Antiscalants in RO Membrane Scaling Control. Water Res. 2020, 183, 115985. [Google Scholar] [CrossRef] [PubMed]
  19. Eltawil, M.A.; Alamri, A.M.; Azam, M.M. Design a Novel Air to Water Pressure Amplifier Powered by PV System for Reverse Osmosis Desalination. Renew. Sustain. Energy Rev. 2022, 160, 112295. [Google Scholar] [CrossRef]
  20. Mito, M.T.; Ma, X.; Albuflasa, H.; Davies, P.A. Reverse Osmosis (RO) Membrane Desalination Driven by Wind and Solar Photovoltaic (PV) Energy: State of the Art and Challenges for Large-Scale Implementation. Renew. Sustain. Energy Rev. 2019, 112, 669–685. [Google Scholar] [CrossRef]
  21. Generous, M.M.; Qasem, N.A.A.; Zubair, S.M. An Innovative Hybridization of Electrodialysis with Reverse Osmosis for Brackish Water Desalination. Energy Convers. Manag. 2021, 245, 114589. [Google Scholar] [CrossRef]
  22. Secretaría de Salud. Norma Oficial Mexicana NOM-127-SSA1-2021. Salud Ambiental, Agua Para Consumo Humano- Límites Permisibles de Calidad y Tratamiento Que Debe Someterse el Agua Para su Potabilización. Available online: https://www.dof.gob.mx/nota_detalle.php?codigo=5650705&fecha=02/05/2022#gsc.tab=0 (accessed on 20 July 2023).
  23. Rodríguez-López, J.; Robles-Lizárraga, A.; Encinas-Guzmán, M.I.; Correa-Díaz, F.; Dévora-Isiordia, G.E. Assessment of Fixed, Single-Axis, and Dual-Axis Photovoltaic Systems Applied to a Reverse Osmosis Desalination Process in Northwest Mexico. Desalination Water Treat. 2021, 234, 399–407. [Google Scholar] [CrossRef]
  24. Armendáriz-Ontiveros, M.M.; Dévora-Isiordia, G.E.; Rodríguez-López, J.; Sánchez-Duarte, R.G.; Álvarez-Sánchez, J.; Villegas-Peralta, Y.; Martínez-Macias, M.d.R. Effect of Temperature on Energy Consumption and Polarization in Reverse Osmosis Desalination Using a Spray-Cooled Photovoltaic System. Energies 2022, 15, 7787. [Google Scholar] [CrossRef]
  25. Freire, G.M.; Bilton, A.M. Experimental Quantification of the Effect of Intermittent Operation on Membrane Performance of Solar Powered Reverse Osmosis Desalination Systems. Desalination 2018, 435, 188–197. [Google Scholar] [CrossRef]
  26. Greenlee, L.F.; Testa, F.; Lawler, D.F.; Freeman, B.D.; Moulin, P. The Effect of Antiscalant Addition on Calcium Carbonate Precipitation for a Simplified Synthetic Brackish Water Reverse Osmosis Concentrate. Water Res. 2010, 44, 2957–2969. [Google Scholar] [CrossRef] [PubMed]
  27. Liberman, B.; Eshed, L.; Greenberg, G. Pulse Flow RO—The New RO Technology for Waste and Brackish Water Applications. Desalination 2020, 479, 114336. [Google Scholar] [CrossRef]
  28. Voutchkov, N. Energy Use for Membrane Seawater Desalination—Current Status and Trends. Desalination 2018, 431, 2–14. [Google Scholar] [CrossRef]
  29. Dévora-Isiordia, G.E.; Cásares De la Torre, C.A.; Morales-Mendívil, D.P.; Montoya-Pizeno, R.; Velázquez-Limón, N.; Aguilar-Jiménez, J.A.; Ríos-Arriola, J. Evaluation of Concentration Polarization Due to the Effect of Feed Water Temperature Change on Reverse Osmosis Membranes. Membranes 2023, 13, 3. [Google Scholar] [CrossRef]
  30. Sanz-Vargas, F.J. Sistemas de Energía Térmica Desalación de Agua de Mar Mediante Energías Renovables: Dimensionado En Canarias; Universidad de Sevilla: Sevilla, Spain, 2019. [Google Scholar]
  31. Freire Gormaly, M.; Bilton, A.M. Impact of Intermittent Operation on Reverse Osmosis Membrane Fouling for Brackish Groundwater Desalination Systems. J. Memb. Sci. 2019, 583, 220–230. [Google Scholar] [CrossRef]
  32. Sitterley, K.A.; Cath, T.J.; Jenne, D.S.; Yu, Y.-H.; Cath, T.Y. Performance of Reverse Osmosis Membrane with Large Feed Pressure Fluctuations from a Wave-Driven Desalination System. Desalination 2022, 527, 115546. [Google Scholar] [CrossRef]
  33. Richards, B.S.; Capão, D.P.S.; Früh, W.G.; Schäfer, A.I. Renewable Energy Powered Membrane Technology: Impact of Solar Irradiance Fluctuations on Performance of a Brackish Water Reverse Osmosis System. Sep. Purif. Technol. 2015, 156, 379–390. [Google Scholar] [CrossRef]
  34. Warsinger, D.M.; Tow, E.W.; Nayar, K.G.; Maswadeh, L.A.; Lienhard, V.J.H. Energy Efficiency of Batch and Semi-Batch (CCRO) Reverse Osmosis Desalination. Water Res. 2016, 106, 272–282. [Google Scholar] [CrossRef]
  35. Dévora-Isiordia, G.E.; Robles Lizárraga, A.; Fimbres Weihs, G.A.; Álvarez Sánchez, J. Comparación de métodos de descarga para vertidos de salmueras provenientes de planta desalinizadora en Sonora, México. Rev. Int. Contam. Ambient. 2016, 33, 45–54. [Google Scholar] [CrossRef]
  36. Liu, T.; Zhou, K.; Ma, R.; Zhang, L.; Huang, C.; Luo, Z.; Zhu, H.; Yao, S.; Yang, C.; Zou, B.; et al. Multifunctional all-polymer photovoltaic blend with simultaneously improved efficiency (18.04%), stability and mechanical durability. Aggregate 2023, 4, e308. [Google Scholar] [CrossRef]
  37. Yao, S.; Yang, L.; Shi, S.; Zhou, Y.; Long, M.; Zhang, W.; Cai, S.; Huang, C.; Liu, T.; Zou, B. A Two-in-One Annealing Enables Dopant Free Block Copolymer Based Organic Solar Cells with over 16% Efficiency. Chin. J. Chem. 2022, 41, 672–678. [Google Scholar] [CrossRef]
  38. Robles-Lizárraga, A.; Martínez-Macías, M.R.; Encinas-Guzmán, M.I.; Larraguibel-Aganza, O.J.; Rodríguez-López, J.; Dévora-Isiordia, G.E. Design of reverse osmosis desalination plant in Puerto Peñasco, Sonora, México. Desalination Water Treat. 2020, 175, 1–10. [Google Scholar] [CrossRef]
Figure 1. Representation of concentration polarization in an RO membrane [14].
Water 15 03022 g001
Figure 2. Graphical representation of AC and DC power supply to the RO process. (a) RO process with AC current, (b) RO process with DC current in sunny day, (c) RO process with DC current in sunny and cloudy day.
Water 15 03022 g002
Figure 3. Diagram of RO desalination plant.
Water 15 03022 g003
Figure 4. (a) DC motor pump diagram—blue. (b) AC motor pump diagram—orange.
Water 15 03022 g004
Table 1. Powers applied in the evaluation of CF in batch processing.
Evaluation of (β) in Batch Process
ACDC
Time (min)Power (W)Time (min)Power (W)
8382.048551.67
12382.0412567.83
16382.0416550.50
20382.0420582.00
24382.0424591.33
Table 2. Power applied in the evaluation of (β) in continuous process.
Evaluation of (β) in Continuous Process
ACDCDC
Time
(min)
Power (W)Time
(min)
Power (W)Time (min)Power
(W)
5405548920206
104051051340313
154051552260421
204052053080530
2540525542100140
3040530513120260
3540535534140560
4040540523160229
4540545555180555
5040550534200180
5540555554220230
6040560548240548
Disclaimer/Publisher’s Note: The statements, opinions and data contained in all publications are solely those of the individual author(s) and contributor(s) and not of MDPI and/or the editor(s). MDPI and/or the editor(s) disclaim responsibility for any injury to people or property resulting from any ideas, methods, instructions or products referred to in the content.

