Article

Macrophyte- and Macrozoobenthic-Based Assessment in Rivers: Specificity of the Response to Combined Physico-Chemical Stressors

1
Department of Geography, Ecology and Environmental Protection, Faculty of Mathematics and Natural Sciences, South-West University “Neofit Rilski”, 66 Ivan Michailov Str., 2700 Blagoevgrad, Bulgaria
2
Department of Aquatic Ecosystems, Institute of Biodiversity and Ecosystem Research, Bulgarian Academy of Sciences, 1 Tsar Osvoboditel Blvd., 1000 Sofia, Bulgaria
3
Faculty of Biology, Plovdiv University, 4000 Plovdiv, Bulgaria
4
Independent Researcher, 9006 Varna, Bulgaria
*
Author to whom correspondence should be addressed.
Water 2023, 15(12), 2282; https://doi.org/10.3390/w15122282
Submission received: 30 March 2023 / Revised: 25 May 2023 / Accepted: 15 June 2023 / Published: 18 June 2023
(This article belongs to the Special Issue Aquatic Ecology and Biological Invasions)

Abstract

:
The importance of adequate biological assessments of rivers based on aquatic assemblages is essential to establish recovery measures. Macrophyte and macroinvertebrate communities react differently in time and in response strength to diverse stressors. Our hypothesis was that each group response is a result of specific and combined abiotic factors and each stressor’s impact. To address the above, both biological quality elements (BQEs) and values of the ecological quality ratio (EQR) were studied in relation to four abiotic parameters and five physico-chemical stressors. Discrepancies of more than one degree between the ecological status assessments of Bulgarian river sites determined using macrophytes and macrozoobenthos were discussed. The RDA analysis showed that altitude had a determining role in shaping the abundance of macrophyte and macrozoobenthos communities. Aquatic flora richness positively correlated with nitrogen enrichment and macroinvertebrate fauna—with altitude and biochemical oxygen demand (BOD). Nutrients and shading were most significant for the ecological status evaluation defined with both macrophytes and macrozoobenthos. Macrophyte-based EQR was related to oxygen concentration and shading, while macroinvertebrate-based EQR was better at sites with coarser substrates. Among tested stressors, mainly total nitrogen and BOD explained the lower macrophyte-based assessment at half of the studied sites. In conditions of increased nitrogen and BOD, but remaining in the range of good status, macrophytes as primary producers gave a faster and stronger response. Despite the differences in the assessment, both BQEs have higher values in conditions of lower BOD and total phosphorus.
Keywords:
BQE; TN; BOD

1. Introduction

The Water Framework Directive (WFD) [1] introduced an overall conceptual approach to the assessment and classification of surface waters aiming at good ecological status for all EU member states. The quality elements and the normative definitions of ecological status classification, in particular, for running waters (rivers and streams), are defined in Annex V of the WFD and refer to terms for quality assessed with the use of biological communities. Ecological status is determined based on biological quality elements, i.e., organism groups, that reflect aquatic ecosystem integrity by responding to various pressures rather than the intensity of a single pressure. For rivers, the aquatic flora (phytobenthos and macrophytes), fish, and, most frequently, benthic invertebrates are monitored [2,3,4]. Long-term studies provide the most suitable data for the empirical analysis of climate change effects on biodiversity and ecosystem health [5] and, in this way, assure more representative and relevant ecological status assessment.
Macrophytes and macrozoobenthos are important for water ecosystem structure and function. Aquatic macrophytes increase habitat diversity and provide refuge for invertebrates, thus having an impact on their species composition and abundance [6]. The two groups are interrelated, for example, a reduction in macrophytes had a negative impact on the macrozoobenthos due to a lack of refuges and impede predation [7]. Characteristics of the two communities and representatives of the flora and fauna, as well as the specific individual features of the taxa that make them up, determine their different resistance and adaptive response to factors in the aquatic environment (natural and anthropogenic).
A number of studies have evaluated the effects of different stressors on stream assemblages, and many assessment systems have been developed including one or more taxonomic groups [8]. If multiple stressors are assessed, then benthic invertebrates and/or macrophytes should be considered. Benthic macroinvertebrates are more sensitive to organic pollution, as this group is more directly affected by oxygen levels. Anthropogenic stressors, such as hydropeaking, organic pollution, and loads of nitrogen and its inorganic forms, appeared to have a considerable effect on river aquatic macrophyte communities. Macrophytes react to hydromorphological degradation and respond to general degradation as well [9]. The degree of water pollution influences the occurrence of macroinvertebrates [10].
Consideration of two groups of organisms enables more comprehensive and reliable monitoring than an assessment based on a single group, especially where the standard bio-indicative practices can be distorted by extreme local conditions [2]. Macrophytes and macrozoobenthos have a close relationship with key physical and chemical parameters, revealing that environmental conditions have a major influence on the type and continuity of macrozoobenthos [11] and macrophytes [6].
It can be summarized that macrophytes and macroinvertebrates respond differently to environmental factors, and thus, the application of both groups in an assessment enables more comprehensive and reliable results [2]. Under which circumstances one or another group reacts more quickly and adequately is still an open issue. Our hypothesis was that each group’s response depends on the combination of the influencing factors and their cumulative effect on the aquatic biota. Thus, the aim of the present study was to outline the complex factors that drive both the macrophyte and macrozoobenthos response and thus determine the difference in the assessment.

2. Materials and Methods

2.1. Study Area, Data Collection, and Research Approach

Biological data for a 5-year period (2016–2020) from 367 river sites (15 river types) in Bulgaria were subjected to a comparative analysis. National river types were defined as a total of 16 according to hydromorphological and biological criteria [12]. Most of the sites had the same macrophyte- and macroinvertebrate-based assessment expressed as the ecological quality ratio (EQR) (n = 146) or the assessment was with a difference of one degree (n = 191) between two biological quality elements (BQEs). We selected 83 sites sampled during the most recent year, i.e., 2020 (Figure 1, Supplementary Table S1).
Of them, only 8% of the sites had an assessment difference of two degrees or more. The final dataset contained 19 river sites from Bulgaria, including both natural and heavily modified water bodies (Table 1).

2.2. Abiotic Characteristics and Physico-Chemical Parameters

Four abiotic parameters were analyzed: altitude (m, a.s.l.), flow velocity, shading, and dominant substrate type (DomSub). Velocity, shading, and substrate were determined in a semi-quantitative way using class scales to enable a fast and easy field application [13,14]. Shading was noted based on a 4-degree scale (1 = no shading, 2 = low shading, 3 = medium shading, 4 = high shading). Flow velocity was recorded using a 6-point scale: 1 = not visible, 2 = barely visible, 3 = slowly running, 4 = rapidly running (current with moderate turbulence), 5 = rapidly running (turbulently running), 6 = torrential). The dominant substrates at the sampling sites were classified in a 6-degree scale (1 = mud/silt, 2 = clay/loam, 3 = sand, 4 = gravel, 5 = stones, 6= rock bed). In situ measurements of dissolved oxygen (DO, mg L−1) and electrical conductivity (EC, μS cm−1) of the river water were obtained using a portable Windaus Labortechnik Package. Biochemical oxygen demand (BOD, mg L−1), total nitrogen (TN, mg L−1), and total phosphorus (TP, mg L−1) compounds were analyzed following the standards used in an accredited laboratory (Aquaterratest Lab., Sofia, Bulgaria).

2.3. Biological Indices

Macrophyte determination was performed at the species level (Supplementary Table S2). Macrozoobenthos taxa were defined to the order (Decapoda, Amphipoda, Isopoda, Arachnida, Ephemeroptera, Plecoptera, Trichoptera, Odonata, Coleoptera, Hemiptera, Megaloptera, Diptera), subclass (Oligochaeta, Hirudinea), class (Nematoda, Hydrozoa, Turbellaria, Gastropoda, Bivalvia), and phylum (Nematoda) levels. The macrophyte-based reference index (RI) and EQR were calculated following Gecheva et al. [15] using the following formula:
R I = ( ( i = l n A Q A i i = l n C Q C i ) / i = l n g Q g i ) × 100
where RI = reference index;
QAi = “quantity” of the i taxon in Group A;
QCi = “quantity of the i taxon in Group C;
Qgi = “quantity” of the i taxon in all groups;
nA = total number of species in Group A;
nC = total number of species in Group C;
ng = total number of species.
The transformation of the RI into a 0 to 1 scale is carried out using the formula:
EQR = {(RI + 100) × 0.5}/100. The Irish biotic index [16,17,18] and its adapted Bulgarian version [19,20] were used for the ecological status determination of the studied river types/sites using macrozoobenthos. The biotic index (BI) includes two metrics: the total number of taxa and taxa richness of indicator groups A (very sensitive), B, C, D, and E (very tolerant). The individuals were counted, and the abundance was divided into five abundance classes: few (1–5), present (6–20), common (21–50), plentiful (51–100), and dominant (100+). The values of the BI depend on the relative proportions of the tolerance groups. EQR is calculated as the ratio between the observed index value and the index value which was defined for reference sites [19,20].
EQRBI = measured value/reference value
The ecological status based on macrophytes and macrozoobenthos was characterized using type-specific assessment scales for indices RI/BI and relevant EQR following the Bulgarian water legislation.

2.4. Statistical Analysis

Excel for Windows 10 techniques were used to visualize the number of taxa and the abundance of macrophytes and macrozoobenthos in the 19 studied sites.
STATISTICA 7 software was applied to generate box plots. Analyses were undertaken using the software statistical package CANOCO 4.5 for Windows [21]. Redundancy analysis (RDA) can be considered a multivariate form of regression analysis whereby the response data are modeled as a function of one or more ordination axes that are constrained to be linear combinations of the environmental variables, depending on the extent of the number of taxa and EQR turnover along the ordination axes. We applied detrended correspondence analysis (DCA), using the option “detrendingby-segment”, which allowed the gradient length of species variance along orthogonal axes to be quantified in terms of standard deviation units. The first axis in our data had a length of 0.6 SD of the number of taxa and 0.7 of EQR, suggesting modest unimodality according [21]. Therefore, we used linear direct analysis. RDA was used to examine relations between the species richness of macrophyte and macroinvertebrate communities and abiotic parameters and physico-chemical stressors. A canonical correspondence analysis (CCA—unimodal analysis with forward variable selection) was used to present the interactions between 57 macrophyte species and 19 macrozoobenthic taxonomic groups with environmental factors at the studied site.

3. Results

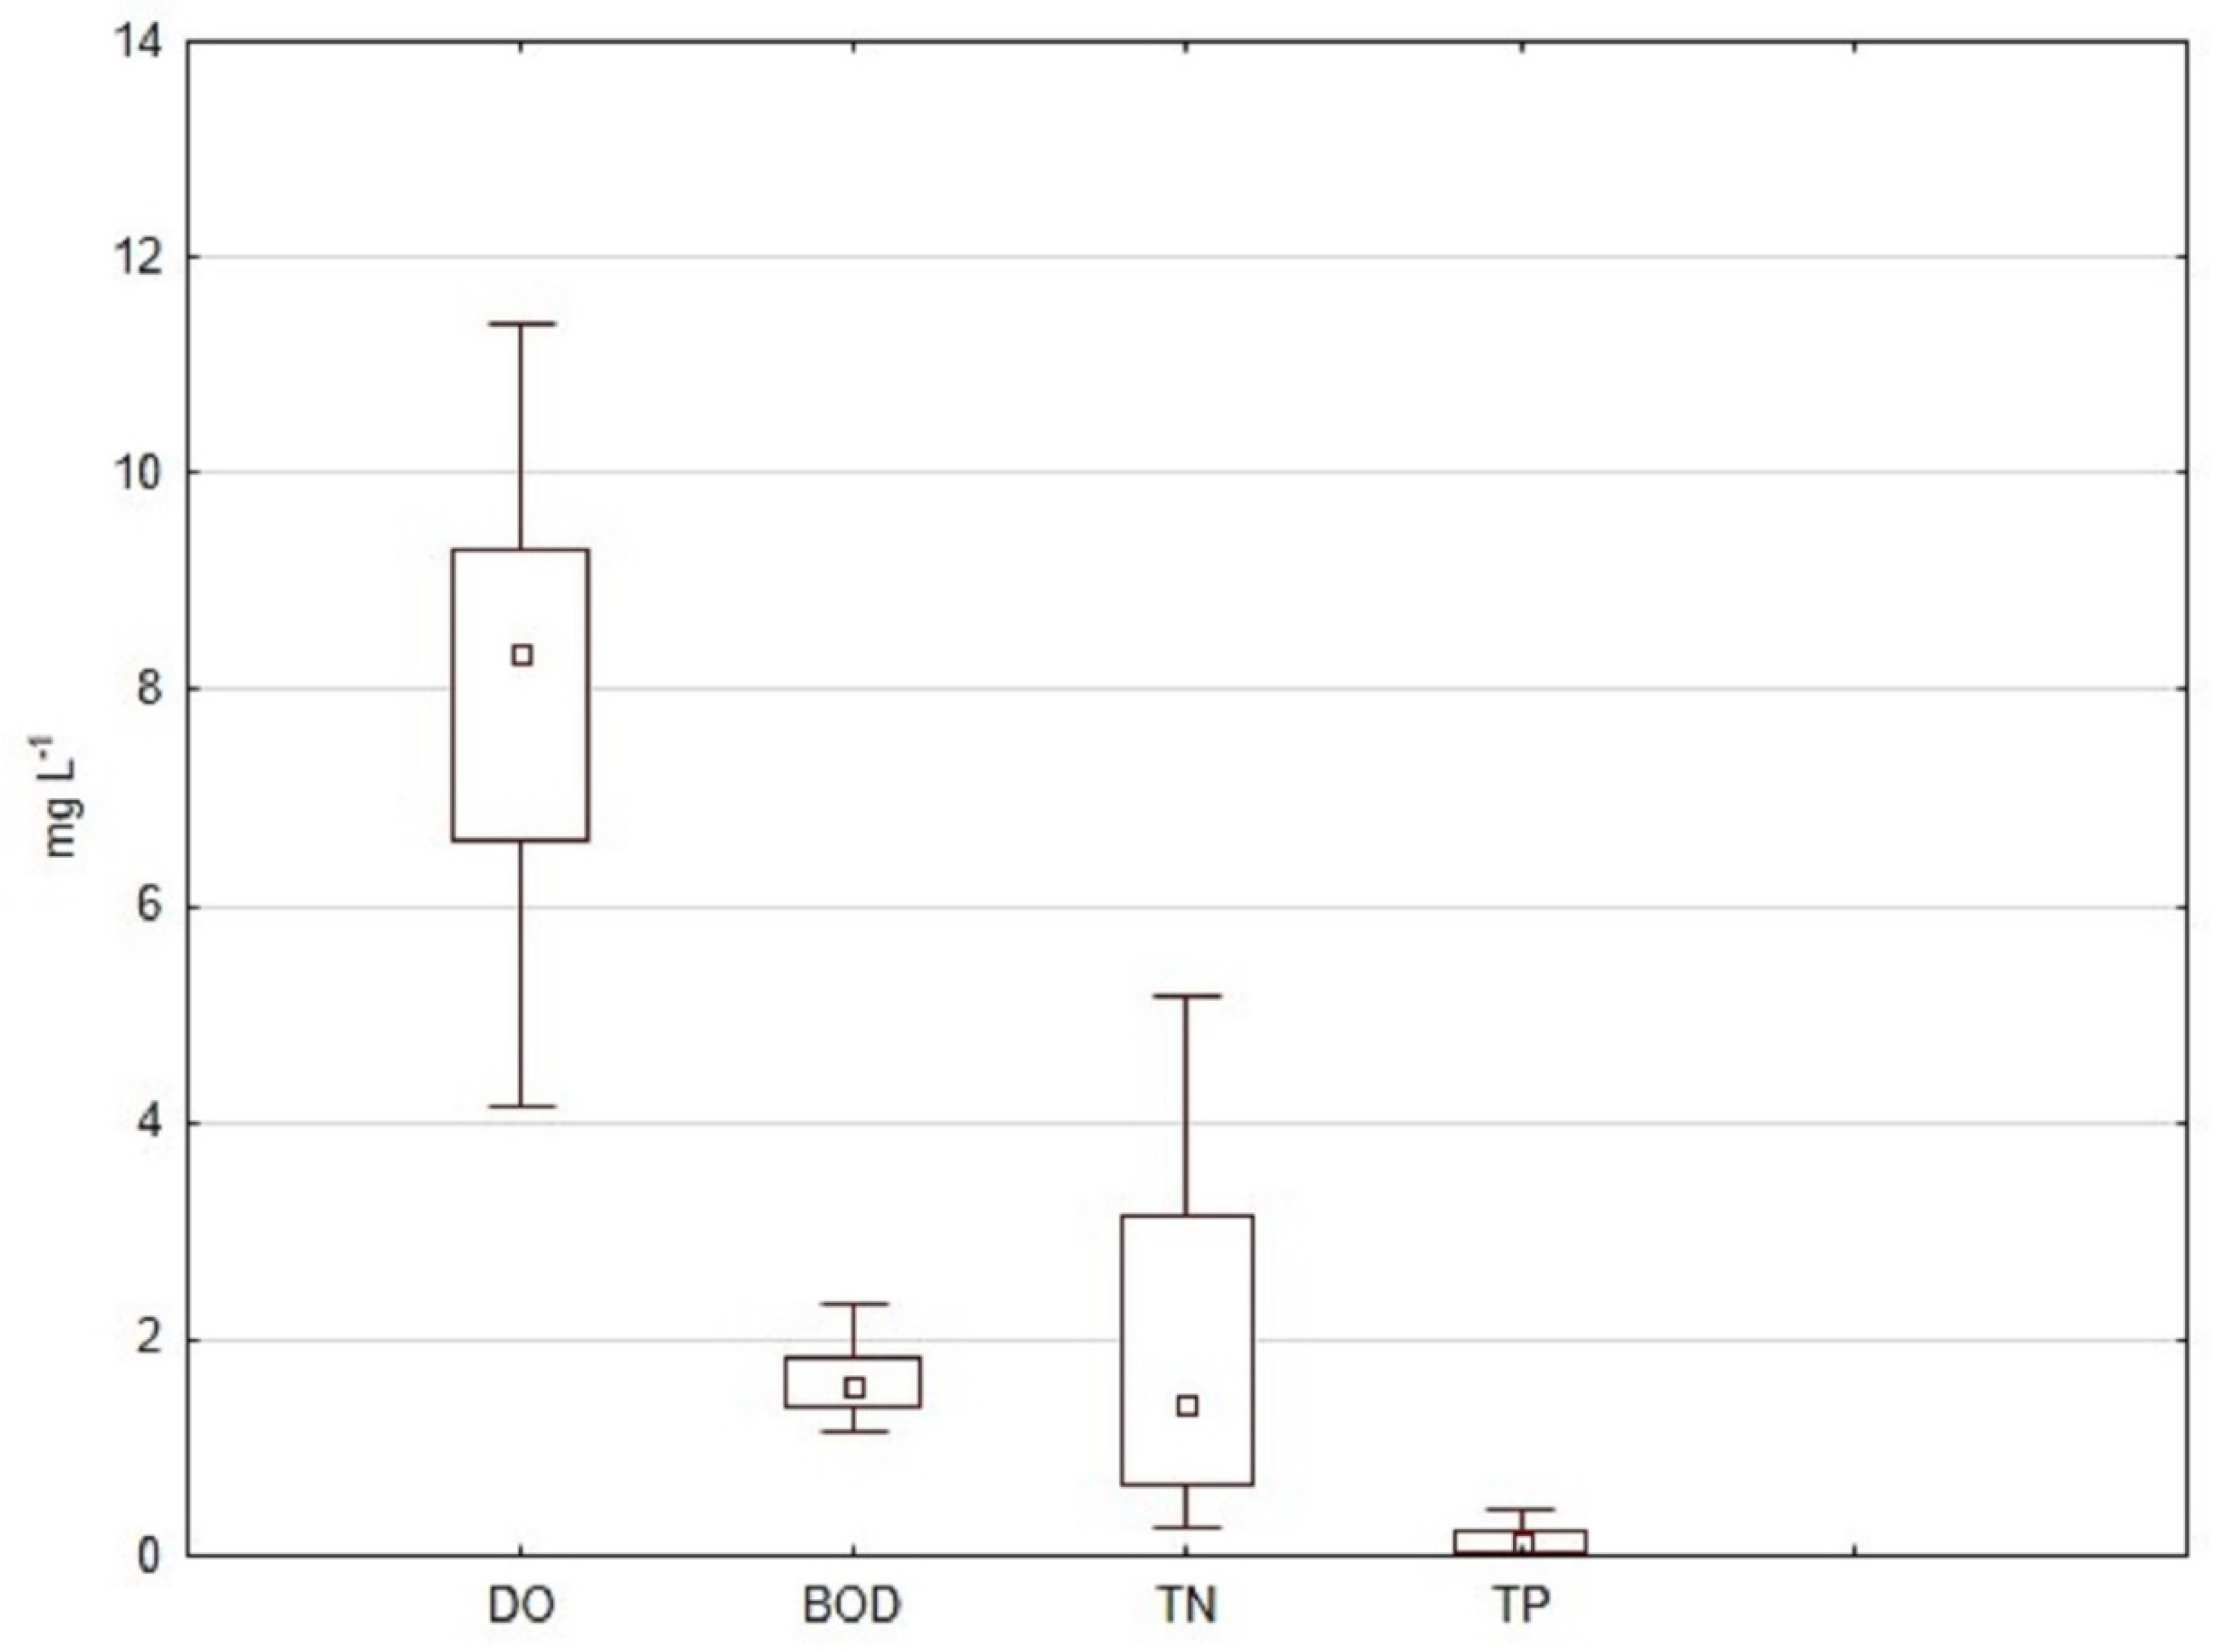
3.1. Abiotic Parameters and Stressors

Studied river sites were located at relatively low altitudes, between 1 and 492 m a.s.l (Table 1). Sandy substrates in combination with organic mud and gravel dominated, which is typical for middle and low river flows. Most of the sites were sunny and characterized by slow to medium flow velocity. Except for the Black Sea river types (R10 and R11 including transitional Black Sea river firths R16), electrical conductivity was in the range of 351–814 μS cm−1, with a median of 497.5 μS cm−1, which was explained by the presence of Dobrudzha drying and karst rivers in the dataset. Dissolved oxygen had a minimum value of 4.2 and a maximum of 9.8 mg L−1. The rest of the physico-chemical stressors were highly variable—between 42 (TP) and 19 times (BOD) (Figure 2).

3.2. Macrophyte and Macroinvertebrate Communities and Metrics

Macrophyte species richness per site was between 1 (sites 7 and 14) and 15 taxa (sites 4 and 11), and the quantity was between 2 and 326 (i.e., cubed abundance following the DAFOR scale, as required to calculate the RI) (Figure 3).
The sites that were richest in macrophyte taxa were natural sites along large Black Sea rivers and karst streams. Aquatic vascular plant species (e.g., Myriophyllum spicatum, Ceratophyllum demersum) and helophytes (e.g., Phragmites australis) dominated the communities. In contrast, sites with the fewest species belonged to mountain and semi-mountain rivers, where macrophyte assemblages were represented by a small number of disturbance indicators (C. demersum, Elodea canadesis, etc.) instead of type-specific reference bryophyte communities.
Based on the calculated RI, 37% of the 19 studied sites were defined as moderate, while the rest were in poor status/potential. According to the BI values, 42% of the sites were determined as good, and 58% of the sites had high ecological status/potential.
The highest macrozoobenthos species richness was recorded at site 2 and site 17 (Figure 4), both being situated in semi-mountain type rivers where clean water indicators (representatives which belong to orders Ephemeroptera, Plecoptera, and Trichoptera) dominated in the composition of the benthic community.
The fewest benthic taxa were found at site 9, where more tolerant taxa (representatives of the classes Amphipoda and Gastropoda and the orders Odonata, Heteroptera, and Diptera) mostly prevailed. Site 11 was characterized by the greatest abundance (3155), which is due to the dominance of class Bivalvia, class Gastropoda, order Amphipoda, order Isopoda, order Arachnida, and order Odonata. The lowest abundance (157) was recorded at site 19, where orders Ephemeroptera, Plecoptera, and Trichoptera were poorly represented, mainly with tolerant taxa.

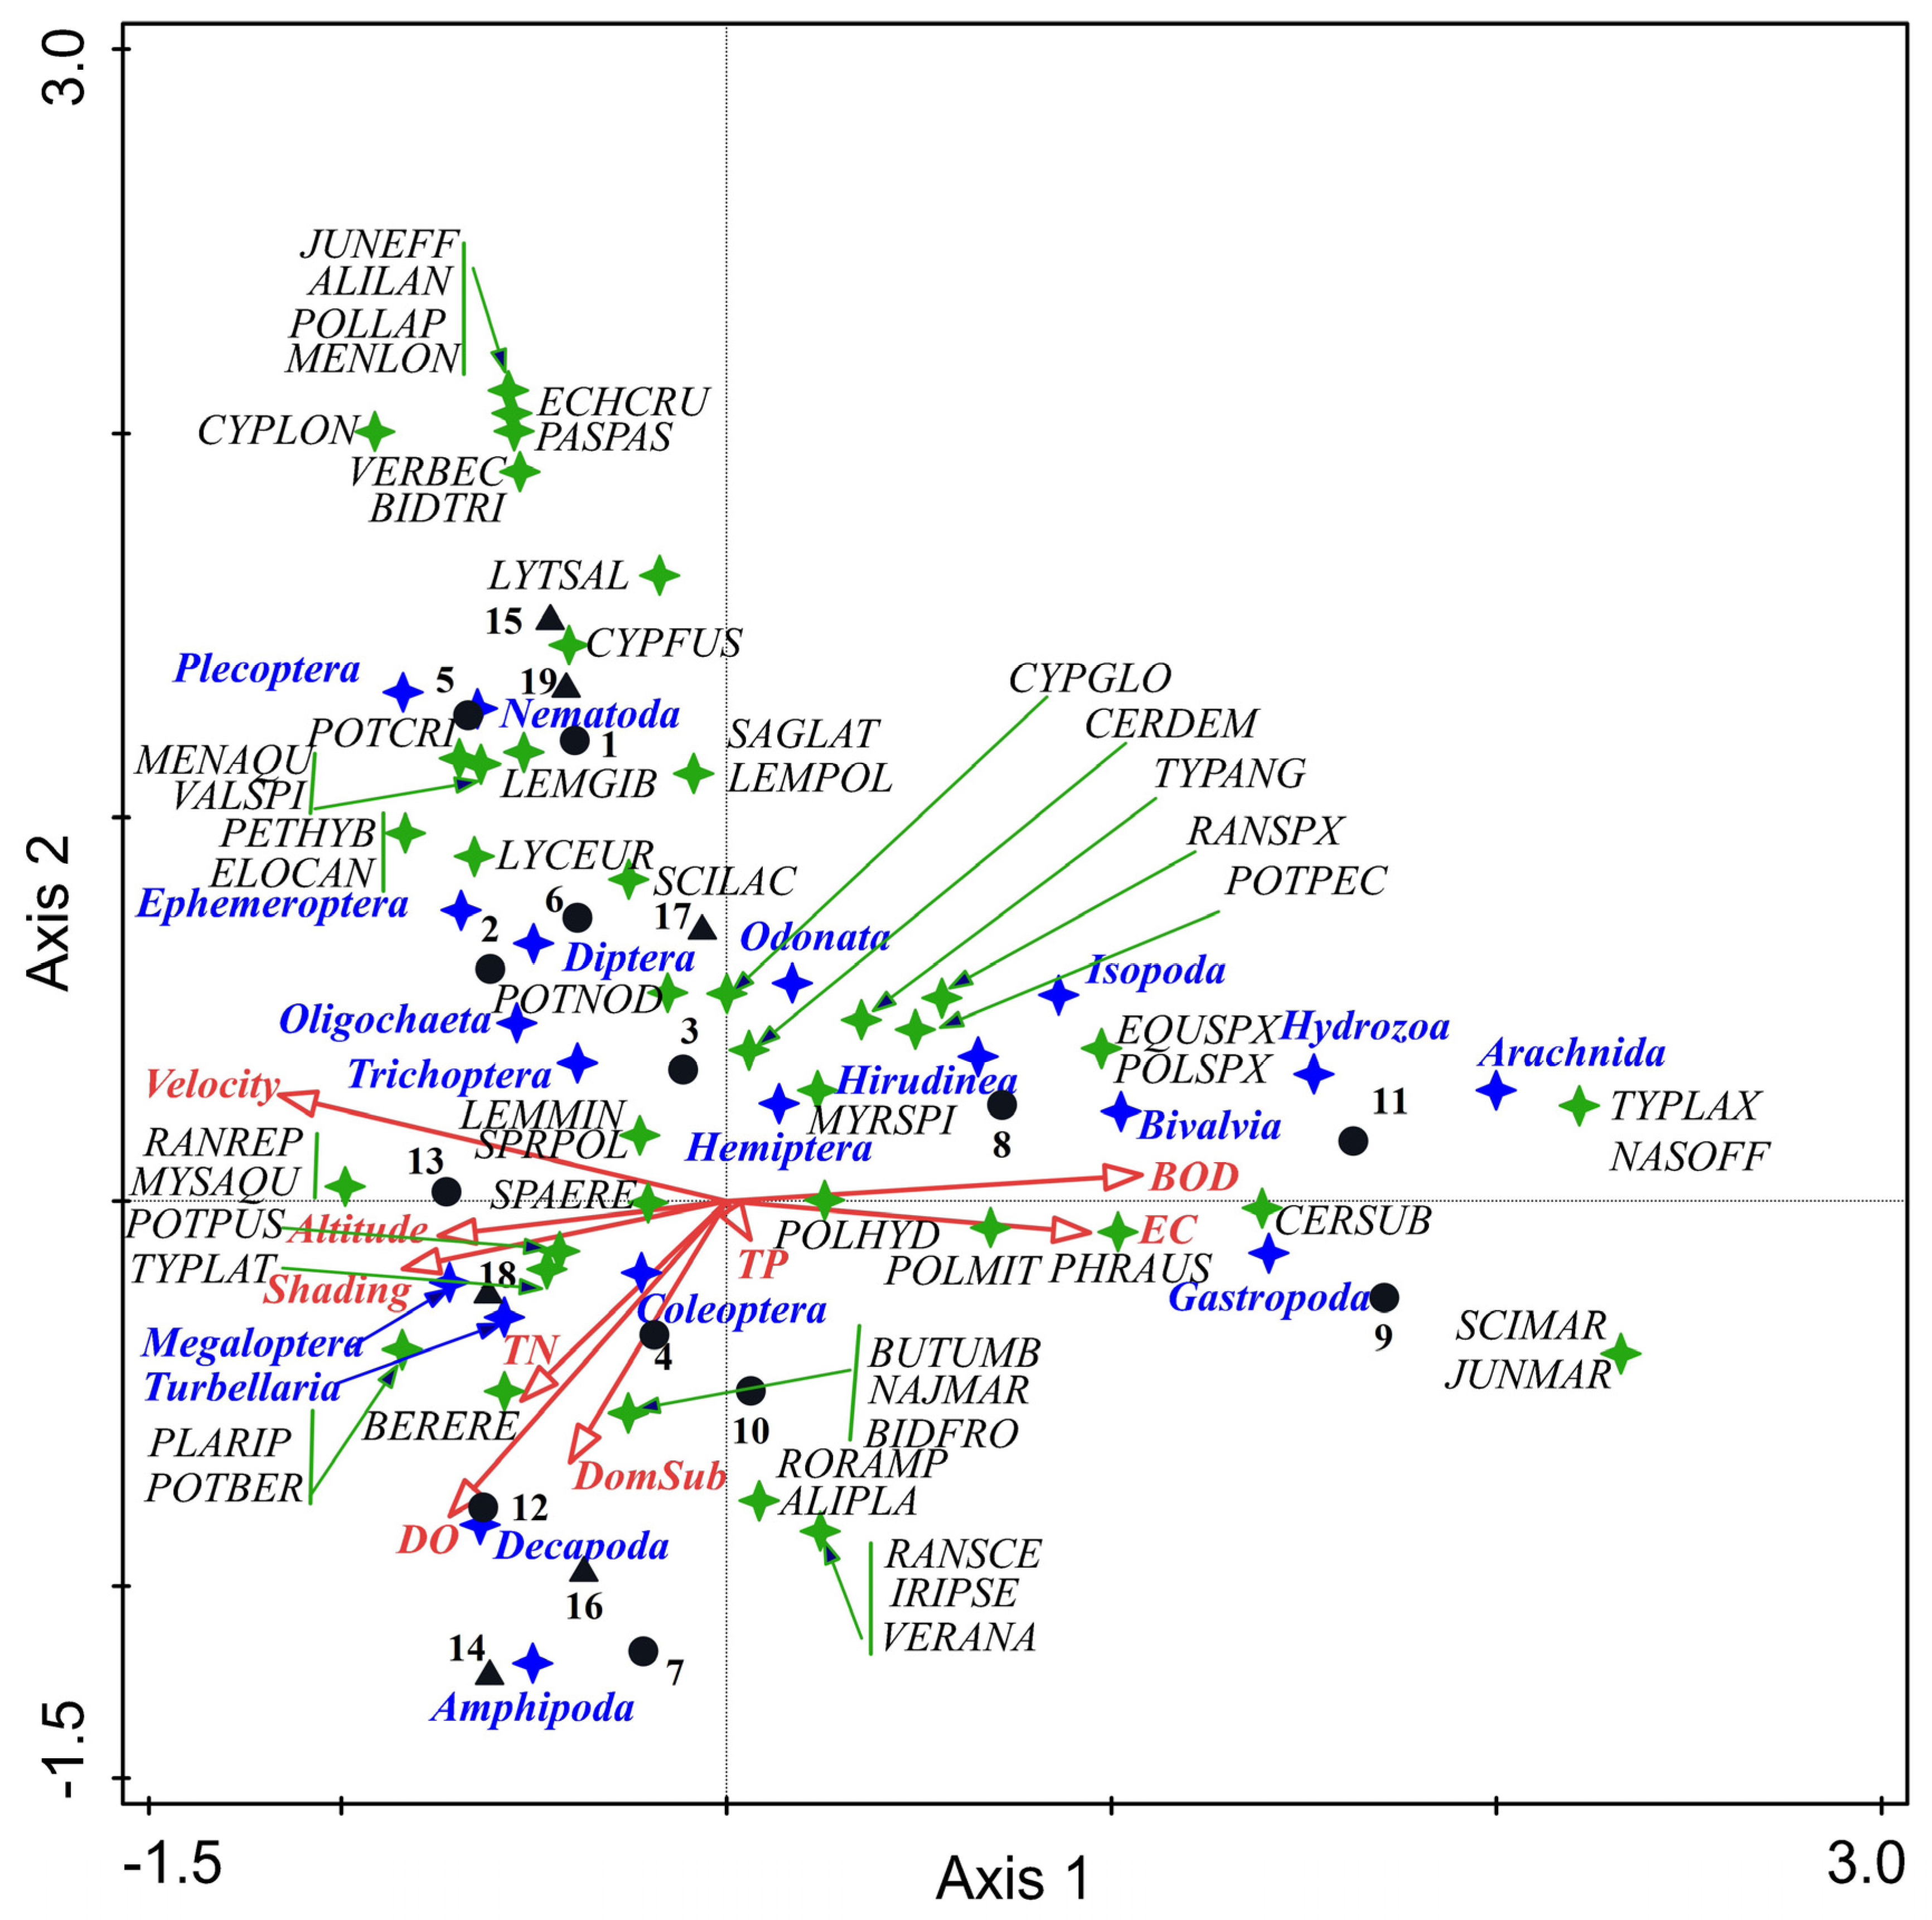
3.3. Aquatic Communities, Abiotic Factors, and Stressors: Relationship

The relationships between macrophytes (Supplementary Table S2), macroinvertebrates, the studied sites, and environmental variables were demonstrated using a CCA (Figure 5).
The eigenvalues (λ1 = 0.5405; λ2 = 0.3991) for the first two axes, as well as the taxa–environmental correlations (0.9832; 0.9812) for the two axes, denoted a clear separation of the taxa in the ordination space. The first two axes accounted for 46.53% of the cumulative percentage variance in the taxa data and 60.04% of the cumulative percentage variance in the taxa–environment relations. Monte Carlo unrestricted permutation tests (499 permutations) indicated significance (p = 0.006) of the first axis.
The forward variable selection testing showed that the most important factors were BOD (p = 0.006), conductivity (p = 0.006), dissolved oxygen (p = 0.008), TN (p = 0.04), and TP (p = 0.01), with contributions of 24.1%, 24.3%, 14.3%, 8.2%, and 8.1%, respectively. Three gradients in the factors and stressors were outlined. The first axes formed a gradient strongly related to BOD (0.667) and conductivity (0.585), with macrophytes typical/representative of these conditions: common reed (Phragmites australis), Ceratophyllum submersum, as well more tolerant macrozoobenthic groups (Hirudinea, Bivalvia, Isopoda, Arachnida, Hydrozoa, and Gastropoda). In contrast, the second environmental gradient demonstrated higher altitude (−0.463) and greater shading (−0.521) and velocity (−0.719), where the aquatic moss Platyhypnidium riparioides; the hygrophytes Myosoton aquaticum and Ranunculus repens; and benthic taxa from class Turbellaria and orders Ephemeroptera, Plecoptera, Trichoptera, and Megaloptera were plotted (left side of the diagram). The third environmental gradient was related to water oxygenation (−0.545), stony substrate (−0.452), and TN (−0.345) and separated benthic taxa into two groups. The first group preferred habitats characterized by high values of dissolved oxygen and stony/gravel substrate, and the second group preferred sites with low values of dissolved oxygen and soft bottom substrate. The presence of nitrogen enrichment tolerant Potamogeton species (P. pusillus, P. berchtoldii) was also linked to the third environmental gradient (Figure 5).

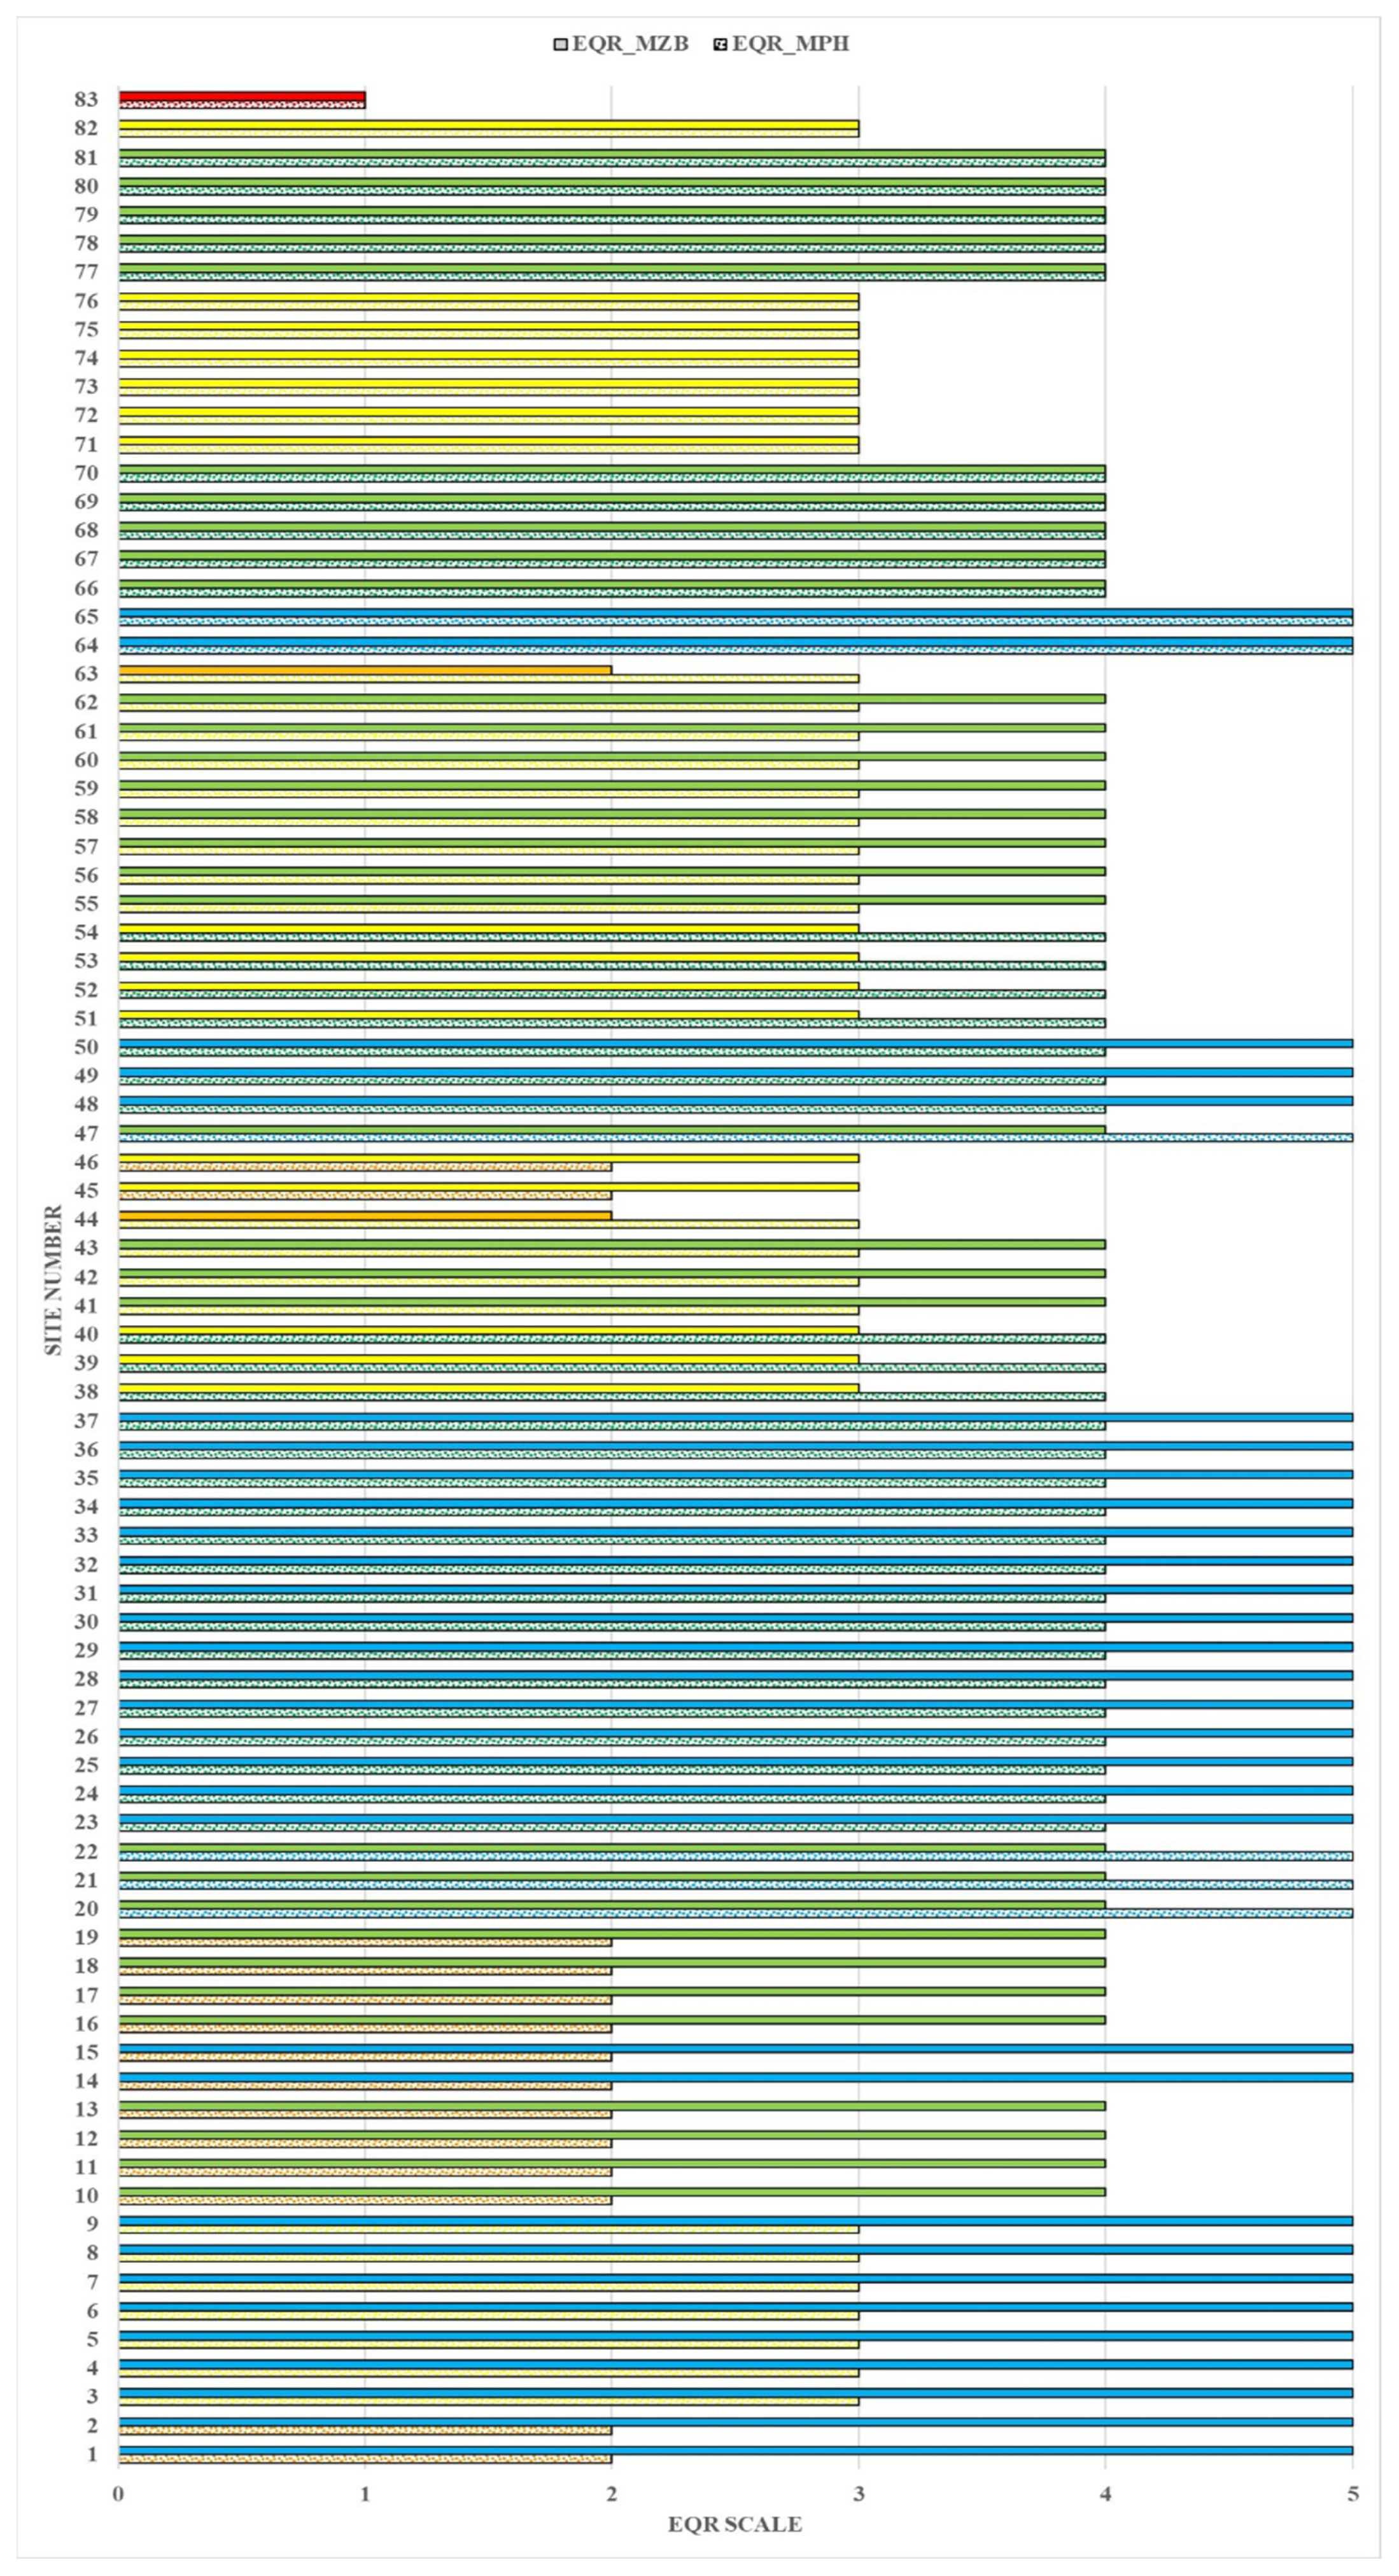
3.4. Ecological Status Assessment, Abiotic Factors, and Stressors: Relationships

A comparison between the ecological status evaluation based on macrophytes and macrozoobenthos showed that from the initial 83 sites (Supplementary Table S1), the assessment coincided at 21 sites, and it differed by one degree at 43 sites and by two or three degrees at 19 sites (24%) (Figure 6).
The 19 studied sites were represented by 13 natural and 6 HMWB sites (Table 1). The studied sites were affected by different types of anthropogenic impact including water abstraction, habitat alteration, channelization, alteration in riparian vegetation, barriers and, chemical pressure. Among the sites located in natural water bodies, a three-degree discrepancy was found at two sites (one from type R5 and one from type R13). A difference in evaluation of two degrees was registered at the remaining eleven sites (one from R5, one from R9, two from R10, two from R1, one from R12, two from R15, and two from R16) (Figure 6). A discrepancy in the ecological status assessment for the sites located at HMWB by three degrees was registered at two sites (R3, R5) and by two degrees at four sites (two from R4, one from R5, and one from R11). The ecological assessment determined using macrophytes was worse at all 19 studied sites compared to those defined using macrozoobenthos.
The first two RDA axes explained 71.7% of the species–environment relationship (F = 2.5, p = 0.028) (Figure 7a). The gradient was most strongly related to altitude (0.718) and shading (0.698). The second axis formed a gradient in the dynamics of oxygen parameters—positive with BOD (0.497) and negative with dissolved oxygen (−0.461). Altitude had a structuring role in shaping the composition of the macrophyte and macrozoobenthic communities (31.9%, p = 0.004). Macrophyte assemblages were richer in taxa at lower altitudes (finer substrate) and in sunny habitats. Aquatic flora richness (S-MPH) positively correlated with nitrogen enrichment and macroinvertebrates—with altitude, shading, and BOD (upper right part of the plot).
The ordination distribution for the abiotic parameters and physico-chemical stressors is presented in relation to macrophyte- and macrozoobenthic-based EQR values (F = 2.0, p = 0.06) (Figure 7b). The first two axes explained 67.2% of the total variance. TP (0.449), velocity (−0.36) and BOD (0.32) exhibited the strongest correlation with the first axis. Along the second axis, a gradient in TN (0.589) and altitude (−0.333) was formed. TP (16.0%, p = 0.04) and shading (14.2%, p = 0.04) were the most significant stressors for the evaluation of the ecological assessment defined using both macrophytes and macrozoobenthos. Moderate macrophytes-based EQR was related to oxygen concentration and shading, while the macroinvertebrate-based assessment was better at sites where coarser substrates and fewer nutrients were registered (Figure 7b).
Among the analyzed stressors, mainly TN and BOD explained the lower macrophyte-based assessment at nine sites shown on the left of the diagram (7, 10, 11–13, 16–19). Hydromorphological pressure explained the lower status/potential at the additional three sites shown on the bottom right of the diagram (4, 6, and 15). Sites 8 and 9 (R16) were also located there and were strongly connected with EC. It could be suggested that a slight increase in TN and BOD, out of high, but still in the range of good status, resulted in faster and stronger responses in macrophytes at five other sites (1–3, 5, and 14). Despite different assessments, both BQEs have higher values in conditions with lower BOD and TP. The sites with high EQR assessed using macrozoobenthos were located in a gradient between oxygen content and altitude, and those rated as having good EQR were influenced by the presence of nutrients in the water (Figure 7b).

4. Discussion

The complex action of the aquatic environment factors forms various habitats, where each species, according to its range of tolerance, finds its optimal living conditions. Factors external to the aquatic ecosystem cause changes in abiotic characteristics, which are reflected in the flora and fauna composition. Each species and community as a whole react strictly and specifically to the site-specific abiotic factors and each stressor’s impact. Gansfort & Traunspurger, 2019 [22] discussed the general drivers of aquatic communities and specific mechanisms that occur in each river system and showed that the consequences of changes in aquatic parameters or habitat connectivity for aquatic communities, irrespective of river network identity, can be quantified. In our study, we analyzed different types of rivers and attempted to present a complex analysis of the factors and stressors that affect the composition of macrophytes and macrozoobenthos. The two communities formed their composition at the same sites with similar habitat conditions but were influenced in a different way and extent by the environmental characteristics (Figure 7).
Macrophyte species richness varied relatively widely (1–15) among the 19 studied sites, although the EQR-based assessment showed mostly poor status. Similar variation was observed in 71 streams in western and central Finland both at reference and test sites [23]. It can be assumed that the number of species does not reflect the status but rather is related to local abiotic factors, mainly softer substrata and better light, suggesting the possibility of supporting a higher number of vascular macrophyte species. This finding was in conformance with previously reported naturally low species richness of macrophytes in undisturbed upland rivers [9,23]. In contrast to macrophytes, the taxonomic richness of macrozoobenthos increased at higher altitude sites and correlated with shading (Figure 7a). The elevation increase was marked by an abundance decrease [24]. The density of the invertebrate community grew in the lower river stretches, where finer substrates and greater amounts of allochthonous and autochthonous organic matter were formed (Figure 4). These habitats were characterized by softer bottom substrates and were favorable for the development of more tolerant species, which were represented in greater numbers of specimens. In unimpacted mountain rivers characterized by reference conditions, macrophytes react most distinctly to altitude, pH, conductivity, alkalinity, and total hardness, while macroinvertebrates depend primarily on dissolved oxygen, flow dynamics, and the granulometry of channel material [2]. At mountainous and semi-mountainous sites (2, 12, 14, and 15), the taxonomic richness of both communities depended on the altitude, which is a complex factor affecting the parameters indicated above. At three of the indicated sites (1, 14, and 15), the ecological assessment based on macrophytes was poor, while that based on macrozoobenthos was high. Two of the sites (14, 15) are highly modified water bodies; the only one without anthropogenic pressure (abstraction, habitat alteration) was site 2, where a poor macrophyte-based status was related to the community of disturbance indicators and invasive species only. Our results showed that regardless of the differences in the characteristics of the aquatic environment, a better ecological status based on two BQE was formed when low values of BOD and total phosphorus were registered (Figure 7b).
Anthropogenic transformations to a riverbed affect the ecological status of rivers [10]. Macrophytes and macrozoobenthos are key BQEs for determining the superficial running waters. The two communities are closely linked, and their interaction has positive effects on maintaining the balance and health of aquatic ecosystems. Thus, the interaction between them is bilateral, where submerged macrophytes provide food for herbivores, decomposers, and detritivore zoobenthos and a suitable habitat by providing oxygen, shelter, resting areas, sites for oviparous and sites for predation. Zoobenthos provide carbon dioxide to promote photosynthesis and improve the sediment soil quality for flavoring macrophyte growth [25]. Considering the two groups of organisms enables more comprehensive and reliable monitoring than an assessment based on a single group of organisms, especially where the standard bio-indicative practices can be distorted by extreme local conditions [2]. This study found a fast and strong response in the macrophyte-based EQR to TN and BOD at both upland and lowland river sites, which confirmed the reported strong response in lowland rivers, but this was in contrast to the stated macrophyte metrics’ (trophic indices MTR and IBMR) poor response to degradation gradients in mountain streams [8]. In conformance with the cited study [8], our results revealed that in cases where both BQEs cannot be monitored, the types of stressors and the time frame of a study should be taken into account. We could also add here a third condition before selecting the monitored biotic group—the type of disturbance-related metrics and indices to be applied, e.g., those focused on assessing particular stressors such as nutrient enrichment or general stream degradation. A similar approach was recommended previously [26], i.e., the selection of a metric to monitor the effects of stressors should not only focus on the BQEs but also on the nature of the metric. Both RI and BI are based on the presence of indicator groups sensitive to multiple stressors [15,19,20]. The macrozoobenthos-based EQR assessment defined the 19 studied sites as having high and good statuses (Figure 6). The sites determined as having high ecological status in terms of macrozoobenthos were located at a higher altitude and characterized by an oxygen-rich environment and faster water velocity. Benthic taxa belonged to orders Ephemeroptera, Plecoptera, and Trichoptera, which are considered indicators of clean water, prevailed (Figure 5). A predominant presence of more sensitive benthic taxa at the unaffected river sections was also reported by other similar observations [27,28]. Alike to our result (see Figure 7b), it was found that macrozoobenthos-based EQR was more closely related to the dominant substrate and conductivity, which could be regarded as one of the major variables that play a crucial role in explaining the gradient in the distribution of benthic macroinvertebrates in rivers [29]. In our study, finer substrate and higher values of conductivity created favorable conditions for more tolerant benthic groups including Hirudinea, Bivalvia, Odonata, Isopoda, and Gastropoda (Figure 5). Nutrient content (especially TN) and lower velocity had determinative roles in the formation of the ecological situation at the sites characterized as having good ecological status according to macrozoobenthos. Juvigny-Khenafou et al. [30] determined flow velocity reduction as a pervasive stressor, which displayed the largest number of changes in water ecosystems with time and effects on invertebrate community-level metrics and abundances of common taxa.
Effective assessment programs to evaluate the ecological status of freshwater systems can contribute to the overall health of the aquatic environment [31]. In our study (Supplementary Table S1 and Table 1), we analyzed only those sites where the EQR based on macrophytes and macrozoobenthos diverged by two and three degrees. The macrophyte-based assessment showed lower EQR at all studied sites than those based on macrozoobenthos (Table 1, Figure 6). Several reasons could be pointed out. Seventeen of the analyzed nineteen river sites were under moderate to strong anthropogenic pressure, which at a first step influenced physical habitat characteristics, e.g., abiotic conditions of major importance for aquatic macrophyte communities. Alteration to riparian vegetation reflects shading and water temperature and habitat alteration (substrate), while abstraction reflects flow velocity. In conditions of additional physico-chemical stressors (nitrogen and other macro-nutrient enrichment), aquatic macrophytes, as primary producers, had a more pronounced response to nutrient excess. On the other hand, macrozoobenthos organisms have various mechanisms with which they can adapt and overcome adverse impacts to a greater or lesser extent. These include burying in the substrate and using various shelters against predators, including macrophytes as refuges for invertebrates. In addition, aquatic invertebrates are more mobile and can move and find more favorable niches for survival.
Furthermore, the two communities responded differently to environmental factors and stressors (Figure 5). The species richness of macrophytes was positively affected by softer substrates and low shading, while the macrozoobenthos was characterized by a greater taxonomic composition in more diverse substrates and at higher shading (Figure 7a).
When analyzing the response of aquatic communities, we should consider which is the dominant stressor in the aquatic ecosystem. If inorganic nutrient enrichment is the main stressor affecting stream integrity, then diatom or macrophyte metrics might be given first consideration. Conversely, if there are sources of organic N and P, then macroinvertebrates should be studied. In addition, if habitat/hydromorphological alteration is the main stressor, then macrophytes or fish should be considered [32]. Juvigny-Khenafou et al. [30] emphasized the complexity of the macroinvertebrate community dynamics and the responses of individual taxa as a result of the impact of multiple stressors. In our study, the sites were affected by more than one anthropogenic impact (Table 1). In this sense, not only the type of stressor but also their cumulative, combined effect, both on the community as a whole and on each species, is essential. Furse et al. [33] determined that macroinvertebrate assemblages could be reliable indicators for changes in stream nutrient status but indirectly since macroinvertebrates most probably react to related changes in oxygen content. The same authors showed that macrophyte assemblages are most useful for assessing stream ecological status at a river basin scale, while macroinvertebrates and benthic diatom assemblages are better at indicating smaller-scale patterns. Under the influence of the formed ecological situations at the studied sites, the two communities reacted strictly and specifically to fluctuations in the physical characteristics of the aquatic environment and the various stressors. An explanation for the discrepancy in the EQR evaluation based on the two biological quality elements could be sought from the above. This confirms the European and Bulgarian water legislation’s justified use of several (better all mandatory) biological elements to obtain a relevant ecological status assessment for the lotic ecosystems. Using this approach, the status class at the combined level will incorporate into the water body ecological status class (one-out-all-out methodology) [34].

5. Conclusions

Environmental characteristics and anthropogenic impacts acted based on their complexity and transformed the composition of the studied communities, which changed the ecological status assessment based on macrophytes and macrozoobenthos. The specific adaptive mechanisms underlying the aquatic communities in general, as well as individual taxa and their ecological preferences, found expression in specific reactions towards physical parameters and stressors, which could lead to discrepancies in EQR estimates using the two studied biological quality elements. Further research, conducted during different years and seasons, could differentiate in more detail the influence of natural factors on the water habitat parameters and the response of the studied aquatic communities to single occurrences of stressors, as well as assess their cumulative effect.

Supplementary Materials

The following supporting information can be downloaded at: https://www.mdpi.com/article/10.3390/w15122282/s1, Table S1: Study sites with indicated geographic coordinates, altitude, river type, and ecological quality ratio (EQR) sorted by type (natural and HMWB) of water body; MPH—macrophytes; MZB—macrozoobenthos. Legend for river type: R1—alpine rivers; R3—mountainous rivers; R4/5—semi-mountainous rivers; R7—large Danube tributaries; R8—medium and small Danube rivers; R9—Dobrudzha degrading rivers; R10—large Black Sea rivers; R11—small and medium Black Sea rivers; R12—large lowland rivers; R13—small and medium lowland rivers; R15—karst springs; R16—Black Sea river estuaries.; Table S2: List of macrophyte species (nomenclature after Hill et al. [35] for mosses and Euro + Med PlantBase [36] for vascular plants) and their codes.

Author Contributions

Conceptualization, E.V., G.G. and V.T.; methodology, E.V., G.G. and V.T.; software, E.V., G.G. and V.T.; validation, E.V., G.G. and V.T.; formal analysis, E.V., G.G. and V.T.; investigation, E.V., G.G. and V.T.; resources, E.V., G.G. and V.T.; data curation, E.V., G.G. and V.T.; writing—original draft preparation, E.V., G.G. and V.T.; writing—review and editing, E.V., G.G., V.T. and T.M.; visualization, E.V., G.G. and V.T.; supervision, E.V., G.G. and V.T. All authors have read and agreed to the published version of the manuscript.

Funding

This article was published using financial support from the National Roadmap for Research Infrastructure (2020-2027), Ministry of Education and Science of Republic of Bulgaria, through agreement № ДO1-163/28.07.2022 for “Upgrading of the distributed scientific research Infrastructure “Bulgarian long-term ecosystem research network (LTER-BG)”.

Data Availability Statement

The data presented in this study are available in the article and the Supplementary Materials.

Acknowledgments

The authors thank to the projects “Validation of the typology and classification system in Bulgaria for the ecological status assessment of the surface water bodies in categories “river’’, “lake” and “transitional waters” (Grant no. 71 957 35/17.4.2020, DICON-UBA) and “Biological classification of surface water bodies of categories “river”, “lake” and “transitional water” in Bulgaria as basis for assessment of ecological status and ecological potential within the Development of the 3rd RBMP” (Grant no.№ 7203912/02.2022, DICON-UBA).

Conflicts of Interest

The authors declare no conflict of interest.

References

  1. Council of the European Communities. Directive of the European Parliament and of the Council establishing a framework for Community action in the field of water policy. L327 OJEC 2000, 43, 1–73. [Google Scholar]
  2. Szoszkiewicz, K.; Jusik, S.; Lewin, I.; Czerniawska-Kusza, I.; Kupiec, J.; Szostak, M. Macrophyte and macroinvertebrate patterns in unimpacted mountain rivers of two European ecoregions. Hydrobiologia 2018, 808, 327–342. [Google Scholar] [CrossRef] [Green Version]
  3. Stefanidis, K.; Dimitrellos, G.; Sarika, M.; Tsoukalas, D.; Papastergiadou, E. Ecological Quality Assessment of Greek Lowland Rivers with Aquatic Macrophytes in Compliance with the EU Water Framework Directive. Water 2022, 14, 2771. [Google Scholar] [CrossRef]
  4. Buchner, D.; Beermann, A.J.; Laini, A.; Rolauffs, P.; Vitecek, S.; Hering, D.; Leese, F. Analysis of 13,312 benthic invertebrate samples from German streams reveals minor deviations in ecological status class between abundance and presence/absence data. PLoS ONE 2019, 14, e0226547. [Google Scholar] [CrossRef] [PubMed] [Green Version]
  5. Jourdan, J.; O’Hara, R.; Bottarin, R.; Huttunen, K.; Kuemmerlen, M.; Monteith, D.; Muotka, T.; Ozoliņš, D.; Paavola, R.; Pilotto, F.; et al. Effects of changing climate on European stream invertebrate communities: A long-term data analysis. Sci. Total Environ. 2018, 621, 588–599. [Google Scholar] [CrossRef]
  6. Pinto, P.; Morais, M.; Ilhe’u, M.; Sandin, L. Relationships among biological elements (macrophytes, macroinvertebrates and ichthyofauna) for different core river types across Europe at two different spatial scales. Hydrobiologia 2006, 566, 75–90. [Google Scholar] [CrossRef]
  7. Gecheva, G.; Belkinova, D.; Varadinova, E. Phytoplankton, Macrophytes and Macroinvertebrates in Reservoirs: Response to Eutrophication. Ecol. Balk. 2020, 12, 153–164. [Google Scholar]
  8. Hering, D.; Johnson, R.K.; Kramm, S.; Schmutz, S.; Szoszkiewicz, K.; Verdonschot, P.F.M. Assessment of European streams with diatoms, macrophytes, macroinvertebrates and fish: A comparative metric-based analysis of organism response to stress. Freshw. Biol. 2006, 51, 1757–1785. [Google Scholar] [CrossRef]
  9. Gecheva, G.; Pall, K.; Todorov, M.; Traykov, I.; Gribacheva, N.; Stankova, S.; Birk, S. Anthropogenic Stressors in Upland Rivers: Aquatic Macrophyte Responses. A Case Study from Bulgaria. Plants 2021, 10, 2708. [Google Scholar] [CrossRef]
  10. Spyra, A.; Kubicka, J.; Strzelec, M. The use of biological indices for the assessment of the river quality (Ruda river, Poland). Ecol. Chem. Eng. S 2017, 24, 285–298. [Google Scholar] [CrossRef] [Green Version]
  11. Chazanah, N.; Muntalif, B.S.; Rahmayani, R.A.; Sudjono, P. Macrozoobentos Distribution as a Bioindicator of Water Quality in the Upstream of the Citarum River. J. Ecol. Eng. 2020, 21, 10–17. [Google Scholar] [CrossRef] [Green Version]
  12. Cheshmedjiev, S.; Karagiozova, T.; Michailov, M.; Valev, V. Revision of River & Lake Typology in Bulgaria within Ecoregion 12 (Pontic Province) and Ecoregion 7 (Eastern Balkans) According to the Water Framework Directive. Ecol. Balk. 2010, 2, 75–96. [Google Scholar]
  13. Schaumburg, J.; Schranz, C.; Foerster, J.; Gutowski, A.; Hofmann, G.; Meilinger, P.; Schneider, S.; Schmedtje, U. Ecological classification of macrophytes and phytobenthos for rivers in Germany according to the Water Framework Directive. Limnology 2004, 34, 283–301. [Google Scholar] [CrossRef] [Green Version]
  14. Schaumburg, J.; Schranz, C.; Stelzer, D.; Hofmann, G.; Gutowski, A.; Foerster, J. Instruction Protocol for the Ecological Assessment of Running Waters for Implementation of the EC Water Framework Directive: Macrophytes and Phytobenthos; Bavarian Environment Agency: Munich, Germany, 2006. [Google Scholar]
  15. Gecheva, G.; Dimitrova-Dyugerova, I.; Cheshmedjiev, S. Macrophytes. In Biological Analysis and Ecological Assessment of the Surface Water Types in Bulgaria; Belkinova, D., Gecheva, G., Eds.; Plovdiv University Press: Plovdiv, Bulgaria, 2013; pp. 127–146. (In Bulgarian) [Google Scholar]
  16. McGarrigle, M.; Lucey, J.; Clabby, K.C. Biological assessment of river water quality in Ireland. In River Water Quality Ecological Assessment and Control; Newman, P.J., Piavaux, M.A., Sweeting, R.A., Eds.; Commission of the European Community: Brussels, Belgium, 1992; pp. 371–385. [Google Scholar]
  17. McGarrigle, M.; Lucey, J. Intercalibration of ecological status of rivers in Ireland for the purpose of the Water Framework Directive. In Biology and Environment: Proceedings of the Royal Irish Academy; Royal Irish Academy: Dublin, Ireland, 2009; Volume 109, pp. 237–246. [Google Scholar]
  18. Clabby, K.; Bowman, J. Report of Irish Participants. In 3rd Technical Seminar on Biological Water Assesment Methods; Ghetti, P.F., Ed.; Commission of the European Communities: Parma, Italy, 1979; Volume 1. [Google Scholar]
  19. Soufi, R.; Vidinova, Y.; Tyufekchieva, V.; Evtimova, V.; Stoianova, D.; Kerakova, M.; Georgieva, G.; Stoichev, S.; Dedov, I.; Wolfram, G. Intercalibration of macroinvertebrate-based method for status assessment of Bulgarian tributaries of the Danube River. Ecol. Balk. 2018, 10, 63–72. [Google Scholar]
  20. Cheshmedjiev, S.; Varadinova, E. Bottom Invertebrates. In Biological Analysis and Ecological Assessment of the Surface Water Types in Bulgaria; Belkinova, D., Gecheva, G., Eds.; Plovdiv University Press: Plovdiv, Bulgaria, 2013; pp. 12–52. (In Bulgarian) [Google Scholar]
  21. ter Braak, C.J.F.; Smilauer, P. CANOCO Reference Manual and CanoDraw for Windows User’s Guide: Software for Canonical Community Ordination (Version 4.5); Microcomputer Power: Ithaca, NY, USA, 2002. [Google Scholar]
  22. Gansfort, B.; Traunspurger, W. Environmental factors and river network position allow prediction of benthic community assemblies: A model of nematode metacommunities. Sci. Rep. 2019, 9, 14716. [Google Scholar] [CrossRef] [Green Version]
  23. Mykrä, H.; Aroviita, J.; Hämäläinen, H.; Kotanen, J.; Vuori, K.-M.; Muotka, T. Assessing stream condition using macroinvertebrates and macrophytes: Concordance of community responses to human impact. Fundam. Appl. Limnol. 2008, 172, 191–203. [Google Scholar] [CrossRef]
  24. Roine, A.; Reid, B.; Uribe, L.; Moreno-Meynard, P.; Fierro, P.; Madriz, I.; Death, R. Macroinvertebrate community composition and richness along extreme gradients: The role of local, catchment, and climatic variables in Patagonian headwater streams. Freshw. Biol. 2021, 67, 445–460. [Google Scholar] [CrossRef]
  25. Tan, S.Y.; Li, Z.; Cheng, S. Ecological Interaction between Submerged Macrophytes and Zoobenthos. J. Earth Sci. Environ. Stud. 2017, 2, 173–182. [Google Scholar] [CrossRef] [Green Version]
  26. Marzina, A.; Archaimbault, V.; Belliard, J.; Chauvin, C.; Delmas, F.; Pont, D. Ecological assessment of running waters: Do macrophytes, macroinvertebrates, diatoms and fish show similar responses to human pressures? Ecol. Ind. 2012, 23, 56–65. [Google Scholar] [CrossRef]
  27. Kownacki, A.; Szarek-Gwiazda, E. The Impact of Pollution on Diversity and Density of Benthic Macroinvertebrates in Mountain and Upland Rivers. Water 2022, 14, 1349. [Google Scholar] [CrossRef]
  28. Tyufekchieva, V.; Vidinova, Y.; Evtimova, V.; Varadinova, E.; Botev, I. Ephemeroptera, Plecoptera and Trichoptera (Insecta) of Mountain Tributaries of the Struma River: Diversity in Relation to Environmental Parameters and Zoogeographic Features. Acta Zool. Bulg. 2022, 70 (Suppl. S16). in press. [Google Scholar]
  29. Lewin, I.; Czerniawska-Kusza, I.; Szoszkiewicz, K.; Ławniczak, A.E.; Jusik, S. Biological indices applied to benthic macroinvertebrates at reference conditions of mountain streams in two ecoregions (Poland, the Slovak Republic). Hydrobiologia 2013, 709, 183–200. [Google Scholar] [CrossRef] [Green Version]
  30. Juvigny-Khenafou, N.P.; Piggott, J.J.; Atkinson, D.; Zhang, Y.; Macaulay, S.J.; Wu, N.; Matthaei, C.D. Impacts of multiple anthropogenic stressors on stream macroinvertebrate community composition and functional diversity. Ecol. Evol. 2020, 11, 133–152. [Google Scholar] [CrossRef] [PubMed]
  31. Schmidt-Kloiber, A.; Graf, W.; Lorenz, A.; Moog, O. The AQEM/STAR taxalist—A pan-European macro-invertebrate ecological database and taxa inventory. In The Ecological Status of European Rivers: Evaluation and Intercalibration of Assessment Methods; Furse, M.T., Hering, D., Brabec, K., Buffagni, A., Sandin, L., Verdonschot, P.F.M., Eds.; Developments in Hydrobiology book series; Springer: Dordrecht, The Netherlands, 2006; Volume 566, pp. 325–342. [Google Scholar] [CrossRef]
  32. Johnson, R.K.; Hering, D.; Furse, M.T.; Clarke, R.T. Detection of ecological change using multiple organism groups: Metrics and uncertainty. In The Ecological Status of European Rivers: Evaluation and Intercalibration of Assessment Methods; Furse, M.T., Hering, D., Brabec, K., Buffagni, A., Sandin, L., Verdonschot, P.F.M., Eds.; Developments in Hydrobiology book series; Springer: Dordrecht, The Netherlands, 2006; Volume 566, pp. 115–137. [Google Scholar] [CrossRef]
  33. Furse, M.T.; Hering, D.; Brabec, K.; Buffagni, A.; Sandin, L.; Verdonschot, P.F.M. The Ecological Status of European Rivers: Evaluation and Intercalibration of Assessment Methods. Hydrobiology 2006, 566, 153–172. [Google Scholar] [CrossRef] [Green Version]
  34. Rules for Assessing Surface Water Body Ecological Status and Potential. Method Statement for 2022 Update of the River Basin Management Plans. Environment Agency, Horizon House, Deanery Road, Bristol BS1 5AH. 2022. Available online: www.gov.uk/government/publications (accessed on 1 April 2023).
  35. Hill, M.O.; Bell, N.; Bruggeman-Nannenga, M.A.; Brugués, M.; Cano, M.J.; Enroth, J.; Flatberg, K.I.; Frahm, J.-P.; Gallego, M.T.; Garilleti, R.; et al. An annotated checklist of the mosses of Europe and Macaronesia. J. Bryol. 2006, 28, 198–267. [Google Scholar] [CrossRef]
  36. Euro+Med PlantBase—The Information Resource for Euro-Mediterranean Plant Diversity. Available online: http://ww2.bgbm.org/EuroPlusMed/ (accessed on 20 January 2023).
Figure 1. Map showing the area and sites studied in 2020. Legend: black circles—natural river sites with a difference of three and two degrees between two BQEs; black triangles—heavily modified water body (HMWB) river sites with a difference of three and two degrees; gray circles—natural river sites with a difference of one degree; gray triangles—HMWB river sites with a difference of one degree; circles without color—natural river sites with equal assessment; triangles without color—HMWB river sites with equal assessment. For the number identity of river sites, please see Supplementary Table S1.
Water 15 02282 g001
Figure 2. Distribution of four anthropogenic stressors analyzed in this study. Legend: DO—dissolved oxygen; BOD—biochemical oxygen demand; TN—total nitrogen; TP—total phosphorus.
Water 15 02282 g002
Figure 3. Taxa number (internal circle) and abundance (outer circle) of the macrophytes at the studied sites.
Water 15 02282 g003
Figure 4. Taxa number (internal circle) and abundance (outer circle) of the macrozoobenthos at the studied sites.
Water 15 02282 g004
Figure 5. CCA ordination triplot showing aquatic macrophytes (species level), macroinvertebrates (taxonomic groups), the studied sites, and environmental variables Legend: blue stars—macrozoobenthic taxa; green stars—macrophytes (for species codes, refer to Supplementary Table S2); black circles—natural; black triangles—HMWBs. Abbreviations for physico-chemical parameters: DO—dissolved oxygen; BOD—biochemical oxygen demand; EC—electrical conductivity; DomSub—dominant substrate; TN—total nitrogen; TP—total phosphorus.
Water 15 02282 g005
Figure 6. Ecological status evaluation based on macrophytes and macrozoobenthos at all 83 investigated sites. Comment: The EQR scale represents the ecological status as follows: 5—high (blue), 4—good (green), 3—moderate (yellow), 2—poor (orange), and 1—bad (red).
Water 15 02282 g006
Figure 7. (a) RDA ordination triplot with species richness (S_MPH, S_MZB), four abiotic characteristics, and six physico-chemical stressors. Legend: black circles—natural; black triangles—HMWBs. (b) RDA ordination triplot with macrophyte- and macroinvertebrate-based assessments (EQR_MPH, EQR_MZB), four abiotic characteristics, and six physico-chemical stressors. Legend: black circles—natural; black triangles—HMWBs.
Water 15 02282 g007
Table 1. The 19 studied sites with indicated geographic coordinates, altitude, river type, anthropogenic impact, and EQR sorted by type (natural and HMWB) of water body. MPH—macrophytes; MZB—macrozoobenthos. The EQR color scale represents the ecological status/potential as follows: blue—high, green—good, yellow—moderate, orange—poor.
River SiteLatitude
(N)
Longitude
(E)
Altitude (m a.s.l.)National River TypeNatural/
HMWB
Anthropogenic ImpactEQR-MPHEQR-MZB
1Stryama River, Manole Village42.28784824.912821190R13NaturalRiparian vegetationPoorHigh
2Bunovitsa River, before Topolnitsa River42.6150524.010267481R5NaturalDrinking water body; no data for significant anthropogenic pressure PoorHigh
3Kamchiya River, Grozdyovo Village43.03345527.55475321R10NaturalRiparian vegetation, habitat alterationModerateHigh
4Kamchiya River, Venelin Village43.03613127.67543715R10NaturalRiparian vegetation, habitat alterationModerateHigh
5Karaagach River, Fazanovo Village42.1948827.747917R11NaturalNo significant anthropogenic impact ModerateHigh
6Tundzha River, Srem Village, before bridge42.06263326.4765589R12NaturalBarriers, chemical pressureModerateHigh
7Karst spring of Maarata River, Krushuna Village43.1476525.020051144R15Natural Channelisation, habitat alterationModerateHigh
8Lisovo Dere River, near Kiten Town42.15878627.8641255R16NaturalRiparian vegetation, habitat alterationModerateHigh
9Butamyata River, liman42.05366727.985651R16NaturalRiparian vegetationModerateHigh
10Rusokastrenska River, Trastikovo Village42.4250327.2598110R11NaturalChannelisation, riparian vegetation, habitat alterationPoorGood
11Devnenska River, mouth43.17910927.6264864R15NaturalRiparian vegetation, habitat alteration, chemical pressurePoorGood
12Tundzha River, Yagoda Village, old bridge42.3274525.33805307R5NaturalBarriers, abstraction, habitat alterationPoorGood
13Chairluk River, Cherkovna Village43.6060926.63787268R9NaturalRiparian vegetation, chemical pressurePoorGood
14Asenovska River, Sliven Town42.68758326.283617290R3HMWBBarriers, water abstraction, riparian vegetation, habitat alterationPoorHigh
15Struma River, before Belishka River41.6331423.19722129R5HMWBBarriers, riparian vegetation, chemical alterationPoorHigh
16Provadiyska River, upstream of Provadiya Town43.2050727.4346542R11HMWBChannelization, riparian vegetation, habitat alteration, chemical pressurePoorGood
17Lesnovska River, before inflow into Iskar River42.4681923.22279492R4HMWBAbstraction, channelization, riparian vegetation, habitat alteration, chemical pressurePoorGood
18Kamchia River, Shalamanovo Village43.17694926.99263471R4HMWBAbstraction, channelization, riparian vegetation, habitat alteration, chemical pressurePoorGood
19Struma River, Topolnitsa Village41.41523.3185975R5HMWBBarriers, riparian vegetation, chemical pressurePoorGood
Disclaimer/Publisher’s Note: The statements, opinions and data contained in all publications are solely those of the individual author(s) and contributor(s) and not of MDPI and/or the editor(s). MDPI and/or the editor(s) disclaim responsibility for any injury to people or property resulting from any ideas, methods, instructions or products referred to in the content.

