Article

Carbon Accumulation Associated with Its Influencing Factors in Sediments from the Poyang Basin

1
School of Geography, Nanjing Normal University, Nanjing 210023, China
2
Jiangsu Center for Collaborative Innovation in Geographical Information Resource Development and Application, Nanjing 210023, China
3
Key Laboratory of Virtual Geographic Environment, Ministry of Education, Nanjing Normal University, Nanjing 210023, China
*
Author to whom correspondence should be addressed.
Water 2023, 15(12), 2199; https://doi.org/10.3390/w15122199
Submission received: 10 May 2023 / Revised: 8 June 2023 / Accepted: 9 June 2023 / Published: 12 June 2023

Abstract

:
Carbon burial in lake sediments has a profound impact on the global carbon cycle. In this study, the burial characteristics of organic carbon (OC) in typical sediments from the Poyang basin over the past hundred years were investigated and the influencing factors and driving mechanism were determined. The results showed that carbon burial in the Poyang basin sediments was mainly driven by human activities, whereas the change in the OC accumulation rate was related to precipitation, forest land area, water area, construction land area, urbanization rate, application of agricultural fertilizers, per capita GDP and population.

1. Introduction

Lakes are an important part of terrestrial ecosystems and also the interaction and connection points between various spheres of the Earth [1,2], which play a vital role in the regional and global carbon cycles. They receive terrestrial biological residues, soil organic matter, lake biological residues, and atmospheric deposition from the surrounding basin. In addition, microorganisms degrade large amounts of the organic carbon (OC) in the lake into carbon dioxide (CO2) and methane (CH4), which then enter the lake water and the atmosphere [3,4].
Lakes contain a large number of erosive substances that are brought in by rivers within the lake basin from biological debris produced by the lake itself. These then form relatively complete sediments. As a result, lake sediments have the characteristics of good continuity, a high sedimentation rate, and temporal resolution [5]. Furthermore, as a component of the lake, some information about the evolution of lake environments and human activities in the basin could be recorded in sediments. Therefore, sediments are used to be an indicator when studying global climate and environmental change [6]. With the intensification of human activities, lake eutrophication has become a serious ecological environmental problem [7]. The enrichment of nutrients in lake water causes increases in primary productivity and endogenous OC in the lake by promoting the growth of algae and aquatic plants, thus affecting the lake ecosystem and carbon cycle [8].
Poyang Lake is the largest freshwater lake in China and the largest bird sanctuary in Asia. It is located in the middle reaches of the Yangtze River basin and has a humid monsoon climate [9,10]. Over the past century, the increases in agricultural activities in the Poyang basin and the artificial construction of dams, gates, or ditches have accelerated the nutrient accumulation in the lake water and the ecological environment degradation [11]. By 2019, the total nitrogen (TN) and total phosphorus (TP) contents in Poyang Lake had increased to 2.29 mg L−1 and 0.15 mg L−1, respectively. Although the nutrient levels are not the highest in history, there has been a continuous upward trend in recent years [12]. These increases in nutrient levels in the lake may lead to environmental issues, e.g., lake eutrophication, algal blooms, food chain shortening, and changes in the lake’s acid–base balance, further influencing the OC burial in lake sediments [13,14,15]. This study took OC in the sediments in a typical water network area in China as the research object, analyzed the temporal variation characteristics and the factors that may affect carbon burial, revealed the relative changes and the driving mechanism associated with OC burial in the sediments, provided data about OC accumulation effects on the carbon cycle, and theoretical information for further environmental protection for the Poyang basin.

2. Materials and Methods

2.1. Natural Resources in the Study Area

The study area (115°49′–116°46′ E, 28°11′–29°51′ N) is located on the south bank of the middle reaches of the Yangtze River, where the river network is interlaced. Among them, five major inflow rivers, i.e., Gan River, Fu River, Xin River, Rao River, and Xiu River originated in Jiangxi Province and converge on the Poyang Lake area from the east, south, and west directions. They then outflow into the Yangtze River from the estuary after basin regulation, thus forming a relatively complete Poyang Lake water system [16]. The water level in the basin is greatly affected by seasonal change. In winter, the water level is low, with many shallow depressions and shoals, whereas in summer, the water level rises, and many islands, shoals, and dunes occur. The lake’s surface area varies with the rise and fall in the water level, but its maximum extent is 4125 km2 [17]. The Poyang basin has a subtropical humid monsoon climate, with an annual rainfall of about 1400 mm and an annual average evaporation of 1000 mm. Peak evaporation is mainly concentrated in summer, with an annual average temperature of about 17 °C, which is suitable for plant growth [11]. The Poyang area land use and land cover (LUCC) data for the relevant years are based on the national LUCC data reported by Yang et al. [18]. The forest land was dominant, followed by farmland. However, the construction land area has considerably increased over recent years. The southern part is bordered by mountains, the central part is mainly hilly, and the northern part is plain. The overall terrain of the basin shows a trend of low in the north and high in the south [19].
As one of the ‘double kidneys’ of the Yangtze River, the Poyang basin is the largest water-carrying, seasonal, and throughput lake in China [20]. It plays a vital role in flood control, water level regulation, ecological balance improvement, and water conservation in the middle reaches of the Yangtze River basin [21]. Therefore, the basin is a key target area for China’s ecological civilization construction programs. However, the rapid development of the social economy and the continuous advance of urbanization and industrialization led to a large increase in high-intensity human activities, which had a significant negative impact on the ecosystem and water environment of the Poyang basin. The widespread use of pesticides in agriculture, the indiscriminate discharge of industrial wastewater and domestic sewage, the reclamation of lakes for farmland, the indiscriminate logging of forests, the increase in the number of cars, the poor energy structure, frequent agricultural activities, and the low agricultural mechanization levels have all led to serious consequences, such as soil and water imbalances, desertification of the land, degradation of wetland functions, and the frequent occurrence of mudslides in the basin. These effects threaten the safety of the ecological environment, human health, and the sustainable development of resources in the Poyang basin [14].
During the flood season, the water level rises and beaches along the lake are submerged. In the dry season, the water level drops, depressions and mudflats are exposed, and plants and aquatic organisms grow rapidly, forming a good ecological environment system. This makes the area the preferred overwintering habitat for migratory birds. In addition, many other rare birds also choose the Poyang basin as their foothold because of the vast grassland exposed in the dry season. In the wet and dry seasons, various elements of the ecosystem in the basin change accordingly, and their interactions form a dynamic balance that maintains an ideal and stable ecosystem [22].

2.2. Cultural Conditions in the Area

The Poyang basin is a large territory that spans several prefecture-level cities and it intersects with many important districts and counties. The urban agglomeration around the water body is the fastest urbanizing and most economically developed area in the province of Jiangxi. The economic industries are mainly agriculture, forestry, and fishery. According to the 2020 Statistical Yearbook data for the province of Jiangxi [23], the total population around the Poyang area reached 379.53 million in 2019, of which the urban population accounted for 58.7%. However, the urbanization rate for the province of Jiangxi is slightly lower, at 57.42%. The employment rate for the urban agglomeration increased year by year.
The sampling sites in this study are located in Jiujiang City, where the urbanization rate is steadily advancing in recent years according to the Statistical Yearbook data for Jiujiang City (Table 1, a number of the indicators have been omitted). Increasing numbers of rural people have been migrating to cities, but the population of Jiujiang City was still dominated by rural people.

2.3. Sample Collection and Pretreatment

A severe drought occurred in the Yangtze River basin in the spring of 2019. The research was carried out along the Xiu River section of the Poyang basin, and basic information about regional hydrology, coastal zones, phytoplankton growth, etc., was collected. The results of a field survey showed that human disturbance near the estuary along Xiu River on the western side of Poyang Lake was weak and that the sedimentary environment was stable. Therefore, this area was used to record evolutionary changes to the ecological environment of the basin over the past century (Figure 1). Sedimentation column gravity coring equipment with an outer diameter of 9 cm and a wall thickness of 0.4 cm was used to collect the sediment core samples. After sampling, the sediment cores were placed vertically and transported to the laboratory for storage in a −40 °C freezer.
One sediment core was selected for analysis based on a pre-experimental comparison of the sedimentary sequence, the sampling site environment, the geographical location of the sampling points, the degree of human influence, research duration, and basic physical and chemical indicators. It was a 56 cm long sediment core from the southern bank of the Xiu River area. Layered samples were taken from the core with a thickness of 1 cm and freeze-dried (−50 °C, 10 Pa) for backup use.

2.4. Determination of 210Pb, 226Ra, TN, TOC and OCAR

A germanium detector (GWL-120-15, ORTEC, Atlanta, GA, USA) was used to determine the 210Pb and 226Ra activities. The sediment samples were sealed in 1 cm diameter plastic tubes and stored in the dark for a month to reach radioactive equilibrium. The constant rate of supply dating model was used to obtain the sedimentation rate and chronology [24] and the difference between 210Pb and 226Ra was the 210Pbex value.
A TOC instrument (SSM-500A, Shimadzu, Kyoto, Japan) was used to determine the total organic carbon (TOC) content. The 0.2 ± 0.0001 g sample was freeze-dried, ground, weighed, and placed in a sample boat. The difference between the two values of TC and IC is the TOC content [15]. Each subsample measurement was replicated three times, and the relative standard deviation of the measurement results was <5%.
An ultraviolet spectrophotometer (UV-3600 Plus, Shimadzu, Japan) was used to measure the TN content after a 2 ± 0.001 g of the sample was added to a 5 mL mixture of 0.1 mol L−1 K2S3O8 and NaOH.
The OC accumulation rate (OCAR) in the sediments was calculated from the sediment accumulation rate (SAR) for each layer of the sediment core and its TOC content [25]. The calculation formula is as follows:
O C A R = S A R × T O C S A R = M d t
where the units of SAR and OCAR are g cm−2 a−1 and mg cm−2 a−1, respectively; TOC is the total organic carbon content (mg g−1); Md represents the mass depth difference of the sediment samples (g cm−2); ∂t is the difference in sedimentation time.

3. Results and Discussion

3.1. Characteristics of SAR, C, and N Burial

The results show that the sedimentation rate ranged from 0.03–3.71 g cm2 a−1. The age of sediment cores in the study area ranged from 1885 to 2019, with an age span of 134 years.
The OCAR variation trend in the sediments over time ranged from 0.16–72.8 mg cm−2 a−1 with an average value of 23.3 mg cm−2 a−1 (Figure 2). Its burial characteristics in the sediment showed a rising trend and finally fell at the surface. Before 1996, OCAR had continuously increased from 0.16 mg cm−2 a−1 in 1885 to a maximum of 72.8 mg cm−2 a−1 in 1996. During this period, the OCAR increase was slower before 1983 and significantly accelerated after 1983. From 1996 to 2005, the OCAR rapidly decreased, followed by a rapid increase until 2017. Finally, it showed a downward trend near the surface.
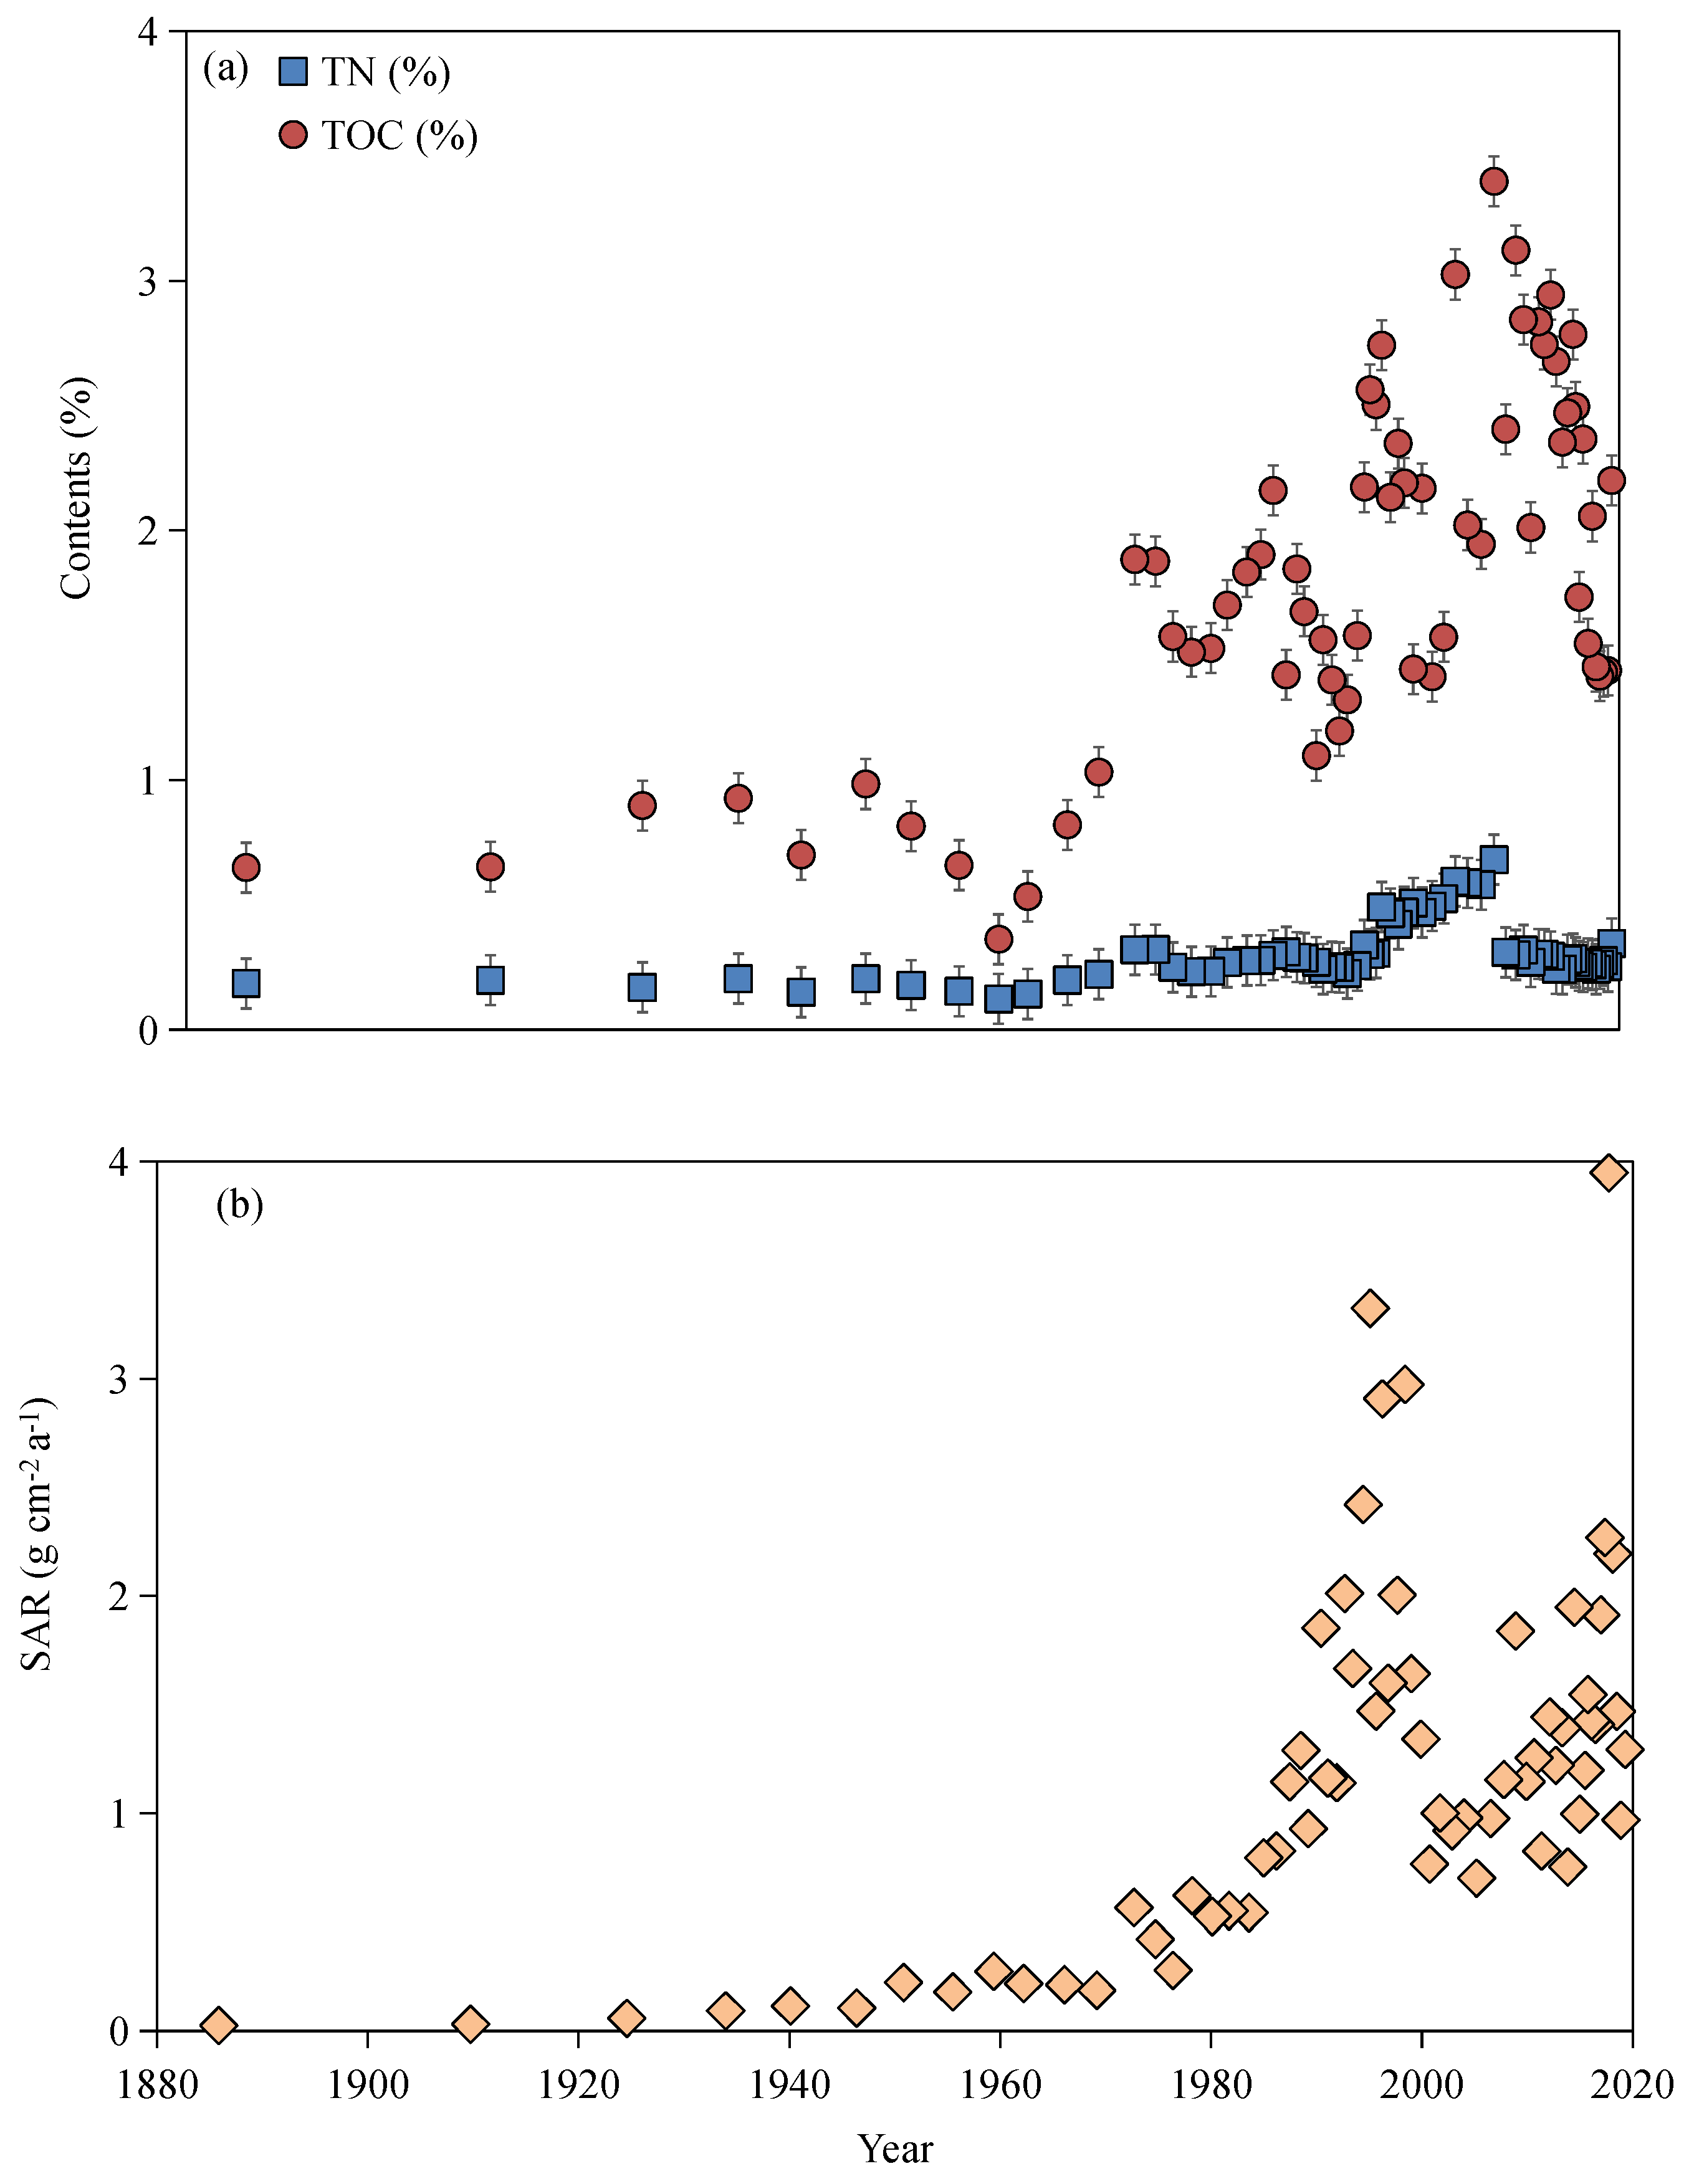
The chronological TOC, TN, and SAR variations in the sediments are shown in Figure 3. The concentration ranges of TOC and TN in sediments were 0.36–3.4% and 0.12–0.68%, respectively. The results show that although the overall TOC concentration in the sediment was higher than that of TN, their concentration change trends over time were relatively similar (Figure 3a). The variation range of SAR in sediment was 0.03–3.95 g cm−2 a−1 (Figure 3b).
Before 1996, the TOC and TN concentrations in sediments were not high and showed a slight increase until 1991. This was then followed by a sharp increase. The changing trend for TOC and TN in sediments was consistent with that of SAR, indicating that the TOC and TN concentration changes were closely related to the lake inputs. During this period, the human activity levels were relatively low; thus, the impacts on the TOC and TN in sediment were relatively small. The stable input of terrestrial organic matter carried by sediment was high. Therefore, the TOC and TN growth rates in sediments were slow during this period, but the OCAR gradually increased and began to rise sharply around 1991, finally reaching a peak around 1996.
From 1996 to 2007, the TOC and TN concentration increases in the sediments intensified and reached their maximum value in 2007. The change trends in TOC and TN concentrations during this period were no longer consistent with SAR, indicating that during 1996–2007, the input impact on TOC and TN in the sediments decreased, whereas the one due to the intensity of human activities increased. The organic matter input from external sources increased, resulting in a greater contribution to the TOC and TN concentrations. A large number of exogenous nutrients also promoted the growth of algae and plankton in the water body, which enhanced primary productivity and endogenous organic matter levels. The OCAR was, therefore, affected and the 1996 to 2007 stage showed a trend of first decreasing and then increasing.
From 2007 to 2019, the TOC and TN concentrations in sediments showed a decreasing trend. This stage was mainly influenced by human activities, and the sampling points were located in township areas. The increase in urbanization level meant that the population proportion in township areas decreased and more rural people moved to work or live in cities. According to the Statistical Yearbook for Jiujiang City, the urbanization rate increased from 27.32% in 2010 to 38.82% in 2019. The decrease in the rural population directly reduced the intensity and frequency of human activities in the basin which lead to a decrease in TOC and TN inputs from external sources into the sediments. In addition, the reduction on industrial wastewater discharge and fertilizer application may also have contributed to the decrease in TOC and TN concentrations in the sediments from the study area. The total discharge of industrial wastewater and application of fertilizers decreased to 88.12 and 0.32 million tons in 2019, respectively. At this stage, OCAR was driven by human activities, reflecting a certain degree of fluctuation and a significant downward trend near the surface.

3.2. Mechanism Driving OCAR Change in Sediments

Before 1983, the slow OCAR in the sediments may be due to the low degree of damage to the vegetation and land surface. Therefore, the organic matter inputs into the sediment were mostly affected by the natural environment. Although the input amount was small, the input source was stable. At the same time, microorganisms in sediments also fully degraded the organic matter, and the easily degradable portion of organic matter was converted into CO2 and other gases, which were then released. The more difficult-to-degrade portion of organic matter was retained and stored in sediments [26], which was also another possible reason for the slower OCAR during this stage.
During the period 1983 to 1996, the OCAR sharply increased. During this period, the population in Jiujiang City increased from 3.5 million in 1980 to 4.27 million in 1995 (Statistical Yearbook of Jiujiang). Even though the urbanization rate continued to increase, the rural people still accounted for a majority of the total. Due to enhanced activities on the vegetation and surface in the study area, the soil erosion level was stimulated. The amount of endogenous and terrestrial organic matter entering the sediments, therefore, increased. In addition, the rapid development of local industry contributed to the increase in the OCAR. The large industrial wastewater discharge led to a rapid increase in nutrients, such as nitrogen and phosphorus in the water body, resulting in better growth and reproduction conditions for algae. The primary productivity of lakes increased, resulting in an increase in internal organic matter associated with the OCAR.

3.3. Influencing Factors and Their Identification

3.3.1. Time Variation in Temperature and Precipitation

Climate factors can be divided into temperature- and precipitation-related factors. The impact of temperature on OC burial in sediments was mainly due to it increasing the growth of plants in the basin and the primary productivity in the water bodies. These changes would affect the input and storage of OC [27]. When the temperature rises by a certain extent, plant growth in a basin becomes more abundant, leading to an increase in the primary productivity in the water body and a corresponding increase in the OC accumulation in sediments. In contrast, as the temperature decreases, the OC inputs from both internal and external sources decrease, and the OC accumulation in sediments falls. However, previous studies have shown that temperature was directly related to the mineralization of organic matter, which affected the OC burial rate. As temperature increases, the mineralization of organic matter increases, and the rate at which organic matter decomposes into CO2 and CH4 rises, resulting in a corresponding decrease in the OC burial [28,29]. The annual average temperature data for 2010–2018 from Wuning County Statistical Yearbook (Table 2) showed that the correlation between temperature and the OCAR data in the study area was not high and had a slight negative correlation (r = −0.22, p > 0.05). The OC decomposition increase caused by a rise in temperature was slightly higher than the OC increase caused by an increased temperature.

3.3.2. Changes in Land Use and Land Cover

Changes in LUCC can also affect the OCAR in sediments. The increase in arable land area represents an increase in agricultural activities. Furthermore, agricultural fertilizers are washed away by precipitation into the water bodies, leading to increases in primary productivity and the OCAR in sediments. The changes in LUCC caused by human destruction of vegetation and the land surface resulted in the intensification of soil erosion, particle inputs into the water bodies, and the OCAR in sediments [30].
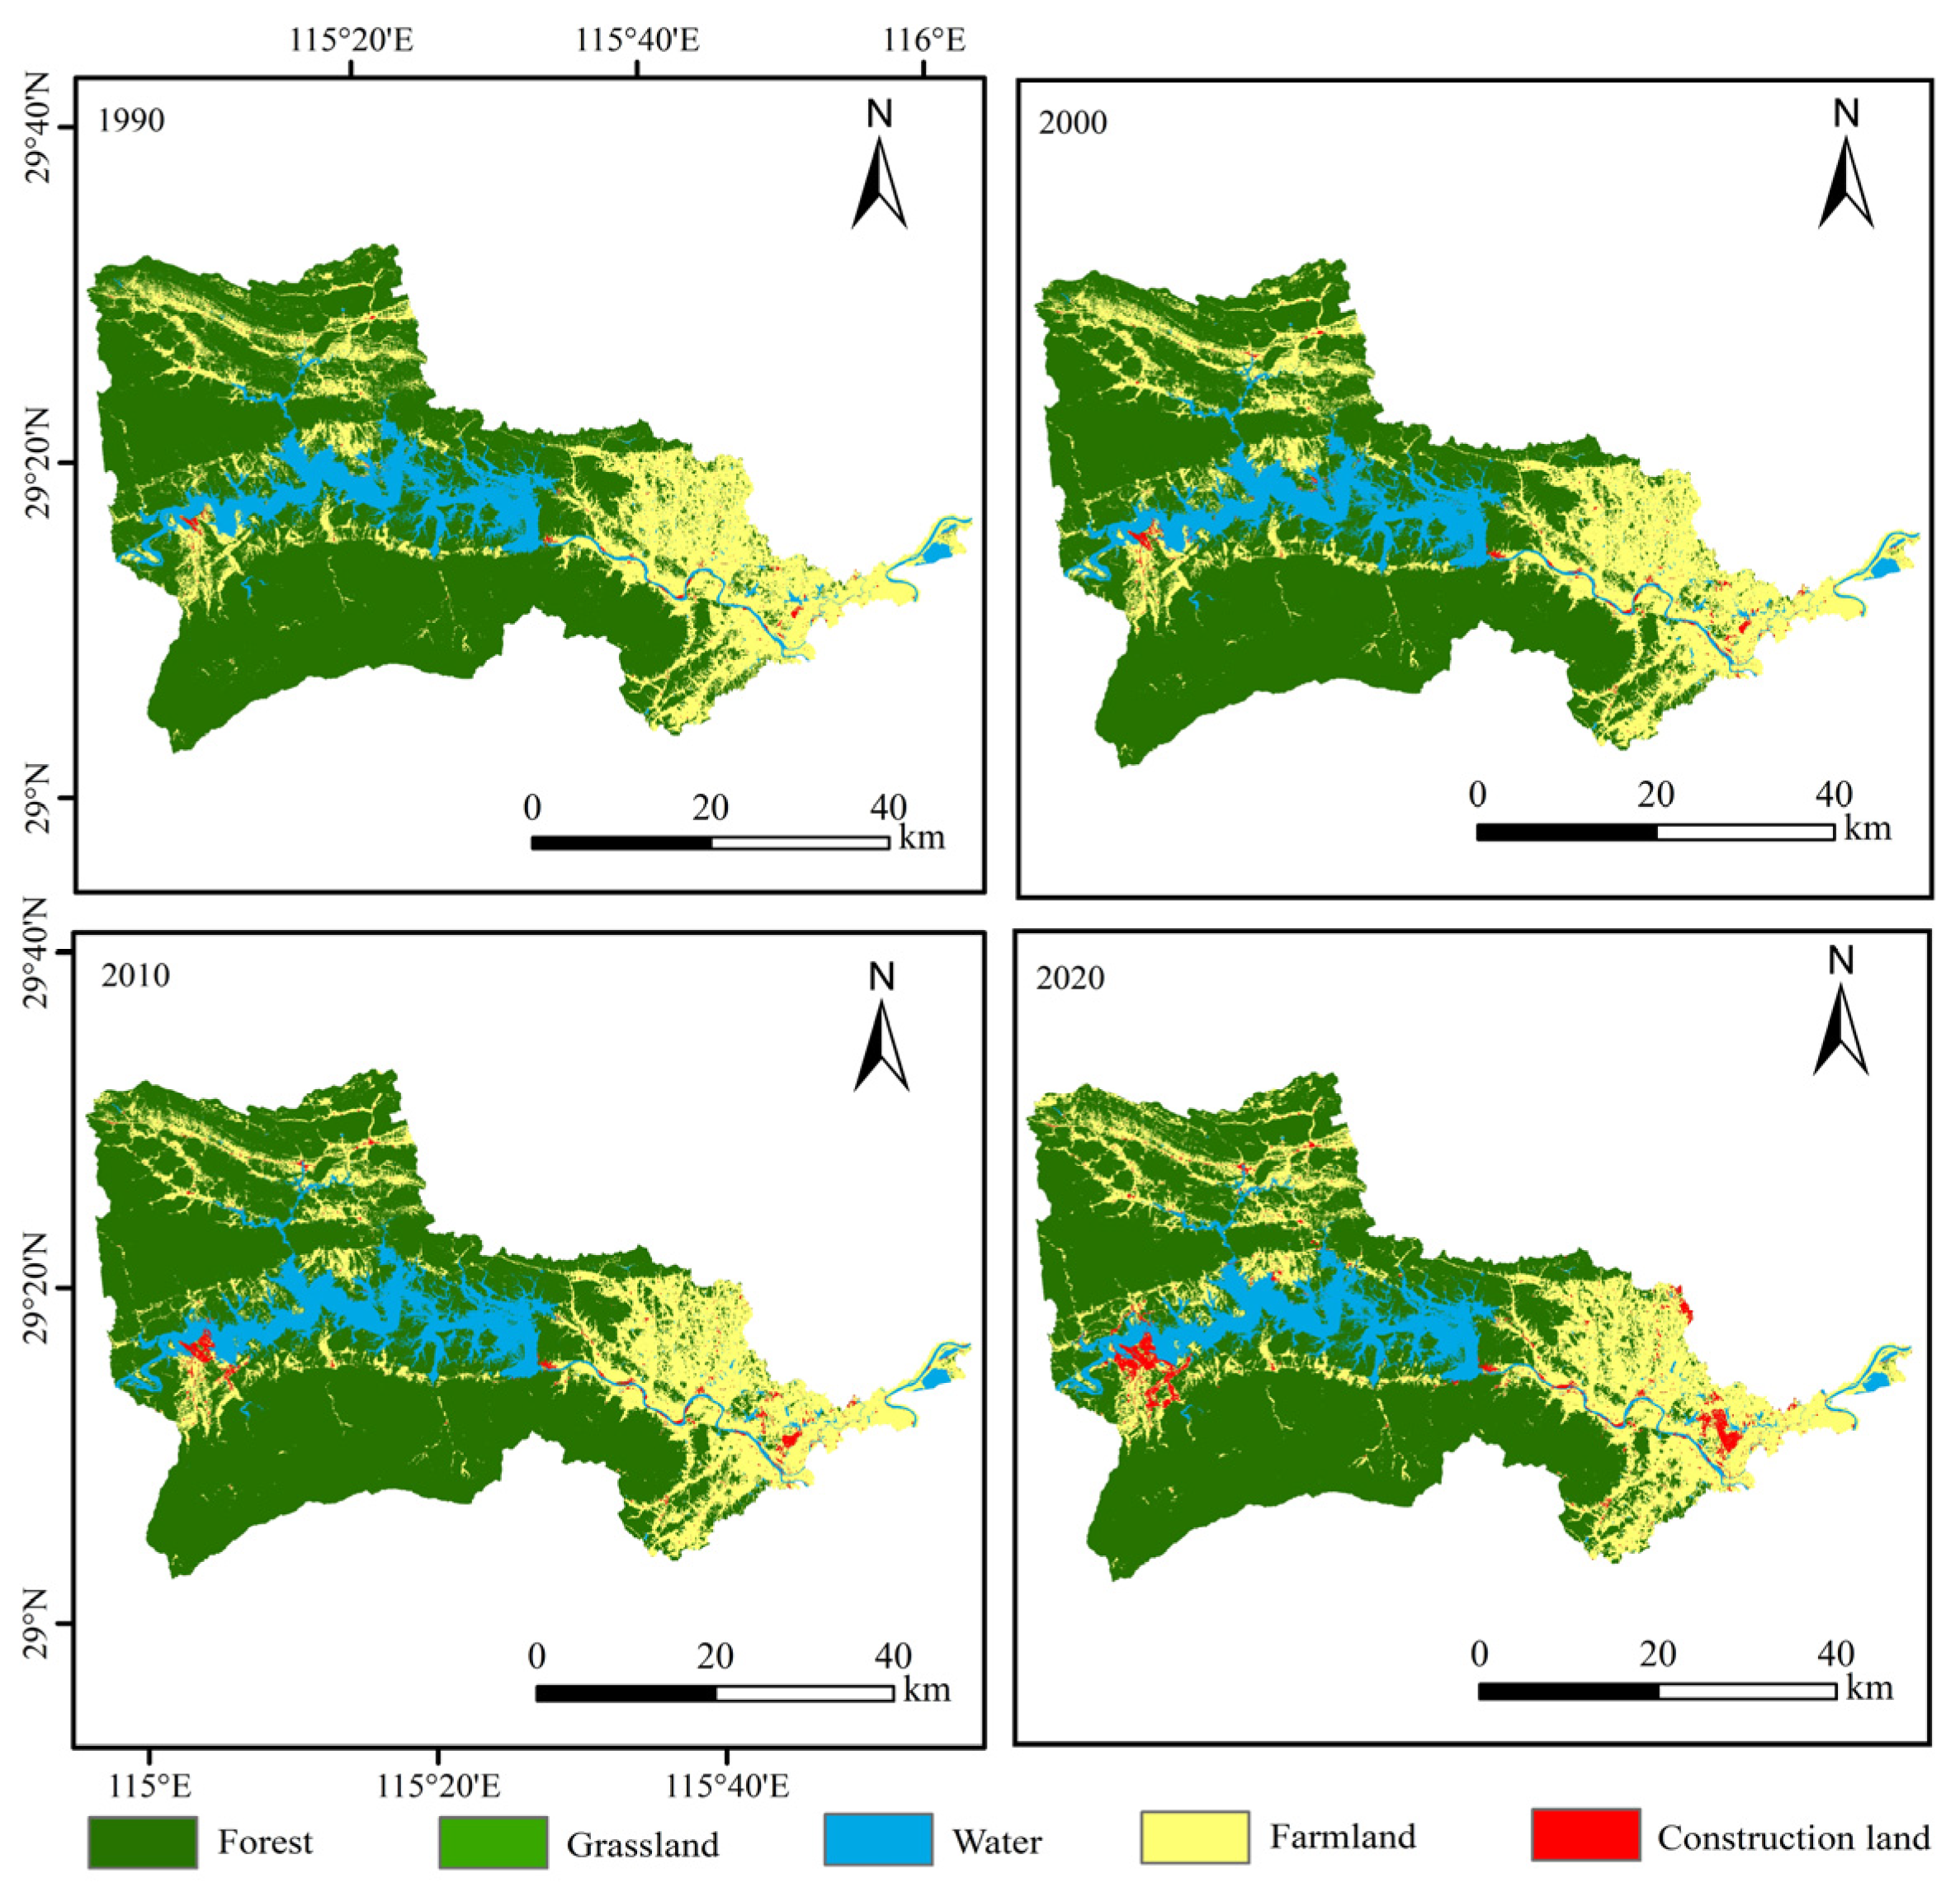
Here, the ArcGIS software was used to interpret the LUCC change in a small catchment of the study area from 1990 to 2020 (the original data are from [18]). Their relationship with the OCAR in the sediments of the study area and driving mechanism were explored. As shown in Figure 4, the area of farmland and water increased slightly, while the area of forest land and grassland decreased. The construction land area increased by 417.35%. Over the past three decades, forest land had been the main type of land used in the Poyang basin, followed by farmland (Table 3).
The results indicate a correlation between the OCAR in sediments and the land use types. A positive correlation between the forest area (r = 0.43, p < 0.05) and the construction land area (r = 0.5, p < 0.05) was found. The increase in forest land area led to an increase in terrestrial organic matter inputs into the water system, resulting in a corresponding increase in OCAR in sediments. The grassland area change had a small impact on the OC burial. The construction land area enlargement represented an increase in human activities. Various construction and human activities could cause a certain degree of damage to vegetation and the land surface, weaken the soil and water conservation ability of the surface, increase the number of particles entering the water body, and increase the OCAR in the sediments.

3.3.3. Socio and Economic Conditions

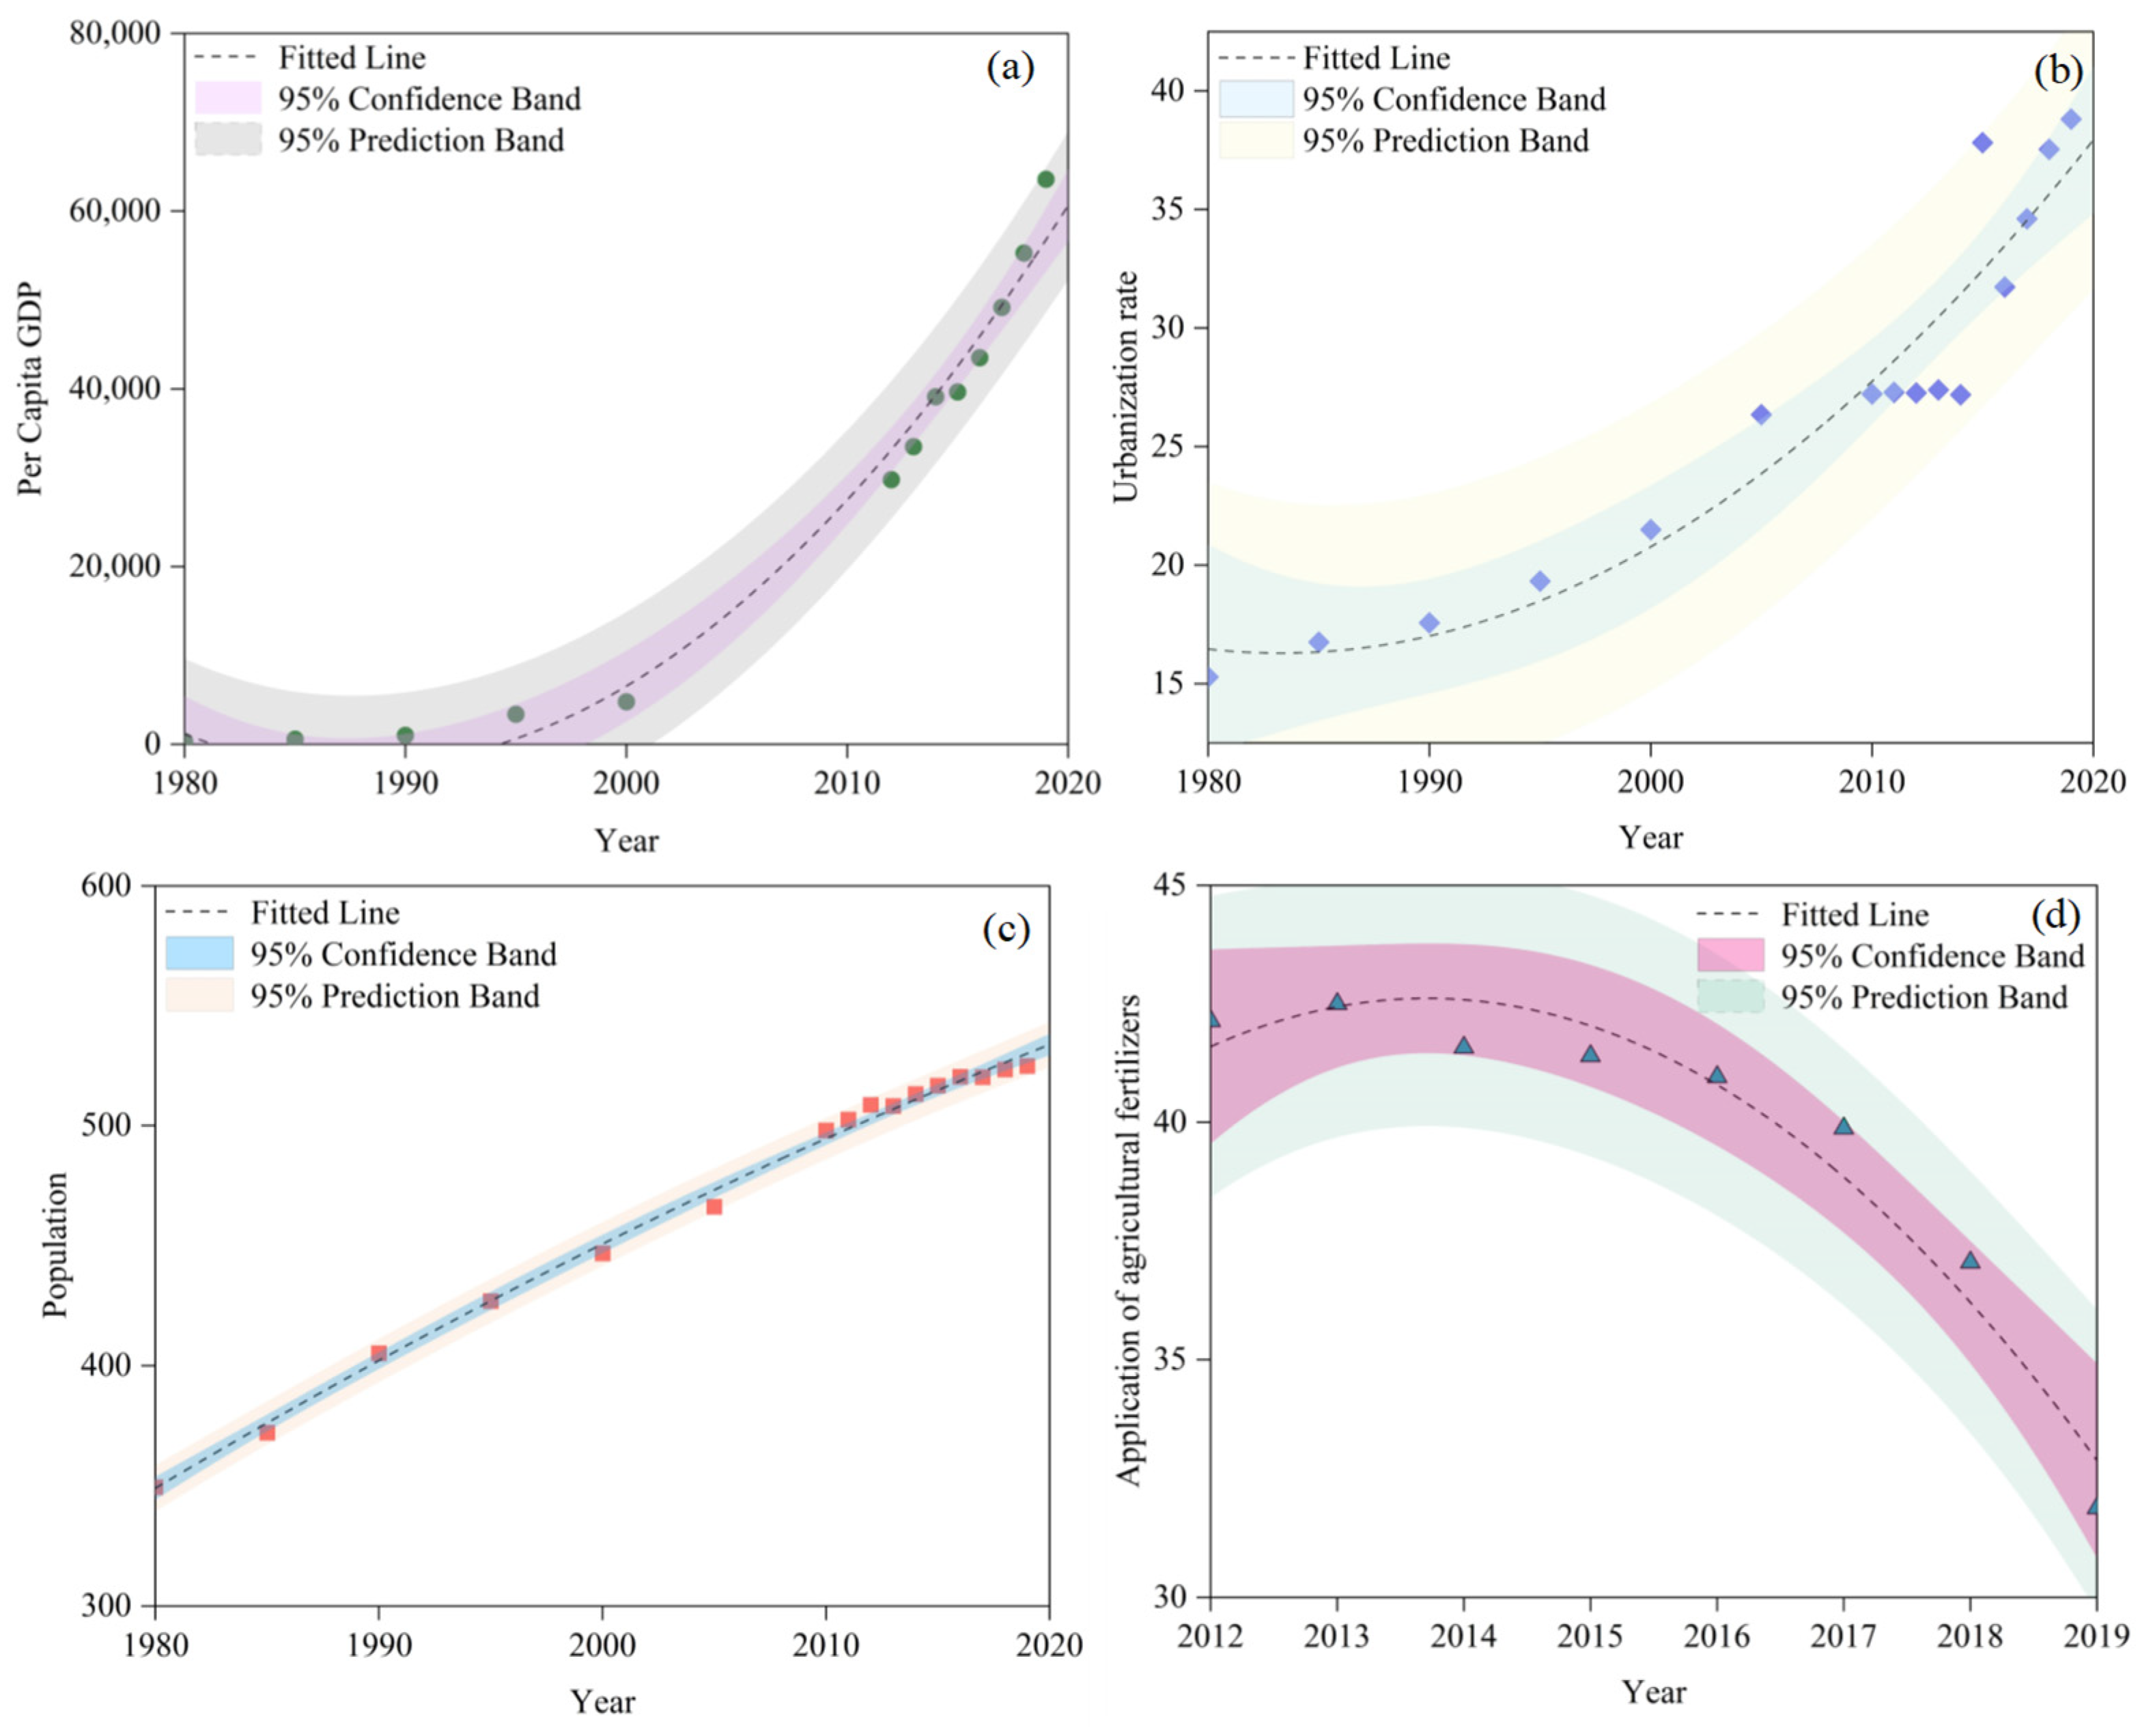
Socio and economic factors may have an indirect impact on the sediment OCAR. These factors include multiple aspects, such as population, urbanization rate, application of agricultural fertilizers, per capita GDP, etc. Huang et al. reported a significant positive correlation between the OCAR and fertilizer application in Dianchi Lake sediment [31]. A changing trend of some social and economic data from 1978 to 2019 is shown in Figure 5 based on the Statistical Yearbook data of Jiujiang City. The results showed that from 1978 to 2019, due to policy application, agricultural fertilizer usage has decreased since 2013, and the per capita GDP has developed, increasing to over CNY 60,000 in 2019 (Figure 5a). The urbanization rate increased more than twice (Figure 5b) and the population increased to 5.25 million (Figure 5c). The analysis showed that population, urbanization rate, application of agricultural fertilizers (Figure 5d), and per capita GDP all had strong positive correlations with the OCAR in the study area (r = 0.68, 0.46, 0.54, 0.59, p < 0.05), indicating that these socio and economic factors could indeed impact the OCAR in sediments in the study area. The acceleration of urbanization brought about a sharp increase in population, the rapid development of per capita GDP, the destruction of surface and vegetation by human activities, the decline in soil and water conservation capacity, the deepening of land pressure, the intensification of urban sewage discharge, an increase in organic matter input into the water bodies, an increase in eutrophication, and the accelerated growth of microorganisms and algae. All these factors contributed to a corresponding increase in sediment OCAR.
The OCAR for the sediments from the study area was analyzed by integrating multiple influencing factors. The results showed that among the 11 influencing factors, the temperature was not significantly correlated with the sediment OCAR, while the other 10 influencing factors were all correlated with the OCAR. The grassland area in the Poyang basin was small, and its impact on the sediment OCAR was limited, so it has not been included in the following discussion. Among the remaining 9 influencing factors, the urbanization rate had the highest correlation with the OCAR (r = 0.68), followed by farmland area, population, per capita GDP, and construction land area. The correlation between other influencing factors and the OCAR had an r ≤ 0.5, while the correlation between precipitation and OCAR was the lowest (r = 0.38). The correlation between urbanization rate, farmland area, population, per capita GDP, construction land area, and OCAR was the highest, while the correlation between precipitation and OCAR was the lowest. These results also indicated that human activities made a significant contribution to the OC burial in the sediments from the study area, whereas the contribution made by natural factors was relatively low. The water and farmland area correlations with the OCAR were negative, indicating that as the water and farmland area increased, the OC burial decreased. The changes in the water and farmland area largely depended on the changes in construction land area. They also reflected the strong impact of human activities on the OC burial in sediment across the study area.
To further explore the response and driving forces of human activities to changes in organic matter inputs in the sediment of the study area, the above 11 parameters (X1, OC; X2, temperature; X3, precipitation; X4, urbanization rate; X5, application of agricultural fertilizers; X6, per capita GDP; X7, population; X8, farmland area; X9, forest area; X10, water area; X11, construction land area) were selected for PCA and multiple linear regression analyses. The two cumulative variance contribution rates obtained accounted for a total of 97.52%. The PCA determined that K > 0.5 and p < 0.05 were suitable for PCA, and the results are shown in Table 4. Simultaneously extract two principal components F1 and F2 with feature roots greater than 1. For the PCA results, the larger the proportion of variance explained by the principal components, the more source information the principal component contains. The results showed a strong positive correlation between PC1 and OC, urbanization rate, per capita GDP, population, and construction land area, and a strong negative correlation with the application of agricultural fertilizers and forest area. The above results also confirmed that the changes in organic matter in the sediment of the study area were driven by human activities.

3.4. Organic Matter Origin Indicated by the C/N Ratios

The organic matter in sediments generally comes from endogenous and exogenous inputs [32]. The C/N ratio can be used to trace the sources in sediments. It is believed that when the C/N value is greater than 15, then they mainly come from terrestrial higher plants. However, when the C/N value is less than 15, then the organic matter mainly derives from algae and other aquatic plants [33]. The high nitrogen content in aquatic phytoplankton meant that the C/N values for aquatic phytoplankton are between 4 and 10 [34,35]. In contrast, the nitrogen content in vascular plants is relatively low; thus, the organic matter derived from terrestrial plants expresses a C/N ratio above 15. Among them, the C/N ratio for C3 and C4 plants is generally in the range of 20–50 or higher [36].
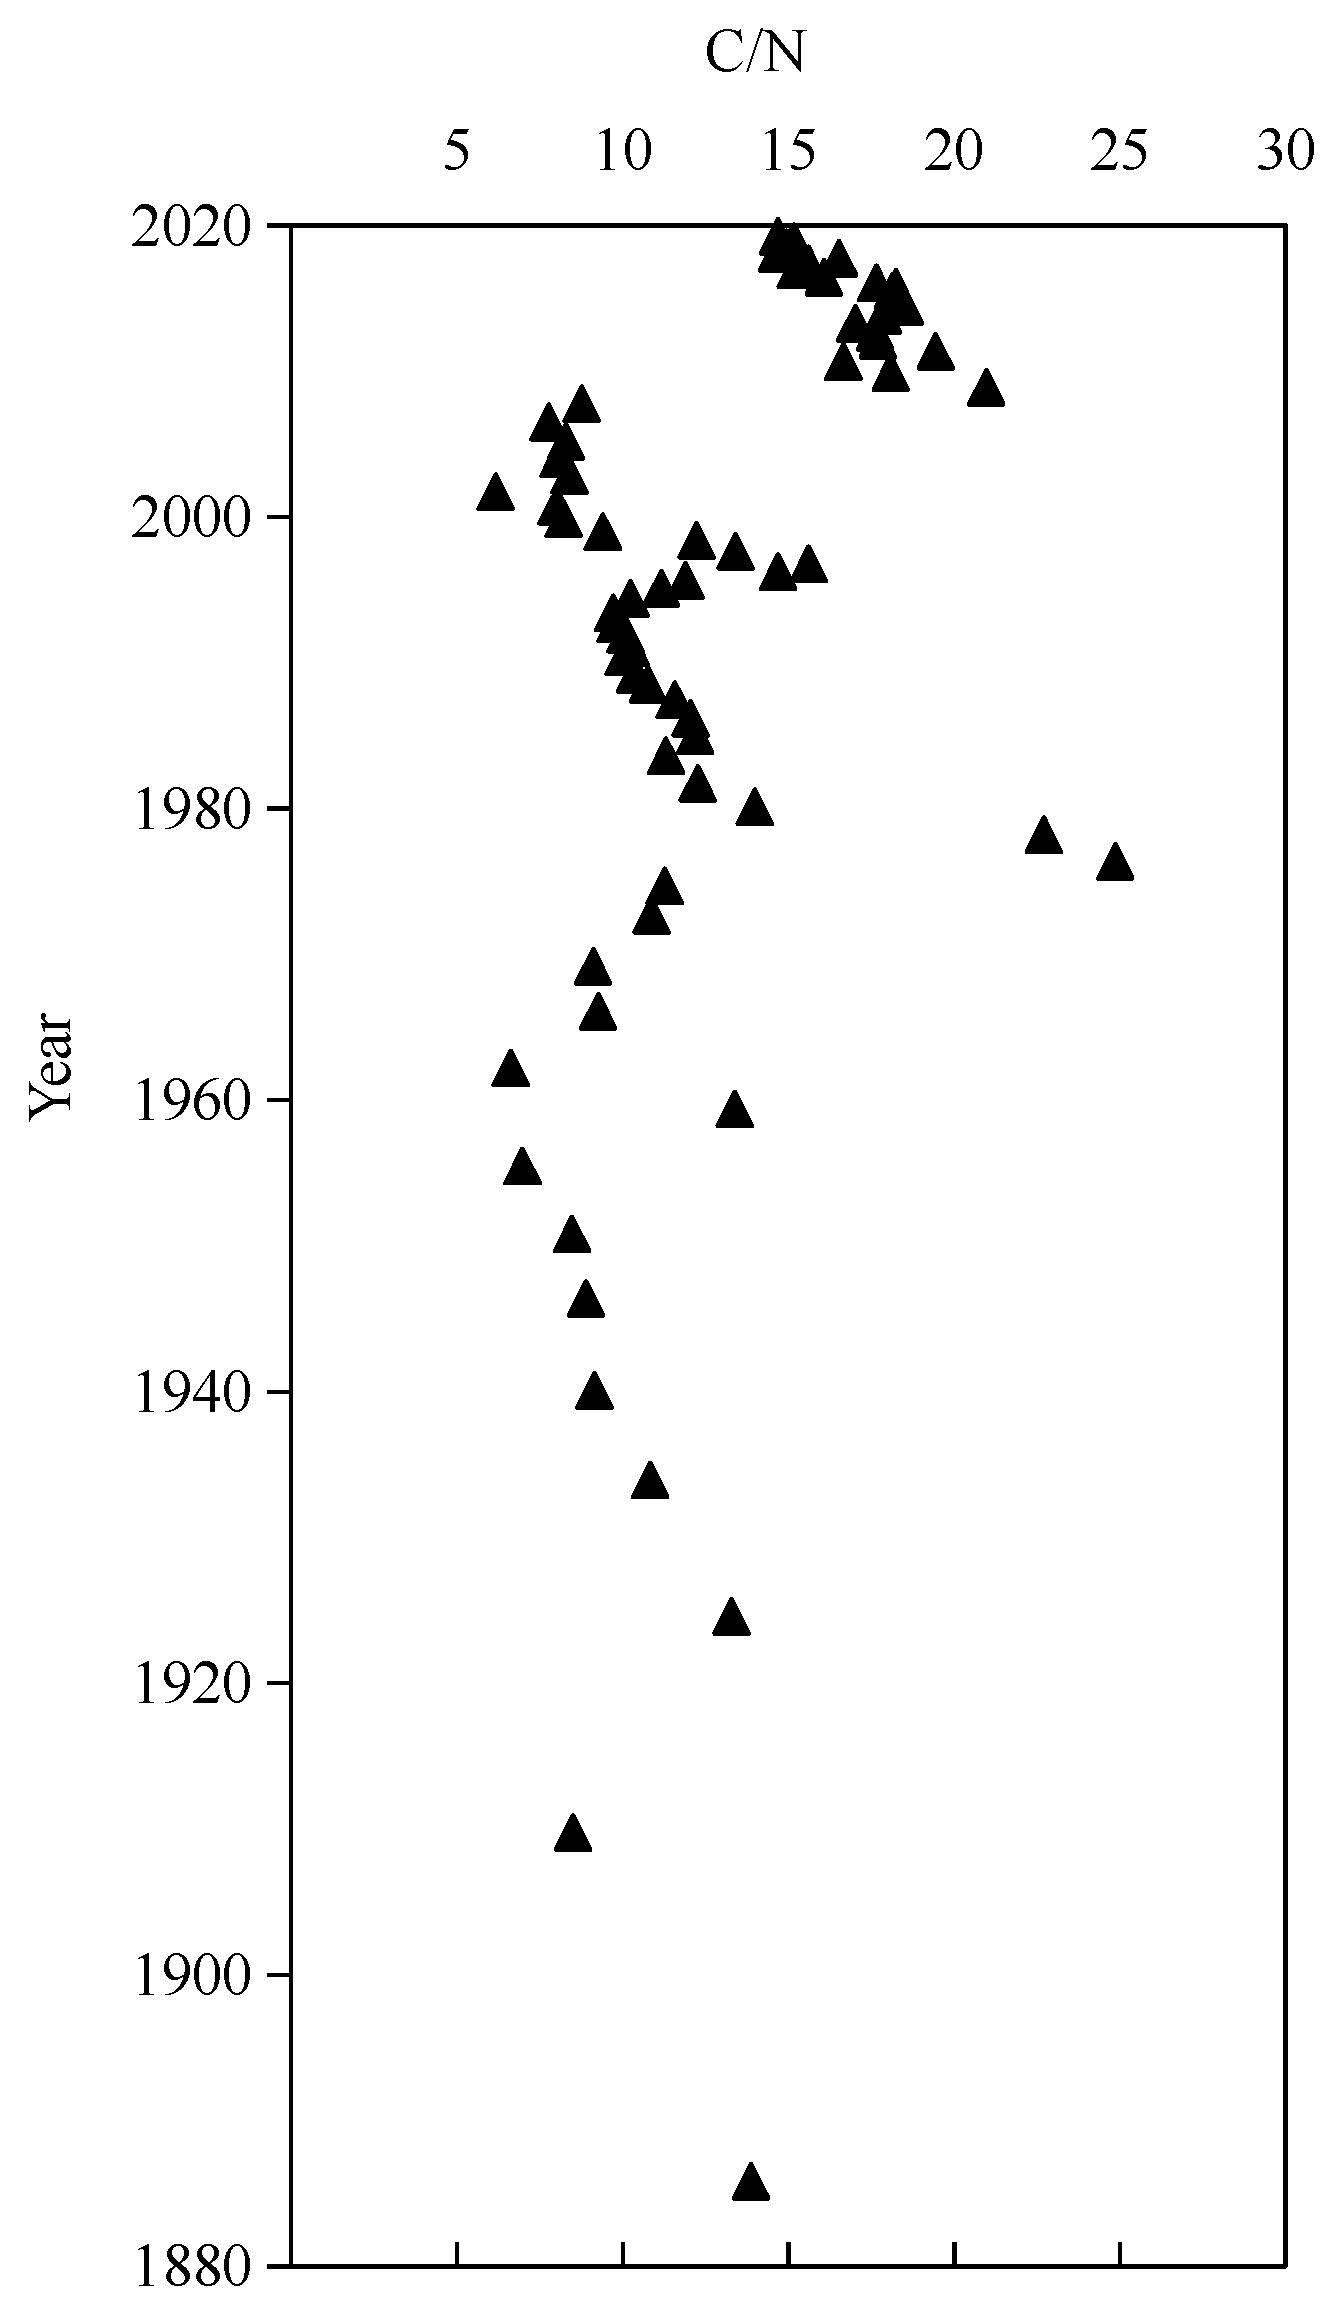
The results showed that the C/N ratios in the sediments from the study area ranged from 6.17 to 24.86 (Figure 6). The vertical variation trend could be roughly divided into the following stages. Starting from the bottom layer, the C/N ratio in the sediments first decreased and then increased, reaching a maximum value of 24.86. Then, it began to decrease until it reached its minimum value of 6.17 at the vertical core depth of −27 cm. It reached its peak at a depth of −20 cm and continued to fluctuate steadily until the surface layer. There was a slight downward trend near the surface layer.
The C/N ratios in the sediments fluctuated around 15, but the values greater than 15 were mainly concentrated up to −21 cm depth (representing 2007), and the value less than 15 were mainly concentrated in the bottom layer to −22 cm depth. This suggests that the sediment organic matter was dominated by terrestrial higher plants and emergent plants after 2007, whereas it was mainly from algae and other aquatic plants before 2007.

4. Conclusions

In this study, a sedimentary sequence for the typical water network area of the Poyang basin was established by combining the burial characteristics for carbon, SAR, and other indicators with the year data for the region at a centennial scale. The changing trends and driving mechanisms associated with their influencing factors were explored. We found enhanced OCAR in the sediments from the typical river estuary area of Poyang Lake with the increases in the forest land area, urbanization rate, application of agricultural fertilizers, and so on. The results showed that changes in LUCC in the Poyang basin, i.e., the significant increase in construction land, the impact on the evolution of terrestrial vegetation and water and soil loss, changes in energy use caused by economic and social progress, and the ecotype of the aquatic system altered by water eutrophication, greatly influenced the OCAR in the sediment core and, thus, drove the OC burial in the Polyang area.

Author Contributions

Conceptualization, writing—original draft preparation, J.T. and M.Z.; methodology, H.W.; investigation and software, J.W., H.W. and Z.Z. project administration, Y.W. All authors have read and agreed to the published version of the manuscript.

Funding

This work was supported by the National Key Research and Development Program of China (2021YFC3201500) and the National Natural Science Foundation of China (41673107).

Data Availability Statement

All relevant data have been made available in the paper.

Conflicts of Interest

The authors declare no conflict of interest.

References

  1. Venugopalan, V.P.; Kumar, R.; Sekar, R.; Rajamohan, R.; Nair, K.V.K. Natural eutrophication in a shallow freshwater lake: Impact and possible restoration strategy. In Restoration and Management of Tropical Eutrophic Lakes; CRC Press: Boca Raton, FL, USA, 2005. [Google Scholar]
  2. Huang, C.; Zhang, L.; Li, Y.; Lin, C.; Huang, T. Carbon and nitrogen burial in a plateau lake during eutrophication and phytoplankton blooms. Sci. Total Environ. 2018, 616–617, 296–304. [Google Scholar] [CrossRef] [PubMed]
  3. Sobek, S.; Zurbrügg, R.; Ostrovsky, I. The burial efficiency of organic carbon in the sediments of Lake Kinneret. Aquat. Sci. 2011, 73, 335–364. [Google Scholar] [CrossRef] [Green Version]
  4. Cole, J.J.; Prairie, T.Y.; Caraco, F.N.; McDowell, H.W.; Tranvik, J. Plumbing the Global Carbon Cycle: Integrating Inland Waters into the Terrestrial Carbon Budget. Ecosystems 2007, 10, 171–184. [Google Scholar] [CrossRef] [Green Version]
  5. Lin, J.; Zhou, X.; Lu, X.; Xu, Y.; Wei, Z. Grain size distribution drives microbial communities vertically assemble in nascent lake sediment. Environ. Res. 2023, 227, 115828. [Google Scholar] [CrossRef] [PubMed]
  6. Wang, Y.; Yang, H.; Zhang, J.; Xu, M.; Wu, C. Biomarker and stable carbon isotopic signatures for 100–200 year sediment record in the Chaihe catchment in southwest China. Sci. Total Environ. 2015, 502, 266–275. [Google Scholar] [CrossRef]
  7. Hu, C.; Xu, H.; Shi, S.; Lan, J.; Zhou, K. Sedimentary organic matter molecular composition reveals the eutrophication of the past 500 years in Lake Daihai, Inner Mongolia. Environ. Res. 2023, 227, 115753. [Google Scholar] [CrossRef]
  8. Dean, E.W.; Gorham, E. Magnitude and significance of carbon burial in lakes, reservoirs, and peatlands. Geology 1998, 26, 783–786. [Google Scholar] [CrossRef]
  9. Ding, Y.; Wang, S.; Zhang, W.; Feng, M.; Yu, R. A rule of hydrological regulating on nutritional status of Poyang Lake, since the operation of the Three Gorges Dam. Ecol. Indic. 2019, 104, 535–542. [Google Scholar] [CrossRef]
  10. Evgeniya, S.; Evgeniya, S.; Dong, Y.; Vladimir, I.; Li, J. Arsenic in groundwater of the Poyang Lake area (China): Aqueous species and health risk assessment. Environ. Geochem. Health 2022, 45, 2917–2933. [Google Scholar] [CrossRef]
  11. Xu, X.; Tan, Z.; Li, Y.; Li, Y.; Wang, X. Effects of water-table depth and soil moisture on plant biomass, diversity, and distribution at a seasonally flooded wetland of Poyang Lake, China. Chin. Geogr. Sci. 2015, 25, 739–756. [Google Scholar] [CrossRef]
  12. Liu, H.; Zhang, Q.; Niu, Y. A Dataset of Water Environment Survey in the Poyang Lake from 2013 to 2018. Available online: http://www.sciencedb.cn/dataSet/handle/876 (accessed on 9 May 2023).
  13. Chen, Y.; Zhao, Z.; Wang, Y.; Zhu, W.; Wu, H. Effects of organic carbon burial on biomarker component changes in contamination in northeast Dianchi watershed. J. Hazard. Mater. 2023, 445, 130474. [Google Scholar] [CrossRef]
  14. Tian, J.; He, X.; Wu, H.; Chen, Y.; Yu, K. Driving forces underlying changes in carbon molecular component deposition in a river-lake ecotone. Ecol. Indic. 2023, 147, 109976. [Google Scholar] [CrossRef]
  15. Wang, Y.; Huang, Y.; Tian, J.; Li, C.; Yu, K. A sediment record of terrestrial organic matter inputs to Dongting Lake and its environmental significance from 1855 to 2019. Ecol. Indic. 2021, 130, 108090. [Google Scholar] [CrossRef]
  16. Sun, C.; Zhen, L.; Wang, C.; Yan, B.; Cao, X. Impacts of ecological restoration and human activities on habitat of overwintering migratory birds in the wetland of Poyang Lake, Jiangxi Province, China. J. Mt. Sci. 2015, 12, 1302–1314. [Google Scholar] [CrossRef]
  17. Wu, D.; Shao, Q.; Li, J. Effects of afforestation on carbon storage in Boyang Lake Basin, China. Chin. Geogr. Sci. 2013, 23, 647–654. [Google Scholar] [CrossRef] [Green Version]
  18. Yang, J.; Huang, X. The 30 m annual land cover dataset and its dynamics in China from 1990 to 2019. Earth Syst. Sci. Data 2021, 13, 3907–3925. [Google Scholar] [CrossRef]
  19. Zhang, Q.; Ye, H.; Ding, Y.; Cao, Q.; Zhang, Y. Carbon storage dynamics of subtropical forests estimated with multi-period forest inventories at a regional scale: The case of Jiangxi forests. J. For. Res. 2020, 31, 1247–1254. [Google Scholar] [CrossRef]
  20. Qin, H.; Cao, X.; Cui, L.; LV, Q.; Chen, T. The Influence of Human Interference on Zooplankton and Fungal Diversity in Poyang Lake Watershed in China. Diversity 2020, 12, 296. [Google Scholar] [CrossRef]
  21. Zhao, G.; Li, Y. Effects of a Proposed Hydraulic Project on the Hydrodynamics in the Poyang Lake Floodplain System, China. Int. J. Environ. Res. Public Heath 2021, 18, 8072. [Google Scholar] [CrossRef]
  22. Debela, T.M.; Wu, Q.; Chen, L.; Sun, X.; Xu, Z. Composition and Diversity of Over-Wintering Aquatic Bird Community on Poyang Lake, China. Diversity 2020, 12, 308. [Google Scholar] [CrossRef]
  23. Xu, Y. Jiangxi Statistical Yearbook; China Statistical Publishing House: Beijing, China, 2020; pp. 4–5. [Google Scholar]
  24. Appleby, P.G.; Oldfieldz, F. The assessment of 210Pb data from sites with varying sediment accumulation rates. Hydrobiologia 1983, 103, 29–35. [Google Scholar] [CrossRef]
  25. Huang, C.; Chen, Z.; Gao, Y.; Luo, Y.; Huang, T. Enhanced mineralization of sedimentary organic carbon induced by excess carbon from phytoplankton in a eutrophic plateau lake. J. Soil. Sediment. 2019, 19, 2613–2623. [Google Scholar] [CrossRef]
  26. Gudasz, C.; Sobek, S.; Bastviken, D.; Koehler, B.; Tranvik, L.J. Temperature sensitivity of organic carbon mineralization in contrasting lake sediments. J. Geophys. Res. Biogeosci. 2015, 120, 1215–1225. [Google Scholar] [CrossRef] [Green Version]
  27. Heathcote, A.J.; Downing, J.A. Impacts of Eutrophication on Carbon Burial in Freshwater Lakes in an Intensively Agricultural Landscape. Ecosystems 2012, 15, 60–70. [Google Scholar] [CrossRef]
  28. Gudasz, C.; Bastviken, D.; Steger, K.; Premke, K.; Sobek, S. Temperature-controlled organic carbon mineralization in lake sediments. Nature 2010, 466, 478–481. [Google Scholar] [CrossRef] [Green Version]
  29. Ferland, M.E.; Giorgio, P.A.; Teodoru, C.R.; Prairie, Y.T. Long-term C accumulation and total C stocks in boreal lakes in northern Québec. Glob. Biogeochem. Cycles 2012, 26, 1–10. [Google Scholar] [CrossRef] [Green Version]
  30. Kortelainen, P.; Pajunen, H.; Rantakari, M.; Saarnisto, M. A large carbon pool and small sink in boreal Holocene lake sediments. Glob. Chang. Biol. 2004, 10, 1648–1653. [Google Scholar] [CrossRef]
  31. Huang, C.; Yao, L.; Zhang, Y.; Huang, T.; Zhang, M. Spatial and temporal variation in autochthonous and allochthonous contributors to increased organic carbon and nitrogen burial in a plateau lake. Sci. Total Environ. 2017, 390, 603–604. [Google Scholar] [CrossRef] [PubMed]
  32. Meyers, P.A. Organic geochemical proxies of paleoceanographic, paleolimnologic, and paleoclimatic processes. Org. Geochem. 1997, 27, 213–250. [Google Scholar] [CrossRef]
  33. Meyers, P.A. Preservation of elemental and isotopic source identification of sedimentary organic matter. Chem. Geol. 1994, 114, 289–302. [Google Scholar] [CrossRef] [Green Version]
  34. Redfield, A.C.; Ketchum, B.H.; Richards, F.A. The influence of organisms on the composition of sea-water. Sea 1963, 2, 26–77. [Google Scholar]
  35. LaZerte, B.D. Stable carbon isotope ratios: Implications for the source of sediment carbon and for phytoplankton carbon assimilation in Lake Memphremagog, Quebec. Can. J. Fish. Aquat. Sci. 1983, 40, 1658–1666. [Google Scholar] [CrossRef]
  36. Hedges, J.I.; Clark, W.A.; Quay, P.D.; Richey, J.E.; Devol, A.H. Compositions and fluxes of particulate organic material in the Amazon River. Limnol. Oceanogr. 1986, 31, 717–738. [Google Scholar] [CrossRef] [Green Version]
Figure 1. Location of the sampling sites.
Water 15 02199 g001
Figure 2. The OCAR variation chart with age.
Water 15 02199 g002
Figure 3. The TOC, TN, and SAR variation with age. (a) represents the nitrogen and carbon content time change; (b) is the deposition accumulation rate variation during the study period.
Water 15 02199 g003
Figure 4. The LUCC changes in the small catchment from 1990 to 2020.
Water 15 02199 g004
Figure 5. Changing trends of socio and economic data over the years. (a) Per capita GDP; (b) Urbanization rate; (c) Population; (d) Application of agricultural fertilizer.
Water 15 02199 g005
Figure 6. The C/N variation with depth.
Water 15 02199 g006
Table 1. Data from the Jiangxi Provincial Statistical Yearbook during 1980–2019.
YearPopulation/104 PeopleUrban Population/104 PeopleRural Population/104 PeopleUrbanization RateHouseholdsPer Capita GDP/CNY
1980349.5353.44296.0915.29%71.76330
1985372.2062.35309.8516.75%79.69561
1990405.2371.19334.0417.57%94.74989
1995426.9182.51344.4919.32%107.223372
2000446.8396.09350.7421.50%114.544771
2005466.20122.83343.3726.35%133.36/
2010497.91135.57362.3427.23%156.85/
2011502.43137.14365.2927.30%162.36/
2012508.61138.68369.9327.27%164.4729,785
2013508.09139.17368.9227.39%165.9133,500
2014513.13139.50373.6327.19%168.0139,097
2015516.59195.40321.1937.82%164.2539,645
2016520.36165.13355.2231.73%162.3243,502
2017520.14180.03340.1134.61%162.8449,157
2018523.39196.49326.8937.54%163.0755,274
2019524.86203.74321.1238.82%164.3763,584
Table 2. Wuning County Statistical Yearbook Data.
YearAverage Temperature in Wuning County/°CAverage Precipitation in Wuning County/mm
201717.201751.40
201617.90179.60
201517.601865.30
201417.601513.70
201318.101219.70
201216.701012.60
2011171012.60
2010171871.90
200917.301190.60
Table 3. Changes in LUCC in the Poyang basin from 1990 to 2020.
YearArea/km2
FarmlandForestGrasslandWater BodyConstruction Land
1990570.271640.580.19239.7410.37
2000592.011607.750.11242.6718.62
2010537.531646.650.19249.6227.16
2020594.531566.670.07246.2353.65
Table 4. The PCA loads for all data.
ParameterPrincipal Component (PC) for All Data
PC1PC2
OC0.96−0.23
Temperature−0.700.69
Precipitation0.13−0.99
Urbanization rate0.900.43
Application of agricultural fertilizers−0.99−0.14
Per capita GDP0.960.24
Population0.900.43
Farmland area0.35−0.92
Forest area−0.820.54
Water area0.530.79
Construction land area0.100.05
Charact. root7.013.72
Var. Contribut. Rate (%)63.7233.80
Cum. Var. Contribut. Rate (%)63.7297.52
Disclaimer/Publisher’s Note: The statements, opinions and data contained in all publications are solely those of the individual author(s) and contributor(s) and not of MDPI and/or the editor(s). MDPI and/or the editor(s) disclaim responsibility for any injury to people or property resulting from any ideas, methods, instructions or products referred to in the content.