Taguchi L9 (34) Orthogonal Array Design for Photocatalytic Degradation of Methylene Blue Dye by Green ZnO Particles Biosynthesized by Chrysanthemum spp. Flower Extract
Abstract
1. Introduction
2. Materials and Methods
2.1. Preparation of Chrysanthemum spp. Flower Extract
2.2. Preparation of ZnO Particles Using Chrysanthemum spp. Flower Extract
2.3. Characterization of Green ZnO Particles
2.4. Photocatalytic Activities of Green ZnO Particles
3. Results and Discussion
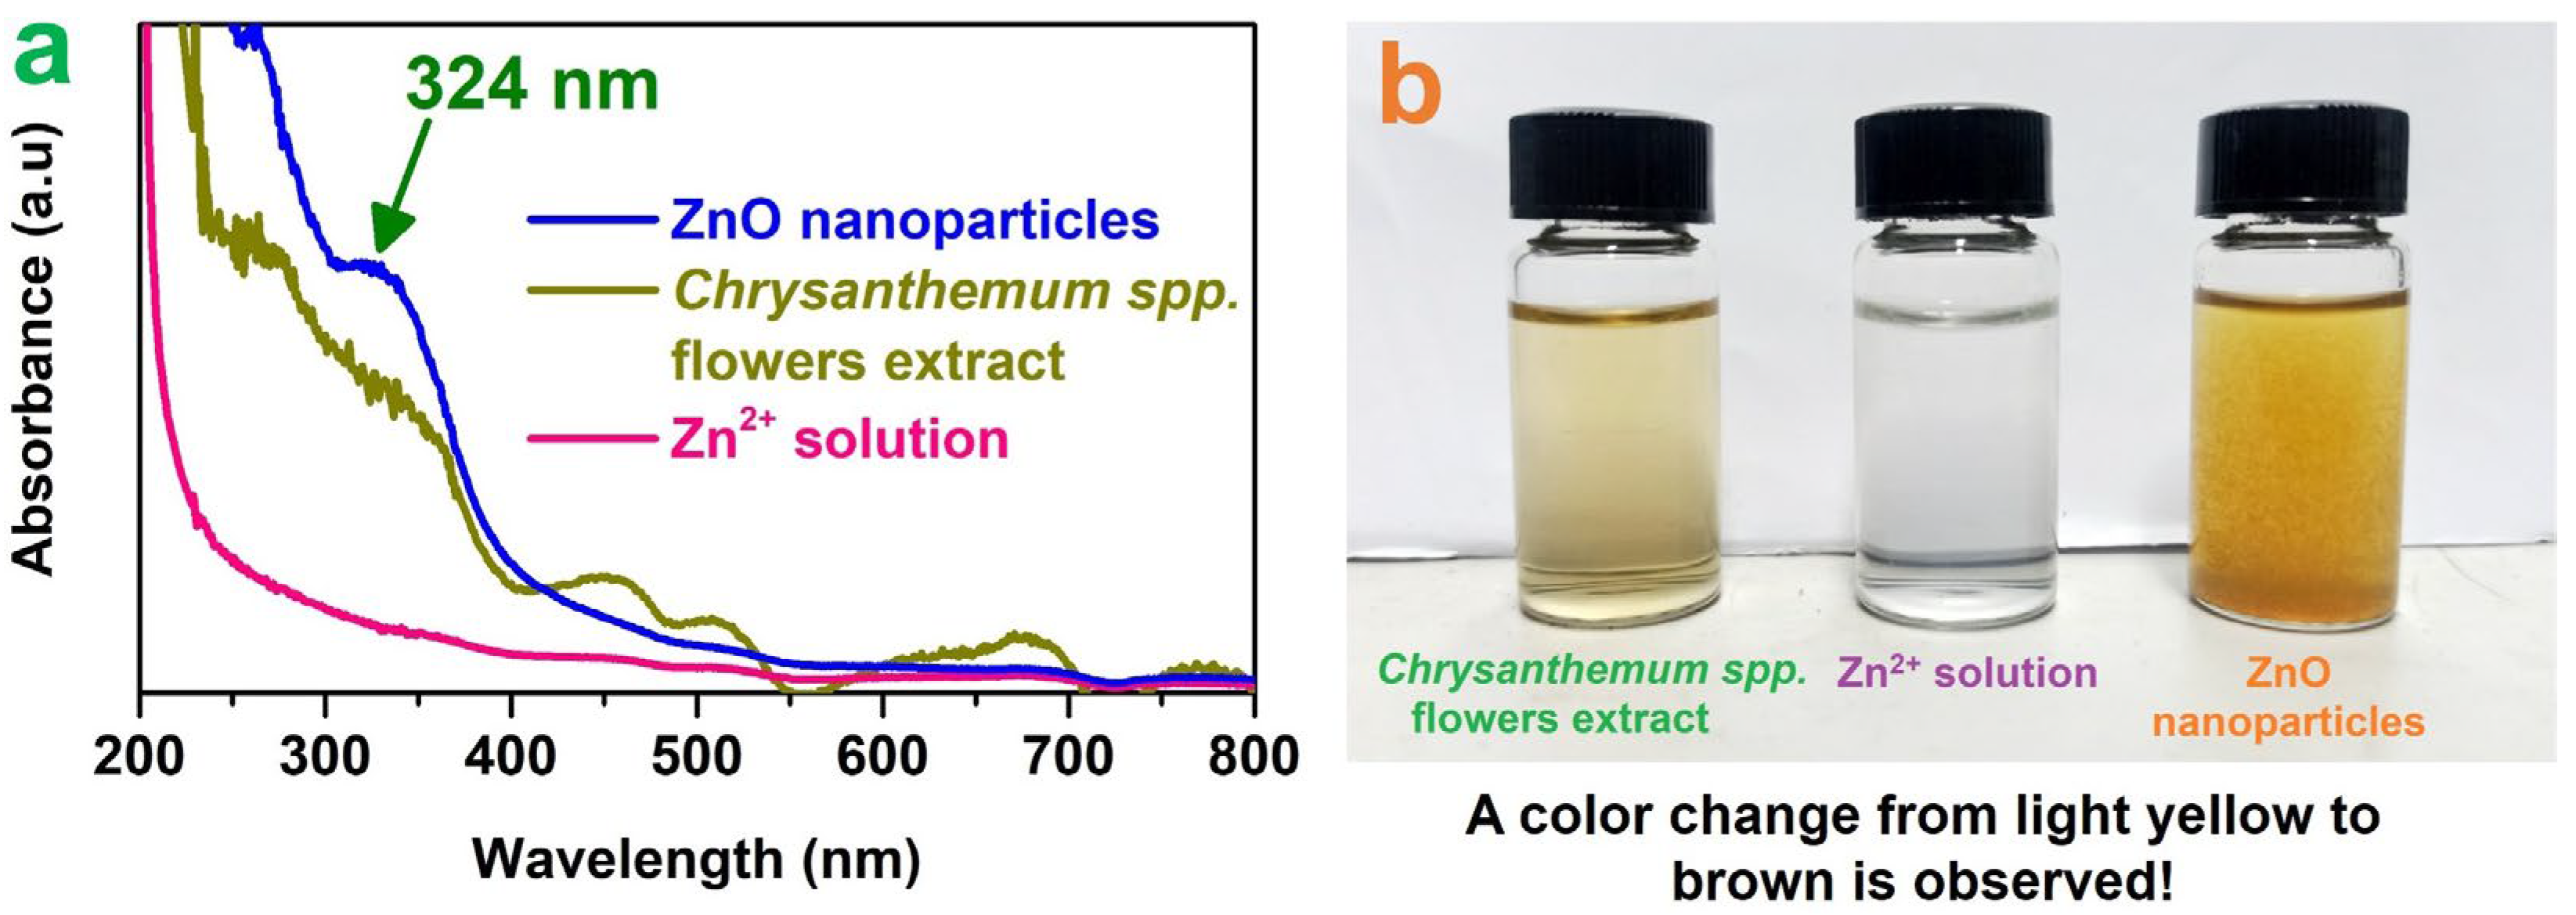
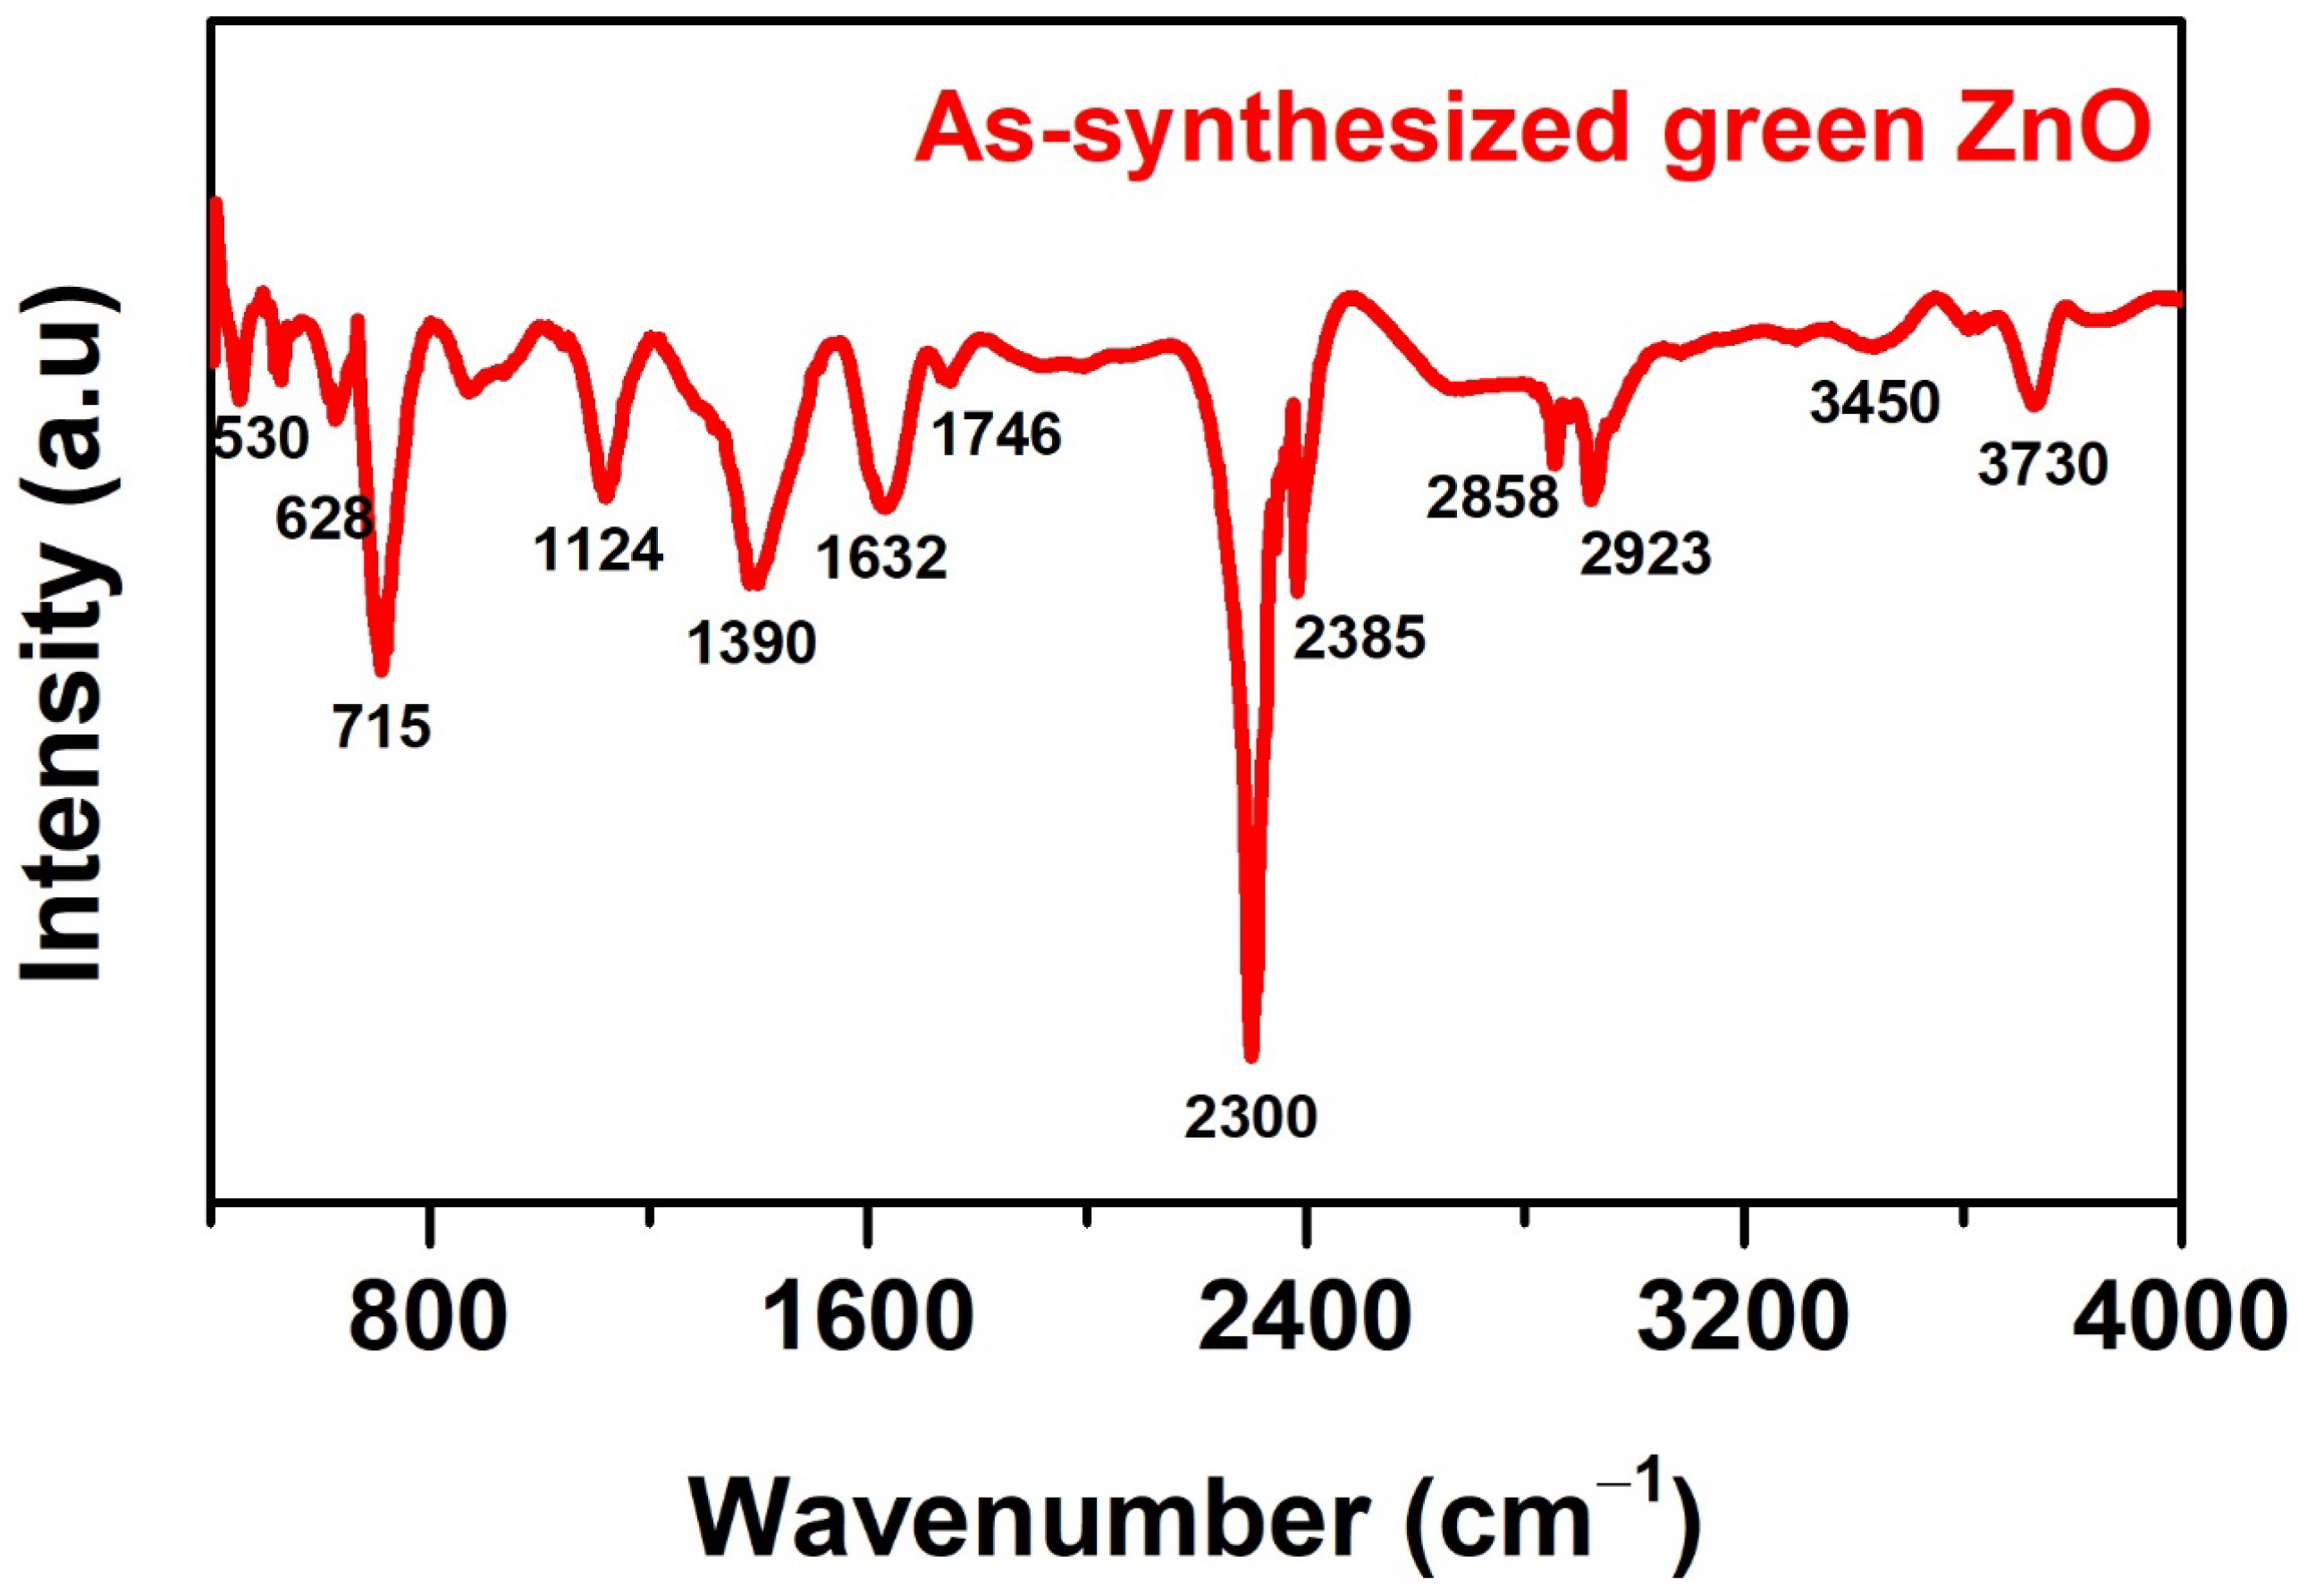
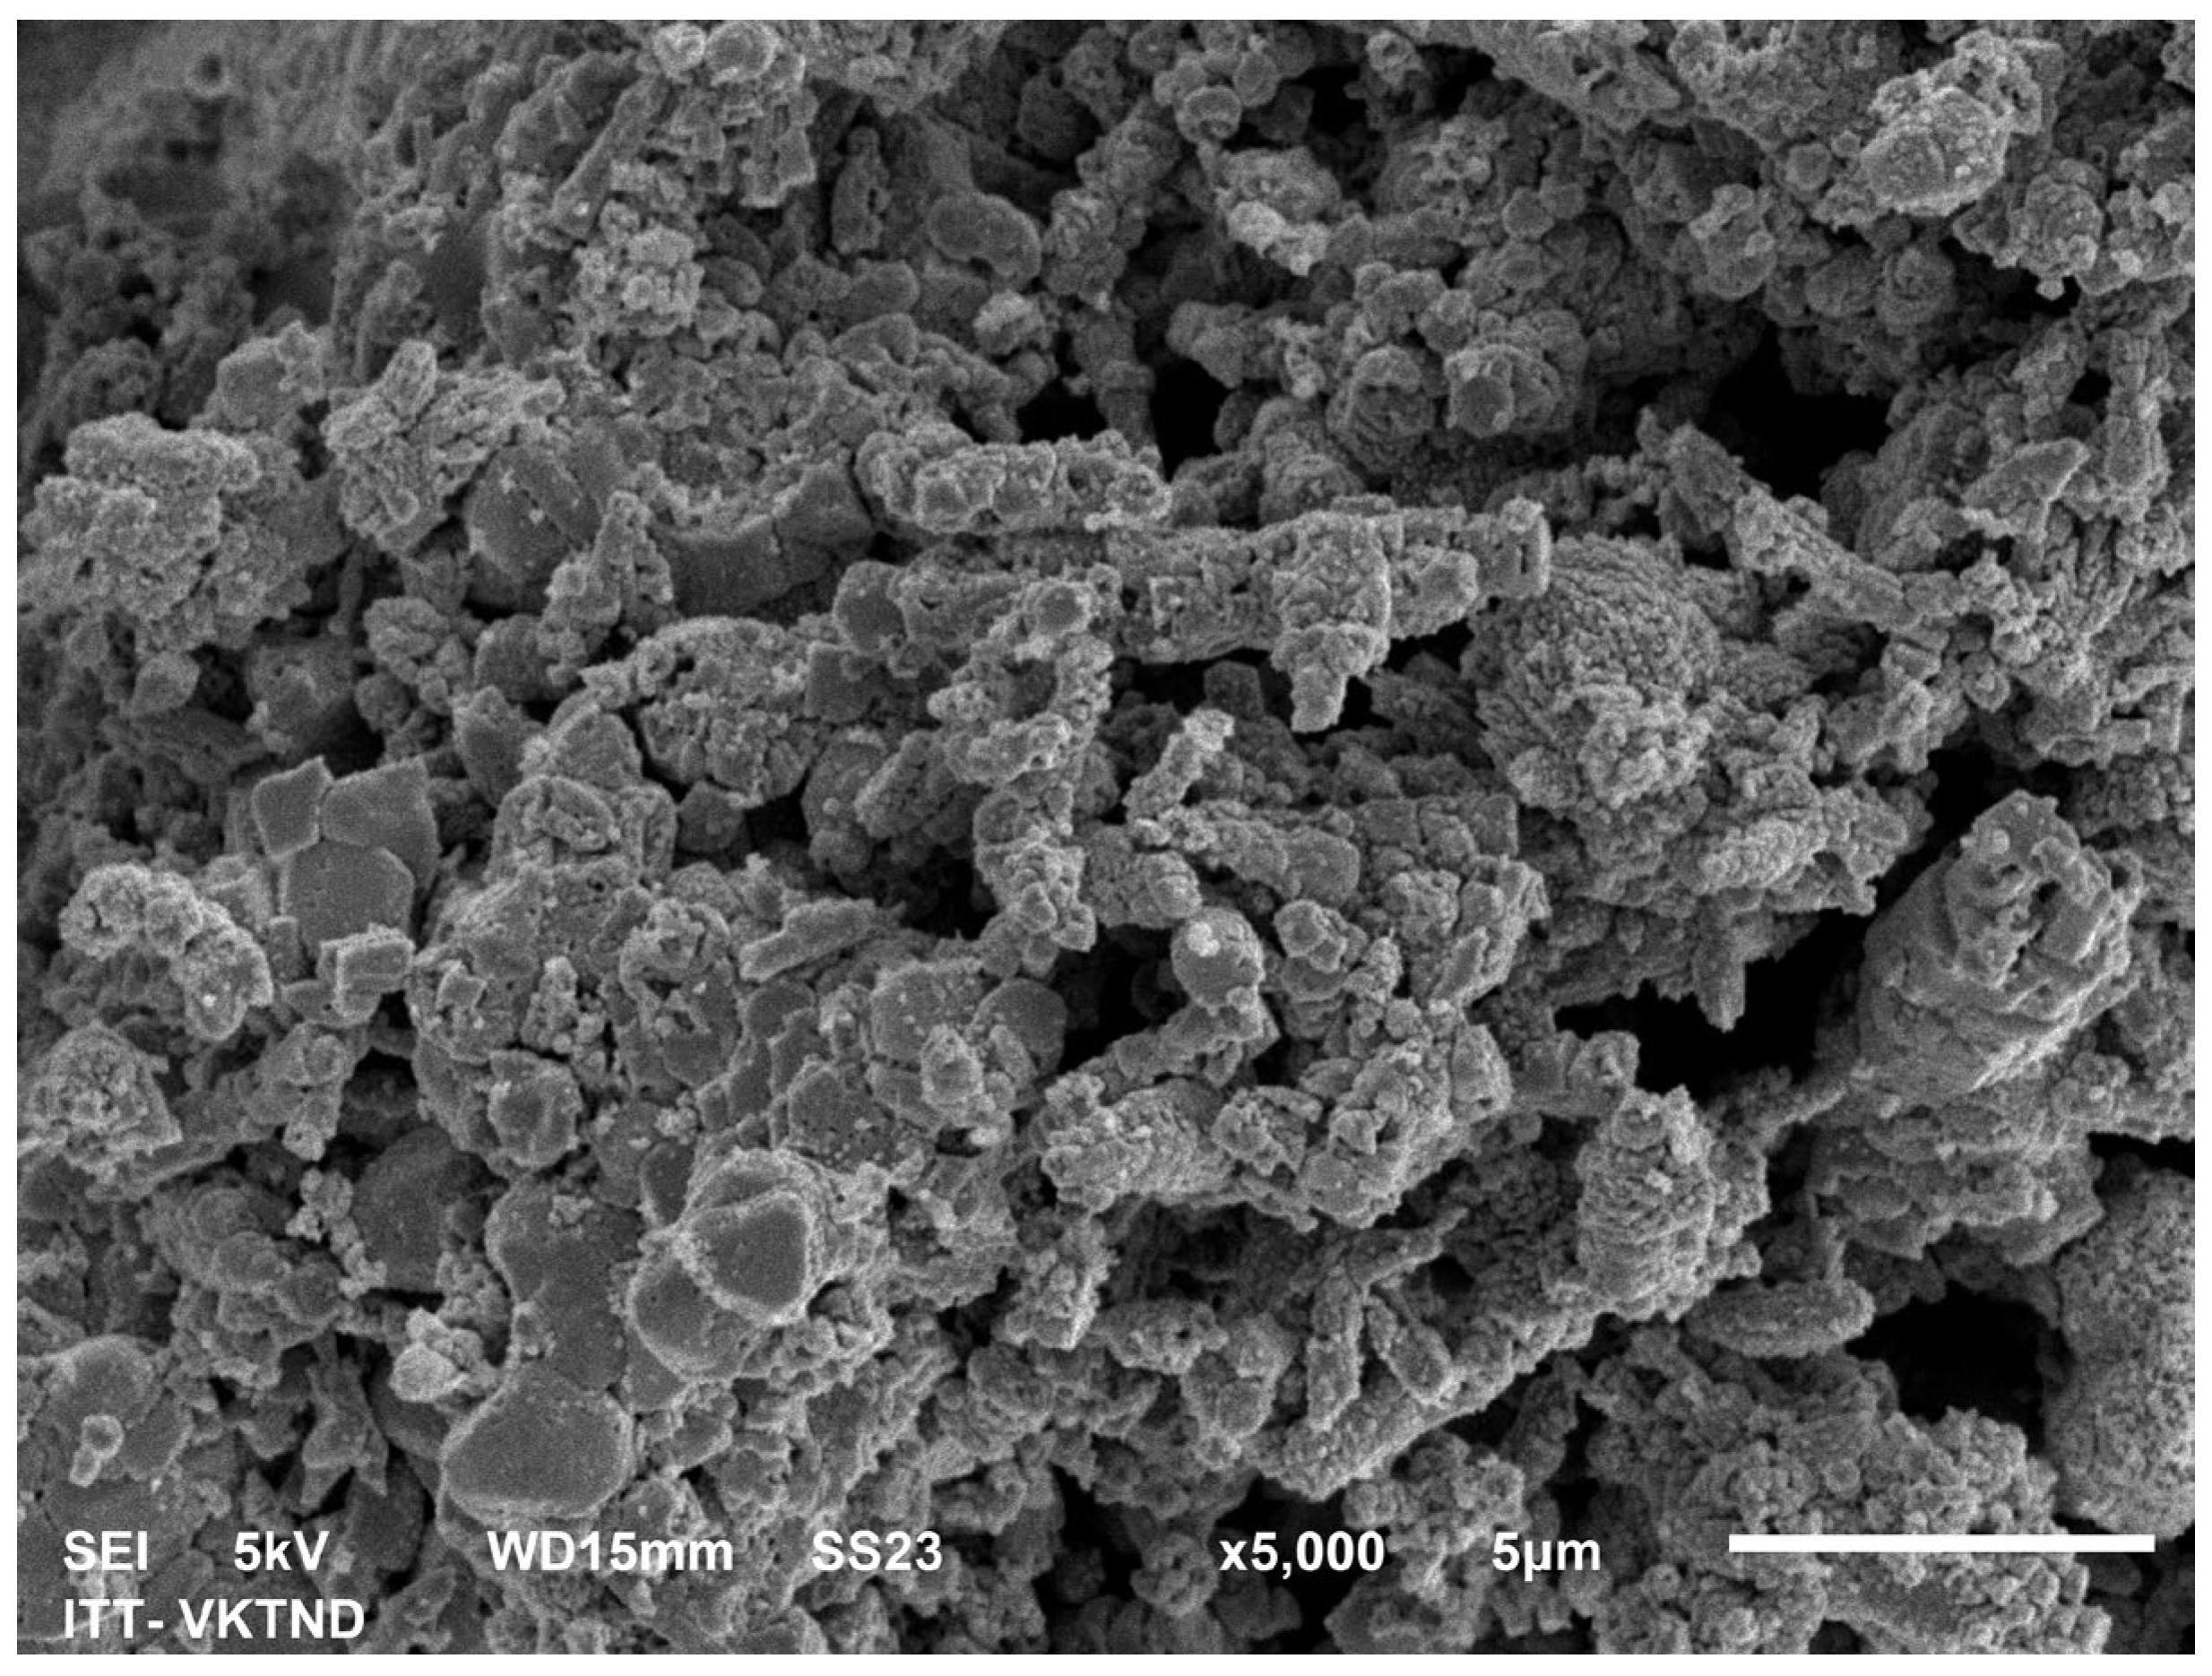
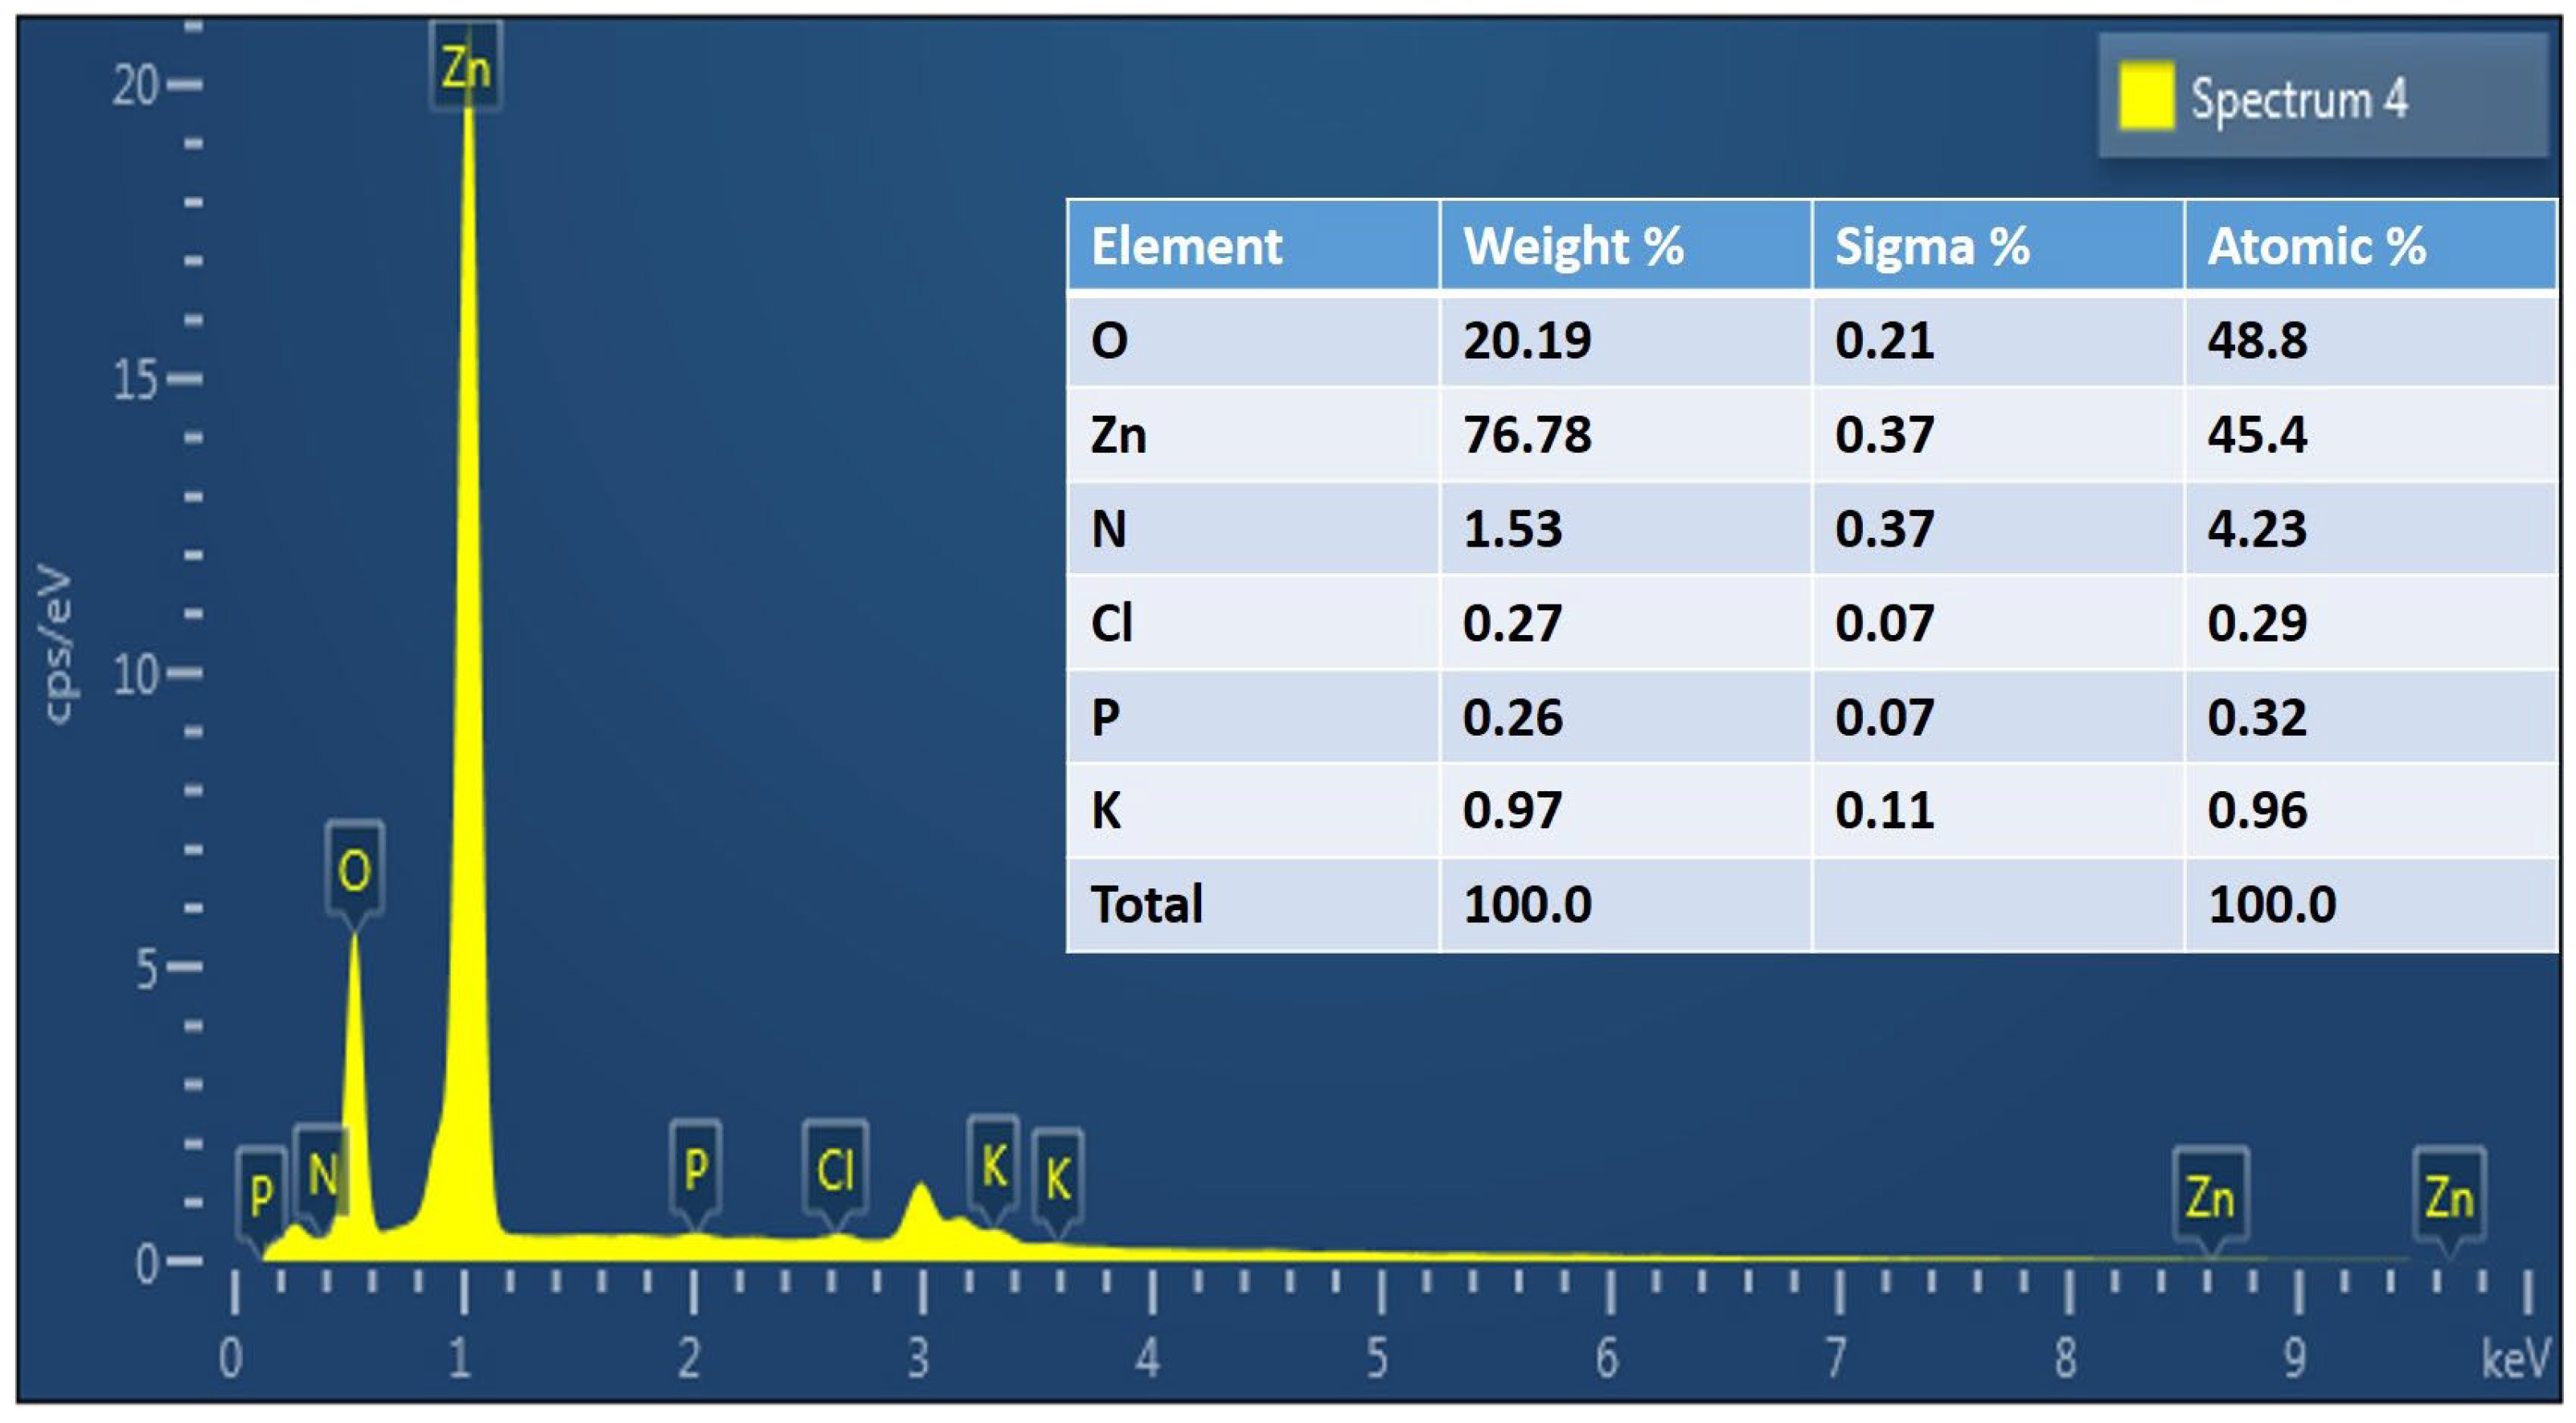
3.1. Characterization of Green ZnO Particles
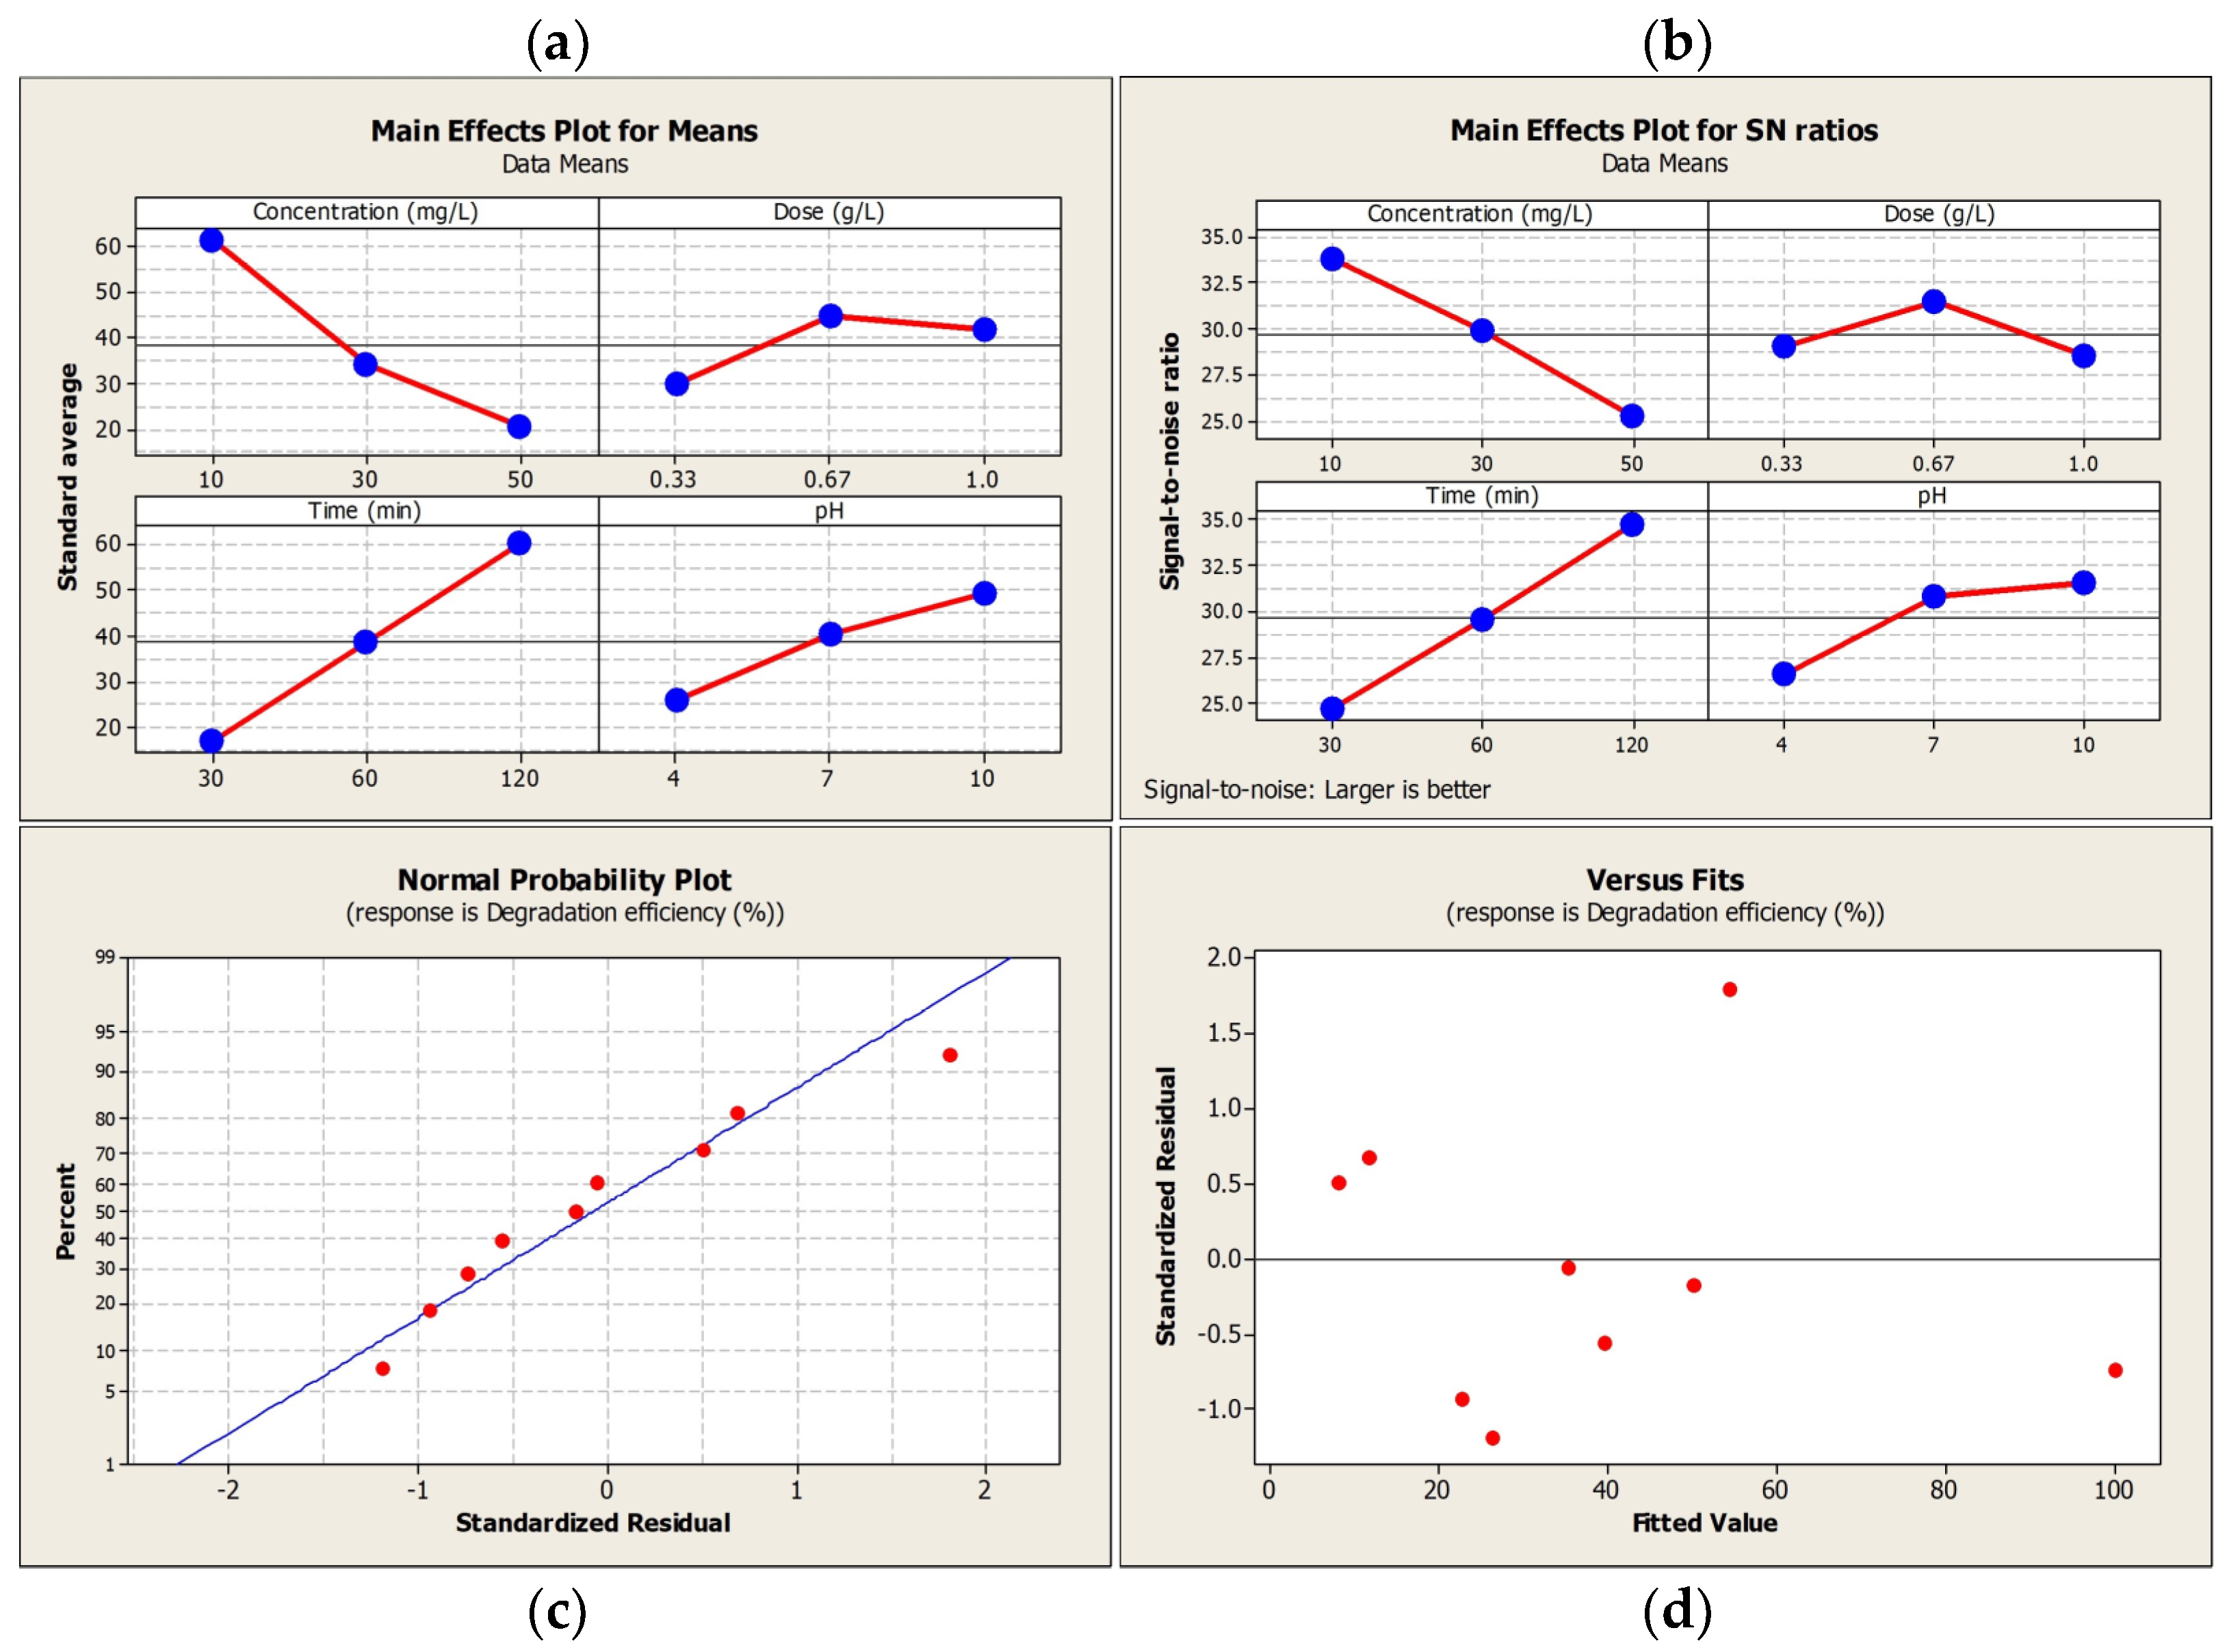
3.2. Taguchi Design and Model Optimization
3.3. Model Confirmation
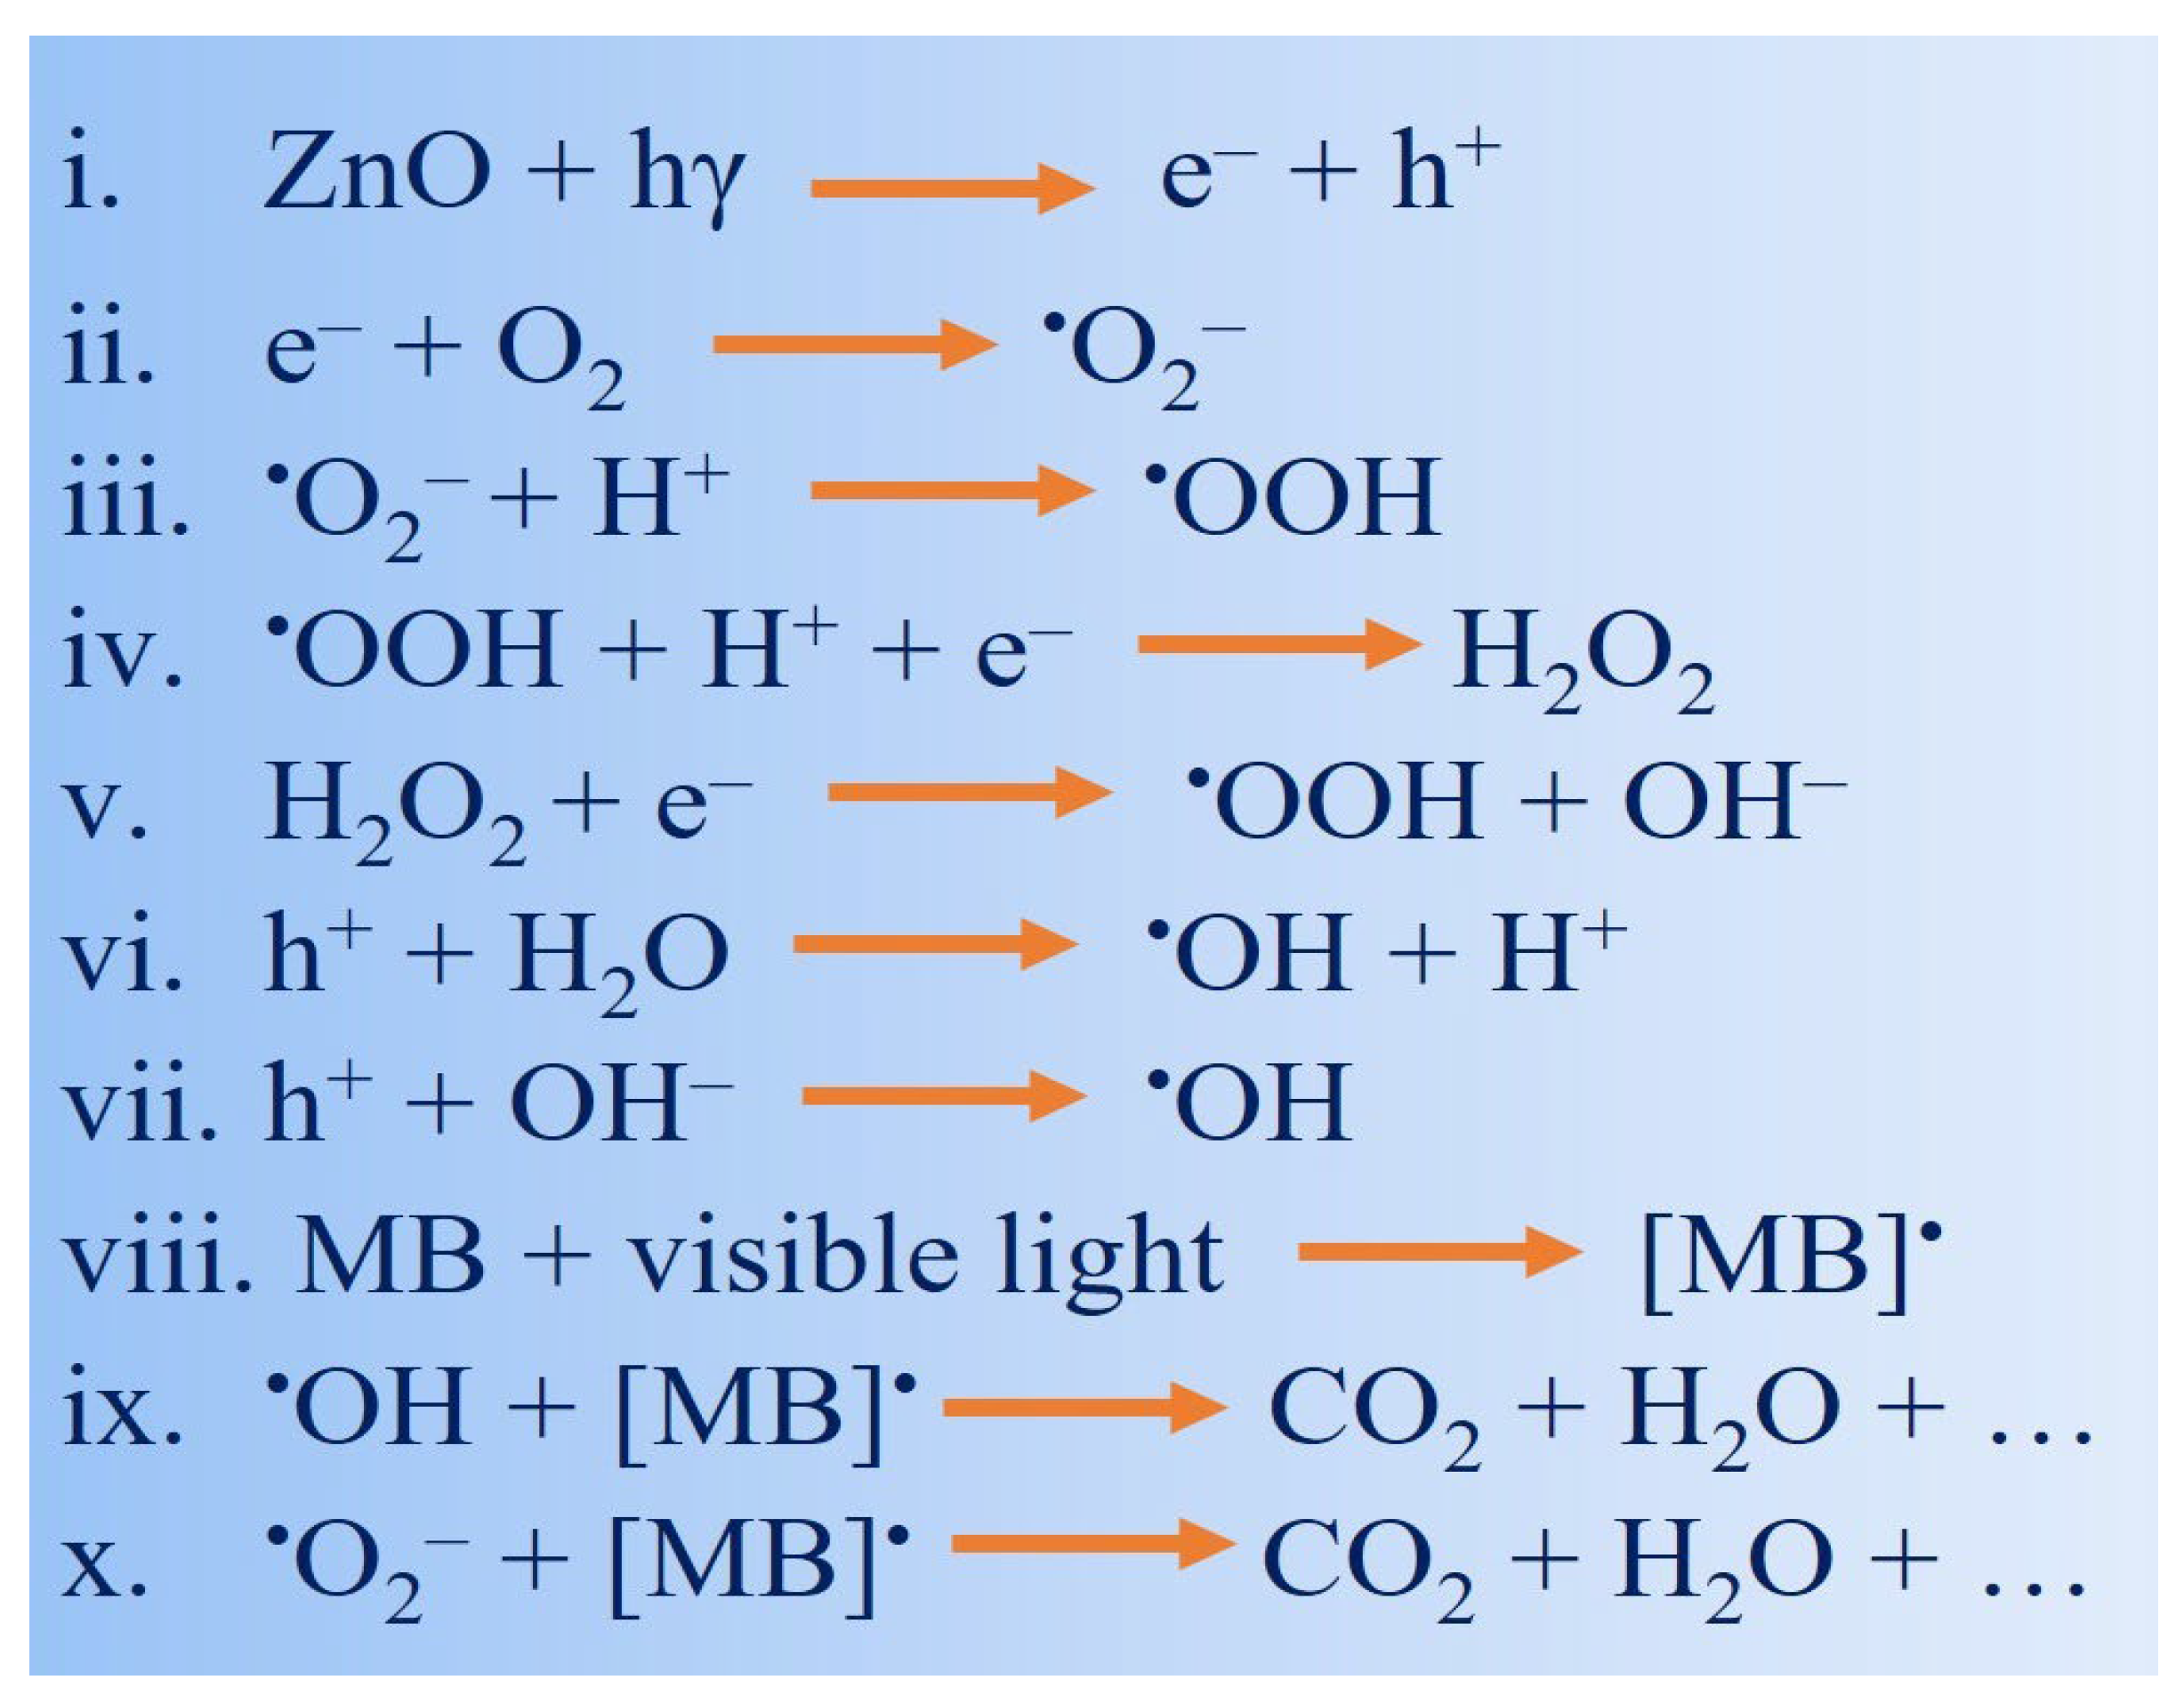
3.4. Proposed Mechanism for Dye Degradation
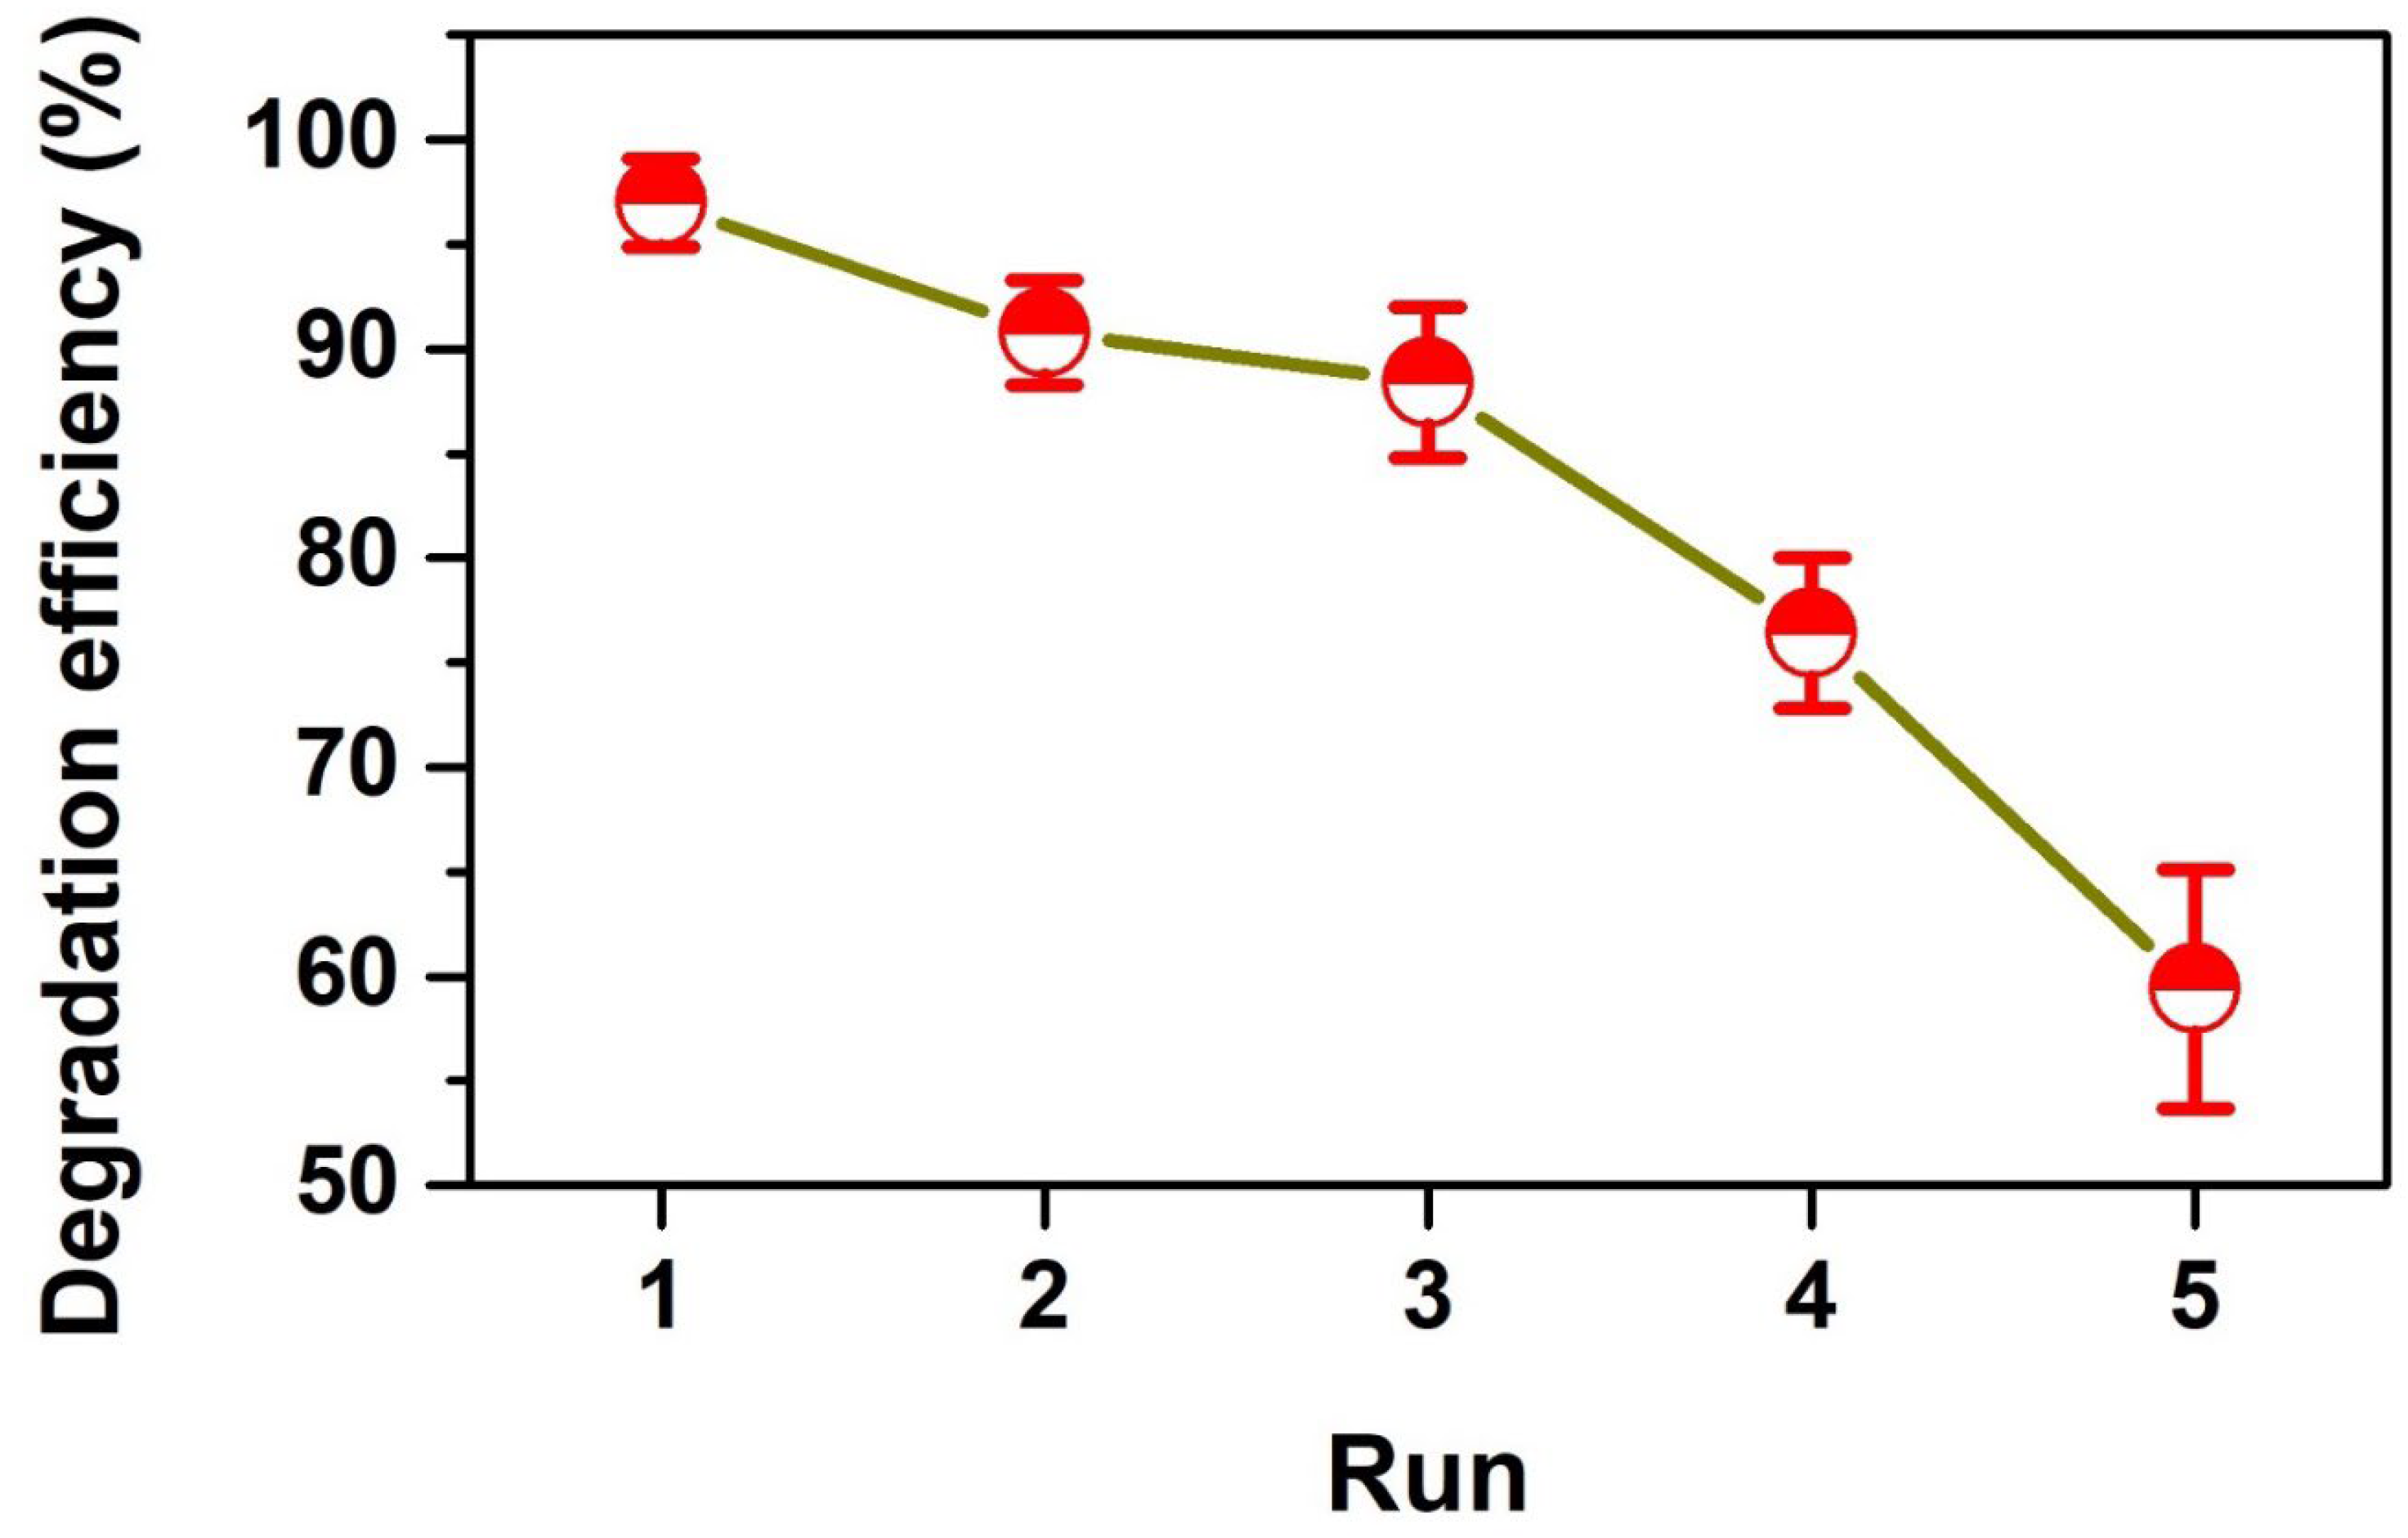
3.5. Recyclability Study
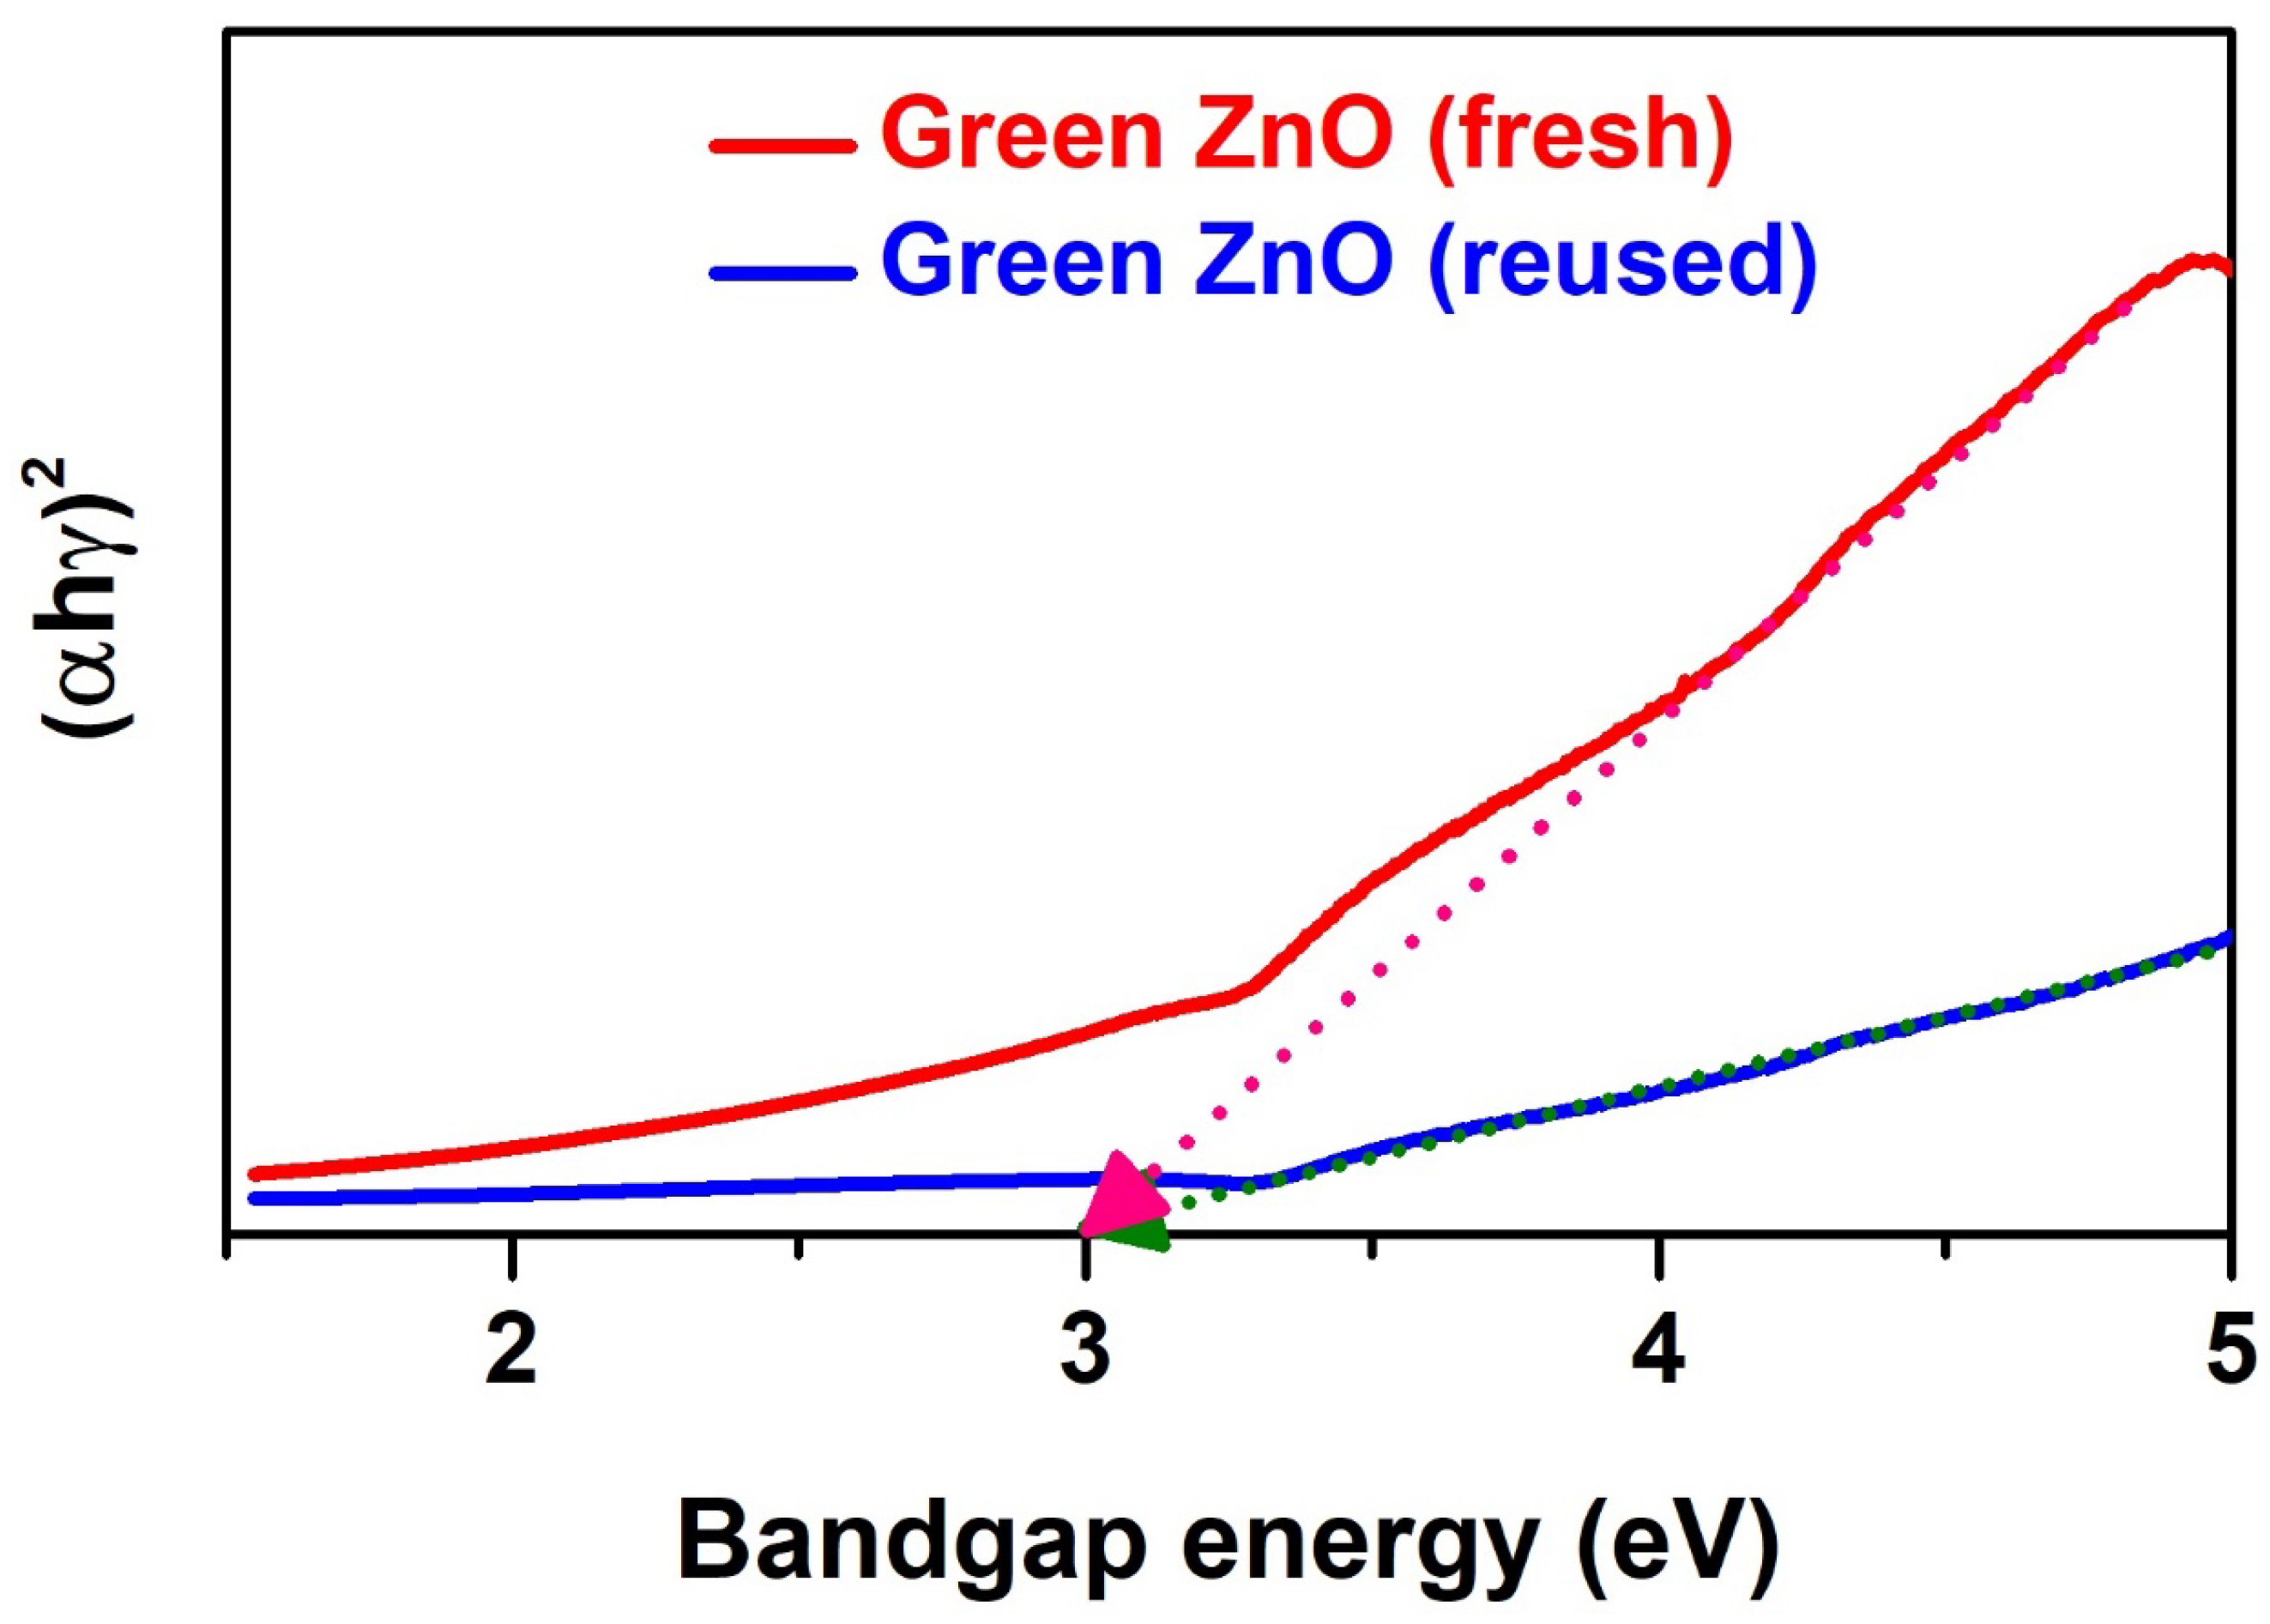
3.6. Stability Study
3.7. Comparison Study
4. Conclusions
Author Contributions
Funding
Data Availability Statement
Acknowledgments
Conflicts of Interest
References
- Hassan, M.M.; Carr, C.M. A critical review on recent advancements of the removal of reactive dyes from dyehouse effluent by ion-exchange adsorbents. Chemosphere 2018, 209, 201–219. [Google Scholar] [CrossRef]
- Donkadokula, N.Y.; Kola, A.K.; Naz, I.; Saroj, D. A review on advanced physico-chemical and biological textile dye wastewater treatment techniques. Rev. Environ. Sci. Bio/Technol. 2020, 19, 543–560. [Google Scholar] [CrossRef]
- Nguyen, L.T.T.; Vo, D.-V.N.; Nguyen, L.T.H.; Duong, A.T.T.; Nguyen, H.Q.; Chu, N.M.; Nguyen, D.T.C.; Tran, T. Van Synthesis, characterization, and application of ZnFe2O4@ZnO nanoparticles for photocatalytic degradation of Rhodamine B under visible-light illumination. Environ. Technol. Innov. 2022, 25, 102130. [Google Scholar] [CrossRef]
- Ahmad, A.; Khan, N.; Giri, B.S.; Chowdhary, P.; Chaturvedi, P. Removal of methylene blue dye using rice husk, cow dung and sludge biochar: Characterization, application, and kinetic studies. Bioresour. Technol. 2020, 306, 123202. [Google Scholar] [CrossRef]
- Din, M.I.; Khalid, R.; Najeeb, J.; Hussain, Z. Fundamentals and photocatalysis of methylene blue dye using various nanocatalytic assemblies- a critical review. J. Clean. Prod. 2021, 298, 126567. [Google Scholar] [CrossRef]
- Dutt, M.A.; Hanif, M.A.; Nadeem, F.; Bhatti, H.N. A review of advances in engineered composite materials popular for wastewater treatment. J. Environ. Chem. Eng. 2020, 8, 104073. [Google Scholar] [CrossRef]
- Zhu, X.; Zhou, Q.; Xia, Y.; Wang, J.; Chen, H.; Xu, Q.; Liu, J.; Feng, W.; Chen, S. Preparation and characterization of Cu-doped TiO2 nanomaterials with anatase/rutile/brookite triphasic structure and their photocatalytic activity. J. Mater. Sci. Mater. Electron. 2021, 32, 21511–21524. [Google Scholar] [CrossRef]
- Ong, C.B.; Ng, L.Y.; Mohammad, A.W. A review of ZnO nanoparticles as solar photocatalysts: Synthesis, mechanisms and applications. Renew. Sustain. Energy Rev. 2018, 81, 536–551. [Google Scholar] [CrossRef]
- Nguyen, N.T.T.; Nguyen, L.M.; Nguyen, T.T.T.; Nguyen, T.T.; Nguyen, D.T.C.; Tran, T. Van Formation, antimicrobial activity, and biomedical performance of plant-based nanoparticles: A review. Environ. Chem. Lett. 2022, 20, 2531–2571. [Google Scholar] [CrossRef]
- Zhu, X.; Wang, J.; Yang, D.; Liu, J.; He, L.; Tang, M.; Feng, W.; Wu, X. Fabrication, characterization and high photocatalytic activity of Ag–ZnO heterojunctions under UV-visible light. RSC Adv. 2021, 11, 27257–27266. [Google Scholar] [CrossRef]
- Ameen, F.; Dawoud, T.; AlNadhari, S. Ecofriendly and low-cost synthesis of ZnO nanoparticles from Acremonium potronii for the photocatalytic degradation of azo dyes. Environ. Res. 2021, 202, 111700. [Google Scholar] [CrossRef]
- Zaidi, Z.; Siddiqui, S.I.; Fatima, B.; Chaudhry, S.A. Synthesis of ZnO nanospheres for water treatment through adsorption and photocatalytic degradation: Modelling and process optimization. Mater. Res. Bull. 2019, 120, 110584. [Google Scholar] [CrossRef]
- Chen, X.; Wu, Z.; Liu, D.; Gao, Z. Preparation of ZnO photocatalyst for the efficient and rapid photocatalytic degradation of azo dyes. Nanoscale Res. Lett. 2017, 12, 143. [Google Scholar] [CrossRef]
- Davari, N.; Farhadian, M.; Solaimany Nazar, A.R. Synthesis and characterization of Fe2O3 doped ZnO supported on clinoptilolite for photocatalytic degradation of metronidazole. Environ. Technol. 2021, 42, 1734–1746. [Google Scholar] [CrossRef]
- Basnet, P.; Inakhunbi Chanu, T.; Samanta, D.; Chatterjee, S. A review on bio-synthesized zinc oxide nanoparticles using plant extracts as reductants and stabilizing agents. J. Photochem. Photobiol. B Biol. 2018, 183, 201–221. [Google Scholar] [CrossRef]
- Nguyen, N.T.T.; Nguyen, L.M.; Nguyen, T.T.T.; Liew, R.K.; Nguyen, D.T.C.; Tran, T. Van Recent advances on botanical biosynthesis of nanoparticles for catalytic, water treatment and agricultural applications: A review. Sci. Total Environ. 2022, 827, 154160. [Google Scholar] [CrossRef]
- Gao, Y.; Xu, D.; Ren, D.; Zeng, K.; Wu, X. Green synthesis of zinc oxide nanoparticles using Citrus sinensis peel extract and application to strawberry preservation: A comparison study. LWT 2020, 126, 109297. [Google Scholar] [CrossRef]
- Khan, Z.U.H.; Sadiq, H.M.; Shah, N.S.; Khan, A.U.; Muhammad, N.; Hassan, S.U.; Tahir, K.; Khan, F.U.; Imran, M.; Ahmad, N. Greener synthesis of zinc oxide nanoparticles using Trianthema portulacastrum extract and evaluation of its photocatalytic and biological applications. J. Photochem. Photobiol. B Biol. 2019, 192, 147–157. [Google Scholar] [CrossRef]
- Darvishi, E.; Kahrizi, D.; Arkan, E. Comparison of different properties of zinc oxide nanoparticles synthesized by the green (using Juglans regia L. leaf extract) and chemical methods. J. Mol. Liq. 2019, 286, 110831. [Google Scholar] [CrossRef]
- Nguyen, D.T.C.; Le, H.T.N.; Nguyen, T.T.; Nguyen, T.T.T.; Bach, L.G.; Nguyen, T.D.; Tran, T. Van Multifunctional ZnO nanoparticles bio-fabricated from Canna indica L. flowers for seed germination, adsorption, and photocatalytic degradation of organic dyes. J. Hazard. Mater. 2021, 420, 126586. [Google Scholar] [CrossRef]
- Asha, S.; Bessy, T.C.; Joe Sherin, J.F.; Vani, C.V.; Kumar, C.V.; Bindhu, M.R.; Sureshkumar, S.; Al-Khattaf, F.S.; Hatamleh, A.A. Efficient photocatalytic degradation of industrial contaminants by Piper longum mediated ZnO nanoparticles. Environ. Res. 2022, 208, 112686. [Google Scholar] [CrossRef]
- Bhattacharjee, N.; Som, I.; Saha, R.; Mondal, S. A critical review on novel eco-friendly green approach to synthesize zinc oxide nanoparticles for photocatalytic degradation of water pollutants. Int. J. Environ. Anal. Chem. 2022, 1–28. [Google Scholar] [CrossRef]
- Egbosiuba, T.C.; Abdulkareem, A.S.; Tijani, J.O.; Ani, J.I.; Krikstolaityte, V.; Srinivasan, M.; Veksha, A.; Lisak, G. Taguchi optimization design of diameter-controlled synthesis of multi walled carbon nanotubes for the adsorption of Pb(II) and Ni(II) from chemical industry wastewater. Chemosphere 2021, 266, 128937. [Google Scholar] [CrossRef]
- Moralı, U.; Demiral, H.; Şensöz, S. Optimization of activated carbon production from sunflower seed extracted meal: Taguchi design of experiment approach and analysis of variance. J. Clean. Prod. 2018, 189, 602–611. [Google Scholar] [CrossRef]
- Maazinejad, B.; Mohammadnia, O.; Ali, G.A.M.; Makhlouf, A.S.H.; Nadagouda, M.N.; Sillanpää, M.; Asiri, A.M.; Agarwal, S.; Gupta, V.K.; Sadegh, H. Taguchi L9 (34) orthogonal array study based on methylene blue removal by single-walled carbon nanotubes-amine: Adsorption optimization using the experimental design method, kinetics, equilibrium and thermodynamics. J. Mol. Liq. 2020, 298, 112001. [Google Scholar] [CrossRef]
- Youssef, F.S.; Eid, S.Y.; Alshammari, E.; Ashour, M.L.; Wink, M.; El-Readi, M.Z. Chrysanthemum indicum and Chrysanthemum morifolium: Chemical Composition of Their Essential Oils and Their Potential Use as Natural Preservatives with Antimicrobial and Antioxidant Activities. Foods 2020, 9, 1460. [Google Scholar] [CrossRef]
- Naseer, M.; Aslam, U.; Khalid, B.; Chen, B. Green route to synthesize Zinc Oxide Nanoparticles using leaf extracts of Cassia fistula and Melia azadarach and their antibacterial potential. Sci. Rep. 2020, 10, 9055. [Google Scholar] [CrossRef]
- Nilavukkarasi, M.; Vijayakumar, S.; Prathipkumar, S. Capparis zeylanica mediated bio-synthesized ZnO nanoparticles as antimicrobial, photocatalytic and anti-cancer applications. Mater. Sci. Energy Technol. 2020, 3, 335–343. [Google Scholar] [CrossRef]
- Dhiman, P.; Sharma, S.; Kumar, A.; Shekh, M.; Sharma, G.; Naushad, M. Rapid visible and solar photocatalytic Cr(VI) reduction and electrochemical sensing of dopamine using solution combustion synthesized ZnO–Fe2O3 nano heterojunctions: Mechanism Elucidation. Ceram. Int. 2020, 46, 12255–12268. [Google Scholar] [CrossRef]
- Golmohammadi, M.; Honarmand, M.; Ghanbari, S. A green approach to synthesis of ZnO nanoparticles using jujube fruit extract and their application in photocatalytic degradation of organic dyes. Spectrochim. Acta Part A Mol. Biomol. Spectrosc. 2020, 229, 117961. [Google Scholar] [CrossRef]
- Nithya, K.; Kalyanasundharam, S. Effect of chemically synthesis compared to biosynthesized ZnO nanoparticles using aqueous extract of C. halicacabum and their antibacterial activity. OpenNano 2019, 4, 100024. [Google Scholar] [CrossRef]
- Alyamani, A.A.; Albukhaty, S.; Aloufi, S.; AlMalki, F.A.; Al-Karagoly, H.; Sulaiman, G.M. Green Fabrication of Zinc Oxide Nanoparticles Using Phlomis Leaf Extract: Characterization and In Vitro Evaluation of Cytotoxicity and Antibacterial Properties. Molecules 2021, 26, 6140. [Google Scholar] [CrossRef]
- Pugazhendhi, A.; Prabhu, R.; Muruganantham, K.; Shanmuganathan, R.; Natarajan, S. Anticancer, antimicrobial and photocatalytic activities of green synthesized magnesium oxide nanoparticles (MgONPs) using aqueous extract of Sargassum wightii. J. Photochem. Photobiol. B Biol. 2019, 190, 86–97. [Google Scholar] [CrossRef]
- Dobrucka, R. Synthesis of MgO Nanoparticles Using Artemisia abrotanum Herba Extract and Their Antioxidant and Photocatalytic Properties. Iran. J. Sci. Technol. Trans. A Sci. 2018, 42, 547–555. [Google Scholar] [CrossRef]
- Essien, E.R.; Atasie, V.N.; Oyebanji, T.O.; Nwude, D.O. Biomimetic synthesis of magnesium oxide nanoparticles using Chromolaena odorata (L.) leaf extract. Chem. Pap. 2020, 74, 2101–2109. [Google Scholar] [CrossRef]
- Abdallah, Y.; Ogunyemi, S.O.; Abdelazez, A.; Zhang, M.; Hong, X.; Ibrahim, E.; Hossain, A.; Fouad, H.; Li, B.; Chen, J. The green synthesis of MgO nano-Flowers using Rosmarinus officinalis L. (Rosemary) and the antibacterial activities against Xanthomonas oryzae pv. oryzae. BioMed Res. Int. 2019, 2019, 5620989. [Google Scholar] [CrossRef]
- Faisal, S.; Jan, H.; Shah, S.A.; Shah, S.; Khan, A.; Akbar, M.T.; Rizwan, M.; Jan, F.; Wajidullah; Akhtar, N.; et al. Green Synthesis of Zinc Oxide (ZnO) Nanoparticles Using Aqueous Fruit Extracts of Myristica fragrans: Their Characterizations and Biological and Environmental Applications. ACS Omega 2021, 6, 9709–9722. [Google Scholar] [CrossRef]
- Jeevanandam, J.; Chan, Y.S.; Danquah, M.K. Biosynthesis and characterization of MgO nanoparticles from plant extracts via induced molecular nucleation. New J. Chem. 2017, 41, 2800–2814. [Google Scholar] [CrossRef]
- Ramesh, M.; Anbuvannan, M.; Viruthagiri, G. Green synthesis of ZnO nanoparticles using Solanum nigrum leaf extract and their antibacterial activity. Spectrochim. Acta Part A Mol. Biomol. Spectrosc. 2015, 136, 864–870. [Google Scholar] [CrossRef]
- Chinnasamy, C.; Tamilselvam, P.; Karthick, B.; Sidharth, B.; Senthilnathan, M. Green Synthesis, Characterization and Optimization Studies of Zinc Oxide Nano Particles Using Costusigneus Leaf Extract. Mater. Today Proc. 2018, 5, 6728–6735. [Google Scholar] [CrossRef]
- Handani, S.; Emriadi; Dahlan, D.; Arief, S. Enhanced structural, optical and morphological properties of ZnO thin film using green chemical approach. Vacuum 2020, 179, 109513. [Google Scholar] [CrossRef]
- Thi, T.U.D.; Nguyen, T.T.; Thi, Y.D.; Thi, K.H.T.; Phan, B.T.; Pham, K.N. Green synthesis of ZnO nanoparticles using orange fruit peel extract for antibacterial activities. RSC Adv. 2020, 10, 23899–23907. [Google Scholar]
- Soto-Robles, C.A.; Luque, P.A.; Gómez-Gutiérrez, C.M.; Nava, O.; Vilchis-Nestor, A.R.; Lugo-Medina, E.; Ranjithkumar, R.; Castro-Beltrán, A. Study on the effect of the concentration of Hibiscus sabdariffa extract on the green synthesis of ZnO nanoparticles. Results Phys. 2019, 15, 102807. [Google Scholar] [CrossRef]
- Thakur, S.; Shandilya, M.; Guleria, G. Appraisement of antimicrobial zinc oxide nanoparticles through Cannabis Jatropha curcasa Alovera and Tinosporacordifolia leaves by green synthesis process. J. Environ. Chem. Eng. 2021, 9, 104882. [Google Scholar] [CrossRef]
- Şahin, B.; Soylu, S.; Kara, M.; Türkmen, M.; Aydin, R.; Çetin, H. Superior antibacterial activity against seed-borne plant bacterial disease agents and enhanced physical properties of novel green synthesized nanostructured ZnO using Thymbra spicata plant extract. Ceram. Int. 2021, 47, 341–350. [Google Scholar] [CrossRef]
- Zhu, W.; Hu, C.; Ren, Y.; Lu, Y.; Song, Y.; Ji, Y.; Han, C.; He, J. Green synthesis of zinc oxide nanoparticles using Cinnamomum camphora (L.) Presl leaf extracts and its antifungal activity. J. Environ. Chem. Eng. 2021, 9, 106659. [Google Scholar] [CrossRef]
- Chauhan, A.K.; Kataria, N.; Garg, V.K. Green fabrication of ZnO nanoparticles using Eucalyptus spp. leaves extract and their application in wastewater remediation. Chemosphere 2020, 247, 125803. [Google Scholar] [CrossRef]
- Alshehri, A.A.; Malik, M.A. Biogenic fabrication of ZnO nanoparticles using Trigonella foenum-graecum (Fenugreek) for proficient photocatalytic degradation of methylene blue under UV irradiation. J. Mater. Sci. Mater. Electron. 2019, 30, 16156–16173. [Google Scholar] [CrossRef]
- Kumar, M.A.P.; Suresh, D.; Nagabhushana, H.; Sharma, S.C. Beta vulgaris aided green synthesis of ZnO nanoparticles and their luminescence, photocatalytic and antioxidant properties. Eur. Phys. J. Plus 2015, 130, 1–7. [Google Scholar]
- Madhumitha, G.; Fowsiya, J.; Gupta, N.; Kumar, A.; Singh, M. Green synthesis, characterization and antifungal and photocatalytic activity of Pithecellobium dulce peel–mediated ZnO nanoparticles. J. Phys. Chem. Solids 2019, 127, 43–51. [Google Scholar] [CrossRef]
- Shim, Y.J.; Soshnikova, V.; Anandapadmanaban, G.; Mathiyalagan, R.; Jimenez Perez, Z.E.; Markus, J.; Ju Kim, Y.; Castro-Aceituno, V.; Yang, D.C. Zinc oxide nanoparticles synthesized by Suaeda japonica Makino and their photocatalytic degradation of methylene blue. Optik 2019, 182, 1015–1020. [Google Scholar] [CrossRef]
- Soto-Robles, C.A.; Nava, O.; Cornejo, L.; Lugo-Medina, E.; Vilchis-Nestor, A.R.; Castro-Beltrán, A.; Luque, P.A. Biosynthesis, characterization and photocatalytic activity of ZnO nanoparticles using extracts of Justicia spicigera for the degradation of methylene blue. J. Mol. Struct. 2021, 1225, 129101. [Google Scholar] [CrossRef]
- Sun, L.; Shao, Q.; Zhang, Y.; Jiang, H.; Ge, S.; Lou, S.; Lin, J.; Zhang, J.; Wu, S.; Dong, M. N self-doped ZnO derived from microwave hydrothermal synthesized zeolitic imidazolate framework-8 toward enhanced photocatalytic degradation of methylene blue. J. Colloid Interface Sci. 2020, 565, 142–155. [Google Scholar] [CrossRef]
- Chen, L.; Batjikh, I.; Hurh, J.; Han, Y.; Huo, Y.; Ali, H.; Li, J.F.; Rupa, E.J.; Ahn, J.C.; Mathiyalagan, R.; et al. Green synthesis of zinc oxide nanoparticles from root extract of Scutellaria baicalensis and its photocatalytic degradation activity using methylene blue. Optik 2019, 184, 324–329. [Google Scholar] [CrossRef]
- Mardikar, S.P.; Kulkarni, S.; Adhyapak, P. V Sunlight driven highly efficient degradation of methylene blue by CuO-ZnO nanoflowers. J. Environ. Chem. Eng. 2020, 8, 102788. [Google Scholar] [CrossRef]




| Factor | Unit | Code | Level 1 | Level 2 | Level 3 |
|---|---|---|---|---|---|
| Initial dye concentration | mg/L | A | 10 | 30 | 50 |
| ZnO dosage | g/L | B | 0.33 | 0.67 | 1.0 |
| Contact time | min | C | 30 | 60 | 120 |
| pH | - | D | 4 | 7 | 10 |
| No. | Position | Chemical Bonds | Compounds | Reference |
|---|---|---|---|---|
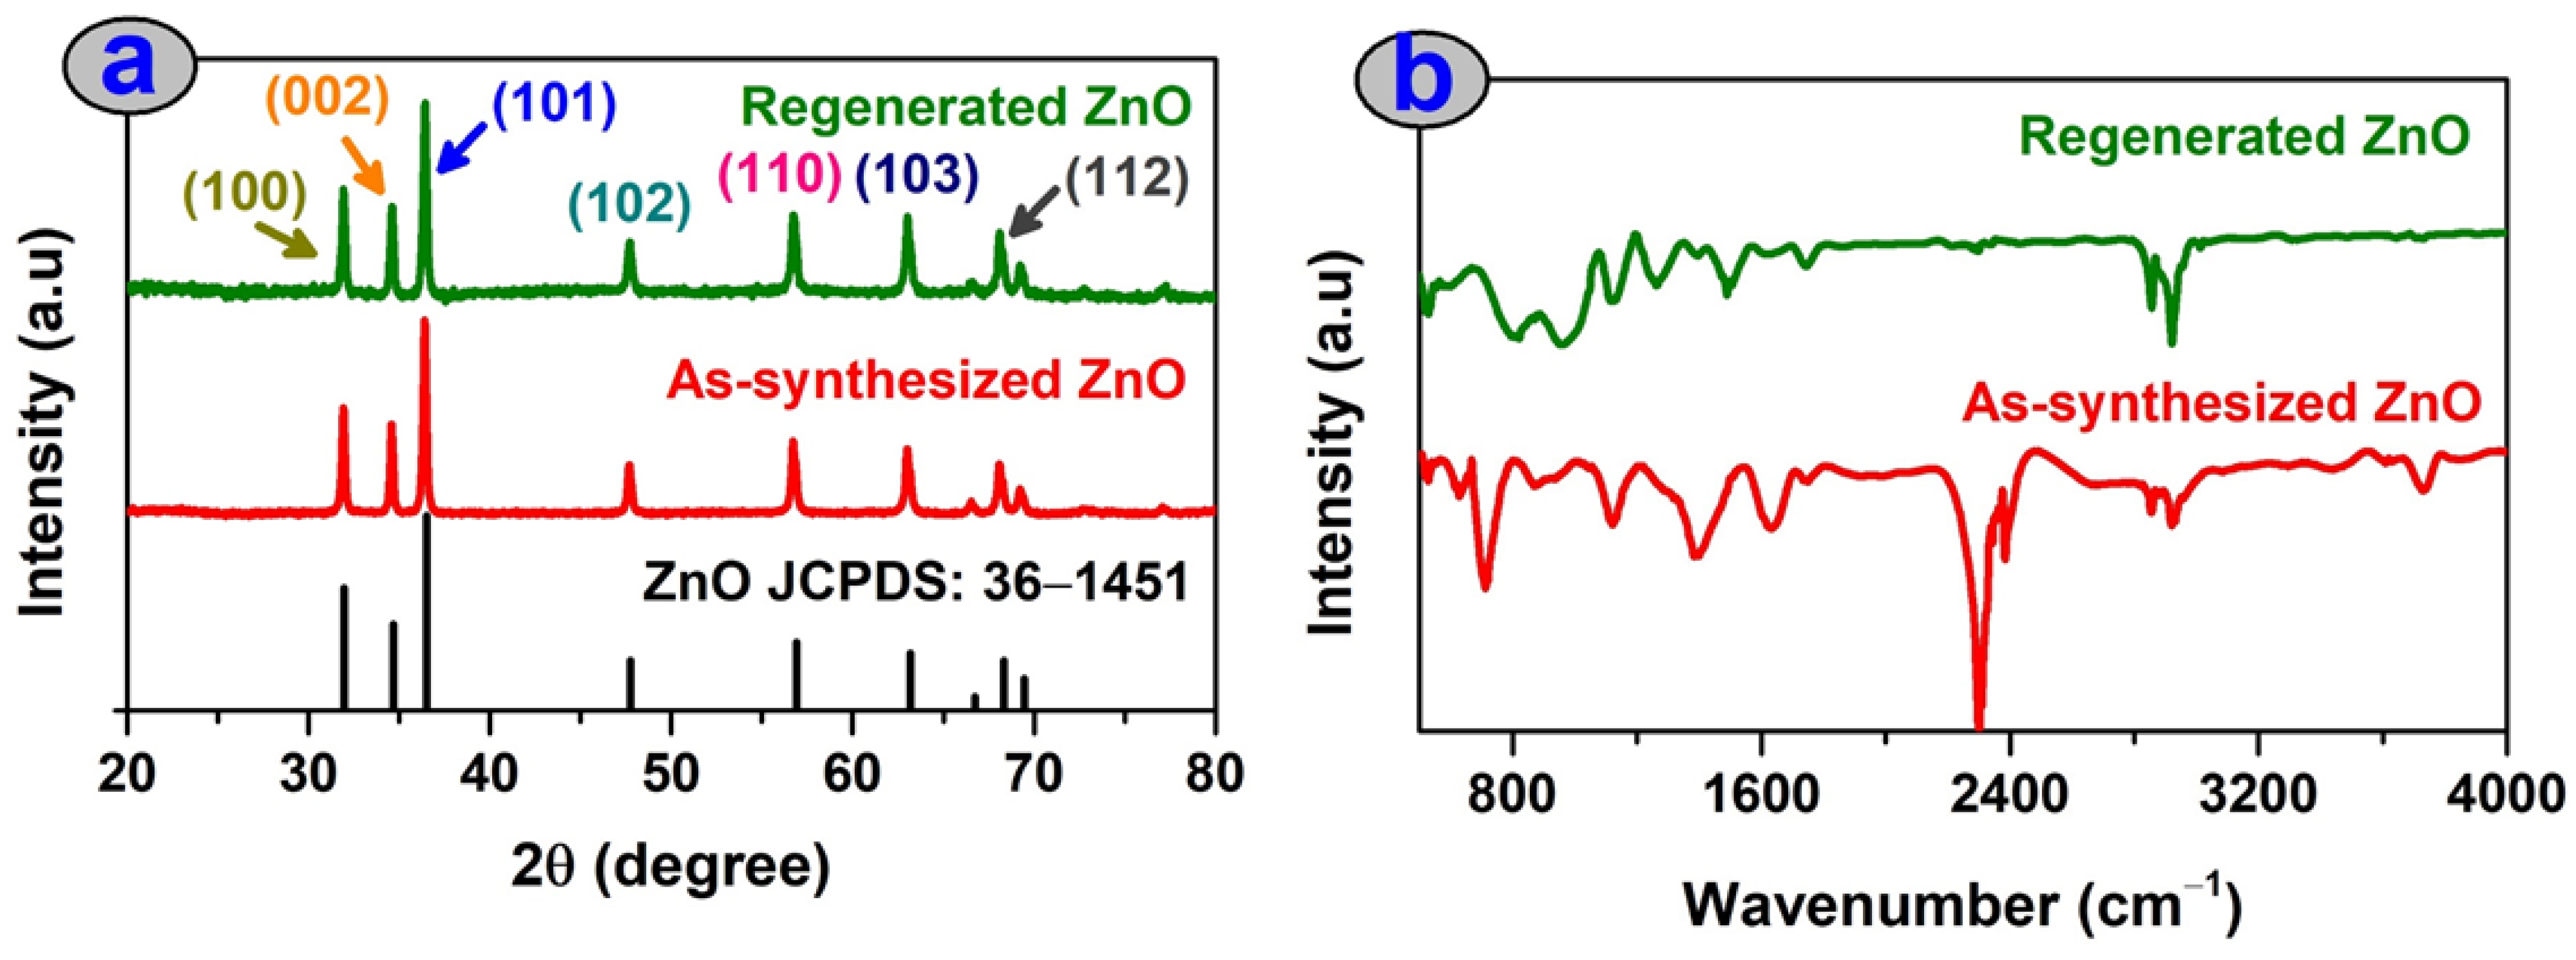
| 1 | 3730 cm−1 | A medium band of O–H vibrations | Hydroxyl groups of alcohols, polyphenols, polysaccharides, quercetin, genin, and gallic acid in Chrysanthemum spp. flower extract or surface-chemisorbed H2O. | [36] |
| 2 | 3450 cm−1 | N–H vibrations (broad band) | Amide groups, primary amines or proteins from alkaloids, and betalains in Chrysanthemum spp. flower extract. | |
| 3 | 2858–2923 cm−1 | C–H stretching (medium band) | Symmetric methylene groups (CH2), aliphatic groups, or aldehydes from natural compounds | |
| 4 | 2385 cm−1 | C=C bending (sharp band) | Aromatic compounds, e.g., quinones, coumarins, tannins, or terpenes (such as carotenoids). | [35] |
| 5 | 2300 cm−1 | C–N/C=N (very sharp band) | Tertiary amines or imines. | |
| 6 | 1746 cm−1 | C=O stretching (narrow band) | Carbonyl groups of esters, δ-lactone, or ketones. | [34] |
| 7 | 1632 cm−1 | C=C stretching (broad, strong band) | Alkenes. | |
| 8 | 1390 cm−1 | C–H bending (strong band) | Aldehydes or reducing sugars. | [33] |
| 9 | 1124 cm−1 | C–O stretching | Secondary or tertiary alcohols. | |
| 10 | 860.1 cm−1 | N–H stretching vibrations | Amines. | [33] |
| 11 | 530–715 cm−1 | Zn–O | The formation of zinc oxide nanoparticles using Chrysanthemum spp. flower extract. | [38] |
| No. | A (mg/L) | B (g/L) | C (min) | D (pH) | Removal (%) |
|---|---|---|---|---|---|
| 1 | 10 | 0.33 | 30 | 4 | 18.1 |
| 2 | 10 | 0.67 | 60 | 7 | 68.8 |
| 3 | 10 | 1.0 | 120 | 10 | 96.9 |
| 4 | 30 | 0.33 | 60 | 10 | 35.7 |
| 5 | 30 | 0.67 | 120 | 4 | 48.9 |
| 6 | 30 | 1.0 | 30 | 7 | 17.6 |
| 7 | 50 | 0.33 | 120 | 7 | 35 |
| 8 | 50 | 0.67 | 30 | 10 | 15.8 |
| 9 | 50 | 1.0 | 60 | 4 | 11.1 |
| Parameter | DF a | SSS b | SEC c | Coefficient | p Value d |
|---|---|---|---|---|---|
| A—Initial concentration (mg/L) | 1 | 2476.6 | 0.193 | −1.016 | 0.006 e |
| B—Adsorbent dosage (g/L) | 1 | 225.7 | 0.386 | 0.613 | 0.187 f |
| C—Contact time (min) | 1 | 2692.0 | 0.084 | 0.462 | 0.005 e |
| D—pH of the solution (−) | 1 | 823.7 | 1.287 | 3.906 | 0.039 e |
| Total | 4 | 6218.0 | – | – | 0.009 e |
| No. | Parameters | Optimized Value | Level | Contribution (%) a |
|---|---|---|---|---|
| 1 | Initial concentration (mg/L) | 10 | 1 | 39.83 |
| 2 | ZnO dosage (g/L) | 0.67 | 2 | 3.63 |
| 3 | Contact time (min) | 120 | 3 | 43.29 |
| 4 | pH of the solution (-) | 10 | 3 | 13.25 |
| Method of Synthesis | Light Source | Degradation Efficiency (%) | Catalyst Dose (g/L) | Concentration (mg/L) | Degradation Time (min) | Reference |
|---|---|---|---|---|---|---|
| Bio-mediated (Chrysanthemum spp. flowers) | Sunlight | 99.0 | 0.67 | 10 | 120 | This work |
| Bio-mediated (jujube fruit) | Sunlight | 85.0 | 1.0 | 100 | 300 | [30] |
| Bio-mediated (Beta vulgaris) | Ultraviolet light, 370 nm | 80.0 | 0.2 | 5 | 150 | [49] |
| Bio-mediated (Myristica fragrans) | Ultraviolet light | 88.0 | 0.56 | 20 | 140 | [37] |
| Bio-mediated (Pithecellobium dulce peel) | Ultraviolet light, 365 nm | 63.0 | - | 320 | 120 | [50] |
| Bio-mediated (Justicia spicigera) | Ultraviolet light, Hg lamp 10 W | 81.9 | 1.0 | 15 | 90 | [52] |
| Bio-mediated (Suaeda japónica) | Ultraviolet light, 346 nm | 54.0 | 1.0 | 32 | 60 | [51] |
| Commercial | Ultraviolet light, Xenon 200 W | 66.9 | 0.5 | 20 | 80 | [53] |
| Bio-mediated (Hibiscus sabdariffa) | Ultraviolet light, 10 W | 97.0 | 1.0 | 15 | 150 | [43] |
| Bio-mediated (Scutellaria baicalensis) | Ultraviolet light, 365 nm | 98.6 | 0.1 | 16 | 210 | [54] |
| Chemical | Ultraviolet light, 10 W | 78.5 | 1.0 | 15 | 120 | [43] |
| Chemical | Sunlight | 98.0 | 0.5 | 100 | 30 | [55] |
Disclaimer/Publisher’s Note: The statements, opinions and data contained in all publications are solely those of the individual author(s) and contributor(s) and not of MDPI and/or the editor(s). MDPI and/or the editor(s) disclaim responsibility for any injury to people or property resulting from any ideas, methods, instructions or products referred to in the content. |
© 2023 by the authors. Licensee MDPI, Basel, Switzerland. This article is an open access article distributed under the terms and conditions of the Creative Commons Attribution (CC BY) license (https://creativecommons.org/licenses/by/4.0/).
Share and Cite
Tran, T.V.; Alsaiari, M.; Harraz, F.A.; Nabgan, W.; Nguyen, D.T.D.; Nguyen, C.V. Taguchi L9 (34) Orthogonal Array Design for Photocatalytic Degradation of Methylene Blue Dye by Green ZnO Particles Biosynthesized by Chrysanthemum spp. Flower Extract. Water 2023, 15, 2186. https://doi.org/10.3390/w15122186
Tran TV, Alsaiari M, Harraz FA, Nabgan W, Nguyen DTD, Nguyen CV. Taguchi L9 (34) Orthogonal Array Design for Photocatalytic Degradation of Methylene Blue Dye by Green ZnO Particles Biosynthesized by Chrysanthemum spp. Flower Extract. Water. 2023; 15(12):2186. https://doi.org/10.3390/w15122186
Chicago/Turabian StyleTran, Thuan Van, Mabkhoot Alsaiari, Farid A. Harraz, Walid Nabgan, Dinh Tien Dung Nguyen, and Chi Van Nguyen. 2023. "Taguchi L9 (34) Orthogonal Array Design for Photocatalytic Degradation of Methylene Blue Dye by Green ZnO Particles Biosynthesized by Chrysanthemum spp. Flower Extract" Water 15, no. 12: 2186. https://doi.org/10.3390/w15122186
APA StyleTran, T. V., Alsaiari, M., Harraz, F. A., Nabgan, W., Nguyen, D. T. D., & Nguyen, C. V. (2023). Taguchi L9 (34) Orthogonal Array Design for Photocatalytic Degradation of Methylene Blue Dye by Green ZnO Particles Biosynthesized by Chrysanthemum spp. Flower Extract. Water, 15(12), 2186. https://doi.org/10.3390/w15122186


