Article

Appraisal of the Temporospatial Migration and Potential Ecotoxicity of Phthalic Acid Esters in Municipal Effluents, Rivers and Dam—A Catchment-Wide Assessment

by
Ntsako Dellas Baloyi
1,*,
Memory Tekere
1,
Khumbudzo Walter Maphangwa
1 and
Vhahangwele Masindi
1,2
1
Department of Environmental Sciences, College of Agriculture and Environmental Sciences, University of South Africa, Florida 1710, South Africa
2
Scientific Services, Research & Development Division, Magalies Water, Brits 0250, South Africa
*
Author to whom correspondence should be addressed.
Water 2023, 15(11), 2061; https://doi.org/10.3390/w15112061
Submission received: 24 April 2023 / Revised: 22 May 2023 / Accepted: 25 May 2023 / Published: 29 May 2023

Abstract

:
Herein, the catchment-wide temporal dynamics and potential ecotoxicological risk of phthalic acid esters (PAEs) in aquatic ecosystems were assessed. Specifically, water samples were collected for a period of six consecutive months from seven selected sites, i.e., covering both dry and wet seasons for seasonal variabilities. The appraised PAEs comprised dimethyl phthalate (DMP), diethyl phthalate (DEP), di-n-butyl phthalate (DBP), benzylbutyl phthalate (BBP), diphenyl phthalate (DPP), di-n-hexyl phthalate (DHP), bis(2-ethylhexyl) phthalate (DEHP), di-n-octyl phthalate (DOP), diisodecyl phthalate (DiDP) and diisononyl phthalate (DiNP)) in municipal wastewater effluents, rivers and dam. Their concentrations were quantified using a gas chromatography–flame ionisation detector (GC–FID) via the liquid–liquid extraction mode. The appraised PAEs were ubiquitous in the selected sampling points, with DBP being the most abundant PAE homologue throughout the assessed localities. In particular, quantifiable concentrations were 18.9, 37.9 and 11.5 μg/L for DBP in wastewater effluents, rivers and the dam catchment, respectively, and for overall Σ10PAEs of minimum, mean and maximum of 0.492, 3.6 ± 9.82 and 63.2 μg/L, respectively. In addition, PAE concentrations in the effluents, rivers, and dam samples showed no significant differences with p < 0.05. The overall prominent sequence for ∑PAEs registered: 53.3 > 10.1 > 10.0 > 9.8 > 4.3 > 2.5 > 1.8 > 1.7 > 1.1 > 0.9% for DBP > DEHP > DiDP > DOP > DHP > DPP > BBP > DMP > DEP > DiNP, respectively. The ecotoxicological risk assessment (risk quotient method) showed that DBP and DiDP posed high risk (RQ ≥ 1), and DOP, DEHP, DHP, DiNP and BBP posed median risk to aquatic organisms (0.1 ≤ RQ < 1), while the risk from DMP and DEP was minimal (RQ < 0.1). Additionally, DBP, DEHP, DOP, DPP and DiDP were higher than the water criterion (3 μg/L) of PAEs recommended by the United States Environmental Protection Agency (USEPA) for the protection of aquatic life. Findings from this study should go a long way in guiding regulators, custodians and catchment management forums, along with interested and affected parties, regarding the status and potential ecotoxicological effects of PAEs in the receiving environment.

1. Introduction

Phthalic acid esters (PAEs), also known as phthalate esters, are among the many groups of emerging organic micropollutants giving rise to increasing numbers of environmental and health concerns worldwide [1,2,3]. PAEs are synthetic or naturally existing organic chemical compounds with myriads of industrial applications. Such compounds mainly emanate from vinyl flooring, lubricating oils and personal care products, along with, primarily, polyvinyl chloride (PVC) plastics, which are used to make such products as plastic packaging, garden hoses [4,5], and clinical appliances, such as catheters and blood transfusion devices [6,7]. Due to their persistent, ubiquitous nature and ability to act as endocrine disruptors [8,9,10], PAEs have recently received much attention, both from many researchers and from various international organisations, such as the World Health Organization (WHO), the United States Environmental Protection Agency (USEPA) and the Stockholm Convention [2,11,12,13]. The applications of PAEs in various industries, including agricultural (pesticides), household (cosmetics, personal care products, vinyl toys, food packaging and plastic wraps) and anthropogenic activities (incineration of fossil fuel, landfills, industrial and municipal effluents), are among the major sources of such compounds [2,3,8,14,15,16,17]. Their ingression into the biosphere is frequently monitored, primarily due to their classification as emerging pollutants that are of prime environmental concern, with notorious potential to have known (documented) and unknown (undocumented) adverse toxicological effects on living organisms from sheer exposure to them [3,18,19,20,21,22]. Consequently, the USEPA has labelled and listed the six (6) PAEs (dimethyl phthalate (DMP), diethyl phthalate (DEP), di-n-butyl phthalate (DBP), bis(2-ethylhexyl) phthalate (DEHP), di-n-octyl phthalate (DOP), and benzyl butyl phthalate (BBP)), along with dihexyl phthalate (DHP), diisodecyl phthalate (DiDP) and diisononyl phthalate (DiNP), as priority pollutants that require close monitoring [11]. These priority PAEs are documented to have mutagenic, teratogenic and carcinogenic effects on living organisms upon exposure, according to pot assays, aquarium studies and toxicity-informed epidemiological reports [20,21].
On discharge or disposal, PAEs and their residues or metabolites tend to find their way into different environmental compartments, thereupon dispersing and become ubiquitous throughout the different environmental spheres [2,3,5,22,23,24,25]. Furthermore, the lack of covalent bonding between them and their embodying polymers accelerates their dispersion [26,27,28]. Upon entering the aquatic ecosystem, PAEs come into contact with aquatic organisms and invertebrates, eliciting their toxicities, such as, but not limited to, developmental, endocrine, immunotoxin, neurotoxic and metabolic toxicities [8,21,29,30]. Acute and chronic toxic effects on aquatic organisms, including such symptoms as crooked tails, cardiac oedema, necrosis, lack of tactile response and death, were noted in aquatic animal embryos [8]. In terms of adult organisms, PAE exposure could lead to adverse effects on reproduction and damage to such vital organs as kidney and liver, among others [31]. Alterations in the swimming behaviours and biochemical activities of zebrafish due to exposure to diheptyl phthalate and DiDP have also been reported [14]. Recent findings also revealed that exposure to DBP, BBP and DEP could lead to alteration in gamete quality, gene expression and have hormonal effects in various fish species [13,17,24]. Due to their toxicologically aggressive nature, their adverse effects are at the broad range of endpoint, even at much lower concentration levels than in most environmental studies [8,32]. Such effects have given rise to numerous concerns since their presence in the biosphere has been topical.
Specifically, PAEs have been detected in such aqueous matrices as lakes [3,15], municipal wastewater effluents [24,33,34,35,36,37], rivers [19,37,38,39,40], dam catchments [38] and drinking water, among others [41,42,43,44,45]. Only a few studies and limited information exist on their occurrence, temporal dynamics, concentration levels and associated risks to aquatic organisms in municipal effluents, rivers and dams in developing, low- and middle-income countries (LMICs), such as South Africa [2,3]. Effluent concentrations of 115.72–208.64 μg/L for DMP and DBP, and 0.17–19.79 μg/L for dicyclohexyl phthalate (DCHP) and DBP in three municipal wastewater treatment works (MWWTWs) were reported in Qingdao, China [35], while concentrations of 0.182–0.748μg/L for DEP and DBP were reported from five MWWTW effluents in Saudi Arabia [34]. In both studies, the authors noted that the MWWTWs located in the industrial areas were the big contributors, with higher total PAE concentrations, because they mainly received and processed industrial wastewaters. In contrast, MWWTWs in residential areas had lower total concentration levels since they received and processed a substantial amount of domestic wastewater. In South Africa, gross pollution by PAEs has been noted as being in the range of 2.7–2488 μg/L for DBP in influents and from below detection limit (BDL) to 17 μg/L upstream, 2.7–2488 μg/L within the MWWTWs, and BDL–25 μg/L for DMP and DBP in the effluents in the Eastern Cape Province [24], and 6 ± 1–7363 ± 119 μg/L for DEP in effluents from various MWWTWs in the Western Cape Province [36]. PAEs have also been detected in river waters from various parts of the world, including, for instance: 0.005–0.135 μg/L for DOP and DBP in the Yangtze River, China [37]; BDL–0.407 μg/L (DEHP) in the Rhone River, France [40]; BDL–0.822 μg/L (DEHP) in the Kaveri River [19] and, most recently, total concentrations of 31.5–95.6 mg/L (DMP, DEP, BBP and DBP) in the Harike Wetland, Ramsar, India, among others [17]. Worryingly, different concentrations and ranges of PAEs in drinking water have been reported worldwide, including 1.07–1.24 μg/L for DBP and DEHP, respectively, in Songkhla Province, Thailand [41]; combined mean values of 2.409 ± 0.391 μg/L for BBP, DBP and DEHP in Tianjin, China [42]; 0.0045–0.607 μg/L for DMP and DEHP in Isfahan, Iran [43]; 1150 ± 280, 90 ± 60 and 280 ± 330 μg/L for DMP, DEP and DBP, respectively, in Lagos, Nigeria [44]; and BDL–0.909 μg/L (DBP) in Madrid, Spain [45]. Notably, even when the PAE concentrations are so low, a dire need still exists for the continuous screening and monitoring of freshwater resources, as the impact of PAEs is cumulative.
The Roodeplaat Dam is one of the catchment areas supplying the surrounding landowners and some parts of the northern areas of City of Tshwane, South Africa, with water for recreational activities, including fishing, agricultural activities and birdwatching, along with serving as a drinking water abstraction source for the Magalies Water Board. Recently, the water quality of the catchment has been generally and severely compromised, in part by the results of anthropogenic activities, including agrochemicals, industrial discharges, domestic waste (including illegal dumping) and municipal effluent from the vicinity [3,8]. The effect of the presence of such pollutants is an ongoing stench in the dam’s surrounding areas, accompanied by the threat to the survival of aquatic organisms and the possibility of dire consequences for human health that depend on this water source [2,3,8]. Accordingly, the present study was conceptualised to assess the temporal dynamics and the ecotoxicological risk of PAEs in municipal effluents, rivers and dam catchments. Although many studies exist on the occurrence and toxicological risk of PAEs worldwide [3,8,19,46,47,48], of which a few have been undertaken in South Africa [24,36,49], to the authors’ knowledge, this is the first catchment-wide assessment study to be pursued, in terms of both design and execution, to monitor and map the spatiotemporal patterns of 10 PAEs (Table 1). The patterns concerned occur in different aqueous environments, specifically ranging from municipal effluent discharges and associated rivers to the dam catchment. The study is also the first to conduct a toxicological risk assessment of aquatic organisms in the Tshwane Metropolis, Gauteng Province, South Africa. Thus, the findings of the present study provide insight into the occurrence and monitoring of PAEs, with the main quest undertaken being to safeguard freshwater quality, including the intrinsic values of the environment, human health and aquatic life. Finally, the findings made should serve to assist in forearming water purification plants and farmers as to the concentrations of PAEs present in their raw water, hence motivating them to adopt the right water treatment technologies, so as to be able to tackle the upcoming loads of pollutants.

2. Materials and Methods

2.1. Target PAE Selection

A total of 10 target PAEs were investigated in the collected water samples, namely from two MWWTWs’ effluents, three rivers and a dam catchment. The selection of PAEs was based on their studied ecotoxicological health effects on aquatic organisms, in terms of the prevalence and frequency of detection (FD) in various water systems worldwide. The appraised PAEs are provided in Table 1, together with their chemical properties and some of the most common applications concerned with them [2]. In addition, the above is informed by common practices and lifestyles within the catchment area.

2.2. Chemicals

Diisobutyl phthalate, 100 mg; Diisodecyl phthalate, 100 mg; Diisononyl phthalate, 50 mg; Dihexyl phthalate, 250 mg; Diphenyl phthalate, 25 g; six priority pollutants/PAEs (EPA Phthalate Esters Mix, 2000 µg/mL each component in methanol) containing Dimethyl phthalate, Diethyl phthalate, Dibutyl phthalate, Benzyl butyl phthalate, Di-n-octyl phthalate and Bis(2-ethylhexyl) phthalate; Benzyl benzoate (internal standard); anhydrous sodium sulphate; acetone, silica gel (high-purity grade, pore size 60 A, 70–230 mesh) and sulphuric acid. Analytical grade (99% purity) dichloromethane and methanol solvents were used. All chemicals used in this research work were purchased from Merck Chemicals (Johannesburg) and Sigma Aldrich (Pty) Ltd. (Lethabong), both in South Africa.

2.3. Study Area and Sampling

The present study was carried out within the City of Tshwane Metropolitan Municipality in Gauteng Province, Republic of South Africa, as shown in Figure 1. The metropolitan municipality, which forms the local government in the northern Gauteng Province within the country, covers an area of about 6298 km2 and is centred on the city of Tshwane, formerly Pretoria, together with the surrounding towns and localities.
The sampling points were strategically chosen from the most accessible and safest representative locations, taking into consideration the anthropogenic pollution sources involved, with the coordinates of the points being recorded using GARMIN Extrex 10 GPS. In particular, water samples were collected from the following sampling points as described in Table 2.
A grab sampling technique was used to collect the water samples from the designated sampling points into 1 L amber glass bottles. Prior to use, the bottles were first double rinsed with water samples, and then immersed to about 5 cm below the water surface, until the bottle filled up to the mark. To preserve the samples concerned, an aliquot of about 2 mL concentrated sulphuric acid was added to the water, after which the bottle was tightly sealed [3,17,39]. Some physicochemical properties, such as the pH, electrical conductivity (EC), dissolved oxygen and temperature, of the collected water samples, were recorded on site, using a Hanna HI 9828 Multiparameter Water Quality Portable Meter from South Africa. The acid-treated samples were kept in a cool-box with ice, so as to maintain their integrity and were transported to the laboratory, where they were kept in the fridge at −4 °C, prior to extraction [3,17,39]. Water samples were collected once a month for a period of six months, throughout both the dry and the wet seasons. The samples concerned were extracted in triplicate, for a total number of 126 samples for analysis.

2.4. Liquid–Liquid Extraction Process and Extracts Clean-Up

Liquid–liquid extraction method, with a solvent mixture of 1:1 dichloromethane and methanol (DCM/MeOH) [3,17,39], which has traditionally been used for the extraction of lipophilic compounds in aquatic medium, was employed; a 100 mL measure of acidified (concentrated sulphuric acid) collected water sample was measured into a 500 mL separating funnel, after which 15 mL extracting solvent mixture (1:1 DCM/MeOH) was also added to the separating funnel. The mixture was vigorously shaken for about 5 min and left to stand for around 2 min, so as to allow for the upper aqueous layer to separate from the bottom organic layer [3,17,39]. The lower organic layer was them collected into a 250 mL round-bottomed flask. This process was repeated three times to ensure maximum extraction of PAEs.
The combined collected organic phases were reduced to about 5 mL, using a rotary evaporator, before being cleaned-up by silica gel column adsorption chromatography. The chromatographic glass column was prepared by packing it with 5 g of activated silica gel and about 1 g of anhydrous sodium sulphate, placed on top of the silica gel, to absorb any excess water from the collected organic phases. The prepared chromatographic column was saturated by pre-eluting it with 15 mL of 1:1 DCM/MeOH. The reduced 5 mL extracts were then poured into the chromatographic column, where they were allowed to sink below the sodium sulphate layer. The extracts were eluted with 2 × 10 mL portions of 1:1 DCM/MeOH. The eluents were then collected and concentrated to about 1.5 mL by the rotary evaporator, transferred to 2 mL amber glass vials for gas chromatography–flame ionisation detector (GC–FID) analysis [3,38,39].

2.5. GC–FID Analysis

A Clarus 600 Gas Chromatograph, fitted with a 30 m × 0.25 mm × 0.25 µm (length, inner diameter, film thickness) Elite-5 capillary column connected with flame ionisation detector, linked to an autosampler and powered by TotalChrom 6.3.2 software, manufactured by PerkinElmer Singapore Pte Ltd. (Sinapore), in Tukang Innovation Grove supplied by PerkinElmer South Africa (Pty) Ltd. (Midrand, South Africa), was used in the detection and quantification of the PAEs found to be present in water samples. Such a process was previously successfully applied for PAE analysis in the case of food samples [50]. The GC–FID was then optimised and utilised for PAE analysis. The injector and detector temperatures were kept at 250 °C and 300 °C, respectively. The GC oven was initially kept at 120 °C for 1 min, ramped from 120 to 250 °C at 20 °C/min, and then held for another minute, ramped again from 250 to 290 °C at 15 °C/min, and finally kept for another minute, with a constant flow of carrier gas (helium) kept at 1.33 mL/min for optimisation, with a total run time of 12.17 min.

2.6. Quantification, Detection Limit and Recoveries

Quantification of PAEs was performed, using an internal standard based on the response factors related to the internal standard on a four-point calibration curve for individual compounds. Benzyl benzoate (internal standard) was spiked into the sample extracts and used for quantification of the PAEs. The GC–FID was calibrated by injecting 1 µL of a solution containing 10 individual PAE standards at four different concentration levels (0.2, 0.4, 0.6 and 0.8 μg/mL) with r2 of greater than 0.998 for all PAE homologues. In the absence of the certified reference materials (CRMs) of the water samples, the standard addition method was adopted. The process entailed adding 1 µg/mL of the PAE standards mixture into 6 × 100 mL environmental water samples (n = 6). Spiked water samples were extracted and evaluated for PAEs at varying retention times. Percentage recoveries and standard deviations (STDevs) were calculated using the average concentrations recovered for individual PAE standards. The instrument detection limits (IDLs) were calculated using Equation (1).
IDL = 3.3σ/S,
where σ is the STDev of the response factor and S is the slope of the calibration curve concerned [12]. The extraction and clean-up processes, as described in the previous sections for the analysis of collected water samples, were also applied, in line with the set quality assurance experimental methods used. Avoidance of plastic apparatus and utensil contact with the samples concerned was ensured throughout all the processes during both the experimental and the analytical procedures conducted. Doing so was required to prevent and/or minimise cross-contamination of the samples with PAEs from the PVC-containing plastics. However, cross contamination of the samples by PAEs from the atmospheric environment and reagents could possibly occur but ultra-care was taken to prevent that from happening.

2.7. Data Analysis, Quality Control and Quality Assurance

The samples collected were extracted and analysed in triplicate, with the results obtained being reported as mean values with STDevs. Data normality test was carried out using GraphPad Prism 8.0.1 software and found to have no significant differences with p < 0.05. Microsoft Excel was used for the descriptive statistics and for the plotting of figures. Standard reference materials were used for the identification and quantification of the PAEs. Extraction methods’ recovery rates, instrument’s response factors, slope of the calibration curves, and IDL (obtained using Equation (1)) of PAE homologues are provided in Table 3.
The percentage recoveries of the appraised PAEs ranged from 50.7 ± 0.84 to 80.6 ± 3.29 for DPP and DiDP in spiked environmental water samples, all with STDevs of less than 5%. However, slightly lower recovery ranges of from 33 to 118% [19], and 47 to 125% have been reported [51]. Furthermore, such recoveries are comparable to those reported by several other researchers, with the rates concerned ranging from 83 to 115% [3], 81 to 122% [39], 54.9 to 94.6% [52], and 92 to 102% [53], in relation to the analysis of PAEs found in various different aquatic ecosystems. The recoveries obtained in the present study are, therefore, quite acceptable and applicable for PAEs analysis and quantification, with minor concerns being registered for DPP (51%), DEP (52%) and DHP (57%). The relatively low recovery of some PAEs found in spiked water samples might be due to added standard loss during the extraction and clean-up processes used [39].
In the current study, the appraised PAE IDLs ranged between 5.92 ng/L for DHP and 32.6 ng/L for DMP (Table 3). The IDLs obtained were well within some of the ranges found and/or were comparable to those reported by other authors for PAE analysis in water samples worldwide: 1–21 ng/L in the Kaveri River, India [19]; 27.2–59.8 ng/L in the Jukskei River, South Africa [39]; 6–178 ng/L in wastewater and pond water, Spain [54]; 1–21 ng/L in Asan Lake, Korea [12]; and 9–78 ng/L in Poyang Lake [15], 3–33 ng/L in the Baoding pond [16], and 1–75 ng/L in the Pearl River Delta [55], all in China, and 17–35 ng/L in surface water, Iran [56], with the exception of the very low IDL range of 0.2–1 ng/L reported in Lake Victoria, Uganda [3]. During analysis, solvent blanks were processed along with each extraction round of each 20 samples, so as to mitigate against carryover and background contamination, due to multiple injections. Additionally, no PAE peaks were detected during the solvent blank runs, and this could suggest that the GC-FID instrument was stable, and no cross contamination occurred between the samples.

2.8. Potential Ecotoxicological Risk Assessment

The assessment of potential ecotoxicological risks of PAEs to aquatic organisms in the study area was conducted based on the risk quotient (RQ) method (where RQ < 0.1, minimal risk; 0.1 ≤ RQ < 1, median risk; and RQ ≥ 1, high risk), in accordance with the guidelines laid down in the European Commission’s Technical Guidance Document on Risk Assessment [57], and thoroughly explained in [3,19]. The RQs of individual PAE homologues were calculated, based on the worst-case scenario, as the ratio of the ‘maximum measured concentration (MEC)’ to the ‘predicted no-effect concentration (PNEC)’, which are derived from toxicological data [21], as indicated in Equation (2).
RQ = MEC/PNEC,
where RQ is the risk quotient (the ratio of a point estimate of exposure and a point estimate of effects), while MEC is the maximum measured environmental concentration, which were obtained from the current study, whereas the PNEC values were derived from the available acute and chronic toxicity data present in the literature, as provided in Table 4 [21]. The PNEC, which is the concentration at which no adverse effects are expected to occur [57], is obtained as the ratio of the lowest chronic ‘no observed effect concentration (NOEC)’, EL50 or LC50 for the indicator species that is most sensitive to the appropriate assessment factor. Assessment factors of 50 (fish, and/or Daphnia and/or algae) and 10 (usually fish, Daphnia and algae) for the available NOEC values for species representing two and three trophic levels, respectively, were applied [3,19,21]. Since the derived PNECs were above the obtained IDL for all PAE homologues, the authors were successfully able to quantify environmental concentrations at much lower concentrations than the PNECs.

3. Results and Discussion

3.1. Concentrations of PAEs in Studied MWWTW Effluents, Rivers and the Dam Catchment

All appraised PAEs were, altogether, ubiquitous at quantifiable concentrations. For the entire study period, the minimum and maximum concentrations of 0.02–37.9 μg/L for DOP and DBP, respectively, were noted. A summary of the PAE concentration levels in the sampled localities is shown in Table 5.
As shown in Table 5, FDs of 84% and above were observed for each PAE homologue concerned. However, only DBP and DOP were found to have 100% FD in the analysed samples, with the rest of the PAEs not being detected on at least one occasion during the study period. Such frequencies resemble the 100% FD obtained for the four analysed PAEs (DMP, DEP, DBP and DEHP) in water samples from Lake Victoria in Uganda [3] and found in some rivers and dams in Venda [38], as well as in the Jukskei River in South Africa [39], and for six analysed PAEs (DMP, DEP, DBP, DEHP, DOP and BBP) from three MWWTWs in Qingdao, China [35]. However, some slightly lower FD (74%) has been reported for similar PAEs in the MWWTW effluents in Saudi Arabia [34]. The overall maximum Σ10PAEs consisting of 63.2 μg/L, with combined mean values of 13.6 ± 9.82 μg/L, were noted for the entire study period. The recorded mean values for individual PAEs varied between 0.121 ± 0.129 and 7.45 ± 4.93 μg/L for DiNP and DBP, with those for DBP being significantly higher than for the former, which is consistent with many other aqueous studies undertaken worldwide [24,34,35,38,52].

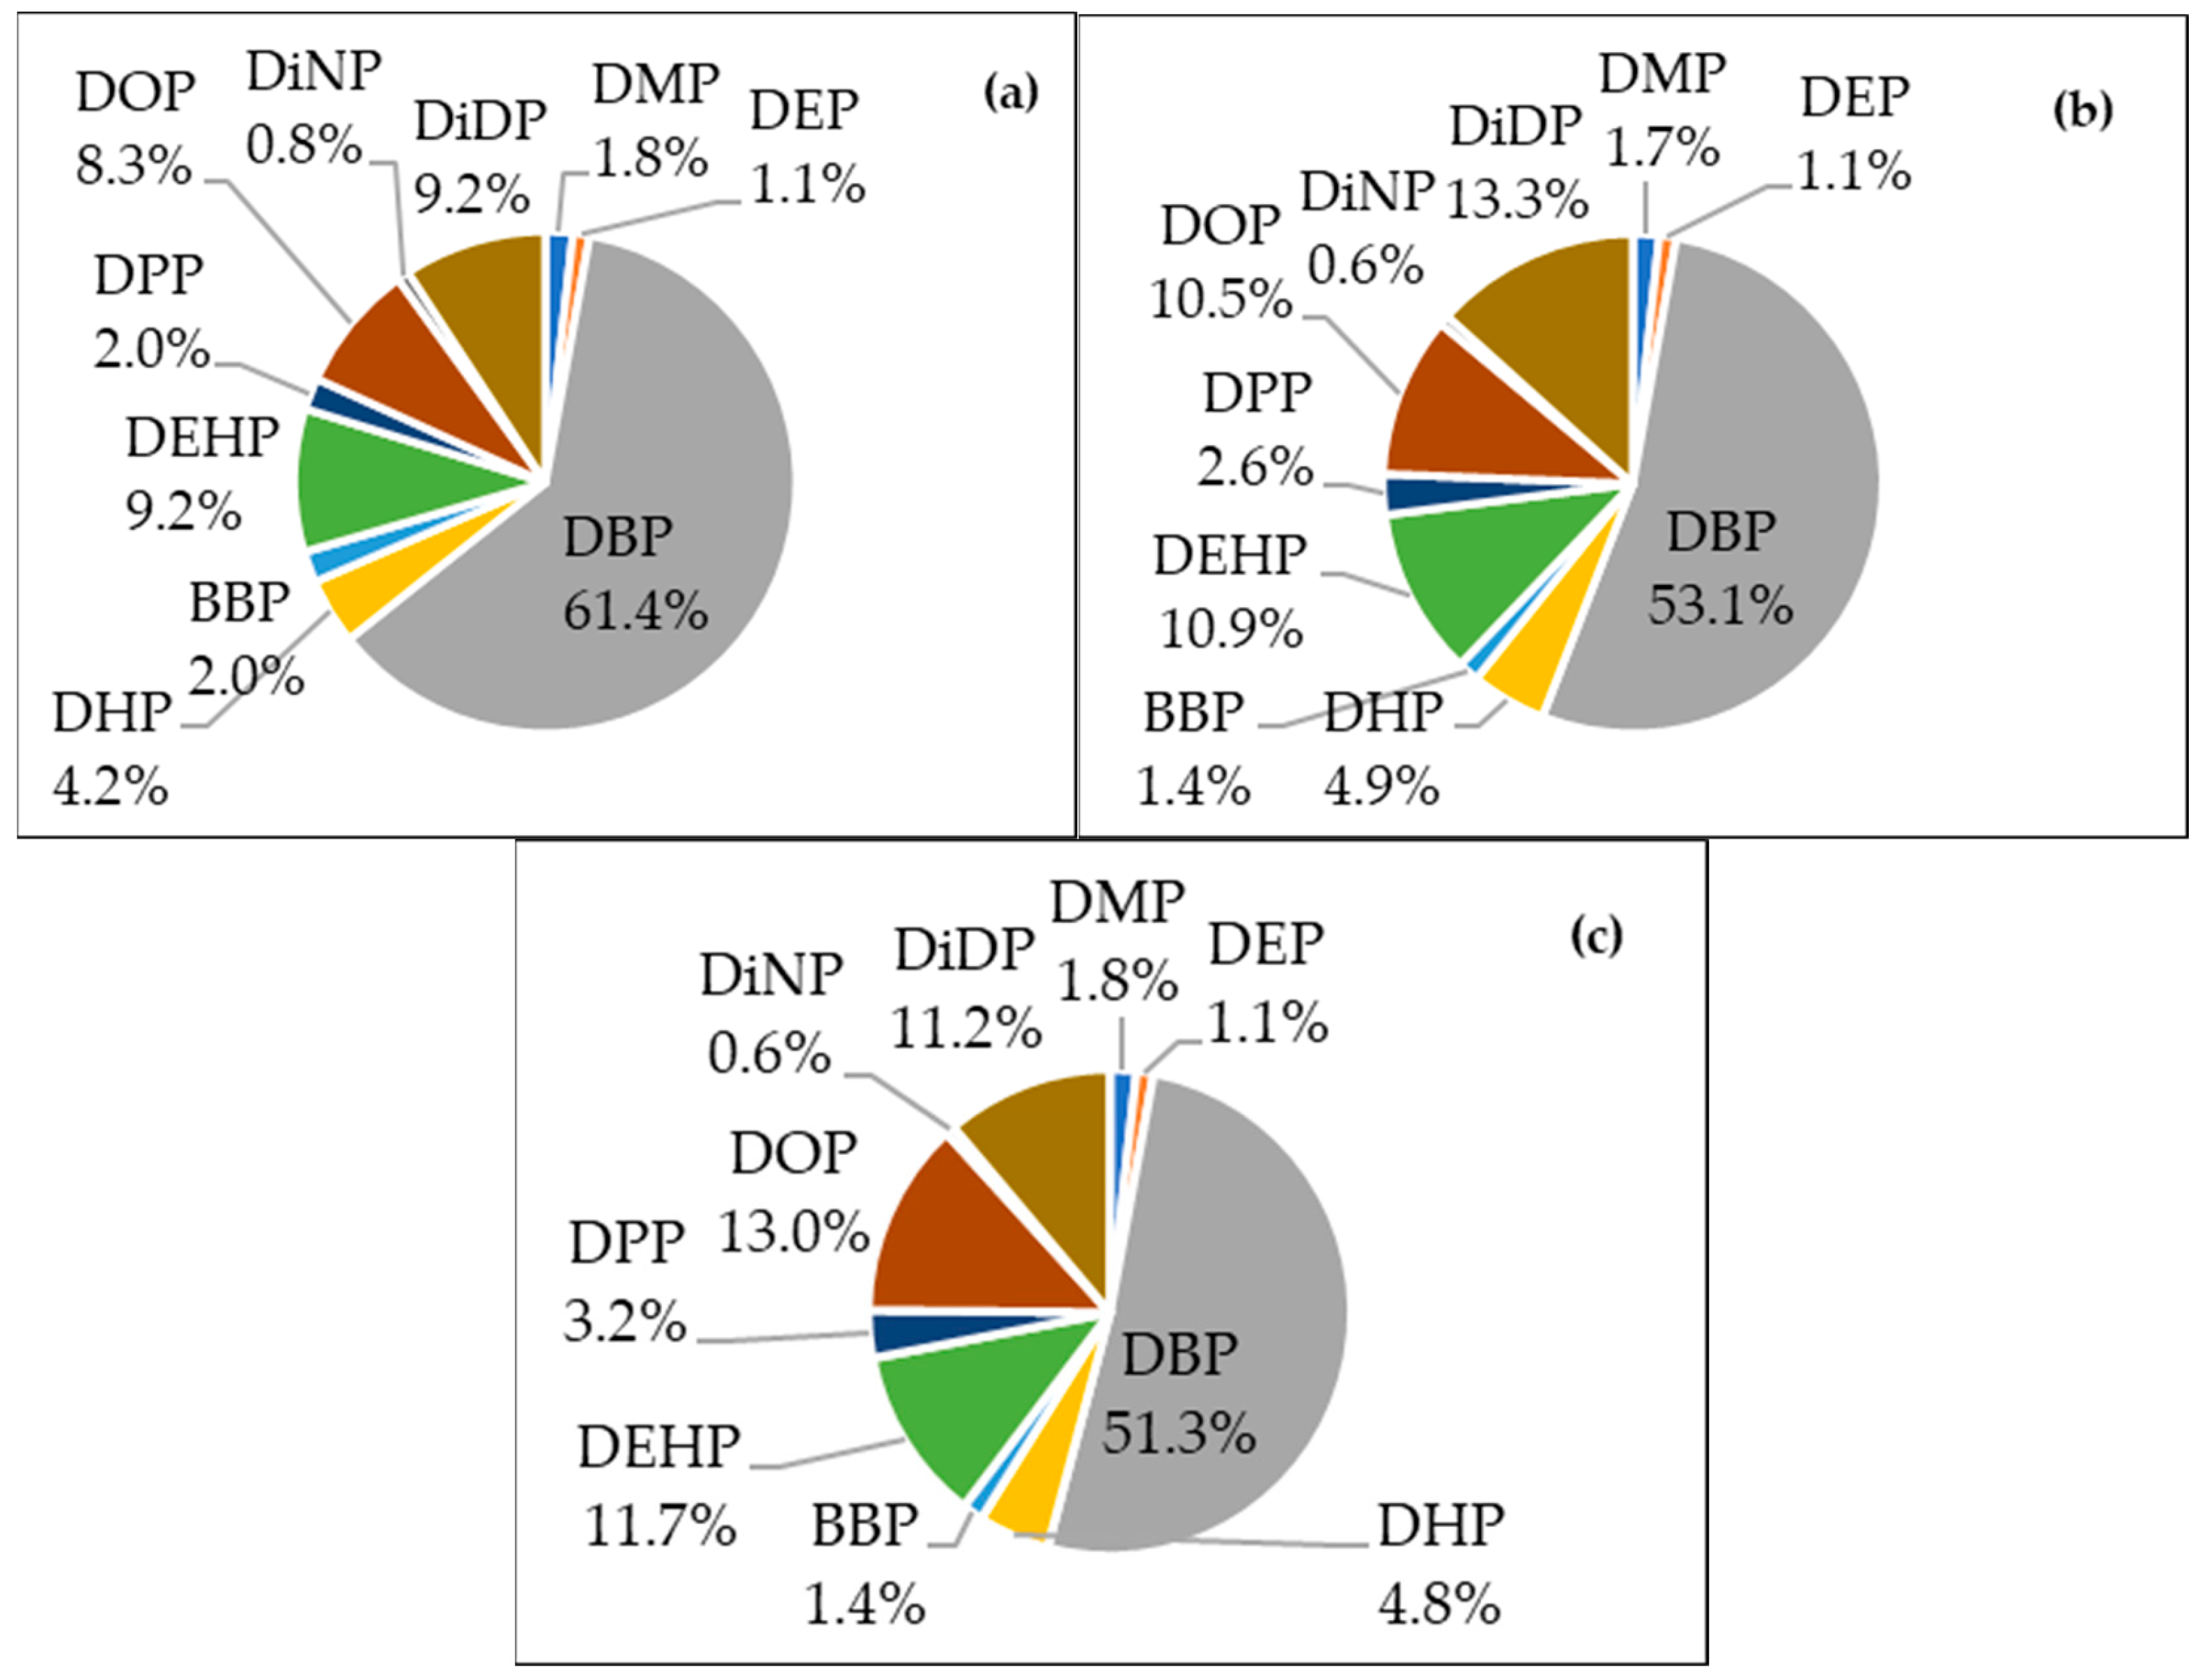
3.1.1. Concentrations of PAEs in Studied MWWTW Effluents

All appraised PAEs were ubiquitous at quantifiable concentrations in effluents from both studied MWWTWs. The total percentages (for the six-month study period) of the PAEs in effluents from MWWTW A (a), MWWTW B (b), and the MWWTW canal (c) are shown in Figure 2.
Figure 2 summarises the overall total percentages of individual PAEs in effluents, along with their differences from the two studied MWWTWs and from the canal for the six-month study period. As shown in Figure 2a, the prominent sequence registered the following arrangement: 61.4 > 9.2 > 9.2 > 8.3 > 4.2 > 2.0 > 2.0 > 1.8 > 1.1 > 0.8% for DBP > DiDP > DEHP > DOP > DHP > DPP > BBP > DMP > DEP > DiNP, with DBP, DiDP, DEHP and DOP comprising >80% of the ∑PAEs in MWWTW A. DBP was highly dominant, with just over 60% of the ∑PAEs, followed by DiDP, DEHP and DOP, with contributions of just less than 10% each. DHP, DPP and BBP contributed less than 5% each to the total concentration with minor (about 1%) contributions from DEP and DiNP.
A similar trend was observed in Figure 2b, with the prominent sequence registering the following arrangement: 53.1 > 13.3 > 10.9 > 10.5 > 4.9 > 2.6 > 1.7 > 1.4 > 1.1 > 0.6% for DBP > DEHP > DiDP > DOP > DHP > DPP > DMP > BBP > DEP > DiNP, again with DBP, DiDP, DEHP and DOP comprising >80% of the ∑PAEs in MWWTW B. DBP was still very dominant, with a slight decline to just over 50% of the ∑PAEs, followed by DEHP, DiDP and DOP, with contributions of just over 10% each. However, unlike the effluents from MWWTW A, DiDP accounted for slightly more than did DEHP and DBP, which showed a significant decline. Notably, all but DMP and BBP showed a slight increase, with the concentration of DEP remaining unchanged.
Furthermore, the four PAE homologues also contributed >80% of the ∑PAEs in the MWWTW canal, as illustrated in Figure 2c. The prominent sequence registered the following arrangement: 51.3 > 13.0 > 11.7 > 11.2 > 4.8 > 3.2 > 1.8 > 1.4 > 1.1 > 0.6% for DBP > DEHP > DiDP > DOP > DHP > DPP > DMP > BBP > DEP > DiNP. DBP, which remained a very dominant homologue, with just over 50% of the ∑PAEs, was followed by DEHP, DIDP and DOP, with contributions of about 10% each. However, DBP, DEHP and DHP showed a slight decline in contrast to the slight increase in DiDP, DOP, DPP and DMP. In this instance, the minimal contributors of BBP, DEP and DiNP remained unchanged. Overall, the four PAE homologues remained the major contributors to both the MWWTWs and the canal, with DBP showing a slight decline (MWWTW A > MWWTW B > MWWTW canal) but remaining the most abundant compound. Generally, MWWTW A registered slightly lower concentrations for all PAEs (especially in the case of the four dominant PAE homologues), but the concentration of DBP was significantly higher when compared to the concentrations present in the MWWTW B and MWWTW canal samples.
An interesting variation in the profile of PAEs in municipal effluents was noted. The average concentrations of PAEs obtained in the studied effluents are shown in Table 6.
Specifically, the concentrations ranged between 0.013 ± 0.0 μg/L for DMP and 14.7 ± 4.17 μg/L for DBP in the MWWTW canal and MWWTW A, respectively, during the study period. Overall, the highest maximum concentrations of 4.74 ± 0.82, 2.27 ± 0.4, 1.15 ± 0.19, 1.07 ± 0.55, 0.213 ± 0.01 and 0.184 ± 0.07 μg/L for DiDP, DPP, DEHP, DPP, DHP and DiNP, respectively, were found in the effluents from MWWTW B, with 14.7 ± 4.17, 1.93 ± 1.36, 0.79 ± 1.0 and 0.357 ± 0.02 μg/L for DBP, DOP, BBP and DMP being found in the case of MWWTW A. The above clearly suggests that the current wastewater treatment processes in the MWWTWs are either incapable of completely treating the PAEs present, or the influents may have been highly contaminated [24,35]. As a result, unit process monitoring for PAEs in MWWTWs is desirable. Furthermore, the effluents from both of the MWWTWs were observed to be somewhat polluted, with roughly similar PAE concentrations. However, maximum concentrations of 3.11 ± 1.13, 1.59 ± 0.63, 0.236 ± 0.03 and 0.401 ± 0.07 μg/L for DOP, DPP, DMP and DEP, respectively, were higher than those present in both the MWWTW B and the MWWTW canal, which could be attributed to the possible accumulation of PAE homologues in the adjacent water-holding catchment, between the MWWTW B and the canal, over time [24]. Additionally, the discrepancies in PAE concentrations from the two MWWTWs might have been influenced by the type and extent of the polluted wastewaters received, and the performance of each MWWTW concerned. As per the PAEs’ average concentrations shown in Table 6, the prominent sequence for most polluted catchment registered the following arrangement: MMWTW canal > MWWTW A > MWWTW B, with no significant differences (p < 0.0001) between them.
The appraised PAEs’ concentrations were found to be slightly higher than the average concentrations of 0.748, 0.468, 0.388, 0.228, 0.195 and 0.182 μg/L for the six priority PAEs (DBP, DEHP, BBP, DMP, DOP and DEP, respectively) reported in the effluents from five MWWTWs in Saudi Arabia [34], except for DBP which was extremely high. Additionally, the concentrations obtained were more comparable to the average concentrations of DMP (5.49), DEP (2.86), DBP (8.74), BBP (1.14), DCHP (3.84) and DEHP (1.03) μg/L, with no detection for DOP from the Chengyang MWWTW; DMP (1.93), DEP (2.86), DBP (19.79), BBP (2.31), DCHP (3.78), DEHP (0.38) and DOP (9.40) μg/L from the Licum River MWWTW; DMP (5.07), DEP (8.35), DBP (4.32), DCHP (0.17), DOP (3.28) and DHXP (3.79) μg/L from the Haibo River MWWTW in Qingdao, China [35]; DMP (2.22), DEP (4.35), DBP (8.88), BBP (5.10), DEHP (13.27) and DOP (4.19) μg/L reported in effluents from the four MWWPWs located in the Amathole District Municipality, Eastern Cape Province, South Africa [24]. However, extremely high concentrations of 310 ± 1, 7363 ± 119, 346 ± 7, 391 ± 2 and 6 ± 1 μg/L for DEP, DBP, BBP, DEHP and DOP, respectively, were reported in effluents from three MWWTWs in the Western Cape Province, South Africa [36], with only the concentration of DOP being comparable to that found in the current study. It was noted that MWWTWs located in industrial areas tend to be the major contributors to PAE concentrations in the receiving water bodies, mainly because they receive and process the industrial wastewaters. Thus, the low concentrations of PAEs present in the current study might have been influenced by the (residential) location of the MWWTWs, as the wastewater treatment works concerned mostly receive and process domestic wastewater [24,34,35].

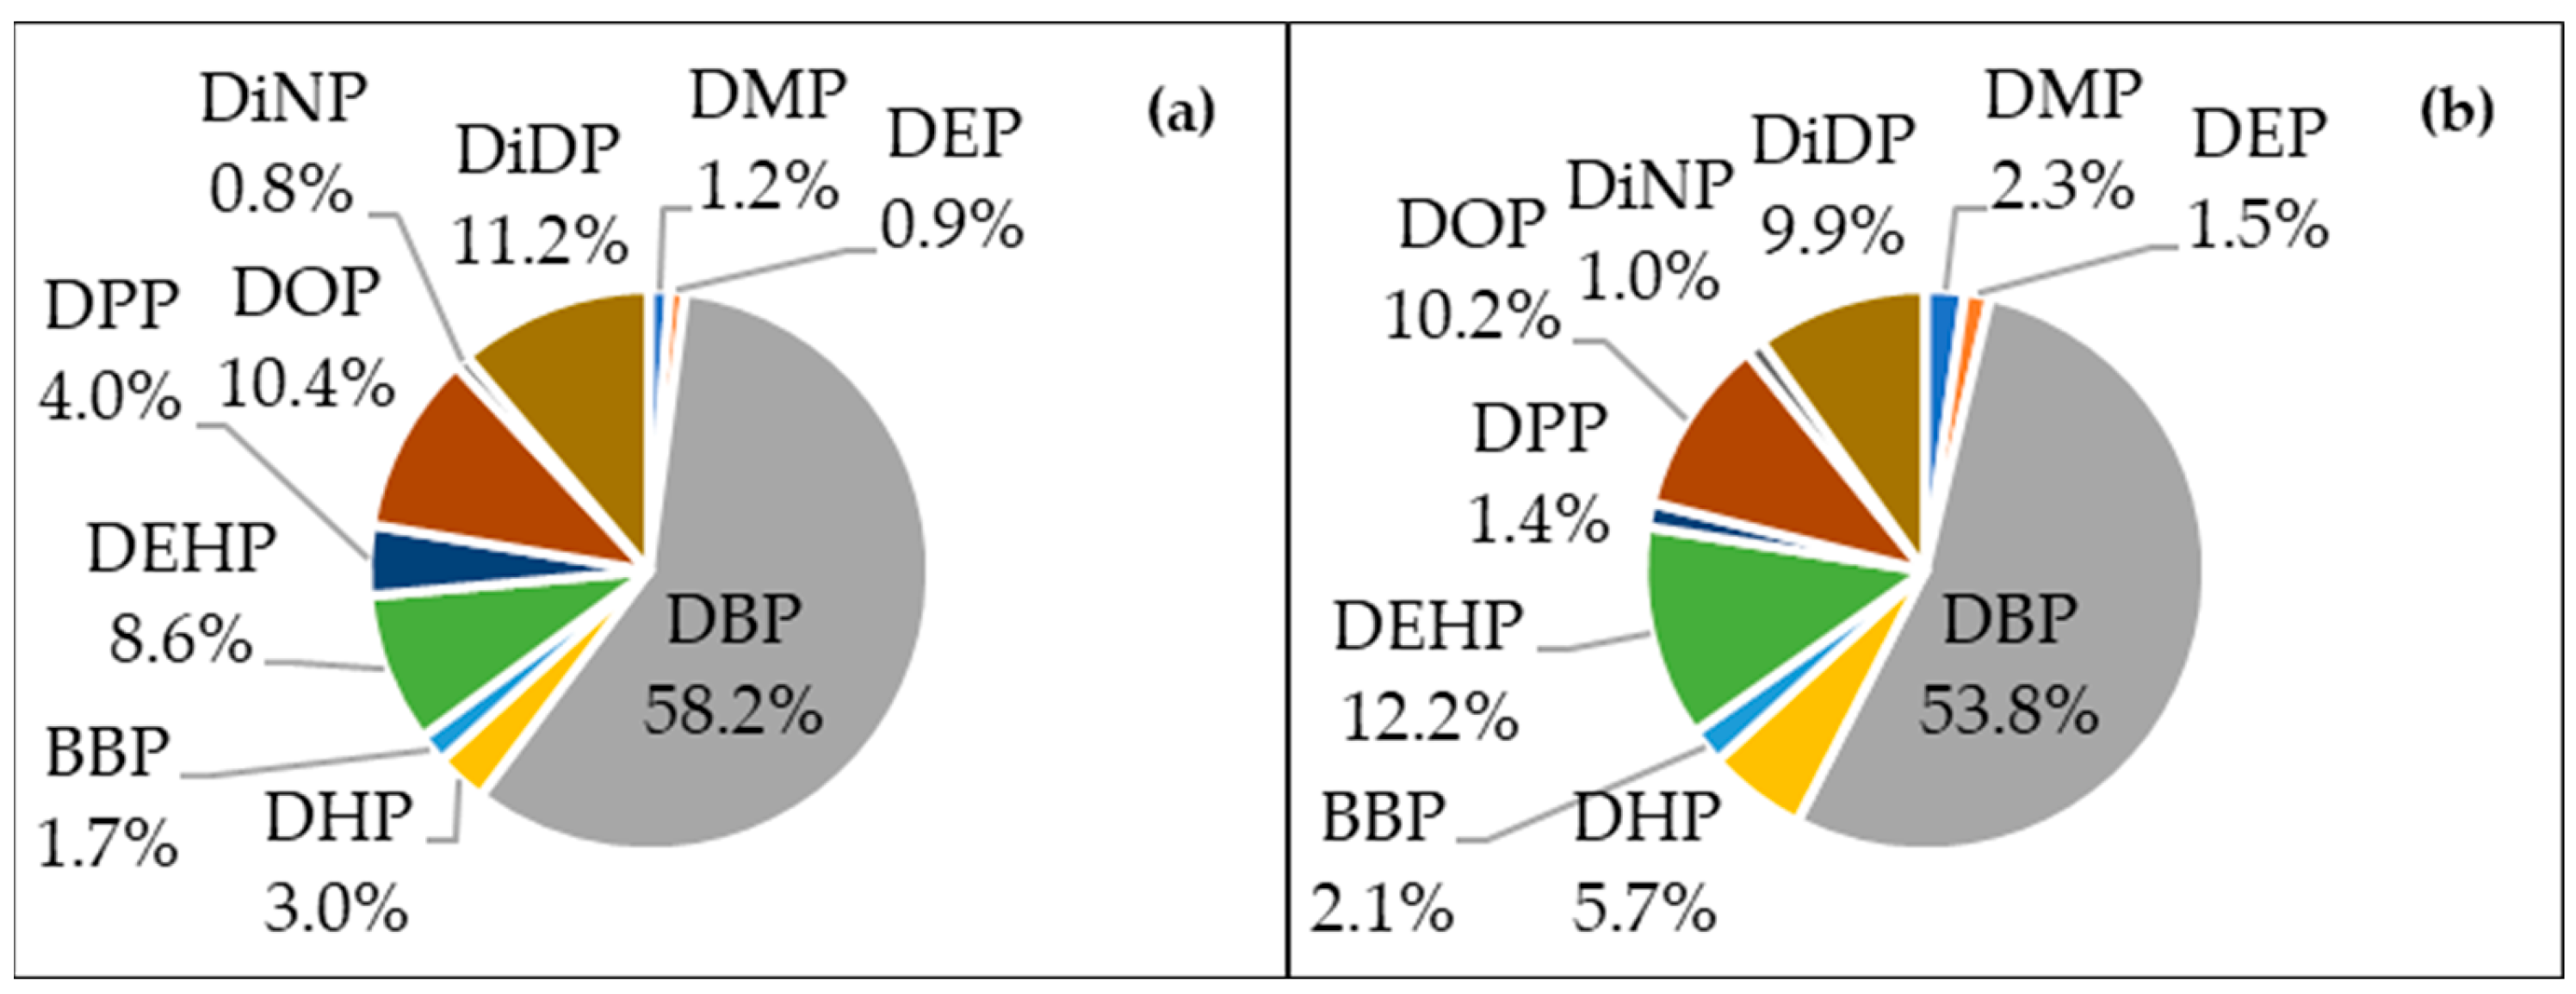
3.1.2. Concentrations of PAEs in Water Samples within the Studied Rivers

The total percentages (for the six-month study period) of the PAEs in samples from the Mamelodi River (a), the Baviaanspoort River (b) and the Moreleta River (c) are shown in Figure 3.
Figure 3 summarises the overall total percentages of individual PAEs in water samples from the three rivers studied, for the six-month study period. As shown in Figure 3a, the prominent sequence registered the following arrangement: 60.1 > 9.9 > 8.7 > 7.9 > 3.9 > 3.6 > 2.4 > 1.4 > 1.1 > 1.1% for DBP > DEHP > DOP > DiDP > DPP > DHP > BBP > DMP > DiNP > DEP, with DBP, DEHP, DOP and DiDP comprising >80% in the case of the ∑PAEs present in the Mamelodi River. DBP was overly dominant, with just over 60% of the ∑PAEs, followed by DiDP, DEHP and DOP, whose contributions were slightly under 10% each. DHP contributed to a certain extent with 5%, which was closely followed by BBP, DPP and DMP with DEP and DiNP, whose contributions were substantially less, at about 1%.
A similar trend was observed in Figure 3b, with the prominent sequence registering the following arrangement: 56.1 > 12.0 > 10.3 > 9.2 > 4.7 > 2.2 > 1.6 > 1.5 > 1.2 > 1.2% for DBP > DOP > DiDP > DEHP > DHP > DMP > DPP > DiNP > BBP > DEP, again with DBP, DOP, DiDP and DEHP comprising >80% in the case of the ∑PAEs present in Baviaanspoort River. DBP was, once again, the dominant PAE homologue, with a slight decline to just over 55% of the ∑PAEs, followed by DOP, DiDP and DEHP, with each contributing about 10% each. However, unlike in the Mamelodi River, DOP and DiDP accounted for slightly more than did DEHP, with just over 10% each, and with DBP showing a significant decline. Notably, DOP, DiDP and DHP showed significant increases, while DMP and DEP and DiNP each showed a marginal increase, with DPP and BBP showing some decrease.
Similar to the case of the other rivers, the four major PAE homologues comprised >80% of the ∑PAEs in the Moreleta River, as shown in Figure 3c. The prominent sequence registered the following arrangement: 56.4 > 11.1 > 10.1 > 8.3 > 5.0 > 3.3 > 2.0 > 1.9 > 1.3 > 0.8% for DBP > DiDP > DEHP > DOP > DHP > BBP > DPP > DMP > DEP > DiNP. Still very dominant, to the extent of just over 55% of the ∑PAEs, DBP showed a marginal increase compared to the extent of its presence in the Baviaanspoort River. Additionally, the other PAEs recorded slight increases (DiDP, DEHP, DHP, BBP, DPP and DEP), marginal declines (DMP and DiNP) and a significant decline for DOP. Overall, the four PAE homologues remained the major contributors amongst the rivers concerned, with DBP being slightly higher in the Mamelodi River (with it being roughly the same in the case of the Baviaanspoort River and the Moreleta River), while remaining the most abundant compound. Furthermore, the Mamelodi River contained slightly higher concentrations for all DBP, DPP and DEHP present (but less than were present in the Moreleta River), with lower concentrations being recorded for the other PAEs. The amount of DiDP, DEHP, DHP and BBP were found to be slightly higher in the Moreleta River, while the amount of DOP present in the Baviaanspoort River was found to be significantly higher than the amount present in the Mamelodi River.
As in the case of MWWTWs, an interesting variation in the profile of the PAEs was noted, and the average concentrations of PAEs obtained in the studied rivers are shown in Table 7.
The quantified concentrations in the studied rivers varied between 0.003 ± 0.0 μg/L for DHP and 27.4 ± 10.5 μg/L for DBP in the Moreleta and Mamelodi rivers, respectively. The maximum high concentrations of 27.4 ± 10.5, 2.95 ± 1.12, 2.72 ± 0.87, 1.11 ± 0.21 and 0.29 ± 0.50 μg/L for DBP, DEHP, DiDP, DHP and DEP, respectively, were found in the Mamelodi River, with 1.77 ± 0.471, 0.499 ± 0.39 and 0.399 ± 0.061 μg/L being recorded for the BBP, DPP and DMP present in the Moreleta River. High concentrations of 4.09 ± 1.45 and 0.628 ± 0.174 μg/L, for both DOP and DiNP, were noted only in the Baviaanspoort River. Thus, unsurprisingly, as per the PAEs’ average concentrations shown in Table 7, the river concerned was also noted as being the most polluted, in accordance with the prominent sequence for most of the polluted rivers registered, namely Mamelodi River > Baviaanspoort River > Moreleta River, with no significant differences (p < 0.0001) between them.
Furthermore, the concentrations obtained were slightly lower than the 0.03–20.3 (DMP), 0.03–38 (DEP), 0.04–82.3 (DBP) and 5.3–90.4 μg/L (DEHP), with 100% FD for all obtained from the Buffalo, Swartkops, Umtata and Keiskamma rivers in East London, Eastern Cape Province, South Africa [49], and significantly lower than the 160–3860 (DEP), 300–1890 (DEHP) and 3080–10,170 μg/L (DBP) with 100% FD for all PAEs involved that were obtained in the Nzhelele, Mutshindudi, Dzwerani, Lotanyanda, Xikundu, Mutale, Luvuvhu and Dzindi rivers in Venda, Limpopo Province [38], South Africa. However, similar and comparable concentrations in the range of 0.67–6.15, 0.36–10.67, 0.01–16.05 and 0.02–15.36 μg/L were reported for DBP, DEHP, DEP and DMP (all 100% FD), respectively, in the Jukskei River, Gauteng Province, South Africa, with a seasonal variation of slightly higher concentrations in winter than in summer [39]. Apart from the extremely high concentrations for the studied PAEs that were reported in the Ogun River, Nigeria [58], and the low concentrations thereof found in the Selangor River, Malaysia [59]; the Kaveri River, India [19]; the Yangtze River, China [37]; and the Rhone River in France [40], the concentrations obtained in the current study are also comparable to many other studies from rivers worldwide [2,8,19,35], with only the concentrations of DBP (0.472–37.9 μg/L) present being found to be significantly higher than in most of the mentioned studies undertaken. Furthermore, only limited studies have been conducted, so far, for the presence of both DHP and DiNP [12,60,61], with no study, as yet, having been conducted for the presence of DiDP in aquatic ecosystems. Thus, the present study has exceeded the usual six priority PAEs (as classified by USEPA) that are frequently studied, so as to include the additional PAEs (namely DHP, DiNP and DiDP) that have also recently emerged to become of prime concern, with their ubiquity being evident through their continuous FDs of 78, 83 and 100% for DHP, DiNP and DiDP, respectively.

3.1.3. Concentrations of PAEs within the Roodeplaat Dam Catchment

The profiling of the PAEs in the Roodeplaat Dam (which is also used for raw water abstraction for drinking water treatment works purposes) as the last receiving terminal for natural water distribution system was performed, with the results obtained for the six-month study period shown in Figure 4.
Figure 4 illustrates similar patterns and distributions of PAEs as observed in the rivers studied, with their MWWTWs with DBP, DEHP, DOP and DiDP still contributing 51.4, 11.1, 11.6 and 11.2%, respectively, to the ∑PAEs, and the four homologues comprising >80% of the total PAEs in the Roodeplaat Dam, with DBP the most abundant compound, with a contribution of just above 50% for the six-month study period. In addition, a significant contribution of just over 10% each was noted for DEHP, DOP and DiDP. However, moderate (DHP, DPP, DMP and BBP) and minimal (DEP and DiNP) contributions from the other PAEs were also observed. The average concentrations of PAEs were in the range of 0.007 ± 0.0 to 8.50 ± 2.99 μg/L for BBP and DBP, with the PAEs appraised registering as ubiquitous within the dam itself, all with 100% FD, apart from DEP (83% FD), DMP, DHP and DiNP (all with an FD of 94% FD). The prominent sequence registered the following arrangement: 51.4 > 13.1 > 11.6 > 11.2 > 4.3 > 2.5 > 1.8 > 1.7 > 1.5 > 1.0% for DBP > DEHP > DOP > DiDP > DHP > DPP > DMP > BBP > DEP > DiNP. Moreover, the concentrations of the appraised PAEs obtained in the present study are comparable to the range of 0.03 and 14.2 μg/L for DMP and DEHP, respectively, for the PAEs (DMP, DEP, DBP and DEHP) reported in the Sandile Dam catchment, East London, Eastern Cape Province [40], with their concentrations being significantly lower than the 3160–3910 (DEP), 3930–5480 (DBP) and 300–1330 (DEHP) μg/L (all with 100% FD) noted in the Marais and Rietvlei dam catchments in Venda, Limpopo Province [38], both in South Africa. PAE studies on dam catchments were seen to be extremely limited, resulting in the current study (in respect of the dam catchments involved) not providing a complete and clear overview of how the related situation fares worldwide. Nonetheless, the concentrations obtained were found, at the time of the current research, to be consistent with many other PAE concentrations reported worldwide from such water catchments as MWWTWs, rivers and lakes, as was earlier discussed.

3.2. Temporospatial Distributions of PAEs in MWWTWs, Rivers and the Dam Catchment

The concentration levels of the analysed PAEs in water samples for both dry and wet seasons are shown in Table 8.
As shown in Table 8, all appraised PAEs were detected in all the MWWTW effluents, rivers and dam during both dry (August 2021 to October 2021) and wet (November 2021 to January 2022) seasons. During this study, the dry and wet seasons represented the winter and summer seasons, respectively. The mean (STDev) concentrations were obtained as the combined averages for each month during the seasons stated. Table 8 reflects that the mean values for the appraised PAE (apart from for DEHP) homologues were slightly higher during the wet season than they were during the dry one with no significant differences (p < 0.0001) between the seasons. PAE concentrations were found to be about two times higher during summer than in winter, in relation to MWWTWs in China, with the authors concluding that the high concentrations obtained could be attributed to the high summer temperatures, which could have accelerated the release and migration of the PAEs involved [33]. However, the highest maximum concentrations for most PAE homologues (DBP, DHP, DEHP, DOP, DiNP and DiDP) were recorded during the dry season, with such concentrations being consistent with those in many other studies [17,39]. Ironically, during the dry season, some PAEs (BBP, DPP and DiNP) were not even detected once. The overall distribution of PAEs per season is illustrated in Figure 5.
As shown in the pie charts provided in Figure 5, similar patterns and distributions of PAEs to those that were observed in the case of the water catchments (rivers, MWWTWs and dam) with DBP, DEHP, DOP and DiDP still being major contributors (>80% of the total PAEs) to the ∑PAEs were also noted during both of the seasons. The prominent sequence registered the following arrangement for the dry season, as illustrated in Figure 5a (58.2 > 11.2 > 10.4 > 8.6 > 4.0 > 3.0 > 1.7 > 1.2 > 0.9 > 0.8% for DBP > DiDP > DOP > DEHP > DPP > DHP > BBP > DMP > DEP > DiNP), and for the wet season, as illustrated in Figure 5b (53.8 > 12.2 > 10.2 > 9.9 > 5.7 > 2.3 > 2.1 > 1.5 > 1.4 > 1.0% for DBP > DEHP > DOP > DiDP > DHP > DMP > BBP > DEP > DPP > DiNP). A significant variation in the profile of the PAEs was noted for the two seasons involved. A notable drop in the concentrations of DBP (approximately 5%), DiDP and DPP, along with a significant increase in the concentrations of DHP and DMP (about twice as much), DEHP (about 4%), DEP and BBP, were noted during the wet season. This seasonal variation could be attributed to the (lack of) run-off (wet vs. dry seasons), which could have aided in the release and migration of traces of these compounds from their main sources, such as agricultural pesticides, leaching from the surrounding illegal dumping, and other anthropogenic activities undertaken in the related residential and upstream areas [33].

3.3. Ecotoxicological Risk Assessment

The RQs of the PAEs present in the municipal effluents, rivers and the dam catchment, as studied in the current research, are shown in Figure 6.
As shown in Figure 6, by using Equation (2) and the values provided in Table 4 and Table 5, the RQs of DBP (RQ = 3.73) and DiDP (RQ = 1.77) suggest that they pose high risk to fish and other aquatic organisms in the aquatic ecosystems studied. In contrast, the RQs of DOP (RQ = 0.91), DEHP (RQ = 0.89), DHP (RQ = 0.5), DiNP (RQ = 0.26) and BBP (RQ = 0.24) suggest the presence of median risk, although the RQs for DEHP and DOP raise concern, with the presence of DMP (RQ = 0.02) and DEP (RQ = 0.01) being unlikely to pose any threat to the aquatic organisms involved. Similar RQs for both DMP and DEP (RQ < 0.1) were reported in the Kaveri River, India [19], in the Yangtze River Delta City, China [37], and, recently, in Lake Victoria, Uganda [3]. However, the findings in the Kaveri River suggested medium risk for DBP (RQ = 0.1) and high risk for DEHP (RQ = 43) and DOP (RQ = 5.6) [19], while those in Lake Victoria suggested high risk for both DEHP (RQ = 4.4) and DBP (RQ = 1.6) [3]. Unlike previous findings [3,19], and the results obtained in the present study, other authors have suggested medium risk for DBP (0.1 ≤ RQ < 1) and high risk for DEHP in relation to algae, crustaceans, fish and other aquatic organisms [62]. Furthermore, DBP, DEHP, DOP, DPP and DiDP concentrations were found to be higher than the water criterion of 3 μg/L recommended by USEPA for the protection of fish and other aquatic life [63]. The above clearly suggests that different PAEs in LMICs across the world, such as South Africa, affect the quality of life in different aquatic organisms, as is evidenced by the varying high RQs of different PAE monologues worldwide. To the current authors’ knowledge, no acute or chronic toxicity data is currently readily available in the literature concerning DPP. Thus, the authors were unable to calculate either its PNEC, or the subsequent RQ for potential ecotoxicological assessment.
Moreover, various PAEs have been reported to cause endocrine disruption in aquatic organisms [8,30,64]. Specifically, such PAEs as DEHP and DBP (at 100 μg/L) have been reported to cause damage to haemocytes and negatively impact the defence mechanisms of freshwater prawns (Macrobrachium rosenbergii) [65]. Additionally, DEHP (at 5 μg/L), which is a suspected carcinogen, has also been reported to induce oxidative stress, and to alter immune-related genes in zebrafish embryos [66], while DBP (at 0.8 μg/L) has been reported to disrupt sex hormones in male zebrafish (Danio rerio), by means of modulating the key steroidogenic genes over an exposure period of 14 days [46]. The presence of DBP and DEHP (both at 40 μg/L) has also been found to decrease the lifespan of, and to increase the reproduction output in, crustaceans (Daphnia magna), respectively [48]. Decreased sperm production, motility and velocity has also been reported in mature goldfish (Carassius auratus) after an exposure period of 30 days to DEHP (at 10 μg/L) [67]. Furthermore, DiDP (at 10 μg/L) has been reported to cause significant transcriptional alteration of steroid hormone genes in zebrafish embryos, even at lower concentrations, suggesting greater endocrine disrupting potency than in the case of DEHP, while DOP (at 10 μg/L) has been found to increase the E2/T ratio significantly in H295R cells in zebrafish larvae [47].

4. Conclusions and Recommendations

The current catchment-wide assessment PAE study has revealed that all of the appraised PAEs were found to be ubiquitous in the sampling points concerned, with DBP (>50%) being the most abundant PAE homologue throughout. Additionally, DBP, DEHP, DiDP and DOP accounted for over 80% of ∑PAEs in each aquatic environment (MWWTW effluents, rivers and dam catchments) for maximum Σ10PAEs of 63.2 μg/L. The overall prominent sequence for ∑PAEs registered the following arrangement: 53.3 > 10.1 > 10.0 > 9.8 > 4.3 > 2.5 > 1.8 > 1.7 > 1.1 > 0.9% for DBP > DEHP > DiDP > DOP > DHP > DPP > BBP > DMP > DEP > DiNP, with such concentrations being comparable to each studied water catchment, with only DBP being slightly higher in the MWWTW A, the Mamelodi River and the dry season. The overall prominent sequence for most polluted catchment registered the following arrangement: Mamelodi River > Roodeplaat Dam > MWWTW canal > MWWTW A > MWWTW B > Baviaanspoort River > Moreleta River, with no significant differences amongst them. Furthermore, DBP and DiDP posed highest ecotoxicological risk, with DOP, DEHP, DHP, DiNP and BBP posing median ecotoxicological risk to aquatic organisms, while the risk of DMP and DEP was minimal. Additionally, concentrations of DBP, DEHP, DOP, DPP, and DiDP exceeded the water criterion of 3 μg/L for those PAEs recommended by USEPA for the protection of aquatic life [63].
The results here suggest that fish and other aquatic organisms in the studied MWWTWs, rivers and dam catchments are at risk, due to the presence of high concentrations of PAEs. As the first South African study in design and execution to monitor and map temporospatial patterns and to assess the ecotoxicological risks of PAEs in different aqueous environments, as stated, these findings are essential for PAE prospects, in terms of monitoring and treatment, so as to safeguard surface water quality and environmental health, including for end-users, in terms of drinking water and agricultural fraternities. Moreover, the findings from this fingerprinting study are pivotal to custodians, interested and affected parties, and toxicologists following their quest to unpack water-based epidemiology further afield. Finally, and under the ‘forewarned and forearmed’ principle, drinking water treatment entities might be able to use the findings obtained in the present study to assemble relevant technologies, so as to be able to tackle PAEs in their raw water, hence protecting the end-users involved at different points of use. Due to their widespread nature in aqueous environments, specifically looking at the South African context, future research should look into the accumulation of PAEs in sediments and riparian zones.

Author Contributions

N.D.B. was responsible for the conceptualisation, data collection, analysis and interpretation and for drafting the original manuscript, with contributions from all the co-authors involved. M.T., K.W.M. and V.M. were responsible for the data analysis, interpretation and reviewing of the draft manuscript. All authors have read and agreed to the published version of the manuscript.

Funding

This research received no external funding.

Data Availability Statement

Data used in this study are available in the manuscript.

Acknowledgments

The authors would like to thank UNISA for funding this research work, conducted through the academic qualification improvement programme and departmental research funds, and Nkosi S.E. for assistance with study area map. The authors also acknowledge the comments and suggestions raised by the reviewers.

Conflicts of Interest

The authors declare no conflict of interest.

References

  1. Farré, M.; Kantiani, L.; Petrovic, M.; Pérez, S.; Barceló, D. Achievements and future trends in the analysis of emerging organic contaminants in environmental samples by mass spectrometry and bioanalytical techniques. J. Chromatogr. A 2012, 1259, 86–99. [Google Scholar] [CrossRef] [PubMed]
  2. Baloyi, N.D.; Tekere, M.; Maphangwa, K.W.; Masindi, V. Insights into the prevalence and impacts of phthalate esters in aquatic ecosystems. Front. Environ. Sci. 2021, 9, 684190. [Google Scholar] [CrossRef]
  3. Nantaba, F.; Ulrich-Palm, W.; Wasswa, J.; Bouwman, H.; Kylin, H.; Kümmerer, K. Temporal dynamics and ecotoxicological risk assessment of personal care products, phthalate ester plasticizers, and organophosphorus flame retardants in water from Lake Victoria. Chemosphere 2021, 262, 127716. [Google Scholar] [CrossRef] [PubMed]
  4. Wang, Y.; Zhu, H.; Kannan, K. A review of biomonitoring of phthalate exposures. Toxics 2019, 7, 21. [Google Scholar] [CrossRef] [PubMed] [Green Version]
  5. Heo, H.; Choi, M.J.; Park, J.; Nam, T.; Cho, J. Anthropogenic occurrence of phthalate esters in beach seawater in the Southeast Coast Region, South Korea. Water J. 2020, 12, 122. [Google Scholar] [CrossRef] [Green Version]
  6. Chiellini, F.; Ferri, M.; Morelli, A.; Dipaola, L.; Latini, G. Perspective on alternatives to phthalate plasticized poly (vinyl chloride) in medical devices applications. Prog. Polym. Sci. 2013, 38, 1067–1088. [Google Scholar] [CrossRef] [Green Version]
  7. Malarvannan, G.; Onghena, M.; Verstraete, S.; Van Puffelen, E.; Jacobs, A.; Vanhorebeek, I.; Verbruggen, S.; Joosten, K.; Van den Berghe, G.; Jorens, P.; et al. Phthalate and alternative plasticizers in indwelling medical devices in pediatric intensive care units. J. Hazard. Mater. 2019, 363, 64–72. [Google Scholar] [CrossRef]
  8. Zhang, Y.; Jiao, Y.; Li, Z.; Tao, Y.; Yang, Y. Hazards of phthalates (PAEs) exposure: A review of aquatic animal toxicology studies. Sci. Total Environ. 2021, 771, 145418. [Google Scholar] [CrossRef]
  9. Ren, L.; Lin, Z.; Liu, H.; Hu, H. Bacteria-mediated phthalic acid esters degradation and related molecular mechanisms. Appl. Microbiol. Biotechnol. 2018, 102, 1085–1096. [Google Scholar] [CrossRef]
  10. Giuliani, A.; Zuccarini, M.; Cichelli, A.; Khan, H.; Reale, M. Critical review on the presence of phthalates in food and evidence of their biological impact. Int. J. Environ. Res. Public Health 2020, 17, 5655. [Google Scholar] [CrossRef]
  11. Ventrice, P.; Ventrice, D.; Russo, E.; Sarro, G. Phthalates: European regulation, chemistry, pharmacokinetic and related toxicity. Environ. Toxicol. Phar. 2013, 36, 88–96. [Google Scholar] [CrossRef] [PubMed]
  12. Lee, Y.M.; Lee, J.E.; Choe, W.; Kim, T.; Lee, J.Y.; Kho, Y.; Choi, K.; Zoh, K.D. Distribution of phthalate esters in air, water, sediments, and fish in the Asan Lake of Korea. Environ. Int. 2019, 126, 635–643. [Google Scholar] [CrossRef] [PubMed]
  13. Park, J.; Park, C.; Gye, M.C.; Lee, Y. Assessment of endocrine-disrupting activities of alternative chemicals for bis(2-ethylhexyl) phthalate. Environ. Res. 2019, 172, 10–17. [Google Scholar] [CrossRef] [PubMed]
  14. Li, Y.Y.; He, W.; Liu, W.X.; Yang, B.; He, Q.S.; Yang, C.; Xu, F.L. Impacts of anthropogenic activities on spatial variations of phthalate esters in water and suspended particulate matter from China’s lakes. Sci. Total Environ. 2020, 724, 138281. [Google Scholar] [CrossRef] [PubMed]
  15. Ai, S.; Gao, X.; Wang, X.; Li, J.; Fan, B.; Zhao, S.; Liu, Z. Exposure and tiered ecological risk assessment of phthalate esters in the surface water of Poyang Lake, China. Chemosphere 2021, 262, 127864. [Google Scholar] [CrossRef] [PubMed]
  16. Li, J.; Wang, Z.; Wang, Q.; Guo, L.; Wang, C.; Wang, Z.; Zhang, S.; Wu, Q. Construction of hypercrosslinked polymers for high-performance solid phase microextraction of phthalate esters from water samples. J. Chromatogr. A 2021, 1641, 461972. [Google Scholar] [CrossRef]
  17. Chaudhary, G.; Jasrotia, A.; Raj, P.; Kaur, R.; Kumari, A.; Rajput, V.D.; Minkina, T.; Mandzhieva, S.; Kaur, R. Contamination of water and sediments of Harike Wetland with phthalate esters and associated risk assessment. Water 2023, 15, 1009. [Google Scholar] [CrossRef]
  18. Geissen, V.; Mol, H.; Klumpp, E.; Umlauf, G.; Nadal, M.; Van der Ploeg, M.; Van de Zee, S.E.A.T.M.; Ritsema, C.J. Emerging pollutants in the environment: A challenge for water resource management. Int. Soil Water Conserv. Res. 2015, 3, 57–67. [Google Scholar] [CrossRef]
  19. Selvaraj, K.K.; Sundaramoorthy, G.; Ravichandran, P.K.; Girijan, G.K.; Sampath, S.; Ramaswamy, B.R. Phthalate esters in water and sediments of the Kaveri River, India: Environmental levels and ecotoxicological evaluations. Environ. Geochem. Health 2015, 37, 83–96. [Google Scholar] [CrossRef]
  20. Staples, C.A.; Peterson, D.R.; Parkerton, T.F.; Adams, W.J. The environmental fate of phthalate esters: A literature review. Chemosphere 1997, 35, 667–749. [Google Scholar] [CrossRef]
  21. Staples, C.A.; Adams, W.J.; Parkerton, T.F.; Gorsuch, J.W.; Biggingers, G.R.; Reiner, K.H. Environmental toxicology review—Aquatic toxicity of eighteen phthalate esters. Environ. Toxicol. Chem. 1997, 16, 875–891. [Google Scholar] [CrossRef]
  22. Das, M.T.; Kumar, S.S.; Ghosh, P.; Sha, G.; Malyan, S.K.; Bajar, S.; Thakur, I.S.; Singh, L. Remediation strategies for mitigation of phthalate pollution: Challenges and future perspectives. J. Hazard. Mater. 2021, 409, 124496. [Google Scholar] [CrossRef] [PubMed]
  23. He, W.; Qin, N.; Kong, X.; Liu, W.; He, Q.; Ouyang, H.; Yang, C.; Jiang, Y.; Wang, Q.; Yang, B.; et al. Spatio-temporal distributions and the ecological and health risks of phthalate esters (PAEs) in the surface water of a large, shallow Chinese lake. Sci. Total Environ. 2013, 461–462, 672–680. [Google Scholar] [CrossRef]
  24. Salaudeen, T.; Okoh, O.; Agunbiade, F.; Okoh, A. Fate and impact of phthalates in activated sludge treated municipal wastewater on the water bodies in the Eastern Cape, South Africa. Chemosphere 2018, 203, 336–344. [Google Scholar] [CrossRef]
  25. Henkel, C.; Hüffer, T.; Hofmann, T. The leaching of phthalates from PVC can be determined with an infinite sink approach. MethodsX 2019, 6, 2729–2734. [Google Scholar] [CrossRef]
  26. Chi, J.; Gao, J. Effects of Potamogeton Crispus L.-bacteria interactions on the removal of phthalate acid esters from surface water. Chemosphere 2015, 119, 59–64. [Google Scholar] [CrossRef] [PubMed]
  27. Wang, R.; Ma, X.; Zhang, X.; Li, X.; Li, D.; Dang, Y. C8-modified magnetic graphene oxide based solid-phase extraction coupled with dispersive liquid-liquid microextraction for detection of trace phthalate acid esters in water samples. Ecotoxicol. Environ. Saf. 2019, 170, 789–795. [Google Scholar] [CrossRef]
  28. Gao, L.; Tang, Y.; Wang, C.; Yao, L.; Zhang, J.; Gao, R.; Tang, X.; Chong, T.; Zhang, H. Highly efficient amphiphilic magnetic nanocomposites based on a simple sol-gel modification for adsorption of phthalate esters. J. Colloid Interf. Sci. 2019, 552, 142–152. [Google Scholar] [CrossRef]
  29. Aarab, N.; Lemaire-Gony, S.; Unruh, E.; Hansen, P.D.; Larsen, B.K.; Andersen, O.K.; Narbonne, J.F. Preliminary study of responses in mussel (Mytilus Edilus) exposed to bisphenol A, diallyl phthalate and tetrabromodiphenyl ether. Aquat. Toxicol. 2006, 78, S86–S92. [Google Scholar] [CrossRef]
  30. Arambourou, H.; Planelló, R.; Llorente, L.; Fuertes, I.; Barata, C.; Delorme, N.; Noury, P.; Herrero, O.; Villeneuve, A.; Bonnineau, C. Chironomus Riparius exposure to field-collected contaminated sediments: From subcellular effect to whole-organism response. Sci. Total Environ. 2019, 671, 874–882. [Google Scholar] [CrossRef]
  31. Gao, D.W.; Li, Z.; Wang, H.; Liang, H. An overview of phthalate acid ester pollution in China over the last decade: Environmental occurrence and human exposure. Sci. Total Environ. 2018, 645, 1400–1409. [Google Scholar] [CrossRef] [PubMed]
  32. Oehlmann, J.; Schulte-Oehlmann, U.; Kloas, W.; Jagnytsch, O.; Lutz, I.; Kusk, K.; Wollenberger, L.; Santos, E.; Paull, G.; Van Look, K.; et al. A critical analysis of the biological impacts of plasticizers on wildlife. Philos. Trans. R. Soc. Lond. B Biol. Sci. 2009, 364, 2047–2062. [Google Scholar] [CrossRef] [PubMed] [Green Version]
  33. Sun, S.; Shen, J.; Li, B.; Geng, J.; Ma, L.; Qi, H.; Zhang, A.; Zhao, Z. The spatiotemporal distribution and potential risk assessment of 19 phthalate acid esters in wastewater treatment plants in China. Environ. Sci. Pollut. Res. 2021, 28, 6780–6791. [Google Scholar] [CrossRef] [PubMed]
  34. Al-Saleh, I.; Elkhatib, R.; Al-Rajoudi, T.; Al-Qudaihi, G. Assessing the concentration of phthalate esters (PAEs) and bisphenol A (BPA) and the genotoxic potential of treated wastewater (final effluent) in Saudi Arabia. Sci. Total Environ. 2017, 578, 440–451. [Google Scholar] [CrossRef] [PubMed]
  35. Wu, J.; Ma, T.; Zhou, Z.; Yu, N.; He, Z.; Li, B.; Shi, Y.; Ma, D. Occurrence and fate of phthalate esters in wastewater treatment plants in Qingdao, China. Hum. Ecol. Risk Assess. 2019, 25, 1547–1563. [Google Scholar] [CrossRef]
  36. Olujimi, O.O.; Fatoki, O.S.; Odendaal, J.P.; Daso, A.P. Chemical monitoring and temporal variation in levels of endocrine disrupting chemicals (priority phenols and phthalate esters) from selected wastewater treatment plant and freshwater ecosystems in Republic of South Africa. Microchem. J. 2012, 101, 11–23. [Google Scholar] [CrossRef]
  37. He, M.J.; Lu, J.F.; Wang, J.; Wei, S.Q.; Hageman, K.J. Phthalate esters in biota, air and water in an agricultural area of Western China, with emphasis on bioaccumulation and human exposure. Sci. Total Environ. 2020, 698, 134264. [Google Scholar] [CrossRef]
  38. Fatoki, O.S.; Bornman, M.; Ravandhalala, L.; Chimuka, L.; Genthe, B.; Adeniyi, A. Phthalate ester plasticizers in freshwater ecosystems of Venda, South Africa and potential health effects. Water SA 2010, 36, 117–126. [Google Scholar] [CrossRef] [Green Version]
  39. Sibali, L.L.; Okonkwo, J.O.; McCrindle, R.I. Determination of selected phthalate esters compounds in water and sediments by capillary gas chromatography and flame ionization detector. J. Environ. Sci. Health A 2013, 48, 1365–1377. [Google Scholar] [CrossRef]
  40. Paluselli, A.; Aminot, Y.; Galgani, F.; Net, S.; Sempéré, R. Occurrence of phthalate acid esters (PAEs) in the Northwestern Mediterranean Sea and the Rhone River. Prog. Oceanogr. 2018, 163, 221–231. [Google Scholar] [CrossRef] [Green Version]
  41. Okpara, K.E.; Phoungthong, K.; Agbozu, I.; Edwin-Isotu, E.; Techato, K. Phthalate esters in tap water, Southern Thailand: Daily exposure and cumulative health risk in infants, lactating mothers, pregnant and nonpregnant women. Int. J. Environ. Res. Public Health 2022, 19, 2187. [Google Scholar] [CrossRef] [PubMed]
  42. Wang, C.; Huang, P.; Qiu, C.; Li, J.; Hu, S.; Sun, L.; Bai, Y.; Gao, F.; Li, C.; Liu, N.; et al. Occurrence, migration and health risk of phthalates in tap water, barrelled water and bottled water in Tianjin, China. J. Hazard. Mater. 2021, 408, 124891. [Google Scholar] [CrossRef] [PubMed]
  43. Abdolahnejad, A.; Gheisari, L.; Karimi, M.; Norastehfar, N.; Ebrahimpour, K.; Mohammadi, A.; Ghanbari, R.; Ebrahimi, A.; Jafari, N. Monitoring and health risk assessment of phthalate esters in household’s drinking water of Isfahan, Iran. Int. J. Environ. Sci. Technol. 2019, 16, 7409–7416. [Google Scholar] [CrossRef]
  44. Dada, E.O.; Ikeh, R.K. Phthalates and metal concentrations in drinking water in Lagos, Nigeria. J. Health Pollut. 2018, 8, 180603. [Google Scholar] [CrossRef] [PubMed] [Green Version]
  45. Domínguez-Morueco, N.; Gonzalez-Alonso, S.; Valcarcel, C. Phthalate occurrence in rivers and tap water from central Spain. Sci. Total Environ. 2014, 500–501, 139–146. [Google Scholar] [CrossRef]
  46. Sohn, J.; Kim, S.; Koschorreck, J.; Kho, Y.; Choi, K. Alteration of sex hormone levels and steroidogenic pathway by several low molecular weight phthalates and their metabolites in male zebrafish (Danio rerio) and/or human adrenal cell (H295R) line. J. Hazard. Mater. 2016, 320, 45–54. [Google Scholar] [CrossRef]
  47. Lee, H.; Lee, J.; Choi, K.; Kim, K.T. Comparative analysis of endocrine disrupting effects of major phthalates in employed two cell lines (MVLN and H295R) and embryonic zebrafish assay. Environ. Res. 2019, 172, 319–325. [Google Scholar] [CrossRef]
  48. Seyoum, A.; Pradhan, A. Effect of phthalates on development, reproduction, fat metabolism and lifespan in Daphnia magna. Sci. Total Environ. 2019, 654, 969–977. [Google Scholar] [CrossRef]
  49. Fatoki, O.S.; Noma, A. Solid phase extraction method for selective determination of phthalate esters in the aquatic environment. Water Air Soil Pollut. 2002, 140, 85–98. [Google Scholar] [CrossRef]
  50. Baloyi, N.D. Prevalence of Endocrine Disrupting Phthalate Esters in Selected Foods and Food Wrappers from Some Supermarkets Around Pretoria, South Africa. Master’s Thesis, University of South Africa, Pretoria, South Africa, 2012. [Google Scholar]
  51. Clara, M.; Windhofer, G.; Hartl, W.; Braun, K.; Simon, M.; Gans, O.; Scheffknecht, C.; Chovanec, A. Occurrence of phthalates in surface runoff, untreated and treated wastewater and fate during wastewater treatment. Chemosphere 2010, 78, 1078–1084. [Google Scholar] [CrossRef]
  52. Liu, X.; Shi, J.; Bo, T.; Li, H.; Crittenden, J.C. Occurrence and risk assessment of selected phthalates in drinking water from waterworks in China. Environ. Sci. Pollut. Res. 2015, 22, 10690–10698. [Google Scholar] [CrossRef]
  53. Hadjmohammadi, M.R.; Ranbari, E. Utilization of homogeneous liquid–liquid extraction followed by HPLC-UV as a sensitive method for the extraction and determination of phthalate esters in environmental water samples. Int. J. Environ. Anal. Chem. 2011, 2, 1312–1324. [Google Scholar] [CrossRef]
  54. Santana-Mayor, Á.; Socas-Rodríguez, B.; Afonso, M.d.M.; Palenzuela-López, J.A.; Rodríguez-Delgado, M.Á. Reduced graphene oxide-coated magnetic-nanoparticles as sorbent for the determination of phthalates in environmental samples by micro-dispersive solid-phase extraction followed by ultra-high-performance liquid chromatography tandem mass spectrometry. J. Chromatogr. A 2018, 1565, 36–47. [Google Scholar] [CrossRef]
  55. Weizhen, Z.; Xiaowei, Z.; Peng, G.; Ning, W.; Zini, L.; Jian, H.; Zheng, Z. Distribution and risk assessment of phthalates in water and sediment of the Pearl River Delta. Environ. Sci. Pollut. Res. 2020, 27, 12550–12565. [Google Scholar] [CrossRef]
  56. Abtahi, M.; Dobaradaran, S.; Torabbeigi, M.; Jorfi, S.; Gholamnia, R.; Koolivand, A.; Darabi, H.; Kavousi, A.; Saeedi, R. Health risk of phthalates in water environment: Occurrence in water resources, bottled water, and tap water, and burden of disease from exposure through drinking water in Tehran, Iran. Environ. Res. 2019, 173, 469–479. [Google Scholar] [CrossRef]
  57. European Commission. Technical Guidance Document in Support of Commission Directive 93/67/EEC on Risk Assessment for New Notified Substances and Commission Regulation (EC) No 1488/94 on Risk Assessment for Existing Substances, Part II; European Commission: Brussels, Belgium, 2003. [Google Scholar]
  58. Adeniyi, A.A.; Okodeyi, O.O.; Yusuf, K.A. Flame ionization gas chromatographic determination of phthalate esters in water, surface sediments and fish species in Ogun River catchments, Ketu, Lagos, Nigeria. Environ. Monit. Assess. 2011, 172, 561–569. [Google Scholar] [CrossRef]
  59. Santhi, V.A.; Mustafa, A.M. Assessment of organochlorine pesticides and plasticisers in the Selangor River Basin and possible pollution sources. Environ. Monit. Assess. 2013, 185, 1541–1554. [Google Scholar] [CrossRef]
  60. Zhang, Z.M.; Zhang, H.H.; Li, J.L.; Yang, G.P. Determination of phthalic acid esters in seawater and sediment by solid-phase microextraction and gas chromatography-mass spectrometry. Chin. J. Anal. Chem. 2017, 45, 348–356. [Google Scholar] [CrossRef]
  61. Cheng, Z.; Liu, J.B.; Gao, M.; Shi, G.Z.; Fu, X.J.; Cai, P.; Lv, Y.F.; Guo, Z.B.; Shan, C.Q.; Yang, Z.B.; et al. Occurrence and distribution of phthalate esters in freshwater aquaculture fishponds in Pearl River Delta, China. Environ. Pollut. 2019, 245, 883–888. [Google Scholar] [CrossRef]
  62. Chen, H.; Mao, W.; Shen, Y.; Feng, W.; Mao, G.; Zhao, T.; Yang, L.; Yang, L.; Meng, C.; Li, Y.; et al. Distribution, source, and environmental risk assessment of phthalate esters (PAEs) in water, suspended particulate matter, and sediment of a typical Yangtze River Delta City. China. Environ. Sci. Pollut. Res. 2019, 26, 24609–24619. [Google Scholar] [CrossRef]
  63. United States Environmental Protection Agency (USEPA). Water Quality Standards Handbook, 2nd ed.; USEPA: Washington, DC, USA, 1994. [Google Scholar]
  64. Koo, H.H.; Lee, B.M. Estimated exposure to phthalates in cosmetics and risk assessment. J. Toxicol. Environ. Health Part A 2004, 67, 1901–1914. [Google Scholar] [CrossRef]
  65. Sung, H.H.; Kao, W.Y.; Su, Y.J. Effects and toxicity of phthalate esters to hemocytes of giant freshwater prawn, Macrobrachium rosenbergii. Aquat. Toxicol. 2003, 64, 25–37. [Google Scholar] [CrossRef]
  66. Xu, H.; Shao, X.; Zhang, Z.; Zou, Y.; Wu, X.; Yang, L. Oxidative stress and immune related gene expression following exposure to di-n-butyl phthalate and diethyl phthalate in zebrafish embryos. Ecotoxicol. Environ. Saf. 2013, 93, 39–44. [Google Scholar] [CrossRef]
  67. Golshan, M.; Hatef, A.; Socha, M.; Milla, S.; Butts, I.A.E.; Carnevali, O.; Rodina, M.; Sokołowska-Mikołajczyk, M.; Fontaine, P.; Linhart, O.; et al. Di-(2-ethylhexyl)-phthalate disrupts pituitary and testicular hormonal functions to reduce sperm quality in mature goldfish. Aquat. Toxicol. 2015, 163, 16–26. [Google Scholar] [CrossRef]
Figure 1. Study area and sampling points within Tshwane metropolis, South Africa.
Water 15 02061 g001
Figure 2. Total percentages of PAEs in effluents from MWWTW A (a), MWWTW B (b), and MWWTW canal (c).
Water 15 02061 g002
Figure 3. Total percentages of PAEs in samples from the Mamelodi River (a), the Baviaanspoort River (b), and the Moreleta River (c).
Water 15 02061 g003
Figure 4. Total percentages of PAEs in the Roodeplaat Dam.
Water 15 02061 g004
Figure 5. Total percentages of PAEs during the dry (a) and wet (b) seasons.
Water 15 02061 g005
Figure 6. Ecotoxicological risk assessment of PAEs in municipal effluents, rivers and dam catchments.
Water 15 02061 g006
Table 1. Chemical properties and common applications of appraised PAE plasticisers.
Phthalates AcronymsCommon
Applications
Molecular Weight (g/mol)Chemical FormulaCAS Number
Dimethyl phthalateDMPCosmetics and insecticides194.2C16H22O4131-11-3
Diethyl phthalateDEPCosmetics, pharmaceuticals and insecticides222.2C12H14O484-66-2
Di-n-butyl phthalateDBPCosmetics and pharmaceuticals278.4C16H22O484-74-2
Benzyl butyl phthalateBBPAdhesives, sealants, food packaging and upholstery312.4C19H20O485-68-7
Diphenyl phthalateDPPAutomotive, construction and medical devices318.2C20H14O484-62-8
Dihexyl phthalateDHPCosmetic, plastic additives and rubber products334.5C20H30O484-75-3
Bis(2-ethylhexyl) phthalateDEHPMedical devices, PVC, packaging products and plastic additives390.6C24H38O4117-81-7
Di-n-octyl phthalateDOPCosmetics, medical devices and pesticides390.6C24H38O4117-84-0
Diisononyl
phthalate
DiNPConstruction, electrical and automotive products418.6C26H42O428553-12-0
Diisodecyl
phthalate
DiDPConstruction, PVC and packaging products446.7C28H46O426761-40-0
Table 2. Description of sampling points.
Sampling PointLocation Description of the Sampling Point
MWWTW AS 25°41.369′ E 028°21.704′Located about 7 km from the dam, with effluents being discharged into Baviaanspoort River, which connects to the Roodeplaat Dam downstream.
MWWTW BS 25°37.394′ E 028°20.185′Located to the north-east of Pretoria and upstream of the Roodeplaat Dam, which is less than a kilometre away. Effluents are discharged into an adjacent water-holding catchment, which then flows into the dam downstream.
MWWTW canalS 25°37.403′ E 028°20.335′This canal serves as a stream or channel for effluents from MWWTW B through the water holding catchment between MWWTW B and the Roodeplaat Dam, which is less than a kilometre away.
Mamelodi RiverS 25°40.695′ E 028°24.100′Part of Edendalspruit, located north-west of Leeuwfontein and about 6 km south-east of the Roodeplaat Dam. The river is a tributary of various streams running from, and through, Mamelodi townships and recreational areas, including schools and shopping complexes.
Baviaanspoort RiverS 25°40.705′ E 028°21.443′Part of the Pienaars River, which is a tributary of the Crocodile River, originating in the east of Pretoria and flowing northwards into the Roodeplaat Dam, which is located about 6 km downstream.
Moreleta RiverS 25°39.379′ E 028°18.501′A short section (which runs for approximately 20 km between Haakdoornbult and the Klipvoor Dam) of the Pienaars River, which is a tributary of the Crocodile River. Tributaries of the Pienaars River include the Moreletaspruit, which originates in the east of Pretoria, within Tshwane Municipality, and flows northwards into the Roodeplaat Dam.
Roodeplaat DamS 25°34.849′ E 028°19.849′Located about 22 km north-east of Pretoria and north of Mamelodi townships. The dam was constructed in 1956 to provide a continuous water supply to the surrounding landowners. It was later developed into a key water source for the northern areas of the City of Tshwane, including the Montana, Wonderboom and Magaliesberg reservoirs, which are used as a direct water supply for Doornpoort and the surrounding areas.
Note: MWWTW = Municipal wastewater treatment works.
Table 3. Methods’ recovery rates, instrument response factors, slope of the calibration curves, and instrument detection limits (IDL) for PAE homologues (n = 6).
PAEs% RecoveryResponse FactorSlope (Calibration Curve)IDL (ng/L)
DMP76.6 ± 1.940.456 ± 0.00730.74132.6
DEP51.6 ± 2.020.515 ± 0.00640.82025.7
DBP71.9 ± 3.030.625 ± 0.00490.97616.8
BBP63 ± 4.220.666 ± 0.00571.021.8
DPP50.7 ± 0.841.83 ± 0.00480.89017.7
DHP56.5 ± 2.241.05 ± 0.00573.575.29
DEHP63.4 ± 3.120.735 ± 0.00381.1211.1
DOP61.2 ± 3.250.731 ± 0.00251.097.4
DiNP71.6 ± 4.980.821 ± 0.00451.1213.3
DiDP80.6 ± 3.290.874 ± 0.00540.73324.3
Table 4. No observed effect concentration (NOEC), trophic levels and assessment factors for calculating predicted no-effect concentration (PNEC) for PAE homologues.
PAEs (NOEC) (mg/L)Number of Trophic LevelsAssessment
Factors
PNEC (mg/L)
DMP1, 9.6 2500.02
DEP1.65, 3.65, 3.8, 10, 133100.165
DBP0.1, 0.21, 0.28, 0.42, 1.33100.01
BBP0.1, 0.20, 0.26, 0.35, 0.36, 0.823100.01
DHP0.03, 0.08, 0.11, 0.18, 0.20, 0.223100.003
DEHP0.052, 0.054, 0.077, 0.1, 0.163100.0052
DOP0.32, 3.22500.006
DiNP0.034, 0.06, 0.14, 0.16, 1.0, 1.83100.003
DiDP0.03, 0.07, 0.1, 0.14, 0.37,0.83100.003
Table 5. Concentration ranges of the analysed PAEs in water samples (n = 42, with each sample extracted in triplicate) in sampled localities.
PAEs Detection Frequency (%) Conc. (μg/L)
MinimumMean (STDev) Maximum (MEC)
DMP89.7nd0.237 ± 0.1490.470
DEP84.1nd0.159 ± 0.1421.89
DBP1000.4727.45 ± 4.9337.9
BBP95.2nd1.41 ± 1.022.25
DPP99.2nd0.255 ± 0.3683.25
DHP91.3nd0.594 ± 0.4251.49
DEHP98.4nd0.348 ± 0.5074.64
DOP1000.021.38 ± 1.055.46
DiNP92.1nd0.121 ± 0.1290.80
DiDP99.2nd1.40 ± 1.105.30
Σ10PAEsn/a0.49213.6 ± 9.8263.2
Note: MEC = measured environmental concentration; n = number of samples; nd = not detected; n/a = not applicable.
Table 6. Average concentrations of PAEs in effluents from MWWTW A, MWWTW B and MWWTW canal.
PAEs Mean (STDev) (μg/L)
MWWTW AMWWTW BMWWTW Canal
DMP0.232 ± 0.1380.216 ± 0.1510.234 ± 0.162
DEP0.139 ± 0.0870.138 ± 0.0850.15 ± 0.093
DBP8.04 ± 3.646.72 ± 2.546.76 ± 3.02
BBP0.263 ± 0.2660.175 ± 0.0910.186 ± 0.124
DPP0.266 ± 0.2080.332 ± 0.3650.416 ± 0.575
DHP0.554 ± 0.3780.615 ± 0.5080.629 ± 0.454
DEHP1.21 ± 0.7211.38 ± 0.9591.54 ± 0.889
DOP1.08 ± 0.6751.32 ± 0.7921.72 ± 1.04
DiNP0.099 ± 0.0540.079 ± 0.0590.08 ± 0.072
DiDP1.20 ± 0.9731.68 ± 1.551.48 ± 0.783
Σ10PAEs13.1 ± 7.1312.7 ± 7.1113.2 ± 7.17
Table 7. Average concentrations of PAEs in Mamelodi, Baviaanspoort and Moreleta Rivers.
PAEs Mean (STDev) (μg/L)
Mamelodi RiverBaviaanspoort RiverMoreleta River
DMP0.224 ± 0.1490.282 ± 0.1430.238 ± 0.17
DEP0.173 ± 00930.156 ± 0.0950.157 ± 0.097
DBP9.76 ± 9.757.08 ± 3.036.71 ± 3.84
BBP0.391 ± 0.1920.146 ± 0.0620.387 ± 0.684
DPP0.635 ± 0.9830.205 ± 0.1450.237 ± 0.144
DHP0.584 ± 0.4420.589 ± 0.3450.596 ± 0.454
DEHP1.6 ± 1.231.16 ± 0.7311.19 ± 1.04
DOP1.42 ± 1.081.51 ± 1.370.983 ± 0.742
DiNP0.171 ± 0.1020.186 ± 0.2280.091 ± 0.054
DiDP1.28 ± 0.9441.29 ± 0.8341.32 ± 0.937
Σ10PAEs16.2 ± 14.912.6 ± 6.9811.9 ± 8.16
Table 8. Concentration levels of analysed PAEs in water samples for both dry and wet seasons (n = 21 for each season, and with each sample being extracted in triplicate).
PAEs Dry Season (μg/L) Wet Season (μg/L)
MinimumMean (STDev)MaximumMinimum Mean (STDev) Maximum
DMPnd0.146 ± 0.1140.3820.1290.331 ± 0.0670.403
DEPnd0.108 ± 0.0970.290.0490.211 ± 0.0790.512
DBP0.667.15 ± 6.1627.41.277.76 ± 1.8810.9
BBPnd0.368 ± 0.411.120.1110.82 ± 0.2311.15
DPPnd0.211 ± 0.2070.790.0990.298 ± 0.3631.78
DHP0.0111.06 ± 1.03.050.3591.76 ± 0.6692.95
DEHP0.0410.496 ± 0.6442.620.1150.2 ± 0.0850.41
DOP0.0511.28 ± 1.174.080.5691.48 ± 0.6032.76
DiNPnd0.096 ± 0.1310.630.0290.145 ± 0.0760.332
DiDP0.0811.38 ± 1.274.740.6621.42 ± 0.4932.5
Σ10PAEs0.84412.3 ± 11.245.13.3914.4 ± 4.5523.7
Note: nd = not detected.
Disclaimer/Publisher’s Note: The statements, opinions and data contained in all publications are solely those of the individual author(s) and contributor(s) and not of MDPI and/or the editor(s). MDPI and/or the editor(s) disclaim responsibility for any injury to people or property resulting from any ideas, methods, instructions or products referred to in the content.

