Article

Estimation of Changes in the Nutrient Release Rate from Sediments after a Tsunami by an Incubation Experiment

by
Mitsuru Hayashi
1,2,*,
Tetsunori Inoue
3,4,5 and
Soichi Hirokawa
2
1
Research Center for Inland Seas, Kobe University, Kobe 658-0022, Japan
2
Graduate School of Maritime Sciences, Kobe University, Kobe 658-0022, Japan
3
Marine Pollution Management Group, Port and Airport Research Institute, Yokosuka 239-0826, Japan
4
Estuary Research Center, Shimane University, Matsue 690-8504, Japan
5
Department of Transdisciplinary Science and Engineering, Tokyo Institute of Technology, Tokyo 152-8552, Japan
*
Author to whom correspondence should be addressed.
Water 2023, 15(11), 2041; https://doi.org/10.3390/w15112041
Submission received: 29 April 2023 / Revised: 22 May 2023 / Accepted: 25 May 2023 / Published: 27 May 2023

Abstract

:
A tsunami induced by the Nankai Trough earthquake may disturb marine sediments in the inner part of Osaka Bay. Since nutrient release from marine sediments has a significant impact on nu-trient concentrations in seawater, an incubation experiment was conducted to estimate the release rates of NH4-N and PO4-P in order to understand the present rates and to quantify the changes in the rates caused by tsunamis in Osaka Bay. The current release rate of NH4-N is an extension of the decreasing trend since 2000. The PO4-P release rate has remained at a low level since 2008. The release rate of redeposited sediments after exposure to the aerobic environment caused by a tsunami may decrease to approximately 70% of the current level for NH4-N and 60% for PO4-P. Nutrient concentrations and fishing have begun to decline in Osaka Bay. A reduction in the nutrient release rate by tsunamis may further limit primary production under the current situation where the contribution of release to nutrients in seawater is significant.

1. Introduction

Earthquakes occur frequently in Japan, and tsunamis often strike coastal areas. In 2011, off the Pacific coast of Tohoku, an earthquake caused a massive tsunami to hit the Tohoku coast, resulting in drastic changes to the marine environment including changes in bathymetry [1], changes in marine sediment quality [2], outbreaks of toxic plankton blooms and shellfish poisoning [3,4] and the destruction of seaweed beds [5]. Seagrass beds and fishery resources recovered quickly [6,7], but it has been noted that the impact on macrobenthos continues [8,9].
Such changes may occur even in inner bays, such as Osaka Bay, as shown in Figure 1, due to a tsunami being induced by a Nankai Trough earthquake with magnitude 8 or 9, which has a 90% probability of occurring within 40 years and a 60% probability of occurring within 20 years [10]. The possibility of severe sediment disturbance in the inner part of Osaka Bay by the tsunami was shown and simulated by using a numerical model [11]. It was predicted by a tidal transport simulation that disturbed sediments will be transported to and redeposited near Okinose along the shoreline and the convergent zone at the sea surface [12]. If the tsunami disturbs the sediment, nutrient release may change. To quantify the change in release rates of nutrients caused by tsunamis, an incubation experiment was conducted on ammonia nitrogen (NH4-N) and phosphoric phosphorus (PO4-P). In addition, the impact of the release rate change on primary production was discussed.

2. Materials and Methods
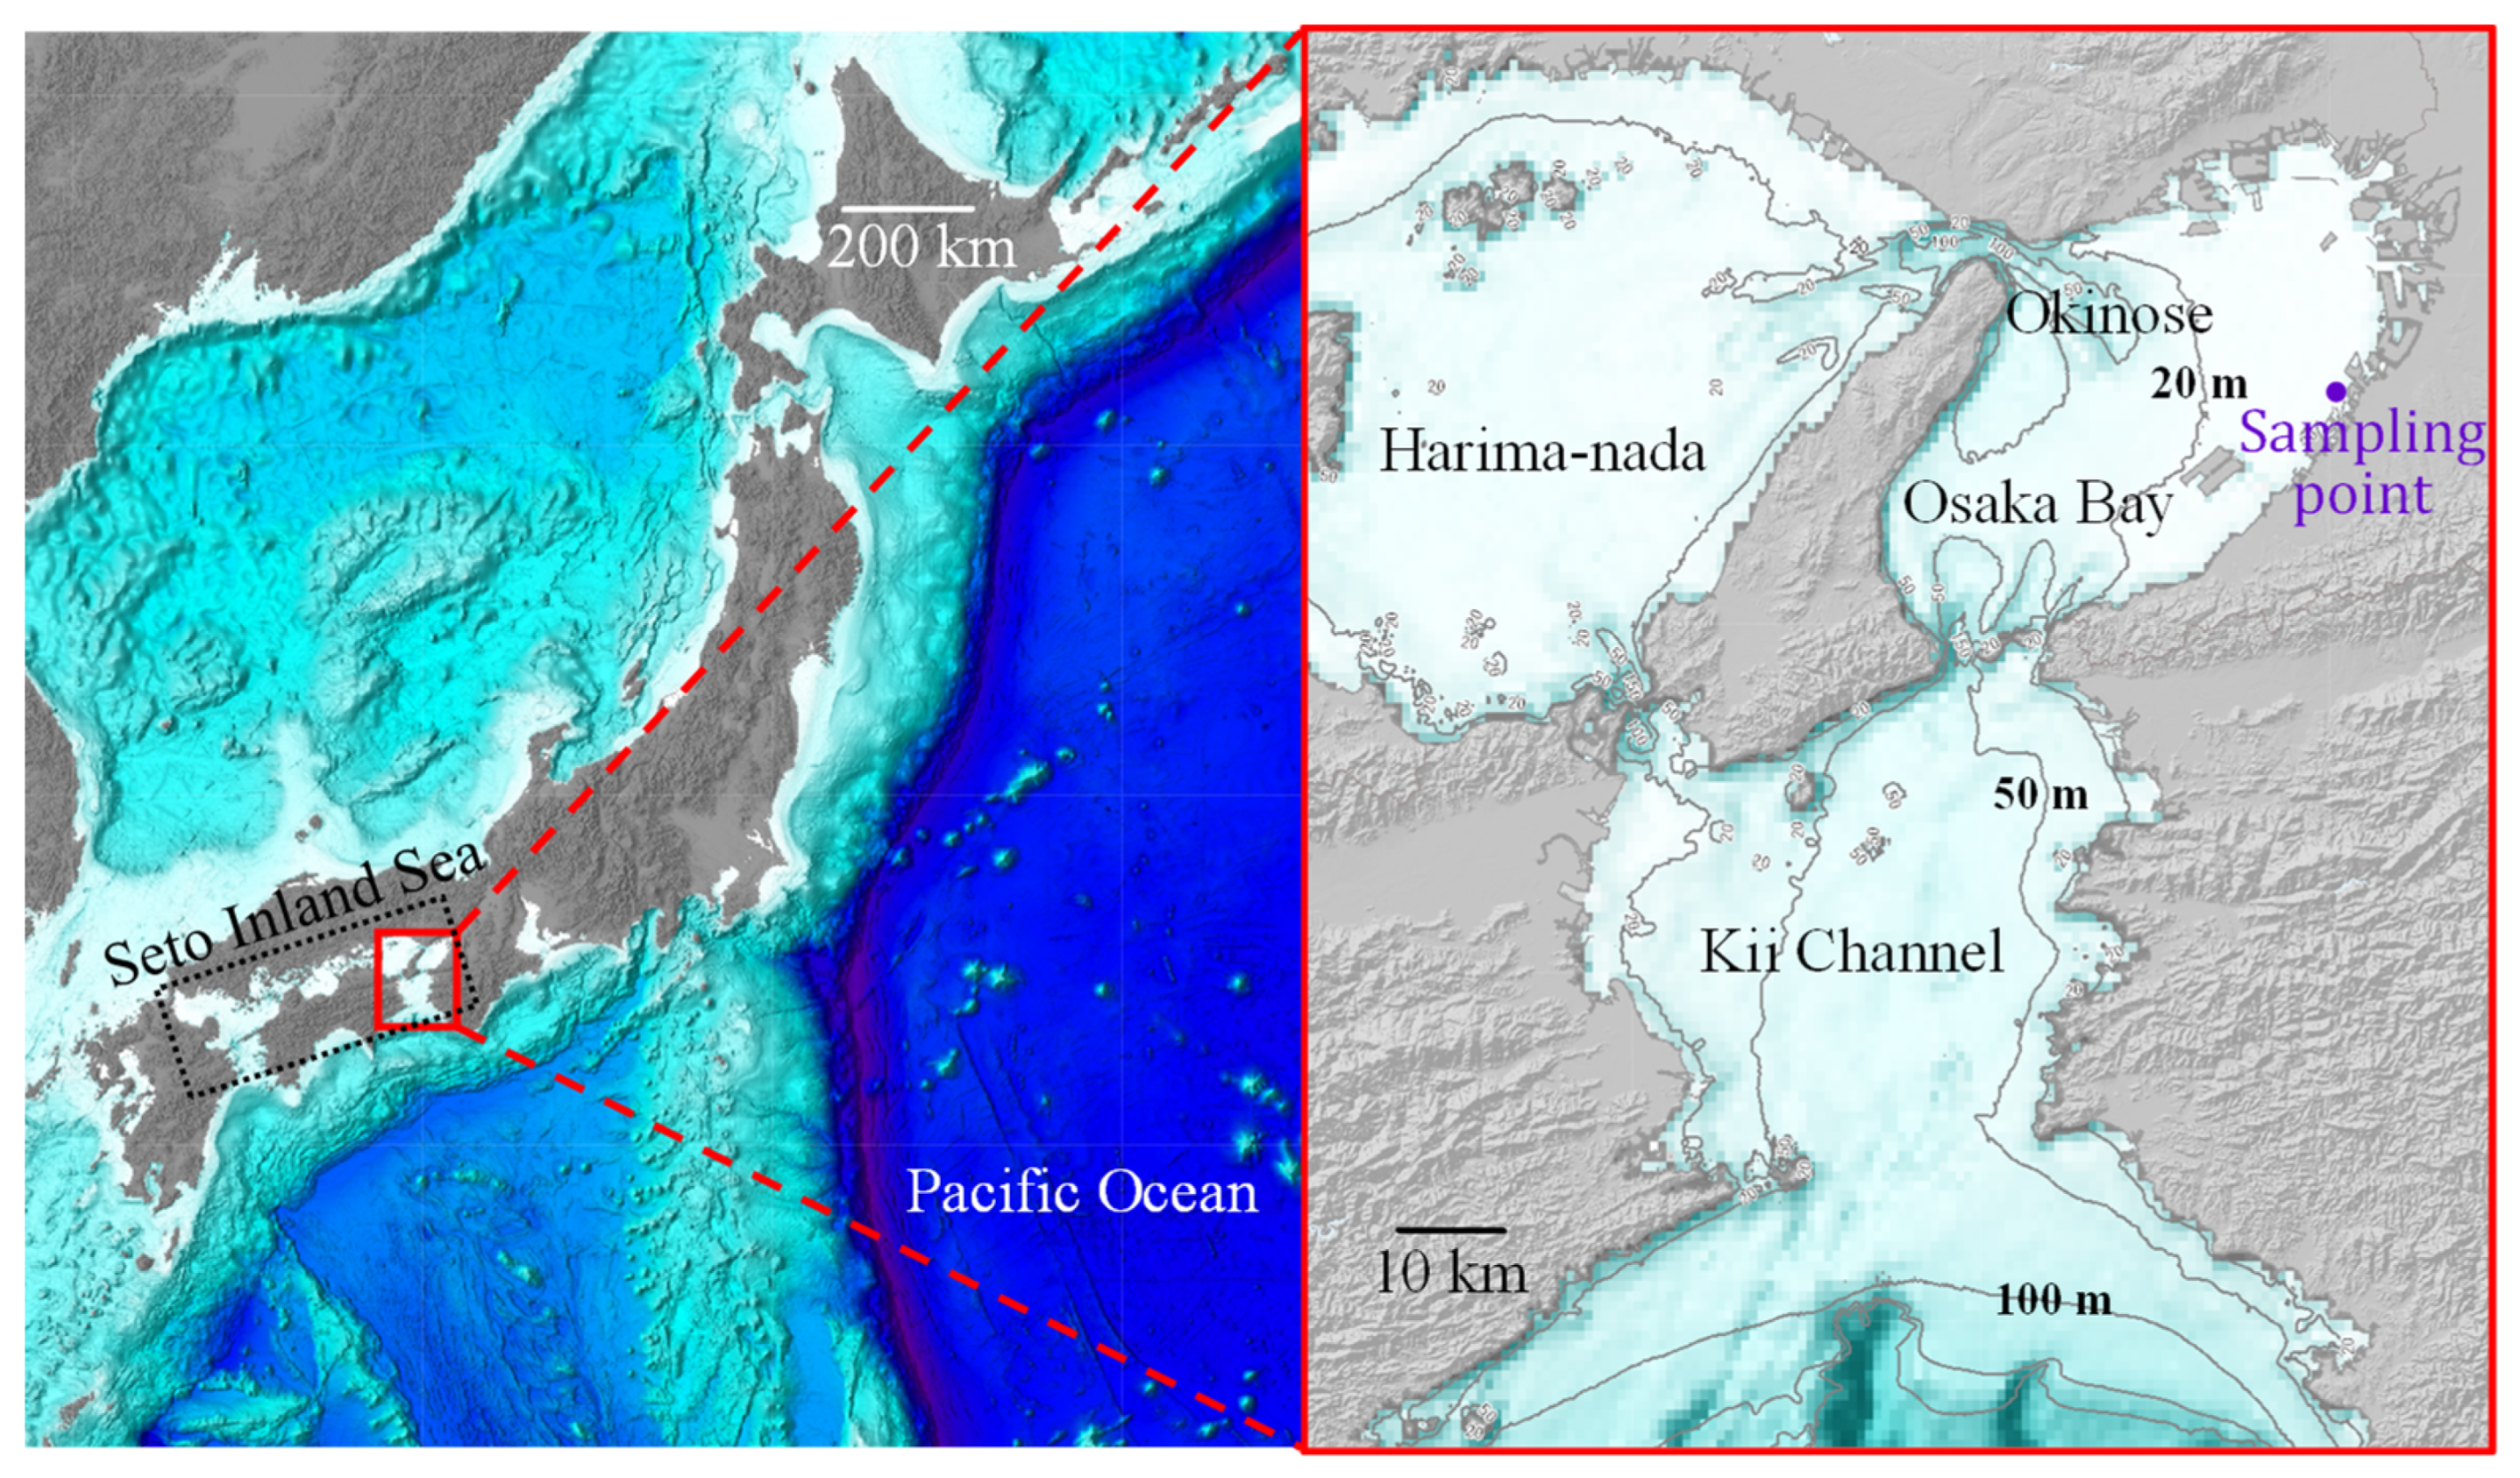
2.1. Study Site

Osaka Bay, as shown in Figure 1, is one of the semienclosed bays in the Seto Inland Sea located in western Japan [13]. The southern part of Osaka Bay is connected to the Pacific Ocean through the Kii Channel. The bathymetry of the west side, the inner part of Osaka Bay, is less than 20 m. There are many cities, factories and river mouths around the inner part of Osaka Bay. Osaka Bay was eutrophic in the 1970s, and red tides occurred frequently. Total nitrogen (TN) and total phosphorus (TP) concentrations in marine sediments in Osaka Bay tend to be higher in the inner part of the bay [14]. Seasonal surveys were conducted in the Seto Inland Sea during 1993~1994, and nitrate nitrogen (NO3-N), NH4-N and PO4-P release fluxes per unit area from marine sediments were shown [15]. The NO3-N release fluxes were almost negative. The NH4-N and PO4-P release fluxes in Osaka Bay tended to be larger than those in other areas of the sea.
Dredging was conducted in Kishiwada Passage on 21 October 2021. Sediment dredged from a depth of 16 m was used for this experiment. The sediment was composed of a mixture of clay and silt and had a hydrogen sulfide odor because this site is deeper than the surrounding area. The dredged sediment sample was maintained at room temperature and was not disturbed until it was brought to the laboratory.

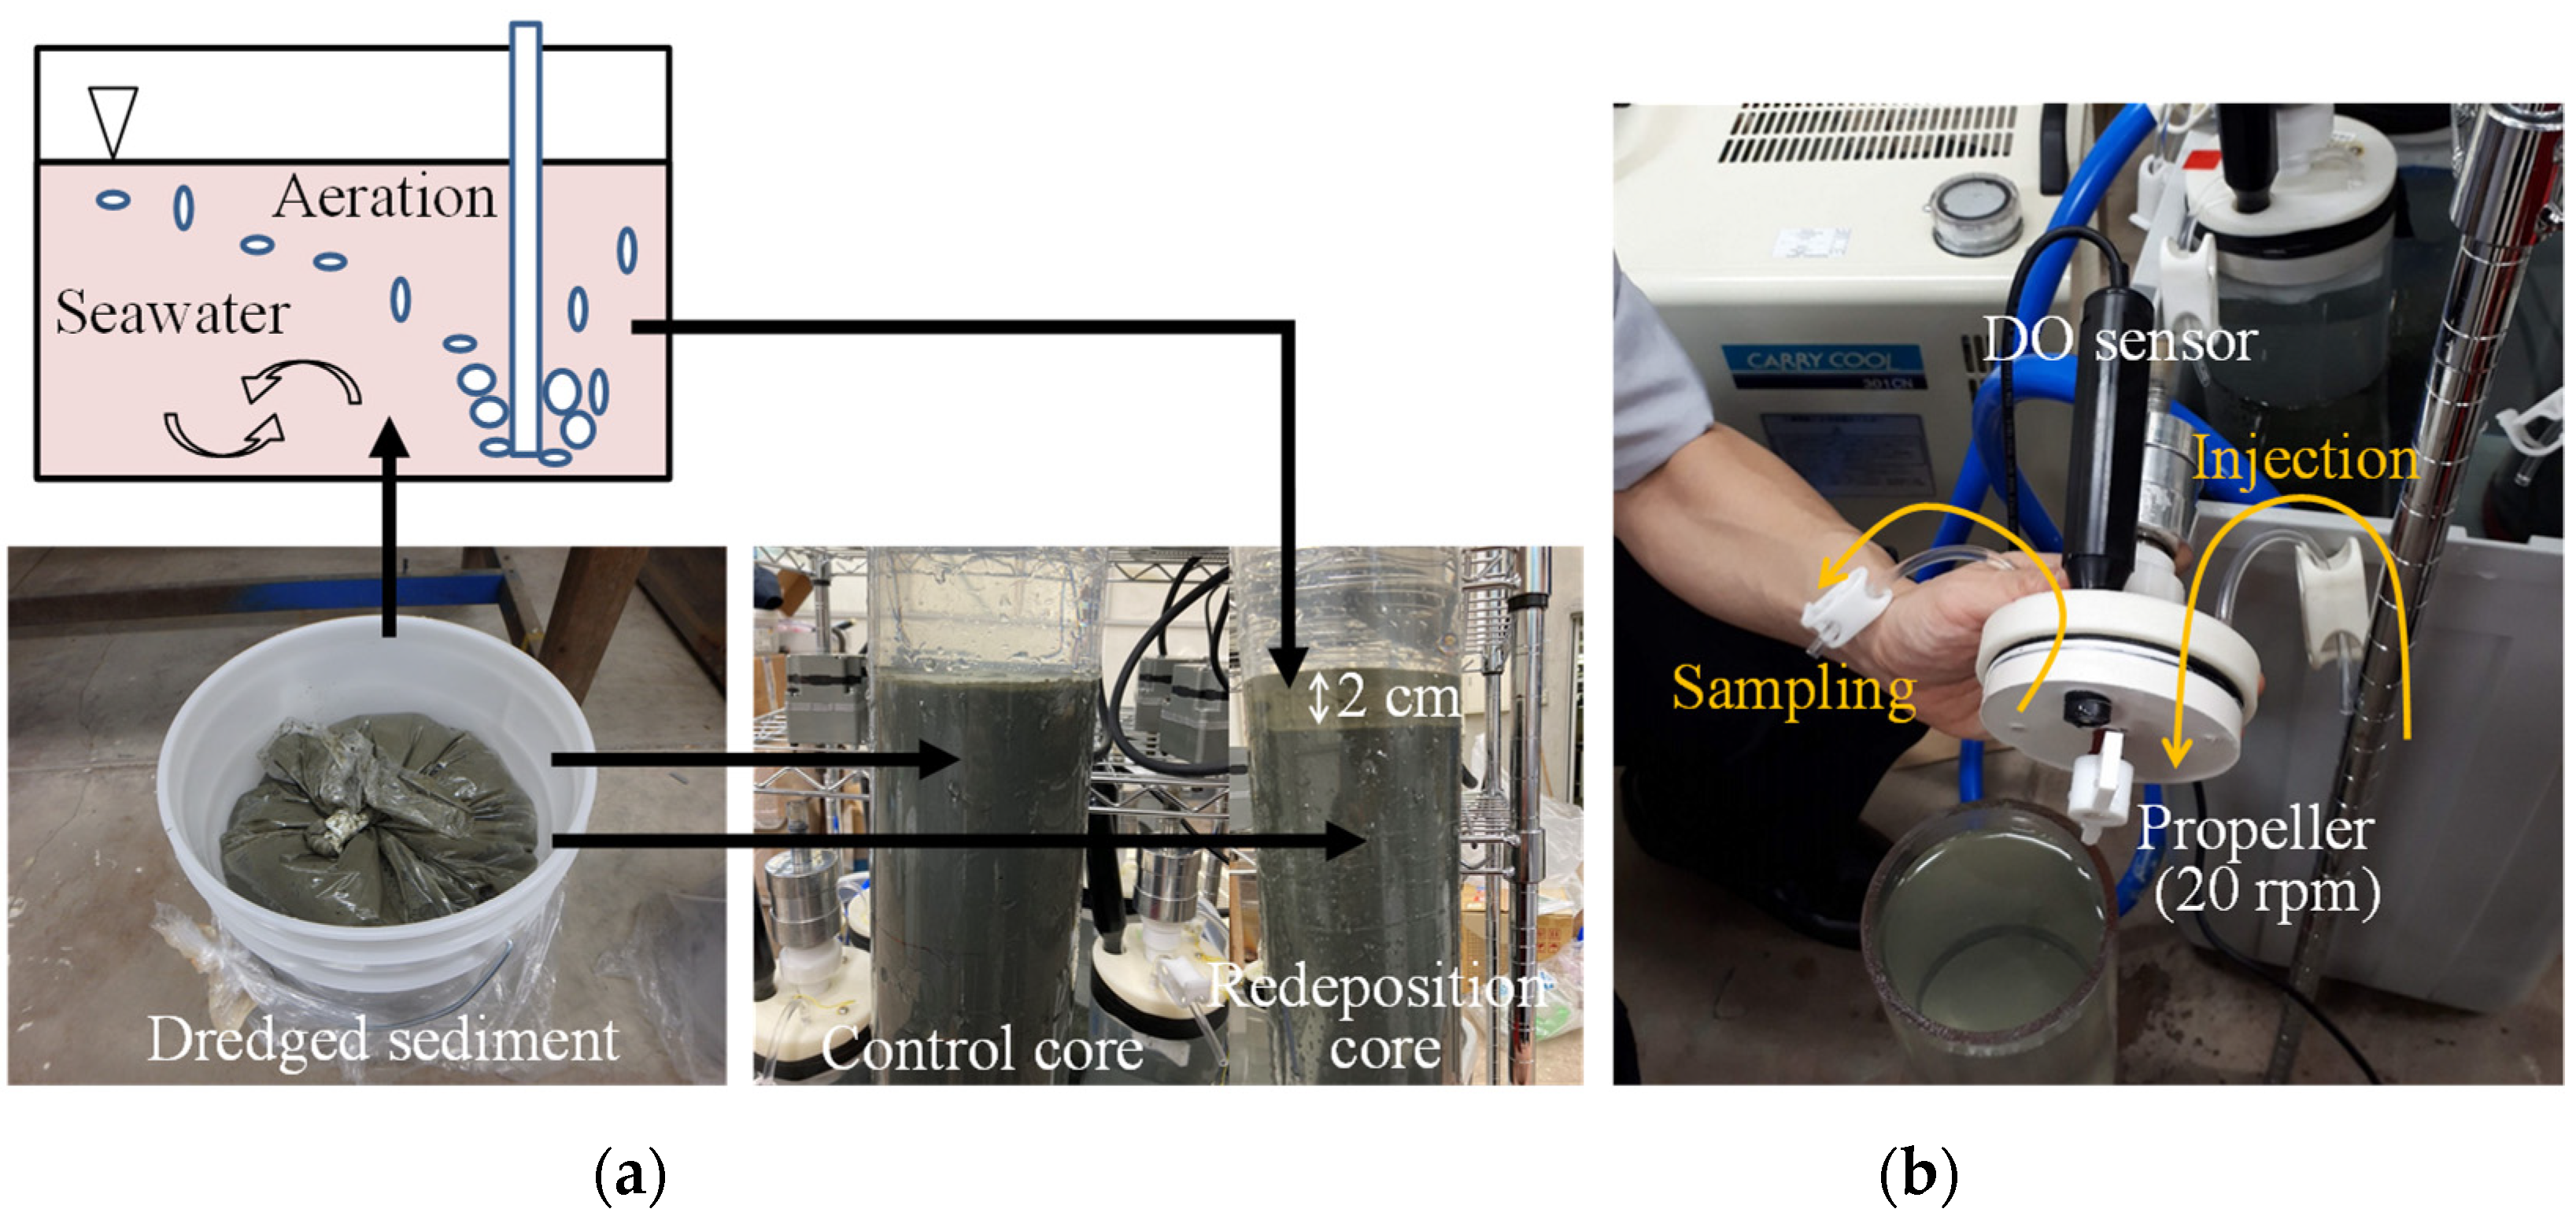
2.2. Incubation Experiment

Three cores were made as the “control cores” (Cores 1, 2 and 3), and the other three were made as the “redeposition cores” (Cores 4, 5 and 6), as shown in Figure 2a. The inner diameter of the clear cylinder was 10 cm. The dredged sediment was placed with a 30 cm thickness in the control cores and 28 cm thickness in the redeposition cores. The control cores represent the present seafloor of Osaka Bay. A part of the dredged sediment was aerated for 8 h and then redeposited. This sediment was then covered with 2 cm of the surface redeposition cores to represent post-tsunami redeposition. Artificial seawater for research (MARINE ART SF-1, Tomita Pharmaceutical, Tokushima, Japan) was carefully poured into the upper part of the cores to avoid sediment suspension. The cores were sealed by a silicone lid fitted with a dissolved oxygen (DO) sensor (DO-24P, TOA DKK, Tokyo, Japan), a Fluororesin propeller and two water sampling tubes, as shown in Figure 2b. The water overlying the sediment was agitated using a propeller with a rotation speed of 20 rpm for thorough mixing and to control the hydrodynamic conditions in the cores [16,17]. No resuspension of the sediment particles was observed. The DO concentrations in the overlying water were measured at 10 min intervals (WA-2017SD, FUSO, Tokyo, Japan) to confirm anoxic conditions. The cores were installed in water baths and were maintained at 23 °C, consistent with the water temperature of the sampling site in the summer. Incubation was continued for five days after 1 day of preincubation, which was inferred to be sufficient to achieve in situ conditions [18]. The overlying water was sampled three times (10, 12, and 15 November) during the incubation. When artificial seawater (50 mL) was injected into the upper part of the overlying water with a syringe from the tube (4 mm inner diameter, 6 mm outer diameter, LMT-55, Saint-Gobain K.K., Tokyo, Japan) on one side, the overlying water was pushed out from the other tube. The propeller was stopped at this time. Artificial seawater has a lower temperature than the overlying water, so it sank and was not pushed out. The first 10 mL of overlying water that was exposed to air was discarded. The latter 40 mL was collected in a syringe and immediately filtered using a disposable filter with a pore size of 0.45 μm (Minisalt SM16555 K, Saltrius, Tokyo, Japan).
After the incubation experiment, the overlying water was drawn, and three layers from the surface of the sediment, each 1 cm thick, were removed. These sediments were centrifuged at 3000 rpm for 10 min to separate pore water. The supernatant of pore water was filtered in the same manner as the overlying water.
The overlying and pore waters were reacted with NH4-N and PO4-P pack test reagents (WAK-NH4-4 and WAK-PO4(D), Kyoritsu Chemical-Check Lab., Corp., Kanagawa, Japan) based on the indophenol and colorimetric methods, respectively. The water samples were analyzed using a spectrophotometer (SP-808, T&T Co., Ltd., Kanagawa, Japan) at 630 nm and 870 nm.

2.3. Calculation Methods

The oxygen consumption rate, R (g m−2 day−1), of the overlying water was calculated by the following equation, which is a modification of the equation shown in [16].
R = d D O d t V A ,
where dDO/dt is the variation in DO concentration during time t and is obtained as the slope in a linear regression equation, as shown later. A is the cross-sectional area of the core, and A = 78.5 cm2 for all cores. V is the volume of the overlying water, calculated by measuring the height of the overlying water of each core (Core 1: 19.4 cm, Core 2: 20.2 cm, Core 3: 19.4 cm, Core 4: 19.4 cm, Core 5: 18.5 cm, Core 6: 18.5 cm).
Release rates were estimated by the sediment core incubation method [19] and the mathematical modeling method [16]. The core incubation method considers that the release from sediment leads to a change in concentration in the overlying water. The mathematical model method is based on the diffusion equation from the vertical gradient of pore water concentrations. Since the pore water was collected after the incubation experiment, the release rates determined by the mathematical model method are reference values. The release rate, Fc (mg m−2 day−1), determined by the core incubation method was as follows:
F c = d C w d t V A ,
where Cw is the concentration in the overlying water. Three evaluation periods were established with 10~12 November being referred to as the first half, 12~15 as the latter half and 10~15 as the entire period, and concentration gradients were determined for each period. The release rate, Fd (mg m−2 d−1), determined by the mathematical modeling method was as follows [20]:
F d = φ D d C p d z ,
where φ is the porosity, D is the diffusion coefficient, Cp is the concentration in the pore water and dz is the layer thickness. The release rates were determined by the concentration gradient, Cp/dz, between the first layer of pore water and the overlying water for which has dz = 0.5 cm. The diffusion fluxes in the pore water can also be calculated with Equation 1, in this case using dz = 1 cm. We used moisture content observations by the Research Institute of Environment, Agriculture and Fisheries of Osaka Prefecture in 2013 as φ, where that of the inner part of Osaka Bay is generally 65~75% [12], and φ = 0.7 in this study. D (cm2 s−1) in the sediment depends on the pore water temperature, T (°C), and was determined as follows [20]:
R D = ( m 0 + m 1 T ) × 10 6 ,
where m0 and m1 are coefficients and different for each ion: m0 = 9.50 and m1 = 0.413 for NH4-N and m0 = 2.62 and m1 = 0.143 for PO4-P.

3. Results

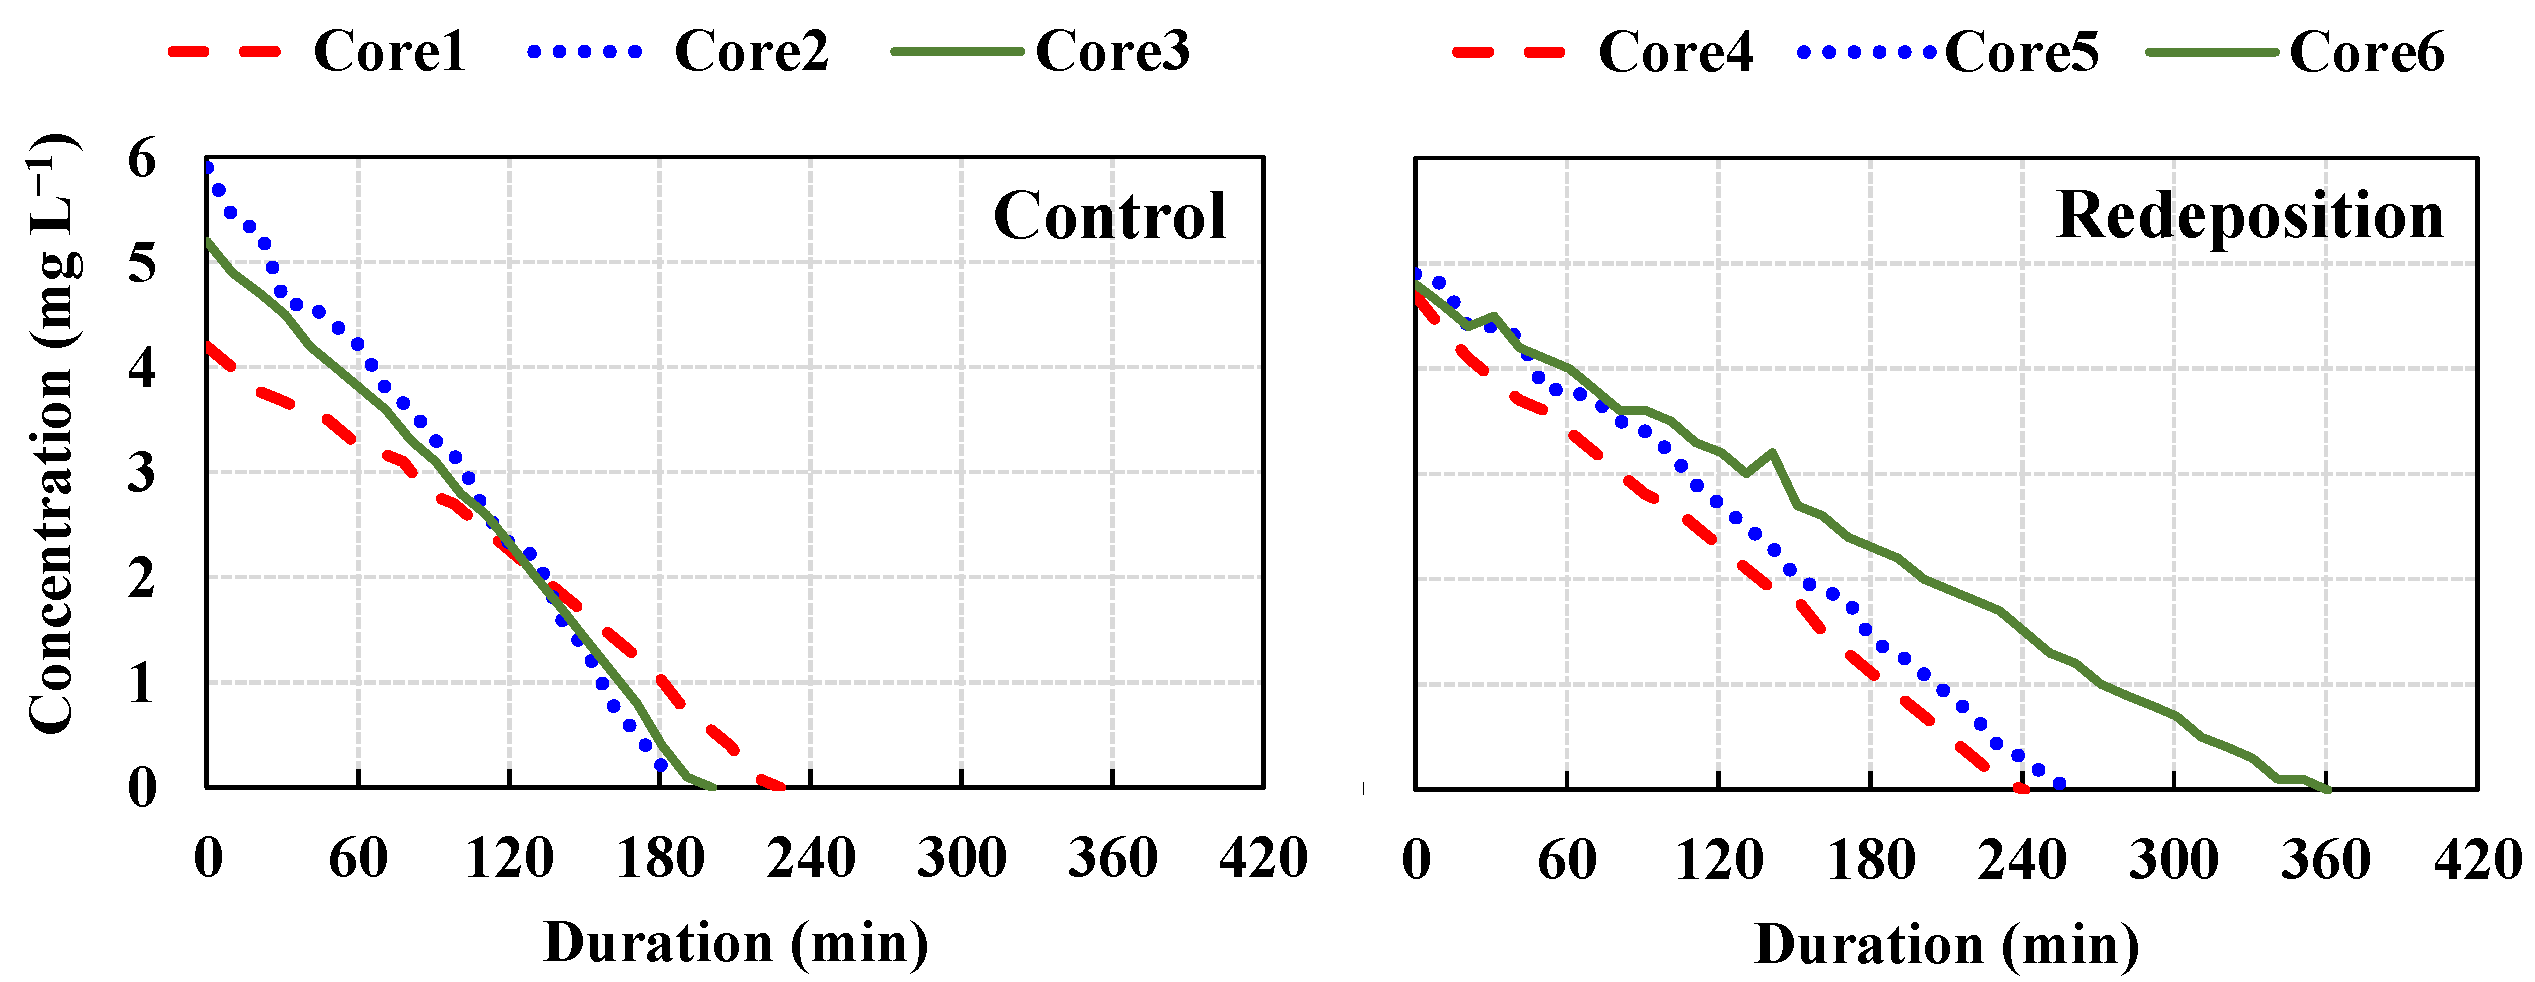
3.1. Oxygen Consumption Rate
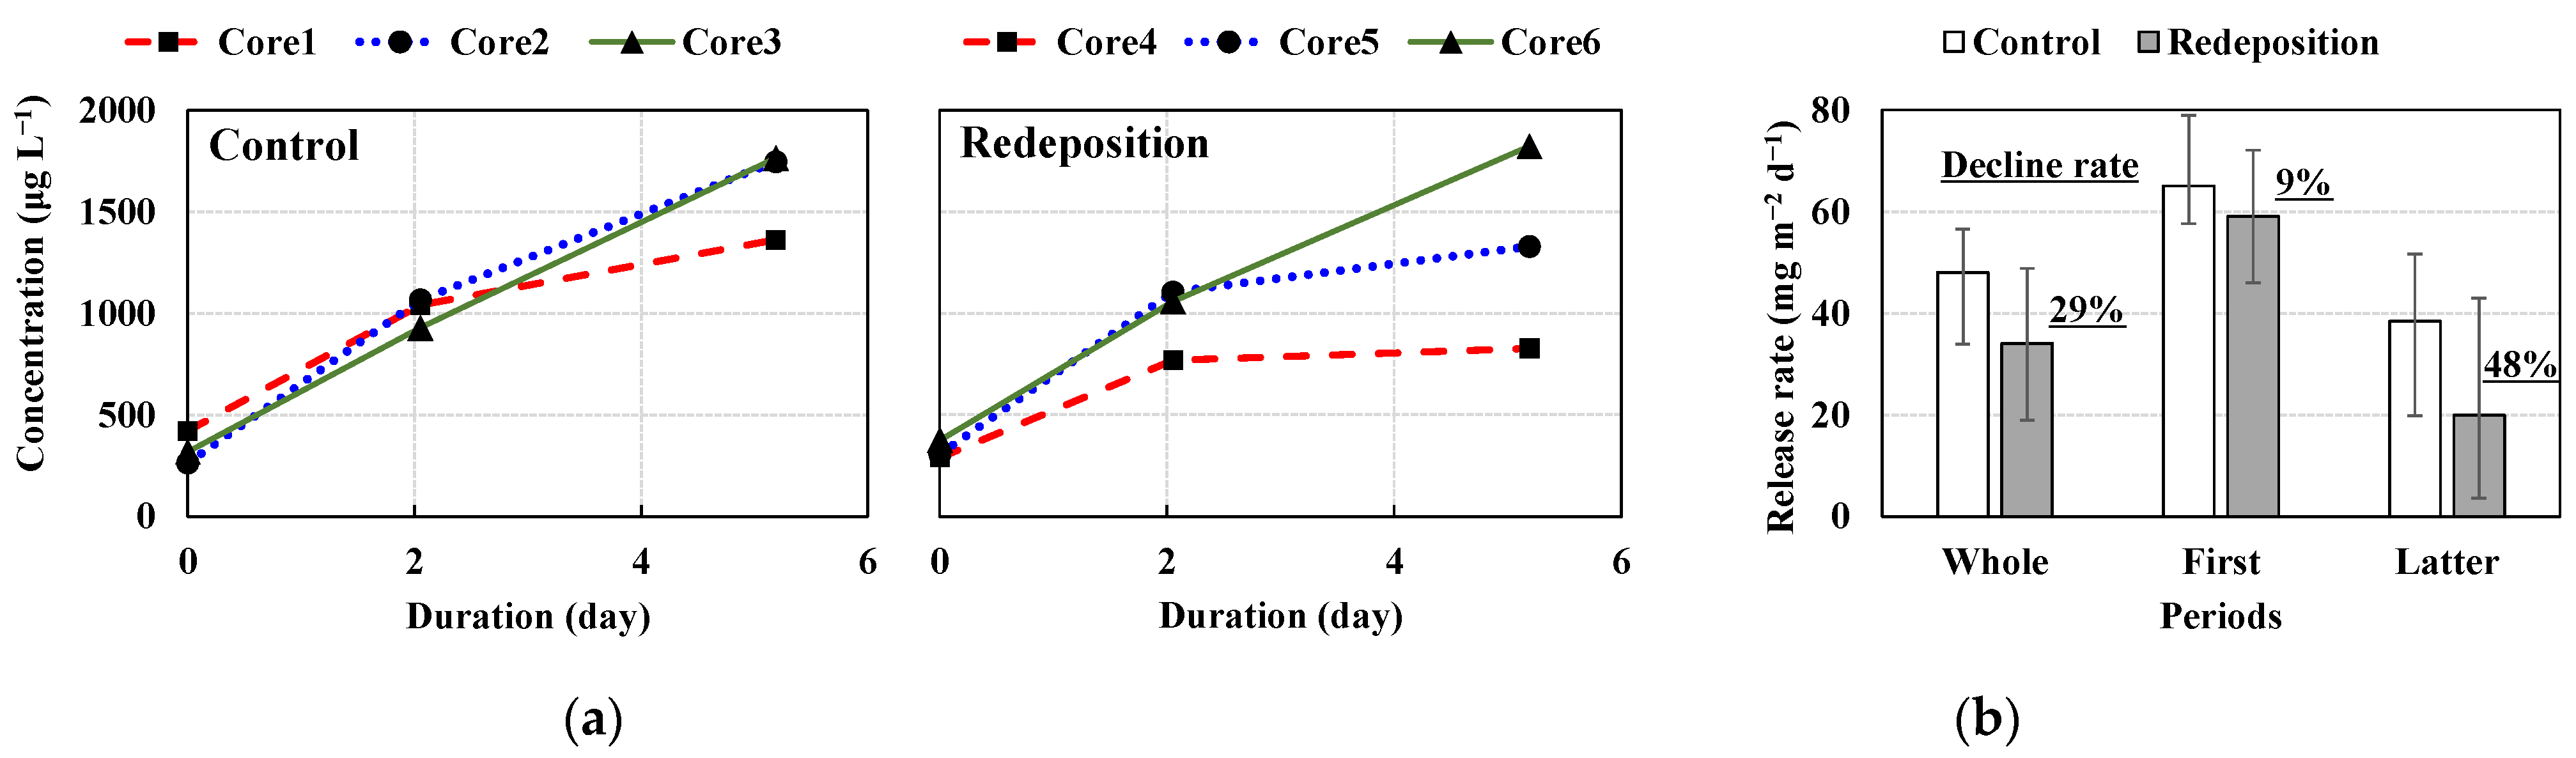
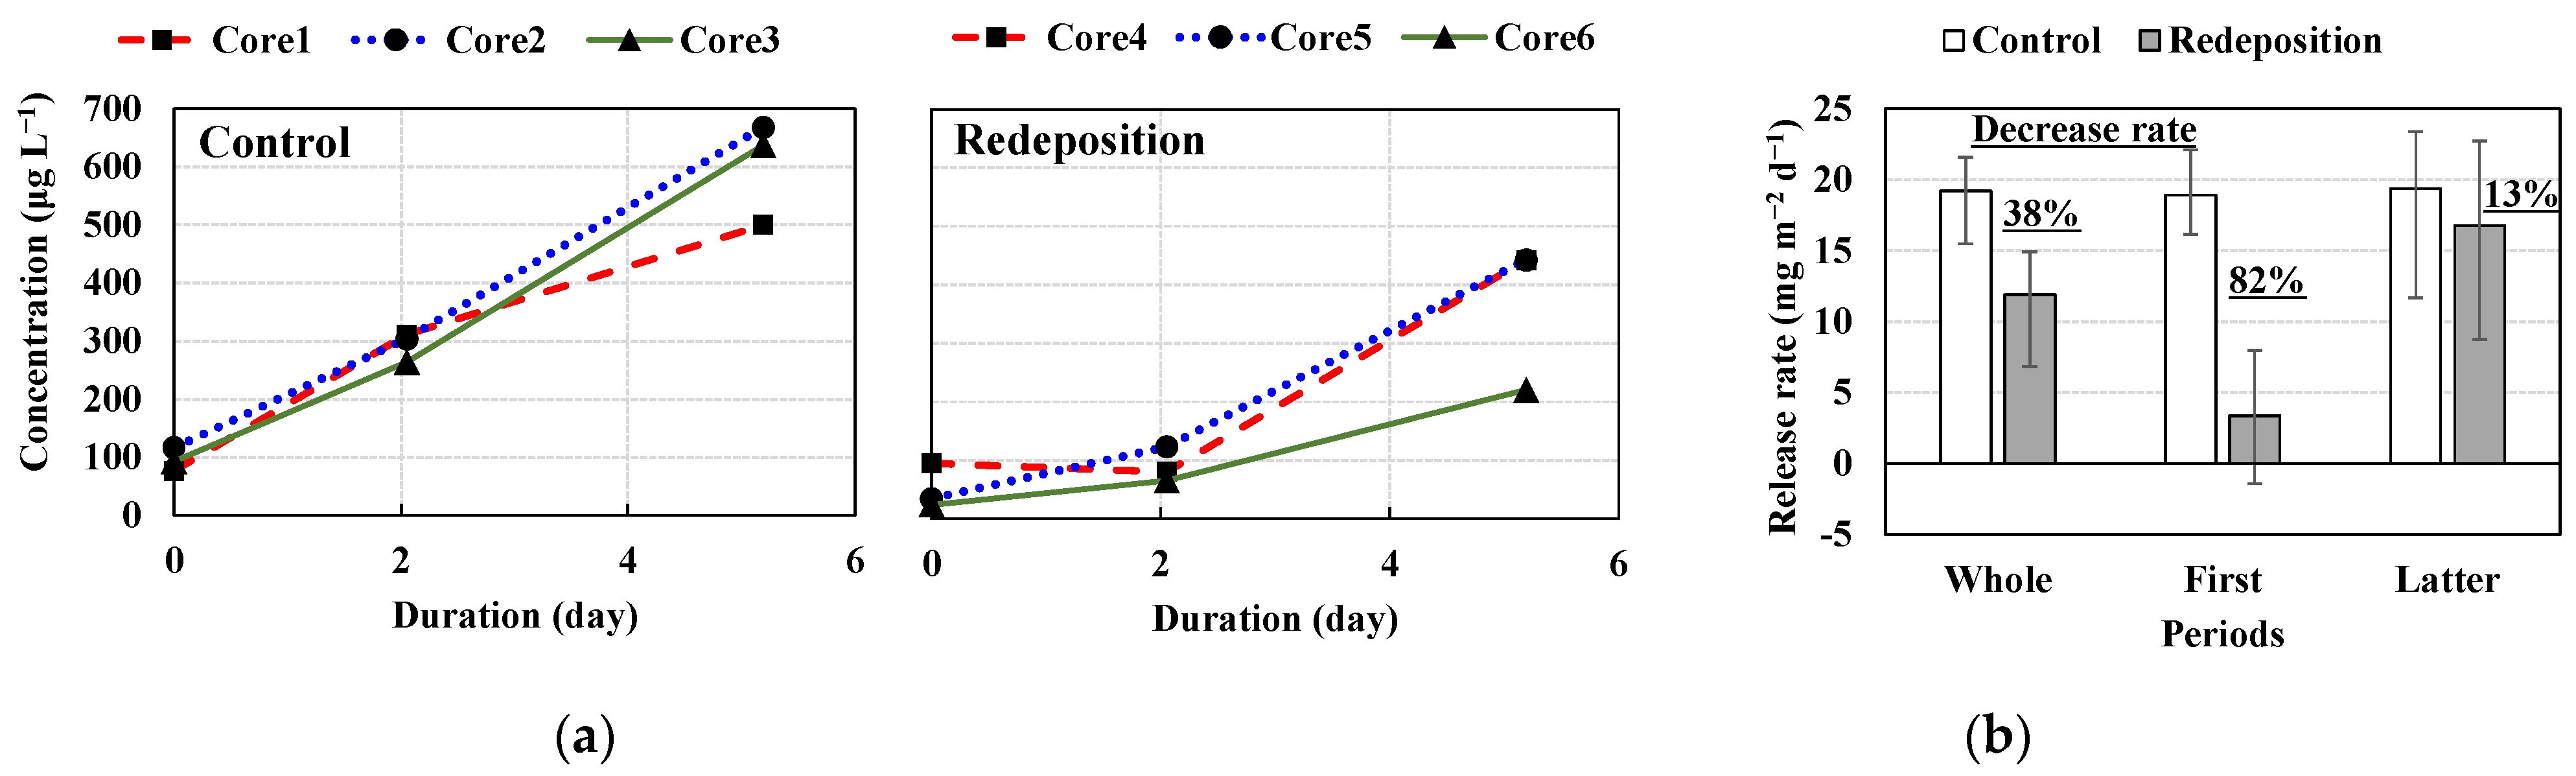
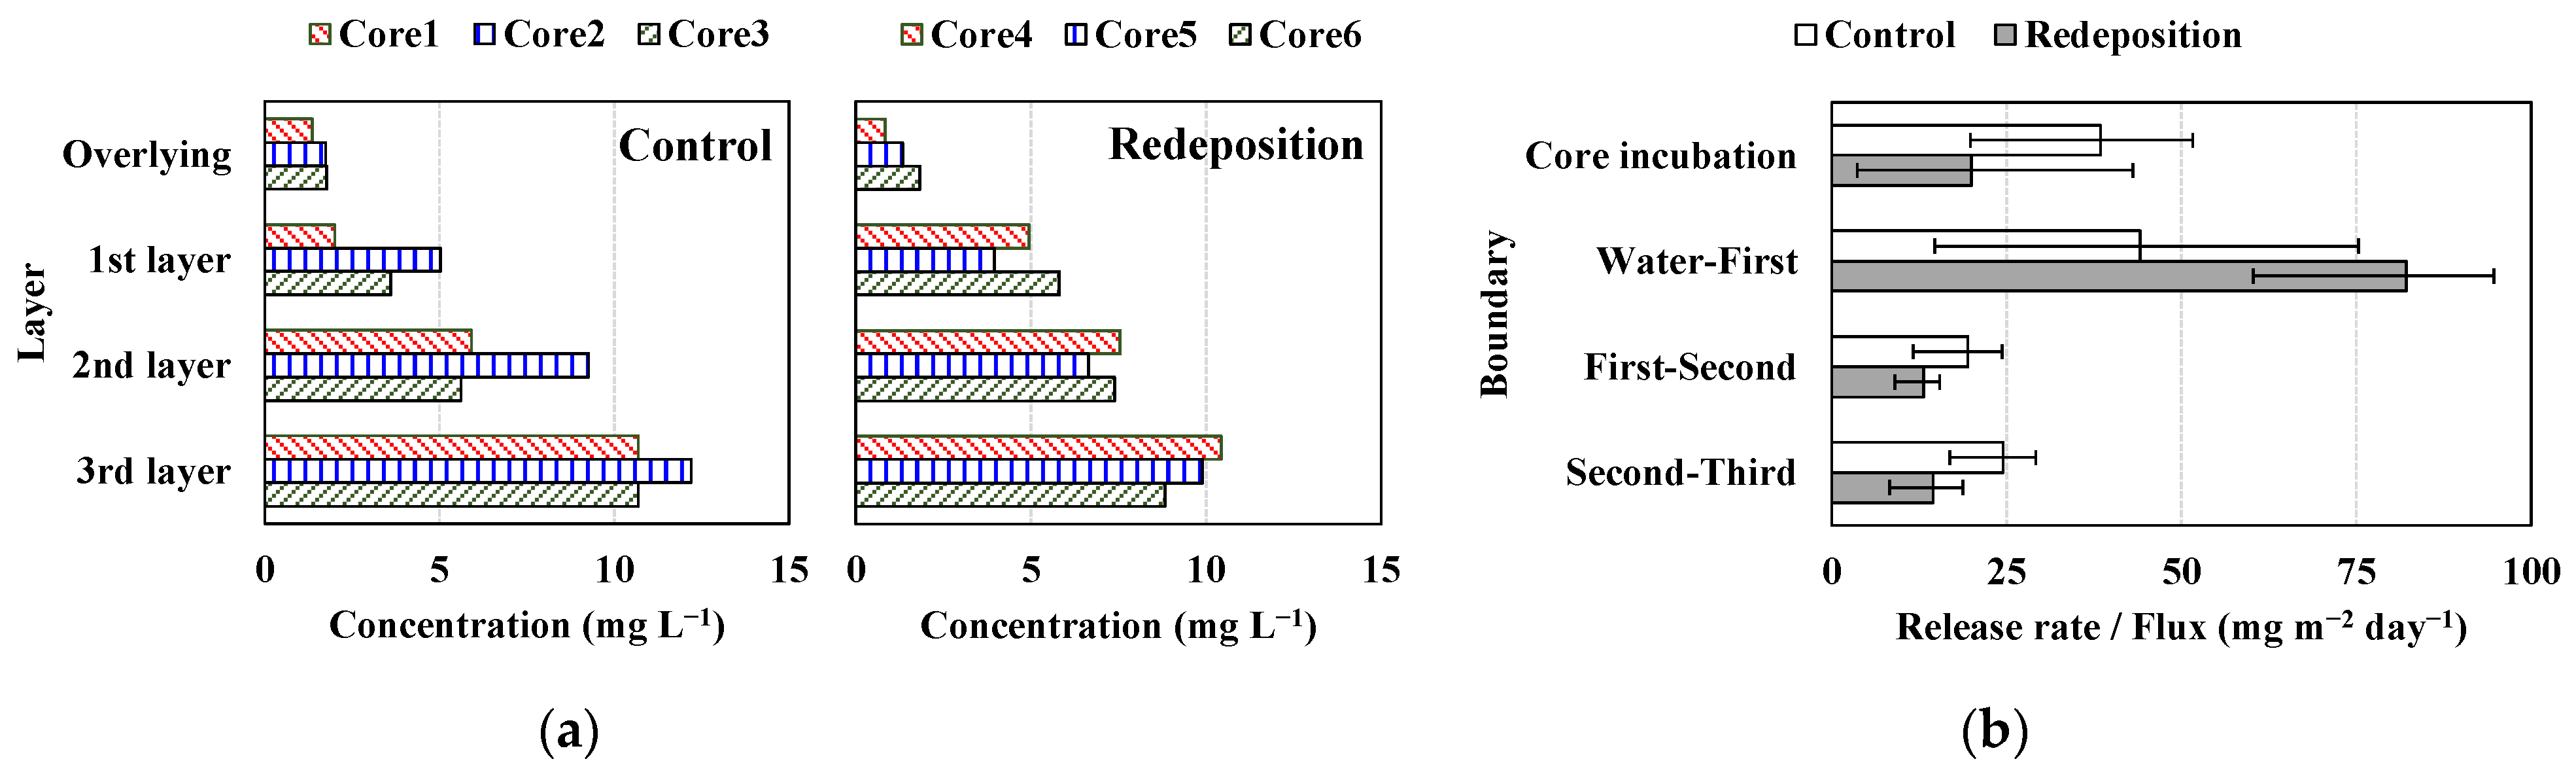
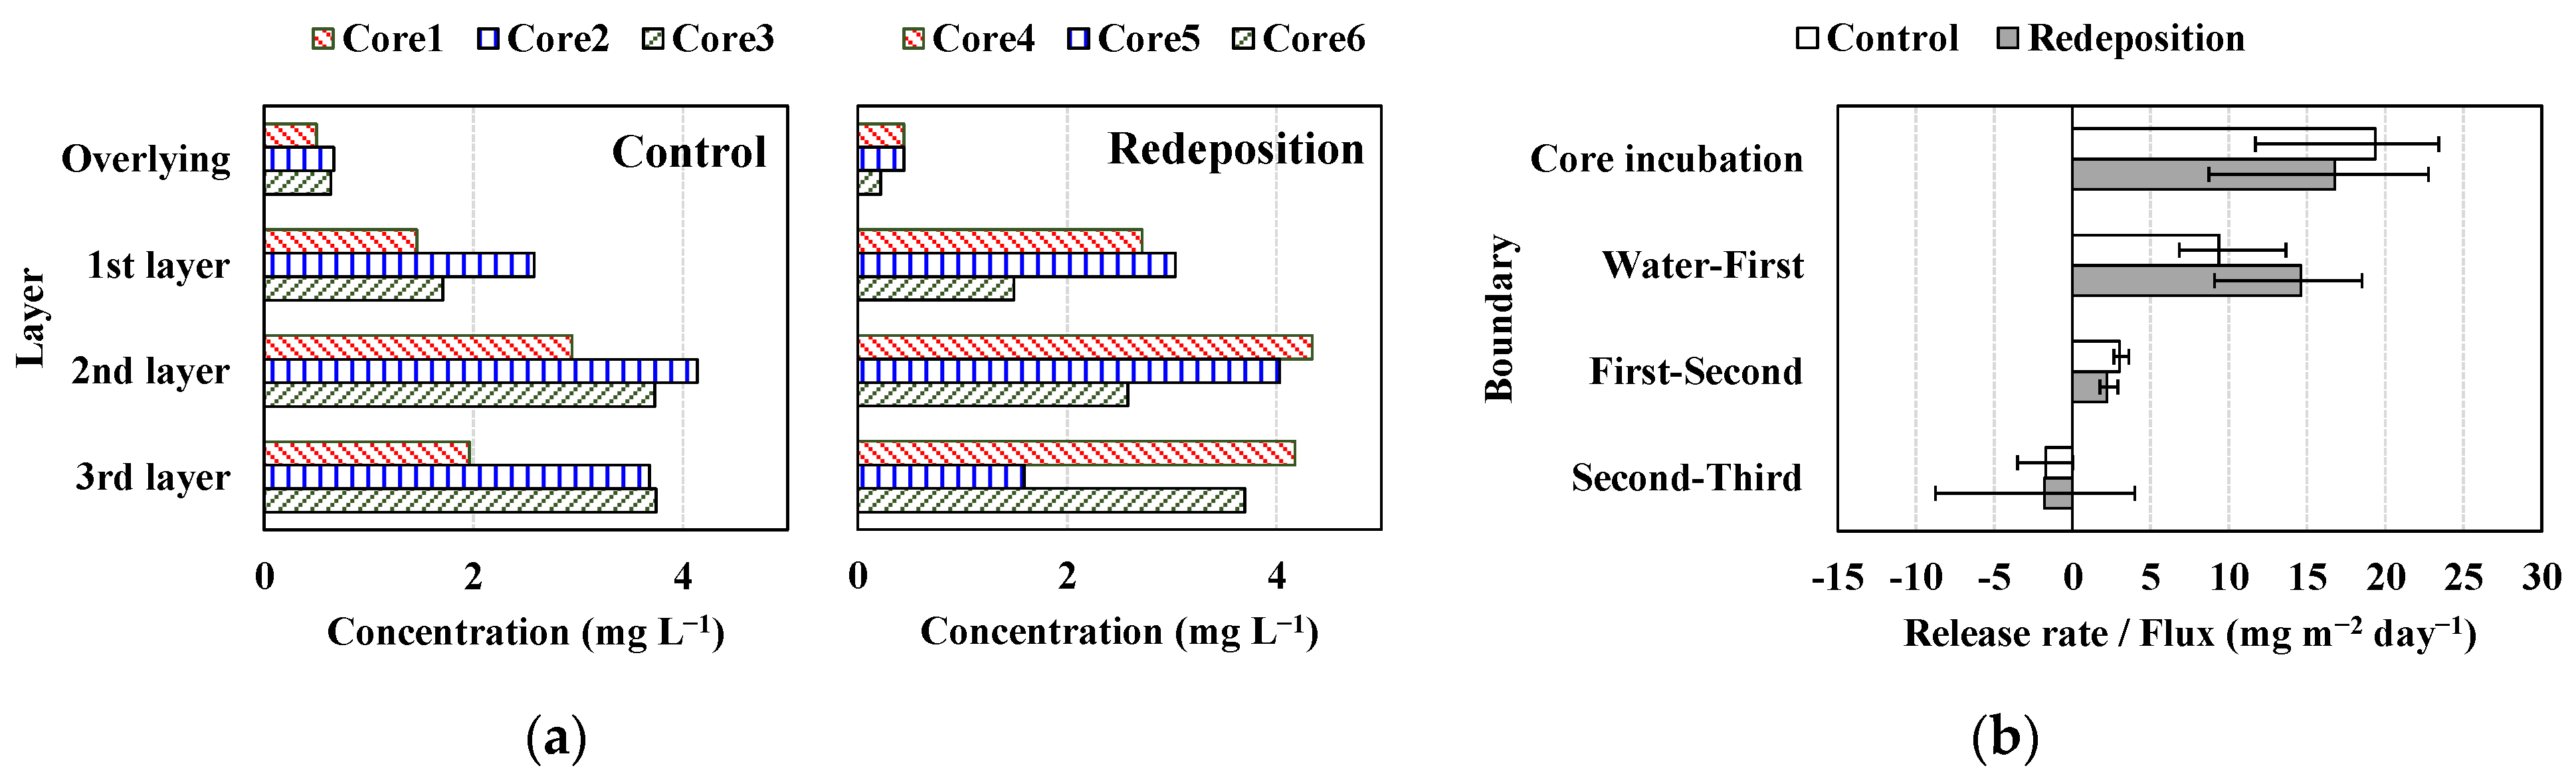
Figure 3 shows the time series of oxygen concentrations in the overlying water of the control cores and redeposition cores. The rates of decrease in oxygen concentration were approximately constant in all cores and can be expressed by a linear regression equation in each core. The oxygen consumption rates calculated by Equation 1 were 4.68 g m−2 day−1 for the redeposition cores compared to 7.10 g m−2 day−1 for the control cores, showing on average, a 66% decrease. This result suggests that the oxygen consumption rate may decrease for a while after a tsunami because the redeposition of oxidative sediments by the tsunami reduces oxygen uptake from the overlying water. The consumption rate obtained by this experiment was larger than typical values (~4 g m−2 day−1 at a maximum [16,21,22]). The pore water may have extruded to the overlying water in the early stages of the experiment due to sediment settling [20].

3.2. Release Rates

Figure 4a shows the temporal change in NH4-N concentration in the overlying water of the control cores and redeposition cores. Increased concentrations were observed in all cores. Figure 4b shows the release rate of NH4-N estimated by the core incubation method and is the average of three cores. In all evaluation periods, the release rates were smaller in the redeposition cores than in the control cores. The decline rate in the redeposition cores relative to the control cores was 29% over the entire period. Release rates were larger in the first half for both types of cores. The decline rate of the redeposition cores increased in the latter half because the release rate in these cores greatly decreased.
Figure 5a shows the temporal change in the PO4-P concentration in the overlying water of the control cores and redeposition cores. Figure 5b shows the release rate of PO4-P estimated by the core incubation method and is the average of three cores. The concentrations in Core 4 decreased in the second measurement; otherwise, the concentrations increased. The release rates of the redeposition cores were smaller in all evaluation periods, and the decline rate of the redeposition cores was 38%. The decline rate of the control cores was similar in the first and latter halves. On the other hand, the decline rate for the redeposition cores was greater in the first half because of the smaller release rate.
Figure 6a shows NH4-N concentrations in the pore water of the control cores and redeposited cores with NH4-N concentrations in the overlying water on 15 November. Figure 6b shows the release rate and diffusion fluxes of NH4-N estimated by the mathematical modeling method with the release rate in the latter half determined by the core incubation method and is the average of three cores. Because the concentrations were higher in the lower layers in all cores, the release rate and diffusion fluxes moved upward in all layers. Contrary to the results from the core incubation method, the release rate of the redeposition cores by the mathematical modeling method was greater than that in the control cores because of the higher concentration in the first layer of the redeposition cores compared to the control cores. On the other hand, the concentrations in the lower layer of the redeposition cores were higher than the concentrations in the control cores, resulting in a smaller diffusion flux in the redeposition cores. The diffusion flux under the first layer was 1/2 of the release rate for the control cores and 1/6 for the redeposition cores, and the vertical concentration gradient of the redeposition cores was steeper than that of the control cores. The release rates estimated by the mathematical modeling method were 1.1 times higher than those estimated by the core incubation method for the control core and 4.1 times higher for the redeposition core.
Figure 7a shows the PO4-P concentrations in the pore water of the control cores and redeposition cores, and Figure 7b shows the release rates and diffusion fluxes of PO4-P estimated by the mathematical modeling method with the release rate in the latter half determined by the core incubation method and is the average of three cores. PO4-P concentrations did not differ significantly between the control and redeposition cores and reached a maximum in Layer 2 with the exception of Core 6. Therefore, the diffusion fluxes in the second-third boundary layer moved downward. The release rate of the redeposition cores determined by the mathematical modeling method was greater than that in the control cores, similar to the results for NH4-N. The vertical concentration gradient of the redeposition cores was steeper than that for NH4-N, as the diffusion flux under the first layer was 1/3 of the release rate for the control cores and 1/7 for the redeposition cores. The release rates estimated by the mathematical modeling method were 0.5 times those estimated by the core incubation method for the control cores and 0.9 times for the redeposition cores; the rates did not differ significantly between the mathematical modeling and core incubation methods.

4. Discussion

4.1. Oxygen Consumption Rate

Two possibilities for the high oxygen consumption rate by extrusion of pore water were verified for the control cores. The first is that pore water with a DO concentration of 0 mg L−1 is extruded, and then the DO concentration in the overlying water decreases; therefore, the oxygen consumption rate increases. This possibility was verified by the oxygen budget expressed as follows:
D O 0 + D O = V D O 0 V + D O ,
where DO0 is the initial DO concentration. ΔDO is the reduction in concentration in the overlying water and is based on the slope shown in Figure 3a. ΔV is the volume increase of overlying water and is the volume of pore water extrusion required to change ΔDO. ΔV was 528~665 mL when Δ = 60 min. The pore water volume was approximately 1649 mL (= 30 ). To reach the oxygen consumption obtained in the experiment, 30~40% of the pore water must be extruded in one hour. It is impossible to explain the magnitude of the oxygen consumption rate by this phenomenon alone.
The other is that reducing substances (Fe2+, Mn2+ and H2S) in the pore water are extruded into the overlying water and combined with oxygen by the following reaction equation; therefore, oxygen consumption is accelerated.
2Mn2+ + O2 + 2H2O → 2MnO2 + 4H+
4Fe2+ + O2 + 6H2O → 4FeOOH + 8H+
H2S → SO42− + 2H+
The concentrations of Fe2+, Mn2+ and H2S in the pore water of each core were Fe2+ = 0.1~1 mg L−1, Mn2+ = 0.5~10 mg L−1 and H2S = 20~60 mg L−1. Therefore, the maximum oxygen consumption by Reaction 6 calculated for each core was 0.28~125.25 mg L−1. On the other hand, the oxygen consumption per unit volume in overlying water is determined by the product of the oxygen consumption rate and the time to anoxia. Assuming that the difference between the experimental and general values of the oxygen consumption rate is due to the oxygen consumption of Reaction 6 in the overlying water, we estimated the volume of extruded pore water that could account for this difference. The volume was obtained for each core by dividing the oxygen consumption determined from the difference in oxygen consumption rates by oxygen consumption due to Reaction 6. The results showed that the required volumes were 30~169 mL. The experimental values are achieved when approximately 2% of the pore water is extruded since oxygen consumption is high when the reducing substance concentration in the pore water is high. Even when the reducing substance concentrations are low, this is achieved when approximately 10% of the pore water is extruded.
When this extrusion occurs, the apparent oxygen consumption rate increases. This increase was estimated to be 0.10~0.39 g m−2 day−1. This oxygen consumption rate is up to 4% of the experimental results. Settling of sediment likely occurred in the early stages of the experiment after cores were made. It had little effect on the incubation experiment.

4.2. Release Rates

The release rate from the redeposited sediments after exposure to an aerobic environment decreased to approximately 70% for NH4-N and 60% for PO4-P. The sediments suspended by the tsunami would be mixed and redeposited. A single type of sediment at one site was used in this study. Considering the type of sediments used and the dredging location, the reduction in the release rate obtained in this study is considered to be near the maximum. Marine sediments containing N and P were suspended in seawater by the tsunami, and it was estimated that TN and TP concentrations in seawater in the inner part of Osaka Bay might exceed environmental standards [23]. Anaerobes may also be released into the seawater at the same time. Therefore, the number of anaerobes and NH4-N and PO4-P concentrations might decrease in the redeposited sediments. In such an environment, it is possible that the NH4-N concentration in the pore water did not recover because the reduction reaction was less advanced than usual in the redeposited sediments. It is difficult to verify these possibilities because it is difficult to measure the temporal variation in NH4-N concentrations in the pore water, and information on the substances and bacteria associated with the oxidation and reduction reactions was not obtained in the experiment. Moreover, when the sediment is oxidative, a thin oxide film is formed on the sediment surface by ferric hydroxide. It is possible that PO4-P adsorbed on this ferric hydroxide and reduced the release rate [24]. As oxygen consumption advances in the sediment and becomes reductive, ferric hydroxide is reduced, the film dissipates and then desorption and release of the adsorbed PO4-P begins [17,19]. The precipitous increase in the release rate of PO4-P in the latter half of the experiment may have been caused by this phenomenon. It has been reported that covering the bottom sediments of aquaculture farms suppressed nutrient release and red tide [25]. Our results suggest that disturbance and redeposition of marine sediments by tsunamis may suppress primary production, which means the proliferation of phytoplankton.

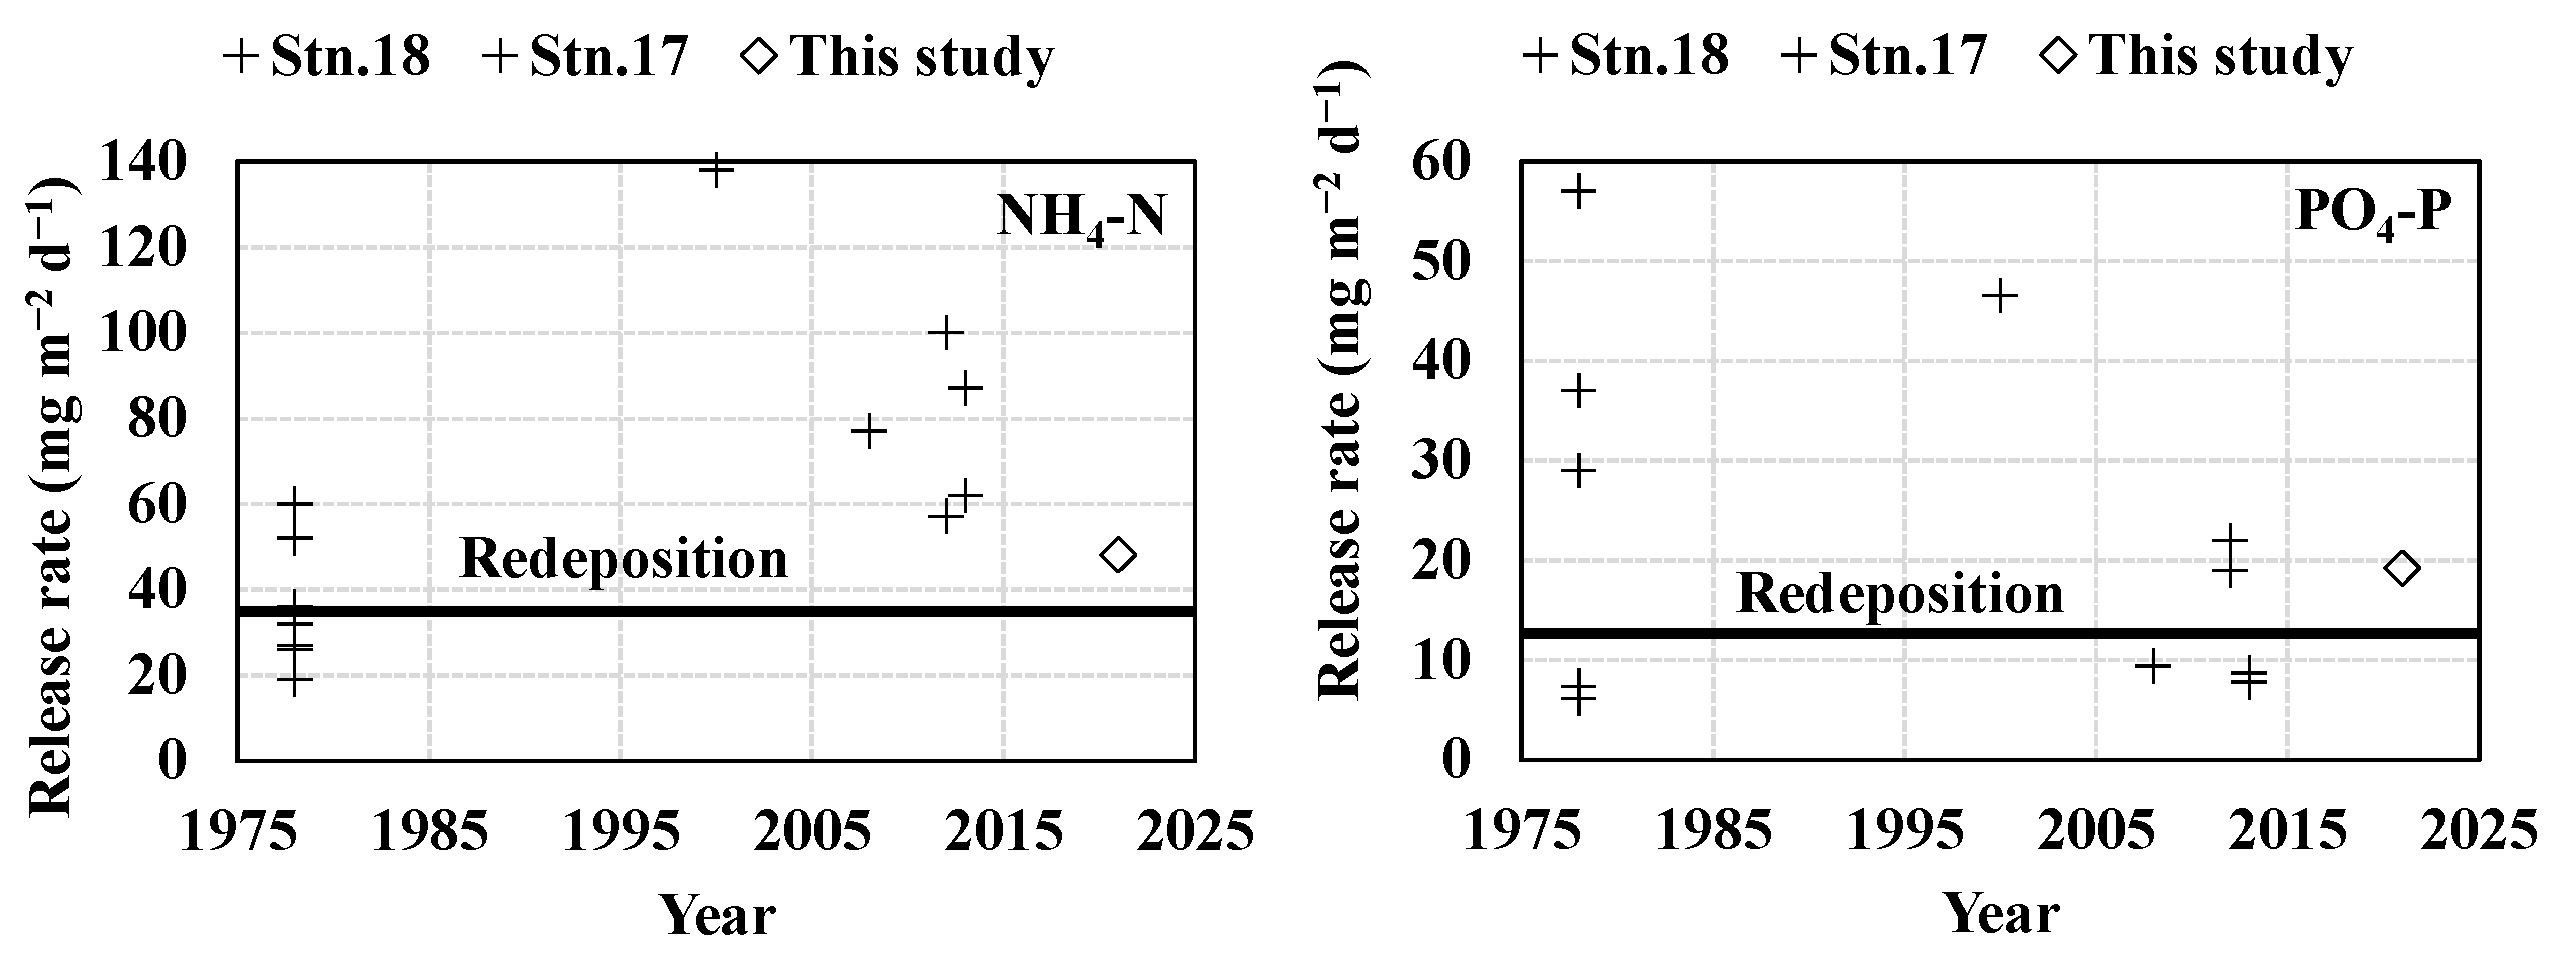
4.3. Comparison with Previous Release Rates

The release rates in Osaka Bay determined by the core incubation method were collected from the literature [15,26,27,28,29,30] listed in Table 1 to compare with the experimental results. It was noted that quantitative comparisons are difficult due to the wide range of estimated release rates, but it is meaningful to understand the values and trends [15,31]. The release rates for each bay are summarized in tables but did not show specific months or sampling locations. Therefore, data for June to October at sampling locations with environments similar to that of the location in this study were extracted from the original studies. In addition, new data have been added. The maximum value indicated in reference [28] was used in cases of unknown sampling locations. DIN (dissolved inorganic nitrogen) was shown in the literature [27], but most of its forms were NH4-N.
Figure 8 shows the temporal change in the release rates of NH4-N and PO4-P. The release rates obtained in the experiment are considered reasonable compared to the historical values. The history of the biological production environment in Osaka Bay is described based on Figure 9 [13]. Eutrophication and large-scale red tides occurred in the Seto Inland Sea including Osaka Bay, with rapid economic growth until the early 1970s [14] and fishing rose with a time lag. Organic pollution loads from rivers were reduced to improve water quality. TN and TP concentrations and red tides in the sea decreased, but fishing also began to decline. Until this time, primary production was mainly supported by river-originating nutrients. TN and TP loads have also been targeted for reduction since 2001, and TN and TP concentrations in the sea were further reduced [32,33]. As a result, discoloration of seaweed [34] and a further decrease in fishing were observed [35]. The Seto Inland Sea, excluding Osaka Bay, is considered to have become oligotrophic [36], and the reduction in the load from rivers was suspended in 2006. Eutrophication measures are also working effectively in Osaka Bay, red tides have been suppressed [37], and fishing has also begun to decline [35]. Therefore, the water quality policy shifted from improvement to maintenance in 2022. Under these conditions, the release rate of NH4-N has been decreasing since 2000, and the control core value is an extension of this trend. The release rate of PO4-P appears to have remained low since 2008. The reduction in release rates, in addition to the reduction in loads from rivers, led to lower TN and TP concentrations and fishing in Osaka Bay.
The release rate of NH4-N in the redeposition cores was as low as that before the increase in fish catches in the 1980s in Osaka Bay, and the release rate of PO4-P was near the lowest level. The primary production of Osaka Bay is limited by phosphorus, as the TN/TP molar ratio in seawater calculated from Figure 9 is 20 or more, which is higher than the Redfield ratio of 16. The release rates of the redeposition cores are values experienced in the inner part of Osaka Bay in the past. However, under the current situation where the contribution of release for nutrients in seawater is significant [14], the reduction in the release rate of PO4-P by tsunamis may be more limiting for primary production.
On the other hand, the release rate of NH4-N in the redeposition core could be achieved if the current decreasing trend continues, which could become a reality even without tsunamis. The N/P ratio in Osaka Bay decreased, primary production from spring to summer in the western part of Osaka Bay decreased due to the depletion of DIN, and biological production also decreased [38]. If the release rate of NH4-N decreases, the limiting factor of primary production may change from phosphorus to nitrogen even in the inner part of Osaka Bay, and tsunamis could bring about this change. The supply ratios of DIN required for seaweed culture in Osaka Bay and Harima-nada on the western side of Osaka Bay (see Figure 1) were presented for each source, classified into load from rivers, seawater exchange with the adjacent bay and release from marine sediments [39]. In Osaka Bay, the release accounted for 30% (17 ton day−1), and in the northern Harima-nada and Kii Channel areas, the seawater exchange accounted for 48% (32 tons day−1) and 59% (34 tons day−1), respectively. Assuming that the supply of DIN through seawater exchange to the northern Harima-nada and Kii Channel areas comes from Osaka Bay, where DIN concentrations are high, the DIN release in Osaka Bay accounts for slightly less than 20% (10 ton day−1) of the supply ratio in the northern Harima-nada and Kii Channel areas. In fact, nutrient release from the sediments to seawater in Osaka Bay and Harima-nada had a significant effect on nutrient concentrations in seawater [14]. Osaka Bay is a source of nutrients to the surrounding seas, and a decrease in the release rate due to a tsunami has the potential to also affect the primary production in these seas.

5. Conclusions

Tsunamis induced by the Nankai Trough earthquake may disturb marine sediments in the inner part of Osaka Bay. Since nutrient release from marine sediments has a significant impact on the nutrient concentrations in seawater, an incubation experiment was conducted to estimate the release rates of NH4-N and PO4-P in order to understand the present rates and to quantify the changes in the rates due to tsunamis. Two types of cores were created: “control cores” representing the current sediment and “redeposition cores” representing redeposition after the tsunami. The current release rate of NH4-N is an extension of the decreasing trend since 2000. The release rate of redeposited sediments after exposure to an aerobic environment due to tsunamis may decrease to approximately 70% of the current level for NH4-N. A tsunami may change the limiting factor of primary production from phosphorus to nitrogen, even in the inner part of Osaka Bay. The PO4-P release rate has remained at a low level since 2008. Moreover, the release rate of PO4-P in the redeposited sediments may decrease to approximately 60% of the current level after a tsunami. Nutrient concentrations and fishing have begun to decline in Osaka Bay. The reduction in the release rate due to tsunamis may further limit primary production under the current situation where the contribution of release for nutrients in seawater is significant. It is necessary to understand variations in release rates over longer time periods to quantify the effects of tsunamis.

Author Contributions

Conceptualization, M.H. and T.I.; methodology, M.H. and T.I.; validation, M.H. and T.I.; investigation, M.H., T.I. and S.H.; resources, M.H. and T.I.; data curation, M.H. and T.I.; writing—original draft preparation, M.H.; writing—review and editing, M.H. and T.I.; visualization, M.H.; project administration, M.H.; funding acquisition, M.H. All authors have read and agreed to the published version of the manuscript.

Funding

This research was funded by JSPS KAKENHI, grant number 21K04500 and by THE KAJIMA FOUNDATION.

Data Availability Statement

The data presented in this study are available on request from the corresponding author. The data are not publicly yet available due to non-completed study. The reference data presented in discussions are available in each reference paper.

Acknowledgments

Taichi Matsumoto who is student at Kobe University made an enormous contribution to experiment. Masanori Nakajima (Research Institute of Environment, Agriculture and Fisheries, Osaka Prefecture, Japan), Kuninao Tada (Kagawa University) and Tamiji Yamamoto (Hiroshima University) offered precious information. We are deeply grateful to all of our associates.

Conflicts of Interest

The authors declare no conflict of interest.

References

  1. Hidaka, M.; Wakui, K.; Kamiyama, K.; Takasaki, T.; Nishi, R.; Yamashita, S.; Hayashi, K. Change in sediment characters and bathymetry in Matsukawaura Inlet due to the tsunami on March 11, 2011. J. Jpn. Soc. Civ. Eng. Ser. B3 (Ocean Eng.) 2021, 68, I_186–I_191. (In Japanese) [Google Scholar] [CrossRef]
  2. Seike, K.; Kobayashi, G.; Kogure, K. Post-depositional alteration of shallow-marine tsunami induced sand layers: A comparison of recent and ancient tsunami deposits, Onagawa Bay, northeastern Japan. Isl. Arc 2017, 26, e12174. [Google Scholar] [CrossRef]
  3. Kamiyama, T.; Yamauchi, H.; Nagai, S.; Yamaguchi, M. Differences in abundance and distribution of Alexandrium cysts in Sendai Bay, northern Japan, before and after the tsunami caused by the Great East Japan Earthquake. J. Oceanogr. 2014, 70, 185–195. [Google Scholar] [CrossRef]
  4. Natsuike, M.; Kanamori, M.; Baba, K.; Moribe, K.; Yamaguchi, A.; Imai, I. Changes in abundances of Alexandrium tamarense resting cysts after the tsunami caused by the Great East Japan Earthquake in Funka Bay, Hokkaido, Japan. Harmful Algae 2014, 39, 271–279. [Google Scholar] [CrossRef]
  5. Tsujimoto, R.; Terauchi, G.; Sasaki, H.; Sakamoto, S.X.; Sawayama, S.; Sasa, S.; Yagi, H.; Komatsu, T. Damage to seagrass and seaweed beds in Matsushima Bay, Japan, caused by the huge tsunami of the Great East Japan Earthquake on 11 March 2011. Int. J. Remote Sens. Remote Sens. Lett. 2016, 37, 5843–5863. [Google Scholar] [CrossRef]
  6. Komatsu, T.; Ohtaki, T.; Sakamoto, S.; Sawayama, S.; Hamana, Y.; Shibata, M.; Shibata, K.; Sasa, S. Impact of the 2011 Tsunami on seagrass and seaweed beds in Otsuchi Bay, Sanriku Coast, Japan. In Marine Productivity: Perturbations and Resilience of Socio-Ecosystems; Ceccaldi, H.J., Hénocque, Y., Koike, Y., Komatsu, T., Stora, G., Tusseau-Vuillemin, M.H., Eds.; Springer International Publishing: Cham, Switzerland, 2015; pp. 43–53. [Google Scholar] [CrossRef]
  7. Katayama, S.; Kaneto, Y. Effects of the huge tsunami in 2011 on coastal fisheries and coastal resources and their recovering states. Nippon Suisan Gakkaishi 2018, 84, 1083–1087. (In Japanese) [Google Scholar] [CrossRef]
  8. Kaneko, K.; Takahashi, D.; Gomi, T.; Syoji, M.; Abe, H.; Fujii, T.; Katayama, A.; Yamaguchi, T.; Kijima, A. Impact of the 2011 Tohoku Earthquake and tsunami on the state of seafloor sediment and benthic macrofauna and their recovery process in Onagawa Bay. Nippon Suisan Gakkaishi 2018, 84, 909–912. (In Japanese) [Google Scholar] [CrossRef]
  9. Okoshi, S.W. Impacts of earthquake and tsunami on macrobenthic community inhabiting soft bottom. Nippon Suisan Gakkaishi 2018, 84, 1062–1065. (In Japanese) [Google Scholar] [CrossRef]
  10. Headquarters for Earthquake Research Promotion, Government of Japan, Jishin Nitaisuru Hyoka, Chokihyoka, Chokihyokakekkaichiran (List of long-Term Evaluation Results for Earthquakes). Available online: https://www.jishin.go.jp/evaluation/long_term_evaluation/lte_summary/ (accessed on 21 January 2023). (In Japanese).
  11. Nakada, S.; Hayashi, M.; Koshimura, S.; Yoneda, S.; Kobayashi, E. Tsunami-tide simulation in a large bay based on the greatest earthquake scenario along the Nankai Trough. Int. J. Offshore Polar Eng. 2016, 26, 392–400. [Google Scholar] [CrossRef]
  12. Nakada, S.; Hayashi, M.; Koshimura, S. Transportation of sediment and heavy metals resuspended by a giant tsunami based on coupled three-dimensional tsunami, ocean, and particle-tracking simulations. J. Water Environ. Technol. 2018, 16, 161–174. [Google Scholar] [CrossRef]
  13. Kinki Regional Development Bureau, Ministry of Land, Infrastructure, Transport and Tourism, Government of Japan, Osaka Wan Kankyo Zusetsu (Osaka Bay Environmental diagrams), Kinki Regional Development Bureau, Ministry of Land, Infrastructure, Transport and Tourism, Government of Japan: Osaka, Japan. 2020. 141p. Available online: http://kouwan.pa.kkr.mlit.go.jp/kankyo-db/data/latest/zusetsu.aspx (accessed on 21 January 2023). (In Japanese).
  14. Tada, K.; Nakajima, M.; Yamaguchi, H.; Asahi, T.; Ichimi, K. The Nutrient Dynamics and bottom sediment in coastal water. Bull. Coast. Oceanogr. 2018, 55, 113–124. (In Japanese) [Google Scholar] [CrossRef]
  15. Yamamoto, T.; Matsuda, O.; Hashimoto, T.; Imose, H.; Kitamura, T. Estimation of benthic fluxes of dissolved inorganic nitrogen and phosphorus from sediments of the Seto Inland Sea. Umino Kenkyu 1998, 7, 151–158. (In Japanese) [Google Scholar] [CrossRef]
  16. Inoue, T.; Nakamura, Y. Effects of hydrodynamic conditions on sediment oxygen demand: Experimental study based on three methods. J. Environ. Eng. 2009, 135, 1161–1170. [Google Scholar] [CrossRef]
  17. Inoue, T.; Hagino, Y. Effects of three iron material treatments on hydrogen sulfide release from anoxic sediments. Water Sci. Technol. 2022, 85, 305–318. [Google Scholar] [CrossRef]
  18. Glud, R.N.; Gundersen, J.K.; Holby, O. Benthic in situ respiration in the upwelling area off central Chile. Mar. Ecol. Prog. Ser. 1999, 186, 9–18. [Google Scholar] [CrossRef]
  19. Inoue, T.; Sugahara, S.; Seike, Y.; Kamiya, H.; Nakamura, Y. Short-term variation in benthic phosphorus transfer due to discontinuous aeration/oxygenation operation. Limnology 2017, 18, 195–207. [Google Scholar] [CrossRef]
  20. Boudreau, B.P. Diagenetic Models and Their Implementation; Springer: Berlin/Heidelberg, Germany, 1996; pp. 37–47, 75–77, 96–117. [Google Scholar]
  21. Carreira, C.; Larsen, M.; Glud, R.N.; Brussaard, C.P.D.; Middelboe, M. Heterogeneous distribution of prokaryotes and viruses at the microscale in a tidal sediment. Aquat. Microb. Ecol. 2013, 69, 183–192. [Google Scholar] [CrossRef]
  22. Gundersen, J.K.; Jørgensen, B.B. Microstructure of diffusive boundary layers and the oxygen uptake of the sea floor. Nature 1990, 345, 604–607. [Google Scholar] [CrossRef]
  23. Hayashi, M.; Nakada, S.; Koshimura, S.; Kobayashi, E. Estimate of water quality change in Osaka Bay caused by the suspension of marine sediment with mega tsunami. In Oceanography Challenges to Future Earth; Komatsu, T., Ceccaldi, H.J., Yoshida, J., Prouzet, P., Hénocque, Y., Eds.; Springer Nature: Cham, Switzerland, 2019; pp. 45–54. [Google Scholar] [CrossRef]
  24. Inoue, T.; Nakamura, Y. Response of benthic soluble reactive phosphorus transfer rates to step changes in flow velocity. J. Soils Sediments 2012, 12, 1559–1567. [Google Scholar] [CrossRef]
  25. Kagawa, H.; Tokumasu, M. Effects of covering sea sediment upon the release of nutrients into seawater—indoor model experiment-. Jpn. J. Water Pollut. Res. 1983, 6, 319–326. (In Japanese) [Google Scholar] [CrossRef]
  26. Jyo, H. Studies on the Mechanism of Eutrophication and the Effect of It on Fisheries Production in Osaka Bay. Bull. Osaka Prefect. Fish. Exp. Stn. 1986, 7, 1–174. (In Japanese). Available online: https://www.knsk-osaka.jp/_files/00055802/7-index.pdf (accessed on 21 January 2023).
  27. Ministry of the Environment, Government of Japan. Osakawan Niokeru Teidei Karano Nijiodakubussitu no Shugenin Tonaru Eiyouennruiyoushutsuhaakujittaityosa (Investigation of the Nutrients Release from Bottom Sediments in Osaka Bay That Are the Main Cause of Secondary Pollutants); Tokyo Kuei: Tokyo, Japan, 2001; 71p. (In Japanese) [Google Scholar]
  28. Nishio, T.; Shinya, M. Effect on nutrient load of removing sediments by maintenance dredging in the Port of Osaka. Nippon Suisan Gakkaishi 2010, 76, 886–893. (In Japanese) [Google Scholar] [CrossRef]
  29. Nakajim, M.; Yamamoto, K.; Sano, M.; Ariyama, K. Engankaiiki no Eiyoenkannrigijyutu no Kaihatsuitakujigyo Seikahokokusyo (Report of Development of Nutrient Management Technology for Coastal Waters); The Japan Fisheries Research and Education Agency: Hiroshima, Japan, 2013; pp. 60–68. (In Japanese)
  30. Nakajim, M.; Yamamoto, K.; Sano, M.; Akiyama, S.; Ariyama, K. Engankaiiki no Eiyoenkannrigijyutu no Kaihatsuitakujigyo Seikahokokusyo (Report of Development of Nutrient Management Technology for Coastal Waters); The Japan Fisheries Research and Education Agency: Hiroshima, Japan, 2014; pp. 62–74. (In Japanese)
  31. Komai, Y. Teishitsu no Jyokyo to naibufuka (Sediment conditions and internal loads). J. Environ. Conserv. Eng. 2015, 44, 128–133. (In Japanese) [Google Scholar]
  32. Nishikawa, T.; Hori, Y.; Nagai, S.; Miyahara, K.; Nakamura, Y.; Harada, K.; Tanda, M.; Manabe, T.; Tada, K. Nutrient and Phytoplankton Dynamics in Harima-Nada, Eastern Seto Inland Sea, Japan During a 35-Year Period from 1973 to 2007. Estuaries Coasts 2010, 33, 417–427. [Google Scholar] [CrossRef]
  33. Abo, K.; Akiyama, S.; Harada, K.; Nakaji, Y.; Hayashi, H.; Murata, K.; Wanishi, A.; Ishikawa, Y.; Masui, T.; Nishikawa, S.; et al. Long-Term Variations in Water Quality and Causal Factors in the Seto Inland Sea, Japan. Bull. Coast. Oceanogr. 2018, 55, 101–111. (In Japanese) [Google Scholar] [CrossRef]
  34. Hori, Y.; Mochizuki, S.; Shimamoto, N. Relationship between the discoloration of cultivated Porphyra thalii and long-term changes of the environmental factors in the northern part of Harima-Nada, eastern Seto Inland Sea, Japan. Bull. Jpn. Soc. Fish. Oceanogr. 2018, 72, 107–112. (In Japanese). Available online: https://www.jsfo.jp/archives/contents/pdf/72-2-107.pdf (accessed on 21 January 2023).
  35. Tanida, M.; Akashige, S.; Ariyama, H.; Yamanoi, H.; Kimura, H.; Dan, A.; Sakamoto, H.; Saiki, Y.; Ishida, Y.; Kotobuki, H.; et al. Nutrient environment and fisheries in the Seto Inland Sea. J. Fish. Technol. 2014, 7, 37–46. (In Japanese). Available online: https://www.fra.affrc.go.jp/bulletin/fish_tech/7-1/070105.pdf (accessed on 21 January 2023).
  36. Yamamoto, T. The Seto Inland Sea—Eutrophic or oligotrophic? Mar. Pollut. Bull. 2003, 47, 37–42. [Google Scholar] [CrossRef]
  37. Fujiwara, T.; Suzuki, K.; Okubo, K. Impact of Nutrient Reduction on Organic Matter (COD and TOC) in Coastal Embayments: Effect of the Reduction and Its Working Mechanism. J. Jpn. Soc. Water Environ. 2021, 44, 185–193. (In Japanese) [Google Scholar] [CrossRef]
  38. Fujiwara, T.; Suzuki, K.; Kimura, N.; Suzuki, M.; Nakajima, M.; Tadokoro, K.; Abo, K. Impact of variation in nutrient concentration on ecosystem, biomass and production in a semi-enclosed embayment: Osaka Bay. J. Jpn. Soc. Water Environ. 2022, 45, 145–158. (In Japanese) [Google Scholar] [CrossRef]
  39. Abo, K.; Nakagawa, N.; Abe, K.; Tarutani, K. Tobusetonaikai niokeru eiyouen no dotai to noriyousyoku nadonotameno eiyouennkannri (Nutrient Dynamics and management in the Eastern Seto Inland Sea). Aquabiology 2015, 37, 274–279. (In Japanese) [Google Scholar]
Figure 1. Location of the sampling point (34°-29′-33.71″ N, 135°-21′-47.94″ E) and the bathymetry of Osaka Bay, Japan.
Water 15 02041 g001
Figure 2. (a) Schematic diagram of core construction and (b) the attached parts on covers.
Water 15 02041 g002
Figure 3. Time series of oxygen concentrations in the overlying water of the control cores and redeposition cores.
Water 15 02041 g003
Figure 4. Results for NH4-N obtained by core incubation: (a) temporal change in NH4-N concentration in the overlying water of the control cores and redeposition cores; (b) release rate of NH4-N estimated by the core incubation method. Bar charts show the average of three control or redeposition cores, respectively, and error bars indicate maximum and minimum values. Decline rate of redeposition means the percentage decrease from the control.
Water 15 02041 g004
Figure 5. Results for PO4-P obtained by core incubation: (a) temporal change in PO4-P concentration in the overlying water of the control cores and redeposition cores; (b) release rate of PO4-P estimated by the core incubation method shown in Figure 4. The bar charts and error bars are the same as those in Figure 4.
Water 15 02041 g005
Figure 6. Vertical distributions of (a) NH4-N concentration of the pore water in control and redeposition cores and of the overlying water on 15 November, and (b) release rates and diffusion fluxes of NH4-N estimated by the mathematical modeling method and release rates in the latter half determined by the core incubation method. The bar charts and error bars are the same as in Figure 4.
Water 15 02041 g006
Figure 7. Vertical distributions of (a) PO4-P concentration of the pore water in the control and redeposition cores and of the overlying water on 15 November, and (b) release rates and diffusion fluxes of PO4-P estimated by the mathematical modeling method and release rates in the latter half determined by the core incubation method as shown in Figure 6. The bar charts and error bars are the same as in Figure 4.
Water 15 02041 g007
Figure 8. The temporal change in release rates of NH4-N and PO4-P collected from the literature and shown in Table 1 and from the experiment. The release rate from the redeposited sediment is shown by a line.
Water 15 02041 g008
Figure 9. Time series of TN and TP concentrations in seawater, the number of red tides and fishery damages caused by red tides and fish catches for each species in Osaka Bay, with figures modified from those in [13]. Target concentrations of TN and TP in the sea are set for each area type II, III and IV. In Osaka Bay, Type IV is near the shoreline in the inner part of the bay, and Type II is in the western half of the bay at depths of 20 m (see Figure 1) or greater generally.
Water 15 02041 g009
Table 1. List of literature that showed release rates determined by the core incubation method in Osaka Bay.
ReferencesStationsSampling Month & Year
Jyo [26]Stn.18 & Stn.17June, July, August & October, 1978
Yamamoto et al. [15]M03October, 1993 & June, 1994
Ministry of the Environment [27]UnknownAugust, 2000
Nishio & Shinya [28]P0September, 2008
Nakajim et al. [29]Stn.18July & October, 2012
Nakajim et al. [30]Stn.18July & October, 2013
Disclaimer/Publisher’s Note: The statements, opinions and data contained in all publications are solely those of the individual author(s) and contributor(s) and not of MDPI and/or the editor(s). MDPI and/or the editor(s) disclaim responsibility for any injury to people or property resulting from any ideas, methods, instructions or products referred to in the content.

