
Study of Water–Sand Inrush through a Vertical Karst Conduit Uncovered through Tunnel Excavation


Abstract
:1. Introduction
2. Occurrence Mechanism of Water–Sand Inrush through Vertical Conduits
3. Testing System and Scheme
3.1. Testing System
- (1)
- Loading support bracket
- (2)
- Confined water chamber
- (3)
- Testing chamber
- (4)
- Base of the testing chamber
- (5)
- Storage tank
- (6)
- Control system
3.2. Testing Scheme
- (1)
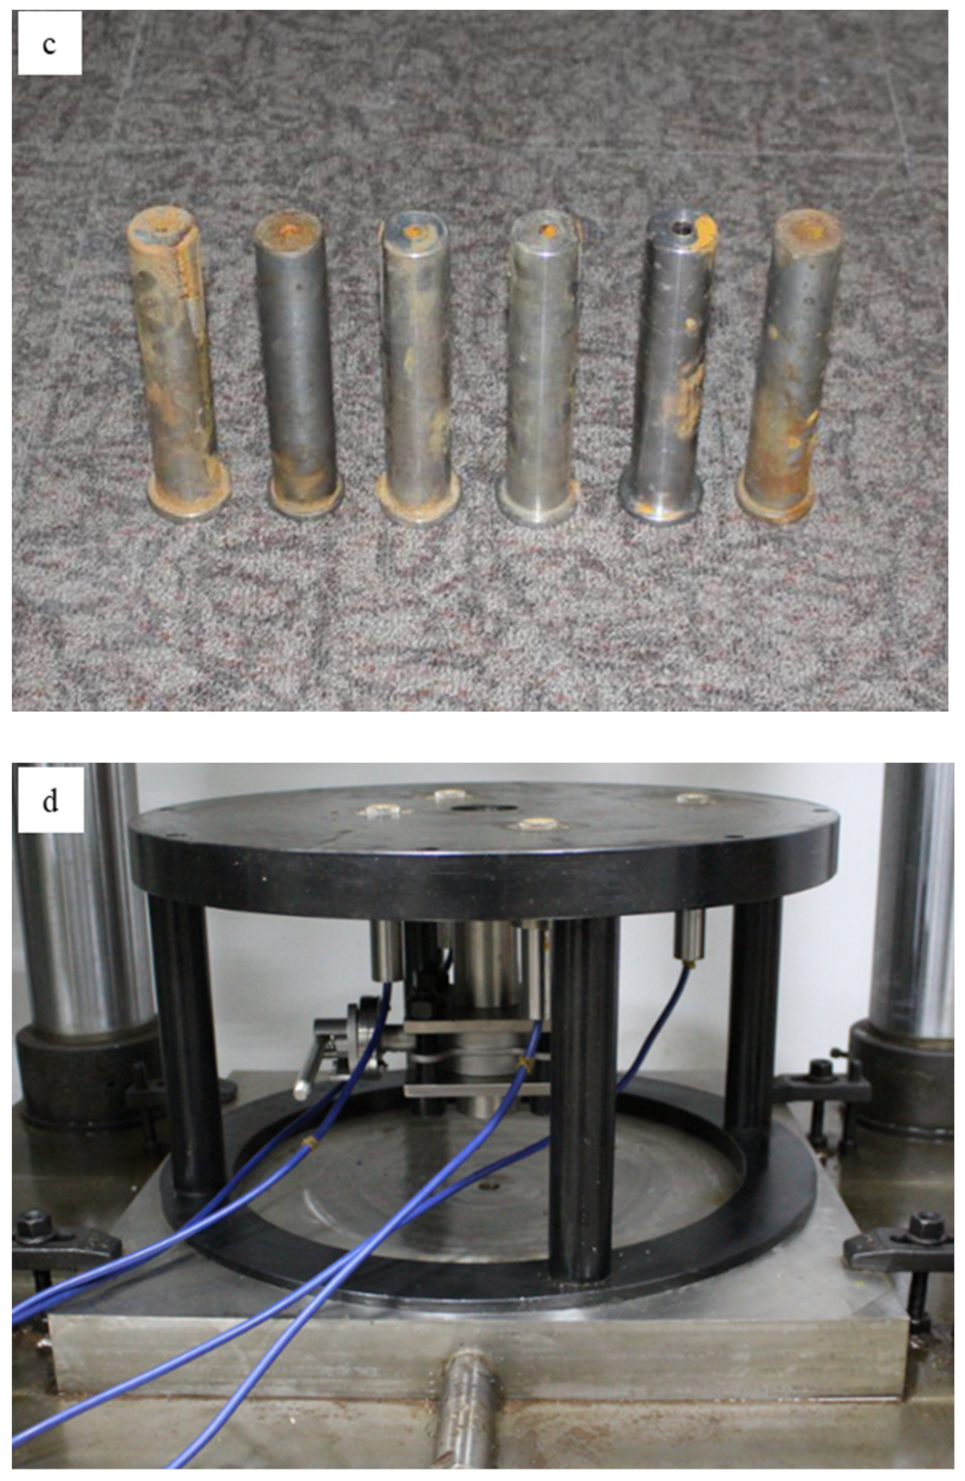
- During water–sand inrush, the solid material is mainly silt sand and fine sand. Considering that the ratio of solid material is complex and varies from region to region, the scheme design did not deliberately aim to adopt a specific ratio. Clean river sand with a particle size of less than 0.3 mm was selected as the testing material, and a karst conduit with a diameter of 5 mm was placed in the mounting hole of the karst conduit.
- (2)
- The pore pressure gauges were installed in the corresponding mounting holes. In order to ensure the tightness of the testing chamber under the water pressure, a circle of sealant was applied at the ends of the pore pressure gauges during installation, and the pore pressure gauges were connected to the data acquisition system.
- (3)
- The testing chamber was placed on the base, and a sealing ring was placed between the base and the testing chamber. The instantaneous opening device for the karst conduit was closed. The river sand was packed into the testing chamber up to the designated height, i.e., 200 mm. The voidage of the river sand was 0.41.
- (4)
- Water was injected into the testing chamber until the total height of the water–sand mixture was 350 mm. As is known, the water–sand ratio is the volumetric ratio of water and sand in a water–sand mixture; therefore, the initial water–sand ratio for the water–sand inrush testing was 1.966. The testing system was initiated, the air vent on the upper part of the confined water chamber was opened, and a displacement control mode was adopted for the testing system to lower the confined water chamber to the position where it was essentially in contact with the water’s surface in the testing chamber, and to keep the displacement constant.
- (5)
- The air vent on the upper part of the confined water chamber was closed. The water pressure control mode was adopted for the testing system in order to increase the water pressure in the testing chamber to the initial design pressure of 0.1 Mpa, as shown in Figure 5. It is worth noting that the maximum flow rate that can be provided by the hydraulic water control system is 41 mL/s. Therefore, if the flow rate of the water–sand mixture reaches this value, the testing can be stopped.
- (6)
- After the above steps were carried out, the servo control system for the water pressure and water yield was closed, and the air vent on the upper part of the confined water chamber was opened again. The confined water chamber was slowly lifted to separate it from the testing chamber. After the whole testing system was cleaned, a karst conduit with a 6 mm diameter was placed in the mounting hole of the karst conduit, and then steps 1~5 were repeated until all of the karst conduits, with diameters ranging from 5 mm to 8 mm, had been tested.
4. Testing Results and Analysis
4.1. Change in Water–Sand Flow
4.2. Distribution of the Water Pressure near the Karst Conduit
5. Conclusions
- (1)
- The process of water–sand inrush through a karst conduit is akin to a water–sand mixture flowing through the discharge opening of a storage bin. Based on force analysis of a non-aqueous sand body above a karst conduit, the limit width of the karst conduit under force equilibrium was obtained. Considering the effect of water on aqueous sand bodies, the criterion of water–sand inrush was established.
- (2)
- The simulated testing system for water–sand inrush through karst conduits consisted of a loading support bracket, a confined water chamber (loading head), a testing chamber, the base of the testing chamber, a storage tank, a servo control system for the water pressure and water yield, a servo control system for displacement and stress, and a console. Moreover, the steps for testing water–sand inrush were also designed.
- (3)
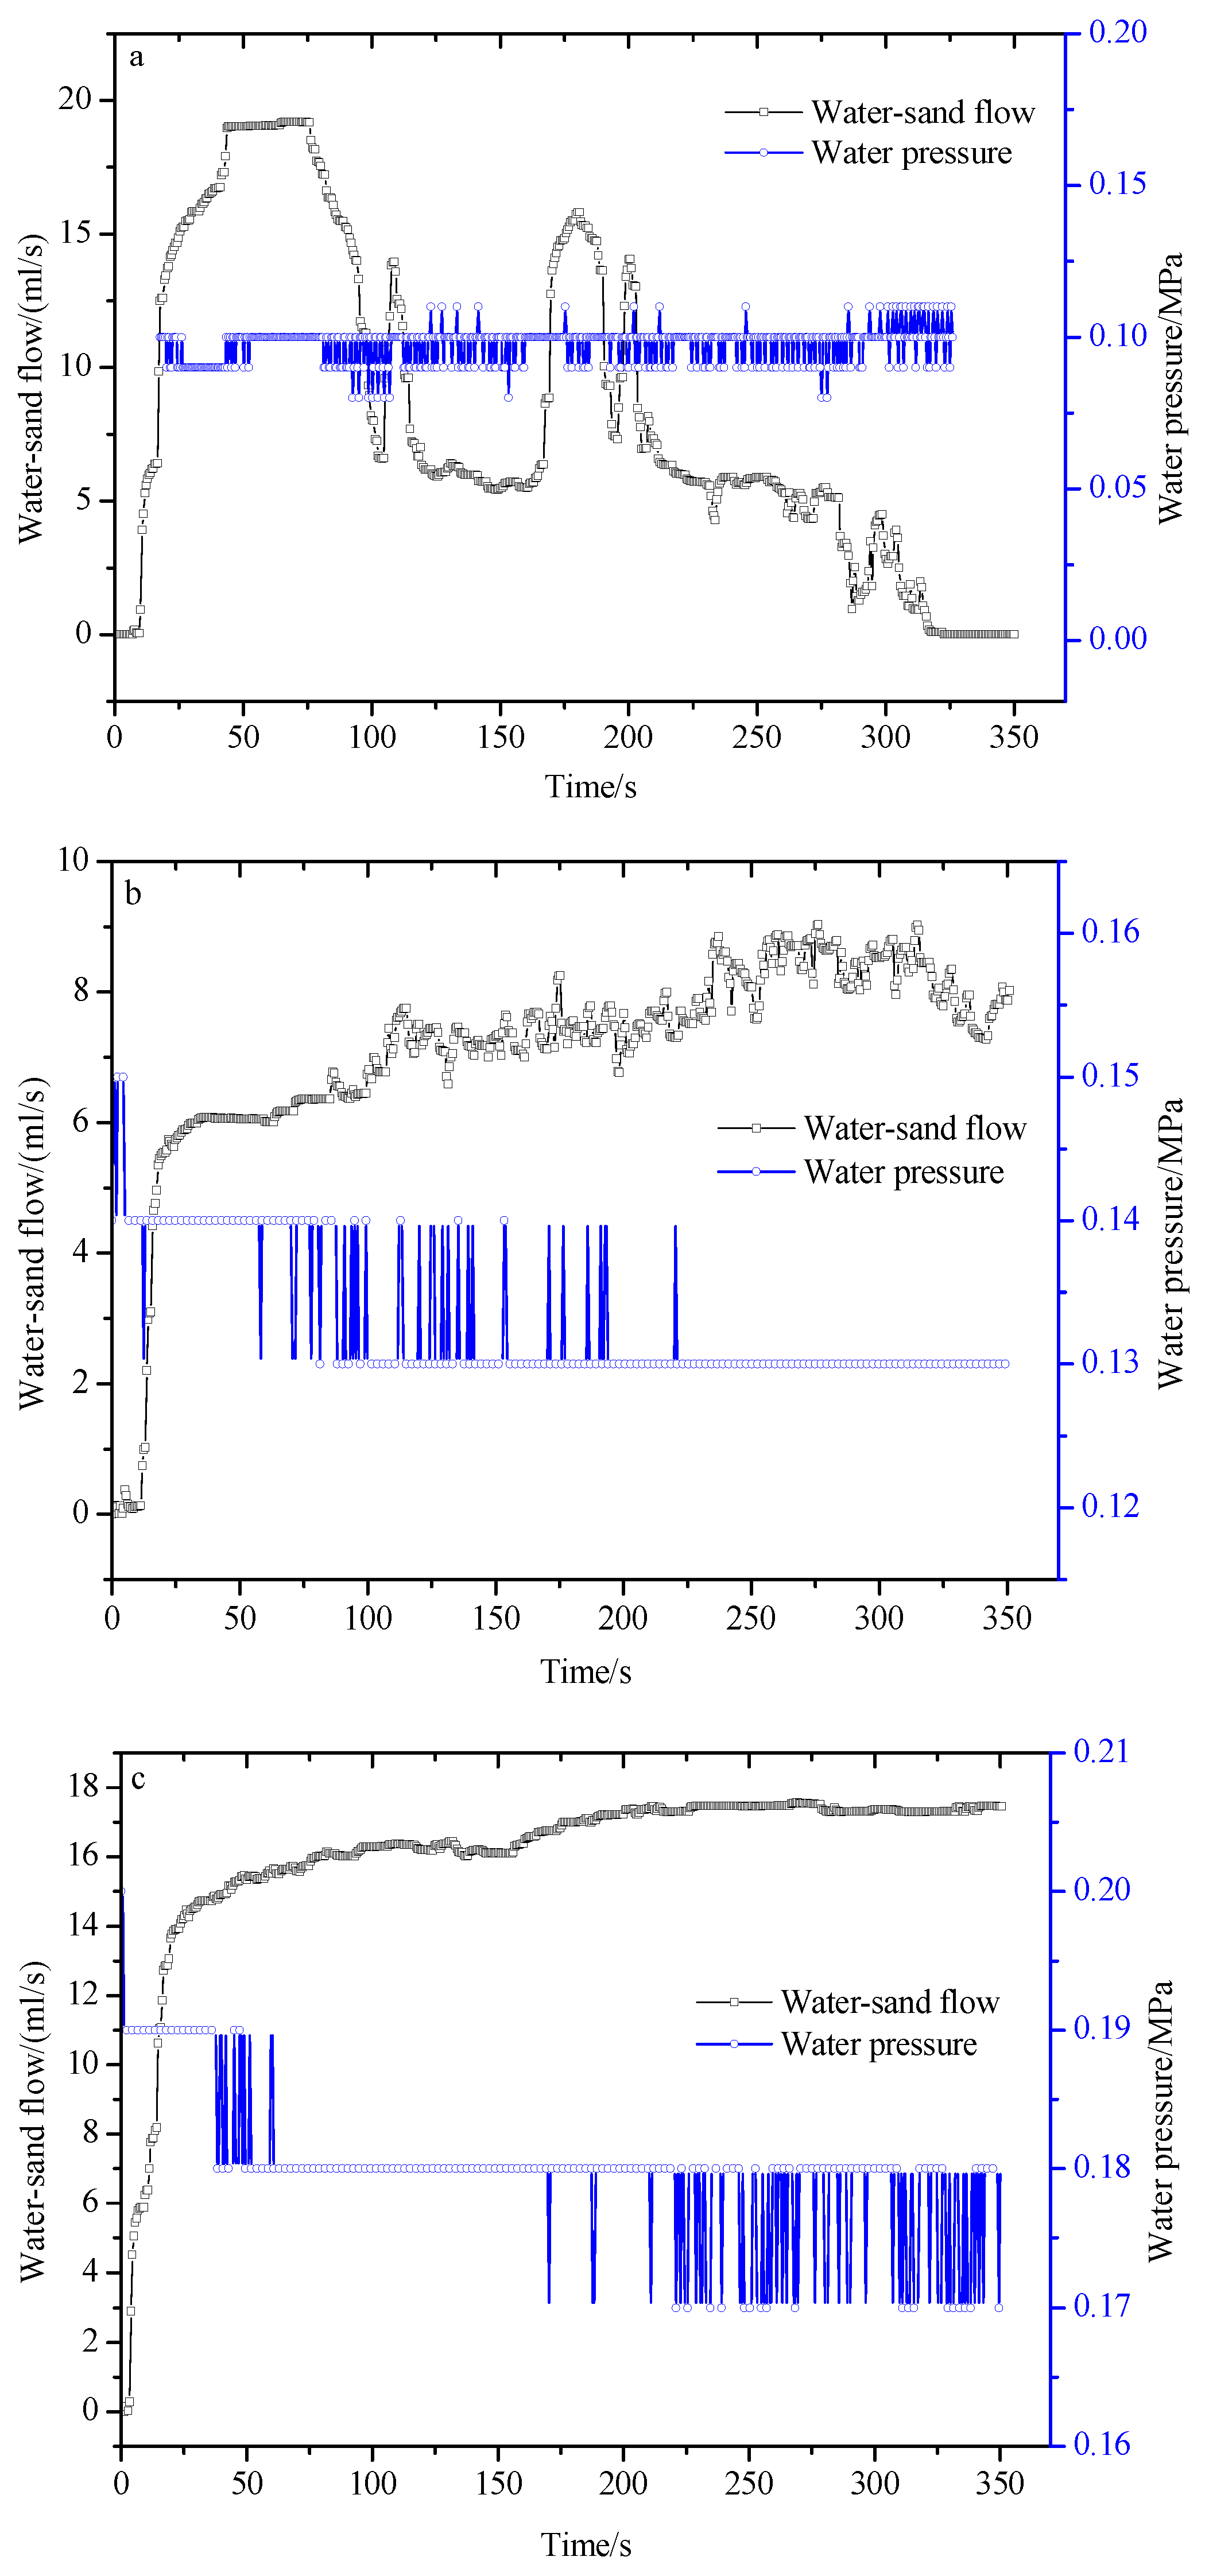
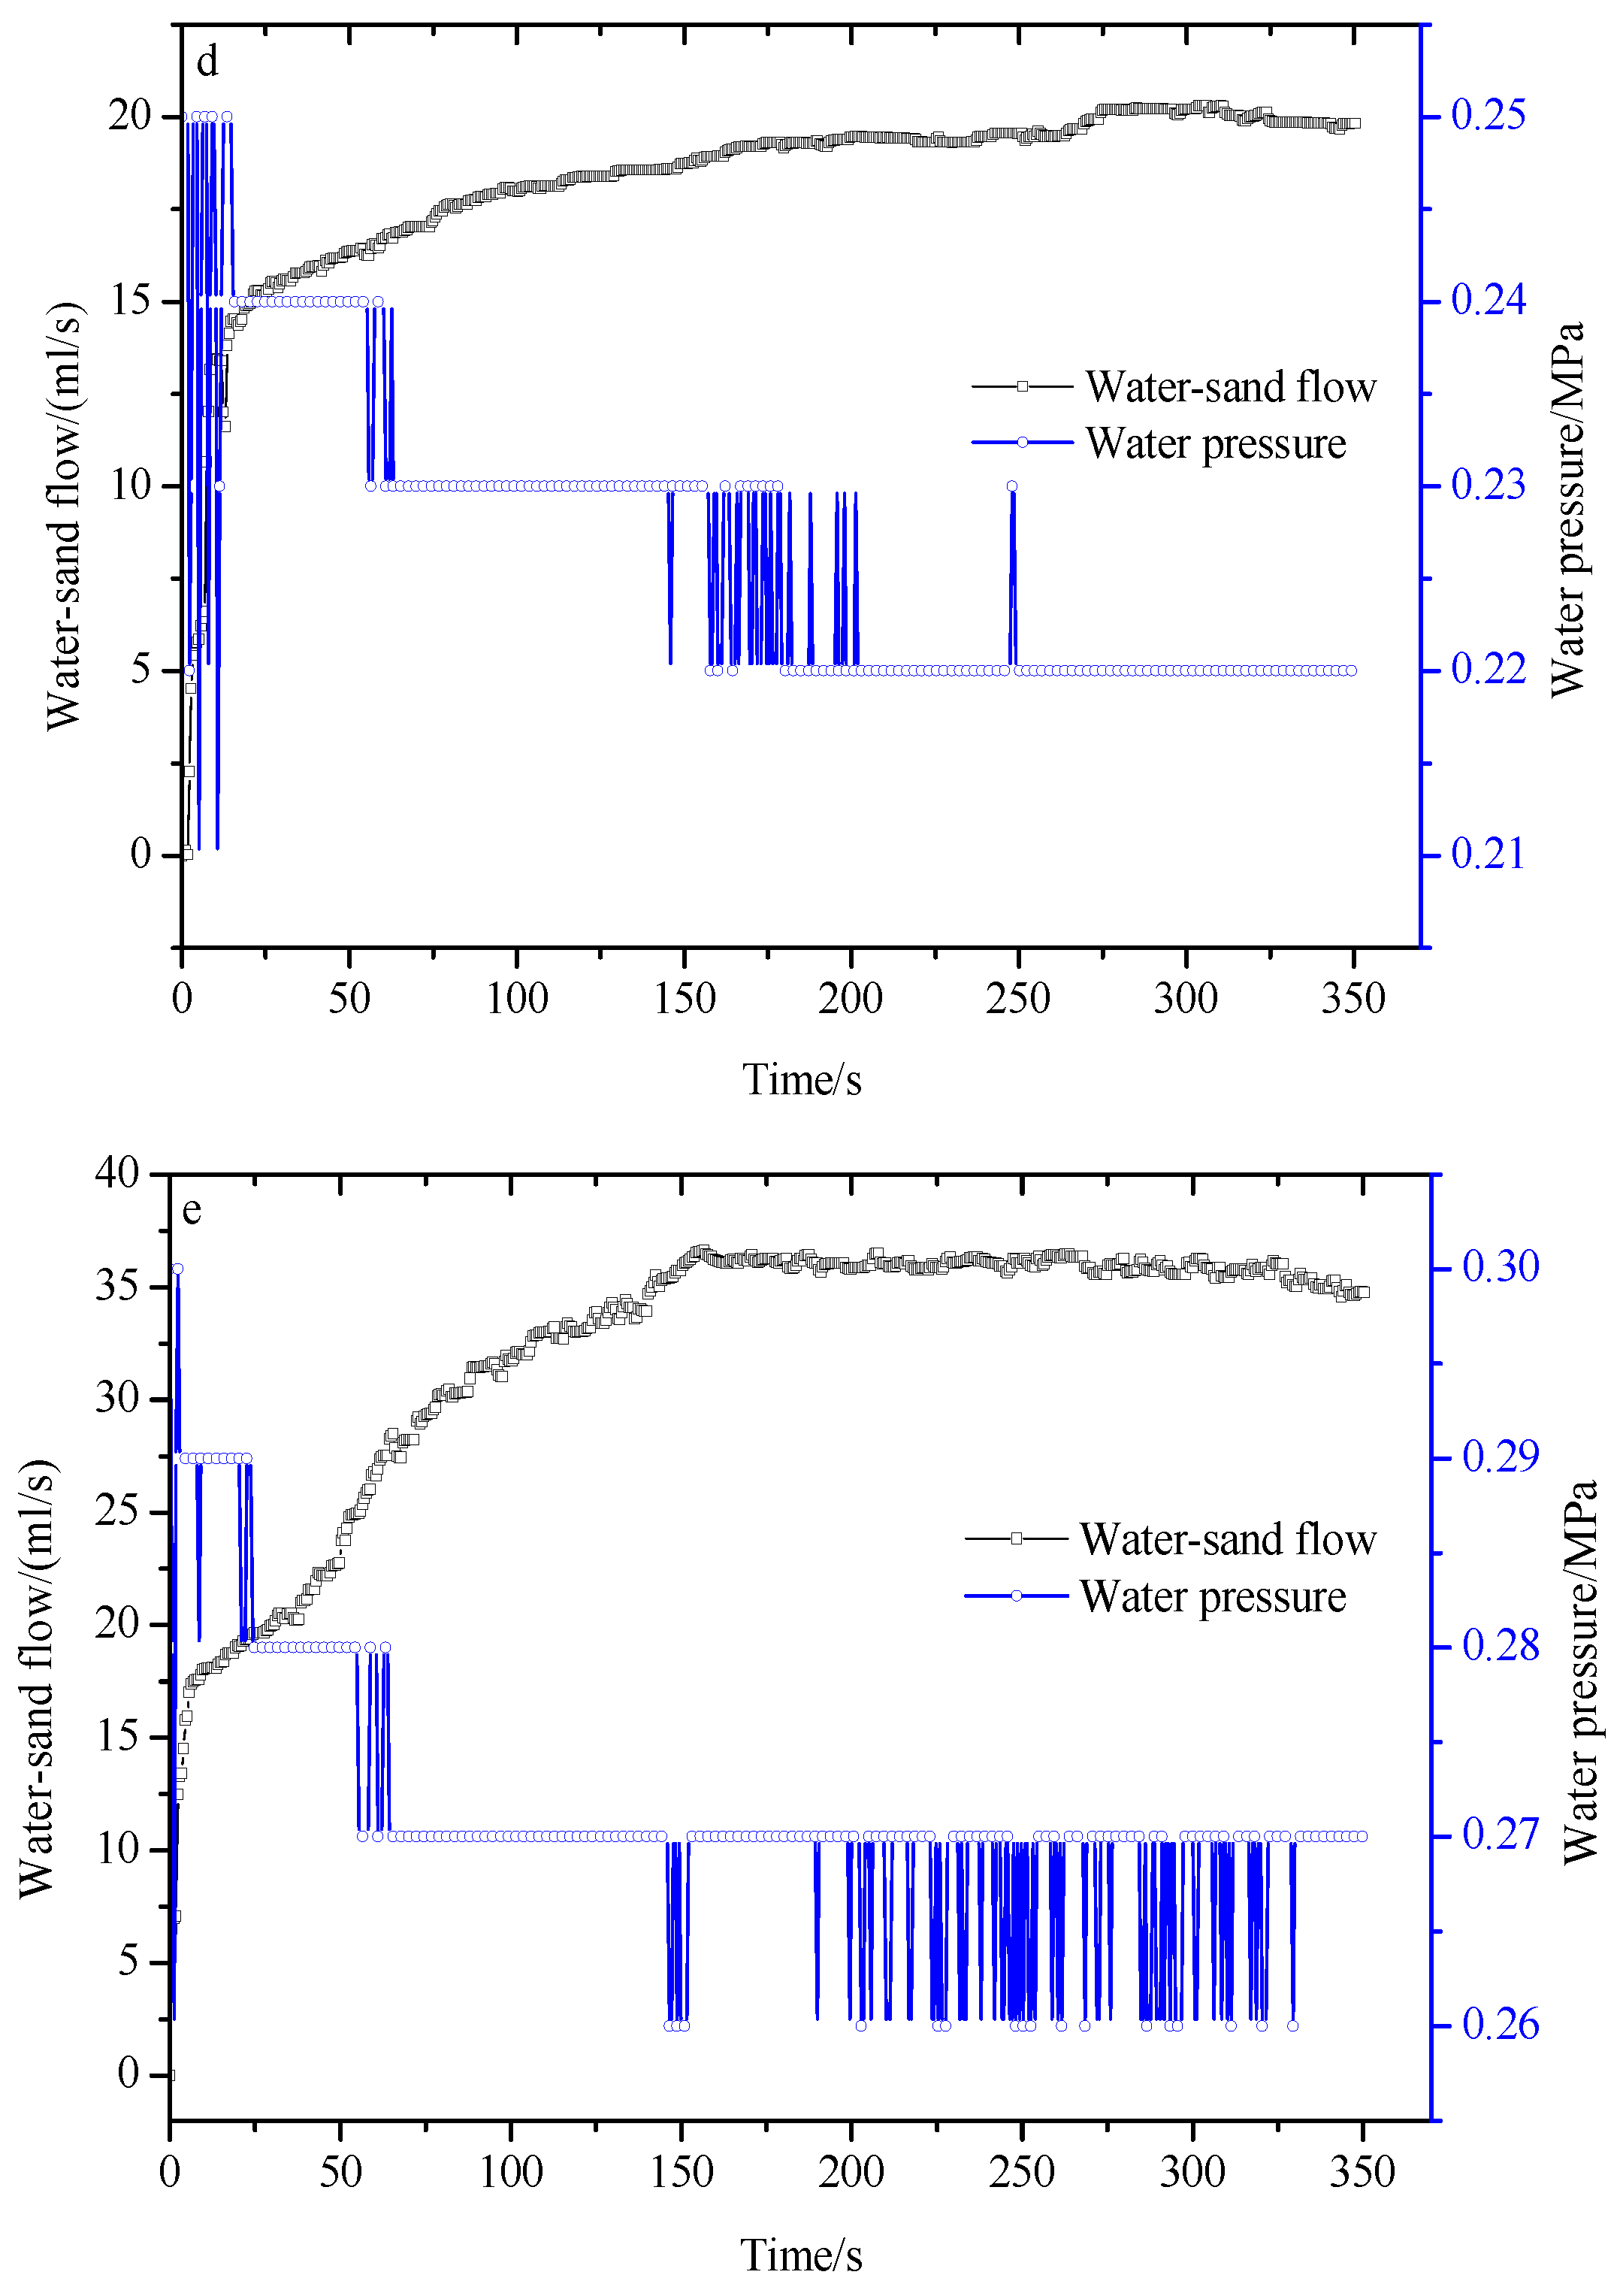
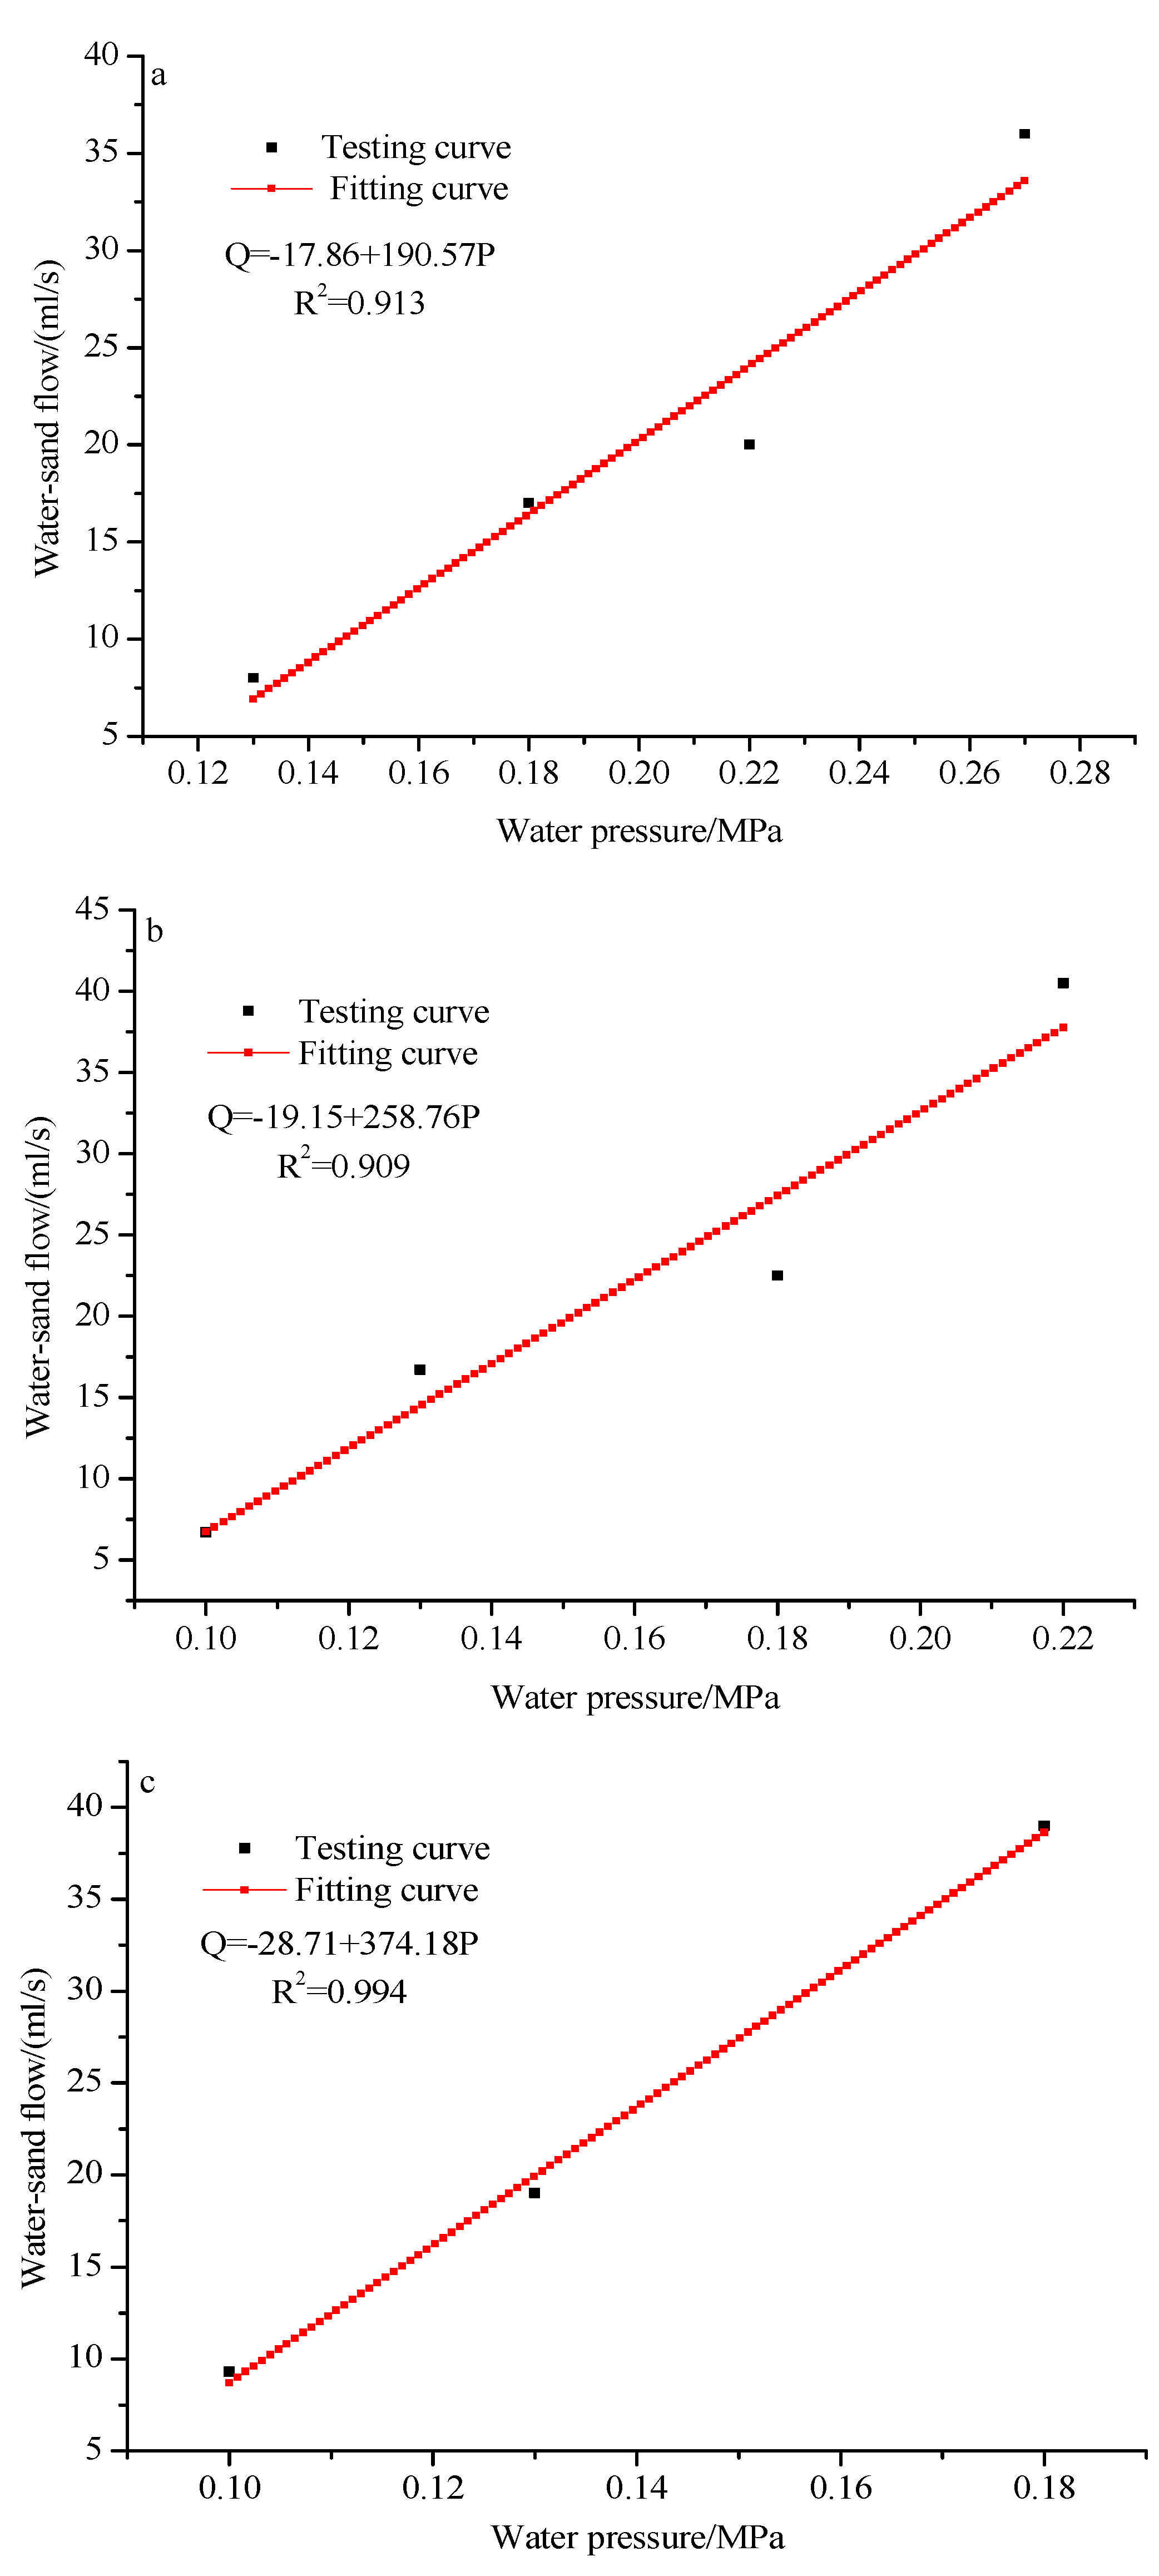
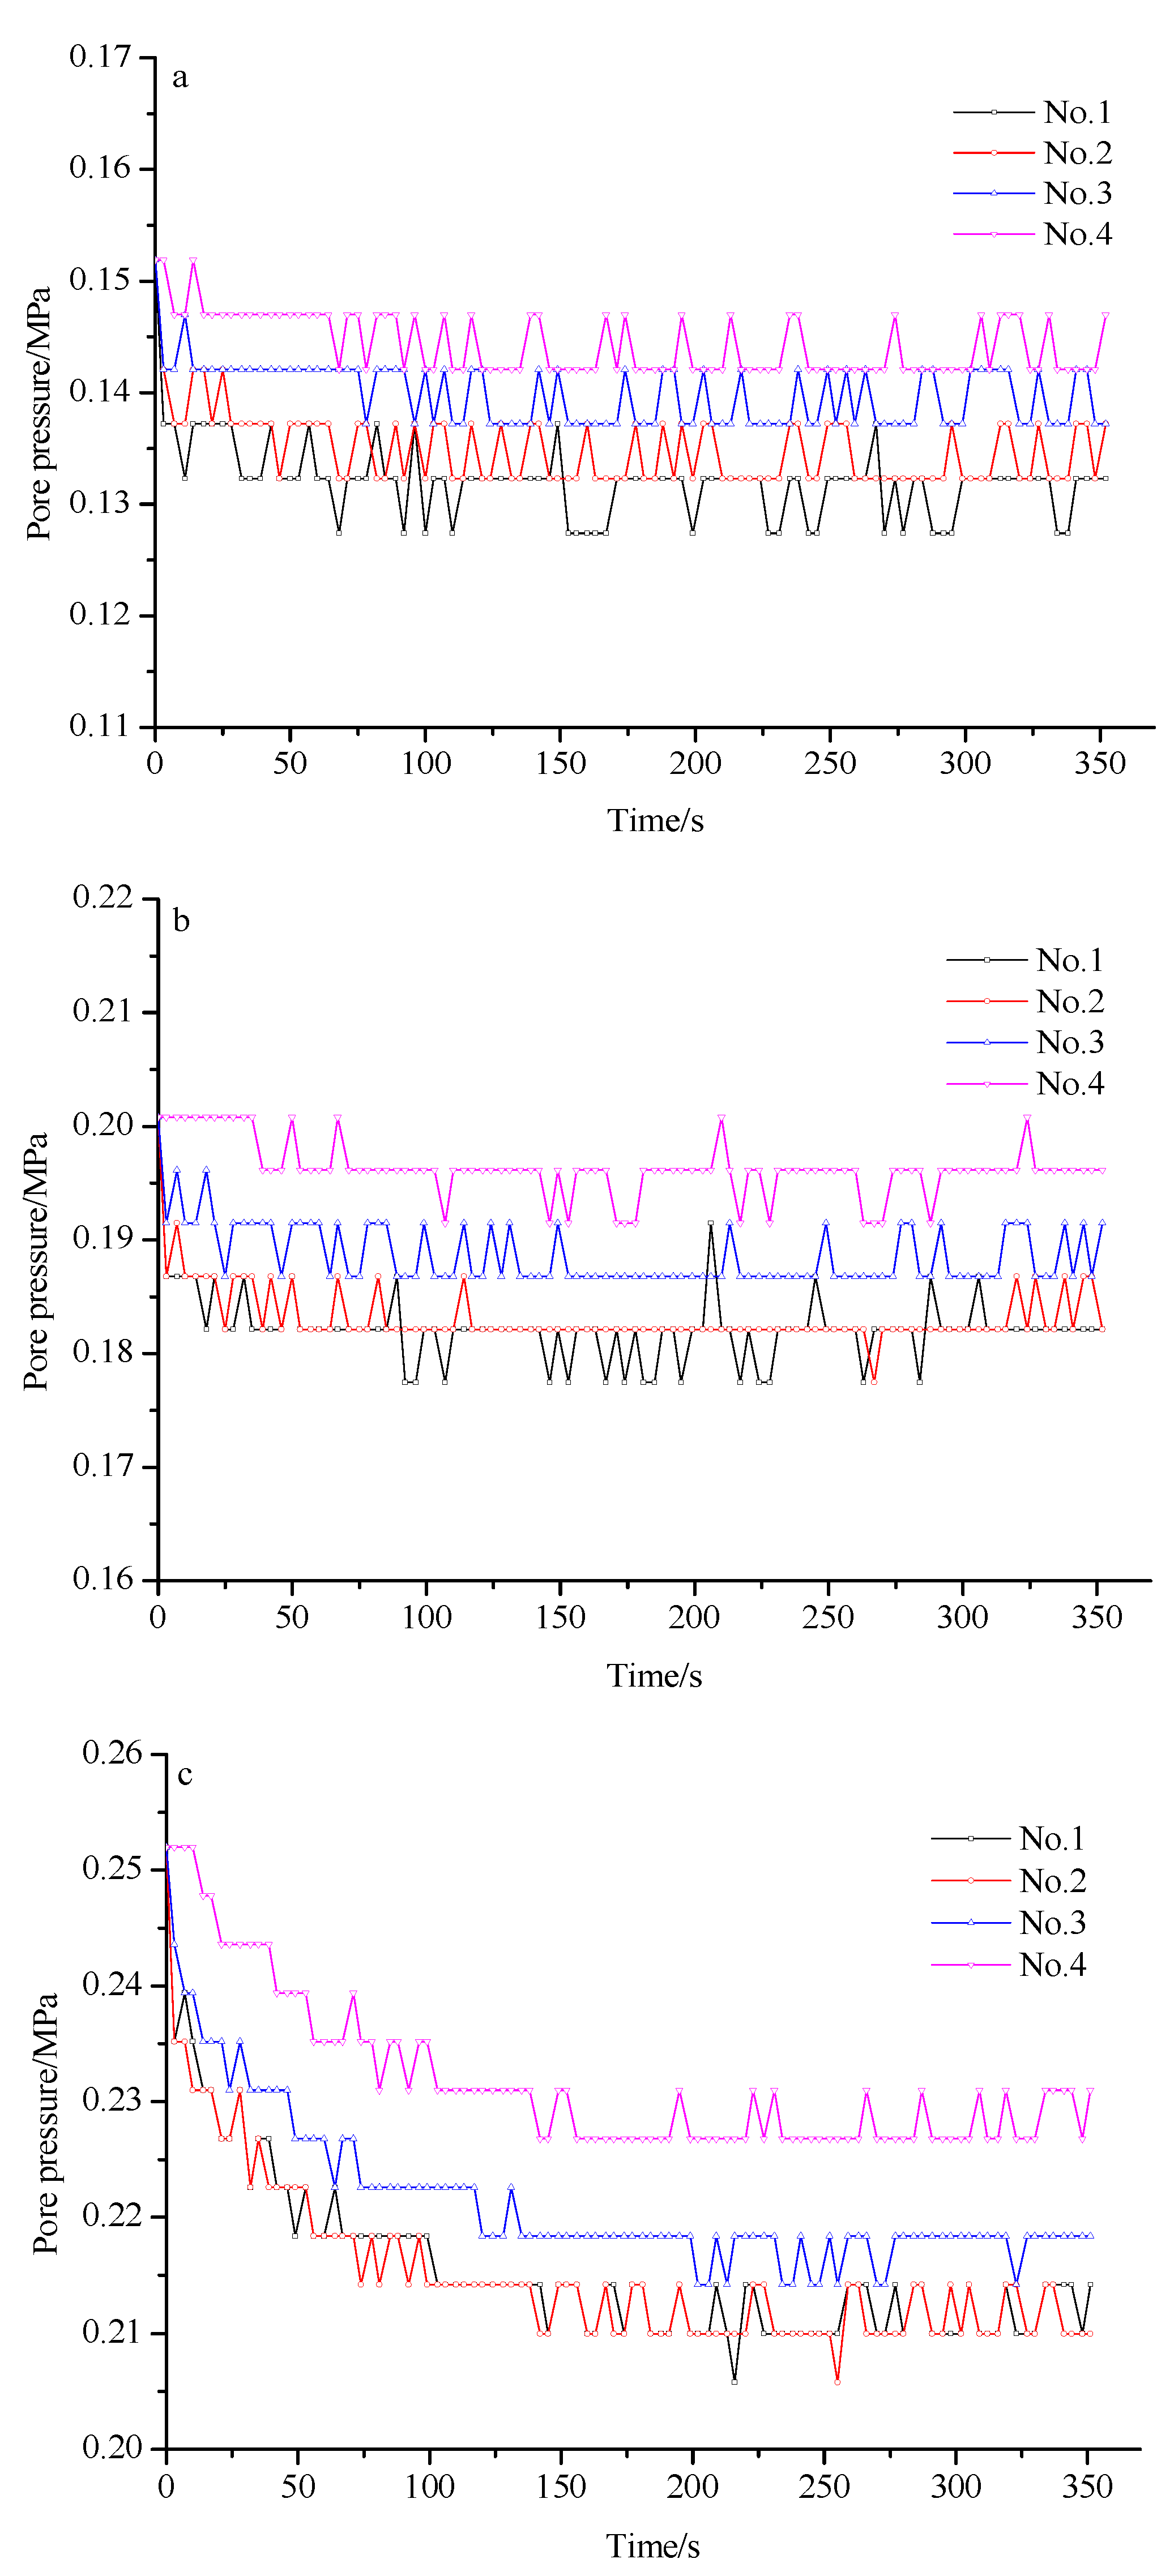
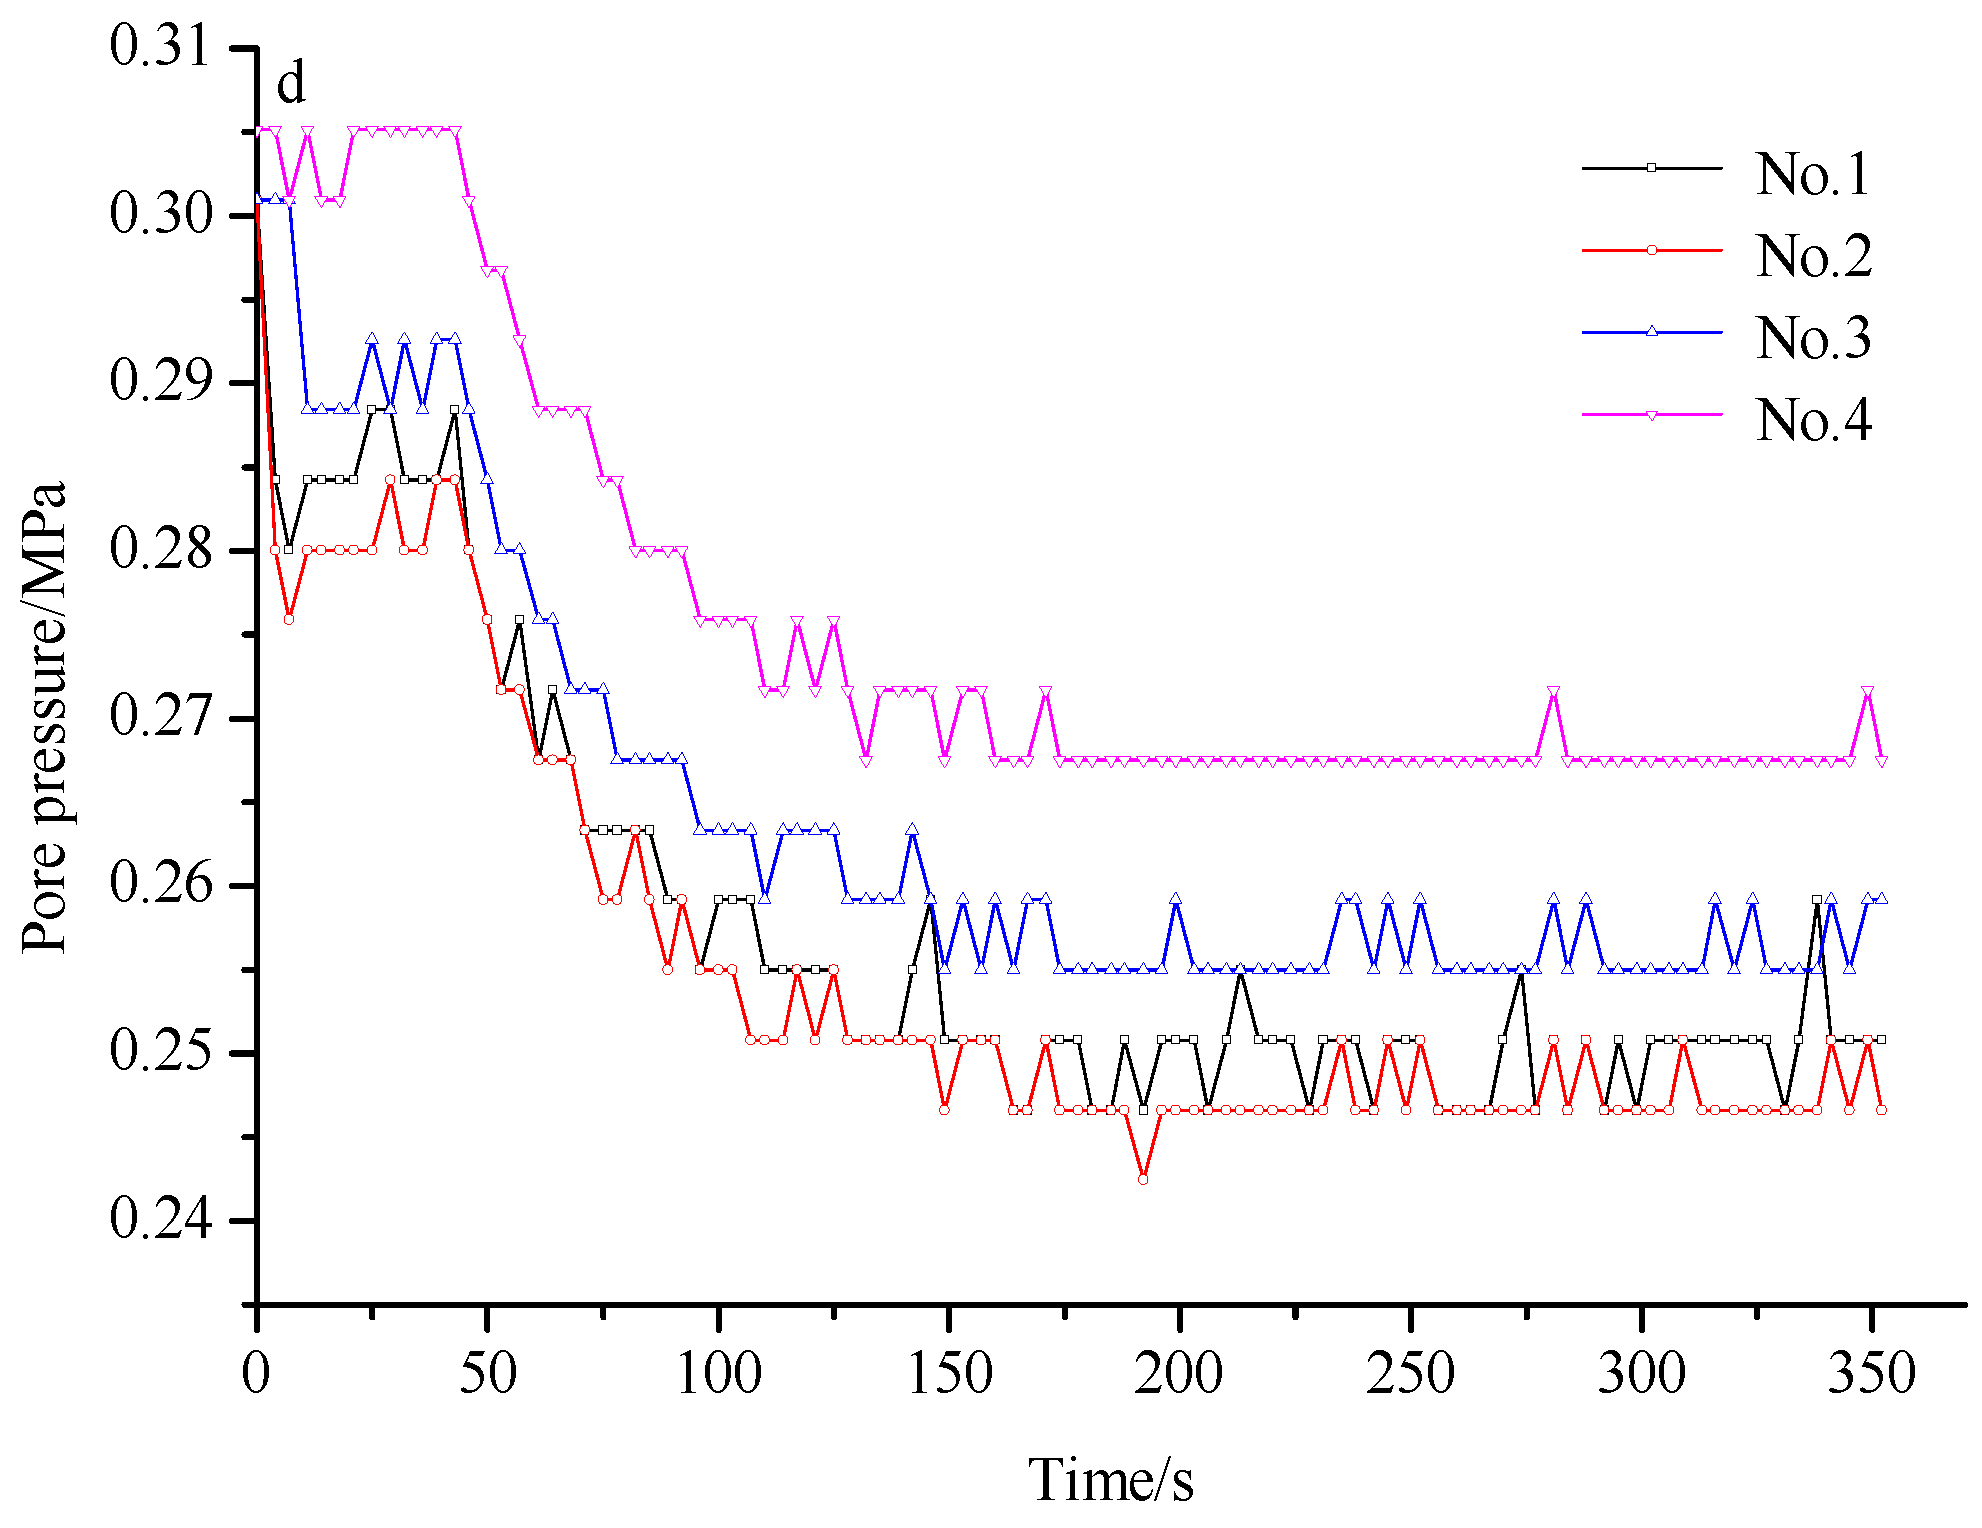
- When the water pressure in the testing chamber was close to the critical head pressure of the water–sand inrush, the water–sand inrush exhibited the pattern of instability—migration—deposition—stability. When the water pressure in the testing chamber exceeded the critical head pressure, the water–sand flow first increased and then stabilized over time. With the increase in the set values of the water pressure and conduit size, the steady flow of the water–sand mixture increased gradually. When the karst conduit was opened suddenly, the actual water pressure in the testing chamber decreased significantly, due to the water–sand mixture flowing out of the testing chamber and the water supply lagging behind. With the stabilization of the water–sand flow, the actual water pressure gradually tended towards stability, but it was still lower than the water pressure that was initially set.
- (4)
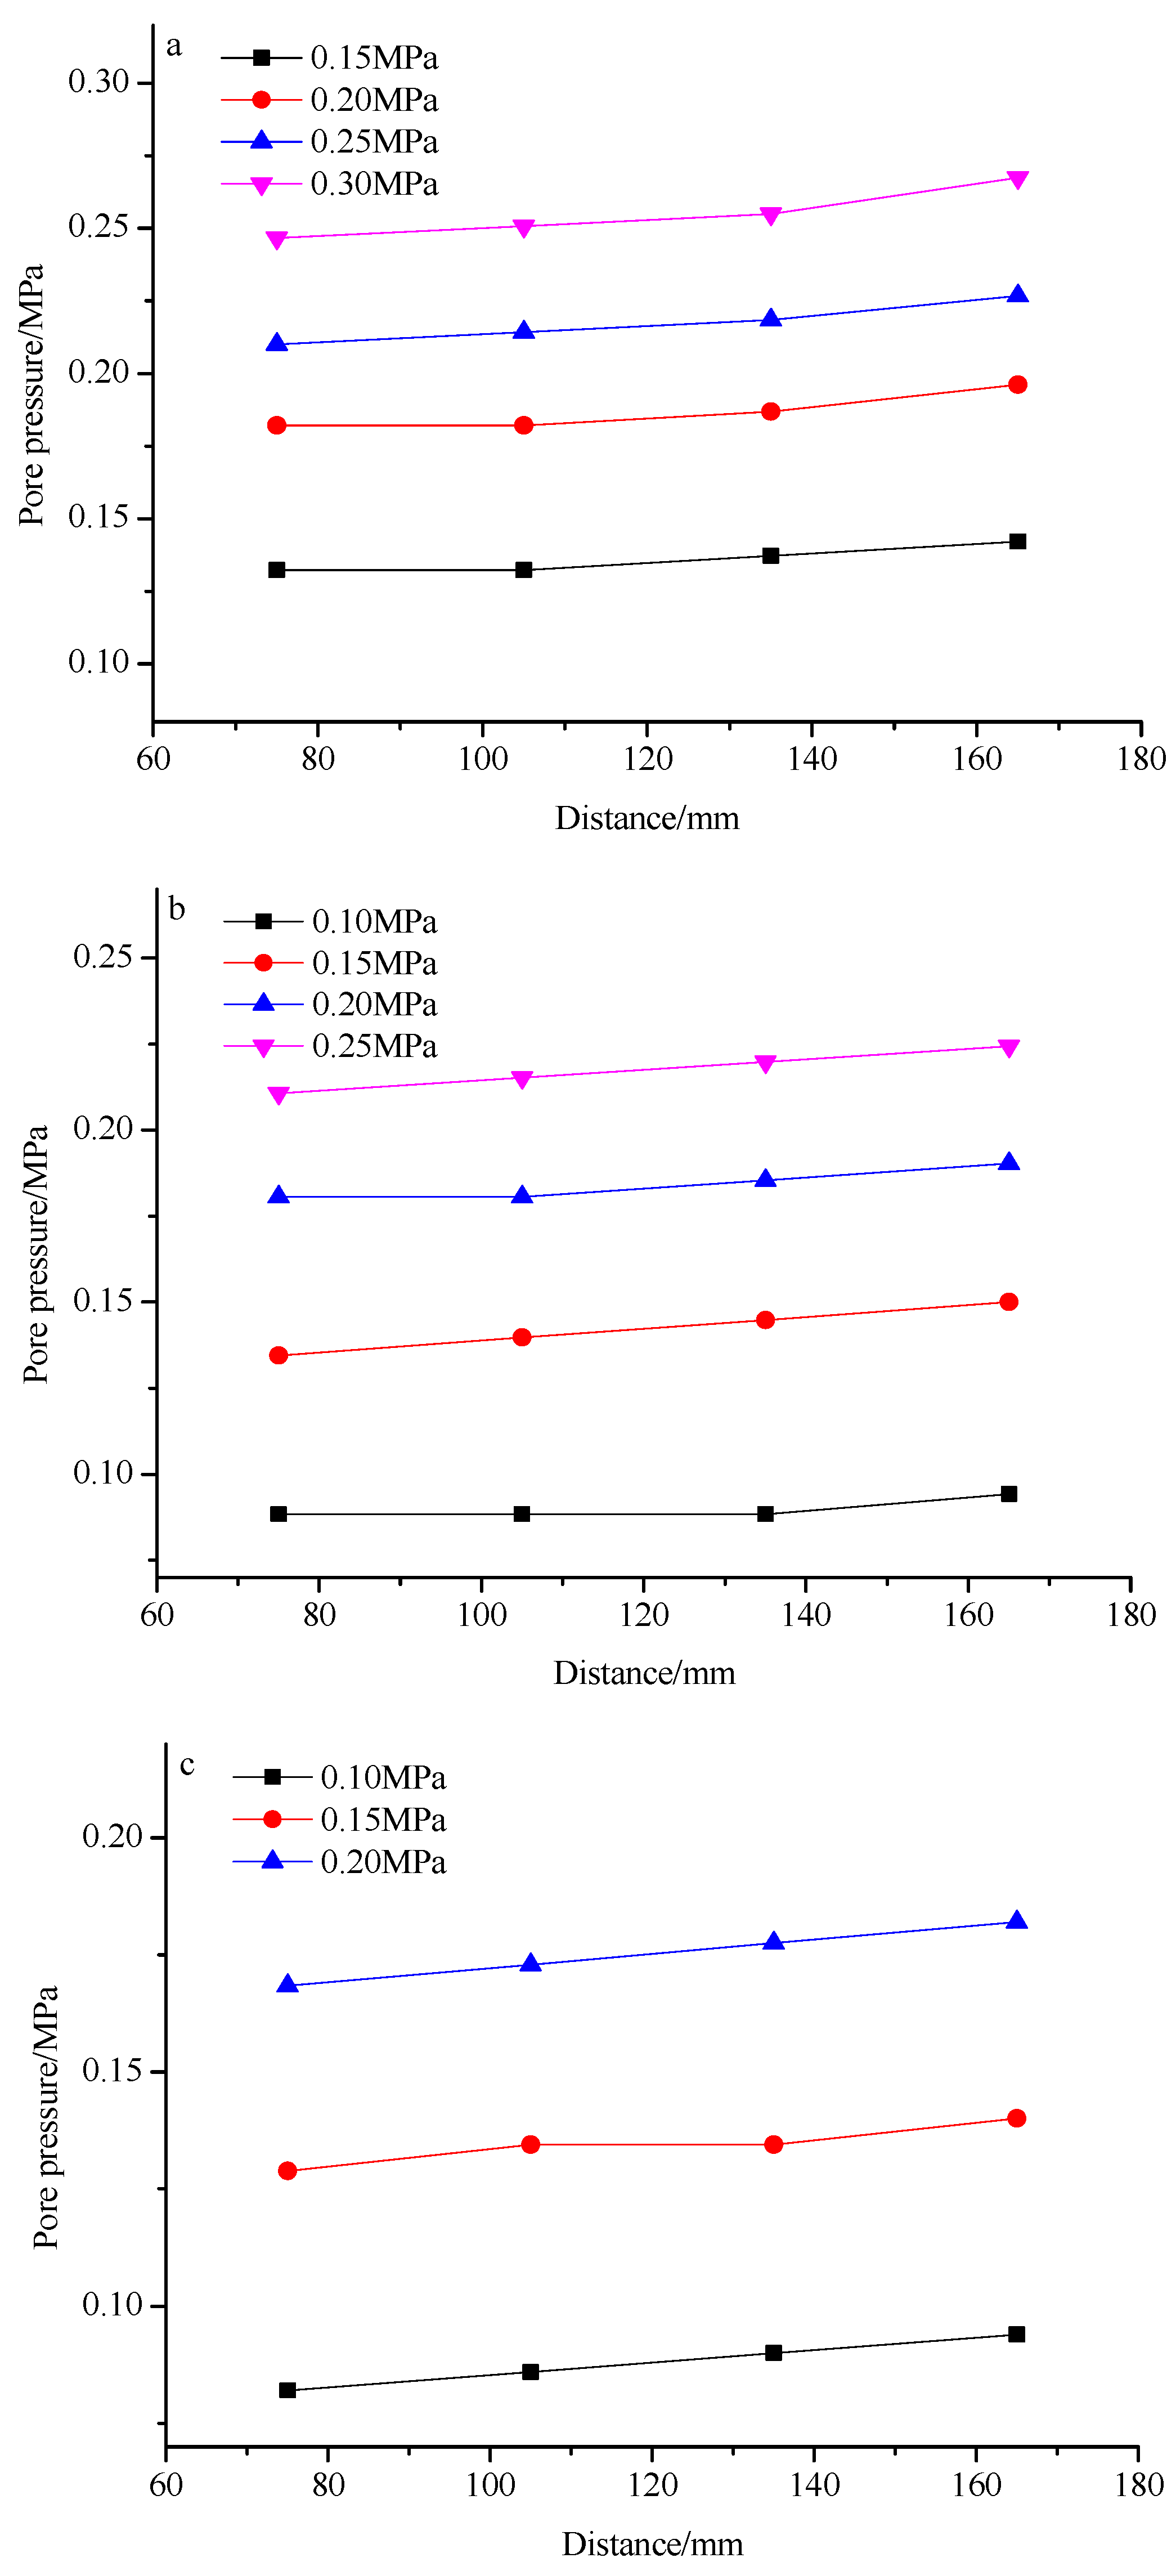
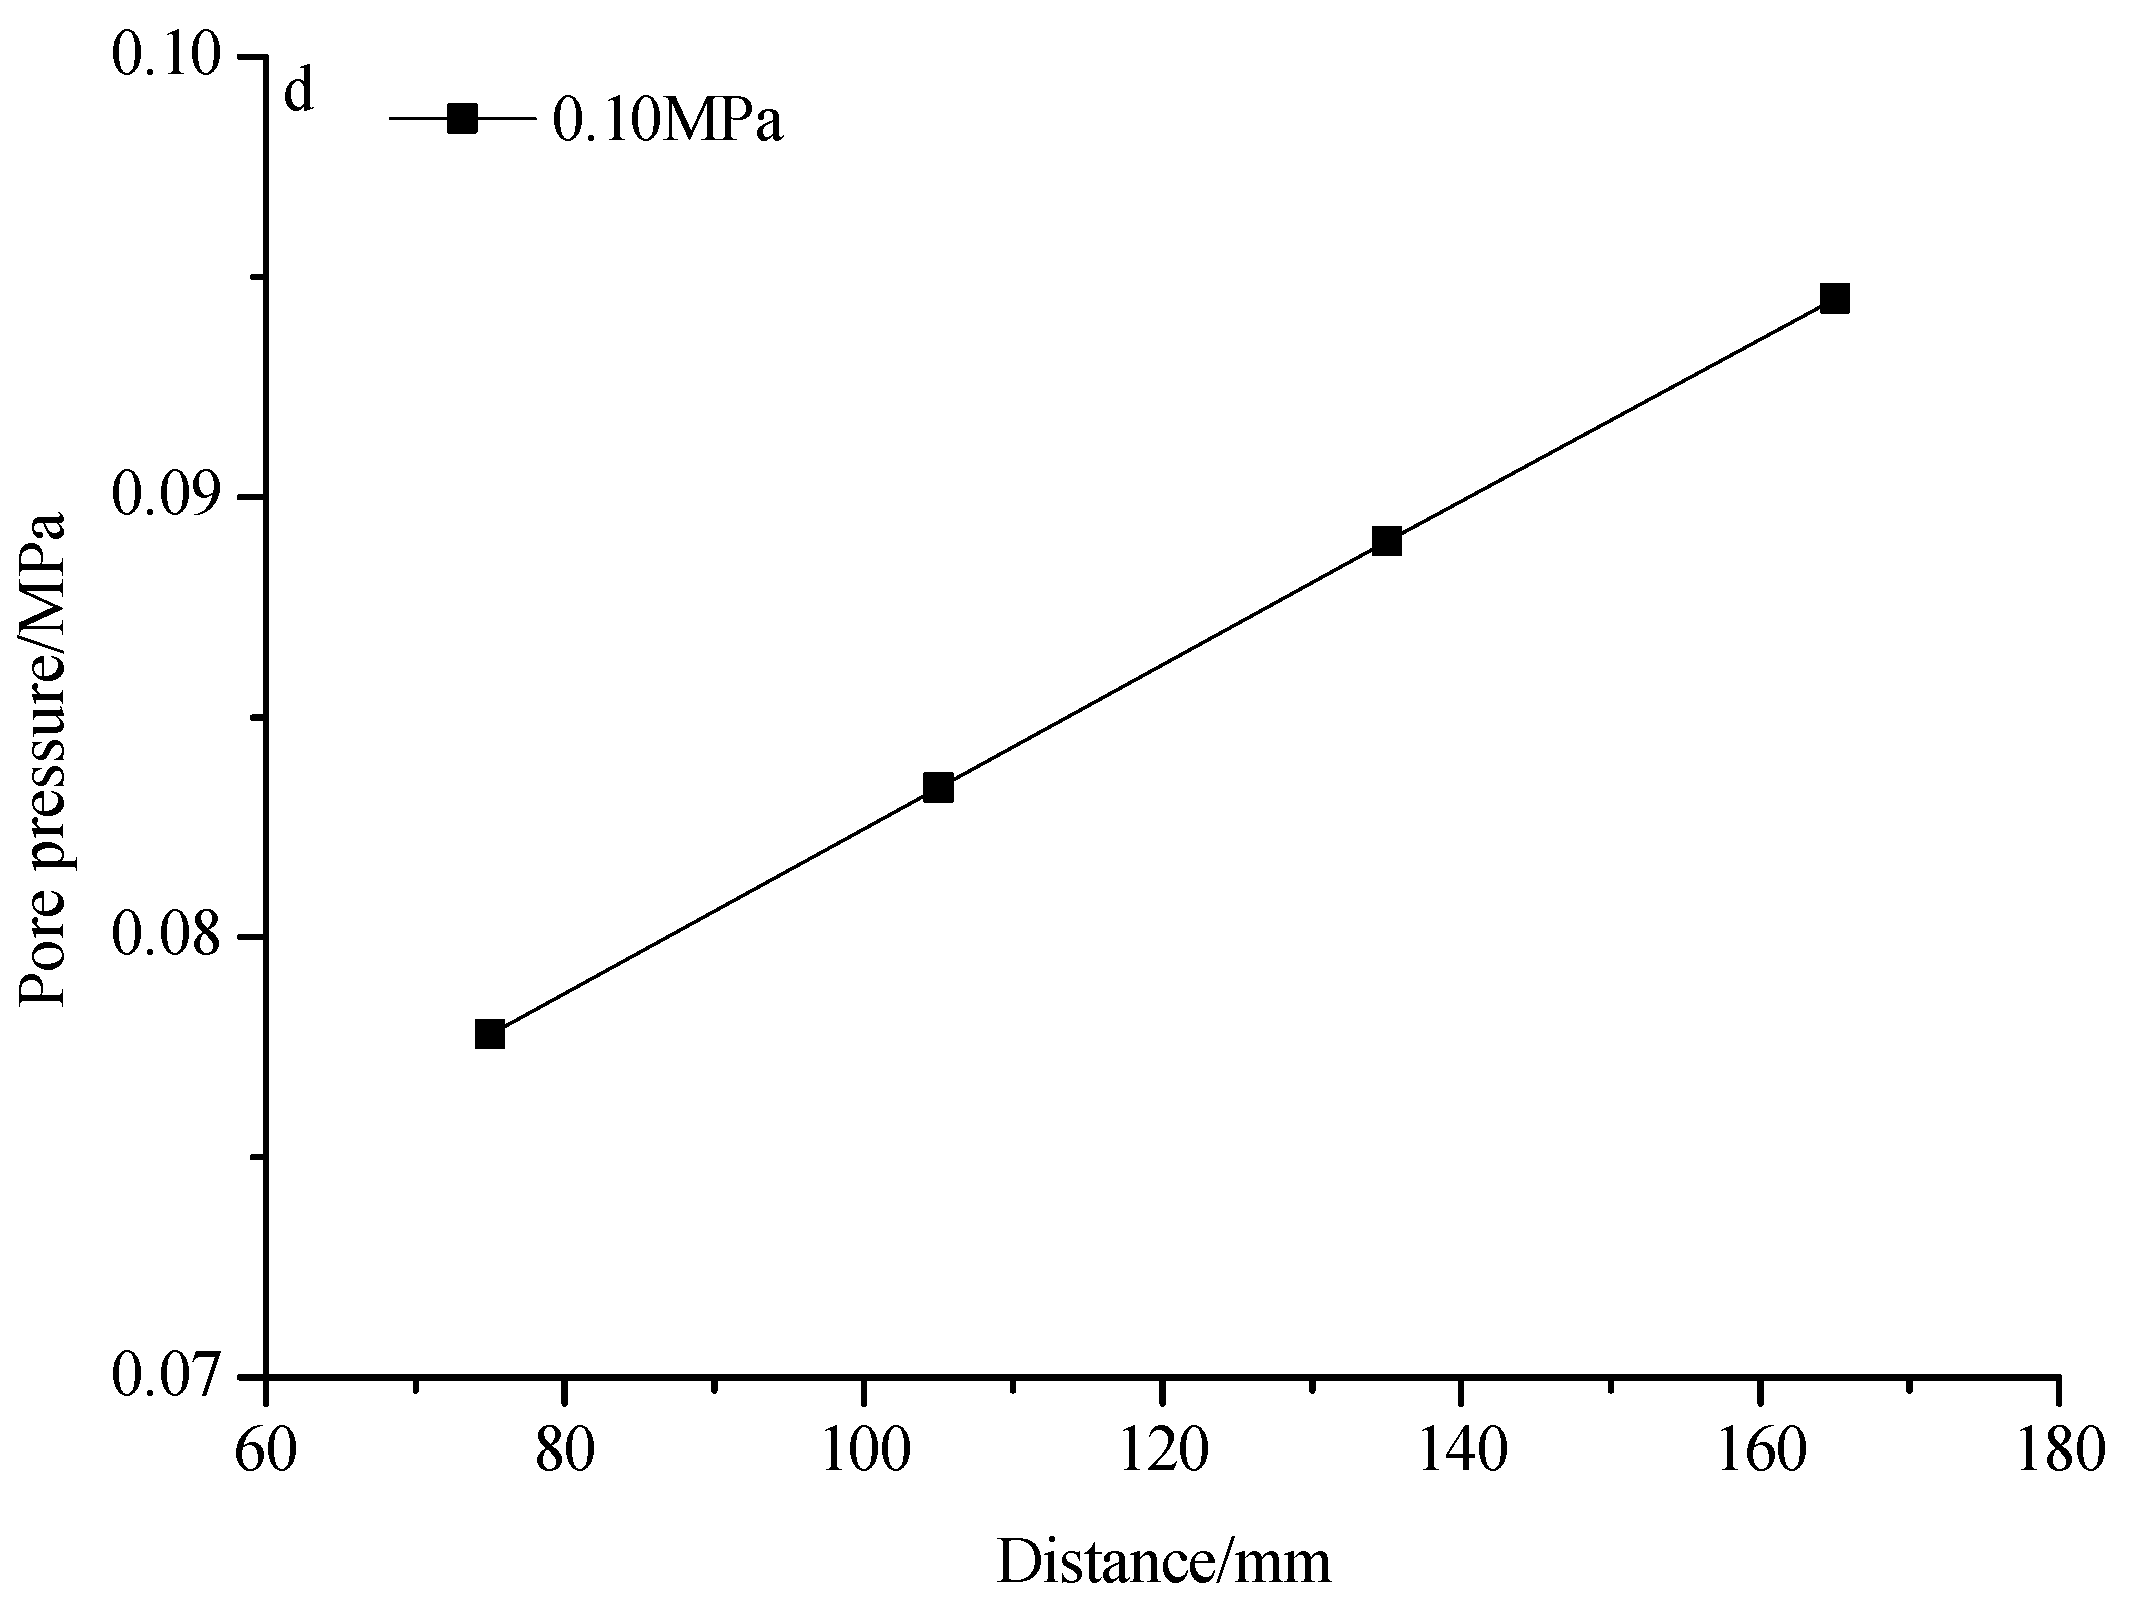
- When the karst conduit was opened, the water pressure values monitored by the pore pressure gauges all clearly decreased. With the stabilization of the water–sand flow, the water pressure gradually became stable. With the increase in the distance between the pore pressure sensor and the karst conduit, the water pressure values all increased gradually. The results of this test are significant in relation to the further study of the formation mechanisms of water–sand inrush through karst conduits.
Author Contributions
Funding
Data Availability Statement
Conflicts of Interest
References
- Parise, M.; Closson, D.; Gutiérrez, F.; Stevanović, Z. Anticipating and managing engineering problems in the complex karst environment. Environ. Earth Sci. 2015, 74, 7823–7835. [Google Scholar] [CrossRef]
- Zhang, K.; Zhang, W.B.; Liao, Z.Y.; Xie, H.P.; Zhou, C.T.; Chen, S.G.; Zhu, J.B. Risk assessment of ground collapse along tunnels in karst terrain by using an improved extension evaluation method. Tunn. Undergr. Space Technol. 2022, 129, 104669. [Google Scholar] [CrossRef]
- Waele, D.J.; Gutiérrez, F.; Parise, M.; Plan, L. Geomorphology and natural hazards in karst areas: A review. Geomorphology 2011, 124, 1–8. [Google Scholar] [CrossRef]
- Cui, Q.L.; Wu, H.N.; Shen, S.L.; Xu, Y.S.; Ye, G.L. Chinese karst geology and measures to prevent geohazards during shield tunnelling in karst region with caves. Nat. Hazards 2015, 77, 129–152. [Google Scholar] [CrossRef]
- Fan, H.B.; Zhang, Y.H.; He, S.Y.; Wang, K.; Wang, X.L.; Wang, H. Hazards and treatment of karst tunneling in Qinling-Daba mountainous area: Overview and lessons learnt from Yichang-Wanzhou railway system. Environ. Earth Sci. 2018, 77, 679–696. [Google Scholar] [CrossRef]
- Xue, F.; Cai, M.J.; Wang, T.Z.; Zhao, T.Y. Characteristics of karst cave development in urban karst area and its effect on the stability of subway tunnel construction. Adv. Civ. Eng. 2021, 2021, 8894713. [Google Scholar] [CrossRef]
- Li, S.C.; Lin, P.; Xu, Z.H.; Li, L.P.; Guo, M.; Sun, C.Q.; Wang, J.; Song, S.G. Minimum safety thickness of water and mud inrush induced by filled-type karst water bearing structures based on theory of slice method. Rock Soil Mech. 2015, 36, 1989–1994. [Google Scholar] [CrossRef]
- Wang, J.X.; Feng, B.; Zhang, X.S.; Tang, Y.Q.; Yang, P. Hydraulic failure mechanism of karst tunnel surrounding rock. Chin. J. Rock Mech. Eng. 2010, 29, 1363–1370. [Google Scholar]
- Zhang, K.; Tannant, D.D.; Zheng, W.B.; Chen, S.G.; Tan, X.R. Prediction of karst for tunnelling using fuzzy assessment combined with geological investigations. Tunn. Undergr. Space Technol. 2018, 80, 64–77. [Google Scholar] [CrossRef]
- Alija, S.; Torrijo, F.J.; Quinta-Ferreira, M. Geological engineering problems associated with tunnel construction in karst rock masses: The case of Gavarres tunnel (Spain). Eng. Geol. 2013, 157, 103–111. [Google Scholar] [CrossRef]
- Zini, L.; Chiara, C.; Franco, C. The challenge of tunneling through Mediterranean karst aquifers: The case study of Trieste (Italy). Environ. Earth Sci. 2015, 74, 281–295. [Google Scholar] [CrossRef]
- Zheng, Y.C.; He, S.Y.; Yu, Y.; Zheng, J.Y.; Zhu, Y.; Liu, T. Characteristics, challenges and countermeasures of giant karst cave: A case study of Yujingshan tunnel in high-speed railway. Tunn. Undergr. Space Technol. 2021, 114, 103988. [Google Scholar] [CrossRef]
- Huang, X.; Li, S.C.; Xu, Z.H.; Guo, M.; Shi, X.S.; Gao, B.; Zhang, B.; Liu, L. An attribute recognition model for safe thickness assessment between concealed karst cave and tunnel. J. Cent. South Univ. 2019, 26, 955–969. [Google Scholar] [CrossRef]
- Kaufmann, G.; Romanov, D. Modelling long-term and short-term evolution of karst in vicinity of tunnels. J. Hydrol. 2020, 581, 124282. [Google Scholar] [CrossRef]
- Lv, Y.X.; Jiang, Y.J.; Hu, W.; Cao, M.; Mao, Y. A review of the effects of tunnel excavation on the hydrology, ecology, and environment in karst areas: Current status, challenges, and perspectives. J. Hydrol. 2020, 586, 124891. [Google Scholar] [CrossRef]
- Li, S.C.; Pan, D.D.; Xu, Z.H.; Li, L.L.; Lin, P.; Yuan, Y.C.; Gao, C.L.; Lu, W. A model test on catastrophic evolution process of water inrush of a concealed karst caved filled with confined water. Rock Soil Mech. 2018, 39, 3164–3173. [Google Scholar] [CrossRef]
- Wang, X.T.; Li, S.C.; Xu, Z.H.; Hu, J.; Pan, D.D.; Xue, Y.G. Risk assessment of water inrush in karst tunnels excavation based on normal cloud model. Bull. Eng. Geol. Environ. 2019, 78, 3783–3798. [Google Scholar] [CrossRef]
- Li, S.C.; Wang, K.; Li, L.L.; Zhou, Z.Q.; Shi, S.S.; Liu, S. Mechanical mechanism and development trend of water-inrush disasters in karst tunnels. Chin. J. Theor. Appl. Mech. 2017, 49, 22–30. [Google Scholar]
- Liu, Q.; Chen, W.Z.; Yuan, J.Q.; Wang, Y.X.; Wan, H. Evaluation of grouting reinforcement effect for karst filling medium based on seepage-erosion theory. Chin. J. Rock Mech. Eng. 2020, 39, 572–580. [Google Scholar] [CrossRef]
- Casagrande, G.; Cucchi, F.; Zini, L. Hazard connected to railway tunnel construction in karstic area: Applied geomorphological and hydrogeological surveys. Nat. Hazards Earth Syst. Sci. 2005, 5, 243–250. [Google Scholar] [CrossRef]
- Wang, J.; Li, S.C.; Li, L.P.; Lin, P.; Xu, Z.H.; Gao, C.L. Attribute recognition model for risk assessment of water inrush. Bull. Eng. Geol. Environ. 2019, 78, 1057–1071. [Google Scholar] [CrossRef]
- Kang, Y.; Yang, C.H.; Zhang, P. Disaster-induced mechanism and its treatment in shallow-buried karst tunnel. Chin. J. Rock Mech. Eng. 2010, 29, 149–154. [Google Scholar]
- Li, S.C.; Xu, Z.H.; Huang, X.; Lin, P.; Zhao, X.C.; Zhang, Q.S.; Yang, L.; Zhang, X.; Sun, H.F.; Pan, D.D. Classification, geological identification, hazard mode and typical case studies of hazard-causing structures for water and mud inrush in tunnels. Chin. J. Rock Mech. Eng. 2018, 37, 1041–1069. [Google Scholar] [CrossRef]
- Xu, Z.H.; Lin, P.; Xing, H.L.; Pan, D.D.; Huang, X. Hydro-mechanical coupling response behaviors in tunnel subjected to a water-filled karst cave. Rock Mech. Rock Eng. 2021, 54, 3737–3756. [Google Scholar] [CrossRef]
- Zhang, W.S.; Jiao, Y.Y.; Zhang, G.H.; Zhang, X.; Ou, G.Z.; Lin, Z.P. Analysis of the mechanism of water inrush geohazards in deep-buried tunnels under the complex geological environment of karst cave-fractured zone. J. Earth Sci. 2022, 33, 1204–1218. [Google Scholar] [CrossRef]
- Zhou, Y.; Li, S.C.; Li, L.P.; Zhang, Q.Q.; Shi, S.S.; Song, S.G.; Wang, K.; Chen, D.Y.; Sun, S.Q. New technology for fluid-solid coupling tests of underground engineering application in experimental simulation of water inrush in filled-type karst and its conduit. Chin. J. Geotech. Eng. 2015, 37, 1232–1240. [Google Scholar] [CrossRef]
- Pan, D.D.; Li, S.C.; Xu, Z.H.; Li, L.L.; Lu, W.; Lin, P.; Huang, X.; Sun, S.Q.; Gao, C.L. Model tests and numerical analysis for water inrush caused by karst caves filled with confined water in tunnels. Chin. J. Geotech. Eng. 2018, 40, 828–836. [Google Scholar] [CrossRef]
- Wang, H.L.; Chen, S.J.; Guo, W.J. Development and application of test system for water-sand inrush. J. Min. Saf. Eng. 2019, 36, 72–79. [Google Scholar] [CrossRef]
- Zhou, Y.; Li, S.C.; Li, L.P.; Shi, S.S.; Zhang, Q.Q.; Chen, D.Y.; Song, S.G. 3D Fluid-solid coupled model test on water-inrush in tunnel due to seepage from filled karst conduit. Chin. J. Rock Mech. Eng. 2015, 34, 1739–1749. [Google Scholar] [CrossRef]
- Chu, V. Mechanism numerical on water inrush disaster of filling karst piping and analysis of evolutionary process in highway tunnel. J. Cent. South Univ. 2016, 47, 4173–4180. [Google Scholar]
- Huang, Z.; Zeng, W.; Li, X.Z.; Zhang, P.X.; Wu, Y.; Zhao, K.; Li, S.J. Numerical analysis of fracture-induced water inrushes in karst underground engineering. J. Basic Sci. Eng. 2021, 29, 412–425. [Google Scholar] [CrossRef]
- Li, L.P.; Li, S.C.; Zhang, Q.S. Study of mechanism of water inrush induced by hydraulic fracturing in karst tunnels. Rock Soil Mech. 2010, 31, 523–552. [Google Scholar] [CrossRef]
- Liu, Z.W.; He, M.C.; Wang, S.R. Study on karst water burst mechanism and prevention countermeasures in Yuanliangshan tunnel. Rock Soil Mech. 2006, 27, 228–232. [Google Scholar] [CrossRef]
- Li, S.C.; Gao, C.L.; Zhou, Z.Q.; Li, L.P.; Wang, M.X.; Yuan, Y.C.; Wang, J. Analysis on the precursor information of water inrush in karst tunnels: A true triaxial model test study. Rock Mech. Rock Eng. 2019, 52, 373–384. [Google Scholar] [CrossRef]
- Zhu, W.S.; Zhang, Q.B.; Zhu, H.H.; Li, Y.; Yin, J.H.; Li, S.C.; Sun, L.F.; Zhang, L. Large-scale geomechanical model testing of an underground cavern group in a true three-dimensional (3-D) stress state. Can. Geotech. J. 2010, 47, 935–946. [Google Scholar] [CrossRef]


| Diameter of Karst Conduit/mm | Set Value of Water Pressure/MPa | Actual Value of Water Pressure/MPa | Flow Rate of Water–Sand Mixture/(mL/s) |
|---|---|---|---|
| 5 | 0.10 | 0.10 | - |
| 0.15 | 0.13 | 8.0 | |
| 0.20 | 0.18 | 17.0 | |
| 0.25 | 0.22 | 20.0 | |
| 0.30 | 0.27 | 36.0 | |
| 6 | 0.10 | 0.10 | 6.7 |
| 0.15 | 0.13 | 16.7 | |
| 0.20 | 0.18 | 22.5 | |
| 0.25 | 0.22 | 40.5 | |
| 0.30 | - | - | |
| 7 | 0.10 | 0.10 | 9.3 |
| 0.15 | 0.12 | 19.0 | |
| 0.20 | - | 39.0 | |
| 0.25 | - | - | |
| 0.30 | - | - | |
| 8 | 0.10 | 0.09 | 19.1 |
| 0.15 | - | - | |
| 0.20 | - | - | |
| 0.25 | - | - | |
| 0.30 | - | - |
| Diameter of Karst Conduit/mm | Set Value of Water Pressure/MPa | Water Pressure Monitored by the Pore Pressure Gauges/MPa | |||
|---|---|---|---|---|---|
| No. 1 | No. 2 | No. 3 | No. 4 | ||
| 5 | 0.10 | - | - | - | - |
| 0.15 | 0.1323 | 0.1323 | 0.1372 | 0.1421 | |
| 0.20 | 0.1821 | 0.1821 | 0.1868 | 0.1961 | |
| 0.25 | 0.2100 | 0.2142 | 0.2184 | 0.2268 | |
| 0.30 | 0.2467 | 0.2508 | 0.2550 | 0.2675 | |
| 6 | 0.10 | 0.0884 | 0.0884 | 0.0884 | 0.0942 |
| 0.15 | 0.1345 | 0.1397 | 0.1448 | 0.1500 | |
| 0.20 | 0.1806 | 0.1806 | 0.1854 | 0.1903 | |
| 0.25 | 0.2107 | 0.2152 | 0.2198 | 0.2244 | |
| 0.30 | - | - | - | - | |
| 7 | 0.10 | 0.0820 | 0.0860 | 0.0900 | 0.0940 |
| 0.15 | 0.1288 | 0.1344 | 0.1344 | 0.1400 | |
| 0.20 | 0.1684 | 0.1729 | 0.1775 | 0.1820 | |
| 0.25 | - | - | - | - | |
| 0.30 | - | - | - | - | |
| 8 | 0.10 | 0.0778 | 0.0834 | 0.0890 | 0.0945 |
| 0.15 | - | - | - | - | |
| 0.20 | - | - | - | - | |
| 0.25 | - | - | - | - | |
| 0.30 | - | - | - | - | |
Disclaimer/Publisher’s Note: The statements, opinions and data contained in all publications are solely those of the individual author(s) and contributor(s) and not of MDPI and/or the editor(s). MDPI and/or the editor(s) disclaim responsibility for any injury to people or property resulting from any ideas, methods, instructions or products referred to in the content. |
© 2023 by the authors. Licensee MDPI, Basel, Switzerland. This article is an open access article distributed under the terms and conditions of the Creative Commons Attribution (CC BY) license (https://creativecommons.org/licenses/by/4.0/).
Share and Cite
Zhao, Z.; Wang, H.; Han, L.; Zhao, Z. Study of Water–Sand Inrush through a Vertical Karst Conduit Uncovered through Tunnel Excavation. Water 2023, 15, 2010. https://doi.org/10.3390/w15112010
Zhao Z, Wang H, Han L, Zhao Z. Study of Water–Sand Inrush through a Vertical Karst Conduit Uncovered through Tunnel Excavation. Water. 2023; 15(11):2010. https://doi.org/10.3390/w15112010
Chicago/Turabian StyleZhao, Zhenhua, Hailong Wang, Lin Han, and Zhenlong Zhao. 2023. "Study of Water–Sand Inrush through a Vertical Karst Conduit Uncovered through Tunnel Excavation" Water 15, no. 11: 2010. https://doi.org/10.3390/w15112010
APA StyleZhao, Z., Wang, H., Han, L., & Zhao, Z. (2023). Study of Water–Sand Inrush through a Vertical Karst Conduit Uncovered through Tunnel Excavation. Water, 15(11), 2010. https://doi.org/10.3390/w15112010