Article

Numerical Modelling on Physical Model of Ringlet Reservoir, Cameron Highland, Malaysia: How Flow Conditions Affect the Hydrodynamics

by
Safari Mat Desa
1,
Mohamad Hidayat Jamal
2,3,*,
Mohd Syazwan Faisal Mohd
1,
Mohd Kamarul Huda Samion
1,
Nor Suhaila Rahim
2,3,
Rahsidi Sabri Muda
4,
Radzuan Sa’ari
2,
Erwan Hafizi Kasiman
2,3,
Mushairry Mustaffar
2,
Daeng Siti Maimunah Ishak
2,3 and
Muhamad Zulhasif Mokhtar
2
1
National Water Research Institute of Malaysia (NAHRIM), Ministry of Environment and Water (KASA), Lot 5377, Jalan Putra Permai, Seri Kembangan 43300, Selangor, Malaysia
2
Faculty of Civil Engineering, Universiti Teknologi Malaysia (UTM), Johor Bahru 81310, Johor, Malaysia
3
Centre of River and Coastal Engineering (CRCE), Research Institute for Sustainable Environment (RISE), Universiti Teknologi Malaysia (UTM), Johor Bahru 81310, Johor, Malaysia
4
TNB Research Sdn Bhd, Lorong Ayer Itam, Kawasan Institusi Penyelidikan, Kajang 43000, Selangor, Malaysia
*
Author to whom correspondence should be addressed.
Water 2023, 15(10), 1883; https://doi.org/10.3390/w15101883
Submission received: 15 March 2023 / Revised: 19 April 2023 / Accepted: 9 May 2023 / Published: 16 May 2023

Abstract

:
The relative impacts of changes in the storage capacity of a reservoir are strongly influenced by its hydrodynamics. This study focused mainly on predicting the flow velocities and assessing the effectiveness of groynes as control mitigation structures in changes in the water depth and velocity distributions in Ringlet Reservoir. Initially, the physical model of the Habu River (the main part of Ringlet Reservoir) was fabricated, and flow velocities were measured. Then, a two-dimensional HEC-RAS was adapted to numerically simulate the hydrodynamics of the annual recurrence intervals of 1, 5, and 100 years in the Ringlet Reservoir. Experimental data acquired at the Hydraulic and Instrumentation Laboratory of the National Water Research Institute of Malaysia (NAHRIM) was used to calibrate and validate the numerical models. The comparison of simulation and experimental results revealed that the water levels in all simulations were consistent. As for the velocity, the results show a comparable trend but with a slight variation of results compared to the experiments due to a few restrictions found in both simulations. These simulation results are deemed significant in predicting future sediment transport control based on hydrodynamics in this reservoir and can be of future reference.

1. Introduction

Dams and reservoirs are essential for impounding or storing water for many uses, such as flood control, water supply, hydropower, irrigation, navigation, and recreation. A reservoir typically has two storage features. First, active storage, or the volume used for storing water, generating power, supplying water, or as reserves for flood management; and second, dead storage, which refers to the volume below the minimum operational elevation [1]. There are different types of reservoirs; for instance, run-of-river type reservoirs. These reservoirs are commonly used for generating hydropower due to their small-volume active and large-volume dead storage [2]. Worldwide, hydropower continues to be the most significant renewable energy source for producing electricity [3]. It has generated more energy than all other renewable sources, with 4418 TWh in 2020 [4].
The Ringlet Reservoir in Cameron Highlands, Malaysia, is an essential water source for domestic, agricultural, and hydropower purposes. However, the increasing demand for water supply and activities such as agriculture and logging have resulted in significant changes in the hydrodynamics of the reservoir. Sediment movement also leads to deposition or erosion, and its movement is primarily influenced by flow velocity and direction. In general, sediment deposition can reduce water storage capacity by up to 0.8%, resulting in a shorter project life [5]. This situation makes it difficult for reservoirs to cater to the rising need for water [6]. Another issue is sediment buildup around power plant gates, reducing a dam’s ability to operate effectively.
Furthermore, a significant amount of sediment in the water intake might harm or lessen the effectiveness of the hydro turbines and other electromechanical components [7,8]. Dredging activities have been carried out since the dam’s initial operation to provide adequate reservoir storage volume. Unfortunately, the cost of dredging has risen dramatically and is anticipated to increase even further as the rate of silt deposition rises [9]. While the projected life for the Ringlet Reservoir in the Cameron Highlands is 80 years with a gross storage of 6.7 million m3, after barely 35 years of operation, 52 percent of its storage was already utilised, with 34 percent filled with sediment [10]. Hence, further research and predictions are required for the continuous operation of the current power generation plant. One of the solutions for this is to study the hydrodynamics of the flow velocity in those reservoirs.
Flow velocity is a crucial parameter in understanding the behavior of fluids in reservoirs. Physical models and numerical simulations are two common methods used to study flow velocity. Physical models involve constructing a scaled-down physical model that mimics the behavior of the reservoir, while numerical simulations use mathematical equations to simulate the behavior of the reservoir. Several studies have compared the accuracy of physical models and numerical simulations in predicting reservoir flow velocity. For example, a study by Kositgittiwong et al. found that physical models provided more accurate predictions of flow velocity than numerical simulations due to the many uncertainties in the real application [11]. However, a study by Zhang et al. found that numerical simulations were more accurate than physical models in predicting flow velocity [12]. Research conducted by McCoy et al. used a physical model to investigate the effect of groynes on flow velocities in a reservoir. The study found that installing groynes reduced flow velocities and increased water retention time in the reservoir [13]. Numerical simulations have also been used to predict flow velocities in reservoirs. Research conducted by Liang et al. used a numerical simulation model to investigate the effect of groynes geometry and arrangement on flow velocities, erosion, and sedimentation in reservoirs. The study found that the installation of groynes led to a reduction in flow velocities, the formation of vortices, and scouring, which was consistent with the findings from their laboratory experiment [14].
The primary objective of this investigation is to determine the effect of hydrodynamics on the flow regime of the reservoir by assessing the rates and directions of flow in Ringlet Reservoir using a physical and 2D numerical model. The present work aims to characterise the Ringlet reservoir’s velocity patterns for up to a 100-year return period through physical and numerical modelling, the common practices used by several researchers [15,16,17]. First, the influences of hydrodynamics on the flow pattern from the reservoir were investigated, and a numerical simulation model was compared with physical observations better to understand the flow pattern along the Ringlet Reservoir. The results of this physical model were then compared with the numerical simulation to validate the accuracy of the simulation. The simulation used a 2D numerical model based on the Reynolds-Averaged Navier-Stokes (RANS) equations. Finally, the numerical model was calibrated and validated using experimental data from the physical model. Further, this study examined the construction of groynes or access rams to obtain the hydrodynamics for this prediction [18].
The results from the physical model and numerical simulation revealed that the flow conditions in Habu (Ringlet Reservoir) are affected by various factors such as velocity, bathymetry, and the presence of hydraulic structures. The findings also showed agreement in the flow pattern between the physical and numerical models, indicating that the numerical model can predict future sediment transport patterns. Furthermore, the results showed agreements in the reservoirs’ flow pattern between the physical and numerical models. In the meantime, the installation of groynes significantly affects the hydrodynamics of flows at the installation area. Overall, the study provides valuable insights into the hydrodynamics of Ringlet Reservoir, which can be used to predict future changes and implement effective management strategies.

2. Methodology

The methodology adopted for numerical modelling of the physical model of Ringlet Reservoir (Habu), located in Cameron Highland, Malaysia, was based on a four-step procedure, as depicted in Figure 1. The first step was a desktop study, which involved gathering relevant data about the reservoir, including aerial images, topography, and hydrology. The second stage was the small-scaled model setup, which comprised two significant components: experimental work and numerical model setup using HECRAS. The experimental work involved the physical construction of a small-scale model of the Ringlet Reservoir. In contrast, the numerical model setup involved using HECRAS software to simulate the hydraulic behaviour and performance of the reservoir. The third step of the study was the comparison of the physical and numerical models. This involved comparing the observed data from the physical model with the results obtained from the HECRAS numerical model setup. The final step involved the presentation of the results, a discussion of the findings, and the study’s overall conclusions. Overall, this methodology incorporates physical and numerical modelling that provides a robust approach to assessing the hydrodynamic performance and prospects of the Ringlet Reservoir in Cameron Highland, Malaysia.

2.1. Study Area

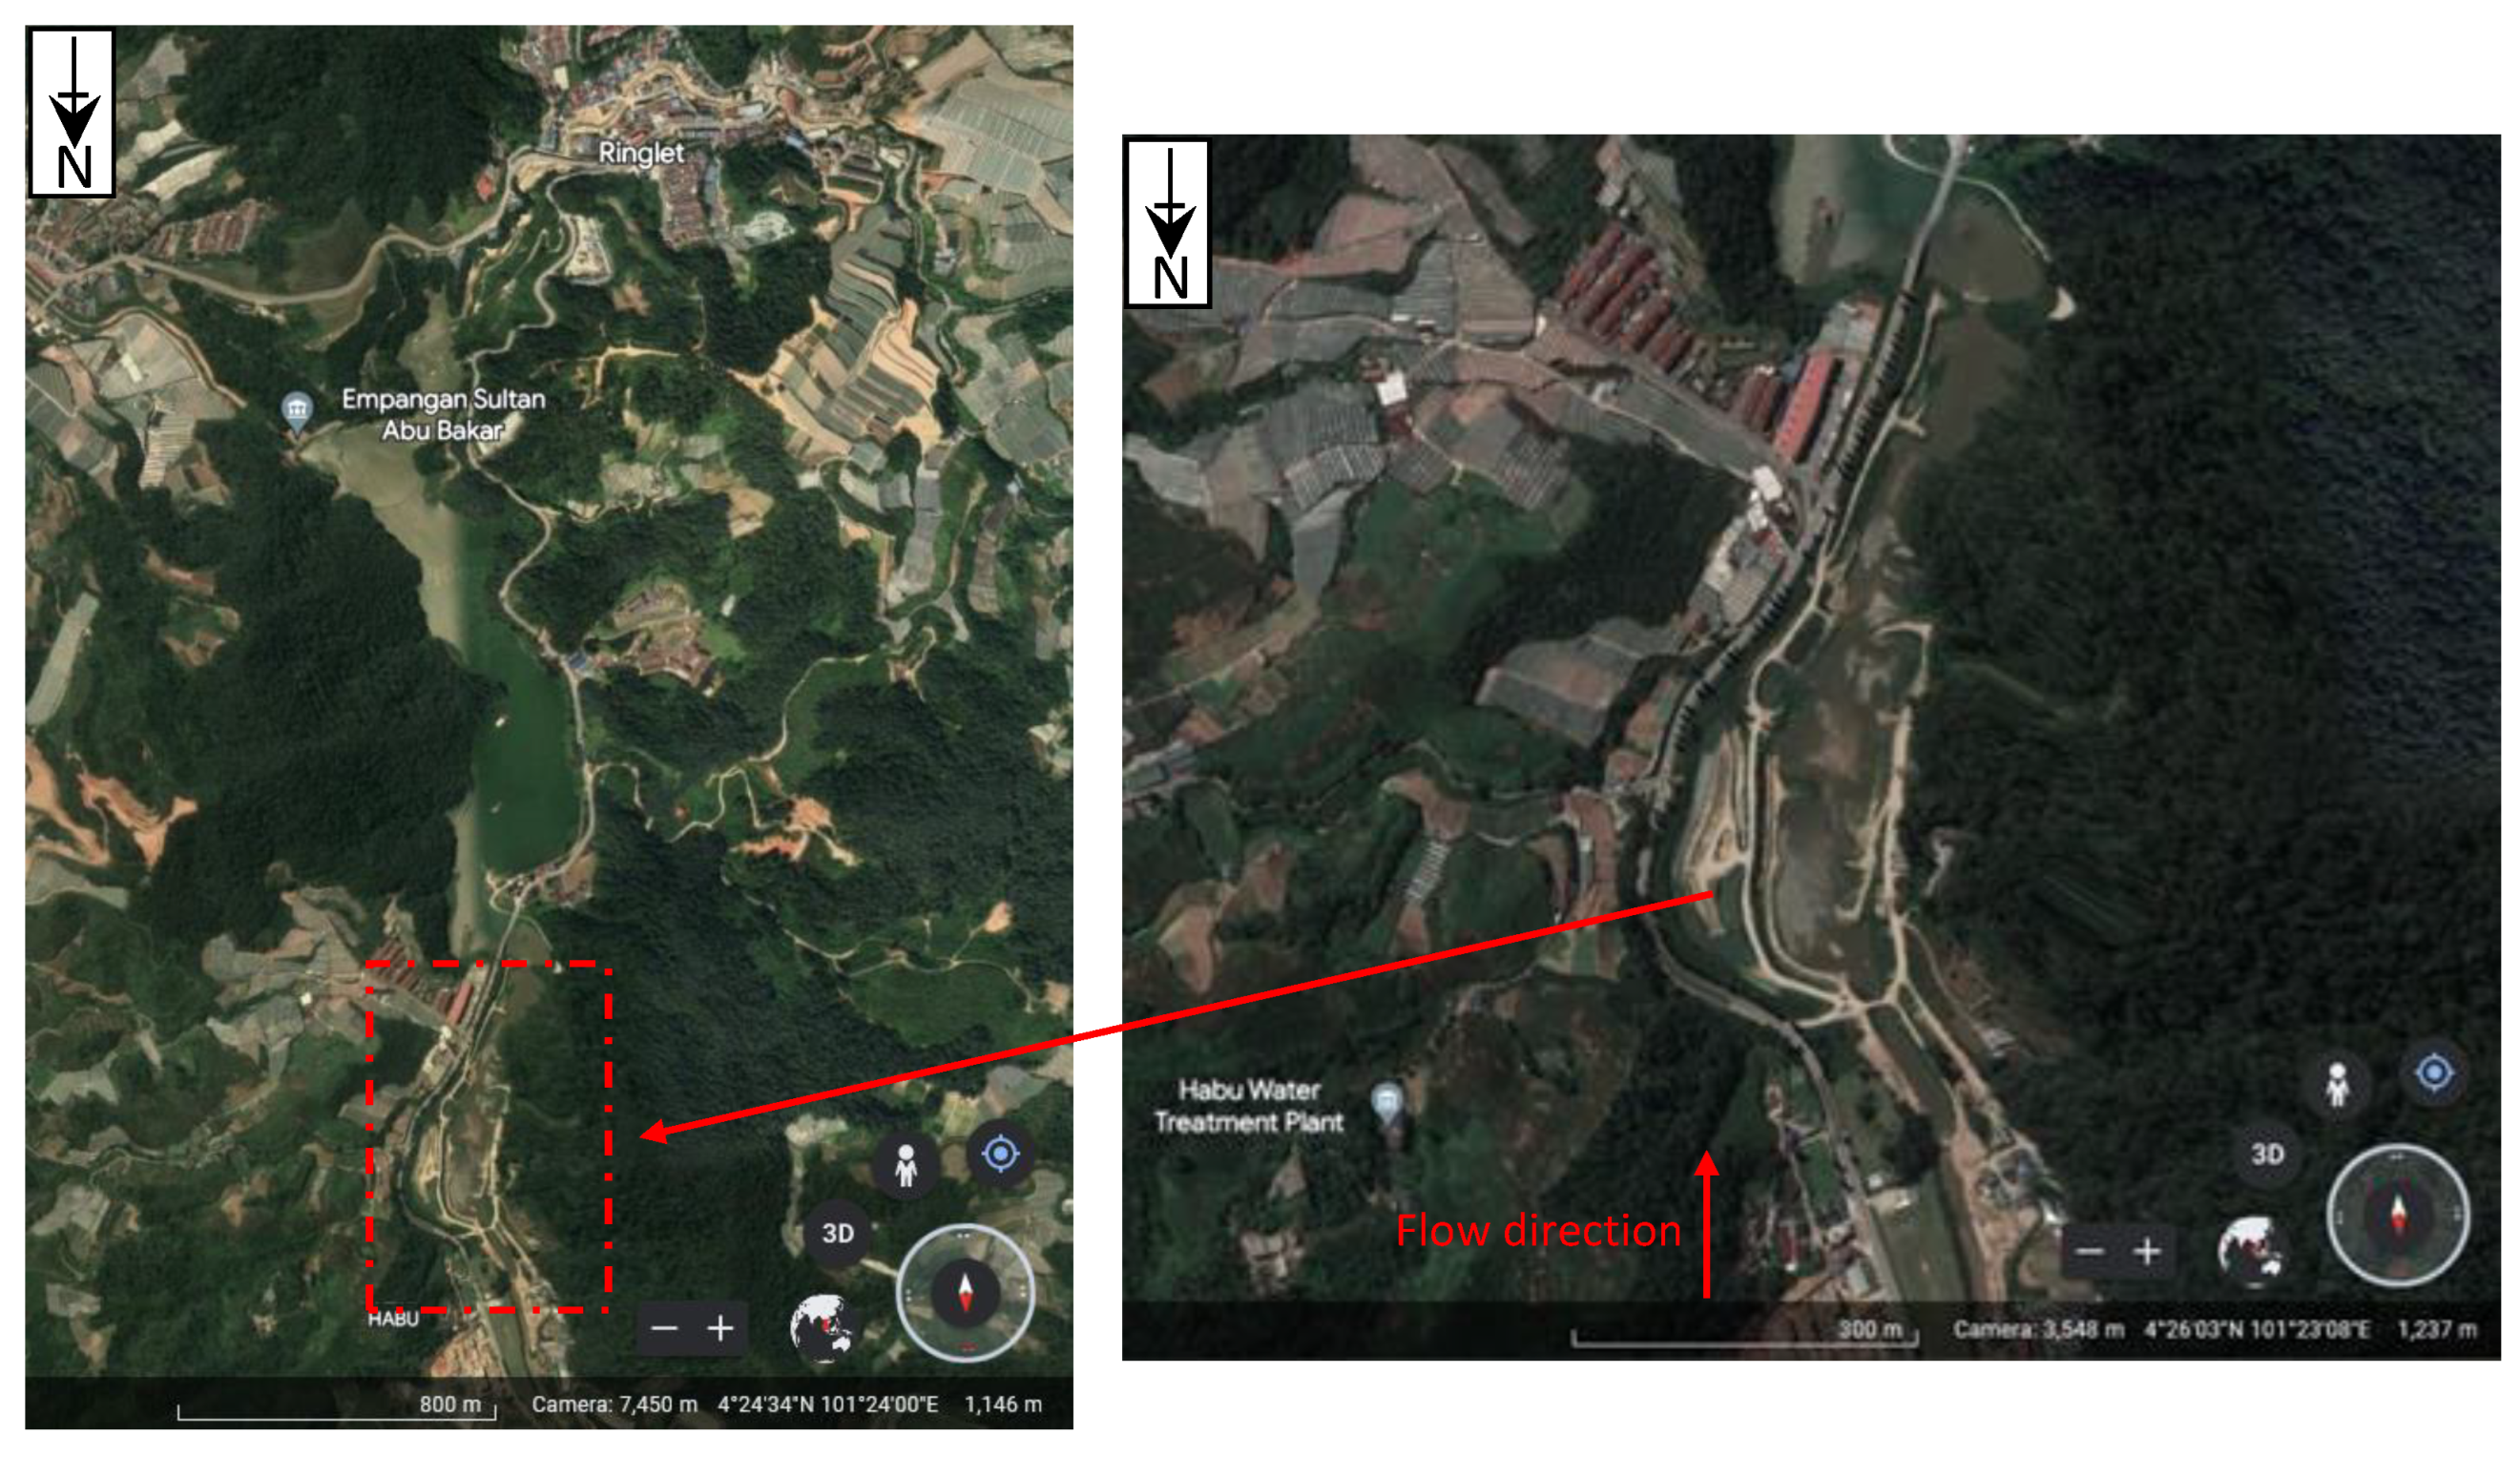
Ringlet Reservoir, in the central highlands of West Malaysia, approximately 160 km north of Kuala Lumpur, is a part of the Cameron Highlands-Batang Padang hydroelectric scheme. It comprises the Sultan Abu Bakar Dam, which was constructed in 1963. It was initially estimated that the sediment loading to the reservoir was m3/annum [19]. Tenaga National Berhad (TNB) is responsible for developing and operating most major hydropower projects. At present, TNB is the main operator for three of the largest hydroelectric schemes in Sungai Perak (1249.1 MW), Kenyir (665 MW), and Cameroon Highlands-Batang Padang (622 MW) [20]. A map of Habu is depicted in Figure 2. The Ringlet Reservoir is located within the Bertam catchment, with a combined area of 70.4 km2. The Bertam Catchment is divided into six sub-catchments: Upper Bertam, Middle Bertam, Lower Bertam, Habu, Ringlet, and Reservoir. Bertam River, Habu River, and Ringlet River are the principal rivers supplying the Ringlet Reservoir. Teh et al. state that most sediment loaded into the Ringlet Reservoir comes from the Habu end [21].
An area of around 183 km2 comprises the upper watershed that feeds the Ringlet Reservoir [22,23]. Electricity is generated from headwater from two main rivers, Sungai Telom and Sungai Bertam. In this regard, even though the Ringlet reservoir had an initial water storage capacity of 6.7 million m3, it has experienced a loss of operational volume over the years because of accelerated sedimentation [19,24]. This phenomenon is caused by millions of tons of additional sediment mobilized by rapid developments in the upper catchments area. This situation has gradually decreased the reservoir’s capacity for hydro generation and led to a higher risk of downstream flooding [25]. The higher sediment deposition rate would significantly reduce the projected useful life of the reservoir [26]. Additionally, it has a negative impact on the dam’s stability and risks the ability to store water for flood control [27,28].

2.2. Experimental Works

2.2.1. Physical Model Construction

Typically, physical models are used to investigate, evaluate, and formulate solutions to various sedimentation issues in hydraulic structures like reservoirs [29,30]. A physical hydraulic model is often a scaled-down version of the research site and was essential for data calibration and validation of the HEC-RAS numerical model. The dynamic similarity makes it possible to scale results from model tests to predict corresponding results for the full-scale prototype. The dynamic similarity makes it possible to scale results from model tests to predict related results for the full-scale prototype. Dynamic similarities can be found by comparing the ratios of various significant forces acting on the system. Because gravitational force dominates fluid motion in free surface flow, Froude scaling was used. Laboratory tests have been conducted in the Hydraulic and Instrumentation Laboratory, National Water Research Institute of Malaysia (NAHRIM). A model of Habu River (also known as Habu), a significant part of Ringlet Reservoir in the Cameron Highlands, was constructed with a geometric scale of 1:30. The model was constructed using a fixed bed setup; hence, no erosion or accretion occurred during the tests. The model’s bed was levelled to its original or existing condition, equivalent to its prototype.

2.2.2. Model Surveying

The model’s bathymetry was determined using three-dimensional surveying techniques (3D), Terrestrial Laser Scanning (TLS), and Digital Close-Range Photogrammetry (DCRP). A medium-range GLS 2000 TLS model (Topcon, Livermore, CA, USA) was used for the laser scanning research. The output of laser scanning is an array of points known as a point cloud, a set of vertices defined in a 3D coordinate system (x, y, and z) capable of reconstructing a highly detailed 3D physical model. The high-density point cloud from TLS will support a numerical model as input parameters (base data). In the meantime, DCRP was implemented to gather 3D information about features from two or more photos of the same object. This technique was used to create accurate 2D orthophoto and 3D surface models in the form of point cloud data using a sequence of overlapping digital photos acquired by a drone. The drone (Phantom 4 Pro, DJI, Tokyo, Japan) flew manually along the designated flight line approximately 5 m above the model. A series of digital images were captured at intervals of three seconds to enable a 3D model and orthophoto of the physical surface model to be generated.

2.2.3. Flow Measurements

Water was pumped through the inlet pipe upstream of Habu. The 350 SZ (EBARA, Subang Jaya, Malaysia) external pumps, with a capacity of 1000 L/min and a head of 7 m, were employed for this study. Water was poured until the model or waterway reached its maximum level. The pump was then turned on until the specified flow rate for each test was reached. Dynaflox Series DMTFP Portable Transit Time Ultrasonic Flow Meters (Emin Group, Singapore) were put near the stabilizer tank to measure the inlet flow rate. Steady flow conditions for all tests were established by manipulating the setting of the pump rate to achieve the designated flow discharges, refer to Table 1. H1 and H2 denote Habu with Existing condition and Groynes, respectively, while the last numerical value after the dash symbol represents their respective ARIs.
Flow velocity is a crucial hydraulic and hydrological component utilised in the velocity–area approach to evaluate discharge [31]. Flow velocities were measured using a 1D AEM electromagnetic current meter (ECM). With a minimum depth of 3 cm and a range of 0 to 5 m/s, this ECM can precisely detect water speeds in shallow water storage. The flow was measured at the observation point located at every CH, marked with black dots in Figure 3. An average of five readings were measured for every point at roughly 0.5 of the depth.
Groynes were constructed after completing the measurements for the existing condition. Figure 3b shows the arrangement of eight groynes with a width-to-length ratio, w/l, approximately equal to 0.1. The groynes were constructed approximately perpendicular to the channel. These impermeable groynes are designed to be non-submerged [32,33,34]. Therefore, the groynes were approximately built perpendicular to the channel. The same procedures used during the existing condition were repeated for mitigation (with groynes condition).

2.3. Numerical Model (HEC-RAS)

2.3.1. Model Setup

HEC-RAS software was used to model the flow of water in this project. The 2D Shallow Water Equations (SWE) are the basis for hydrodynamic two-dimensional (2D) models in HEC-RAS. The SWE is found by integrating the Reynolds-averaged Navier-Stokes equations over the flow depth [35]. In this integration process, a hydrostatic pressure distribution is assumed. The 2D finite volume method is used for the solution of the SWE, allowing greater stability (due to shock capturing capability) and accuracy compared to the finite element or finite difference-based method. Two types of models are available in HEC-RAS 2D, the full SWE and the Diffusion Wave Approximation (DWA). The DWA model was used as an initial condition for the SWE model to provide stability for the unsteady model. The point cloud taken from the 3D scanning of the model was processed into Digital Elevation Model (DEM) and exported as a GeoTIFF file format. This was then imported into HEC-RAS as terrain for the simulation model.
In all cases, an initial water level was prescribed. This means at the start of the simulation. The domain contains water at a certain level. This initial condition proved more effective than starting the simulation with the domain completely dry. Boundary conditions were imposed at the inlet and outlet of the computational domain. The inlet is located at the upstream part of the domain, while the outlet is located precisely on the check dam. A constant flow rate based on the Annual Recurrence Interval (ARI) of 1-, 5- and 100 years was prescribed at the inlet. At the outlet, a constant water level was used. The level was initially assumed as no water level data was observed during the experiment. The value was then changed until the water level just upstream of the outlet matched the experimental observation. This is one of the calibration steps used to set the current value for the unknown boundary conditions.

2.3.2. Convergence Study and Model Calibration

A computational mesh was generated for the domain of interest. Three mesh sizes of 7680, 30,065, and 185,338 were used for 15 cm, 10 cm, and 5 cm, respectively. The water surface elevation and velocity plots at CH500 for different mesh sizes were plotted and compared. Although the coarse mesh can provide an equally accurate result, for the simulation that follows, a mesh size of 5 cm is used throughout. Constant flow rates were imposed at the inlet, while constant water levels were used at the outlet. An adaptive time step was used in the simulation with a minimum and maximum Courant number between 1 and 3. Two of Manning’s values of 0.0025 and 0.01 were used for calibration. The Manning value was selected based on the closest agreement of water level and velocity between simulation and experimental results. The simulation period for all cases is 30 min.

2.3.3. Model Simulation

The wetted boundary of the model is considered through the Manning coefficient. Because the shallow water equation assumes averaged vertical velocity, the effect of the boundary layer cannot be modelled directly. The influence of the boundary layer due to surface roughness is represented as additional source terms. This source term includes, amongst others, the Manning coefficient. For the current work, it is assumed that the bed is quite rough. A different value for Manning was tested. The best Manning value was selected based on the closest agreement for water level and velocity between simulation and experimental results. A Manning value of 0.0025 was used throughout the simulation. With the mesh generated and the initial and boundary conditions imposed, the hydrodynamics of the model was simulated for 15 computational minutes based on a steady state obtained during the preliminary study. The 2D HEC-RAS model used in the current work solves the unsteady SWE. HEC-RAS uses an explicit formulation for the solution of the SWE. Due to the explicit formulation, the time step needed to keep the solution stable needs to be smaller than the critical time step calculated by the Courant number [36]. Two schemes for time marching are available in HEC-RAS: fixed and adaptive time stepping. Initially, the fixed time step was used. However, as the mesh size decreased, the time step selected violated the critical time step and resulted in an unreliable solution. The adaptive time step was then selected. The use of adaptive time-stepping requires the setting of a minimum and maximum Courant number. The minimum and maximum Courant numbers 1 and 3 were selected for all simulations. The selection was based on the best practices outlined in the HEC-RAS manual [37].

3. Results and Discussions

3.1. Physical Model

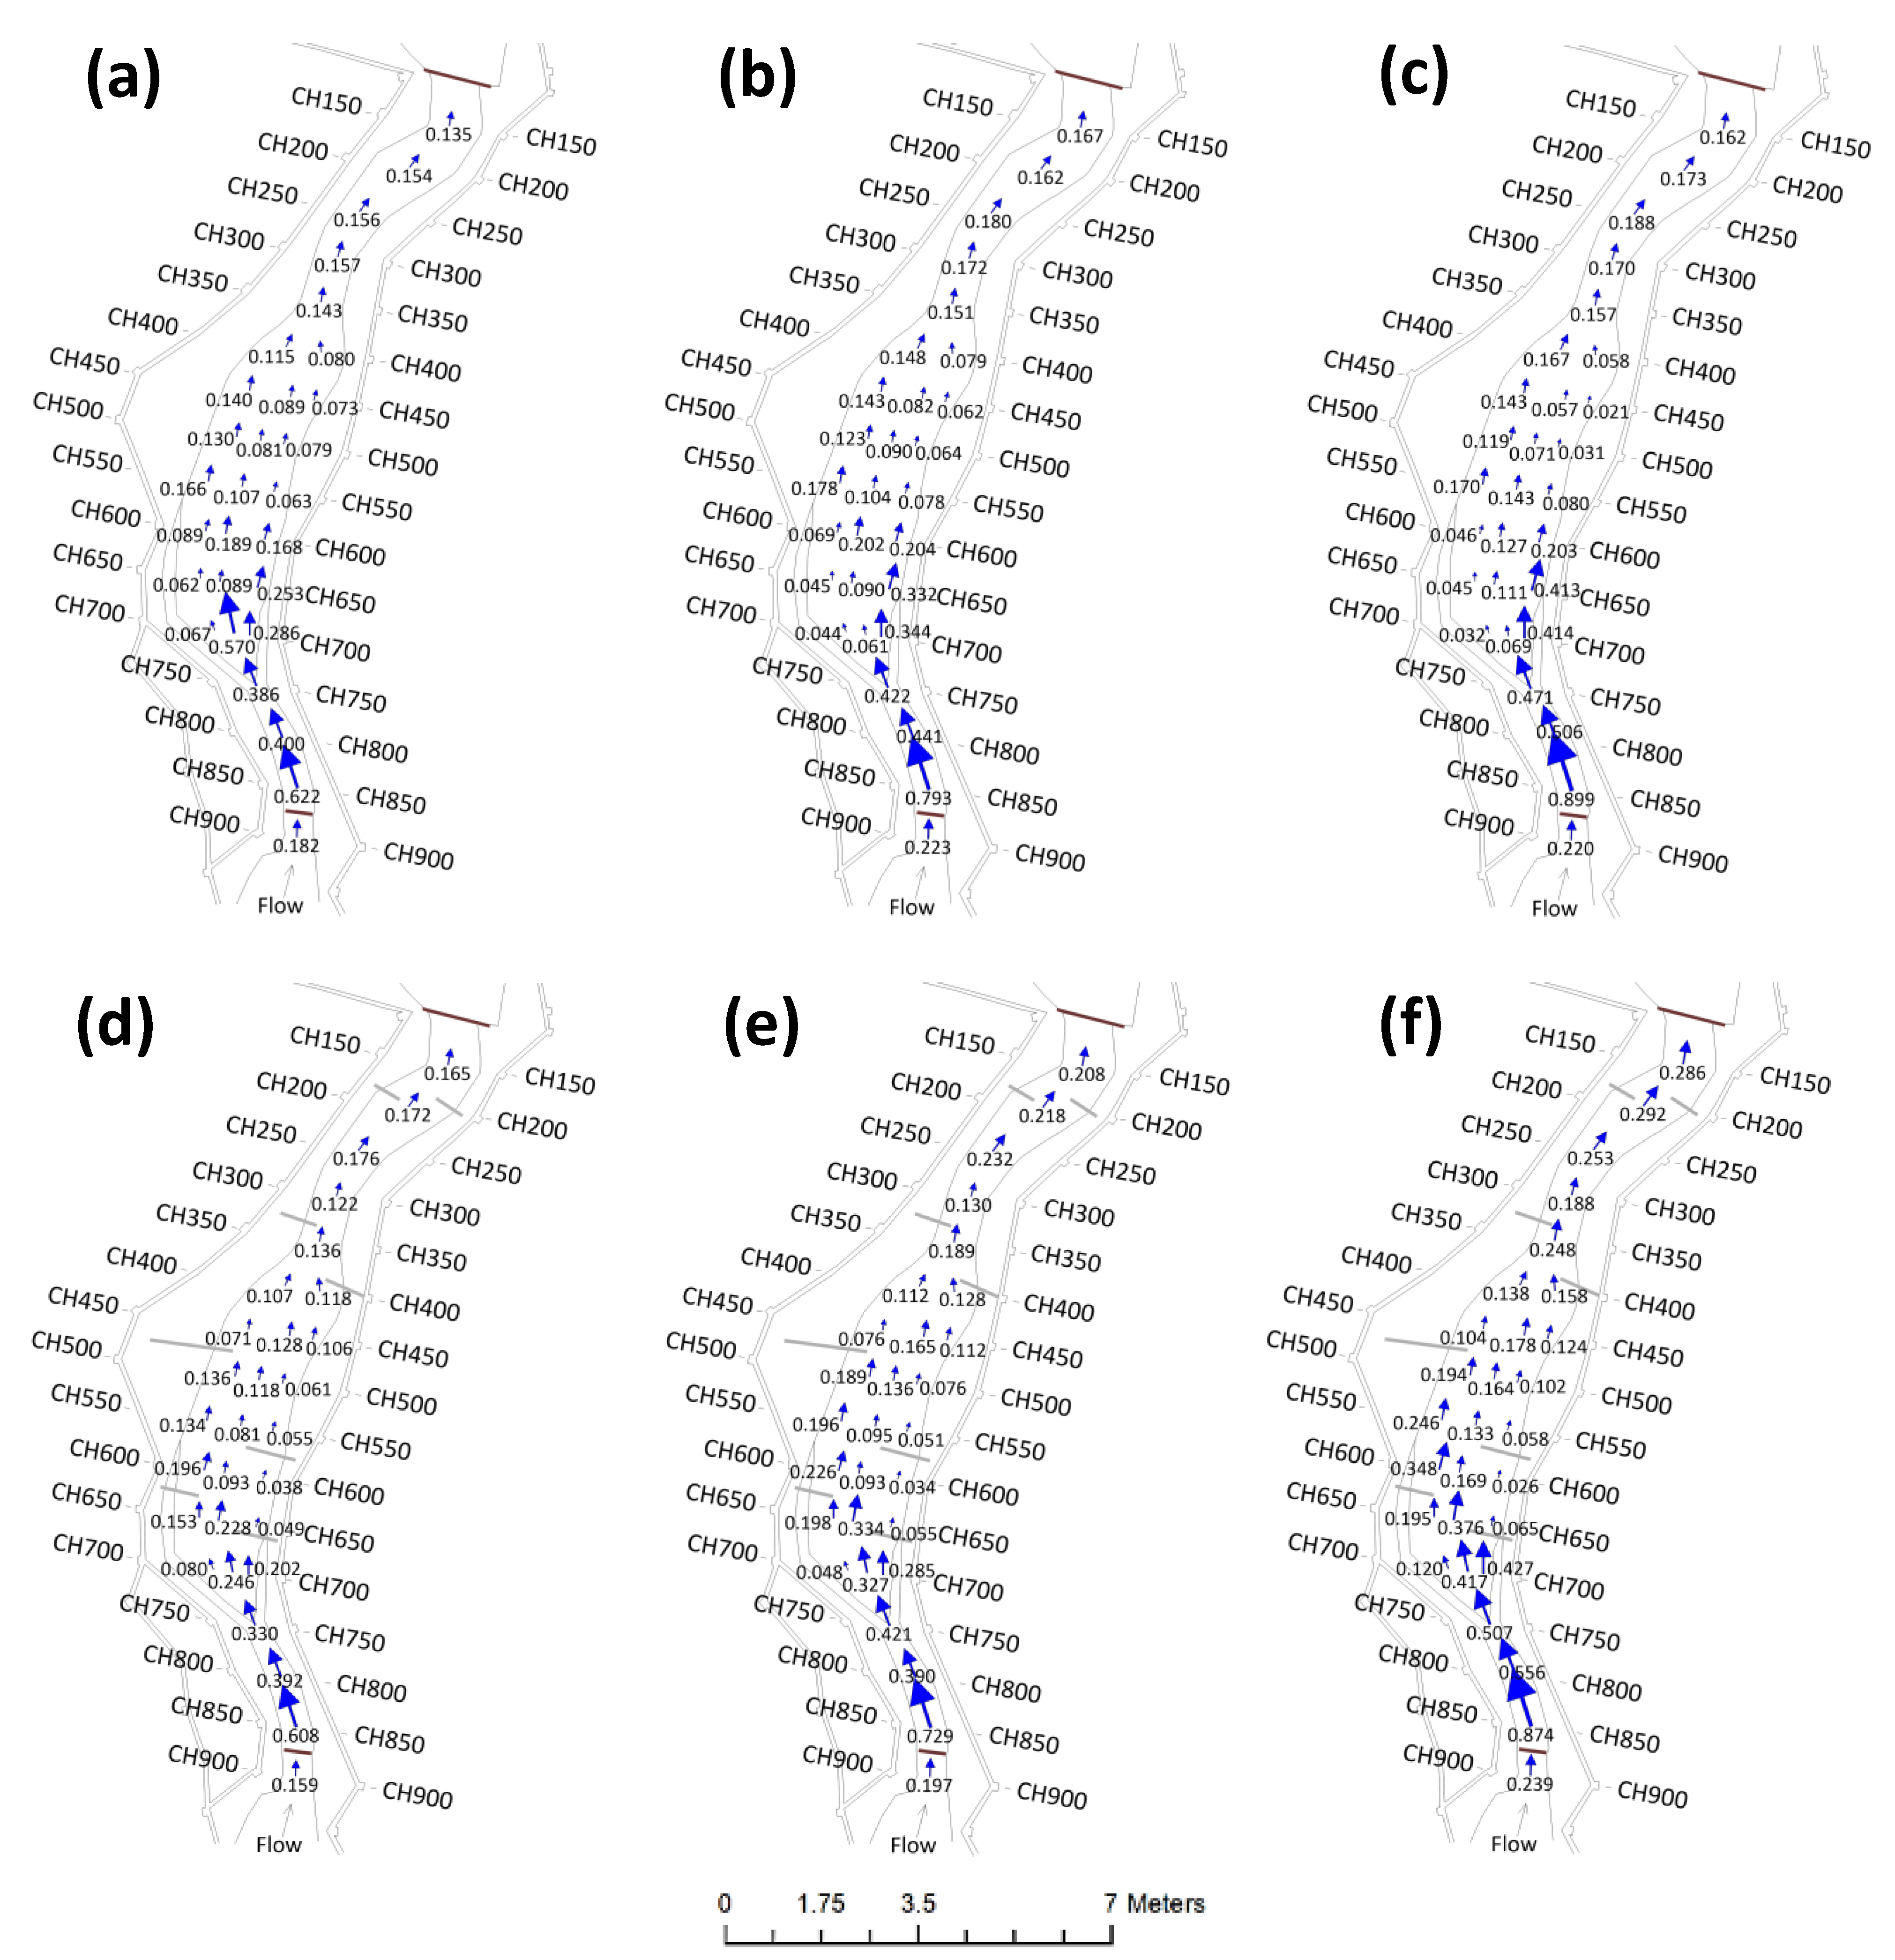
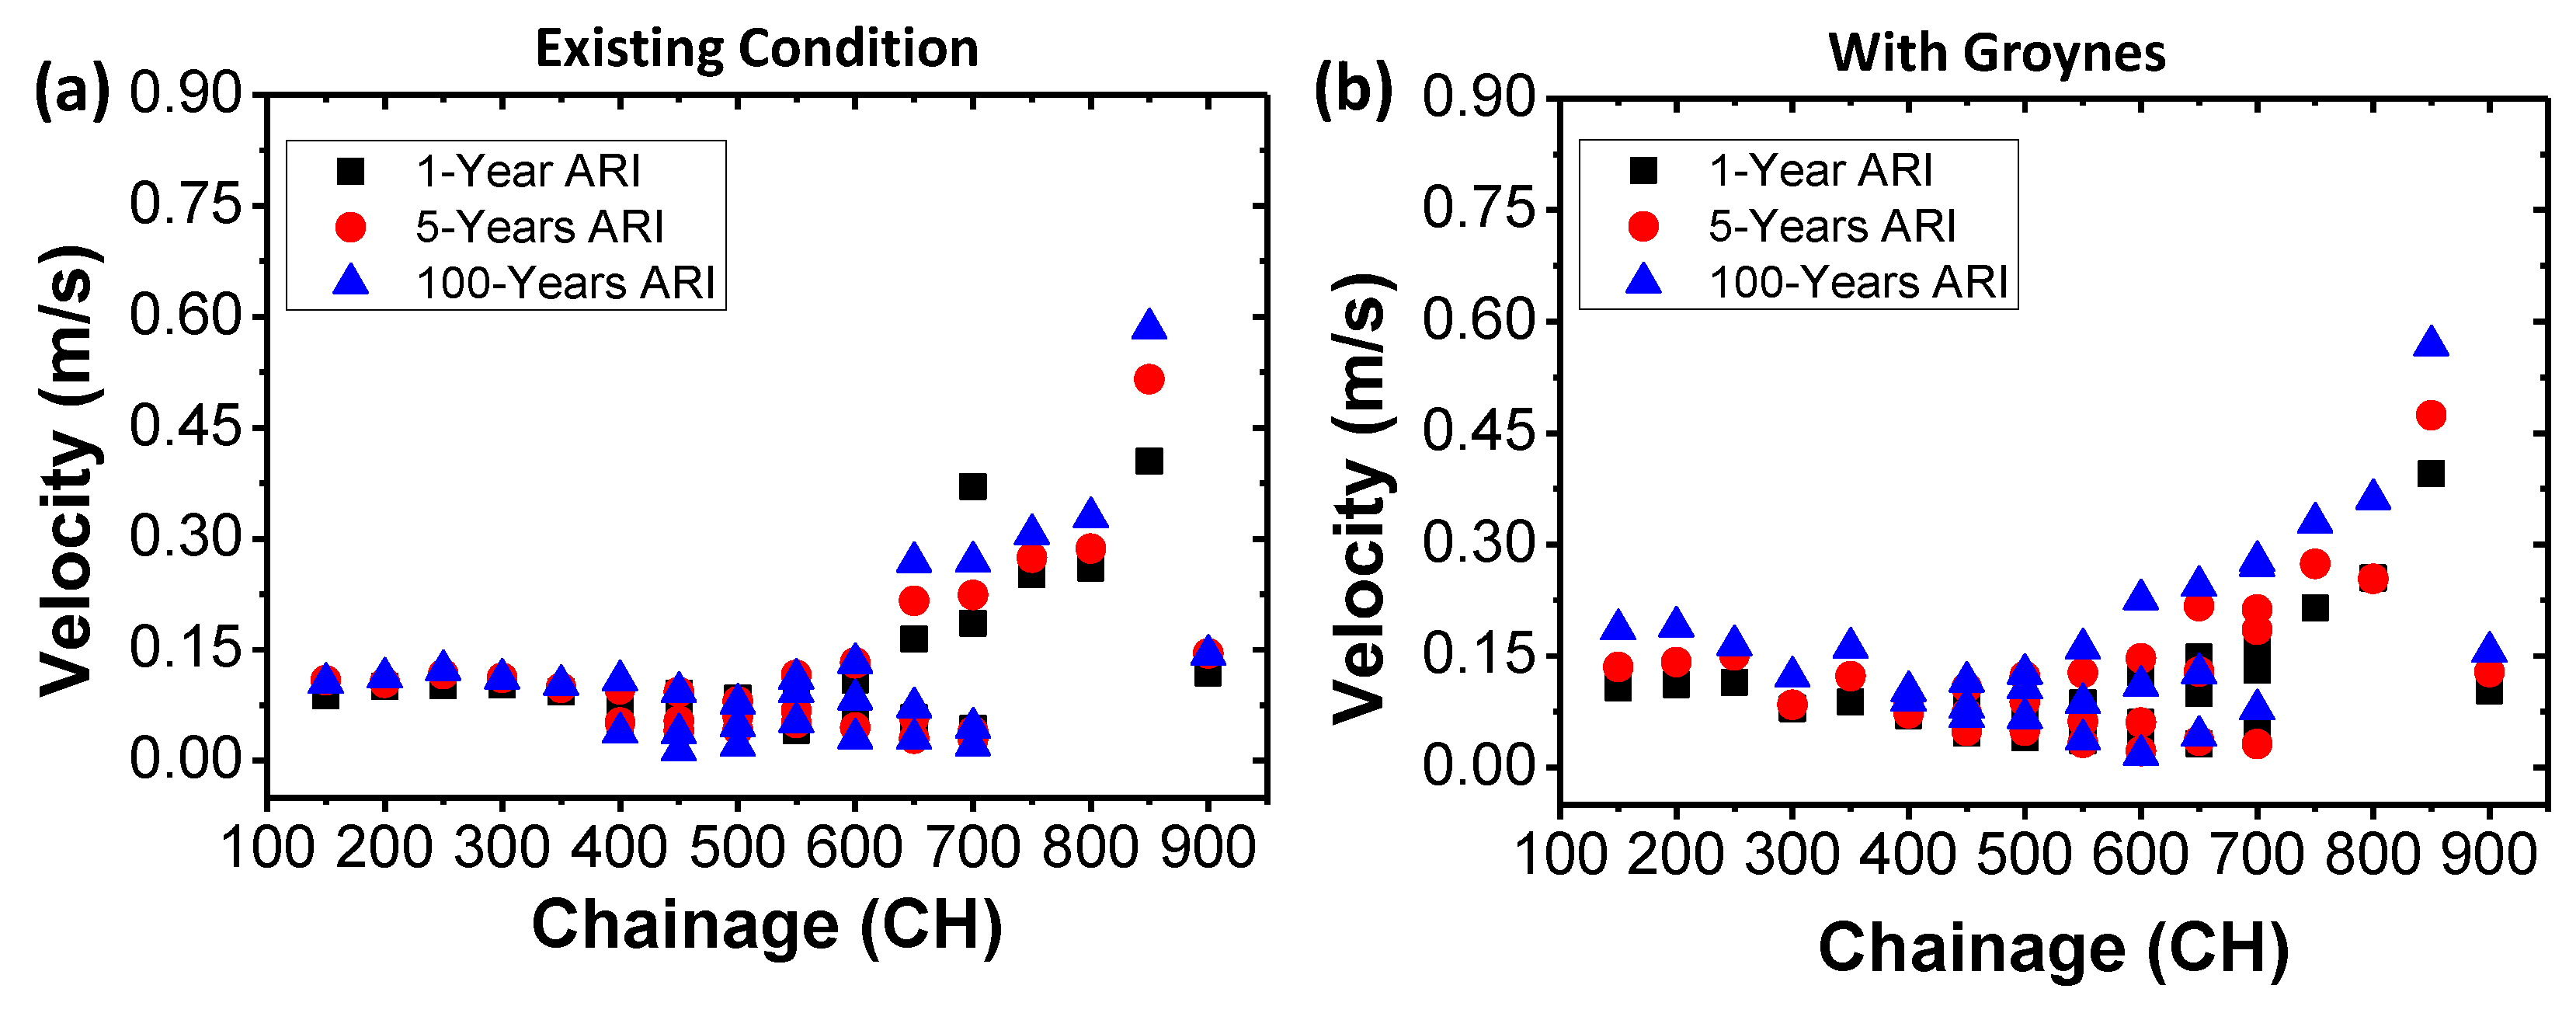
Flow velocity measurements in Habu were plotted as velocity points for the existing and mitigation (groynes). Velocity points are illustrated in Figure 4 for existing conditions and mitigation (groynes), while Figure 5 shows the scatter plot comparisons between different ARIs for both conditions. The original velocity points are used to show the distribution of data points on the model and to demonstrate the accuracy of the gridding methods used for an accurate comparison with the simulation.
Generally, the local velocity in the reservoir or channel varies with its location. The velocity is lower near the boundary (side). It was found that as the flow rate, 𝑄 increased, the velocity also increased for all tests in both existing and mitigation conditions. This indicated that the velocities in the reservoir increased when the water depths and flow rates increased. The summary of flow velocities at Habu for existing and during mitigation (groynes) is summarized in Table 2.
Most of the flow in Habu takes place in the middle of the channel for both existing and mitigation conditions. The highest velocity occurred at CH850, right after the first check dam in Habu for existing and mitigation conditions. The velocity decreases after CH650 downstream in Habu for existing conditions. Meanwhile, the velocity decreases after CH600 downstream in Habu for mitigation conditions. This indicates the influence of groynes to reduce the flow velocity in the area close to their location and focus or concentrate the flow velocity in the middle of the channel [38]. Therefore, the second groyne effectively conveys the flow to the middle of the channel. Based on the experimental results, the flow velocity patterns for all return periods tested are the same; the only difference is the magnitude of the velocity. This can also be observed by the existence of groynes in the channel. Groynes also changes the pattern of the velocity, with lower velocity observed on the side of the channel and higher velocity being more concentrated in the middle of the channel.

3.2. HEC-RAS

3.2.1. Convergence Study

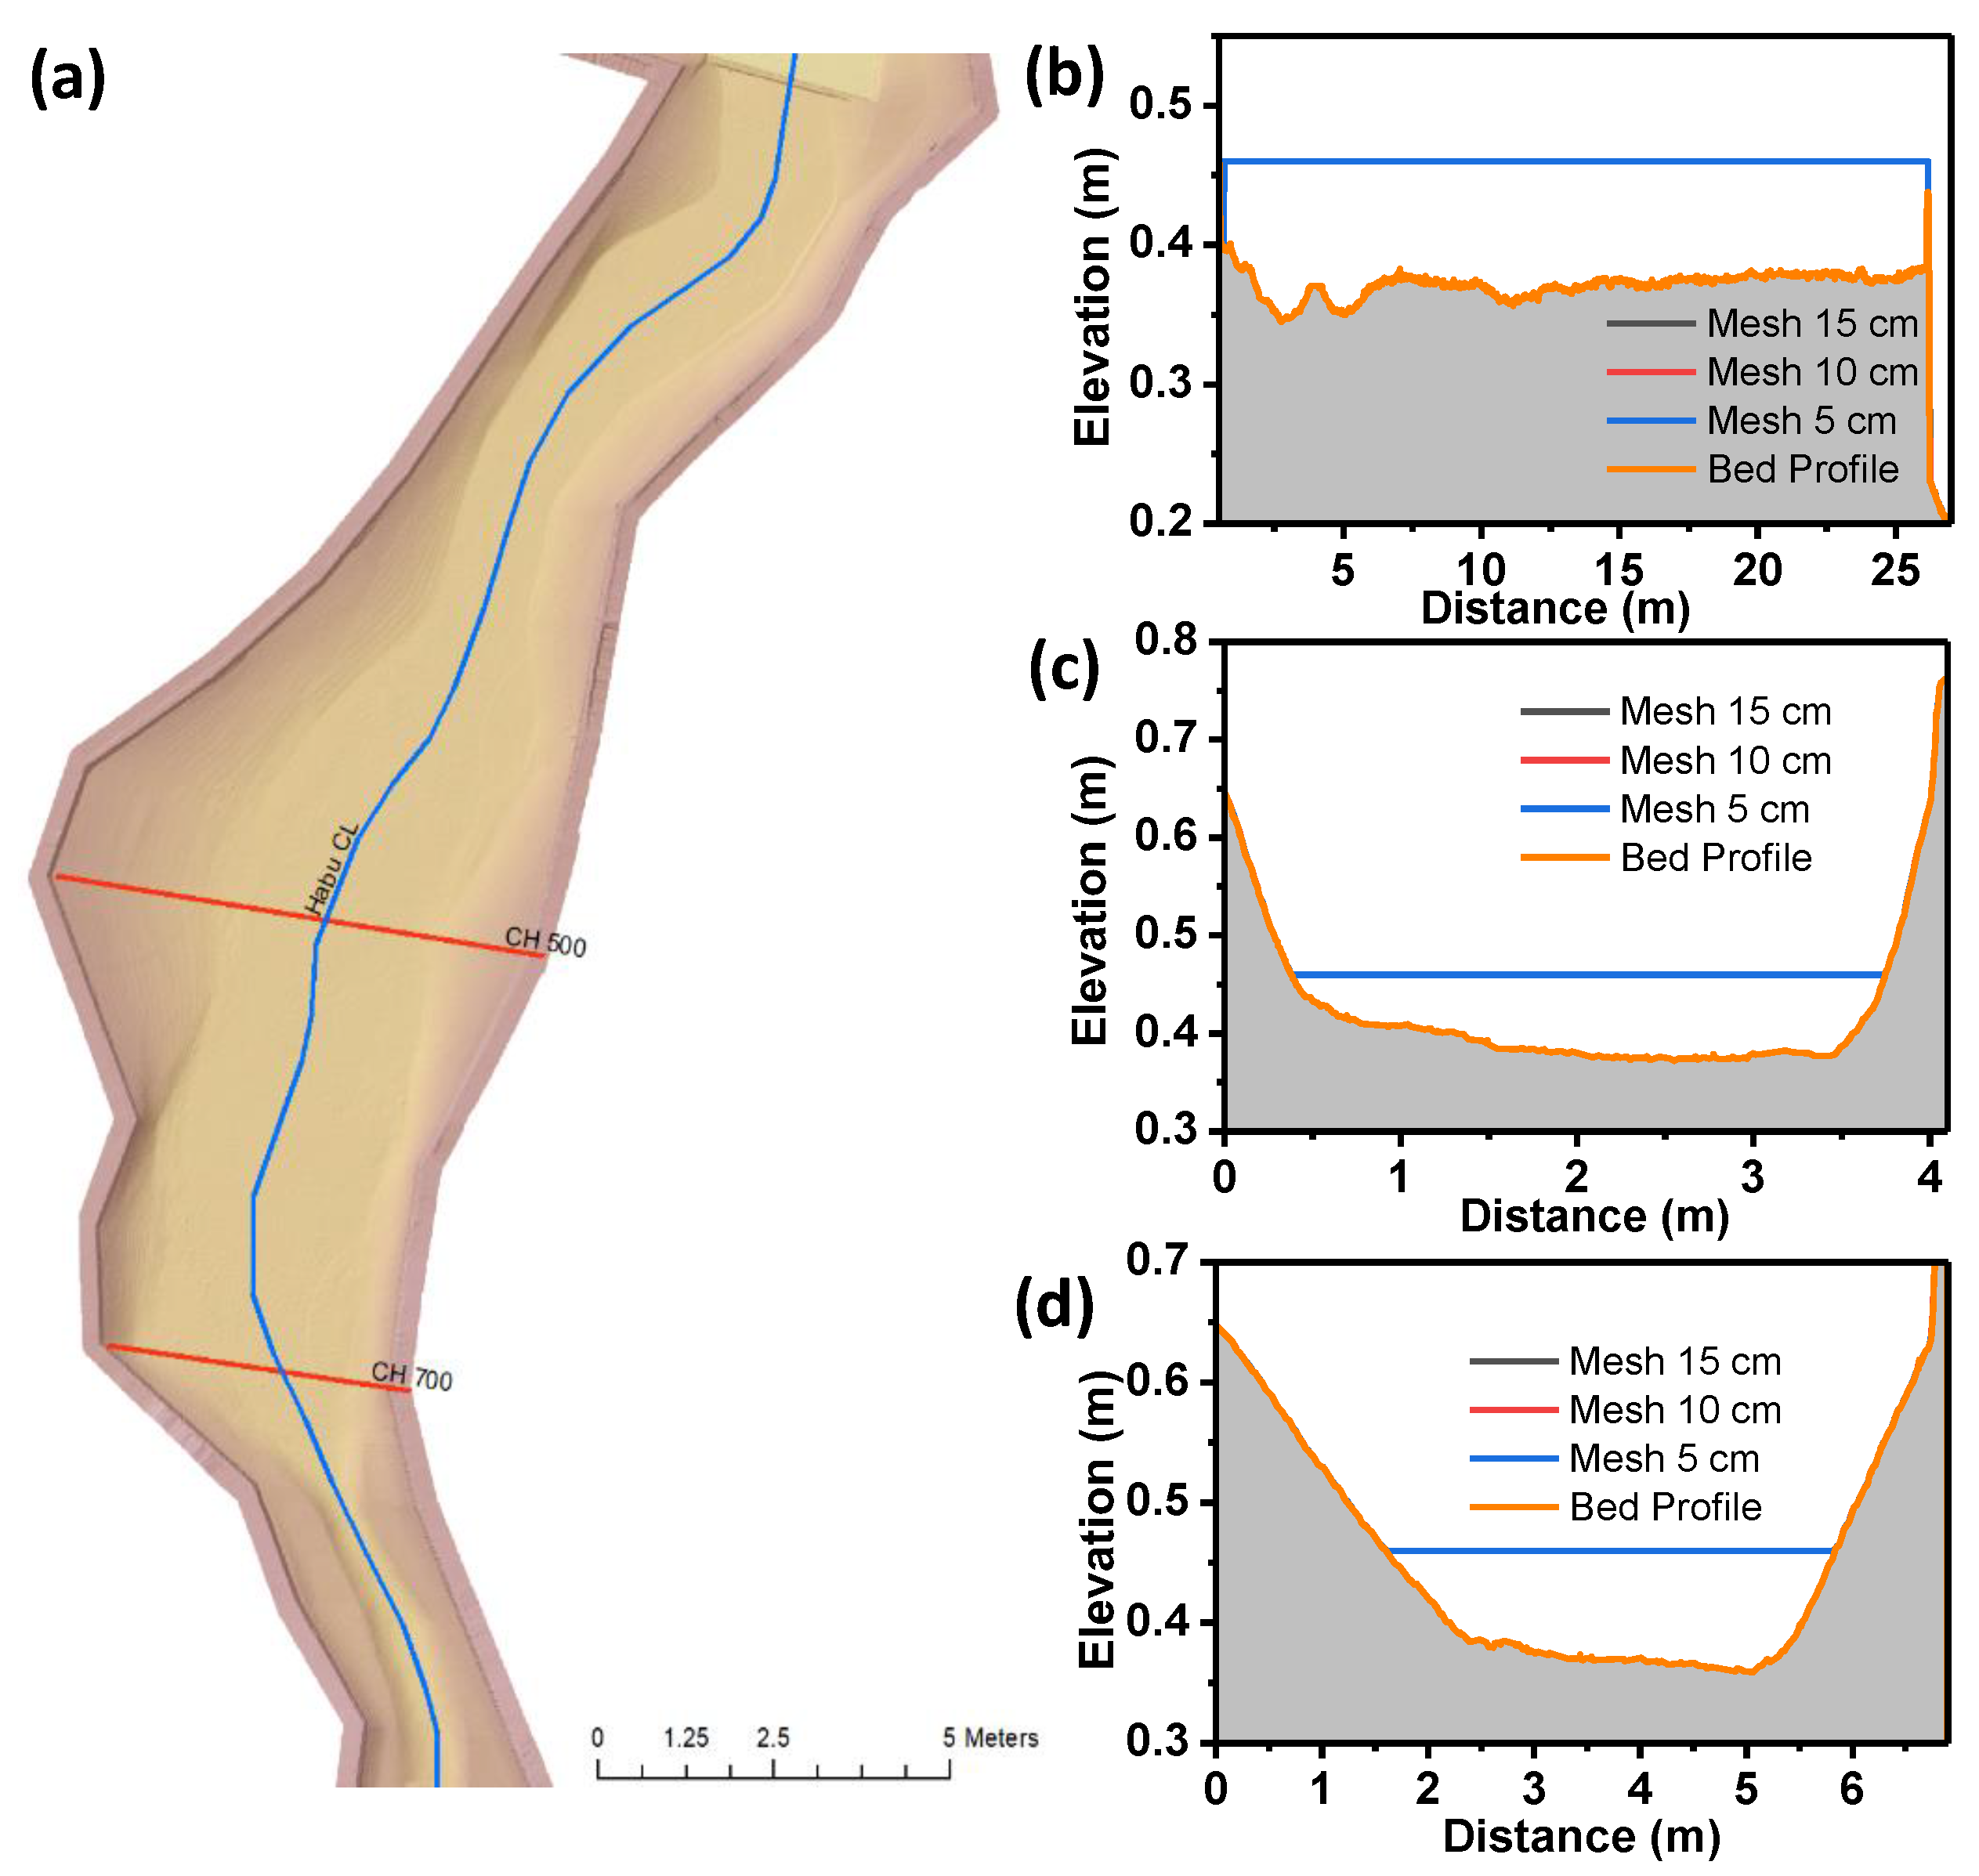
This section discusses the convergence study for simulations with different mesh sizes. The convergence study aims to determine the best mesh size that needs to be used to minimise computational expenses and, at the same time, ensure that the solution is not sensitive to the changes in mesh size (mesh independent solution) [13]. Therefore, a convergence study was carried out for these mesh sizes. Figure 6a–c compares mesh sizes used throughout the simulation.
It should be noted that the solution produced by the DWA might be different from SWE depending on the corresponding Reynold number, with higher values representing turbulence flow. As DWA neglect the nonlinear effect caused by the convective acceleration, the effect of turbulence on the flow cannot be accounted for. For the case considered here, the result is mostly turbulence. The use of SWE is more appropriate and was used for this study. A cross-section at CH500 was chosen for the water surface elevation and velocity evaluation. To simplify the analysis of the result, only the DWA model was considered. Figure 7a shows the cross sections in which the values for the water surface elevation (WSE) and velocity were evaluated. Figure 7b–d shows the plot of WSE along the centre line of Habu for different mesh sizes. From the figure, it is shown that the WSE is almost identical for all mesh cases. From the figure, it can be concluded that even with the coarsest mesh used here (15 cm), HEC-RAS can provide accurate prediction for the WSE.
The velocities along CH700 and CH500 are presented in Figure 8. The result shows that mesh convergence is also achieved for velocity. Although the coarse mesh can provide an equally accurate result, for the simulation that follows, a mesh size of 5 cm was used throughout. It should be noted that the solution produced by the DWA might be different from the SWE depending on the corresponding Reynolds number, with a higher value representing turbulence flow [39]. As DWA ignores the nonlinear effect caused by the convective acceleration, the impact of turbulence on the flow cannot be accounted for. For the case considered here, where the result is mostly turbulence, the use of SWE is more appropriate and was used for this study. The DWA method was adopted just to simplify the comparison of the convergence study.

3.2.2. Model Calibration

Calibration is finding the most appropriate parameter that must be included in the model to produce results representing the physical condition. For hydraulic modelling involving SWE, an important calibration factor that needs to be determined is the Manning coefficient. Manning’s coefficients represent the influence the bottom roughness has on the solution. As the physical model involves a bottom boundary that is relatively smooth, the influence Manning has on the solution might not be that critical. Therefore, two Manning values were used for calibration: 0.0025 for a smooth surface and 0.01 for a slightly rough one. Normal concrete has a roughness of 0.01. A smaller value increases velocity but reduces water surface elevation, while a larger value has the opposite effect. However, since the physical model’s surface is assumed to be uniformly smooth, a single Manning value was used for the entire domain.
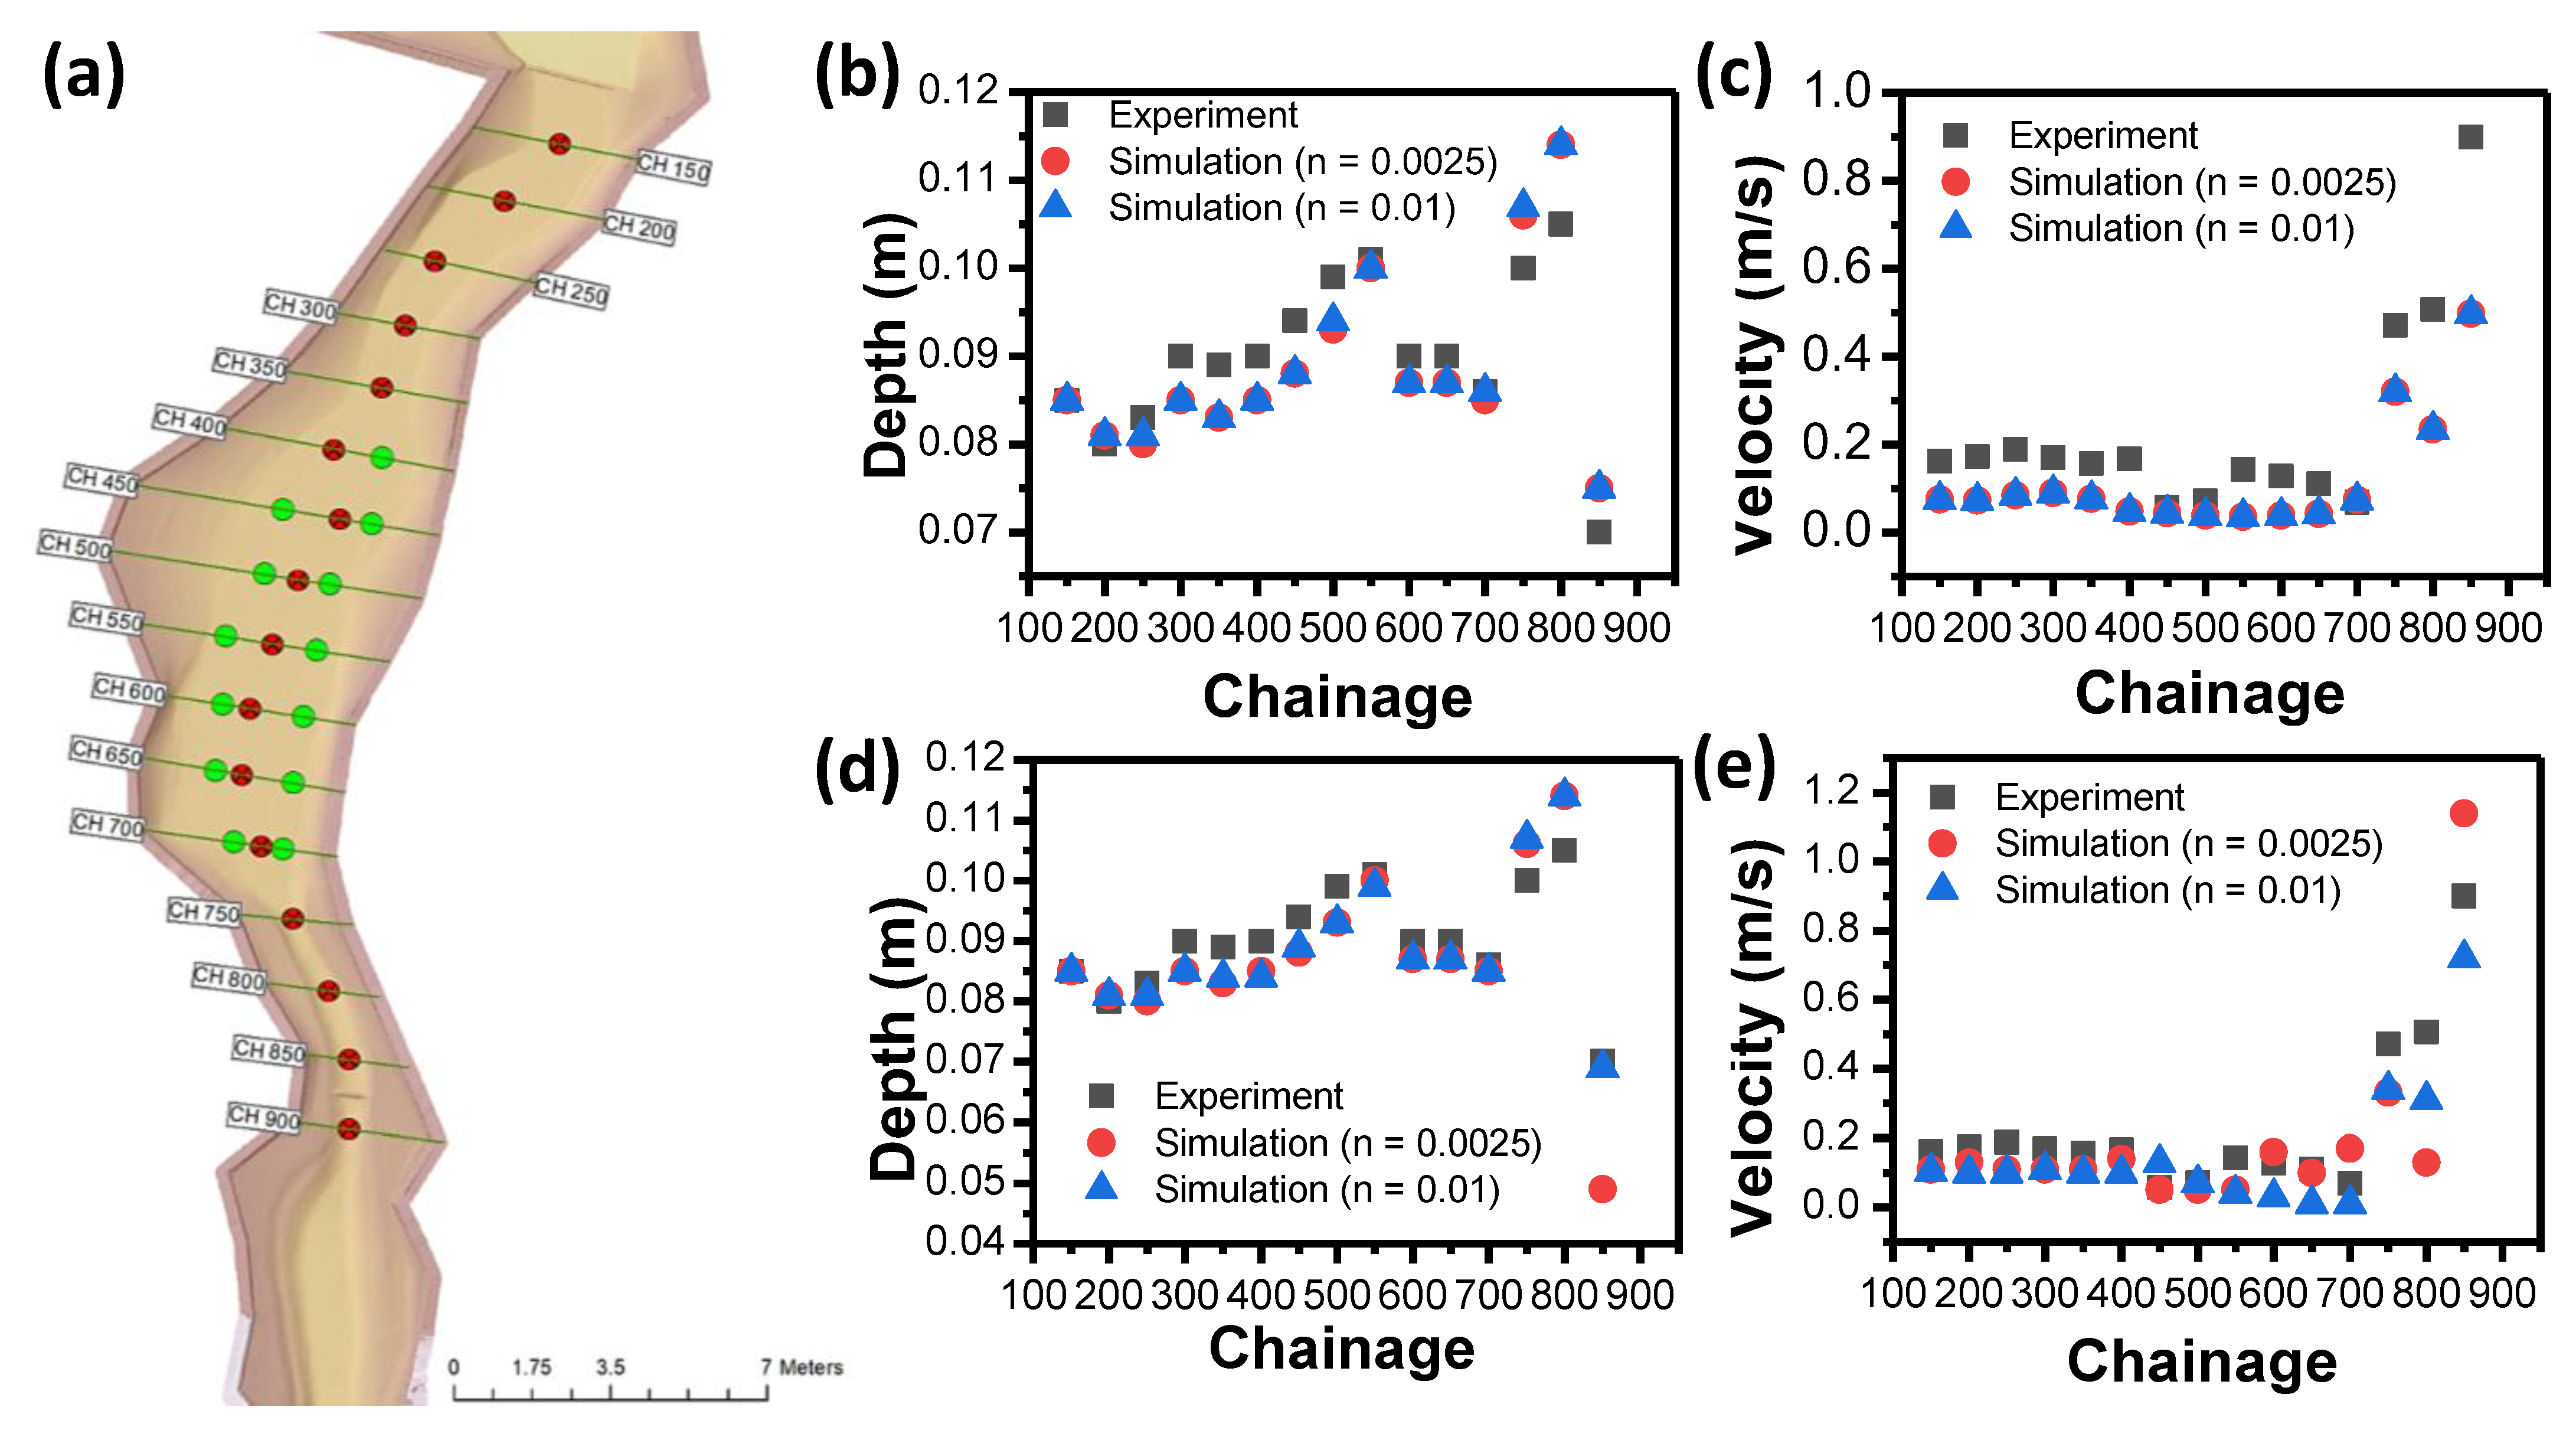
Figure 9a shows the observation points from the experimental work. The point is located along the channel’s CH. The red dots are the points where a comparison between simulation and experimental observation is carried out. To determine the influence of Manning on the result, a comparison is carried out for the water depth and velocity at the observation points. In addition, a comparison was made between DWA and SWE, the former assuming negligible flow acceleration while the latter includes the full nonlinear solution. Please note that the calibration should only be carried out for the 100-year ARI scenario, as this represents the worst-case scenario and provides the largest velocity changes compared to the rest of the scenarios.
Figure 9b,d show the comparison of the water depth between experimental observation and simulation for DWA and SWE, respectively. The plot shows that the water depth can be predicted accurately by both DWA and SWE. A closer inspection shows that SWE provides overall better accuracy than DWA, except for CH850, due to the presence of the check dam where the turbulence and hydraulic jump occurred. The experimental and simulation values differed by 25–65%. The differences between the Manning results were quite small for this comparison. Figure 9c,e compares the velocity at the observation points between experimental and simulation results for DWA and SWE, respectively. For this comparison, much larger differences can be seen. For DWA, the velocity predicted by the simulation model is consistently lower than those obtained from the experiment, with the result from Manning varying slightly. However, for the SWE, the result shows better prediction by the simulation model, with a closer agreement for the Manning value of 0.0025 compared to 0.01. Apart from CH800 and CH850, the Manning value of 0.0025 shows good agreement with the observed data.
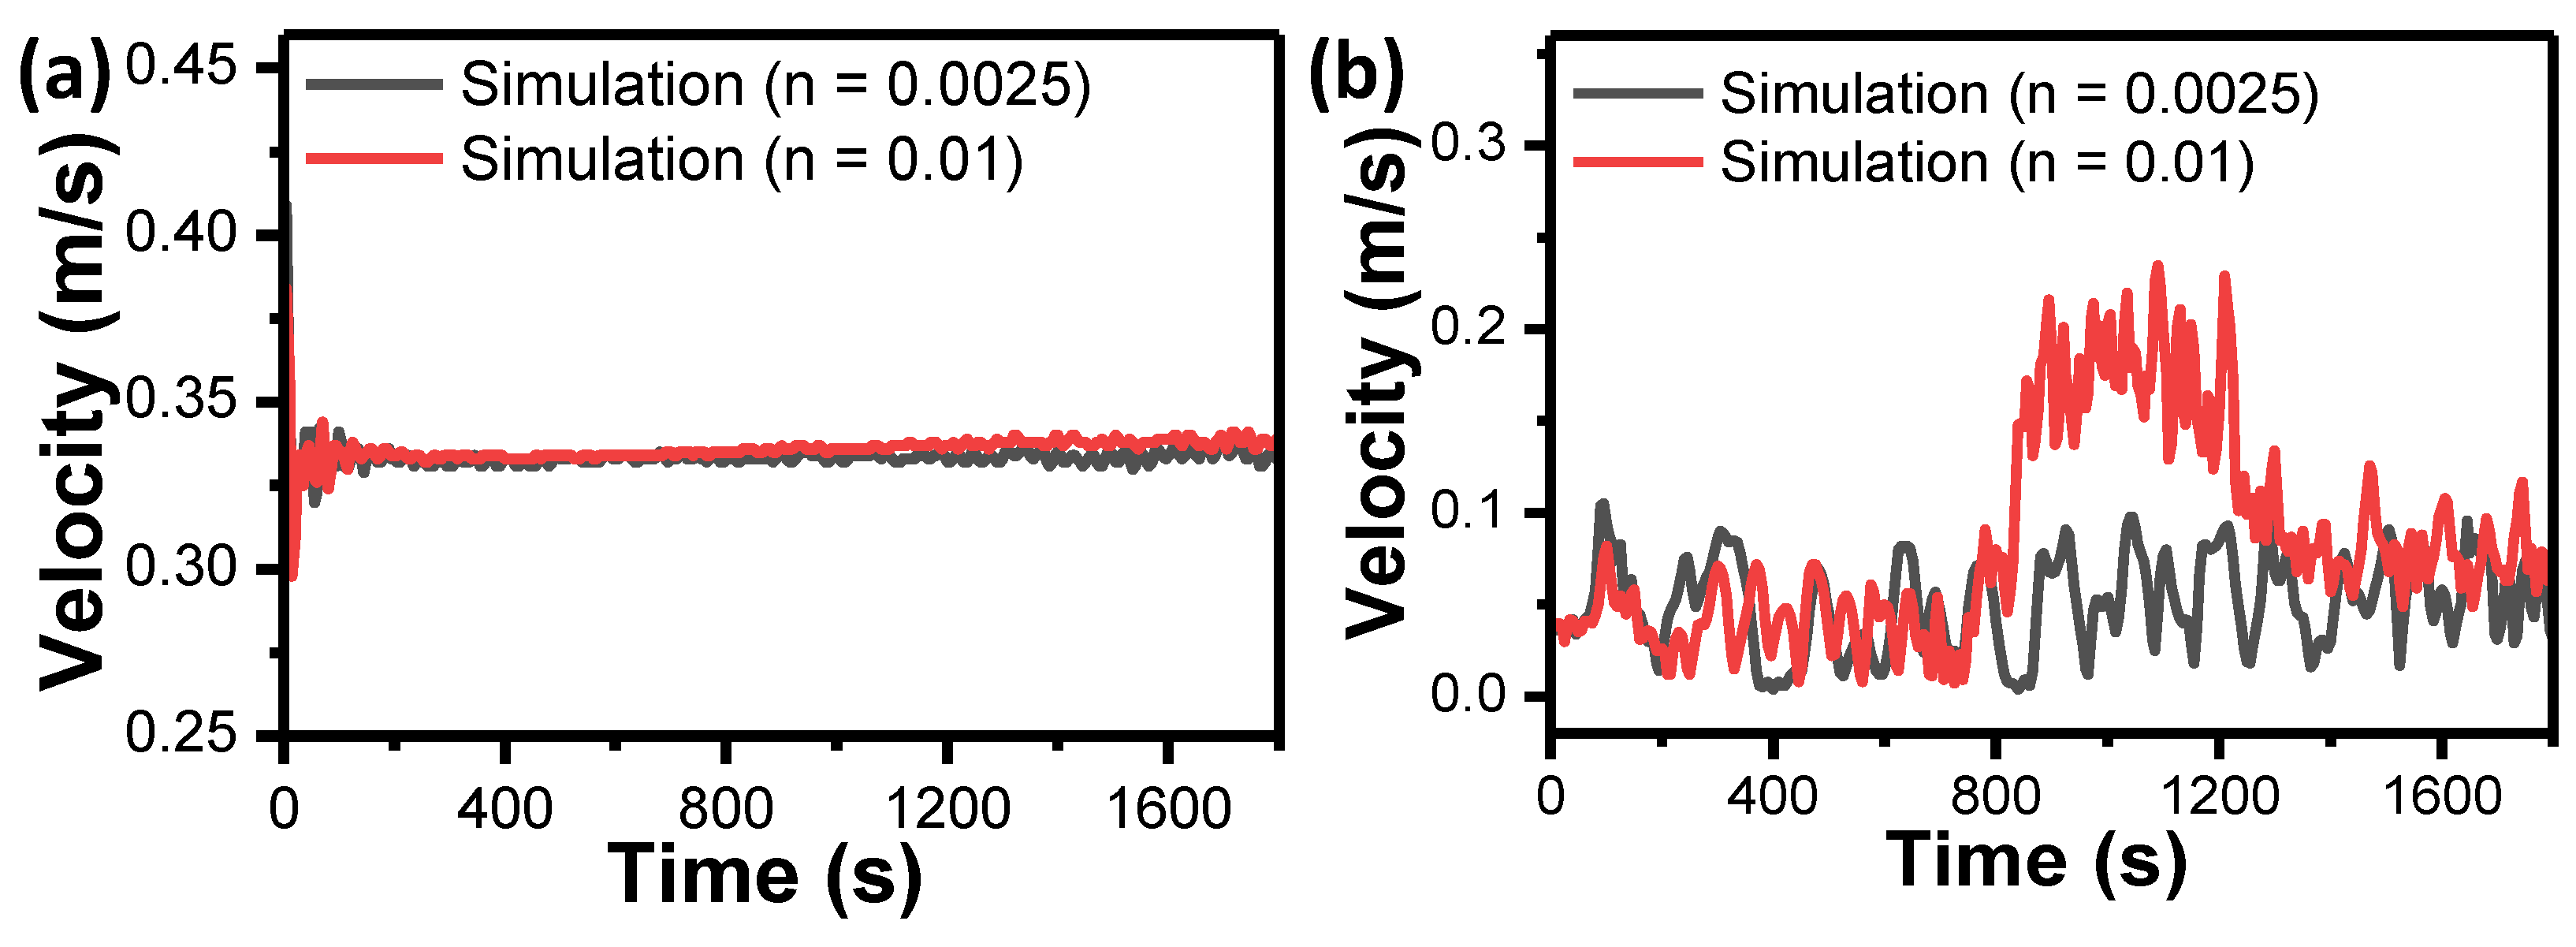
It is important to note that to compare the velocity of the simulated model against the physical model, the velocity for SWE is taken as the average velocity over some time. This is because the simulation does not reach a true steady state globally [40]. The velocity fluctuation is presented in Figure 10a,b. At CH750 in Figure 10a, where the channel is relatively narrow, the flow is predominantly one-dimensional. The velocity at the centre of the channel fluctuates rapidly at the beginning of the simulation but stabilizes over time. However, at CH500, where the channel is wider, the flow becomes two-dimensional, and vortices form as the simulation progresses. As the vortices develop, the velocity taken at the middle of the cross-section fluctuates, as shown in Figure 10b. The velocity fluctuation becomes less pronounced once the vortices are fully formed. To compare with the experimental data, the velocity magnitude is the average over a period during which the vortices have fully formed. The root mean square of velocity fluctuation is small.
A comparison with observation data for the Habu catchment with groynes installed has also been carried out. Figure 11a shows the location of the groynes along the Habu catchment. Figure 11b,c shows the water depth and velocity comparison between the experiment and simulation result at the observation location. The result shows good agreement for the water depth and a slight variation for the velocity. These small variations were due to uncertainties in model parameters. The numerical model relies on specific input parameters, such as friction coefficients or roughness values, which may be uncertain or difficult to estimate accurately and may not perfectly capture the exact physics of the flow in the physical system. However, comparing both chosen Manning values shows a small influence of the value on the hydrodynamics of the flow.

3.3. Simulation

3.3.1. Habu Existing Conditions

This section presents the simulation results and analysis for Habu without the groynes and focuses on the hydrodynamics of the flow. At the start of each simulation, a fixed water level was set for the entire domain. The simulation period for all cases was 30 min. Figure 12a shows a plot of the water surface elevation (WSE) along the Habu centreline. Although the WSE in all cases does not vary significantly along the channel, the corresponding water depth is not constant due to the undulating bathymetry. Figure 12b–d displays the simulated water depth at the end of the simulation for 1-year, 5-years, and 100-years ARI. The figures reveal that the water depth throughout the domain varies significantly at several locations due to variations in the bathymetry. These variations, coupled with differences in the channel width, are expected to lead to a spatially varying velocity distribution.
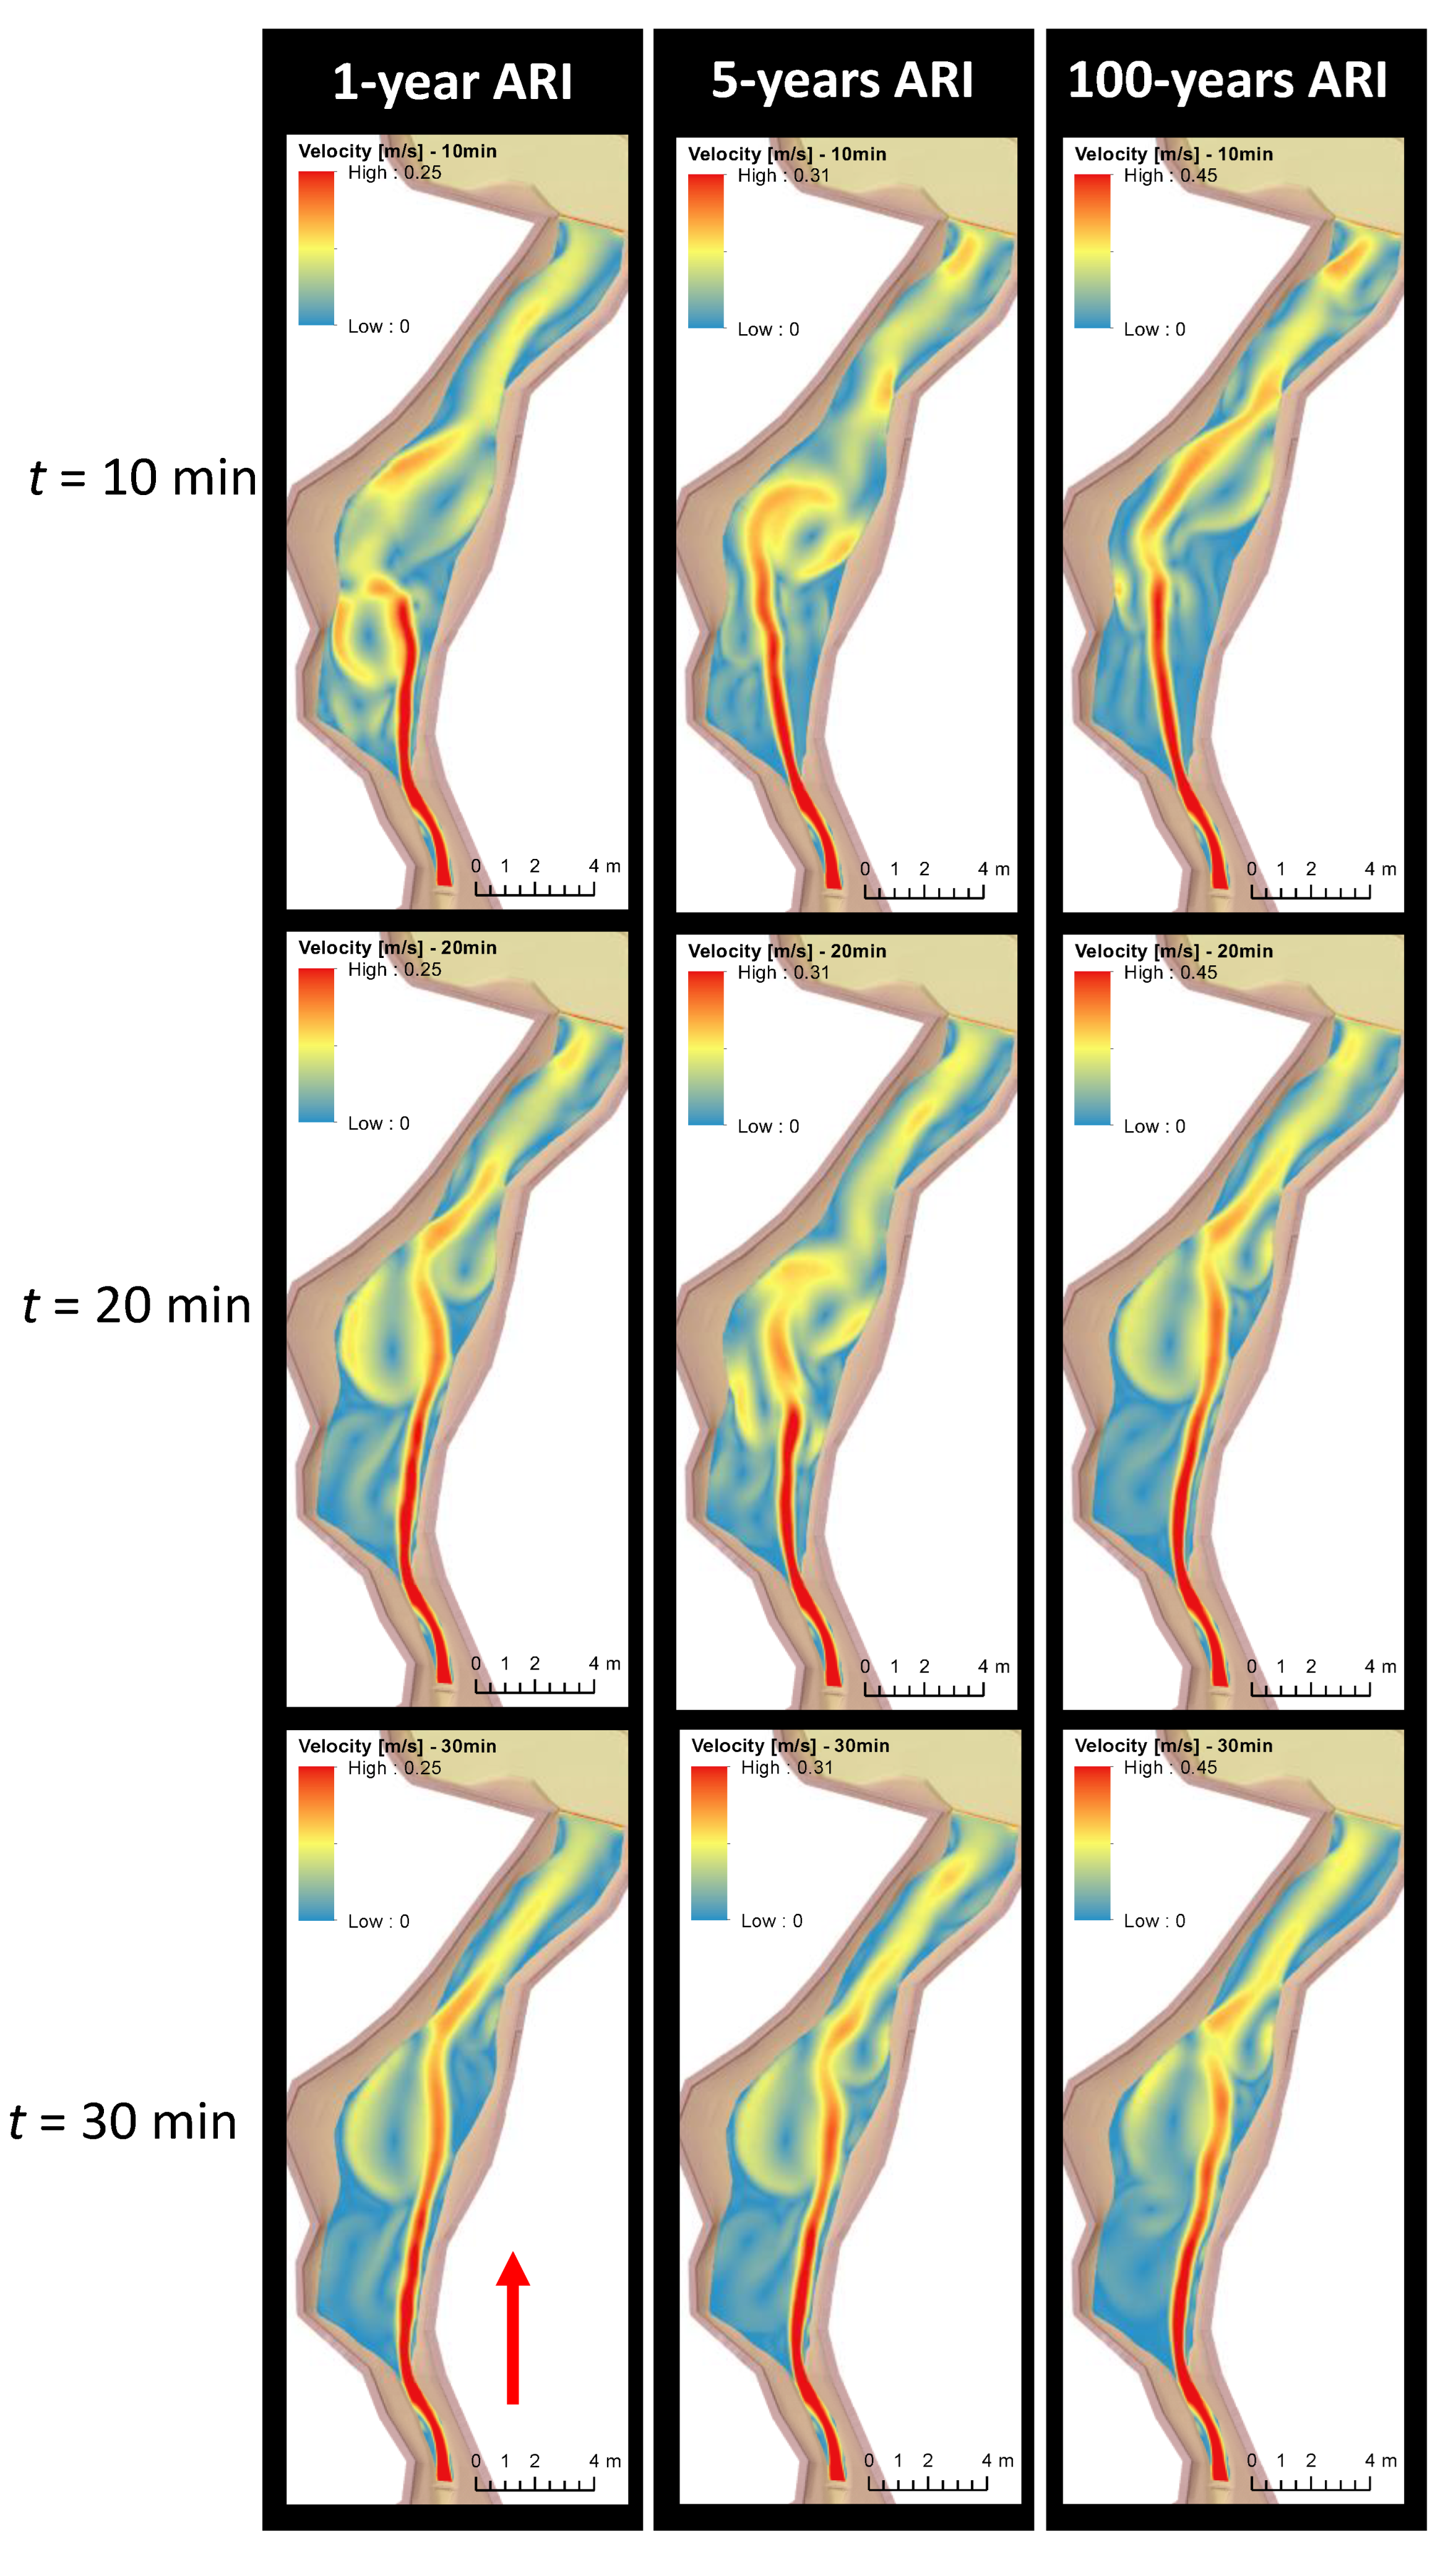
The velocity magnitude for different ARI at time steps of 10 min, 20 min, and 30 min is presented in Figure 13. In all cases, the highest velocity can be observed at the upstream end of the channel. At this upstream part, the channel is narrow, with a very steep bottom. This combination forces the water to flow at a relatively high velocity within this constricted area.
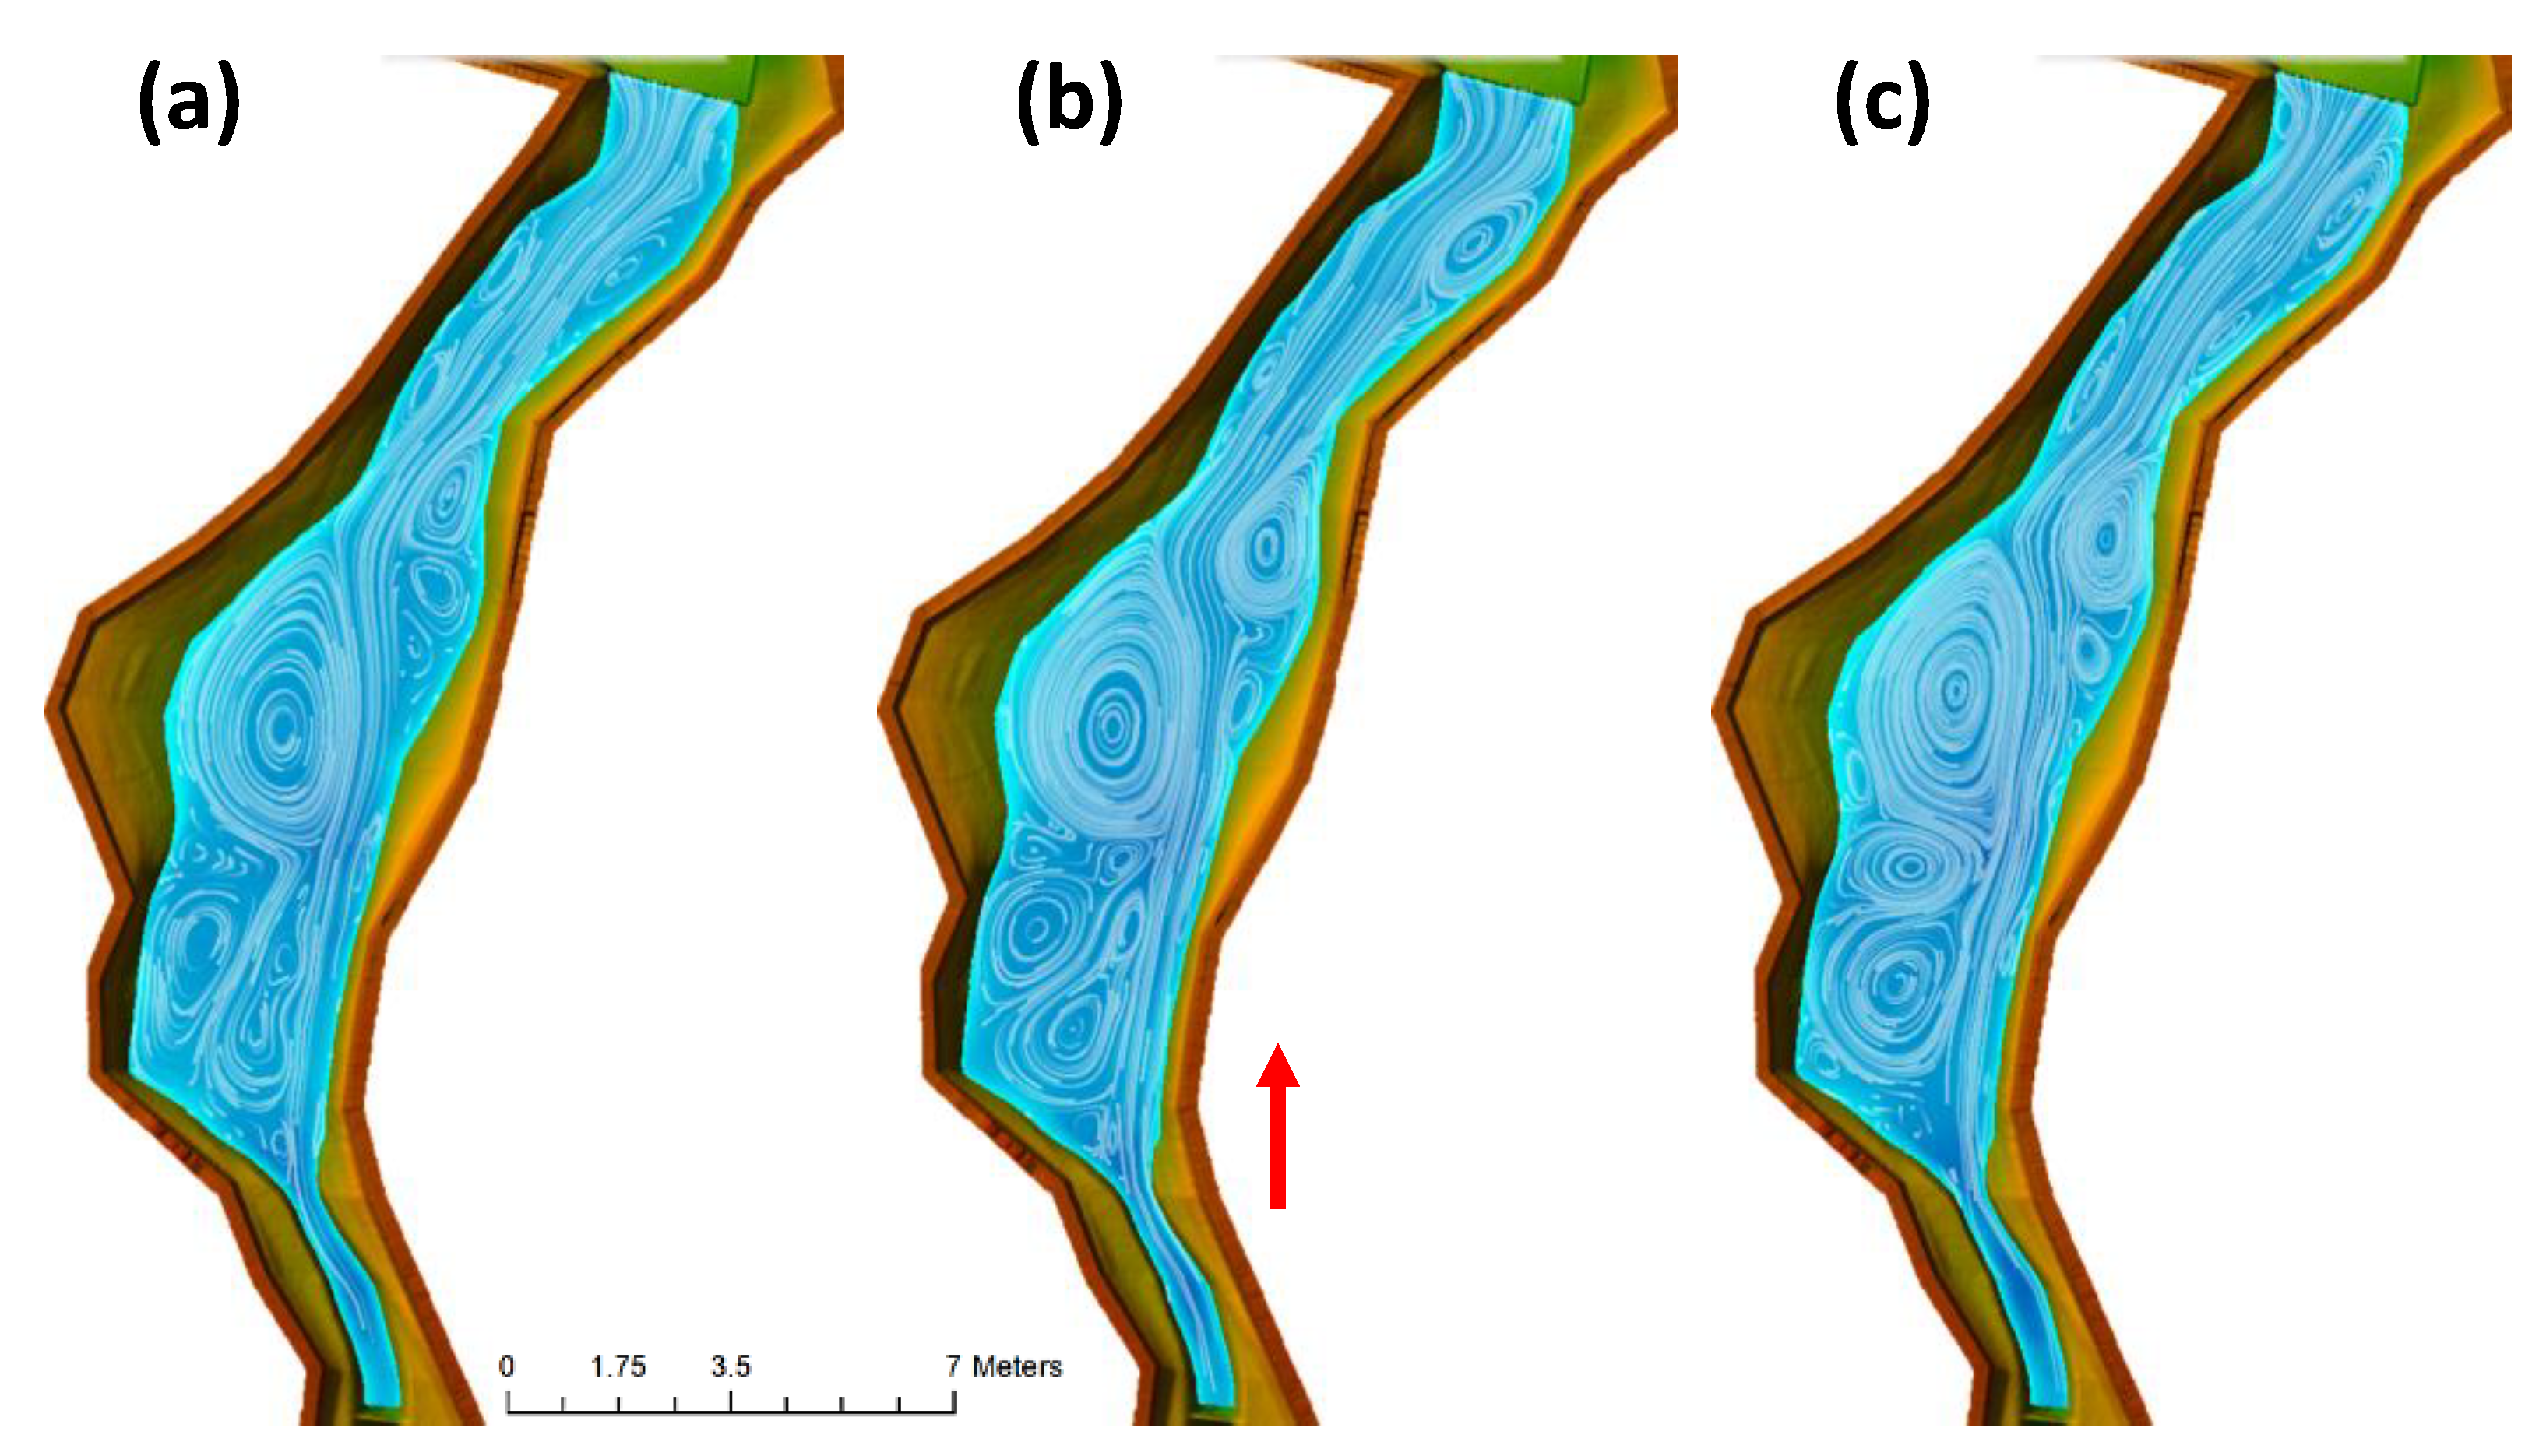
For 100 years of ARI, a comparison with the experiment shows that the simulated velocity is underpredicted. At CH 850, experimental observation recorded a value of around 0.9 m/s, whereas simulation predicted a value of about 0.37 m/s. The differences can be attributed to how the inlet boundary is applied. Due to stability problems at the upstream check dam, where rapid wetting and drying occur, the inlet has been moved to just after the check dam. This reduces the high velocity due to free fall. Unfortunately, a velocity boundary condition cannot be specified in HEC-RAS, as only flow rate is allowed; hence, the velocity at the boundary is calculated from the flow rate. As the water enters a broader part of the channel, the variation of the velocity magnitude becomes increasingly large. Flow recirculation or rollers can be observed as the channel enlarges. The same roller-like flow patterns were observed in the physical model; see Video S1. This was due to a turbulent flow at the inlet area. Turbulence occurs when the flow of water becomes irregular, forming vortices and eddies that cause the water to roll. This rolling motion can also be caused by the irregular surface beneath the water. The velocity reduces in the downstream direction due to a downstream check dam. The particle tracing plots in Figure 14a–c show that the flow is highly unsteady, especially at the start of the simulation. By observing the evolution of the magnitude of the velocity at increasing time steps, one can observe significant changes in the velocity distribution. At time step t = 5 min, the high-velocity region impinges on the left side of the channel. However, as time progresses, this pattern changes. At the next step, t = 20 min onward, the high-velocity region after the expansion changes sides, impinging to the right. This change is caused by the formation of vortices at around CH 450. As the simulation reaches a steady state, the velocity shows an identical pattern for all ARI cases.
Figure 15a–c displays the cross-sectional velocity profiles for CH650, CH500, and CH350. These plots compare the velocity across the chainage at t = 30 min (steady state) for different ARI cases. The distance between banks is measured from left to right when looking downstream. It should be noted that the plots only show the magnitude of the velocity and do not consider its direction. With higher ARI, the inflow increases, resulting in an increase in velocity magnitude for all cases. The velocity profiles at CH650 and CH500 reveal that the right side has a higher velocity than the left. This observed velocity profile may be explained by the eddy that forms on the left side of the channel around CH650 and CH500, as shown in Figure 14. As this eddy forms due to low-velocity flow, a high-pressure region is developed, which pushes the high-velocity flow to the right. At CH350, the eddy forms on the right side and pushes the flow to the right, creating a high-velocity region, as shown in Figure 15c.
The differences in the flow profile across the domain have large implications for sediment transport dynamics. The movement of sediment is highly dependent on the hydrodynamics of the flow. For example, the formation of vortices can entrain sediment and force it to settle.

3.3.2. Habu with Groynes Installed

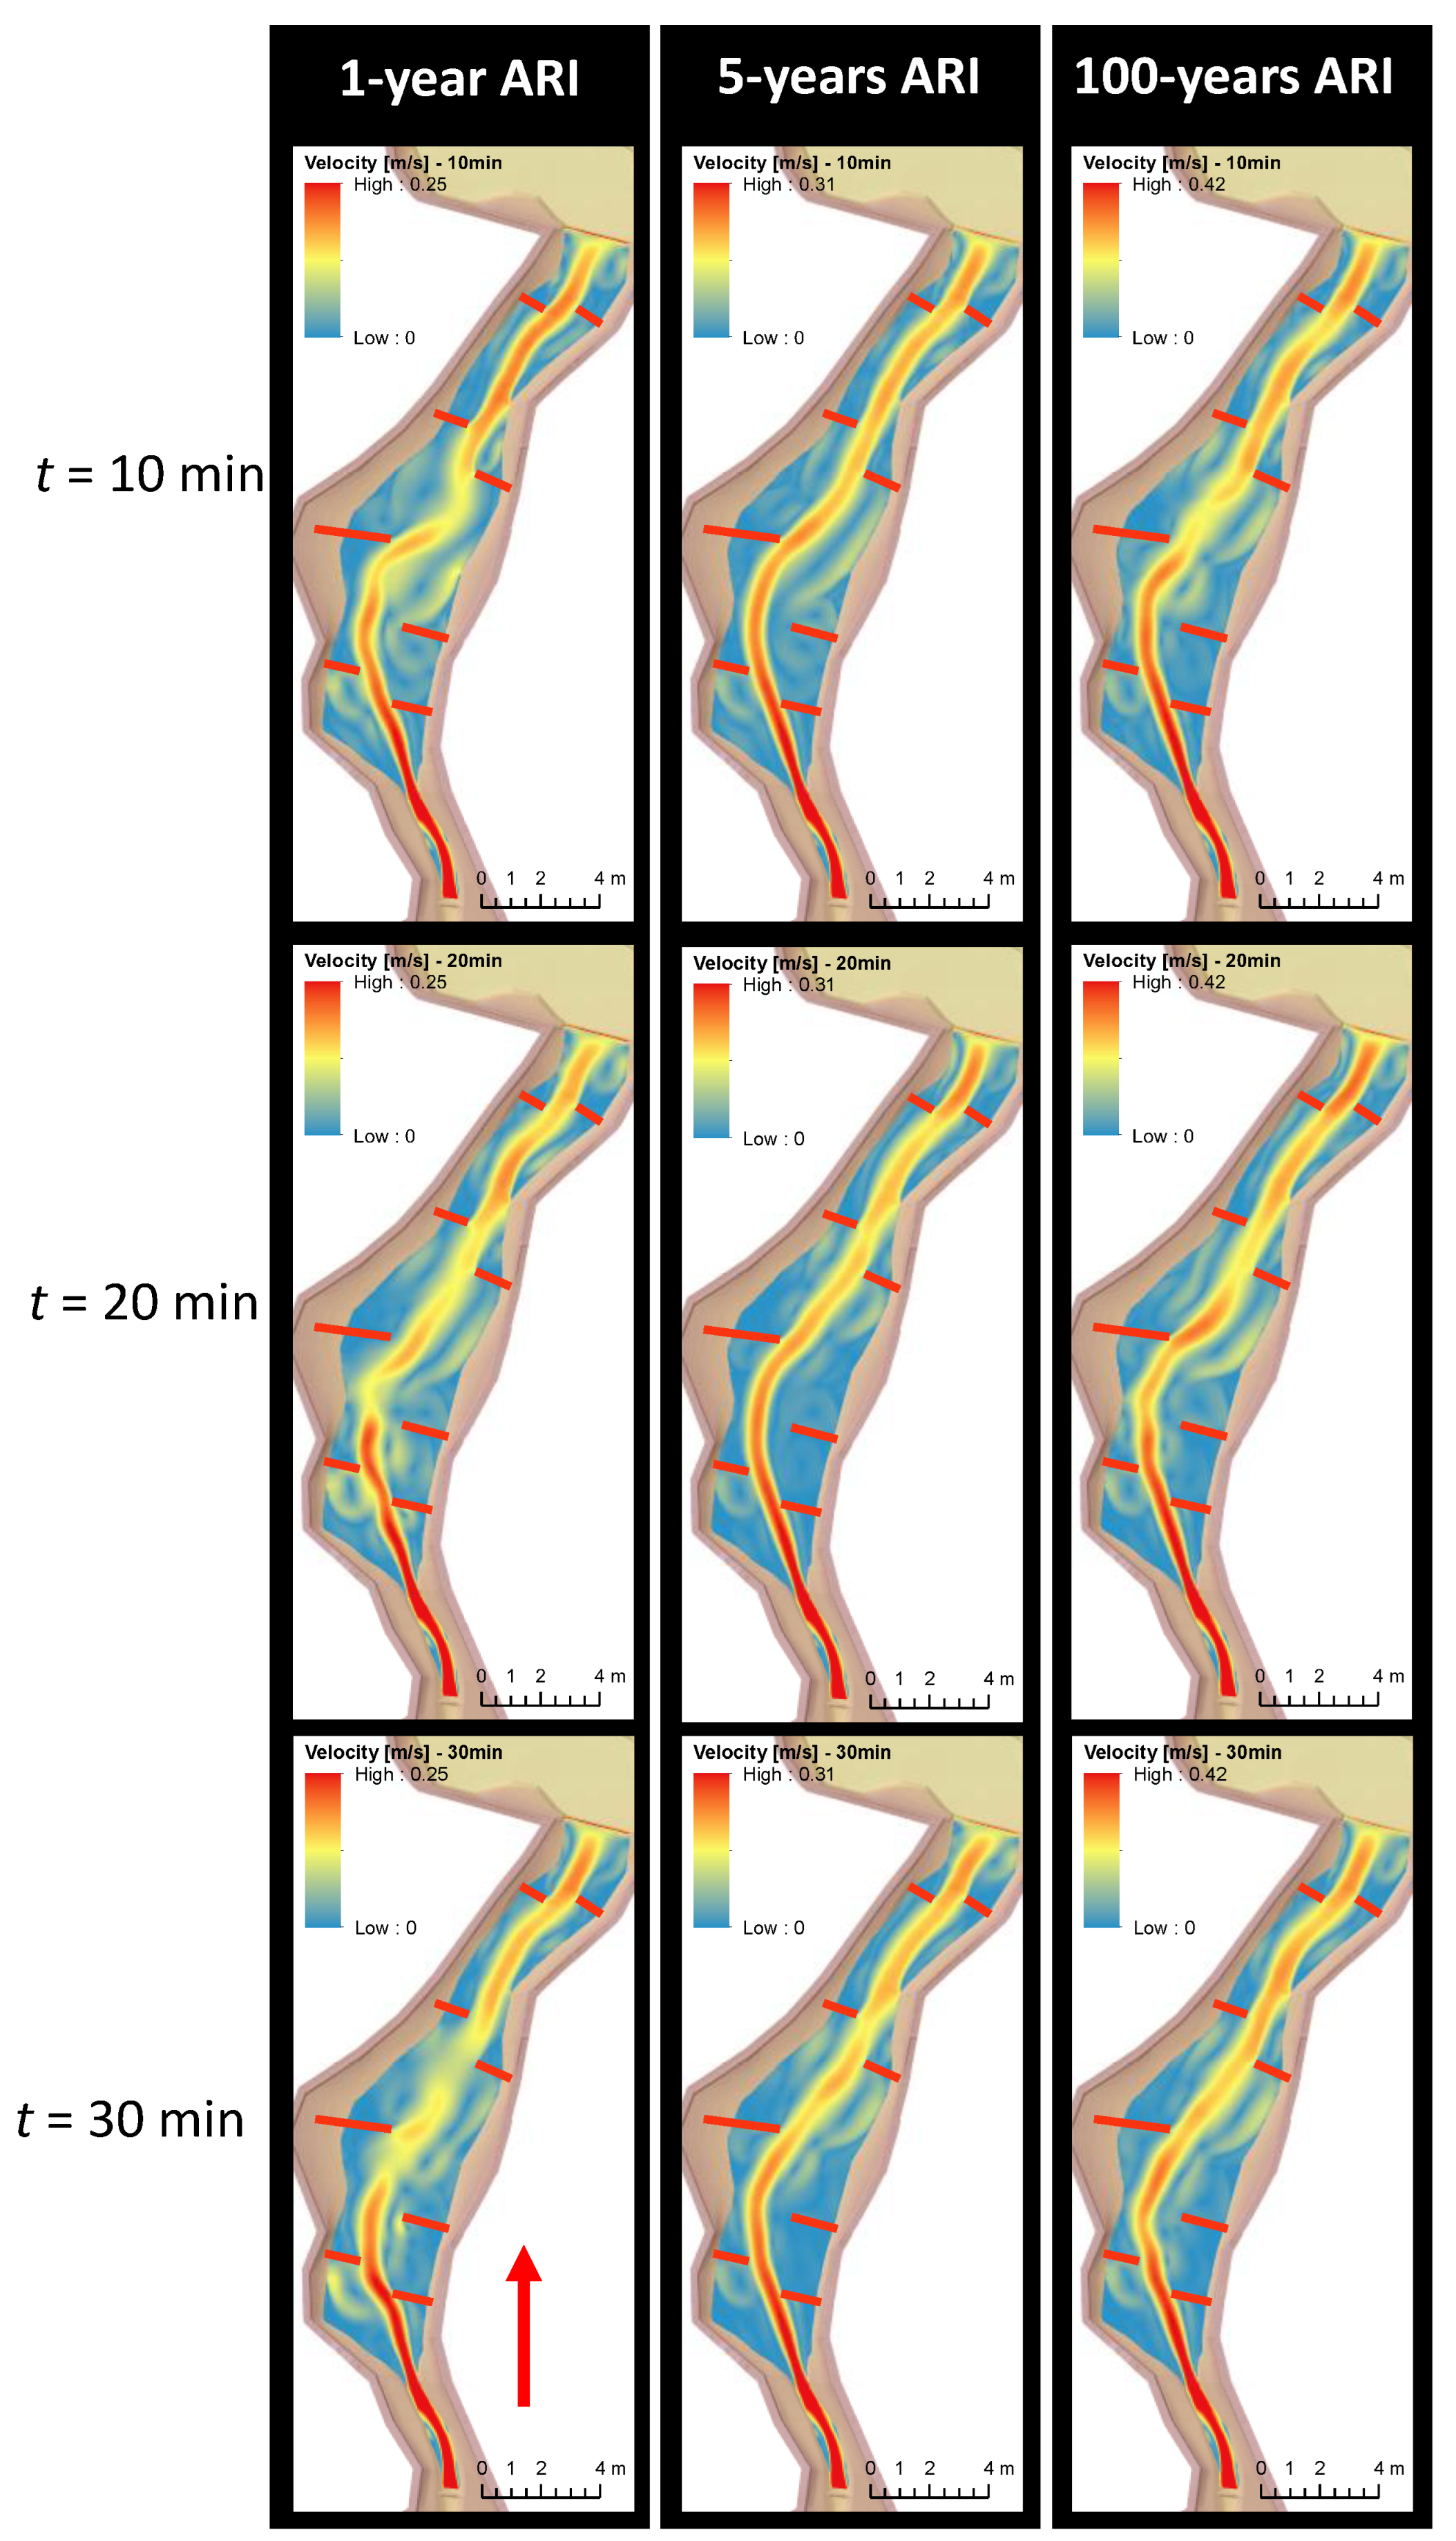
This section presents the results and analysis of the simulation of different ARI events with groynes installed. Figure 16a–c shows the plot of water depth at the end of the simulation for all cases. Despite the presence of the groynes, no appreciable difference in the water depth can be observed compared to the existing condition. With the installation of the groynes, the “unsteadiness” of the flow pattern has somehow been suppressed.
This is evidenced by the velocity magnitude plot at time t = 10 min, t = 20 min, and t = 30 min, given in Figure 17. The plot shows almost identical patterns for all cases and time steps. High-magnitude velocities can be observed to flow at the centreline of the channel. In addition, vortices can be observed forming on the front side of the groynes (looking downstream). These vortices have a lower velocity than the main flow and could be significant in trapping sediment. The number of vortices has also increased as compared to the existing condition.
The particle tracing plot in Figure 18 shows the dominant flow pattern and the vortices generated. The effect of groynes on the flow pattern and hydrodynamics of water can vary depending on the groynes’ size, shape, and placement. When water flows towards the groyne, it is forced to slow down and divert around the structure. This creates eddies and vortices on the downstream side of the groyne, resulting in areas of slower-moving water that will lead to sediment deposition. On the upstream side of the groyne, water accelerates and creates faster-moving currents. This can cause erosion at the base of the groyne and create a scour hole. The placement of groynes can also affect the flow pattern and hydrodynamics of water. Too many groynes placed too closely together can disrupt the natural flow of water and create potential stagnant areas, e.g., around the CH600, while too few groynes can lead to increased erosion, e.g., in the area between the CH600 and the CH400. The optimal placement and number of groynes to minimise the impact on the flow pattern and hydrodynamics must be determined to mitigate erosion effectively.
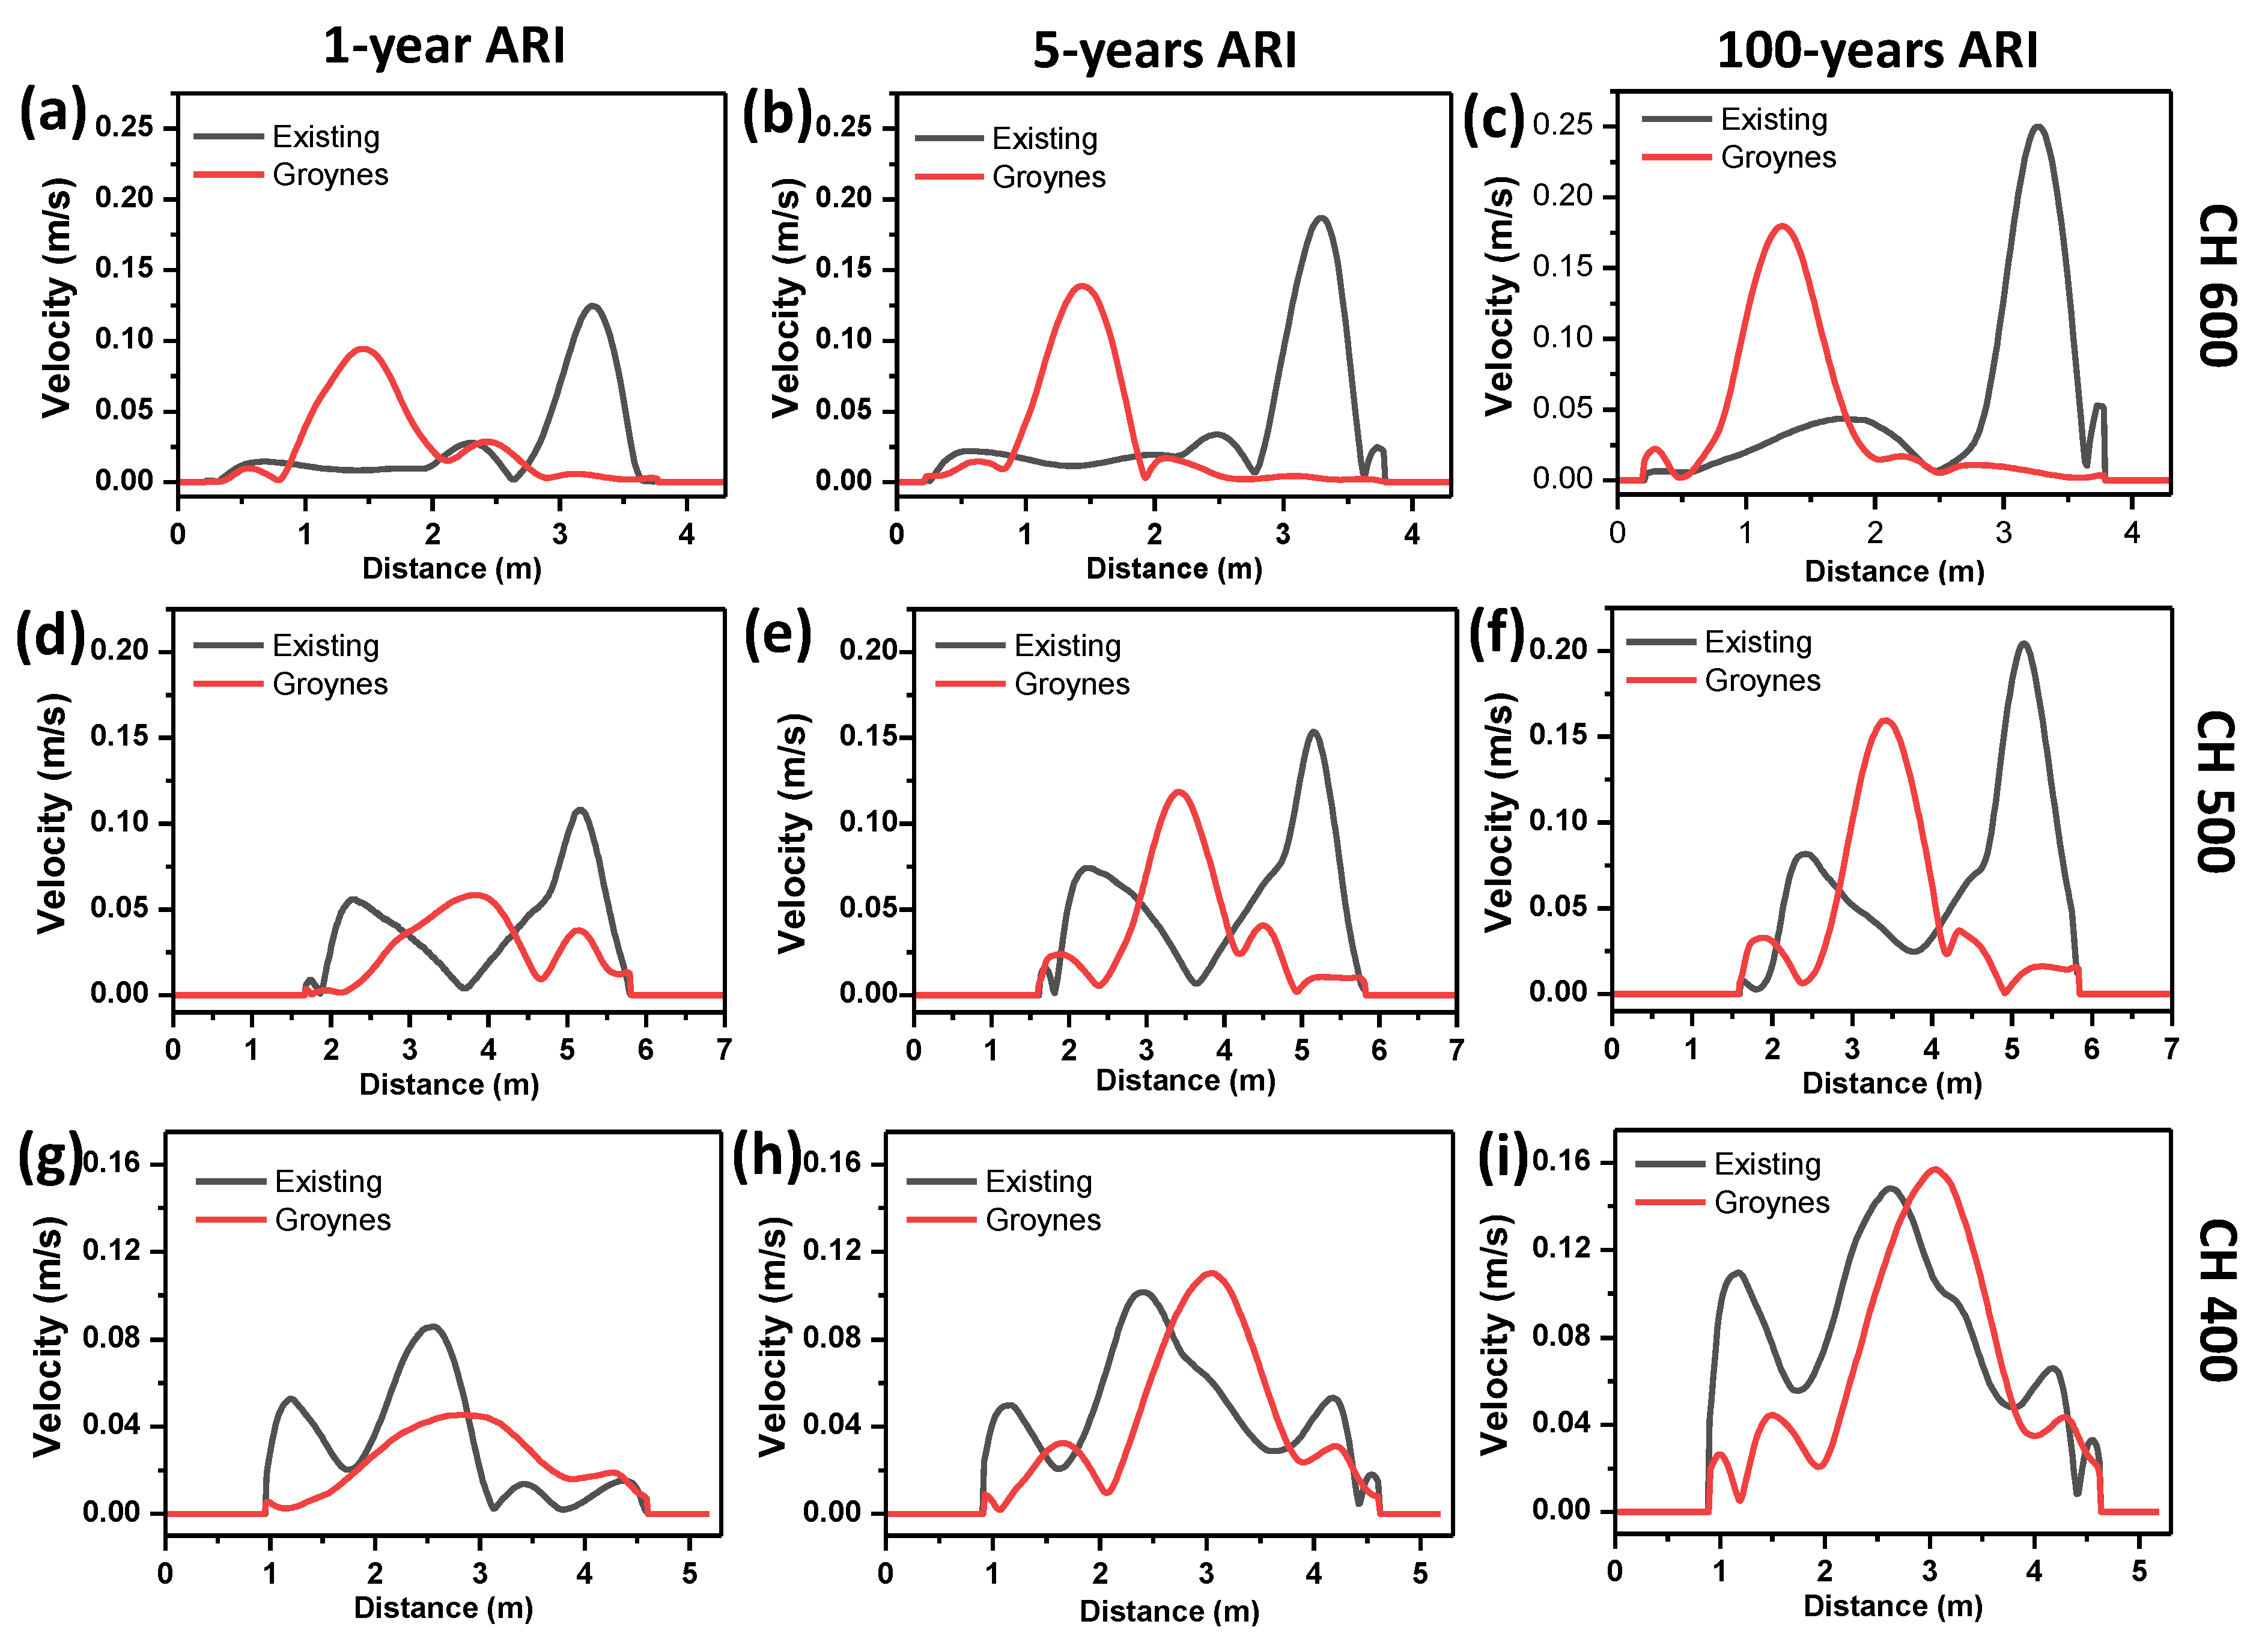
A comparison between velocity along CH600, CH500, and CH400 between the existing condition and with groynes installed is presented in Figure 19. These plots show the difference in magnitude and location of the dominant flow. At CH600 to CH500, the high-velocity magnitude is located on the opposing side of the channel for cases with and without groynes. The location change is caused by installing groynes at the upstream part of the channel. Furthermore, the magnitude of the dominant velocity at the upstream part (CH600 and CH500) is reduced with the installation of groynes and increases at the downstream part (CH400). In this scenario, the existence of groynes can change the flow pattern. To trap sediment, groynes can be built to generate flow that directs sediment to a specific area within the domain [41]. The ability of a numerical model to predict sediment transport and migration in Ringlet Reservoir will be explored and discussed in our future study using Flow-3D software that solves tougher free-surface flow problems.

4. Conclusions

Flow velocity measurements in Habu (Ringlet Reservoir) were plotted in velocity points for existing and mitigation (groynes) conditions. Based on the experimental results, the flow velocity patterns for all return period tested is very similar but with different magnitude of velocities. This also can be observed in the existence of groynes in the channel. Groynes also change the pattern of the velocity. Lower velocity was observed on the side of the channel, and higher velocity was more concentrated in the middle. An unsteady shallow water module in HEC-RAS has been used to investigate the flow hydrodynamic of the problem. Comparison with experimental results shows that HEC-RAS can provide an excellent prediction for the water surface elevation but falls slightly off when predicting the velocity. The unsteady shallow water equation allows HEC-RAS to simulate complex flow phenomena involving highly energetic free surface turbulence flow. The output can provide further insight into the flow behaviour, which provide essential information for the experimental work and future flow predictions. Detailed flow information such as velocity and free surface flow provided in this study will give valuable information that can be used to design better mitigation options. Understanding flow characteristics in reservoirs is crucial for designing effective mitigation options because it helps identify potential risks and predict behavior. For example, knowledge of flow characteristics can help determine the likelihood of sedimentation or erosion and design appropriate measures to prevent them.

Supplementary Materials

The following supporting information can be downloaded at: https://www.mdpi.com/article/10.3390/w15101883/s1, Video S1: Physical observation of vortex formation using dye tracer.

Author Contributions

S.M.D. and M.H.J. Conceptualization, and project supervision; M.S.F.M., M.K.H.S., R.S. and R.S.M. methodology and field investigation; E.H.K. and M.M. performed software modelling and data validation; N.S.R., D.S.M.I. and M.Z.M. performed data curation, general analysis, and manuscript preparation. All authors have read and agreed to the published version of the manuscript.

Funding

The National Water Research Institute of Malaysia (NAHRIM), Ministry of Natural Resources, Environment and Climate Change, spearheaded and funded this research.

Data Availability Statement

The data can be obtained from the corresponding author upon reasonable request.

Acknowledgments

The author would like to thank TNB Research Sdn Bhd (TNBR) for collaborating on this project’s research and exchanging data. This paper’s contents are based solely on research and are intended solely for research purposes; they do not reflect the views of TNBR or its subsidiaries. The National Water Research Institute of Malaysia (NAHRIM) provided the physical model experiment facilities necessary for this work. The authors are grateful for the help.

Conflicts of Interest

The authors have declared there are no competing interests. The present paper is an original work, and they are not associated with any profitable organization or company with any financial interest.

References

  1. Maass, A.; Hufschmidt, M.M.; Dorfman, R.; Thomas, J.H.A.; Marglin, S.A.; Fair, G.M. Design of Water-Resource Systems; Harvard University Press: Cambridge, MA, USA, 1962. [Google Scholar]
  2. Annandale, G.W.; Morris, G.L.; Karki, P. Extending the Life of Reservoirs: Sustainable Sediment Management for Dams and Run-of-River Hydropower; The World Bank: Washington, DC, USA, 2016; p. 188. [Google Scholar]
  3. Branche, E. The multipurpose water uses of hydropower reservoir: The SHARE concept. Comptes Rendus Phys. 2017, 18, 469–478. [Google Scholar] [CrossRef]
  4. IEA. Hydroelectricity. 2022. Available online: https://www.iea.org/reports/hydroelectricity (accessed on 13 March 2023).
  5. Huang, C.-C.; Lai, J.-S.; Lee, F.-Z.; Tan, Y.-C. Physical Model-Based Investigation of Reservoir Sedimentation Processes. Water 2018, 10, 352. [Google Scholar] [CrossRef]
  6. Basson, G. Reservoir sedimentation—An overview of global sedimentation rates and predicted sediment deposition. In Proceedings of the Oral Contribution to the International CHR Workshop-Expert Consultation: Erosion, Transport and Deposition of Sediments, Bern, Switzerland, 28–30 April 2008; pp. 74–79. [Google Scholar]
  7. Garcia, M. Sedimentation Engineering: Processes, Measurements, Modeling, and Practice; ASCE: Reston, VA, USA, 2008; pp. 2–12. [Google Scholar]
  8. Padhy, M.K.; Saini, R.P. A review on silt erosion in hydro turbines. Renew. Sustain. Energy Rev. 2008, 12, 1974–1987. [Google Scholar] [CrossRef]
  9. Sidek, L.M.; Luis, I.J. Sustainability of Hydropower Reservoir as Flood Mitigation Control: Lesson Learned from Ringlet Reservoir, Cameron Highlands, Malaysia. 2014. In Proceedings of the 2nd International Conference on Water Resources (ICWR2012), Langkawi, Malaysia, 5–7 November 2012. [Google Scholar]
  10. Sidek, L.M.; Luis, I.J.; Desa, M.N.M.; Julien, P.Y. Challenge In Running Hydropower As Source Of Clean Energy: Ringlet Reservoir, Cameron Highlands Case Study. In Proceedings of the National Graduate Conference 2012 (NatGrad2012), Kajang, Malaysia, 8–10 November 2012. [Google Scholar]
  11. Kositgittiwong, D.; Chinnarasri, C.; Julien, P. Numerical simulation of flow velocity profiles along a stepped spillway. Proc. Inst. Mech. Eng. E J. Process Mech. Eng. 2013, 227, 327–335. [Google Scholar] [CrossRef]
  12. Zhang, Y.; Han, L.; Chen, L.; Wang, C.; Chen, B.; Jiang, A. Study on the 3D Hydrodynamic Characteristics and Velocity Uniformity of a Gravity Flow Circular Flume. Water 2021, 13, 927. [Google Scholar] [CrossRef]
  13. McCoy, A.; Constantinescu, G.; Weber Larry, J. Numerical Investigation of Flow Hydrodynamics in a Channel with a Series of Groynes. J. Hydraul. Eng. 2008, 134, 157–172. [Google Scholar] [CrossRef]
  14. Choufu, L.; Abbasi, S.; Pourshahbaz, H.; Taghvaei, P.; Tfwala, S. Investigation of Flow, Erosion, and Sedimentation Pattern around Varied Groynes under Different Hydraulic and Geometric Conditions: A Numerical Study. Water 2019, 11, 235. [Google Scholar] [CrossRef]
  15. Desa, S.M.; Samion, M.K.H.; Hamzah, A.F.; Manan, E.A.; Noh, M.N.M. Physical Modelling Study on Sediment Removal of Sungai Habu and Sungai Ringlet, Cameron Highlands. In ICDSME 2019—Water Resources Development and Management; Springer: Singapore, 2020; pp. 184–196. [Google Scholar]
  16. Al-Qaisi, D.A.; Alqaisi, M.; Abdulridha, R. Analysis of the hydraulic characteristics of al mahawil stream using hecras: A field study. Pollut. Res. 2020, 39, 856–863. [Google Scholar]
  17. Mojtahedi, A.; Basmenji, A.B. Numerical and Field Investigation of the Impacts of the Bank Protection Projects on the Fluvial Hydrodynamics (Case Study: Ghezel Ozan River). Int. J. Eng. Technol. 2017, 9, 492–497. [Google Scholar] [CrossRef]
  18. Walker, D.J.; Dong, P.; Anastasiou, K. Sediment Transport near Groynes in the Nearshore Zone. J. Coast. Res. 1991, 7, 1003–1011. [Google Scholar]
  19. Luis, J.; Sidek, L.M.; Desa, M.N.M.; Julien, P.Y. Hydropower Reservoir for Flood Control: A Case Study on Ringlet Reservoir, Cameron Highlands, Malaysia. J. Flood Eng. 2013, 4, 87–102. [Google Scholar]
  20. Berhad, T.N. TNB’s Nenggiri Dam to Play Multi-Fold Role. 2021. Available online: https://www.thesundaily.my/local/tnb-s-nenggiri-dam-to-have-multifold-roles-YG7811573 (accessed on 23 March 2023).
  21. Teh, S.H. Soil Erosion Modeling Using RUSLE and GIS on Cameron Highlands, Malaysia for Hydropower Development. Master’s Thesis, The School for Renewable Energy Science, Akureyri, Iceland, 2011. [Google Scholar]
  22. Luis, J.; Sidek, L.M.; Desa, M.N.M.; Julien, P.Y. Sustainability of hydropower as source of renewable and clean energy. IOP Conf. Ser. Earth Environ. Sci. 2013, 16, 012050. [Google Scholar] [CrossRef]
  23. Raj, J.K. Land use changes, soil erosion and decreased base flow of rivers at Cameron Highlands, Peninsular Malaysia. Bull. Geol. Soc. Malays. 2002, 45, 3–10. [Google Scholar] [CrossRef]
  24. Razad, A.Z.A.; Abbas, N.A.; Sidek, L.M.; Alexander, J.L.; Jung, K. Sediment management strategies for hydropower reservoirs in active agricultural area. Int. J. Eng. Technol. 2018, 7, 228–233. [Google Scholar]
  25. Vangelis, H.; Zotou, I.; Kourtis, I.M.; Bellos, V.; Tsihrintzis, V.A. Relationship of Rainfall and Flood Return Periods through Hydrologic and Hydraulic Modeling. Water 2022, 14, 3618. [Google Scholar] [CrossRef]
  26. Morales-Marin, L.A.; French, J.R.; Burningham, H.; Battarbee, R.W. Three-dimensional hydrodynamic and sediment transport modeling to test the sediment focusing hypothesis in upland lakes. Limnol. Oceanogr. 2018, 63, S156–S176. [Google Scholar] [CrossRef]
  27. Kang, T.; Jang, C.-L.; Kimura, I.; Lee, N. Numerical Simulation of Debris Flow and Driftwood with Entrainment of Sediment. Water 2022, 14, 3673. [Google Scholar] [CrossRef]
  28. Ma, C.; Xu, X.; Yang, J.; Cheng, L. Safety Monitoring and Management of Reservoir and Dams. Water 2023, 15, 1078. [Google Scholar] [CrossRef]
  29. El Kadi Abderrezzak, K.; Die Moran, A.; Mosselman, E.; Bouchard, J.-P.; Habersack, H.; Aelbrecht, D. A physical, movable-bed model for non-uniform sediment transport, fluvial erosion and bank failure in rivers. J. Hydro-Environ. Res. 2014, 8, 95–114. [Google Scholar] [CrossRef]
  30. Isaac, N.; Eldho, T.I.; Gupta, I.D. Numerical and physical model studies for hydraulic flushing of sediment from Chamera-II reservoir, Himachal Pradesh, India. ISH J. Hydraul. Eng. 2014, 20, 14–23. [Google Scholar] [CrossRef]
  31. Sun, Y.; Zhang, L.; Liu, J.; Lin, J.; Cui, Q. A Data Assimilation Approach to the Modeling of 3D Hydrodynamic Flow Velocity in River Reaches. Water 2022, 14, 3598. [Google Scholar] [CrossRef]
  32. Yossef, M. The Effect of Groynes on Rivers: Literature Review; Cluster Publicatienummer 03.03.04; Delft University of Technology: Delft, The Netherlands, 2002. [Google Scholar]
  33. Michioku, K.; Osawa, Y.; Kanda, K. Performance of a groyne in controlling flow, sediment and morphology around a tributary confluence. E3S Web Conf. 2018, 40, 04006. [Google Scholar] [CrossRef]
  34. Farzad Mohammadi, N.M. Technical Evaluation of the Performance of River Groynes Installed in Sezar and Kashkan Rivers, Lorestan, Iran. J. Appl. Environ. Biol. Sci. 2015, 5, 258–268. [Google Scholar]
  35. Baker, C.; Johnson, T.; Flynn, D.; Hemida, H.; Quinn, A.; Soper, D.; Sterling, M. Chapter 4—Computational techniques. In Train Aerodynamics; Baker, C., Johnson, T., Flynn, D., Hemida, H., Quinn, A., Soper, D., Sterling, M., Eds.; Butterworth-Heinemann: Oxford, UK, 2019; pp. 53–71. [Google Scholar]
  36. Katopodes, N.D. Chapter 8—Methods for Two-Dimensional Shallow-Water Flow. In Free-Surface Flow; Katopodes, N.D., Ed.; Butterworth-Heinemann: Oxford, UK, 2019; pp. 500–567. [Google Scholar]
  37. U.S. Army Corps of Engineers. HEC-RAS 2D Modeling User’s Manual; U.S. Army Corps of Engineers: Washington, DC, USA, 2021.
  38. Sjölund, L. A Study of Sedimentation Problems in the Lower Reaches of the River Österdalälven. Master’s Thesis, KTH Royal Institute of Technology, Stockholm, Sweden, 2018. [Google Scholar]
  39. Shields, A.B. Application of Similarity Principles and Turbulence Research to Bed-Load Movement; California Institute of Technology: Pasadena, CA, USA, 1936. [Google Scholar]
  40. Camnasio, E.; Orsi, E.; Schleiss, A.J. Experimental study of velocity fields in rectangular shallow reservoirs. J. Hydraul. Res. 2011, 49, 352–358. [Google Scholar] [CrossRef]
  41. Yossef Mohamed, F.M.; de Vriend Huib, J. Sediment Exchange between a River and Its Groyne Fields: Mobile-Bed Experiment. J. Hydraul. Eng. 2010, 136, 610–625. [Google Scholar] [CrossRef]
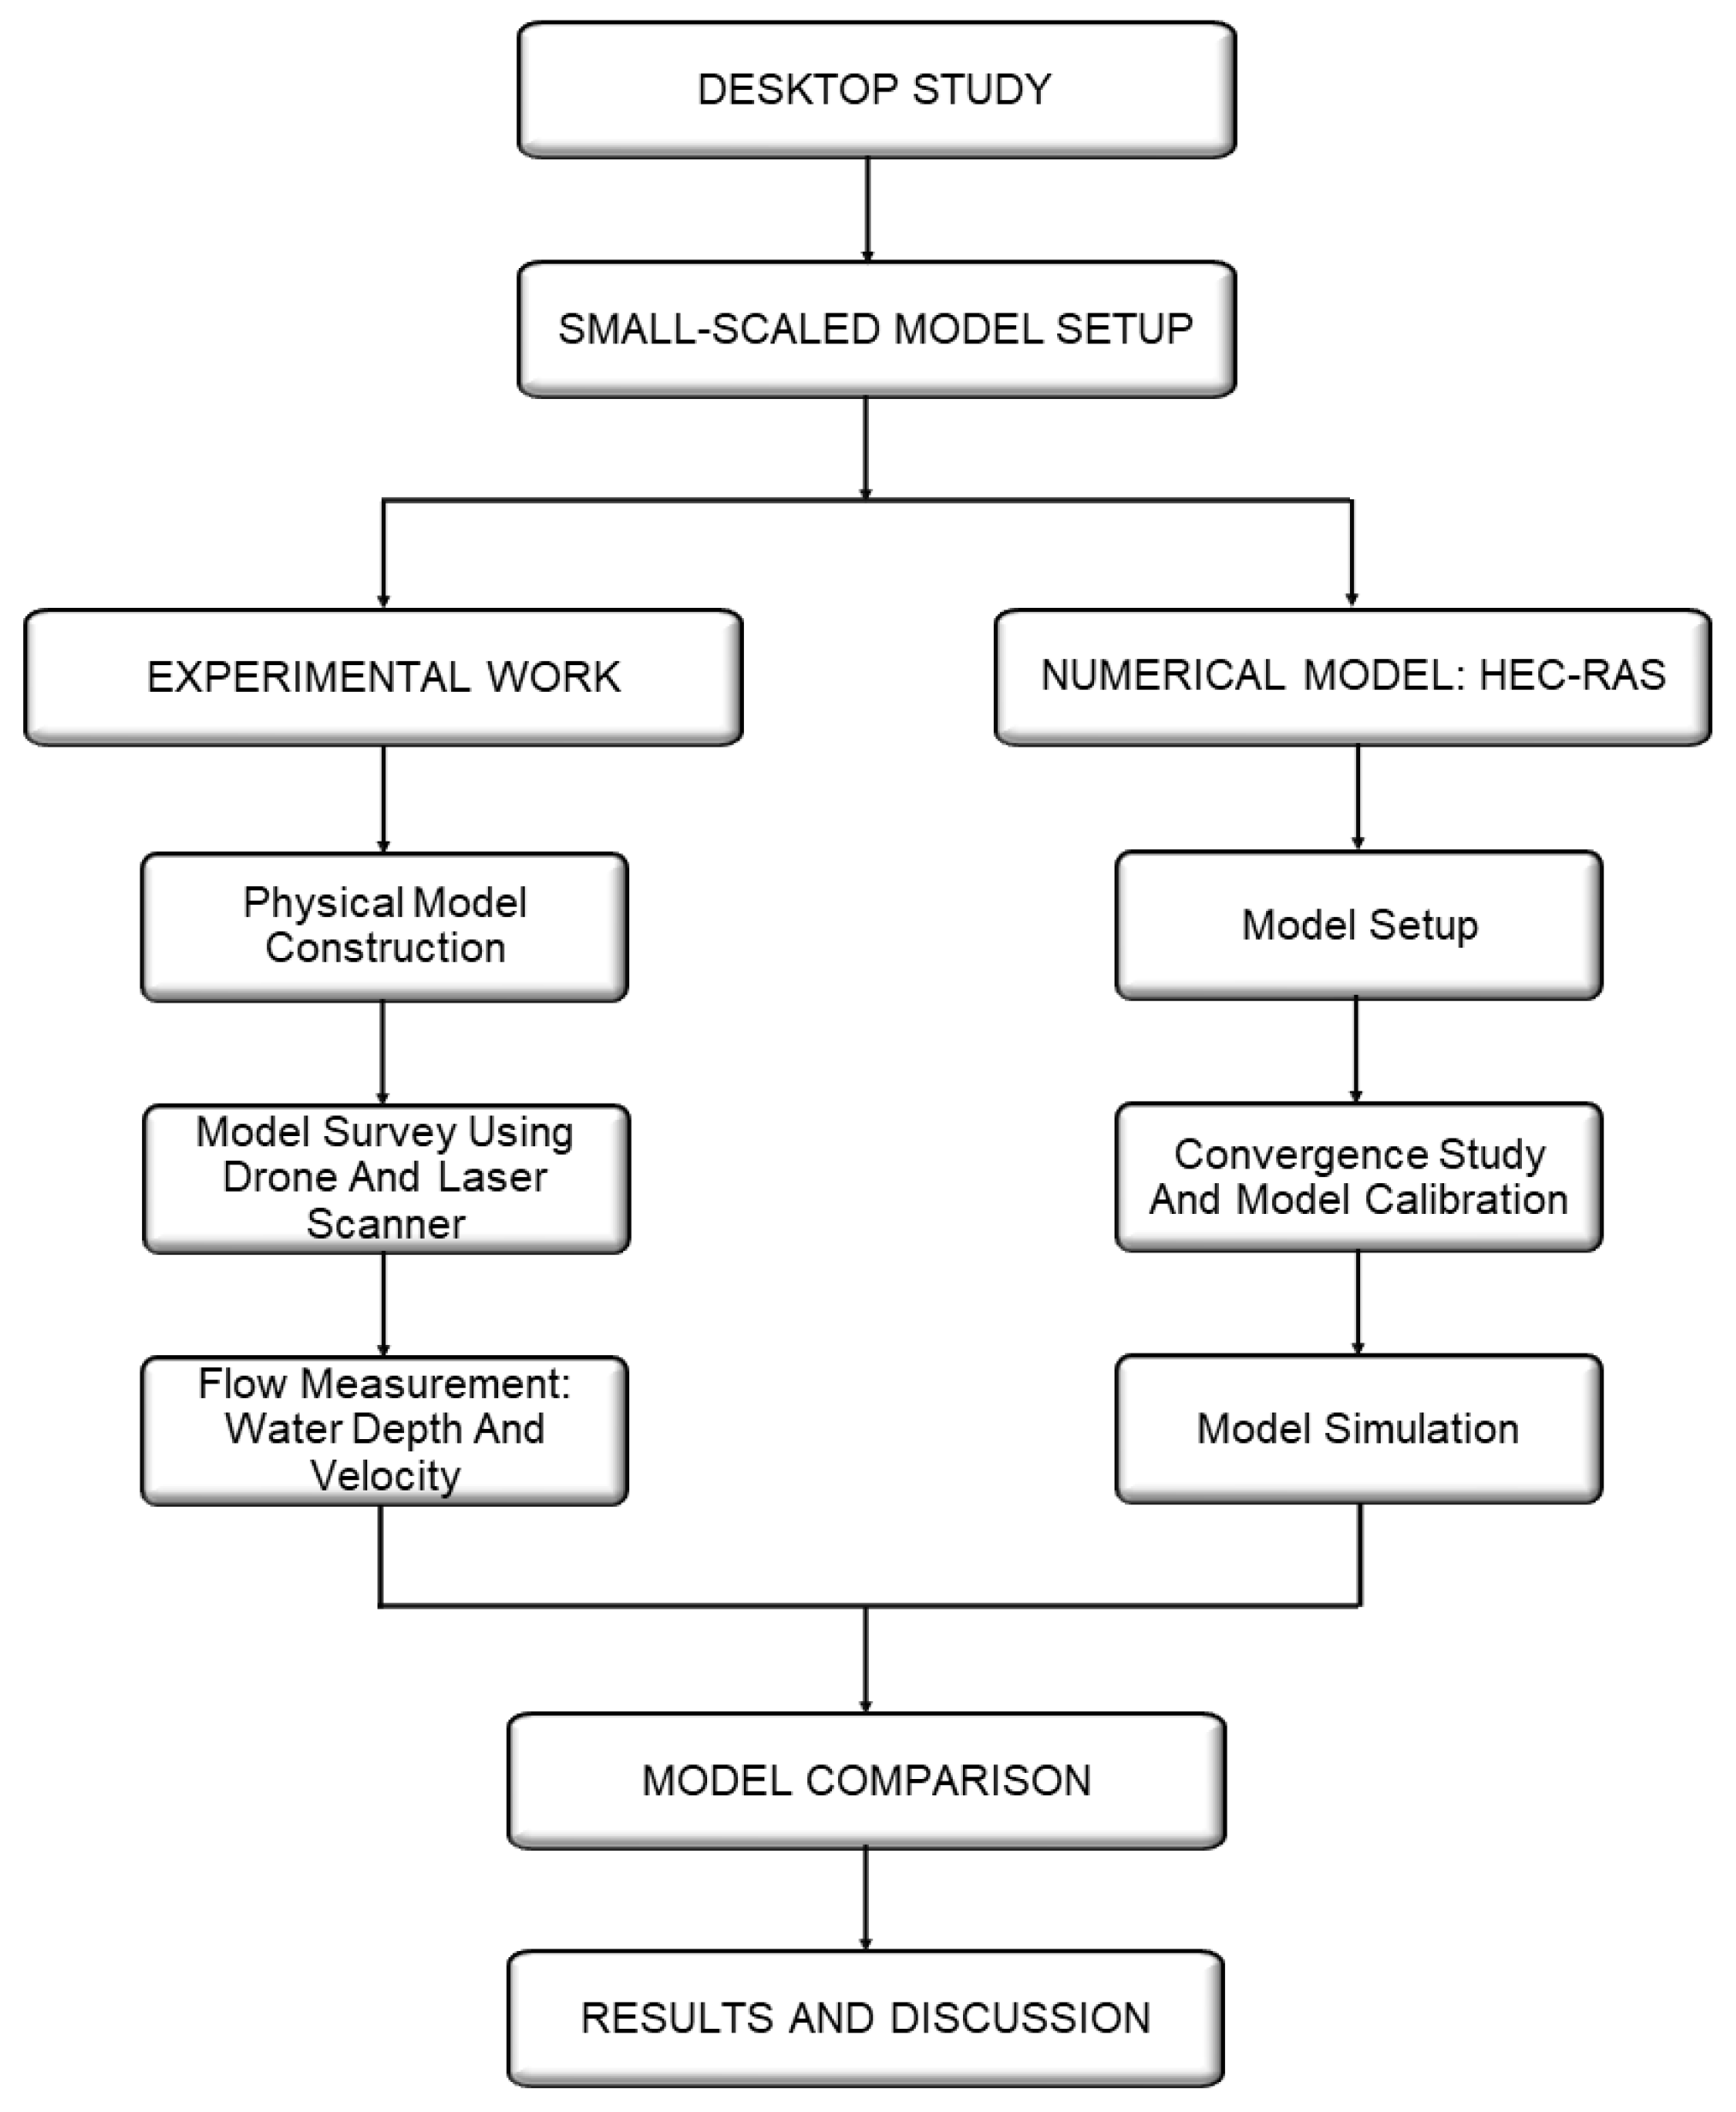
Figure 1. Flowchart of the study. The major components of the study are the experimental works and validation of the model using a numerical approach.
Water 15 01883 g001
Figure 2. Map area of Habu. Habu is part of the Ringlet Reservoir, Cameron Highland, Malaysia. Hence, the name ‘Habu’ was used throughout.
Water 15 01883 g002
Figure 3. Diagram of the physical model in Habu. (a) existing and (b) with groynes conditions. (c,d) live images of the constructed physical models of (a,b).
Water 15 01883 g003
Figure 4. Velocity points at Habu during; existing condition: (a) 1-year, (b) 5-years and (c) 100-years ARI, Groynes condition: (d) 1-year, (e) 5-years and (f) 100-years ARI, respectively. Display vectors were present with the vector arrow tail at the data location.
Water 15 01883 g004
Figure 5. Velocity distribution comparisons between different ARIs (1-year, 5-years, and 100-years) for (a) existing conditions and (b) with Groynes.
Water 15 01883 g005
Figure 6. Mesh with sizes of (a) 15 cm, (b) 10 cm and (c) 5 cm.
Water 15 01883 g006
Figure 7. (a) River centreline (blue line) and CH (red line) for Habu. WSE plot along the Habu end centreline for different mesh sizes (b) centreline, (c) CH700, (d) CH500.
Water 15 01883 g007
Figure 8. Sensitivity plot of velocity along Habu (a) CH700, (b) CH500 for different mesh sizes. The insets show the enlarged curves to aid comparisons.
Water 15 01883 g008
Figure 9. (a) Observation points from experimental work. Red dots denote the location of sampling used for comparison between experiment and simulation, while green dots denote the additional experimental sampling locations. Water depth and velocity comparison for DWA (b), (c) and SWE (d), (e) between experimental observation and simulation results.
Water 15 01883 g009
Figure 10. Velocity time history at (a) CH750, (b) CH500 for simulation with different Manning’s values.
Water 15 01883 g010
Figure 11. (a) Location of the groynes along Habu catchment and experimental sampling locations. Red dots denote the location of sampling used for comparison between the experiment and simulation, while green dots denote the additional experimental sampling locations. (b) water depth (c) velocity comparison between experimental observation and simulation results (SWE) for a model with groynes installed.
Water 15 01883 g011
Figure 12. (a) Water Surface Elevation (WSE) along the Habu centreline. Simulated water depth at the end of the simulation for (b) 1 year (c) 5 years, and (d) 100 years ARI.
Water 15 01883 g012
Figure 13. Velocity magnitude at a time step, t = 10, 20 and 30 min, for 1-year, 5-years and 100-years ARI. The arrow represents the flow direction of the water and is applied to all cases.
Water 15 01883 g013
Figure 14. Particle tracing at time step, t = 30 min, for (a) 1-year, (b) 5 years and (c) 100-years ARI. The arrow represents the flow direction of the water and is applied to all cases.
Water 15 01883 g014
Figure 15. Velocity comparison between 1-year, 5-years and 100-years ARI during steady-state conditions at (a) CH650, (b) CH500 and (c) CH350.
Water 15 01883 g015
Figure 16. Water depth at Habu with groynes installed for (a) 1 year (b) 5 years, and (c) 100 years ARI.
Water 15 01883 g016
Figure 17. Velocity magnitude comparison between 1-year, 5-years and 100-years ARI for Habu with groynes installed at a time step, t = 10, 20 and 30 min. The arrow represents the flow direction of the water and is applied to all cases.
Water 15 01883 g017
Figure 18. Particle tracing comparison between (a) 1-year (b) 5-years, and (c) 100-years ARI for Habu with groynes installed. The arrow represents the flow direction of the water and is applied to all cases.
Water 15 01883 g018
Figure 19. Velocity comparison between existing condition (black line) and groynes installed (red line) at CH 600 (ac), CH 500 (df), CH400 (gi) for 1-year, 5-years and 100-years ARI.
Water 15 01883 g019
Table 1. Test conditions for Habu (Ringlet River).
LocationConditionsARI (Year)Test SeriesFlow Rate
Prototype
(m3/s)
Model
(l/s)
HabuH1
Existing
1H1-123.54.7
5H1-534.57.0
100H1-10055.511.3
H2
with Groynes
1H2-123.54.7
5H2-534.57.0
100H2-10055.511.3
Table 2. Summary of velocities measured at Habu.
Condition A R I (Years) Flow   Rate ,   Q (L/s) U m i n   ( m / s ) U m a x   ( m / s ) U a v e   ( m / s )
H1
Existing
14.70.0620.6220.180
57.00.0440.7930.181
10011.30.0210.8990.188
H2
Groynes
14.70.0380.6080.161
57.00.0340.7290.195
10011.30.0260.8740.248
Disclaimer/Publisher’s Note: The statements, opinions and data contained in all publications are solely those of the individual author(s) and contributor(s) and not of MDPI and/or the editor(s). MDPI and/or the editor(s) disclaim responsibility for any injury to people or property resulting from any ideas, methods, instructions or products referred to in the content.