Article

Simulation Study on the Impact of South–North Water Transfer Central Line Recharge on the Water Environment of Bai River

1
Water Conservancy College, North China University of Water Resources and Electric Power, Zhengzhou 450046, China
2
Collaborative Innovation Center of Water Resources Efficient Utilization and Protection Engineering, Zhengzhou 450046, China
3
Technology Research Center of Water Conservancy and Marine Traffic Engineering, Zhengzhou 450046, China
*
Author to whom correspondence should be addressed.
Water 2023, 15(10), 1871; https://doi.org/10.3390/w15101871
Submission received: 22 March 2023 / Revised: 10 May 2023 / Accepted: 12 May 2023 / Published: 15 May 2023
(This article belongs to the Section Hydrology)

Abstract

:
To effectively improve the water quality of the Bai River, this paper proposes the use of the ecological replenishment of the South–North Water Transfer as a measure for the integrated allocation of water resources, addressing the impact of complex topography, climate, and human disturbances on the river’s water environment. This measure can alleviate the problem of water shortage and significantly enhance the quality of the Bai River’s water environment. Using the MIKE21 coupled hydrodynamic and water-quality model, this paper analyzes the impact of ecological recharge on river hydrodynamics and simulates the evolution of various water-quality indicators, including dissolved oxygen (DO), permanganate index (CODMn), chemical oxygen demand (COD), ammonia nitrogen (NH3-N), and total phosphorus (TP) under different scenarios. The aim of this paper is to investigate the impact mechanism of ecological recharge on the river’s water environment. The results show that the most significant improvement in river water quality is achieved when the recharge flow is 2Q and the recharge duration is 1/2T (scenario 1), with the river improving from a grade IV water-quality standard to a grade III water-quality standard, and COD and TP indicators improving to a grade II water standard, with the largest improvement rate of 94.67% seen in DO, with the best improvement rate of 94.67% in DO indicators and the best reduction rate of 66.67% in TP indicators. Overall, ecological replenishment can significantly improve the Bai River’s water quality, with scenario 1 being the most effective approach. The results of this study may provide theoretical and technical support for the future management of river water environments.

1. Introduction

Water is an important natural resource and a strategic economic resource, and it is the material basis for human survival. With the rapid development of the economy, industrialization, and urbanization, the development of water resources is unreasonable; water resources are over-exploited, and pollutants are not discharged in accordance with standards, making the problem of water shortage increasingly serious [1]. Ecological recharge is a common comprehensive river-training measure at home and abroad, which has the function of restoring the ecosystem function of the receiving area and achieving a dynamic ecological balance in the receiving area [2]. The study of ecological replenishment began earlier, with GE Petts et al. proposing an ‘ecologically acceptable’ flow-calculation method that takes into account river connectivity, vertical exchange, diffuse flows, and minimum flows in order to manage the water environment of rivers in England and Wales [3]. Gleick et al. introduced the concept of ecological water demand in the 1990s, which refers to the amount of water required by a riverine ecosystem to safeguard its functional and structural integrity and to maintain biodiversity, and a number of methods for calculating ecological water demand have emerged [4]. In 1994, the Australian Government stated that water resources should be provided in appropriate amounts to water ecosystems, such as rivers and lakes, to restore ecosystem function and structural integrity and to maintain biodiversity [5]. In order to restore wetland ecosystems in Sudan that have been severely affected by irrigation projects, Dadaser-Celik F et al. developed a cost-effective ecological recharge scheme by estimating the total costs required for water transfer, as well as the marginal benefits [6]. Nikoo et al. developed a water-quality model for the Karoon River basin in Iran to investigate the impact of water transfer projects on the receiving area. The model takes into account the ecological water demand and the target water quality of the receiving area and exposes the changes in pollutant concentrations in the river after ecological recharge [7]. Research on ecological water recharge in China is more limited and started later than abroad. In the late 1980s, Chinese scholars began to conduct research on ecological water demand, and Tang Qicheng summarized the development patterns and laws of the basin’s oases by analyzing the water resources of the Tarim basin at that time and raised the issue of ecological water use in the conservation proposals for the oases [8]. In order to investigate the optimal configuration of the river ecological recharge scheme, Fei-Fei Wang et al. [9] developed a two-dimensional numerical model based on the MIKE21 hydrodynamic water-quality module for the heavily polluted river Furniu Creek in Chongqing. The simulation results showed that a two-point recharge scheme is economically feasible and has a high rate of water-quality improvement.
The physical simulation of the ecological recharge process can be very labor-intensive. Numerical simulation, with the help of a model, offers significant advantages in terms of visibility of the process and results, short modelling cycles, and economic savings. In 1973, Simons T J et al. [10] developed a two-dimensional circulation hydrodynamic model of the lake based on survey data from Lake Ontario, which is recognized as the earliest developed and most complete two-dimensional hydrodynamic model in terms of model parameters. With the significant increase in computing power, the problem of slow-running 2D hydrodynamic models has been fully solved and a large number of 2D hydrodynamic simulation software has been created; the more typical ones are MIKE21, EFDC, HEC-RAS, and Delft3D. Zhang Ye et al. [11] used MIKE21 software to build a two-dimensional hydrodynamic model of the Chaobai River and simulated four different recharge scenarios to analyze improvements in the hydrodynamic conditions of the water body under different scenarios. Numerical water-quality models are based on hydrodynamic models and are a further extension of the development of hydrodynamic models and an important tool for simulating the study of processes such as the diffusion, transport, and degradation of pollutants in water bodies. Using the Jiahetan–Gaocun section of zonal flood detention as an example, Chen J. et al. established a two-dimensional flow mathematical model using MIKE 21 to analyze the floodplain detention effect through numerical simulation of the flood flow path in the detention operation, and the maximum absolute error of the water level at the measuring station calculated using the MIKE 21 model was only 0.77 m [12]. Zuo Q et al. used MIKE21 to develop a hydrodynamic and dilution dispersion model for the discharge sea area and simulated the dilution dispersion pattern of radionuclides in liquid effluents under tidal action [13]. In 2018, Yang Mee et al. [14] introduced an artificial-bee-colony algorithm to optimize the BP neural network and proposed a water-quality model based on a double-implied-layer network structure, selecting water-quality indicators such as DO, BOD, and COD as evaluation indicators to evaluate the monthly water-quality data of a section of the lower Yellow River, achieving more reasonable results.
For a long time, caused by the unreasonable discharge of industrial wastewater and domestic sewage on both sides of the river, the quality of the water environment in the middle and lower reaches of the Bai River has declined sharply, causing water-quality-based water-shortage problems and failure to meet the needs of local water resources and water environment quality [15]. The MIKE model can be divided into hydrodynamic, water quality, sediment, and wave according to modules. MIKE software has a wide range of applications and offers a wide range of tools for water resources and environmental modelling that can be used in a variety of applications. In addition to this, MIKE software has the advantage of high accuracy, flexibility, and the ability to integrate with other software compared to other simulation software.
The aims of this paper are as follows: (1) to study the improvement in the water environment by ecological recharge in the Bai River region through modelling; (2) to simulate different recharge scenarios for a 35.46 km long section of the Bai River from the Upper Zhantou Barrage section to the Upper Fanying section in Nanyang using the MIKE21 coupled hydrodynamic water-quality model, and to study changes in the hydrodynamic conditions and pollutant concentration fields in the Bai River under three recharge scenarios; and (3) to reveal the impact mechanisms and response patterns of ecological recharge on the water environment of the Bai River.

2. Study Area Overview

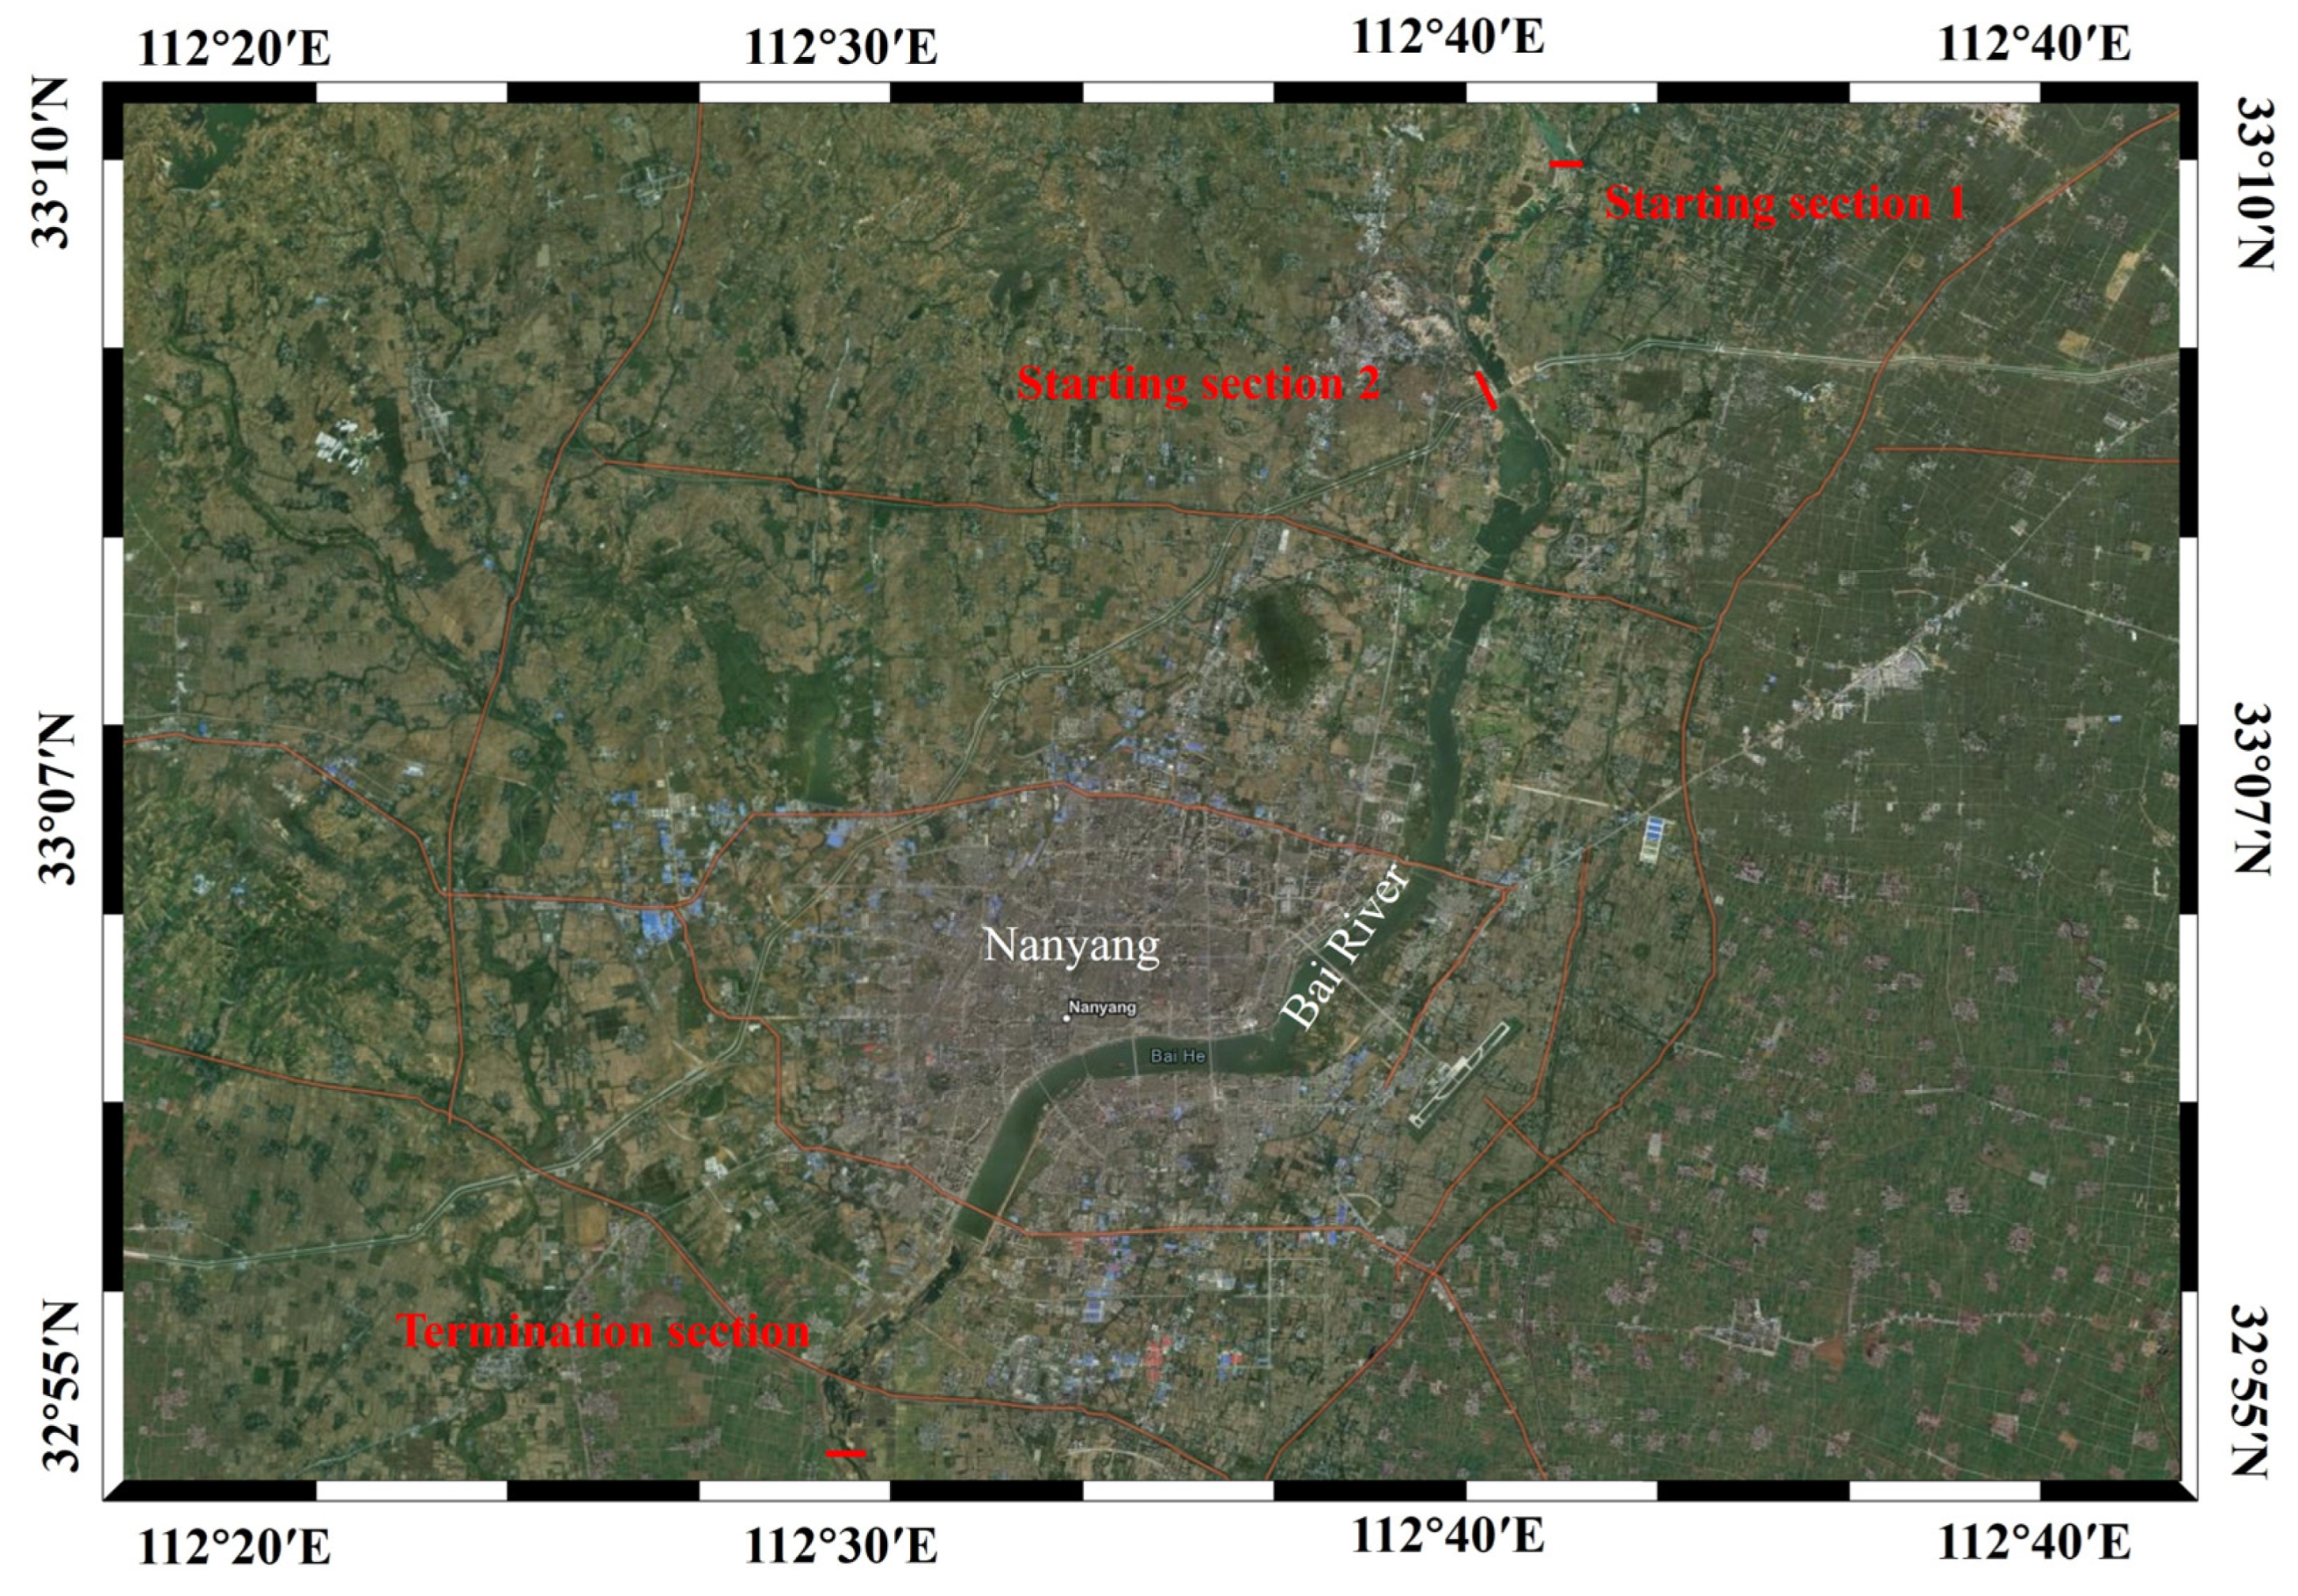
The Bai River is the right main tributary of the Tangbai River, a first-grade tributary of the Han River, located between 112°20′ E and 112°27′ E and 32°10′ N and 33°25′ N, with a total basin area of 12,270 km2 and a total main-stream length of 264 km. The water system in which the Bai River is located is the Han River system, which is one of the main water systems in the Yangtze River basin and has an important historical status. The Bai River is located at the headwaters of the Han River and has a large overall slope drop. There are many hydrological stations on the main stream of the Bai River, including the basic water control station, namely the Xindianpu hydrological station, which is responsible for the observation of the water level, flow, and sediment of the Bai River, providing a solid foundation for flood and drought prevention and rational development of water resources downstream. With the progress of technology, the rapid development of major factories in the vicinity of the Bai River, and unreasonable discharge due to the untimely treatment of industrial wastewater on both sides of the river, the quality of the water environment in the middle and lower reaches of the Bai River as a cited water source has declined sharply, causing water-quality-based water-shortage problems and making it difficult to meet the allocation of water resources and water environmental protection in the Bai River basin. The South–North Water Diversion Project is a strategic water conservancy project in China aimed at addressing the uneven distribution of water resources [16]. The South–North Water Diversion Project is 1432 km long, supplying water to an area of 155,000 km2. Because of its commissioning, the Central Line Project has transferred over 52 billion m3 of water, effectively alleviating the shortage of water resources in the receiving regions along the coast, optimizing the allocation of water resources between regions, facilitating access to water for the receiving regions, and promoting regional economic development [17]. The South–North Water Diversion Project has supplied a total of over 17 billion m3 of water to Henan Province, of which over 3.8 billion m3 of water was supplied to 26 rivers and 8 lake reservoirs in Henan Province for ecological replenishment [18]. By means of ecological water replenishment, it promotes the ecological restoration of the local water environment and improves the quality of the regional water environment. The South–North Water Transfer Main Canal crosses the Bai River in Cai Zhai Village, Pushan Town, Wancheng District, and Nanyang City using an inverted siphon, with a catchment area of 3594.6 km2 above the cross-section of the Bai River and a main-stream length of 115 km. The main source of ecological replenishment of the Bai River is the receding channel upstream of the inverted siphon of the Bai River channel of the South–North Water Transfer Central Project in Nanyang, located 25 km downstream of the Duck River mouth reservoir. The ecological water supply is delivered by gravity and enters the Bai River through the retreat channel, where the retreat gate has a design flow of 165 m3/s. The location of the Bai River in the South–North Water Transfer Central Project is shown in Figure 1.

3. Model Principles

Based on the MIKE21 hydrodynamic and water-quality module to numerically simulate different recharge scenarios, this study enriches the field of ecological recharge and expands the application area of water environment simulation, which can provide a case reference for exploring the evolution mechanism of the water environment in the receiving area. In terms of ecological recharge research methods, theoretical analysis, model experiments and numerical simulation, etc., are available, and using the MIKE21 hydrodynamic–water-quality coupled model compared to empirical formulas and physical models greatly improve the calculation speed and accuracy. MIKE21, as a typical flat two-dimensional numerical simulation model compared to three-dimensional calculation, is less difficult and is suitable for current mainstream computer-operating systems; the simulation process is stable, easy to operate, widely used, and has a wealth of features. The MIKE21 water environment model used in this study mainly includes hydrodynamic HD and water-quality Ecolab simulation processes, which can better simulate and analyze the ecological recharge process [19].

3.1. Hydrodynamic Models

The core of the 2D shallow water flow equations is a set of 2D non-constant flow equations, which are used to explain the flow of water bodies. The main idea is to use the finite unit method to split the calculation object into continuous but non-interfering units and to calculate the vertical component of each parameter of the hydraulics according to the idea of time by time and unit by unit, thus describing the flow of water bodies in shallow water [20].
The 2D shallow water equations are the basis of the 2D hydrodynamic model used by MIKE21 and are embodied in the integration of the 2D shallow water set of control equations to obtain the corresponding set of equations as follows [21]:
h t + h u ¯ x + h v ¯ y = h S f
h u ¯ t + h u ¯ 2 x + h v u ¯ y = f v ¯ h g h η x g h 2 2 ρ ρ x + τ s x ρ τ b x ρ + x ( h T x x ) + y ( h T x y ) + h u 2 S f
h v ¯ t + h u ¯ v ¯ x + h v ¯ 2 y = f v ¯ h g h η y g h 2 2 ρ ρ x + τ s y ρ τ b y ρ + x ( h T x y ) + y ( h T y y ) + h v 2 S f
where t —time, d; x , y —horizontal and vertical axis coordinates, respectively, m; η —water level, m; d —static water depth, m; h —total water depth, h = η + d , m; f —coefficient of Koch’s force, f = 2 Ω s i n φ , s 1 ; g —acceleration of gravity, m/s2; ρ —density of the fluid, g/mL; τ s x , τ s y , τ b x , τ b y —surface wind stresses in the x and y directions and bottom shear stresses, N; S f —source items, kg/(m3·s); and u s , v s —source flow rate, m/s.

3.2. Water-Quality Models

This simulation of the water quality of the Bai River was built on the basis of the MIKE21 hydrodynamic model, using the Ecolab module and convective dispersion module together, which can reveal the main pollutants in the water body and the migration change pattern of these pollutants [22]. Therefore, the coupled hydrodynamic–water-quality model is used to simulate the water environment conditions of the Bai River, and the model is rate-determined by the measured data.
The two-dimensional water-quality model uses two-dimensional shallow water equations to calculate the flow of water bodies based on the Riemann approximation solution method and explains the principles of pollutant dispersion, using the finite volume method to describe the phenomenon of pollutant degradation and dispersion in water bodies [23].
The basis of the mass equation is built on the mass balance equation. The two-dimensional water-quality convective diffusion equation is as follows:
t ( h c ) + x ( u h c ) + x ( v h c ) = x ( h D x c x ) + y ( h D y c y ) F h c + S
where c —pollutant concentration; u , v —flow velocity components in the x , y direction, respectively; D x , D y x , y upward diffusion coefficient, respectively; F —degradation coefficient; h —water depth, S = Q s   ( c s c ) : Q —sewage flow; and c —pollutant concentration.
The Ecolab model is a software module used in MIKE21 to simulate changes in the water environment. It has good model coupling and can often be used in conjunction with the hydrodynamic module and the convective diffusion module. As a result, the module has been popularized and is widely used in water-quality simulations in rivers, lakes, and estuaries.
The Ecolab module transport equations are as follows:
h C ¯ t + h u ¯ C ¯ x + h v ¯ C ¯ y = h [ x ( D h x ) + y ( D h y ) ] C ¯ h k p C ¯ + h C s s
where C s —concentration of the scalar variable; D h —horizontal diffusion coefficient; t —time; and k p —degradation coefficient of the scalar.
The water-quality model is calculated as follows:
c t + u c x + v c y + w c z = D x 2 c z 2 + D y 2 c z 2 + D z 2 c z 2 + S c + P c
where c —concentration of the Ecolab state variable; u , v , w —flow velocity components of the convective term; D x , D y , D z —dispersion coefficients of the diffusion term; S c —source-sink term; and P c —biochemical reaction of the Ecolab.
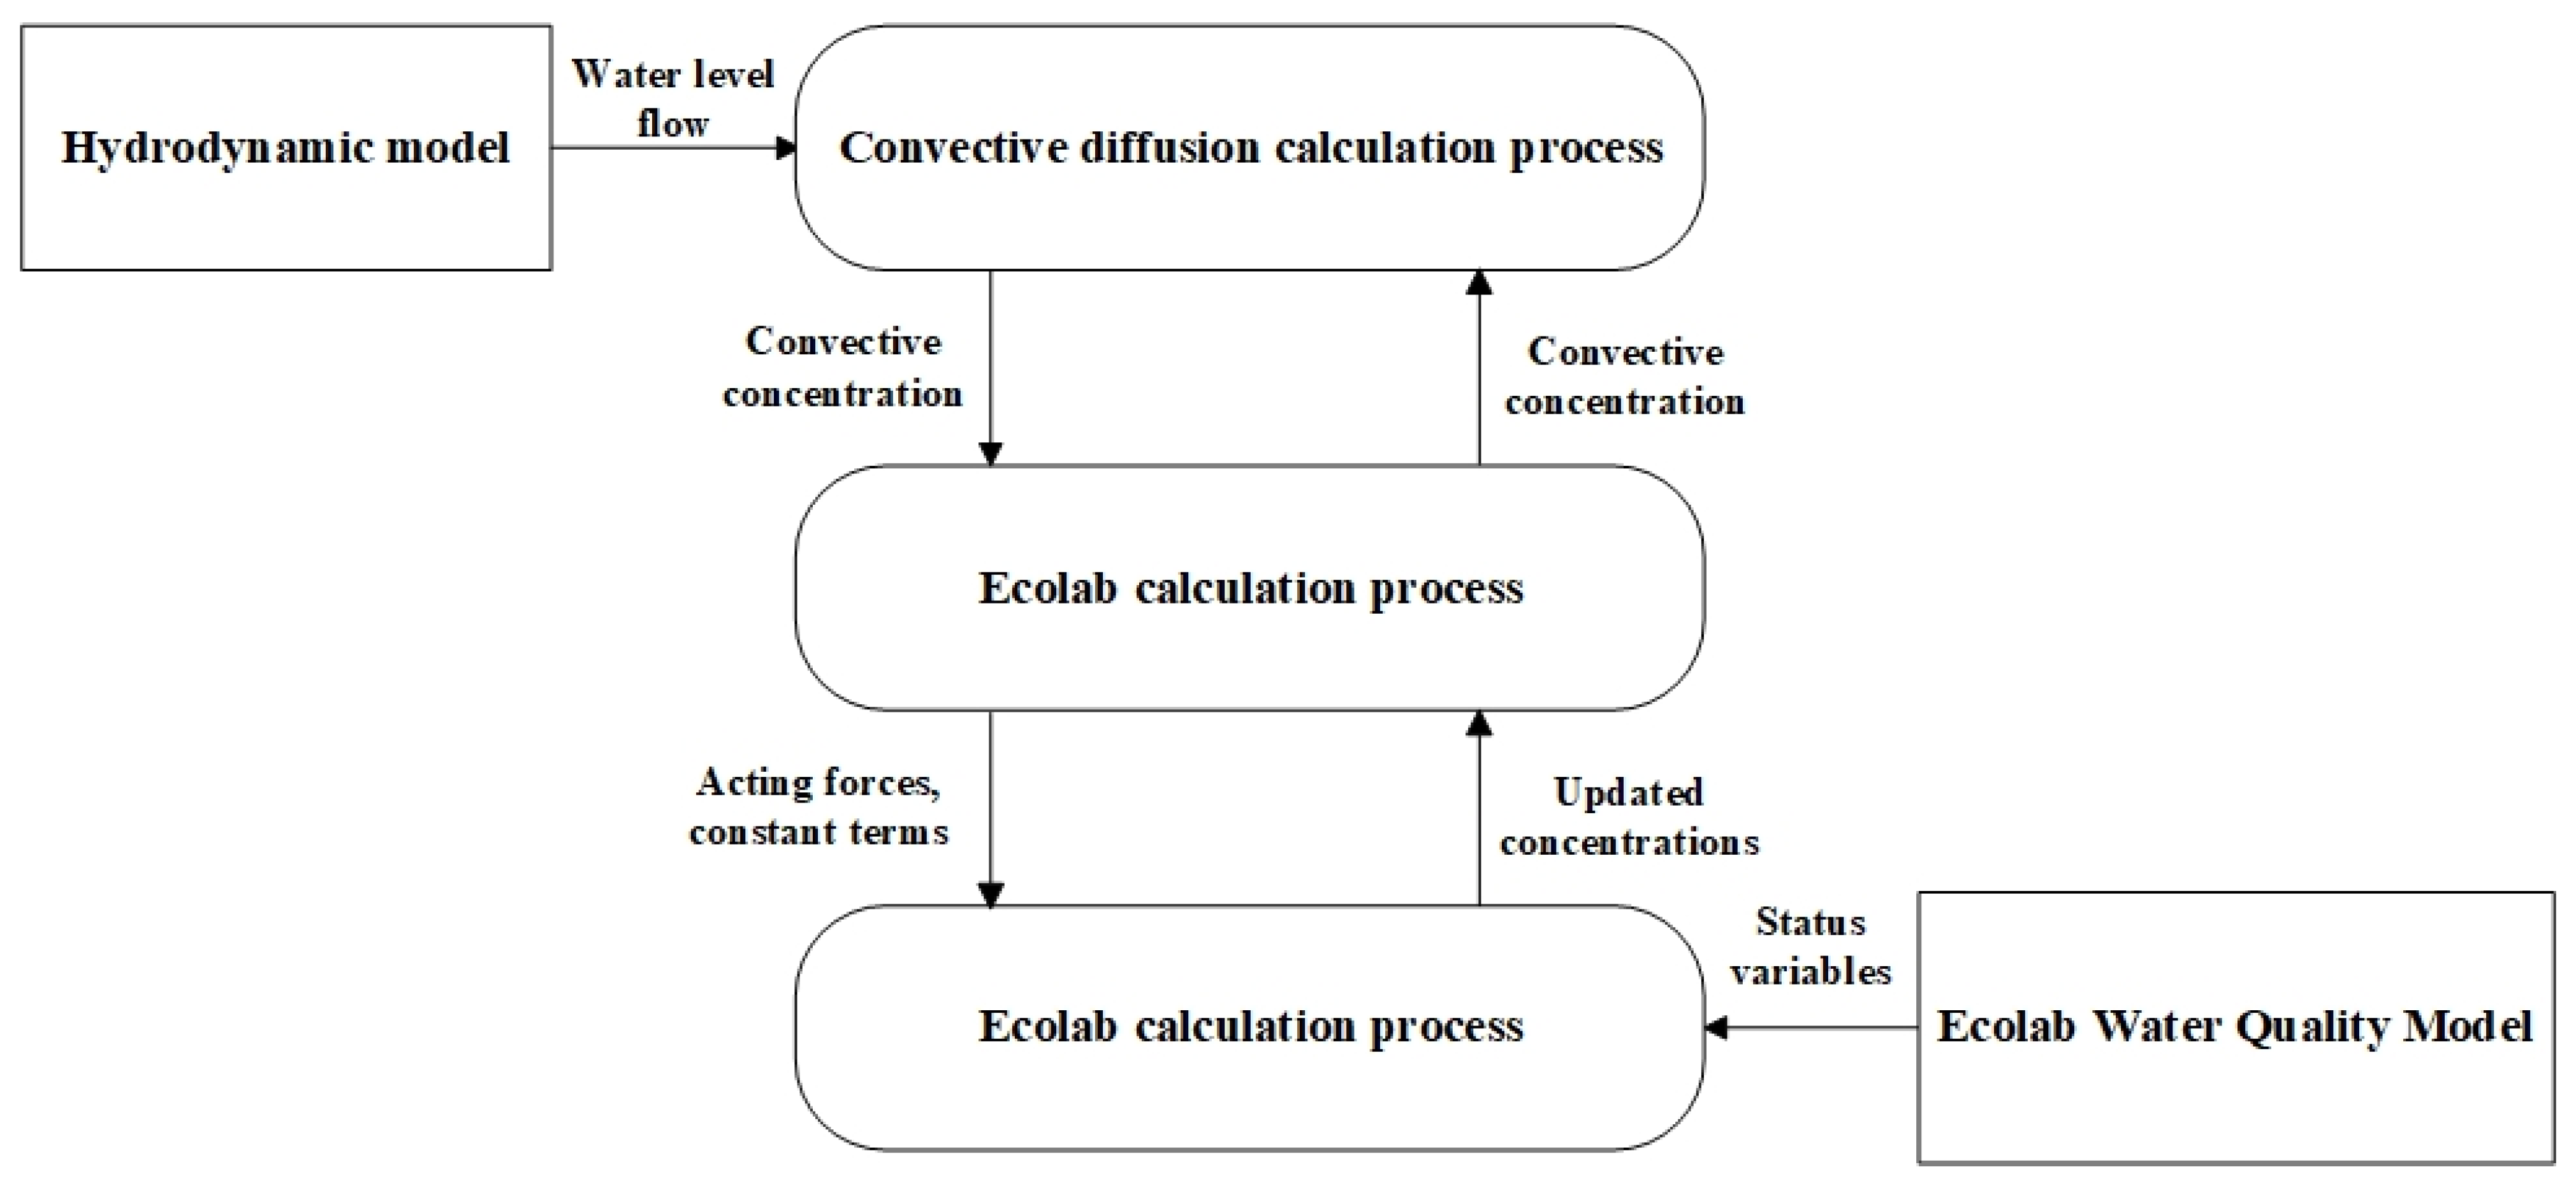
To perform the calculations in Ecolab, the Ecolab COM component is used, which is versatile and can be used with various DHI hydrodynamic model systems. In the simulation process, the model system initially simulates the transport diffusion of the convective state variables according to hydrodynamic principles, which are then integrated over a unit time step. The Ecolab COM component then solves for the value of each expression using the loaded initial or updated concentration, the associated parameters, or the constants, and the force functions. It integrates for each time step and returns the updated concentration values to the hydrodynamic model system to start the next time step. The Ecolab calculation flow is shown in Figure 2.

3.3. Based on the MIKE21 Coupled Hydrodynamic–Hydraulic Model

Affected by complex topographic and geomorphological conditions, as well as climate and human interference, the Bai River has been suffering from the problem of water environment pollution [24]. Based on the systematic analysis of the current situation of water resources and water environment in the Bai River, this paper constructs a coupled hydrodynamic–water-quality model of the Bai River based on MIKE21 software version 2014, and its simulation process diagram is shown in Figure 3.

4. Model Construction

4.1. Model Construction

4.1.1. Grid Division

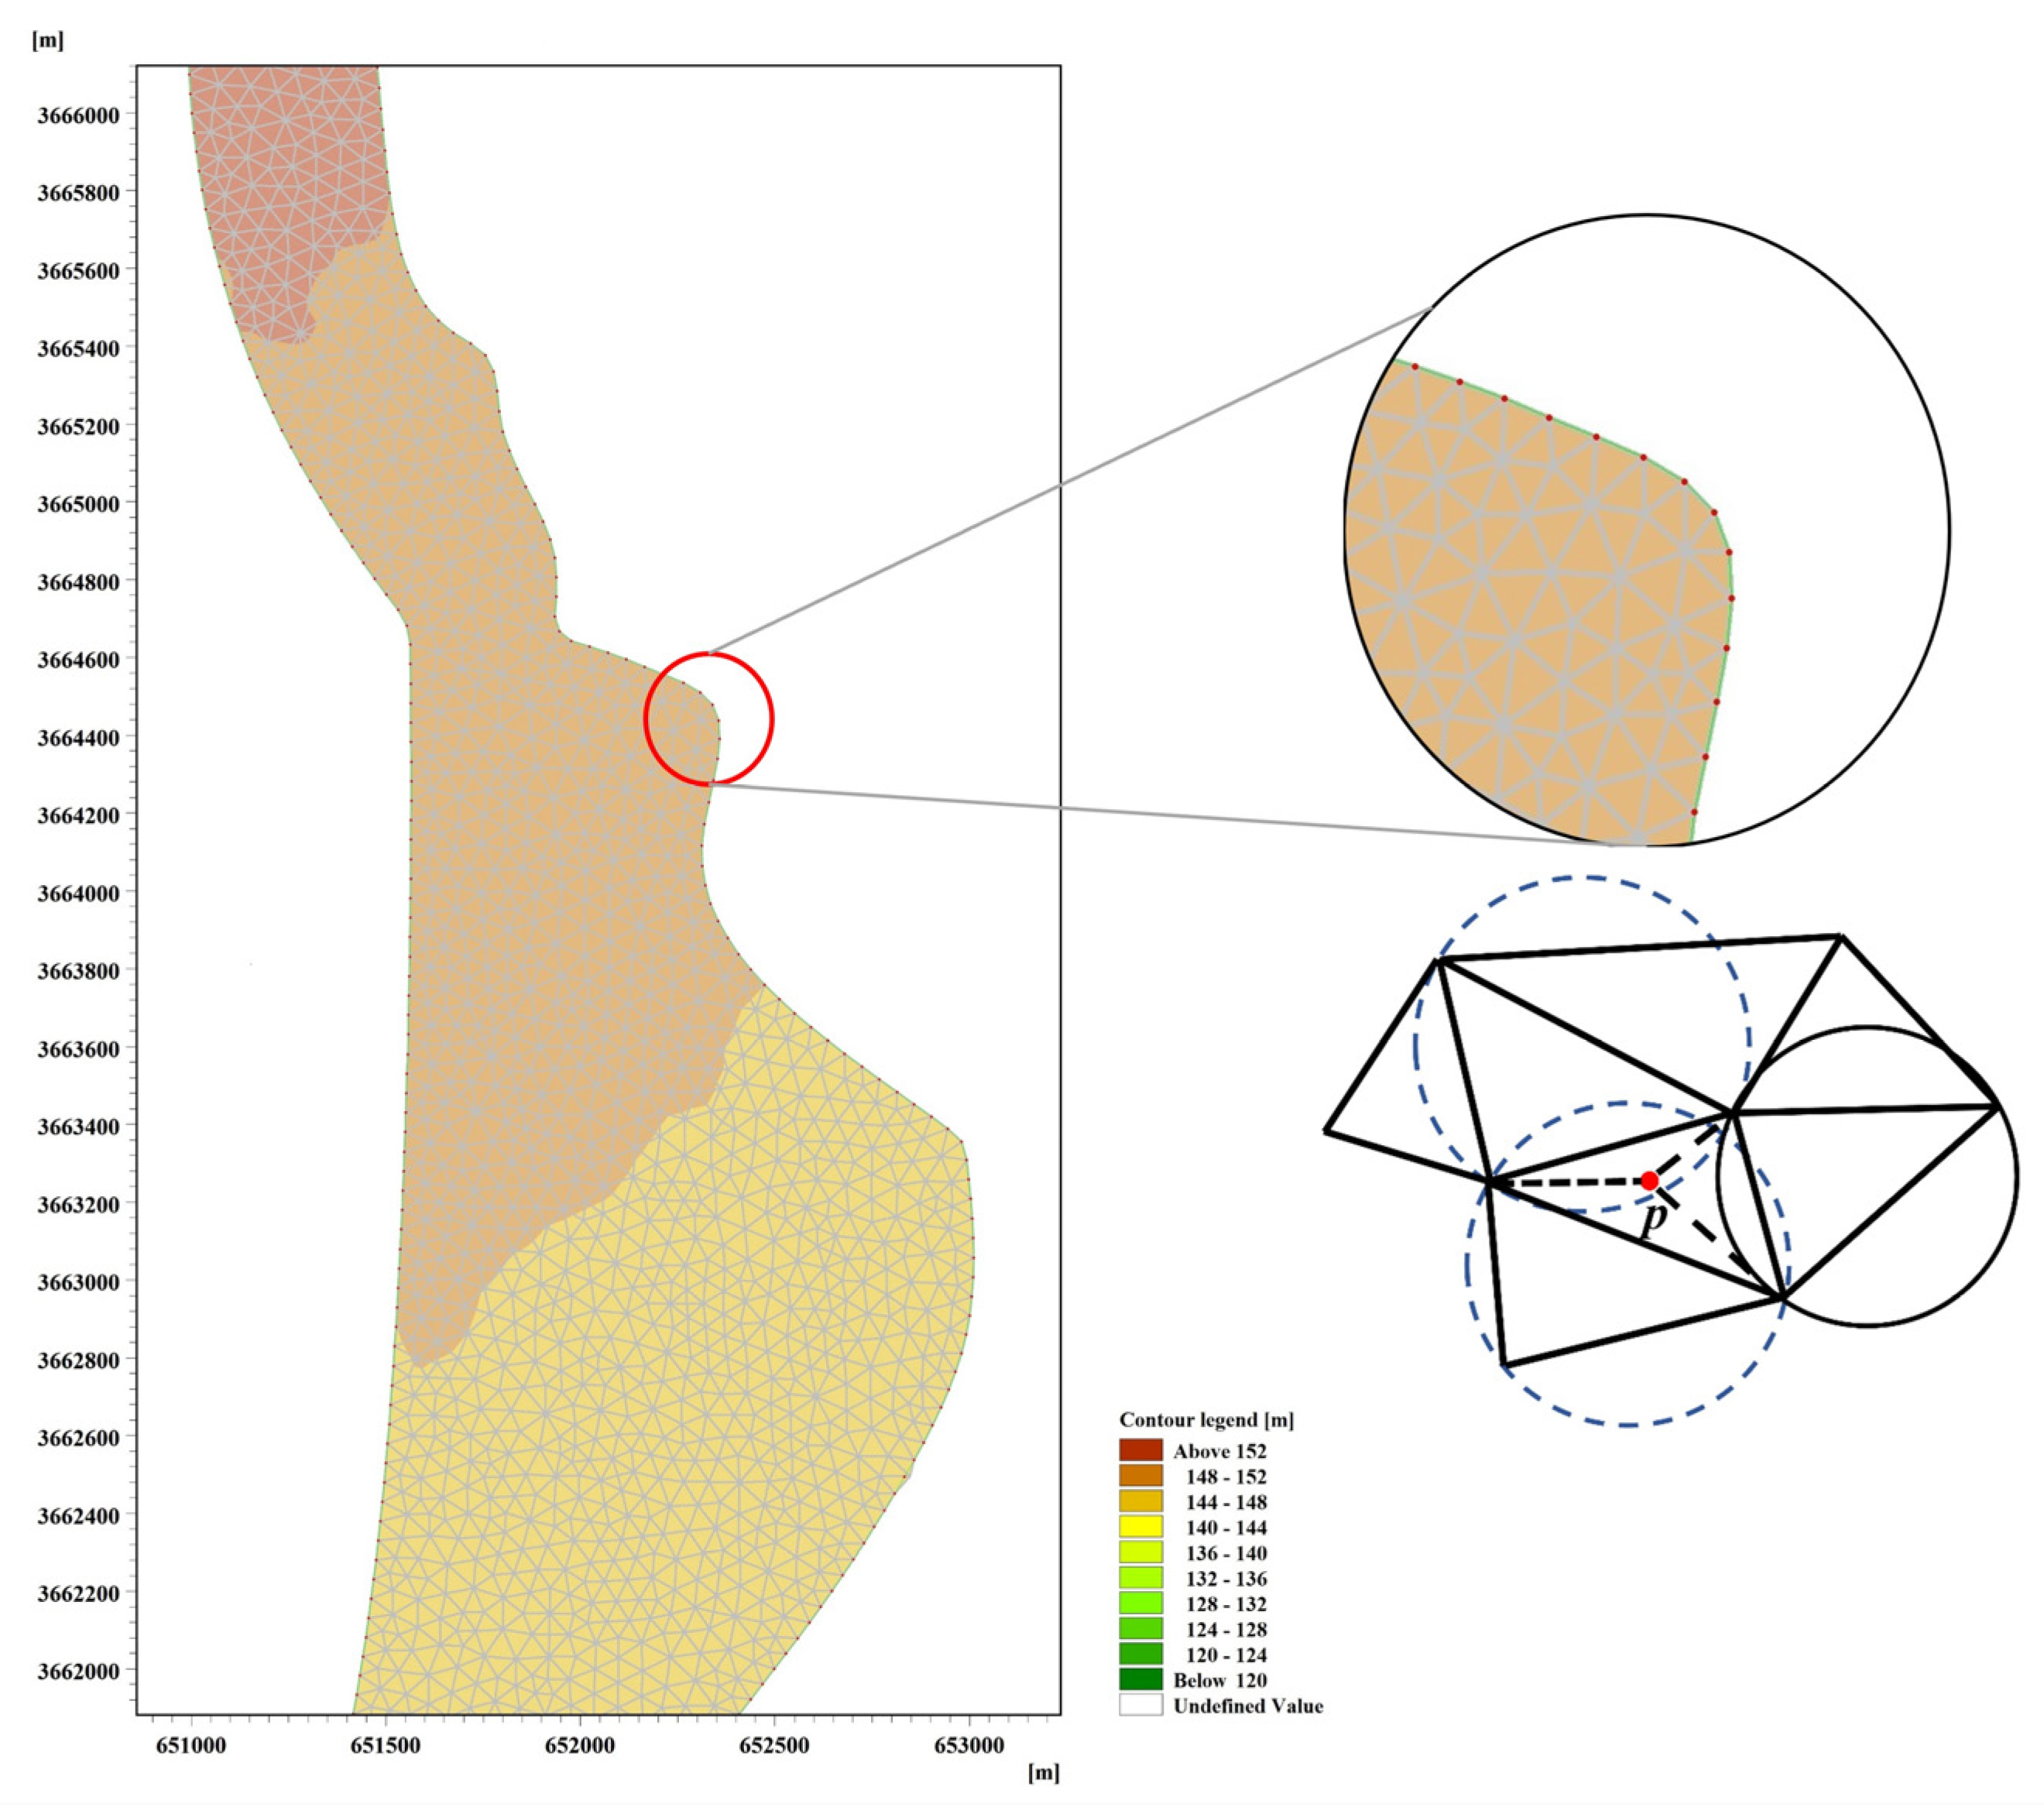
The quality of the mesh is the key to the quality of the model. Quadrilateral mesh is suitable for objects with regular shape and simple structure, and triangular mesh is used in this simulation. A total of 7608 nodes and 13,775 grids were generated for this simulation grid. Too few meshes result in an unstable mesh structure, while too many result in some of the mesh angles being too small. Using the LOP mesh optimization theory of the Delaunay mesh criterion, the mesh debugging tool was used to make local algorithmic modifications to meshes that did not meet the computational geometry criterion and took longer to compute, improving the accuracy of the model [25]. The results of the LOP optimized meshing are shown in Figure 4.

4.1.2. Boundary Conditions

The Cham Tau Barrage at approximately 5.26 km above the cross-section of the South–North Water Transfer and the Bai River was selected as the starting boundary for this simulation, with a channel width of approximately 408 m. The South–North Water Transfer Central Project uses an inverted siphon project when crossing the junction of the Bai River. The project has a retreat gate upstream of the trunk line to implement ecological recharge to the Bai River through the retreat gate; therefore, an inlet of approximately 54 m wide is set up at this cross-section as the starting boundary of Bai River hydrodynamic model 2. The Nanyang Upper Fanying section was set as the termination boundary. The location of the Bai River boundary is shown in Figure 5. The initial conditions for the MIKE21 hydrodynamic model include water level and flow velocity in the river, with different initial values used for different spatial locations. In addition, this simulation also uses a hot start, which means that the results of the previous simulation are used as the initial conditions for the next simulation, and this iterative algorithm helps to improve the speed and accuracy of the model’s operations [26].

4.1.3. Parameter Settings

The establishment and efficient operation of the model requires the setting of reasonable model parameters. The simulation time step is 86,400 s, that is, 1 day, and the year 2020 is chosen as the status quo level year, with a total of 366 steps; the dry water depth of the model is h d r y = 0.005 m, the inundation water depth is h f l o o d = 0.05 m, and the wet water depth is h w e t = 0.1 m. Through multiple rate determination, the range of riverbed roughness at the center of the river channel is limited to 0.025~0.04 [27]; the precipitation and evaporation time series and wind field conditions were adopted from the Nanyang meteorological station in 2020. The model parameter settings after rate setting are shown in Table 1 below.

4.2. Water-Quality Assessment Criteria and Results

A combination of five water-quality indicators commonly used in surface water environmental models, namely DO (dissolved oxygen), COD (chemical oxygen demand), CODMn (permanganate index), NH3-N (ammonia nitrogen), and TP (total phosphorus), were selected as the state variables for this Ecolab module of the Bai River water environment simulation [28]. The evaluation standard uses the Surface Water Environmental Quality Standard (GB3838-2002).
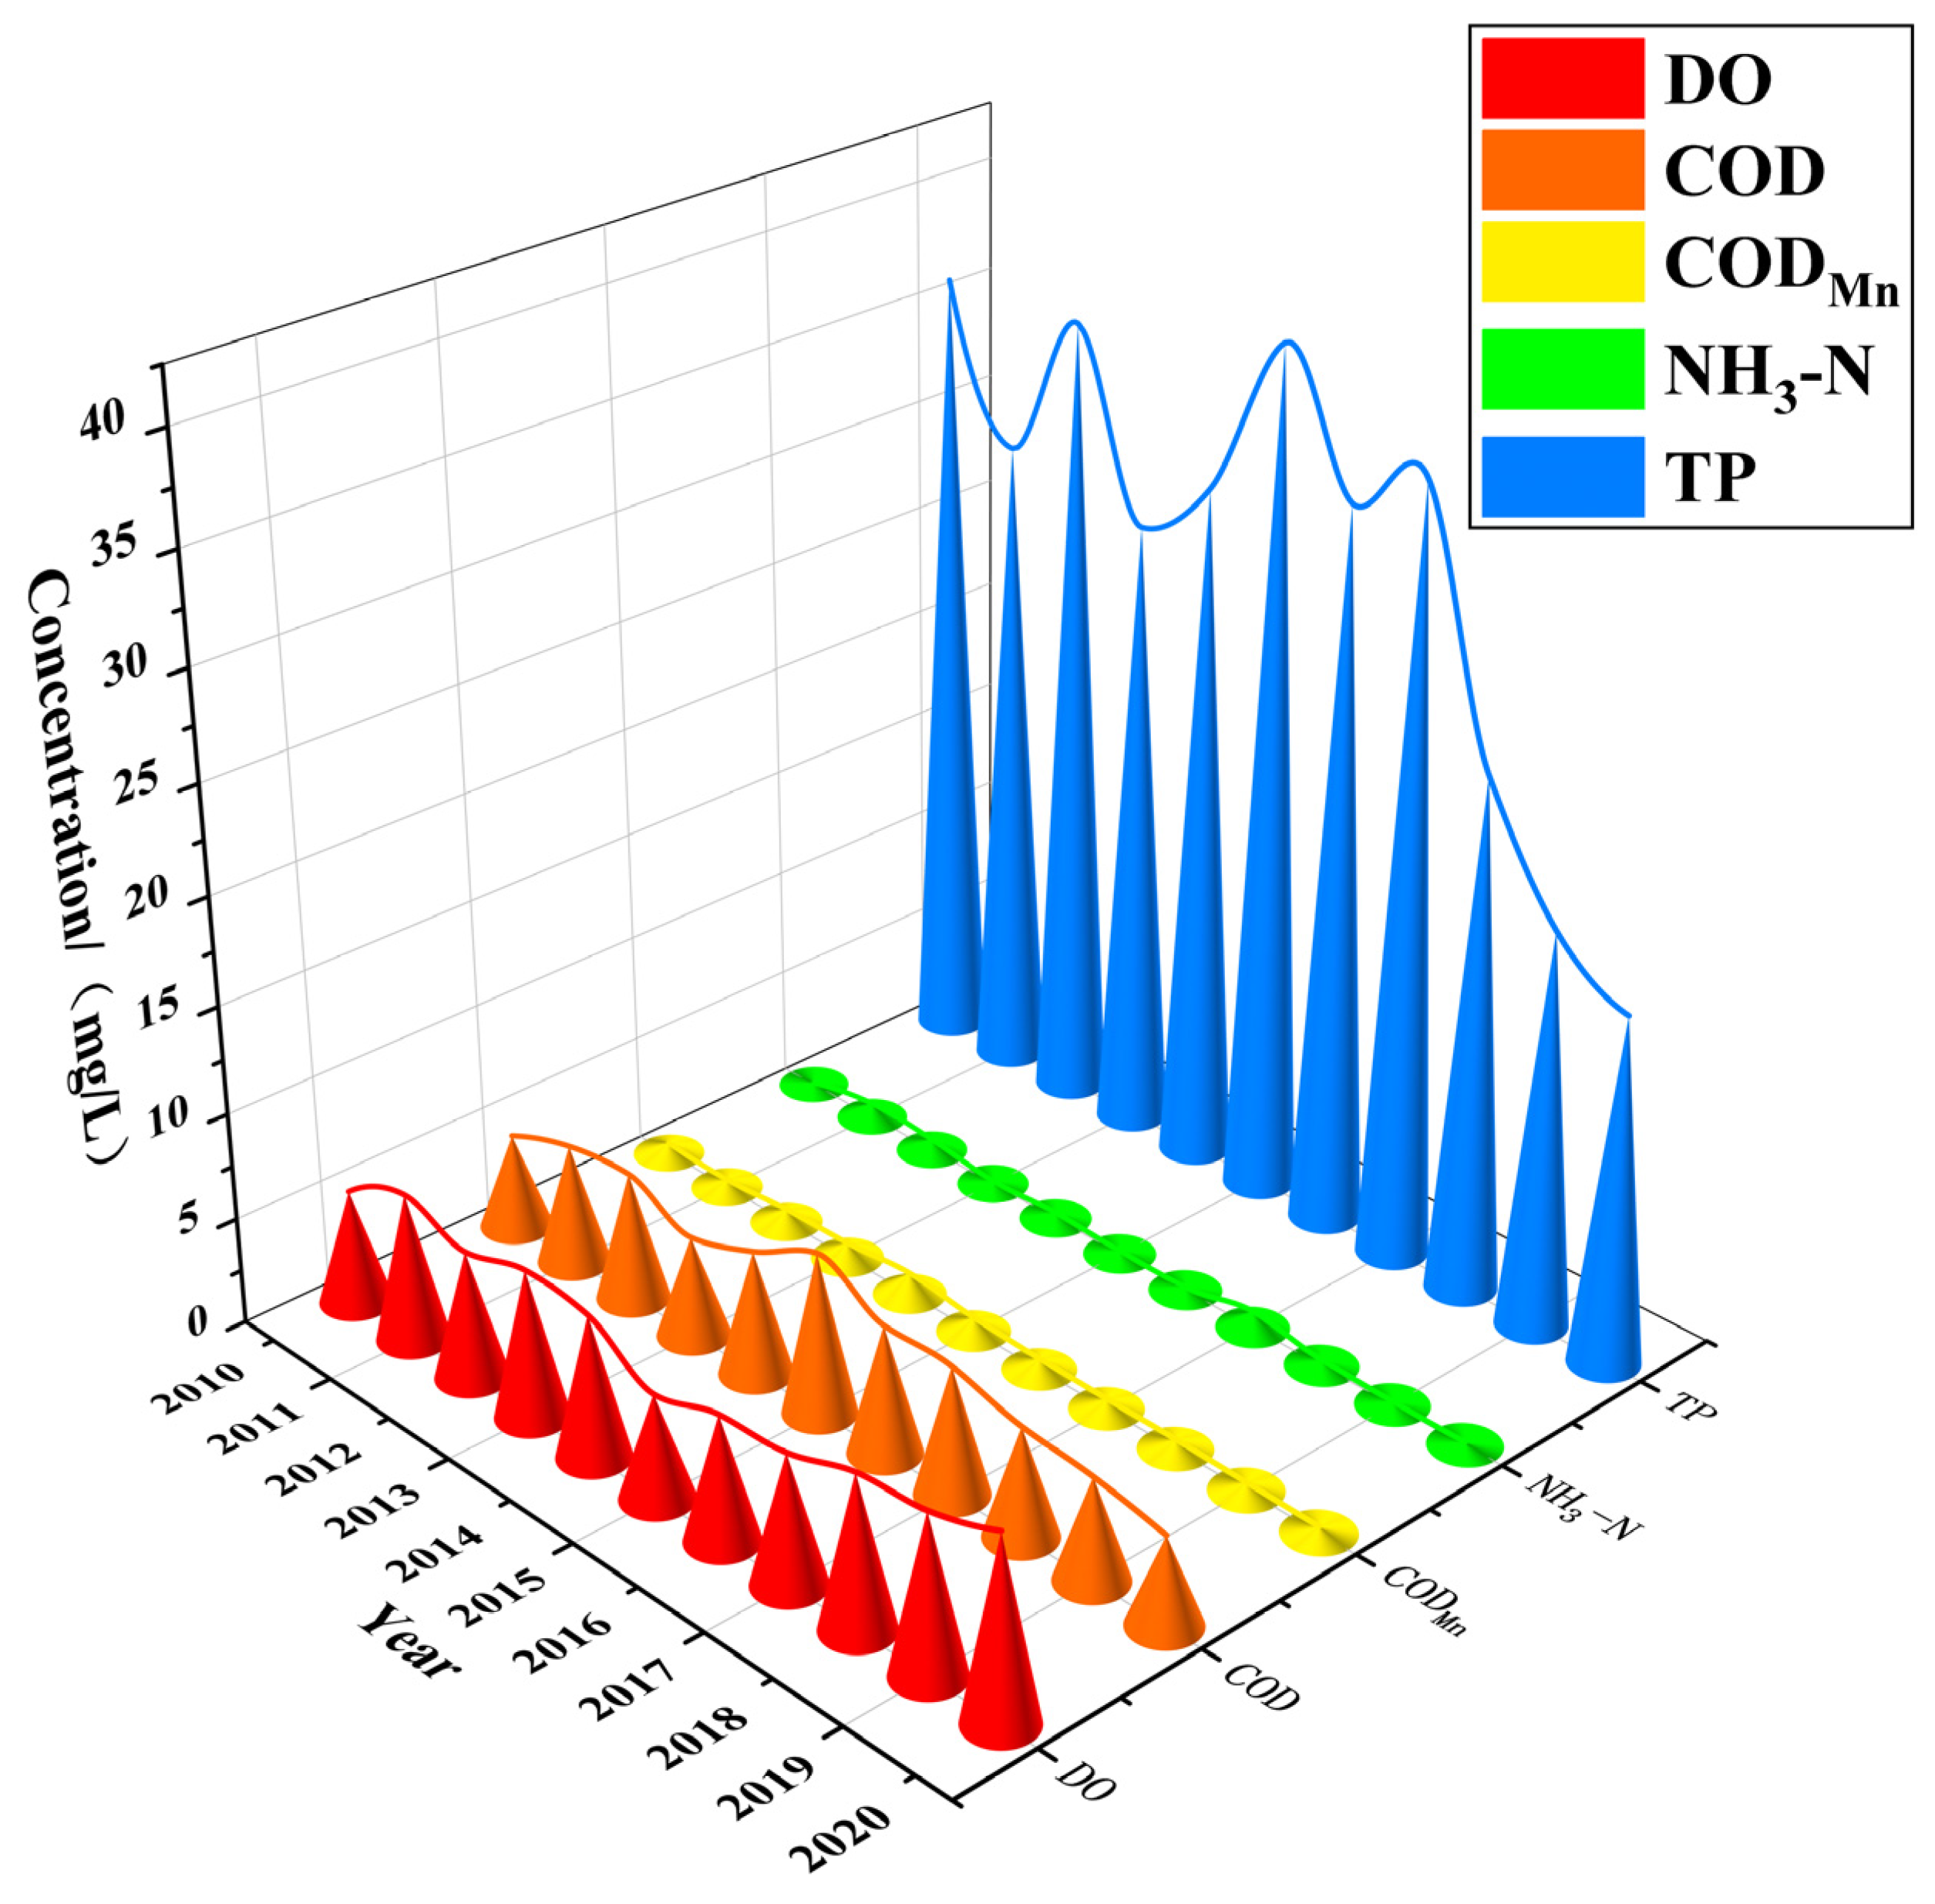
This study selected water-quality monitoring data from 2010 to 2020 from the upper Fanying section in Nanyang for evaluation, and the changes in each water-quality indicator over time are shown in Figure 6, and the evaluation results of the single-factor evaluation method [29] are shown in Table 2.
As can be seen from Figure 3, dissolved oxygen (DO) is highly volatile with an overall upward trend. Chemical oxygen demand (COD) shows an overall decreasing trend, with higher concentrations between 2008 and 2018, and the permanganate index (CODMn) shows some fluctuations, but the overall level is consistently between 4 and 8 mg/L. It has fallen sharply and been at a low level since 2018. The overall pattern of ammonia nitrogen (NH3-N) shows an upward and then a downward trend, with the peak occurring in 2014, after which it has remained in a declining state. Total phosphorus (TP) fluctuates the most, with two extreme values occurring in 2011 and 2017, with the overall level remaining between grade III and V.

5. Results and Discussion

5.1. Model Validation

5.1.1. HD Model Validation

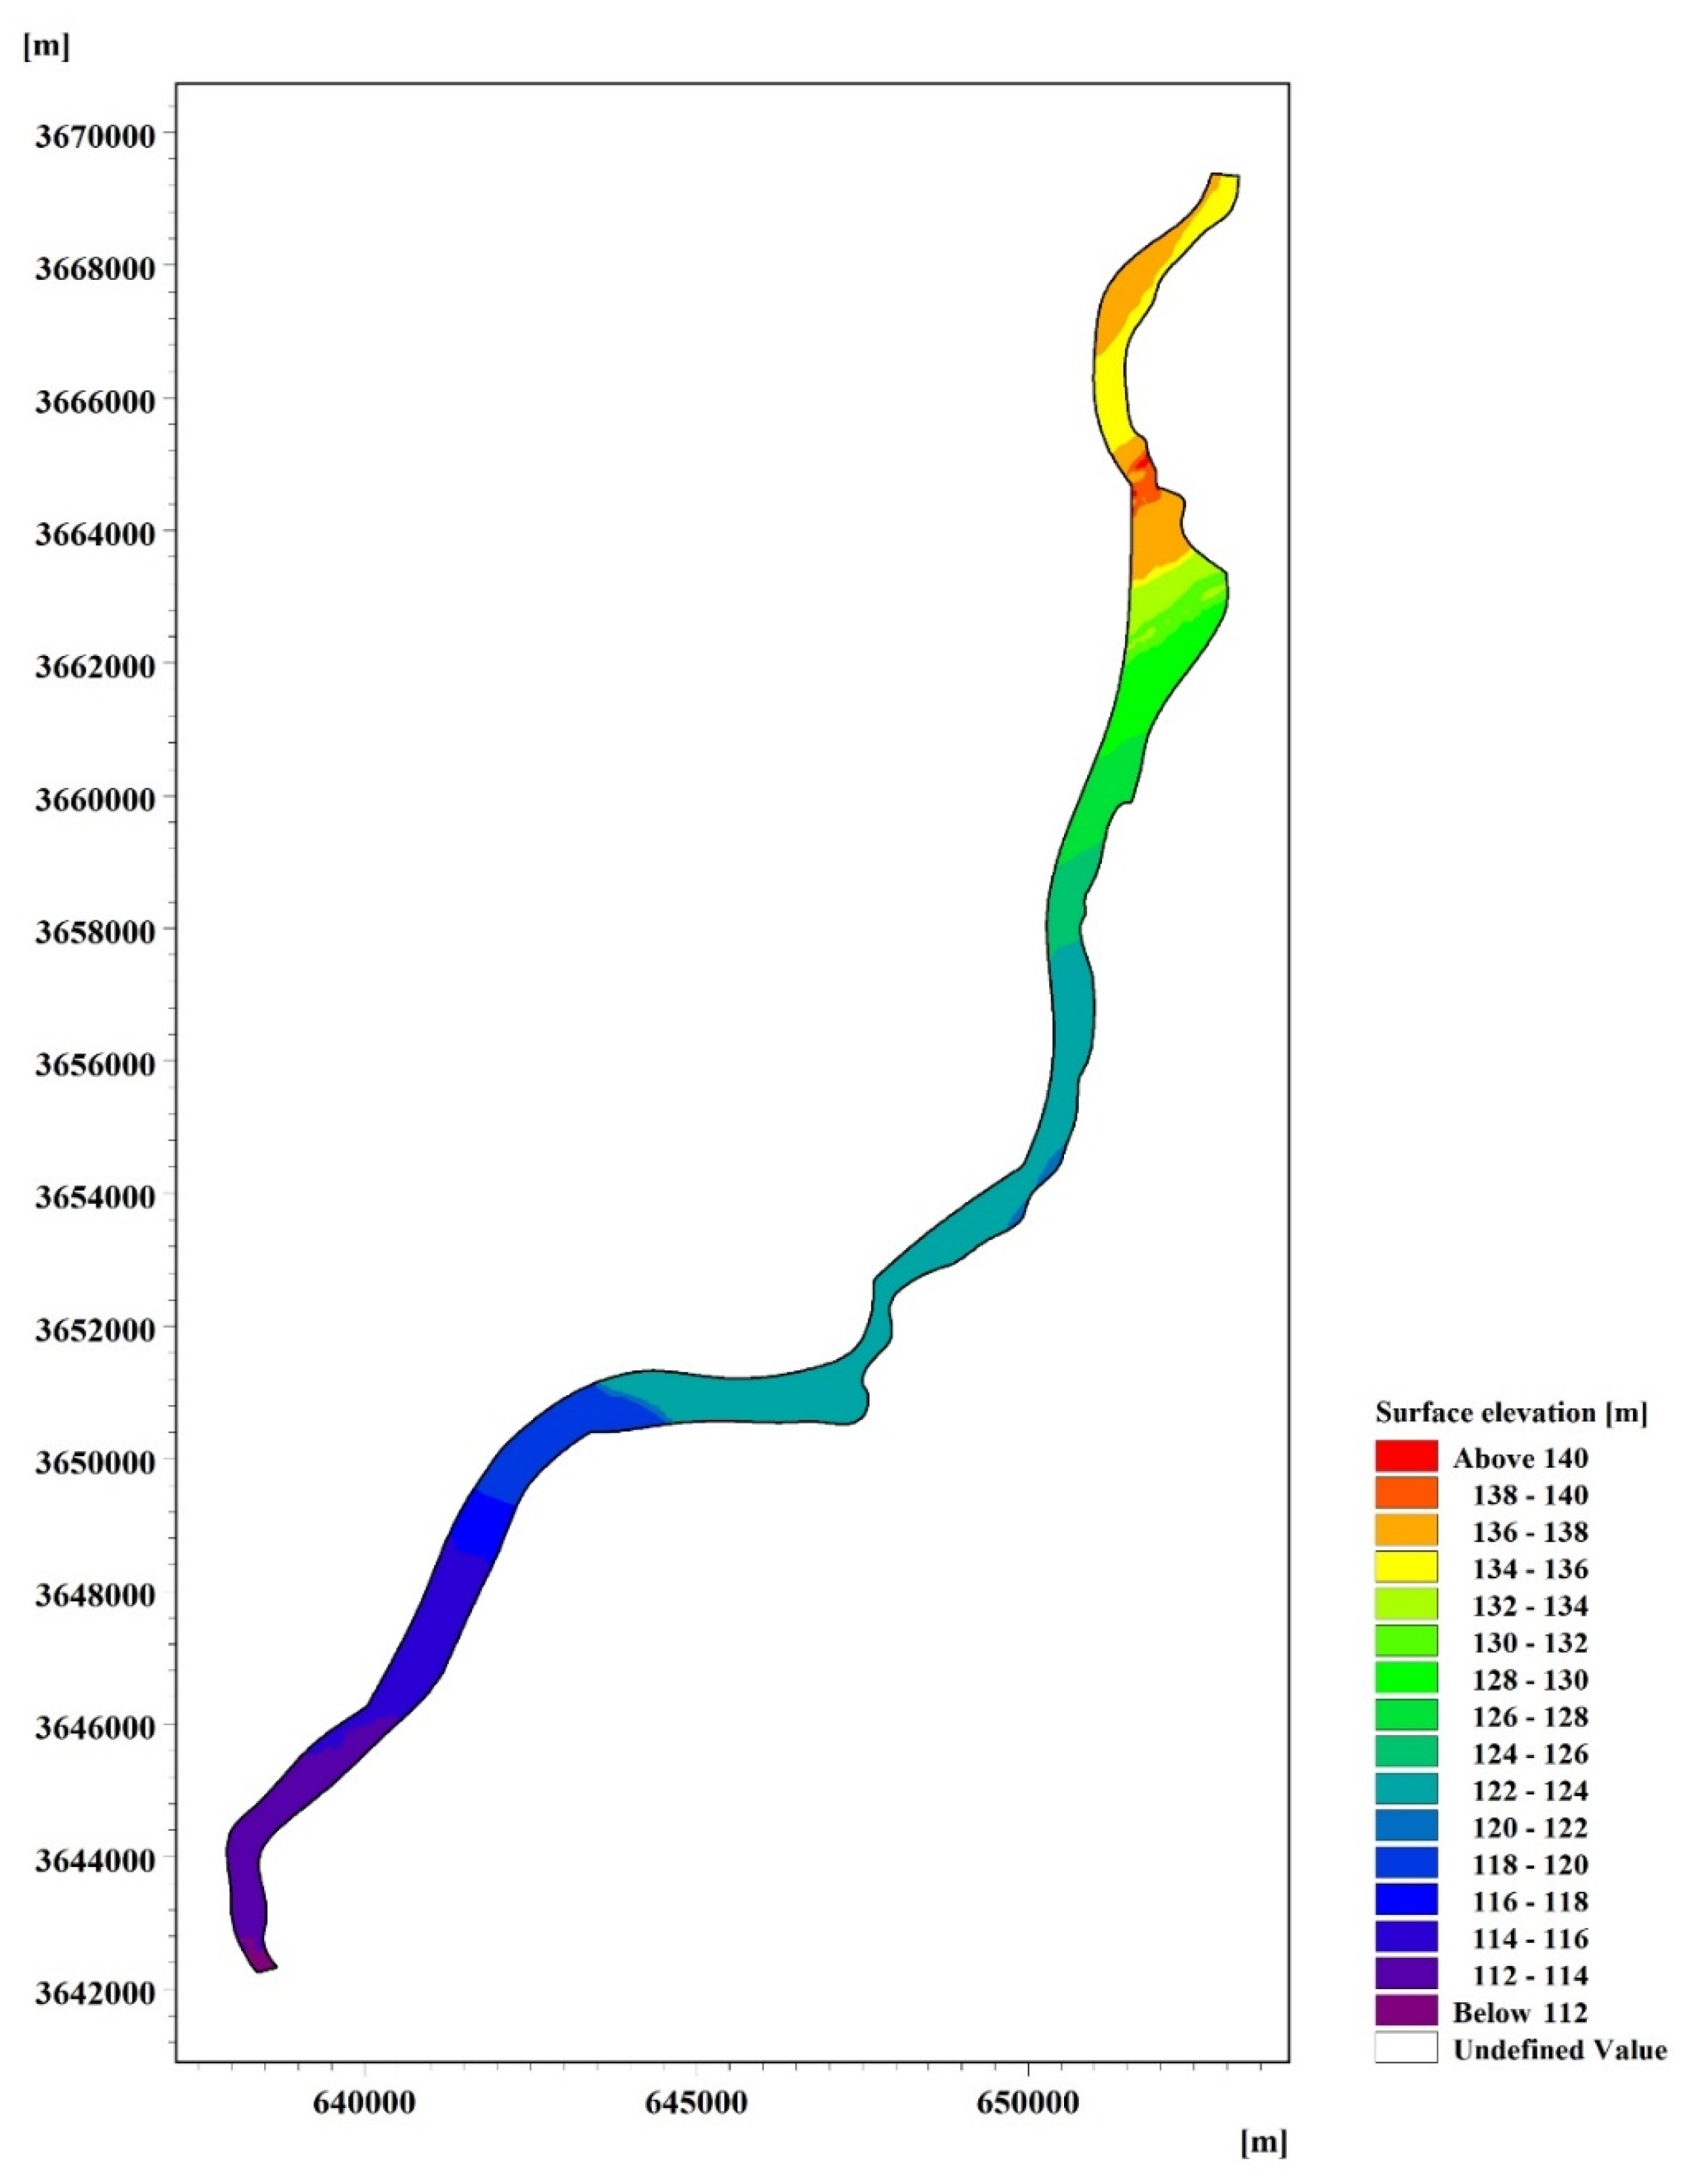
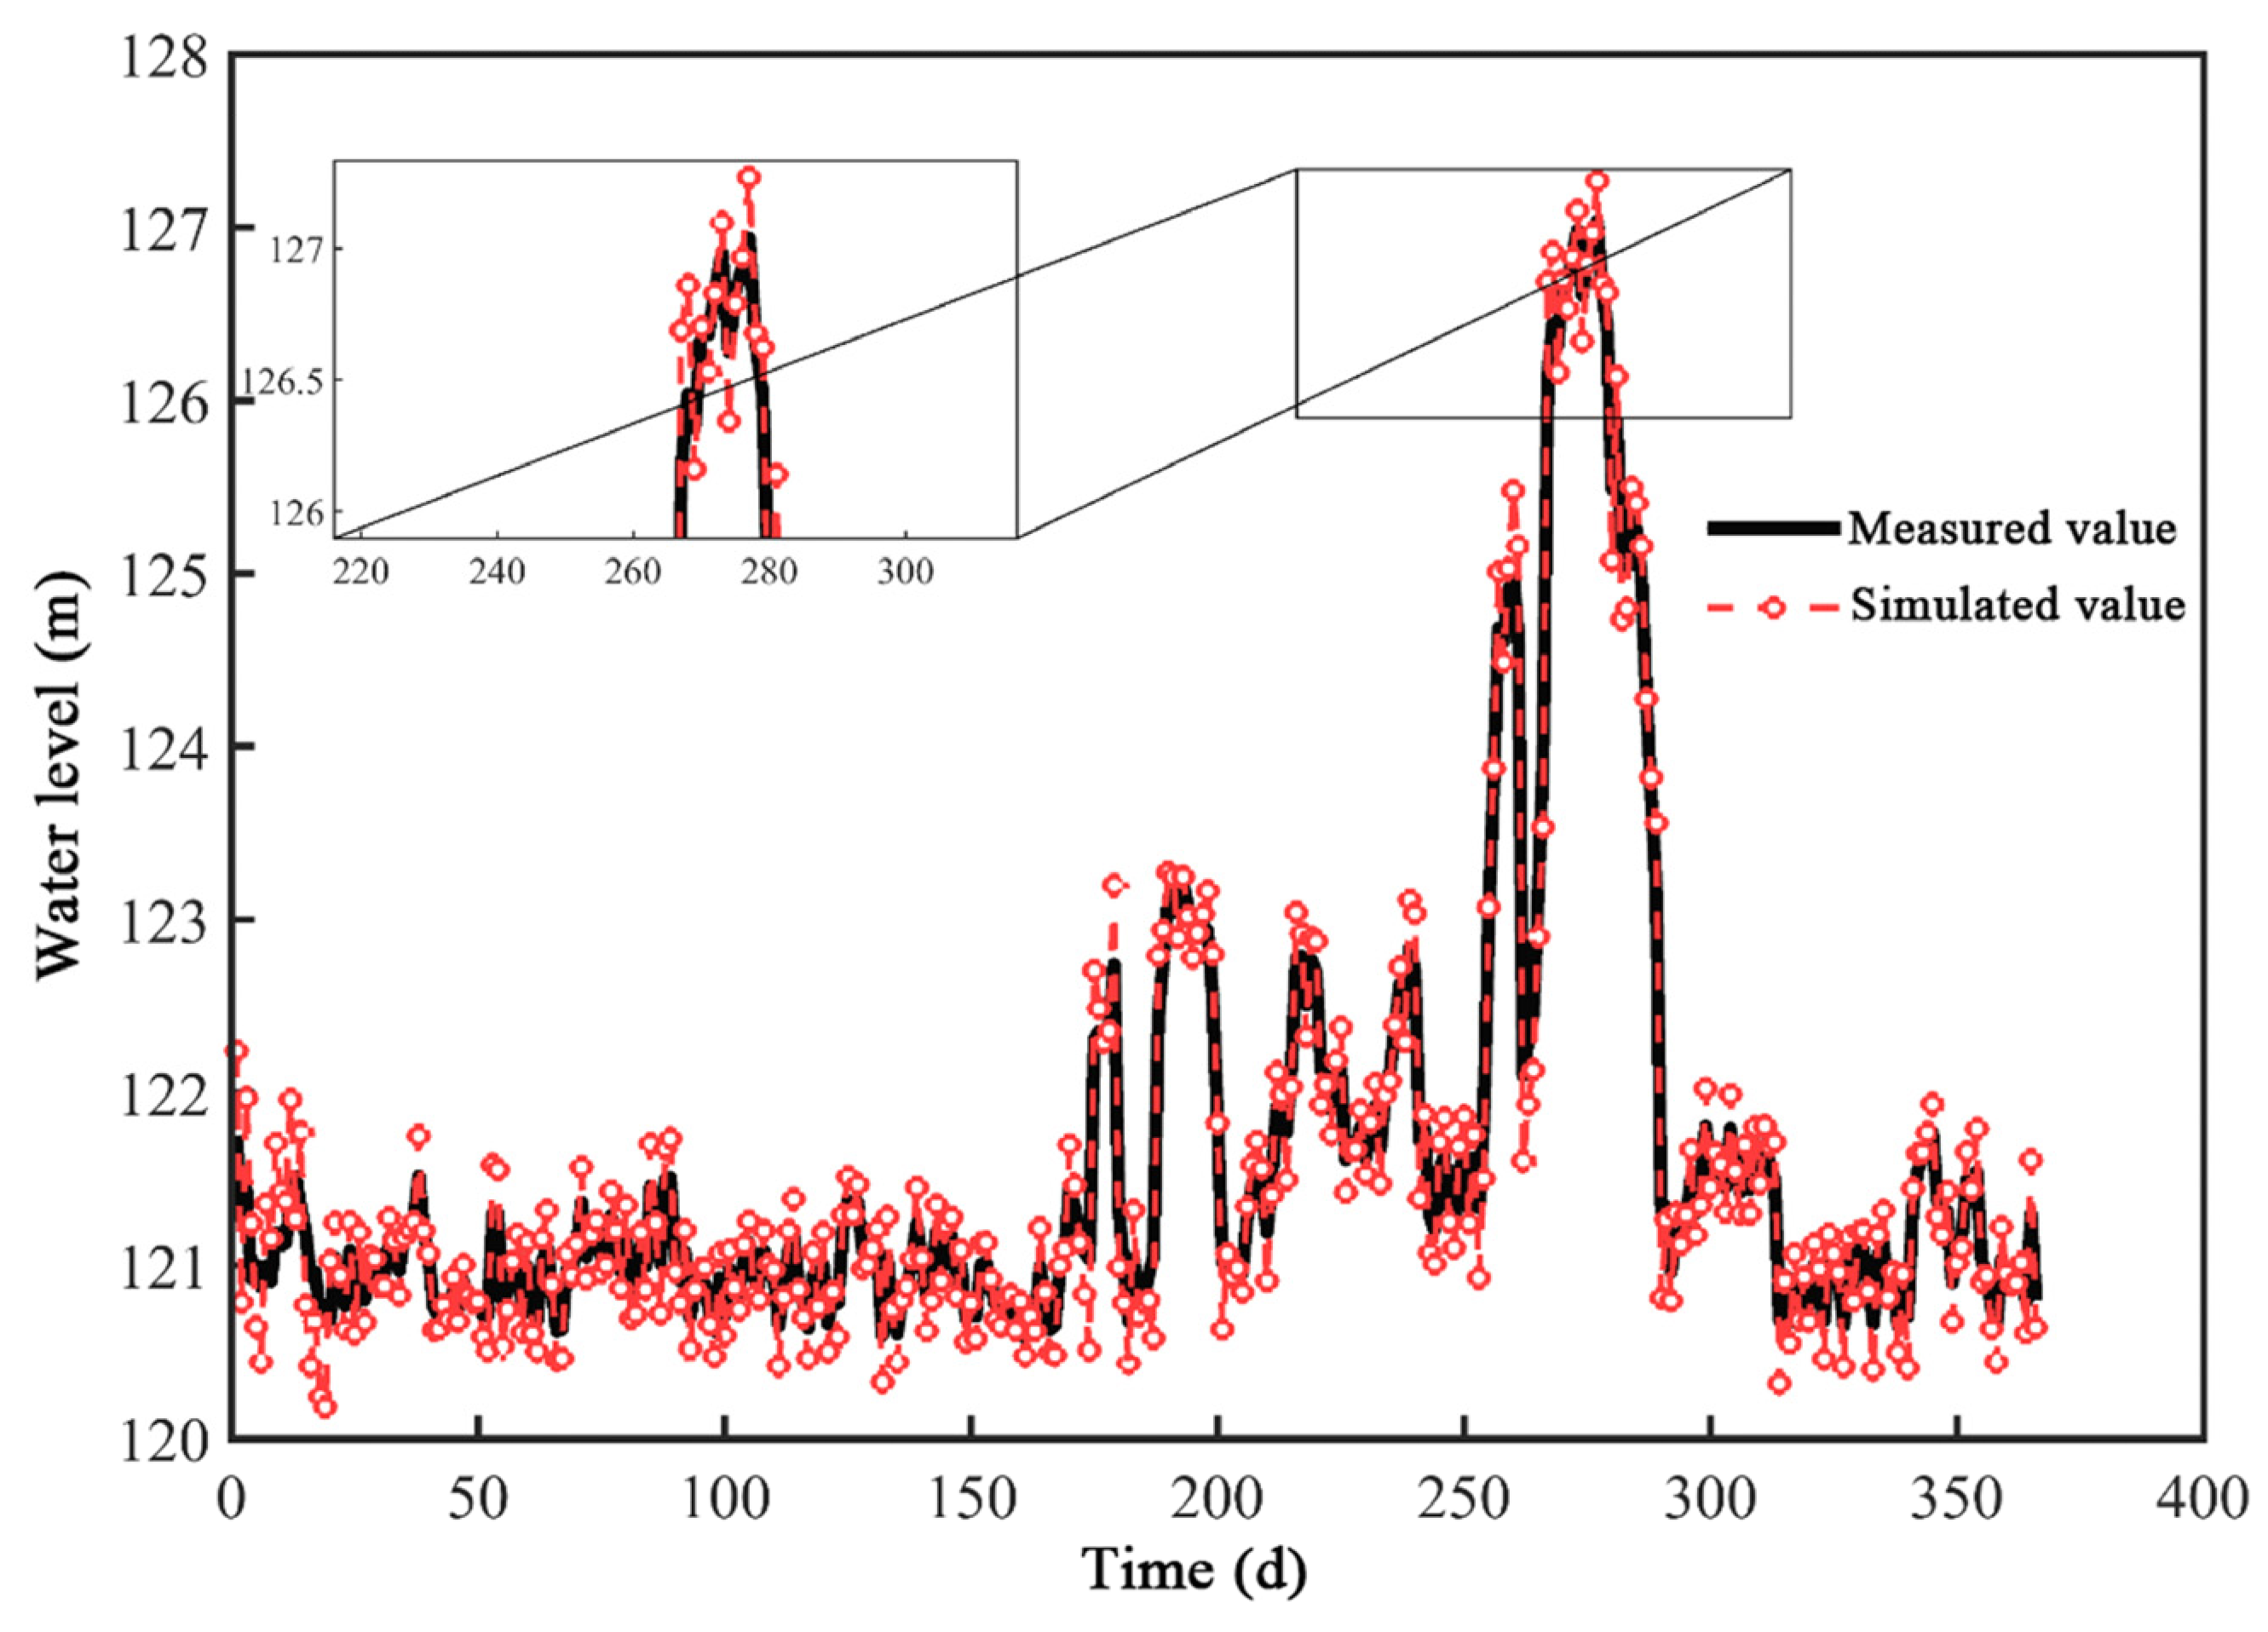
There are two hydrological monitoring stations in the study reach, namely Nanyang Penyao and Nanyang Shangfanying, with the Nanyang Penyao hydrological station in the upper reaches of the modelled reach close to the initial boundary of the model. The Shangfangying section is the termination section of the model. Therefore, the measured daily average water level time series data of 2020 at the two hydrological stations are selected as the model validation objects. The hydrodynamic model of water level validation for the simulated section of the Bai River is shown in Figure 7.
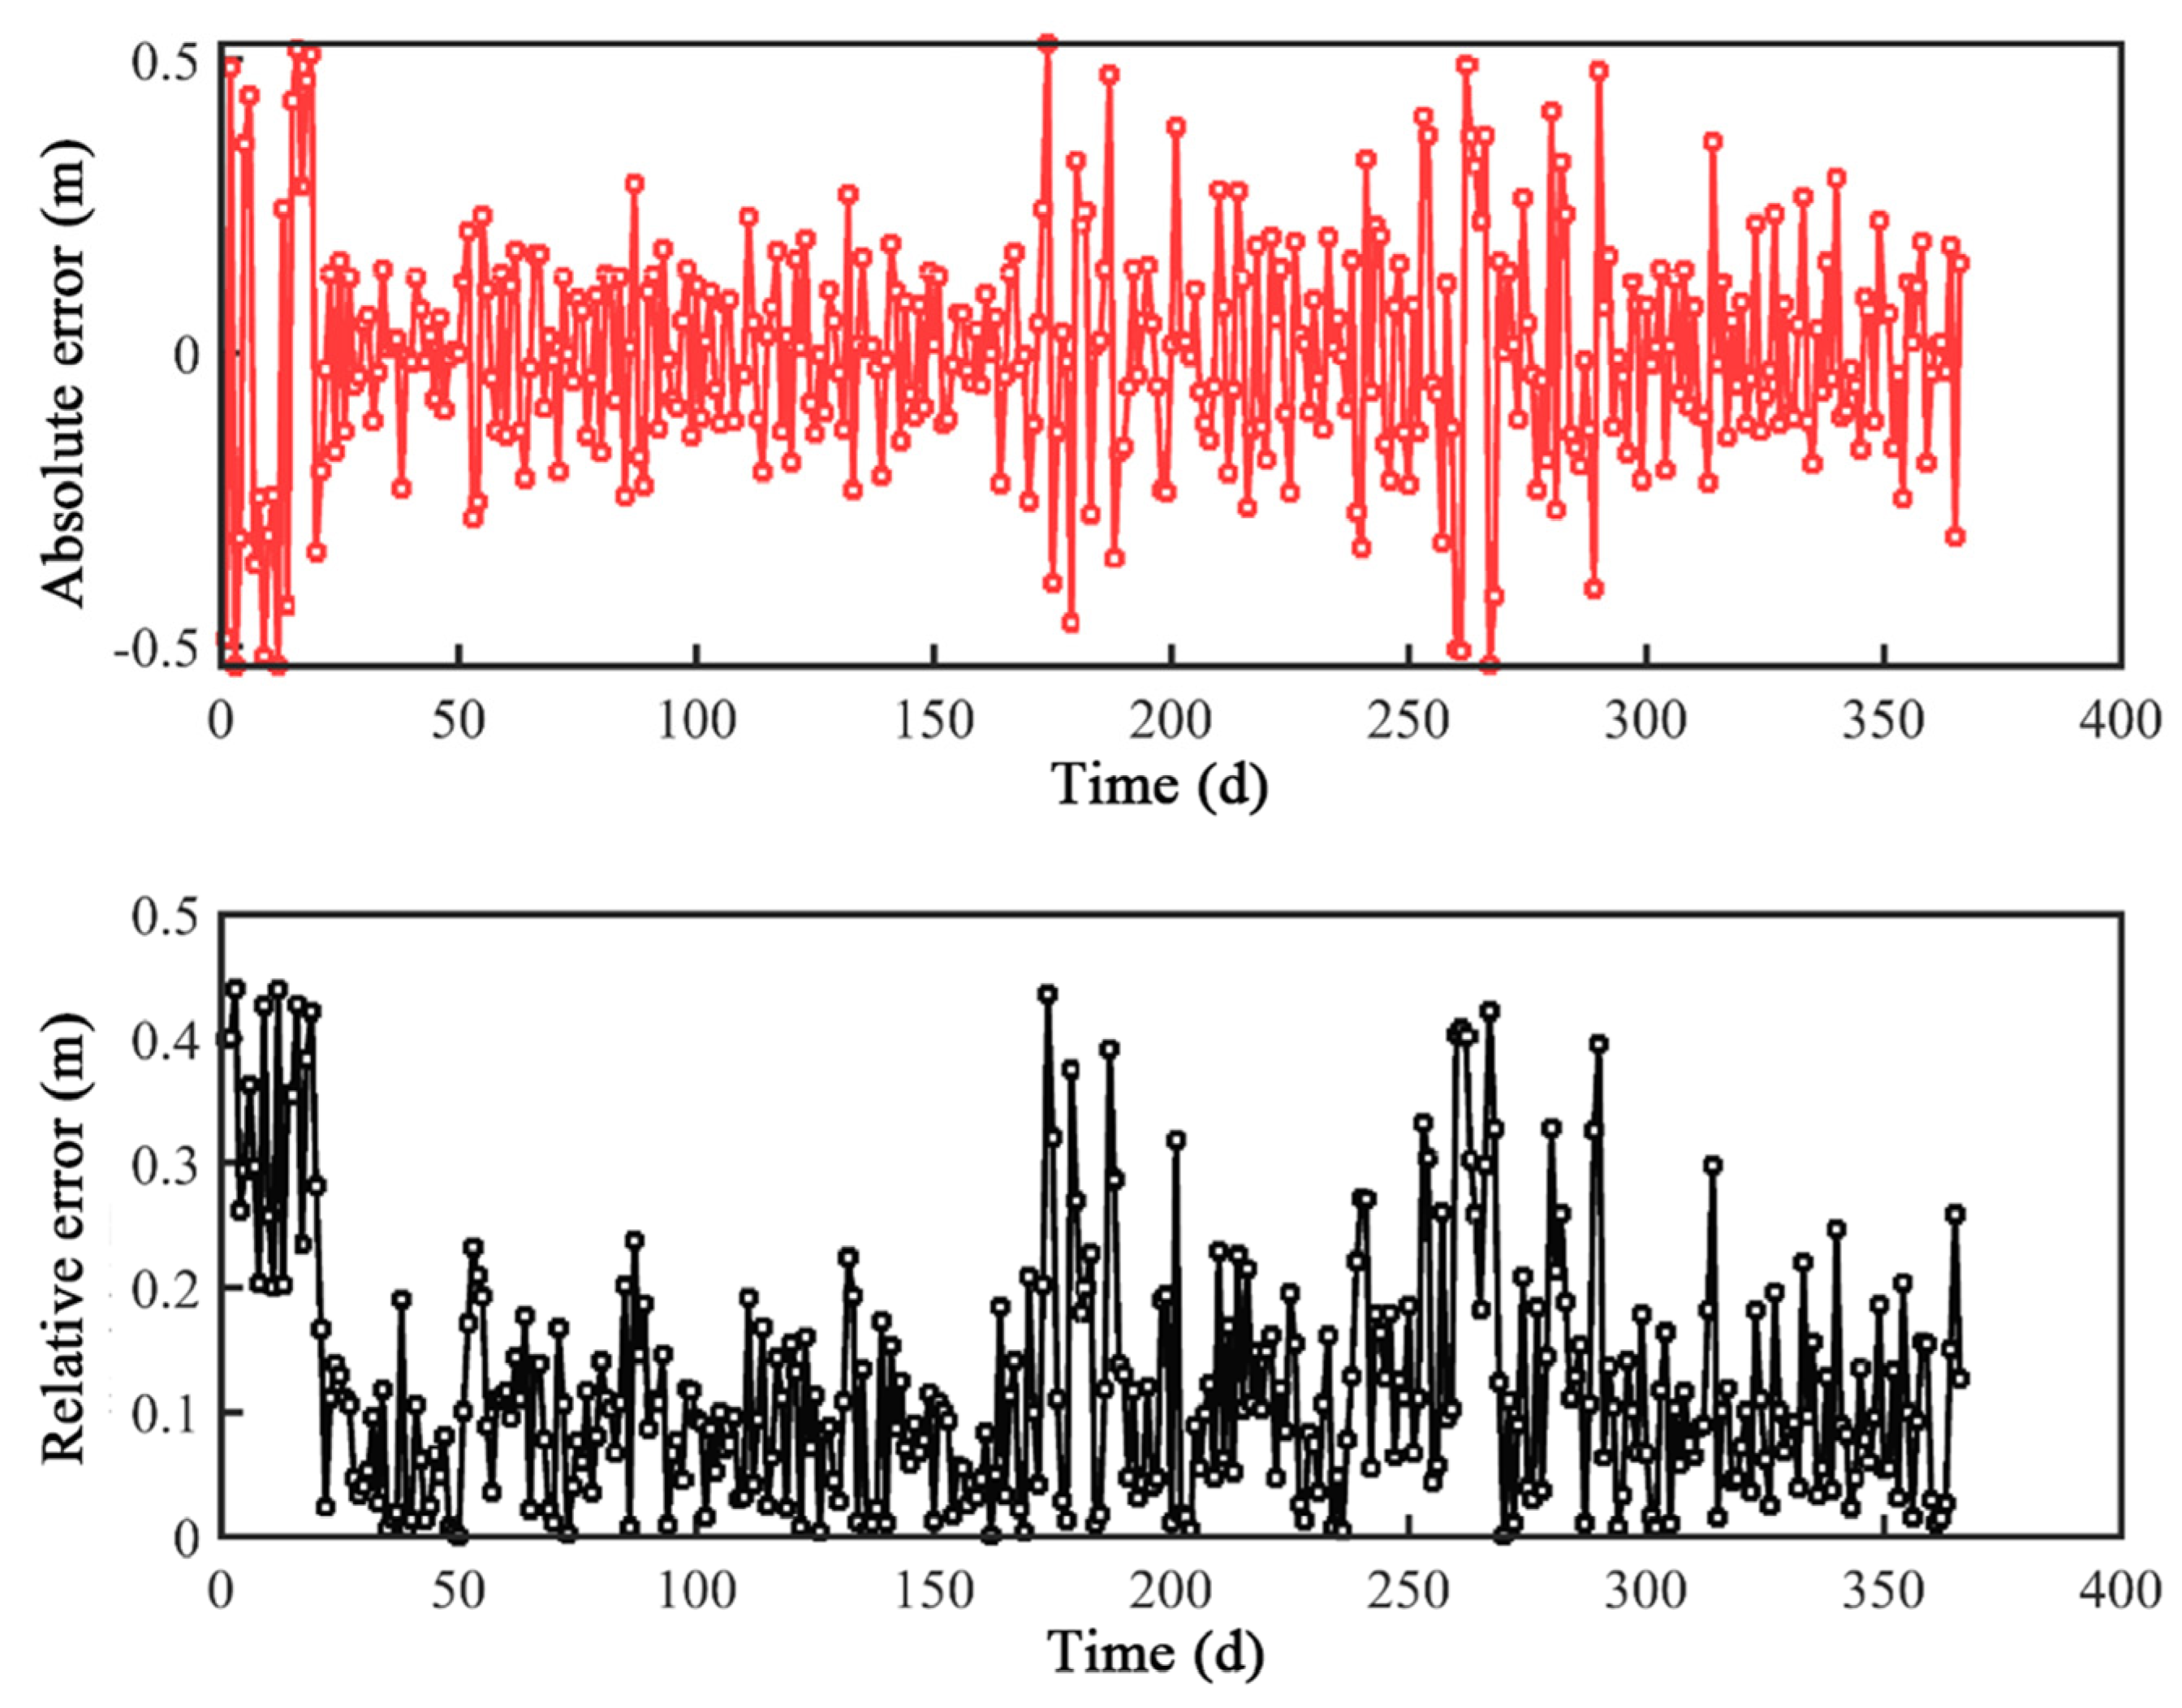
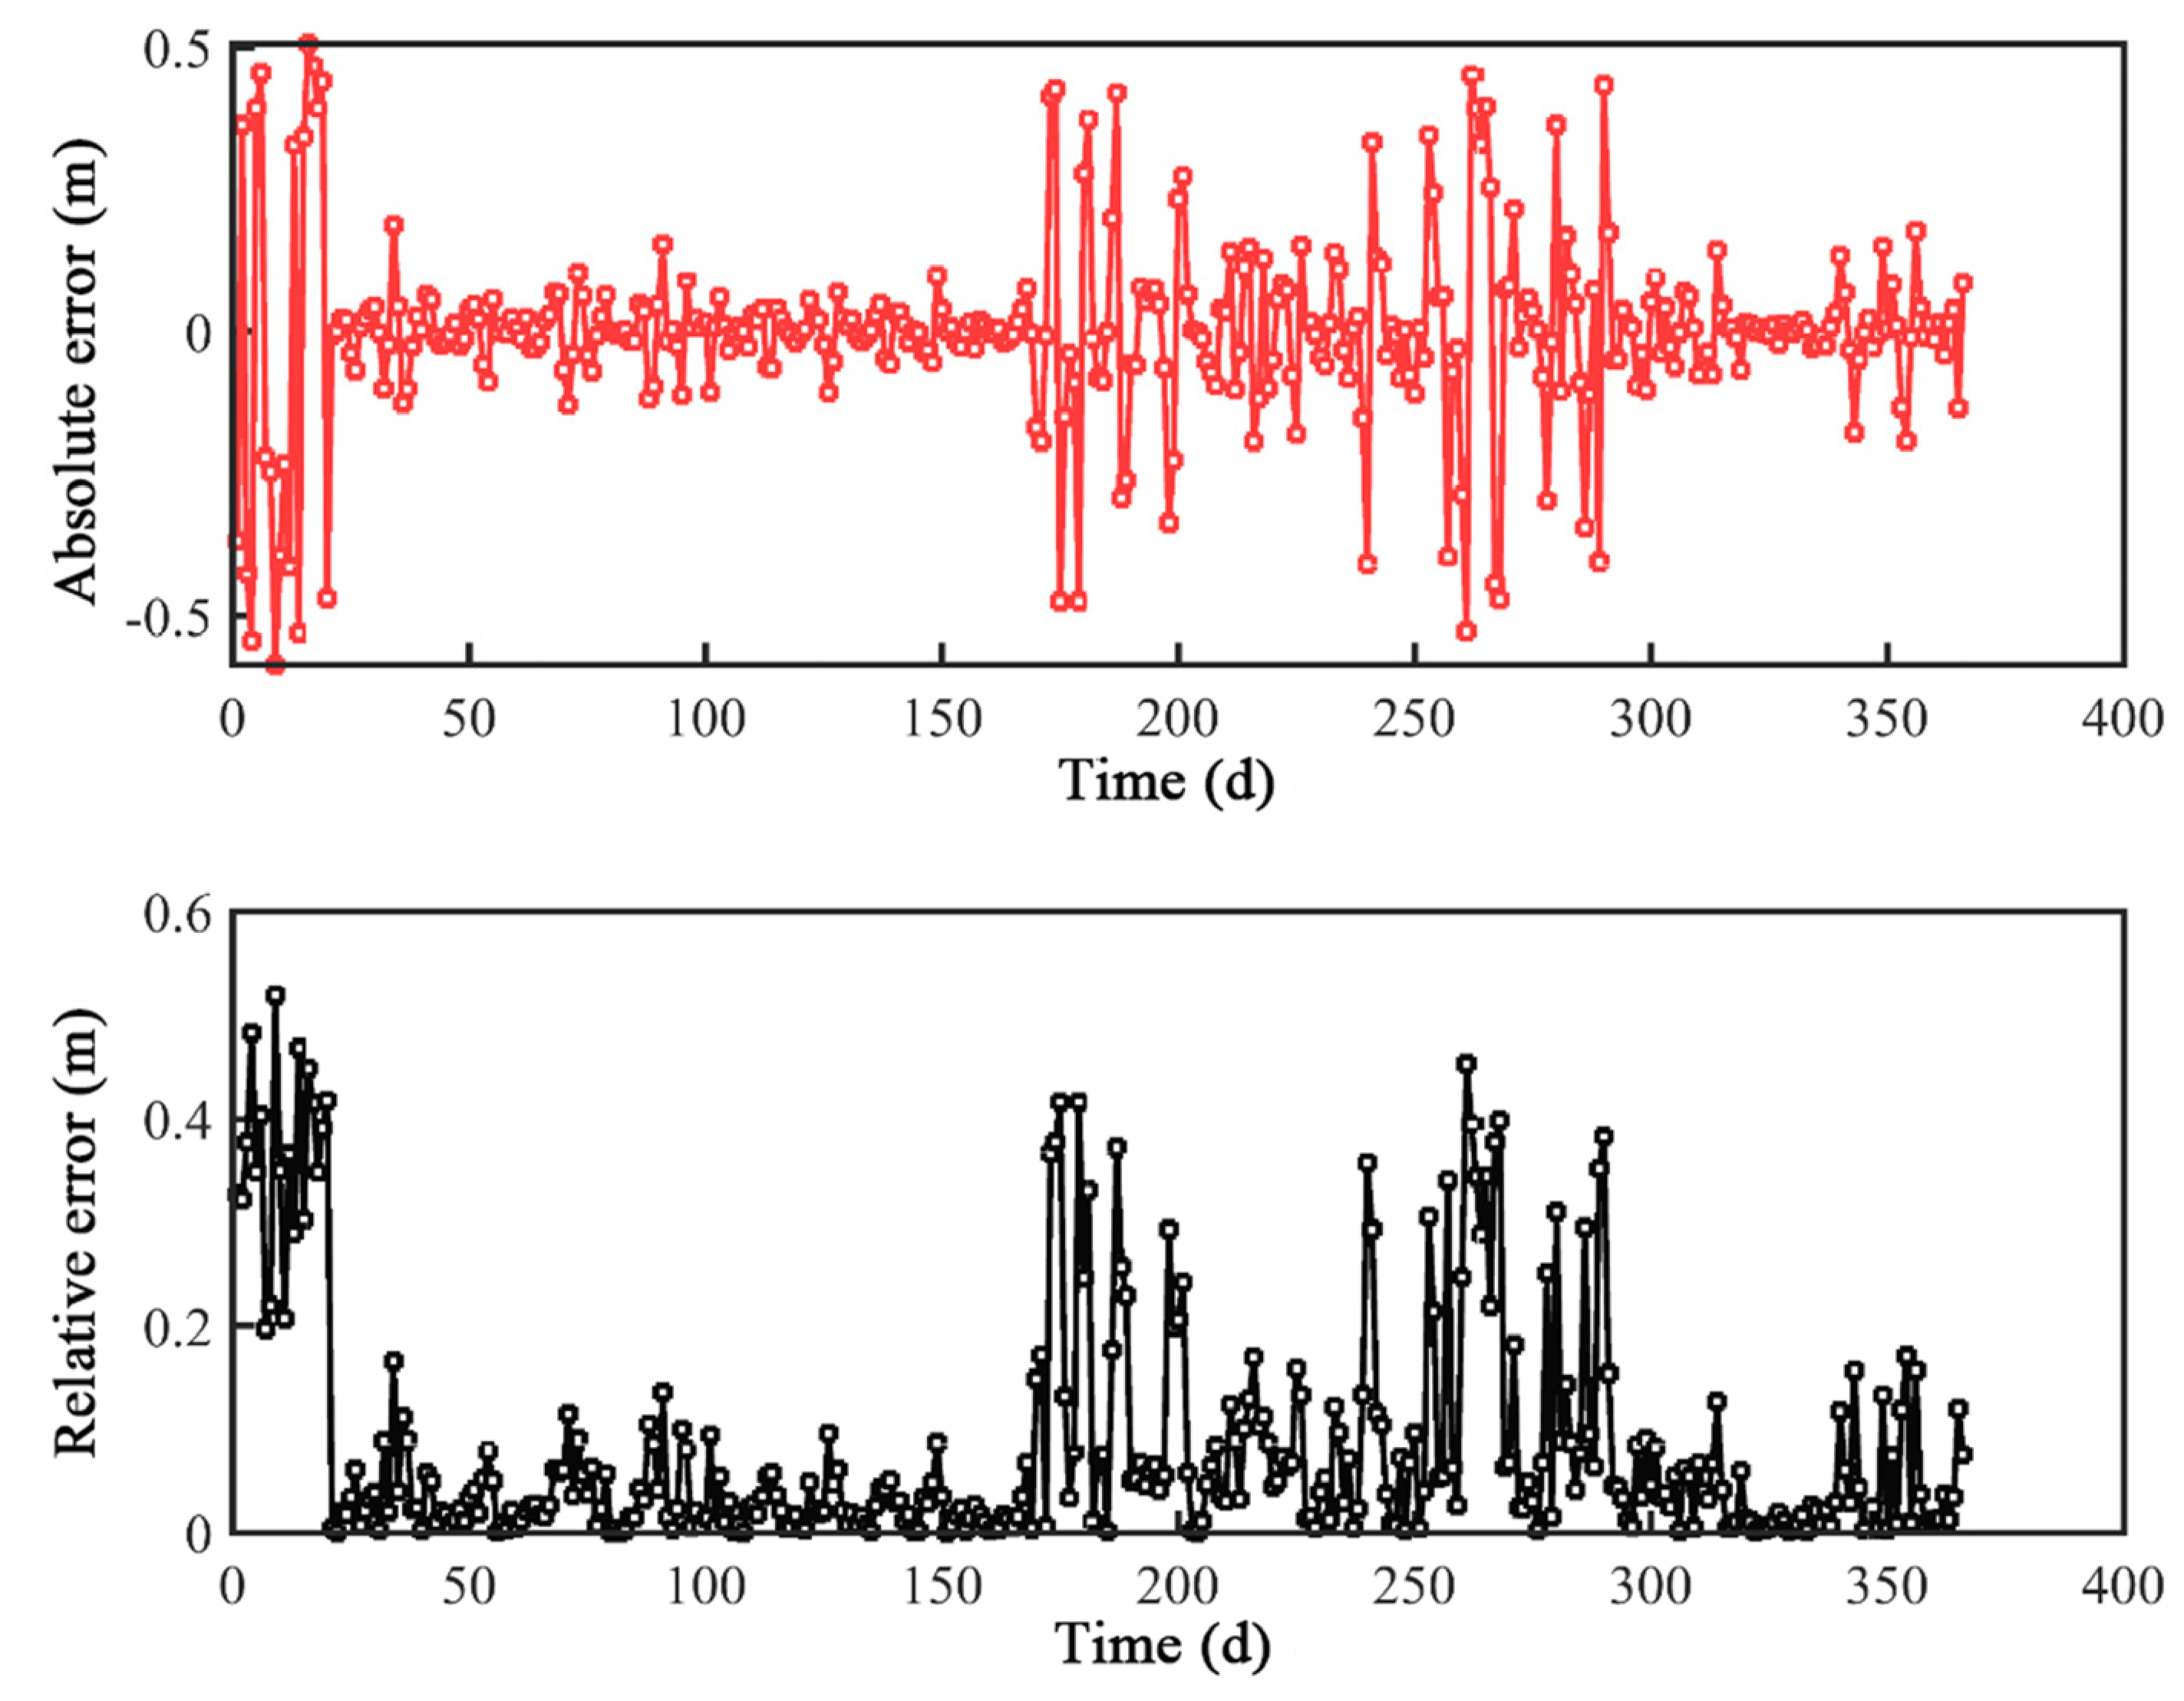
Numerical simulations are carried out for the simulated section of the Bai River, and the simulation results are compared with the observed values at the two hydrological stations. The simulated values of the water level at the Nanyang Penyao station are compared with the measured values and the simulation errors are shown in Figure 8 and Figure 9. The simulated values of the water level at the Nanyang Shangfanying station are compared with the measured values and simulation errors shown in Figure 10 and Figure 11.
As can be seen from the above graph, the maximum absolute error between the simulated water level and the actual measured water level at the Nanyang Bongyao station is 0.53m, corresponding to the date of 3 January 2020, and the relative error at this time is 0.44%, which is basically within the permissible error range of the hydrodynamic model. Furthermore, model accuracy and credibility are high. The error maxima are basically located at the beginning of the simulation, which is caused by the large dependence on the initial conditions of the model before the model is stabilized. From an overall perspective, the trend in the Bai River water level simulation results is consistent with the actual measured water level, and the simulation error is basically below 0.2%. Large water level errors can also occur at locations near the flood stage in the first and middle stages of the simulation, and the local fit is poor, but with the adaptive adjustment of the model, the water level values in the later stages of the simulation are basically consistent with the actual measured values.
As can be seen from the above graph, the maximum absolute error between the simulated water level and the actual measured water level at the Nanyang Shangfanying station is 0.59 m, corresponding to 9 January 2020, and the relative error at this time is 0.44%, which is basically within the permissible error range of the hydrodynamic model. Furthermore, model accuracy and credibility are high. The maximum error is located at the early stage of the simulation, which is caused by the fact that the model is not stable in the early stage and relies heavily on the initial conditions of the model. From an overall perspective, the trend in the Bai River water level simulation results is consistent with the actual measured water level, and the simulation error is basically below 0.2%. There are also large water level errors near the flood stage in the first and middle stages of the simulation, with poor local fit.

5.1.2. Water-Quality Model Validation

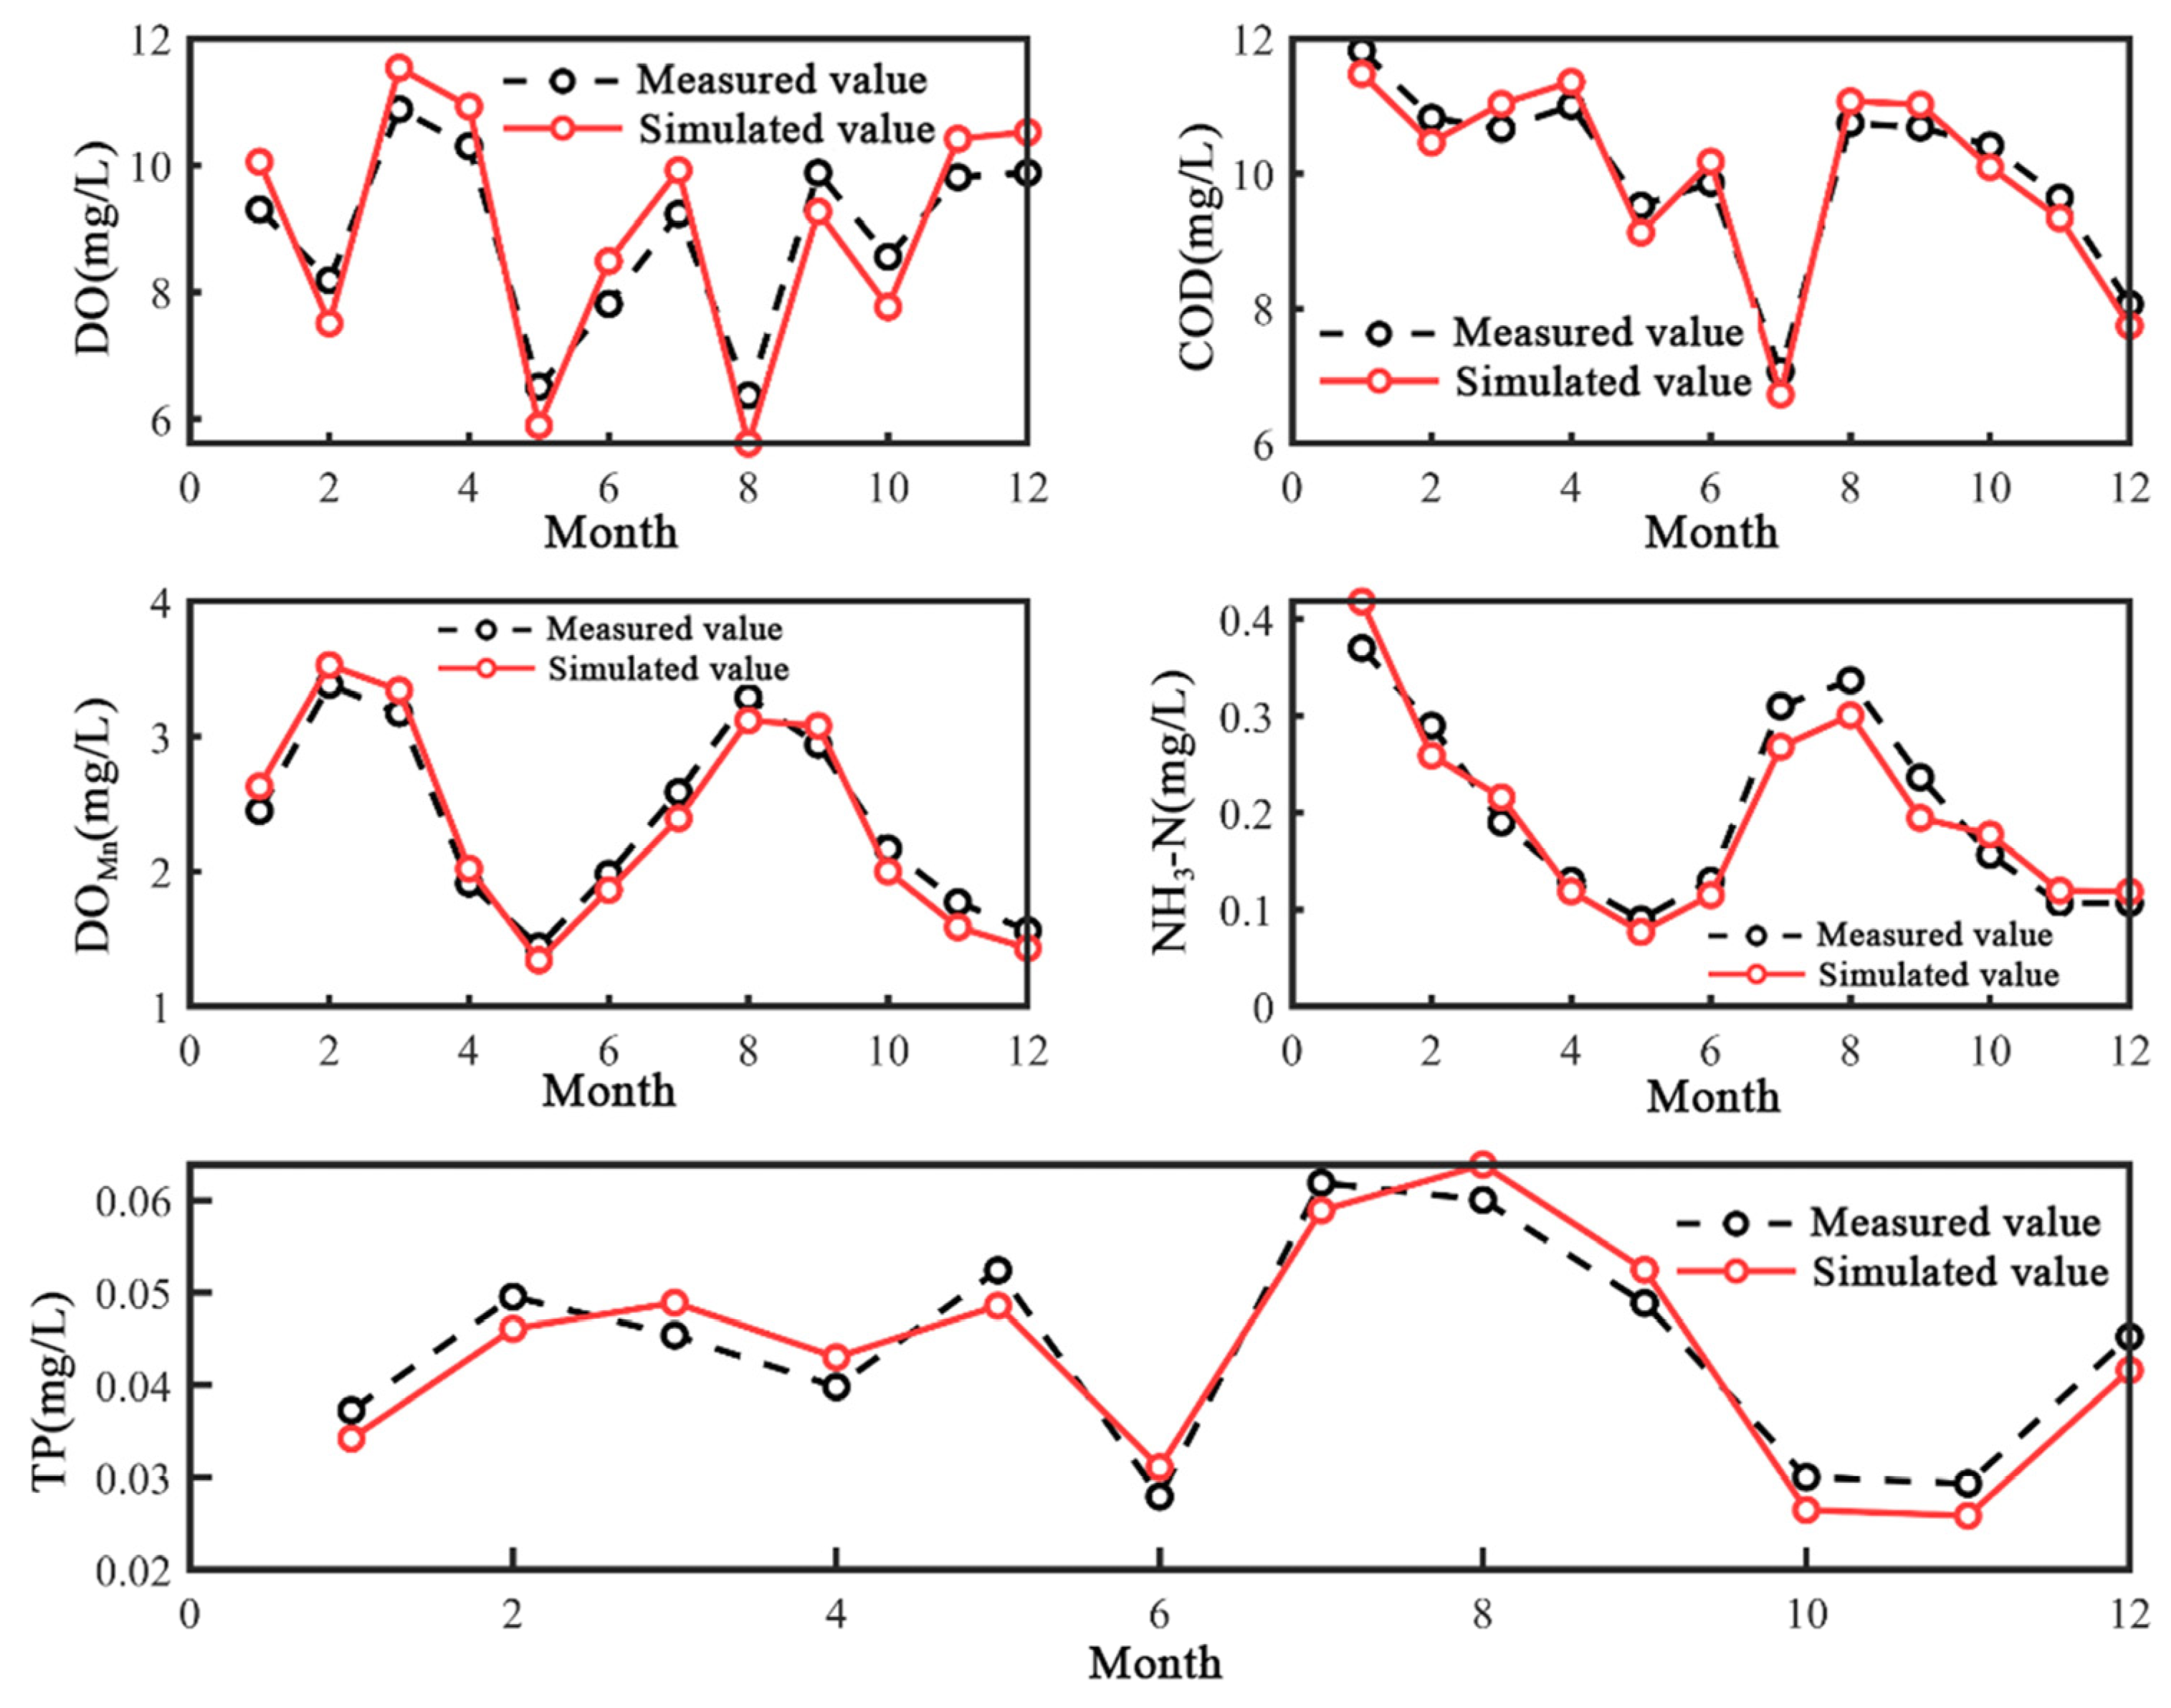
The simulation results of each water-quality indicator at the downstream Nanyang Upper Fanying Crossing are compared with the month-by-month measured data from the 2020 hydrological station to verify the accuracy and reliability of the model. Before the comparative analysis, the simulation needs to be converted into a monthly average water-quality series by taking the monthly average of the day-by-day water-quality data [30], and the comparative analysis between the simulated values of each water-quality indicator and the actual measured values of the hydrological stations is shown in Figure 12.
As can be seen from Figure 12, the fit of this simulation is good and reflects the trend in each pollutant indicator. The overall fluctuation in DO, COD, and CODMn, which are at low levels during the pre- and post-flood period, as well as during the dry period, is due to the fact that a large number of pollutants sink into the river during the flood season, posing a serious threat to the river’s water environment. Furthermore, the low oxygen content in the water body during the dry period may cause the death of aquatic plants and animals in the river, further aggravating the deterioration in water quality [31]. NH3-N and TP are important indicators of eutrophication in water bodies. During the winter period, NH3-N and TP are at relatively high levels as the temperature of river waters decreases; the uptake of chemical elements by aquatic plants, animals, and microorganisms in the water body decreases; and the self-purification capacity of the water body is reduced, resulting in a limited ability to reduce the concentration of pollutants in the water body.
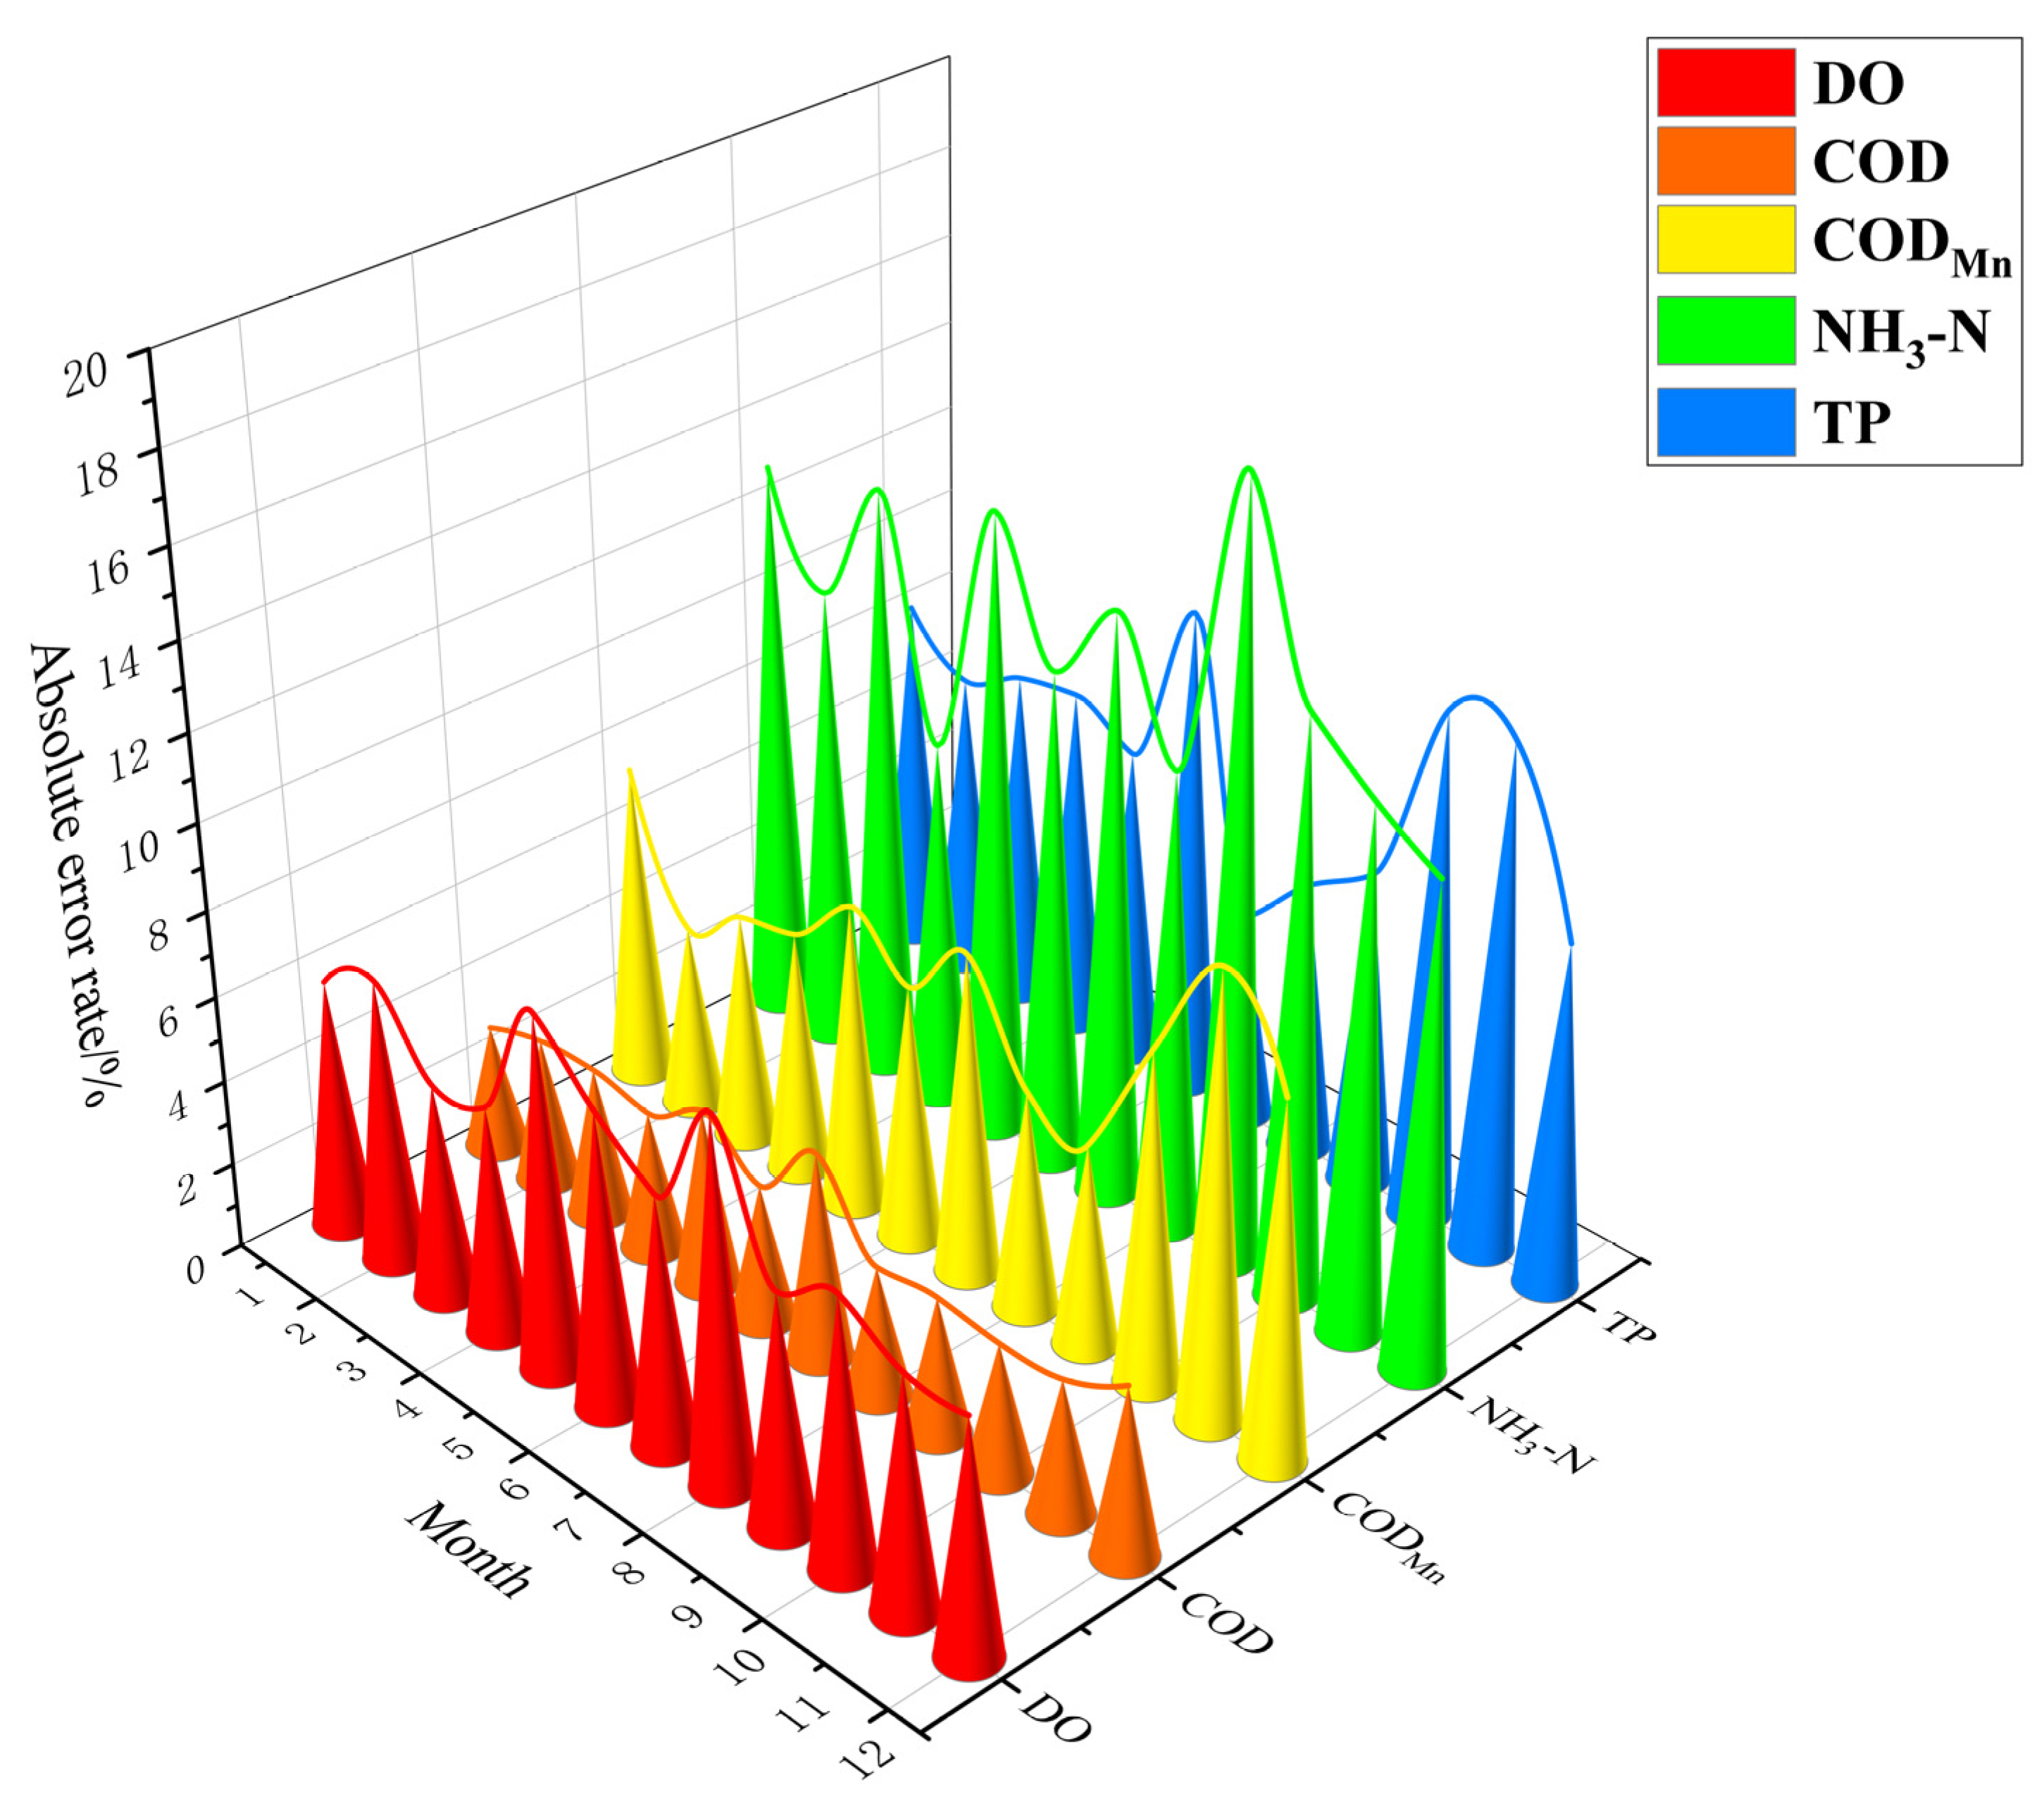
Overall, the accuracy of this simulation is high, and the errors are generally maintained at a low level. The average error rate of DO is 6.28%, the average error rate of COD is 3.47%, the average error rate of CODMn is 6.66%, the average error rate of NH3-N is 12.55%, and the average error rate of TP is 8.34%. Among them, the average error rate of the NH3-N index is the largest, and the maximum error occurred in September 2020, the absolute error rate of each water-quality index of the Bai River is shown in Figure 13.
Water-quality models often require consideration of complex parameters, and different parameters have different effects on the error of the model, so reference to only the absolute error rate as an evaluation indicator is not a strong indication of the model’s merit. In order to better describe the accuracy of the model, the deterministic coefficient R-squared is introduced to further evaluate the degree of fit of the model [32]. The results of the calculation of the deterministic coefficients for each water-quality indicator by formula are shown in Table 3. The coefficient of certainty provides a good description of the goodness of fit of the simulation results. In general, an R-squared value greater than 0.8 is considered a good fit, and an R-squared value greater than or equal to 0.9 is also considered a good fit. The five water-quality indicators in this simulation are all greater than 0.8, and the best fit is COD, with a coefficient of certainty of 0.95. Therefore, it is considered that the fit of this simulation meets engineering requirements, has high reliability, and can accurately restore the spatial and temporal evolution of the Bai River water quality.

5.2. Scenario Setting

Scenario analysis, also known as scenario description, is a more intuitive approach to forecasting, where certain parameters are adjusted based on existing scenarios, or certain premises are assumed based on existing scenarios, to simulate and predict the possible outcomes of these hypothetical scenarios.
In this paper, the period of ecological recharge of the Bai River channel by the South–North Water Transfer Central Project is defined as the recharge period, and the recharge period scenario is based on the specific ecological recharge implementation in 2020. Based on the long-term series data of rainfall and runoff in the study area, the recharge scenario is set around the recharge volume and recharge ephemeris with the Bai River retreat gate as the recharge inlet, and water-quality simulation studies are carried out for different scenarios [33].
The ecological replenishment of water to the Bai River by the South–North Water Transfer Project in 2020 lasted from 9 May to 21 June, a total of 44 days, with a total of 85.07 million m3 of water replenished, the source of which was the Danjiangkou Reservoir. In this study, 2017 is used as a typical year as the ecological recharge input situation as the upstream recharge input condition, with a flow rate of 12.04 m3/s. Considering the actual water transmission capacity of the project and the fact that too short a recharge duration results in insufficient time for pollutant degradation, the recharge volume of ecological recharge in 2020 is defined as Q, and the recharge calendar time is defined as T. In order to explore the optimal solution for ecological recharge, a consistent control method for the total amount of recharge is used, and the amount of recharge is divided into 2Q, Q, and Q/2, corresponding to three recharge durations of T/2, T, and 2T, respectively. Simulation and analysis of the impact of the above scenarios on the river ecosystem provide a theoretical reference for the implementation of the ecological recharge of the river, with the specific scenarios set out in Table 4.

5.3. Scenario Simulation Analysis

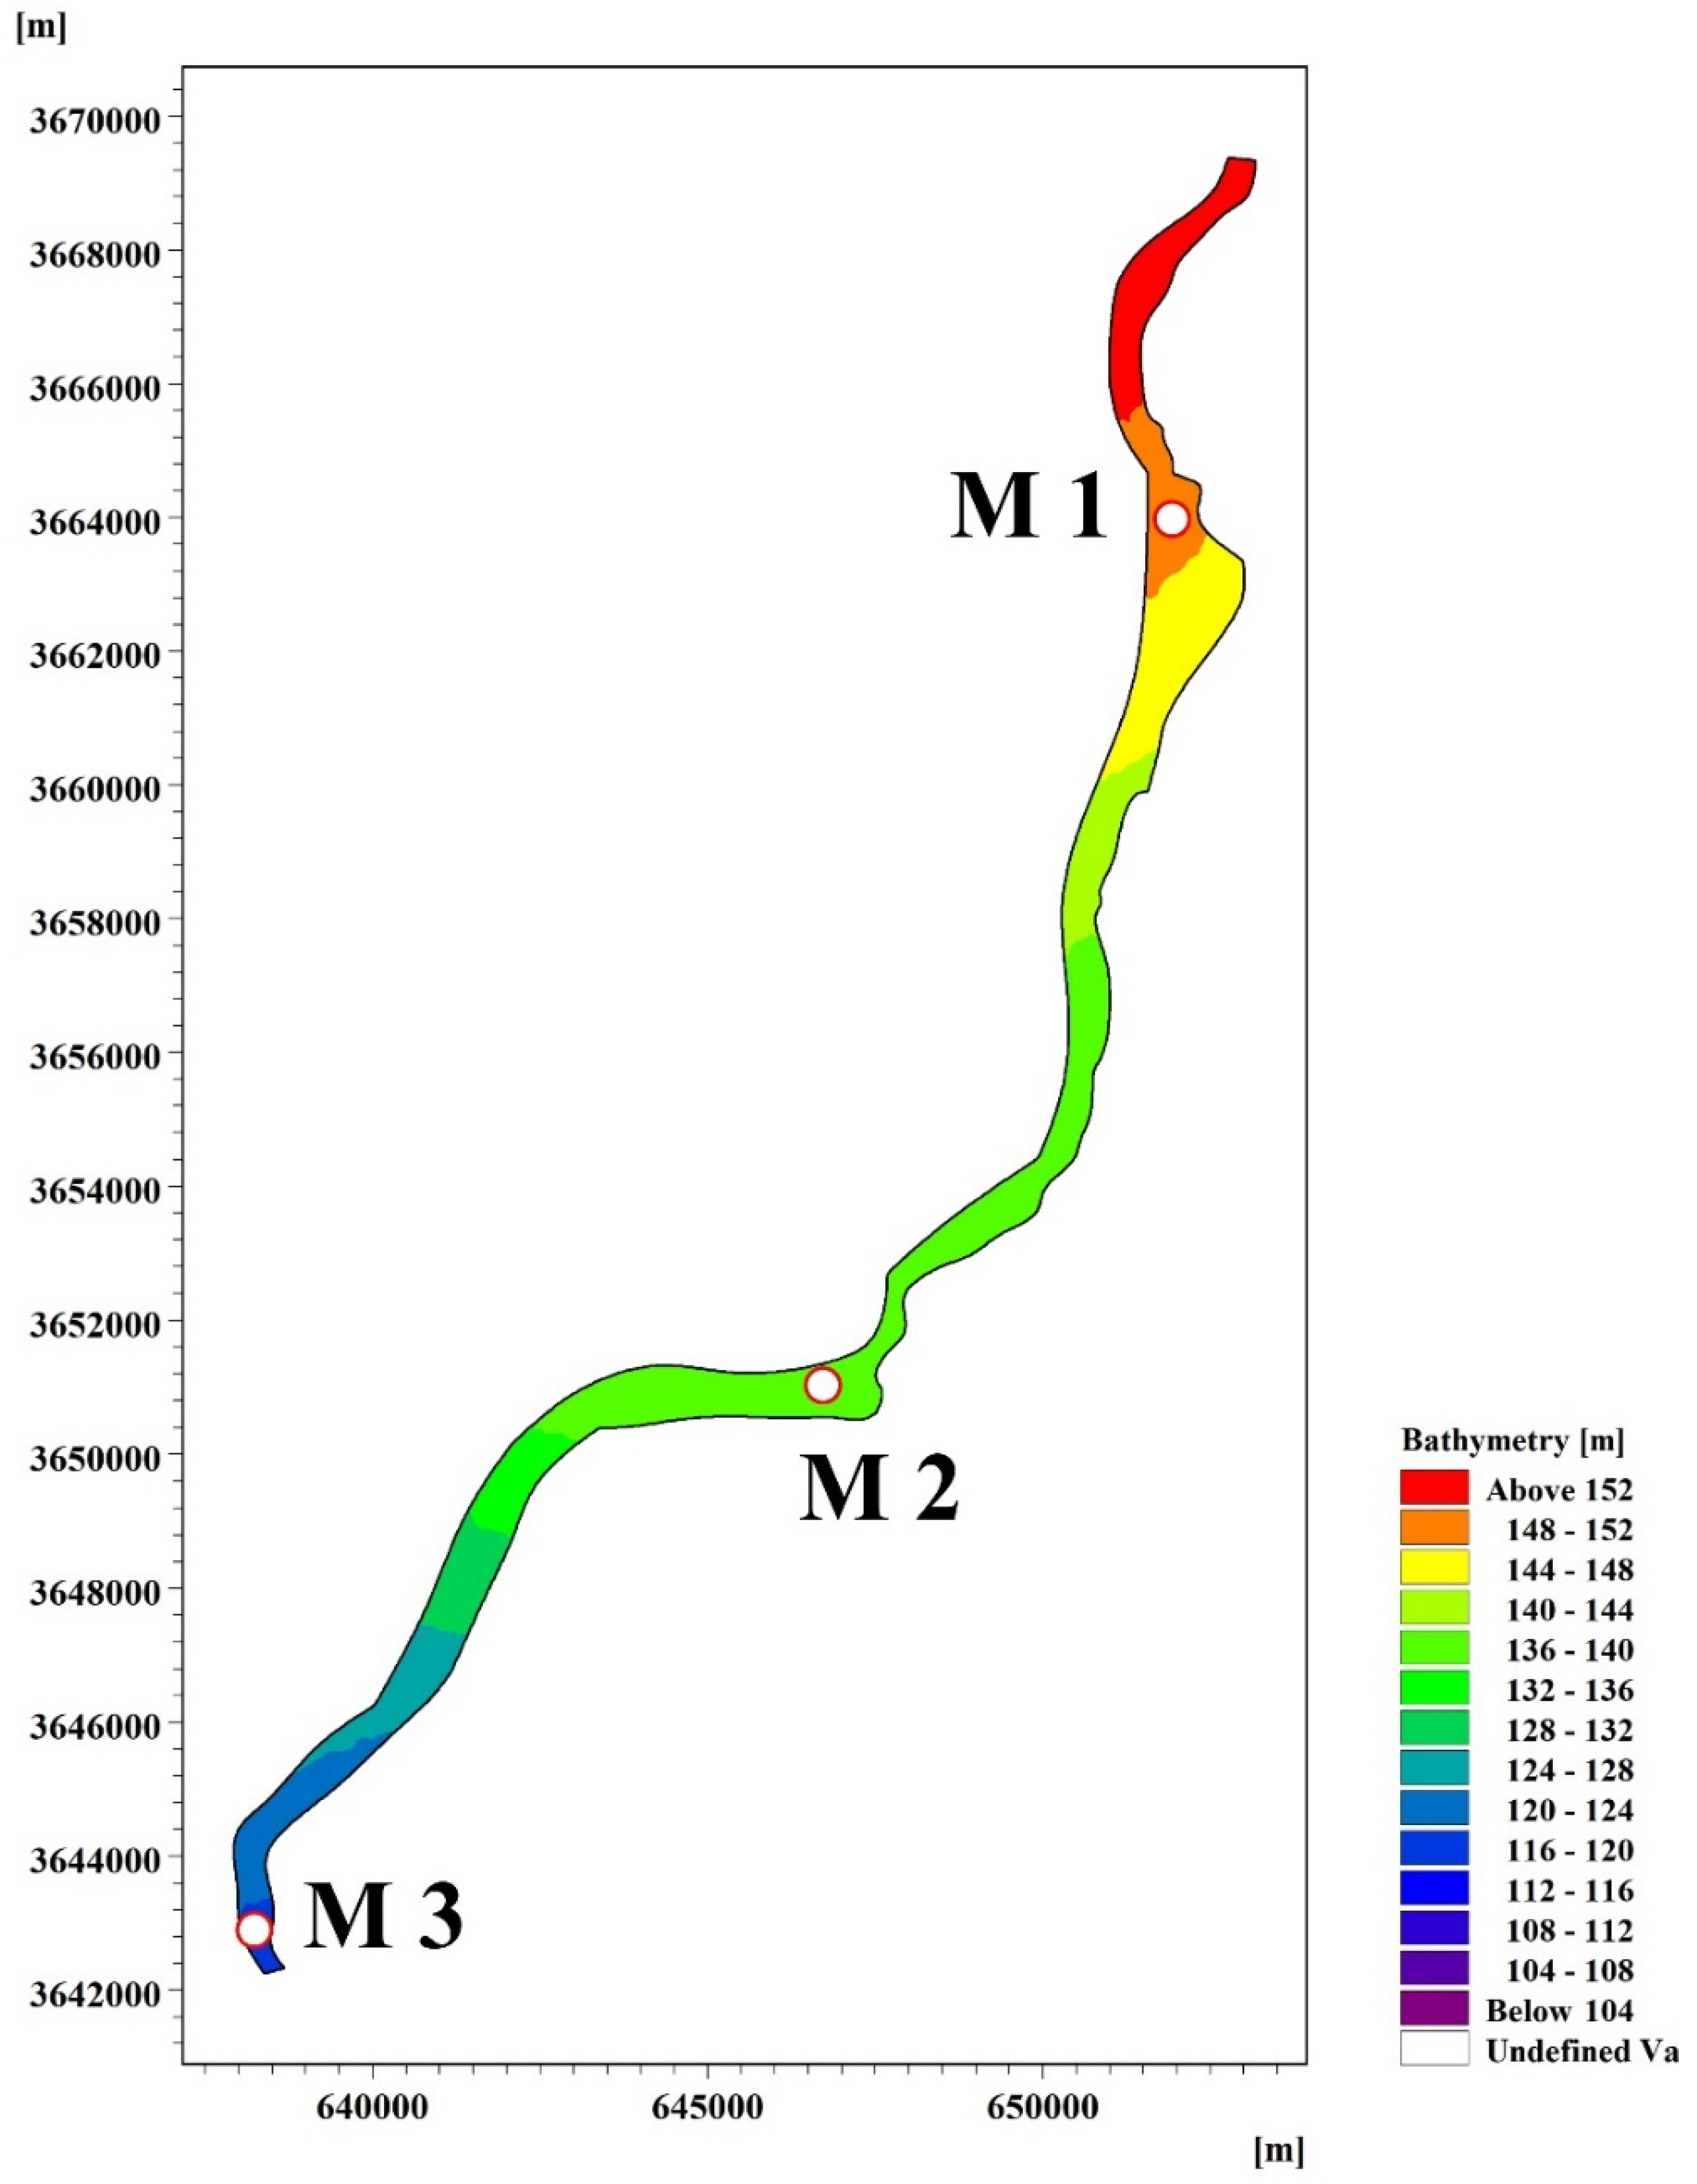
In order to better describe the evolution of water quality in the simulated section of the Bai River, monitoring points need to be set in the model [34]. In this paper, three monitoring points (M1, M2, and M3) are set to control the water quality of the Bai River in real time. M1 is located near the South–North Water Transfer Central Line of the Bai River retreat gate, M2 is located near the main city of Nanyang, and M3 is located near the upper Shangfanying section of Nanyang. The specific locations of the control points are shown in Figure 14.

5.3.1. Scenario 1 Simulation Analysis

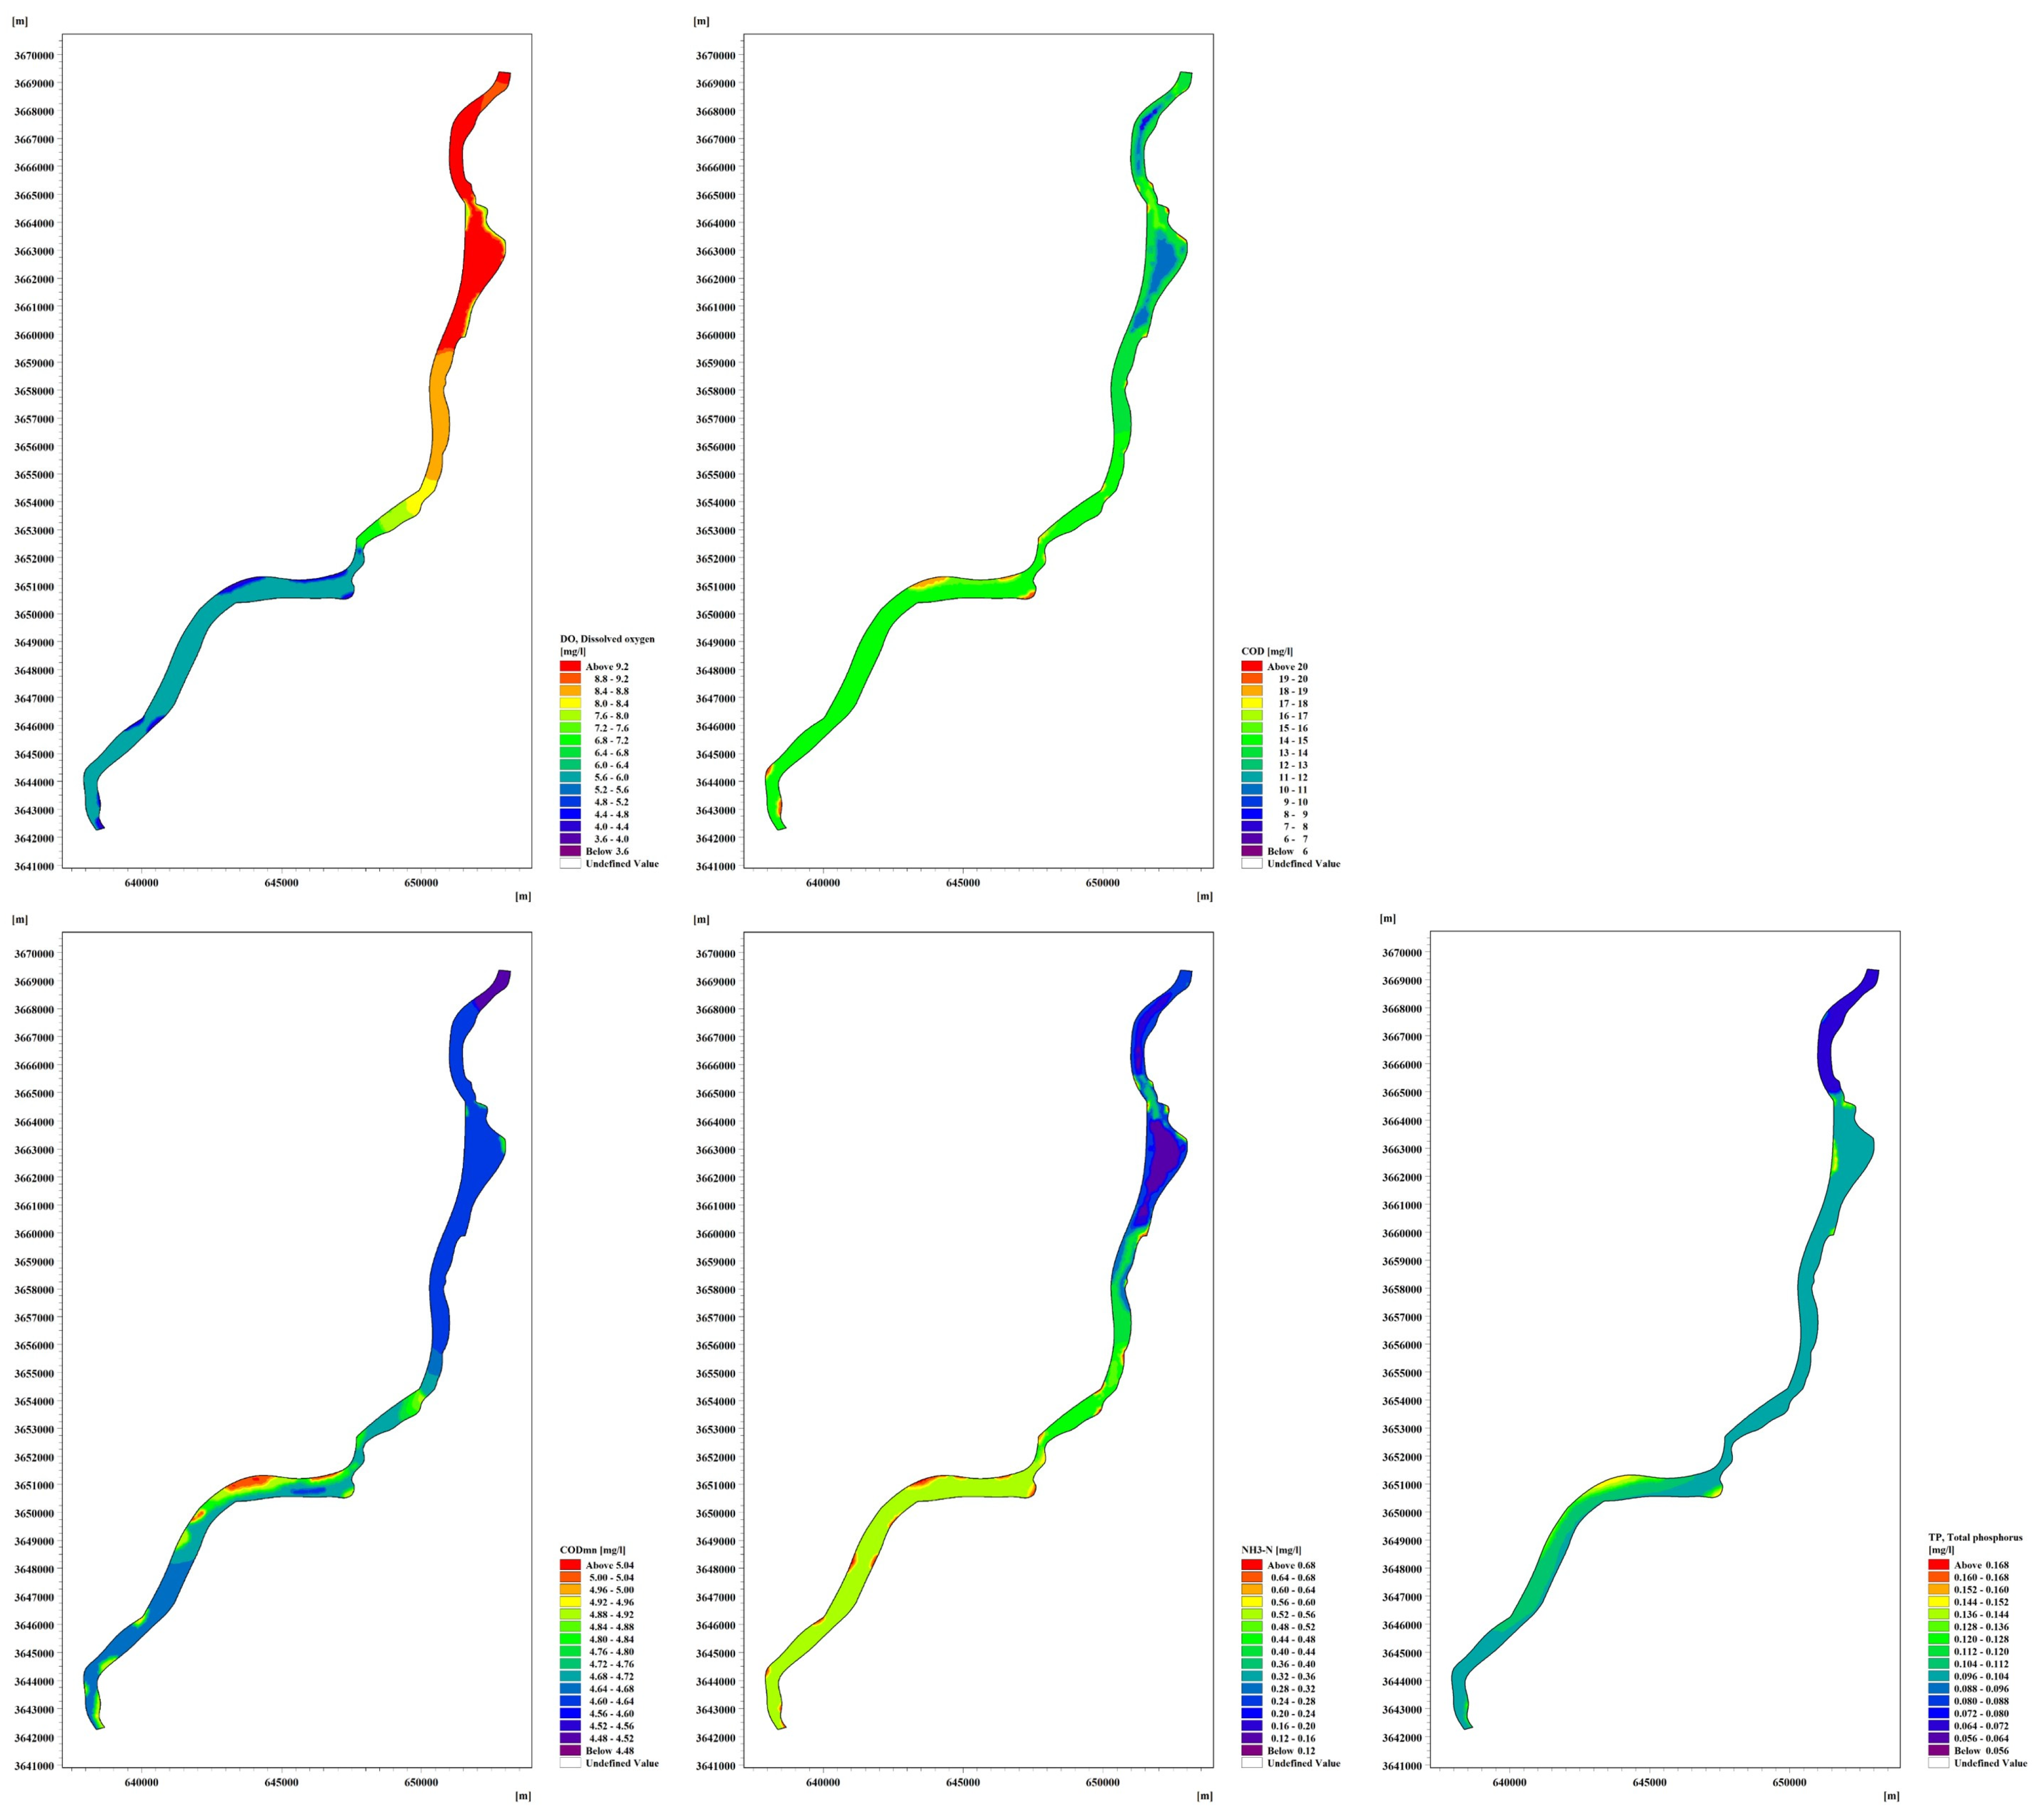
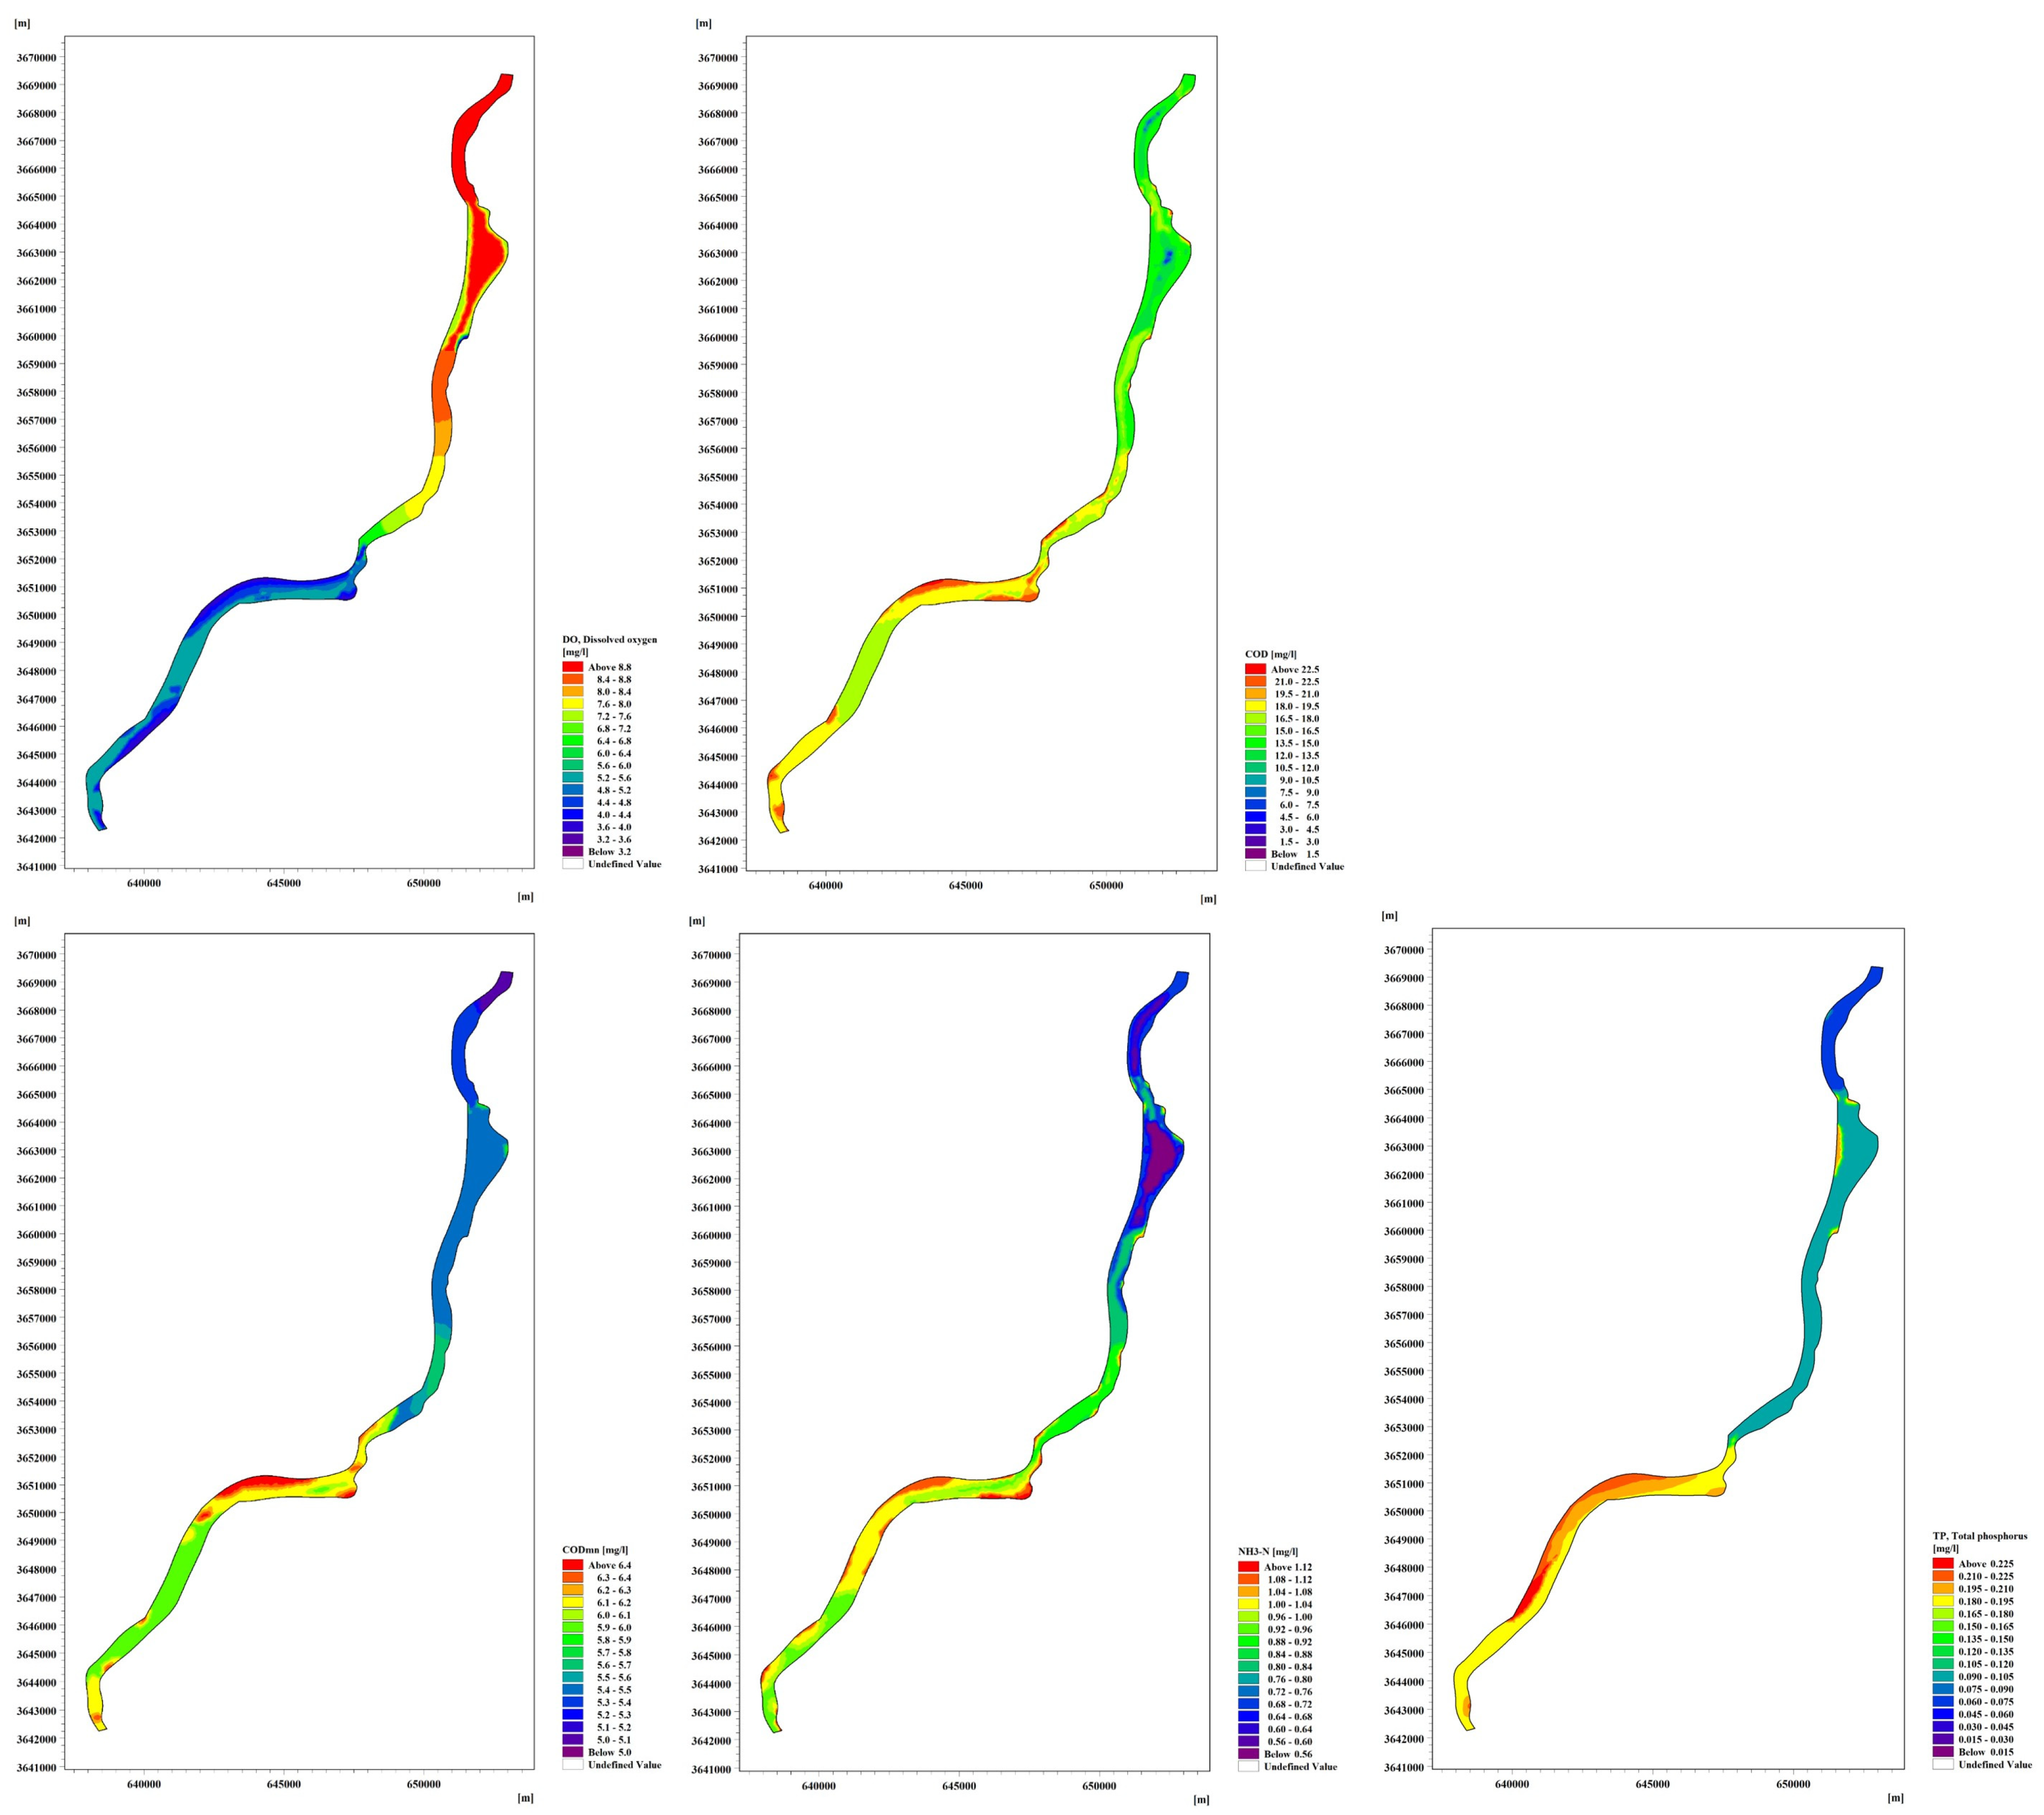
Scenarios 1, 2, and 3 take 2020 as the base year of the model, and the initial water quality before ecological recharge is of a grade IV water standard. The recharge flow process and water quality at the Bai River retreat gate are set in the model, and a coupled hydrodynamic–water-quality model is constructed to simulate the ecological recharge process in scenarios 1, 2, and 3. The spatial distribution of the modelled mean values for the five water-quality indicators, namely DO, CODMn, COD, NH3-N, and TP, are shown in Figure 15.
As can be seen from Figure 15, after the implementation of ecological recharge, the hydrodynamic conditions of the water body improve as ecological recharge continues to the Bai River channel [35]. DO levels in the simulated reaches are significantly elevated, and the diffusion of pollutants in the water column by the flow of water is enhanced, reducing the concentrations of indicators such as CODMn, COD, NH3-N, and TP [36]. In scenario 1, overall DO concentration is maintained between 3.6 and 9.2 mg/L, overall COD concentration is maintained between 6 and 20 mg/L, the overall CODMn concentration is maintained between 4.48 and 5.04 mg/L, overall NH3-N concentration is maintained between 0.12 and 0.68 mg/L, and overall TP concentration is maintained between 0.056 and 0.168 mg/L.
Regarding the performance of the water-quality indicators at the monitoring points, the water quality of each monitoring point meets the standard of grade III water or above, and the performance of COD and TP indicators is the best, reaching the standard of grade II water. The M1 monitoring point is close to the location of the recharge inlet. The water quality at this point is similar to the recharge water quality, and the performance of water-quality indicators is optimal. The M2 monitoring point is close to the location of the outfall. The water quality at this point is more variable, and the water-quality indicators are more disturbed by the discharge of pollutants at the M2 monitoring point. The M3 monitoring point is located in the downstream urban section, and the changes in water-quality indicators tend to lag behind. Under scenario 1 conditions, the flow of ecological recharge is much greater than the flow during the dry period. Ecological recharge has a greater impact on the hydrodynamic conditions of the river, where the hydrodynamic action of the river is the dominant factor and the reduction in pollutants by diffusion with water flow is significant.

5.3.2. Scenario 2 Simulation Analysis

The spatial distribution of the modelled mean values for the five water-quality indicators, namely DO, CODMn, COD, NH3-N, and TP, are shown in Figure 16.
As can be seen from Figure 16, after the implementation of ecological recharge and with the continuous recharge of ecological recharge to the Bai River channel, the hydrodynamic conditions of the water body improve, the DO content of the simulated river section significantly increase, and the diffusion of pollutants in the water body by the water flow is enhanced, reducing the concentrations of CODMn, COD, NH3-N, and TP, as well as other indicators. In scenario 2, overall DO concentration is maintained between 3.2 and 8.8 mg/L, overall COD concentration is maintained between 0 and 21 mg/L, overall CODMn concentration is maintained between 5 and 5.56 mg/L, overall NH3-N concentration is maintained between 0.44 and 1 mg/L, and overall TP concentration is maintained between 0.072 and 0.184 mg/L. The overall concentration of TP is maintained at 0.072~0.184 mg/L.
Regarding the performance of water-quality indicators at the monitoring points, the water quality at each monitoring point meets the standard of grade III water or above. The M1 monitoring point is close to the location of the recharge inlet. The water quality at this point is similar to the recharge water quality, and the performance of water-quality indicators is the best. The M2 monitoring point is close to the location of the outfall. The water quality at this point is more variable, and the water-quality indicators at the M2 monitoring point are more disturbed by the discharge of pollutants. The M3 monitoring point is located in the downstream urban section, where the water-quality indicators tend to lag behind the changes. In scenario 2, the flow of ecological recharge is halved compared to scenario 1. The impact of ecological recharge on the hydrodynamic conditions of the river is reduced, and the reduction in pollutants by diffusion with water flow is reduced.

5.3.3. Scenario 3 Simulation Analysis

The spatial distribution of the modelled mean values for the five water-quality indicators, namely DO, CODMn, COD, NH3-N, and TP, are shown in Figure 17.
As can be seen from Figure 17, after the implementation of ecological recharge, with the continuous recharge of ecological recharge to the Bai River channel, the hydrodynamic conditions of the water body improve, the DO content of the simulated river section significantly increases, and the diffusion of pollutants in the water body by the water flow is enhanced, reducing the concentrations of CODMn, COD, NH3-N, and TP, as well as other indicators. In scenario 3, overall DO concentration is maintained between 3.6 and 9.2 mg/L, overall COD concentration is maintained between 6 and 20 mg/L, overall CODMn concentration is maintained between 4.48 and 5.04 mg/L, overall NH3-N concentration is maintained between 0.12 and 0.68 mg/L, and overall TP concentration is maintained between 0.056 and 0.168 mg/L.
From the performance of water-quality indicators at the monitoring points, the water quality at each monitoring point meets the standard of grade III water or above. The M1 monitoring point is close to the location of the recharge inlet. The water quality at this point is similar to the recharge water quality, and the performance of water-quality indicators is the best. The M2 monitoring point is close to the location of the outfall. The water quality at this point is more variable, and the water-quality indicators at the M2 monitoring point are more disturbed by the discharge of pollutants. The M3 monitoring point is located in the downstream urban section, where water-quality indicator change often lags behind. In scenario 3, the flow of ecological recharge is halved compared to scenario 2. The impact of ecological recharge on the hydrodynamic conditions of the river is further reduced, and the reduction in pollutants by diffusion of water is further reduced.

5.4. Discussion

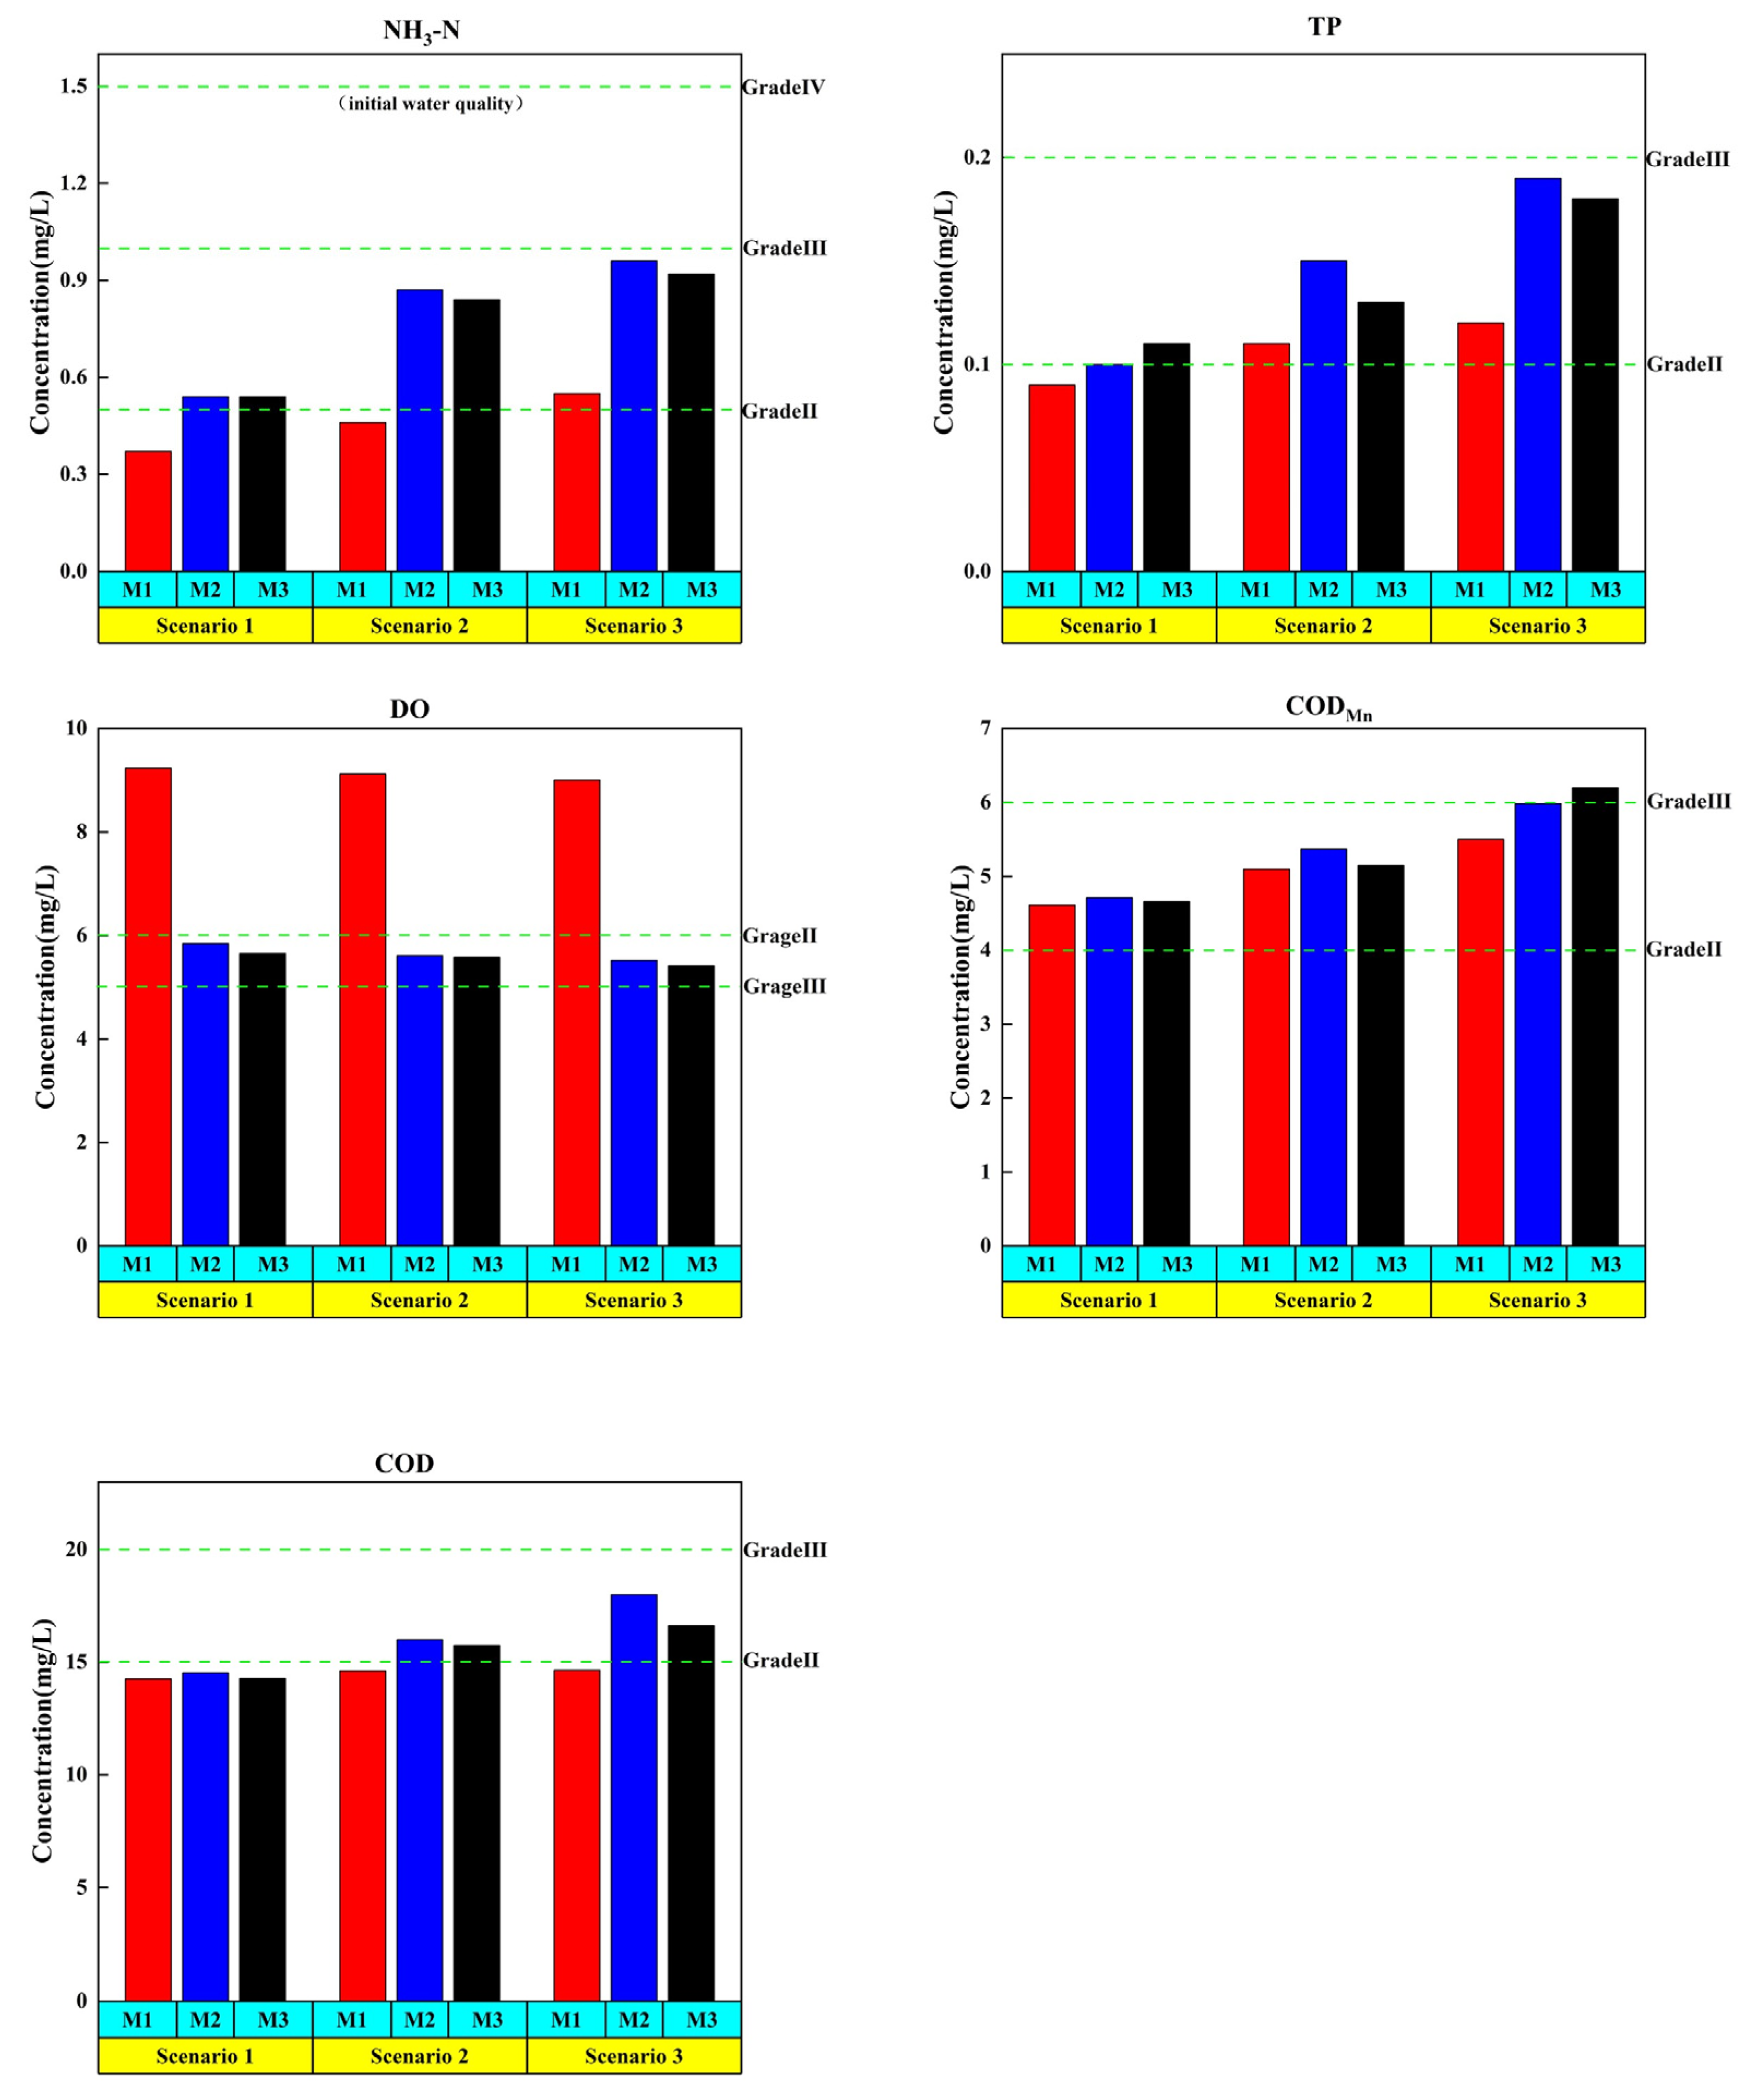
To evaluate the effect of ecological recharge on water-quality enhancement, the concentrations of each water-quality indicator at the monitoring points are shown in Table 5, and the improvement in water quality at M1~M3 for scenarios 1~3 is shown in Figure 18.
In scenario 1, DO concentration increases to 5.84 mg/L and the index meets the standard for grade III water, an increase of 94.67% compared to the pre-recharge condition. In addition, COD concentration decreases to 14.54 mg/L and the index meets the standard for grade II water, a reduction of 51.53% compared to the pre-recharge condition; CODMn concentration decreases to 4.71 mg/L and the index meets the standard for grade III water; the concentration of NH3-N reduces to 0.54 mg/L and the index reaches the standard for grade III water, a reduction of 64.00% compared to before water replenishment; the concentration of TP reduces to 0.10mg/L and the index reaches the standard for grade II water, a reduction of 66.67% compared to that before water replenishment. In scenario 2, DO concentration increases to 5.61mg/L and the index reaches the grade III water standard, an increase of 87% compared to the pre-recharge condition; COD concentration decreases to 16.00 mg/L and the index reaches the grade III water standard, a reduction of 46.67% compared to the pre-recharge condition; CODMn concentration decreases to 5.37 mg/L and the index reaches the grade III water standard, a reduction of 46.30% compared to the pre-recharge condition; NH3-N concentration decreases to 0.87 mg/L and the index reaches the grade III water standard, a reduction of 42.00% compared to the pre-recharge condition; and TP concentration decreases to 0.15 mg/L and the index reaches the grade III water standard. The concentration of NH3-N reduces to 0.87 mg/L and the index reaches the standard of grade III water, which is 42.00% less than that before water replenishment; and the concentration of TP reduces to 0.15mg/L and the index reaches the standard of grade III water, which is 50.00% less than that before water replenishment. In scenario 3, DO concentration increases to 5.52 mg/L, meeting the grade III water standard, an increase of 84.00% compared to the pre-recharge condition; COD concentration decreases to 18.00 mg/L, meeting the grade III water standard, a reduction of 40.00% compared to the pre-recharge condition; CODMn concentration decreases to 5.98 mg/L, meeting the grade III water standard; the concentration of NH3-N reduces to 0.96 mg/L and the index reaches the standard for grade III water, a reduction of 36.00% compared to that before water replenishment; and the concentration of TP reduces to 0.19mg/L and the index reaches the standard for grade III water, a reduction of 36.33% compared to that before water replenishment.
The simulation results of scenarios 1 to 3 are compared and analyzed according to the initial water-quality grade of the Bai River. After the ecological recharge, the water quality is unstable in the early stages due to the strong convective diffusion generated by the recharge, with the best results at the upstream entrance. Water quality stabilizes as the river flows downstream. This shows that the concentration of pollutants at the recharge inlet is significantly reduced and the flow of water is mainly diffused, while the middle of the Bai River is subject to the diffusion of pollutants by backflow from both sides of the river [37]. As a whole, the modelling results are consistent with natural patterns and reflect, to some extent, the changes in the water quality of the Bai River following ecological recharge. The results show that after ecological recharge, the water quality of the Bai River is significantly improved, with an average improvement of 35.92% in all water-quality indicators after recharge, reaching or approaching grade II water quality.

6. Conclusions

This study uses the Bai River as the research object, evaluates the current water quality of the Bai River, and on this basis constructs the MIKE21 coupled hydrodynamic–water-quality model for the study section of the Bai River. It also simulates three recharge period scenarios, analyzes the laws of changes in hydrodynamic conditions and water-quality indicators of the Bai River for different scenarios, evaluates the impact of the recharge period scenarios on water-quality improvement, and screens out the best recharge scenario. Based on the above studies, the following conclusions are drawn on the hydrodynamics of the Bai River and the evolution of the water environment:
(1)
Due to the lack of water resources during the dry season, the rivers have poor hydrodynamic conditions, and the water quality does not meet the water-quality objectives of the water function zones, so ecological replenishment needs to be implemented to improve the quality of the water environment of the rivers. Non-flood conditions tend to have better water-quality conditions as they are less subject to confluence action. Water-quality indicators show a spatial pattern that is better upstream than downstream, with more dramatic changes in water quality near the outfall influenced by the discharge of sewage near the urban section of Nanyang.
(2)
Based on the simulation results of the three scenarios during the recharge period, the hydrodynamic conditions of the three recharge scenarios are good, and scenario 1 is the best of the three recharge scenarios, and the ecological recharge has a significant effect on the river water quality. According to the single-factor evaluation method, all water-quality indicators met the water-quality objectives of the Bai River water function area, and the river is upgraded from grade IV water-quality standards to grade III water-quality standards. Among them, the COD and TP indicators are raised to grade II water standard, and the DO rate is the largest (94.67%) with the best improvement effect (94.67%). In addition, the TP indicator has the best reduction effect, 66.67%, and the changes in each water-quality indicator are in line with the law of natural evolution, and a good simulation effect is achieved. However, the model parameters, such as eddy viscosity coefficient and Koch’s force, are set as constants. Future studies can consider setting these parameters as variables that can change from time to time to further improve the accuracy of the model. In addition, this study does not consider the confluence of many small tributaries of the Bai River, and the hydrological information of the study area is missing in some years.
(3)
The study uses the Bai River as the research object, based on the current situation of water resources and water environment in the study area, constructs the MIKE21 coupled hydrodynamic–water-quality model for the study section of the Bai River, analyzes the evolution of river hydrodynamics and water quality under different scenarios, and obtains relatively good simulation results. This study provides valuable insights for policymakers and water managers, offering guidance for the integrated allocation of water resources to achieve sustainable water management in the Bai River basin.

Author Contributions

All authors (X.Z., Y.L., Z.Z., M.Z. and H.L.) contributed to the study’s conception and design. Writing and editing: X.Z. and Y.L.; chart editing: Z.Z.; preliminary data collection: M.Z. and H.L. All authors have read and agreed to the published version of the manuscript.

Funding

This research received no external funding.

Institutional Review Board Statement

Not applicable.

Informed Consent Statement

Not applicable.

Data Availability Statement

Data and materials are available from the corresponding author upon request.

Conflicts of Interest

The authors declare no conflict of interest.

References

  1. Yang, Y.; Wang, H.; Li, Y.; Zhang, L.; Zhao, Y. New green development indicator of water resources system based on an improved water resources ecological footprint and its application. Ecol. Indic. 2023, 148, 110115. [Google Scholar] [CrossRef]
  2. Bergkamp, G.; McCartney, M.; Dugan, P.; McNeely, J.; Acreman, M. Dams, ecosystem functions and environmental restoration. Themat. Rev. II 2000, 1, 1–187. [Google Scholar]
  3. Petts, G.E. Water allocation to protect river ecosystems. Regul. Rivers Res. Manag. 1996, 12, 353–365. [Google Scholar] [CrossRef]
  4. Wescoat, J.L., Jr. Books of note—Water in Crisis: A Guide to the World’s Fresh Water Resources edited by Peter H. Gleick. Environment 1994, 36, 26. [Google Scholar]
  5. Ahmadi-Nedushan, B.; St-Hilaire, A.; Bérubé, M.; Robichaud, É.; Thiémonge, N.; Bobée, B. A review of statistical methods for the evaluation of aquatic habitat suitability for instream flow assessment. River Res. Appl. 2006, 22, 503–523. [Google Scholar] [CrossRef]
  6. Dadaser-Celik, F.; Coggins, J.S.; Brezonik, P.L.; Stefan, H.G. The projected costs and benefits of water diversion from and to the Sultan Marshes (Turkey). Ecol. Econ. 2009, 68, 1496–1506. [Google Scholar] [CrossRef]
  7. Nikoo, M.R.; Karimi, A.; Kerachian, R.; Poorsepahy-Samian, H.; Daneshmand, F. Rules for optimal operation of reservoir-river-groundwater systems considering water quality targets: Application of M5P model. Water Resour. Manag. 2013, 27, 2771–2784. [Google Scholar] [CrossRef]
  8. Tang, Q.; Chen, H. Water resources and oasis construction in Tarim Basin. Chin. Geogr. Sci. 1992, 2, 173–182. [Google Scholar] [CrossRef]
  9. Yan, Z.; Zhou, Z.; Sang, X.; Wang, H. Water replenishment for ecological flow with an improved water resources allocation model. Sci. Total Environ. 2018, 643, 1152–1165. [Google Scholar] [CrossRef]
  10. Mahaffy, M.W. A three-dimensional numerical model of ice sheets: Tests on the Barnes Ice Cap, Northwest Territories. J. Geophys. Res. 1976, 81, 1059–1066. [Google Scholar] [CrossRef]
  11. Zhang, Y.; Meng, D.J.; Yu, Z.C.; Zhao, J.Y.; Peng, W.Q.; Han, H.L.; Zhang, J. Analysis of water quality improvement and compliance of urban rivers based on MIKE21. Hydropower Energy Sci. 2020, 9, 48–52. [Google Scholar]
  12. Chen, J. Dynamic and loss analysis of flood inundation in the floodplain area of the lower Yellow River considering ecological impact. J. Eng. Appl. Sci. 2023, 70, 26. [Google Scholar] [CrossRef]
  13. Zuo, Q.N.; Lin, D.C.; Wang, X.L. Study on the Dilution and Diffusion of Liquid Effluent from Coastal Nuclear Facility and Discharging Optimization Based on MIKE21 Simulation. J. Isot. 2022, 35, 75. [Google Scholar]
  14. Yang, M.; Xu, P.P.; Qian, H. Water quality model of BP double hidden layer neural network based on artificial bee colony algorithm. Environ. Monit. Manag. Technol. 2018, 30, 6. [Google Scholar]
  15. Xu, J.P.; Ran, Z.H.; Liu, H.; Guan, X.X.; Meng, Y. Water quality assessment and spatial variation analysis in the Baihe River Basin, Nanyang. China Rural. Water Conserv. Hydropower 2021, 12, 66–71. [Google Scholar]
  16. Wei, D. Beijing water resources and the south to north water diversion project. Can. J. Civ. Eng. 2005, 32, 159–163. [Google Scholar] [CrossRef]
  17. Xu, Y.; Lin, J.; Lei, X.; Zhang, D.; Peng, Q.; Wang, J.; Zhu, B. Assessment of the spatiotemporal water quality variations in the Middle Route of China’s South-to-North Water Diversion Project by multivariate analysis. Environ. Sci. Pollut. Res. 2023, 30, 44206–44222. [Google Scholar] [CrossRef] [PubMed]
  18. Li, D.; Zuo, Q.; Wu, Q.; Li, Q.; Ma, J. Achieving the tradeoffs between pollutant discharge and economic benefit of the Henan section of the South-to-North Water Diversion Project through water resources-environment system management under uncertainty. J. Clean. Prod. 2021, 321, 128857. [Google Scholar] [CrossRef]
  19. Li, X.; Huang, M.; Wang, R. Numerical simulation of Donghu Lake hydrodynamics and water quality based on remote sensing and MIKE 21. ISPRS Int. J. Geo Inf. 2020, 9, 94. [Google Scholar] [CrossRef]
  20. Lai, Y.; Lu, Y.; Ding, T.; Sun, H.; Li, X.; Ge, X. Effects of Low-Impact Development Facilities (Water Systems of the Park) on Stormwater Runoff in Shallow Mountainous Areas Based on Dual-Model (SWMM and MIKE21) Simulations. Int. J. Environ. Res. Public Health 2022, 19, 14349. [Google Scholar] [CrossRef]
  21. Ahn, J.; Na, Y.; Park, S.W. Development of two-dimensional inundation modelling process using MIKE21 model. KSCE J. Civ. Eng. 2019, 23, 3968–3977. [Google Scholar] [CrossRef]
  22. Gordillo, G.; Morales-Hernández, M.; Echeverribar, I.; Fernández-Pato, J.; García-Navarro, P. A GPU-based 2D shallow water quality model. J. Hydroinformatics 2020, 22, 1182–1197. [Google Scholar] [CrossRef]
  23. Liu, J.C.; Hu, Z.Q.; Zhu, M.Y. Comparison and analysis of calculation of Bridge backwater based on Mike21 hydrodynamic model. E3S Web Conf. 2021, 233, 03043. [Google Scholar] [CrossRef]
  24. Zhang, D.; Zhang, C. Risk assessment and impact factor analysis of soil heavy metal pollution in Baihe River Basin. Southwest China J. Agric. Sci. 2015, 28, 2187–2193. [Google Scholar]
  25. Zhang, X.; Duan, B.; He, S.; Lu, Y. Simulation study on the impact of ecological water replenishment on reservoir water environment based on Mike21—Taking Baiguishan reservoir as an example. Ecol. Indic. 2022, 138, 108802. [Google Scholar] [CrossRef]
  26. Tang, Y.; Chen, X.; Zhang, J.; Wang, J.; Hu, W.; Liu, S.; Luo, Z.; Xu, H. Generation and Characterization of Monoclonal Antibodies Against Tth DNA Polymerase and its Application to Hot-Start PCR. Protein Pept. Lett. 2021, 28, 1090–1098. [Google Scholar] [CrossRef]
  27. Nicosia, A.; Carollo, F.G.; Ferro, V. Effects of Boulder Arrangement on Flow Resistance Due to Macro-Scale Bed Roughness. Water 2023, 15, 349. [Google Scholar] [CrossRef]
  28. Escher, B.I.; Neale, P.A. Effect-based trigger values for mixtures of chemicals in surface water detected with in vitro bioassays. Environmental. Toxicol. Chem. 2021, 40, 487–499. [Google Scholar] [CrossRef]
  29. Morioka, T.; Nakamori, T.; Komiyama, K. A method to calculate antenna factor by a single site attenuation. In Proceedings of the 2004 Conference on Precision Electromagnetic Measurements, London, UK, 27 June–2 July 2004; IEEE: Piscataway, NJ, USA; pp. 198–199. [Google Scholar]
  30. Potash, E.; Steinschneider, S. A Bayesian approach to recreational water quality model validation and comparison in the presence of measurement error. Water Resour. Res. 2022, 58, e2021WR031115. [Google Scholar] [CrossRef]
  31. Zhao, X.M.; Yao, L.A.; Ma, Q.L.; Zhou, G.J.; Wang, L.; Fang, Q.L.; Xu, Z.C. Distribution and ecological risk assessment of cadmium in water and sediment in Longjiang River, China: Implication on water quality management after pollution accident. Chemosphere 2018, 194, 107–116. [Google Scholar] [CrossRef]
  32. Wu, X.; Xiong, S.; Mu, W. An Ensemble Method for Feature Screening. Mathematics 2023, 11, 362. [Google Scholar] [CrossRef]
  33. Qin, H.H.; Huang, B.X.; Hao, W.U.; Gan, J.Y.; Zhou, Y.Z.; Xiong, W.Y.; Yi, Z.G. Water Demand Prediction in North China Plain Based on SD Model and Scenario Analysis Method. Water Sav. Irrig. 2022, 2, 59–65. [Google Scholar]
  34. Zhang, J.; Ma, S.; Song, Y. Hydrological and water quality simulation and future runoff prediction under CMIP6 scenario in the upstream basin of Miyun Reservoir. J. Water Clim. Chang. 2022, 13, 2505–2530. [Google Scholar] [CrossRef]
  35. Sun, K.; Hu, L.; Sun, J.; Zhai, Y.; Zhang, S.; Cao, X. Quantifying the contribution of ecological water replenishment on aquifer recovery using a refined groundwater model. Sci. Total Environ. 2023, 857, 159216. [Google Scholar] [CrossRef] [PubMed]
  36. Elshemy, M.; Khadr, M.; Atta, Y.; Ahmed, A. Hydrodynamic and water quality modeling of Lake Manzala (Egypt) under data scarcity. Environ. Earth Sci. 2016, 75, 1329. [Google Scholar] [CrossRef]
  37. Yang, X.; Chen, Z. A hybrid approach based on Monte Carlo simulation-VIKOR method for water quality assessment. Ecol. Indic. 2023, 150, 110202. [Google Scholar] [CrossRef]
Figure 1. Location of the Bai River in the Henan section of the South–North Water Diversion Project.
Water 15 01871 g001
Figure 2. Ecolab module calculation flow chart.
Water 15 01871 g002
Figure 3. MIKE21 coupled hydrodynamic–water-quality model simulation process.
Water 15 01871 g003
Figure 4. Gridding of the Bai River study section.
Water 15 01871 g004
Figure 5. Location of the Bai River boundary.
Water 15 01871 g005
Figure 6. Variation of water-quality indicators in the Bai River over time.
Water 15 01871 g006
Figure 7. Verification of water levels in the Bai River hydrodynamic model.
Water 15 01871 g007
Figure 8. Comparison of simulated and measured water levels at Nanyang Penyao station in 2020.
Water 15 01871 g008
Figure 9. Simulated errors in water levels at Nanyang Penyao station in 2020.
Water 15 01871 g009
Figure 10. Comparison of simulated and measured water levels at Nanyang Shangfanying station in 2020.
Water 15 01871 g010
Figure 11. Simulated errors in water levels at Nanyang Shangfanying station in 2020.
Water 15 01871 g011
Figure 12. Comparison of simulated and measured water quality of the Bai River in 2020.
Water 15 01871 g012
Figure 13. Absolute error rate of each water-quality index of the Bai River in 2020.
Water 15 01871 g013
Figure 14. Location map of monitoring points in the Bai River.
Water 15 01871 g014
Figure 15. Scenario 1: Cloud map of hourly average concentration of each water-quality index.
Water 15 01871 g015
Figure 16. Scenario 2: Distribution of hourly average concentration of each water-quality index cloud.
Water 15 01871 g016
Figure 17. Scenario 3: Cloud map of hourly average concentration distribution of water-quality indicators.
Water 15 01871 g017
Figure 18. Scenarios 1~3: water-quality improvement at M1~M3.
Water 15 01871 g018
Table 1. Model parameter settings.
ParametersValueUnit
Evaporation of precipitationMeasured sequence valuesmm
Wind farmsMeasured sequence valuesm/s
Kochlik7.92 × 10−5s−1
Eddy viscosity coefficient0.3
Salinity0
Water temperature17
Diffusion coefficient0.3
COD degradation factor0.19/day
TP degradation factor0.07/day
CODMn degradation factor0.02/day
NH3-N degradation factor0.16/day
DO degradation factor0.06/day
Table 2. Water-quality evaluation results of the Bai River from 2010 to 2020.
YearDOCODMnCODNH3-NTPGrade
20105.364.4636.130.520.07V
20116.965.6629.590.380.69V
20126.026.0436.380.630.53V
20136.984.7528.430.720.13IV
20146.725.8631.401.030.28V
20154.927.5938.910.670.14V
20165.916.0533.220.530.14V
20176.126.0335.530.480.78V
20187.225.1724.010.470.28IV
20197.514.8318.550.380.16III
20208.644.1616.290.300.14III
Standard deviation1.000.927.120.190.24
Table 3. Deterministic coefficients of each water-quality index of the Bai River.
DOCODCODMnNH3-NTP
R-square0.840.930.940.910.90
Table 4. Scenario setting table.
Flow Rate (m3/s)Initial Water QualityHydration Flow RateHydration DurationScenario Setting
(m3/s)
12.04Grade Ⅳ2Q1/2TScenario 1
12.04Grade ⅣQTScenario 2
12.04Grade Ⅳ1/2Q2TScenario 3
Table 5. Scenarios 1 to 3: simulation results for each control point. Unit: mg/L.
ScenarioDetection PointsDOCODCODMnNH3-NTP
M19.2314.264.610.370.09
Scenario1M25.8414.544.710.540.10
M35.6514.284.660.540.11
M19.1214.625.100.460.11
Scenario2M25.6116.005.370.870.15
M35.5815.745.150.840.13
M19.0014.655.500.550.12
Scenario3M25.5218.005.980.960.19
M35.4116.636.200.920.18
Disclaimer/Publisher’s Note: The statements, opinions and data contained in all publications are solely those of the individual author(s) and contributor(s) and not of MDPI and/or the editor(s). MDPI and/or the editor(s) disclaim responsibility for any injury to people or property resulting from any ideas, methods, instructions or products referred to in the content.