
Multiwater Index Synergistic Monitoring of Typical Wetland Water Bodies in the Arid Regions of West-Central Ningxia over 30 Years

Abstract
1. Introduction
2. Materials and Methods
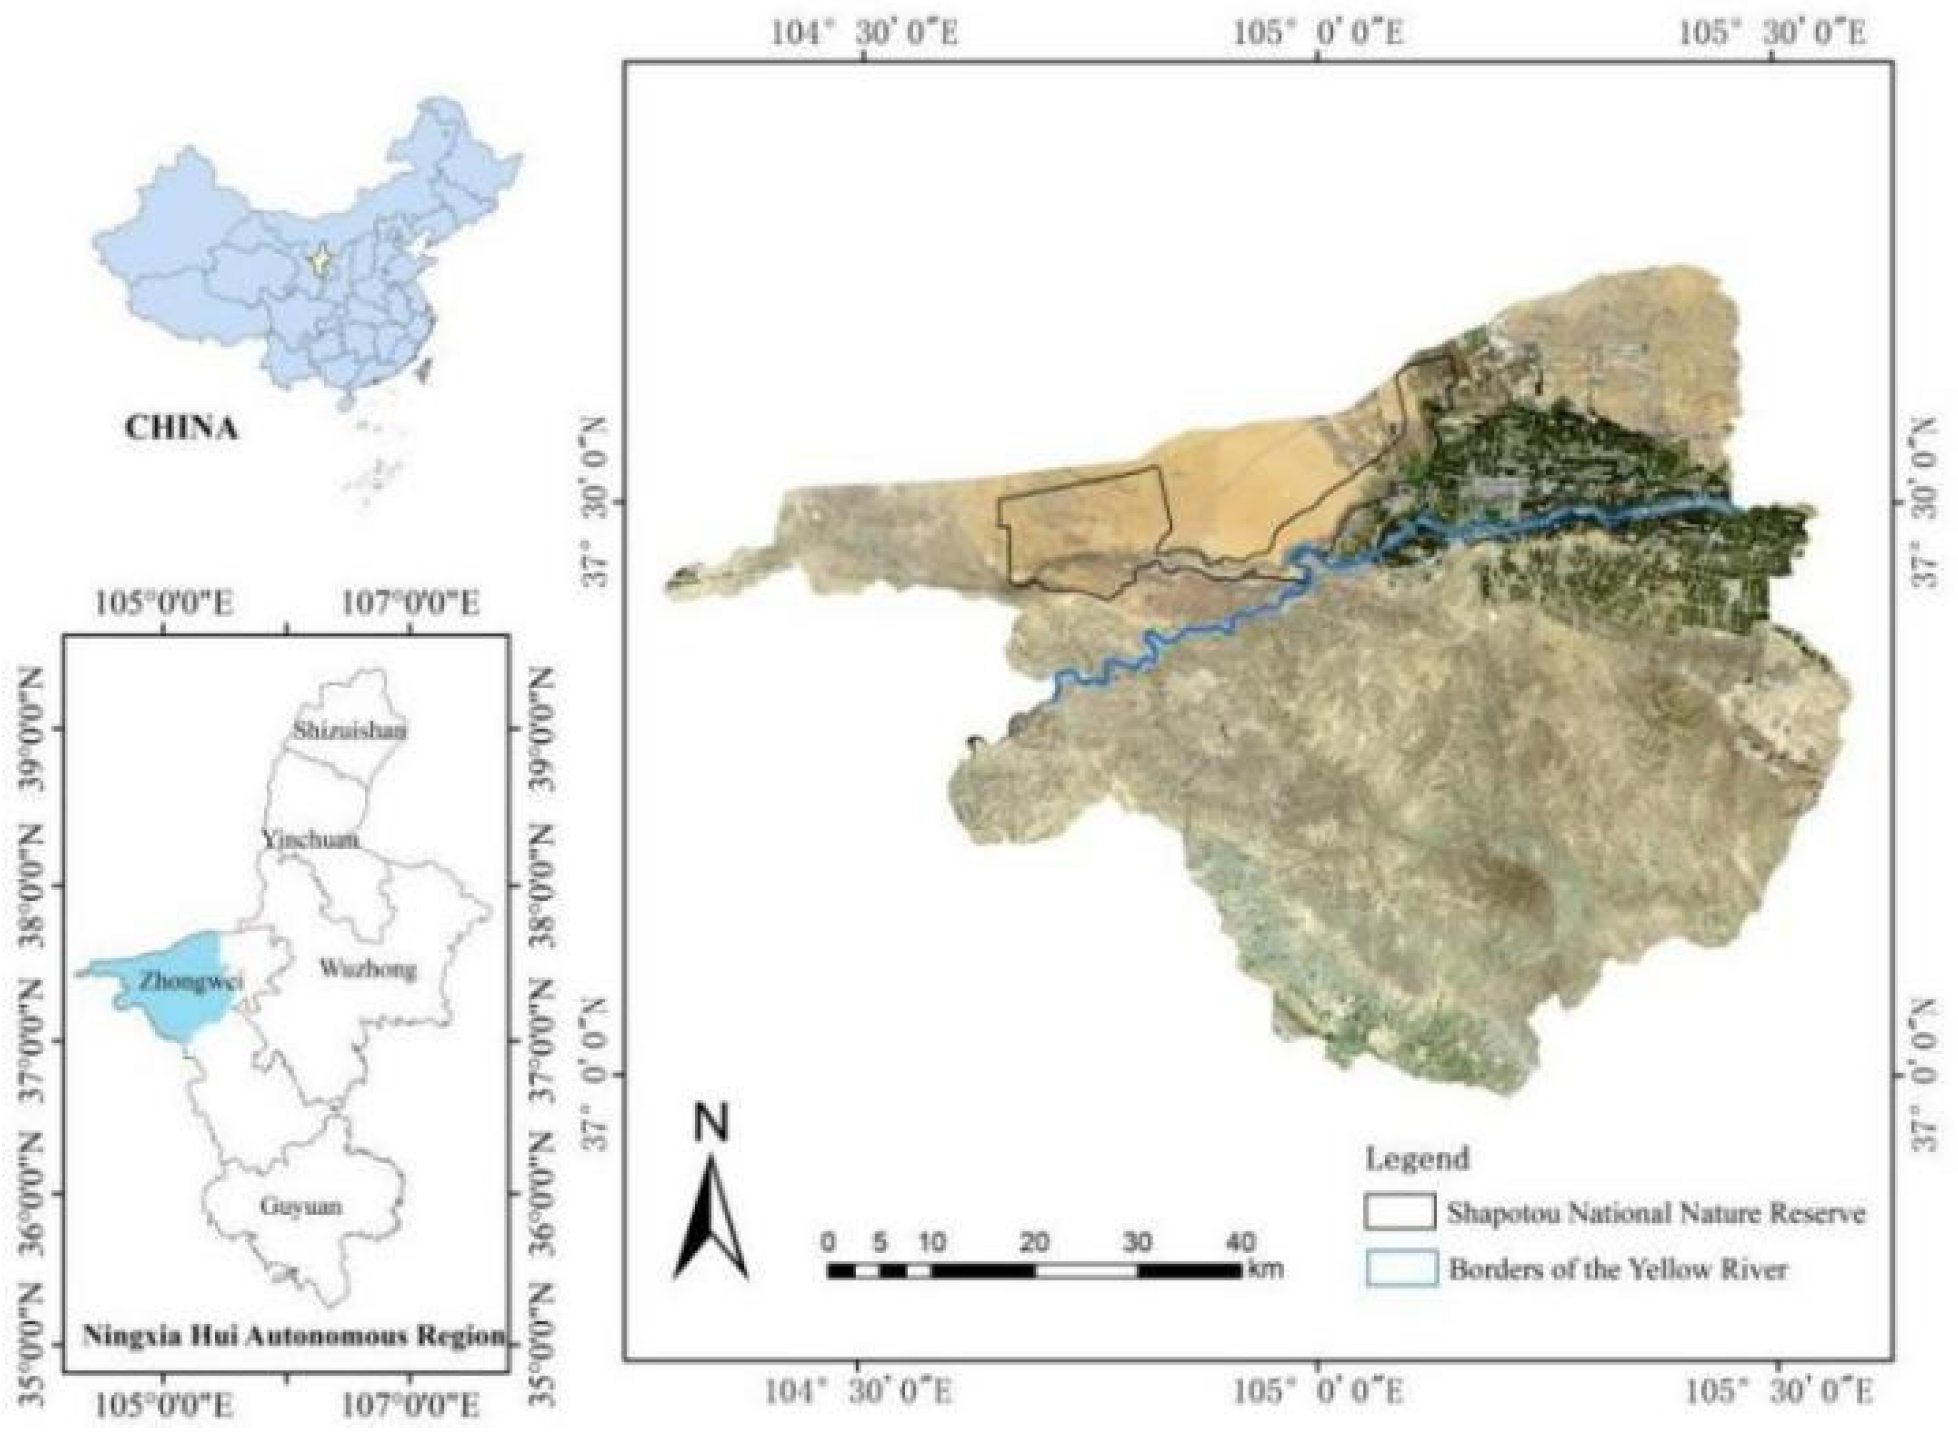
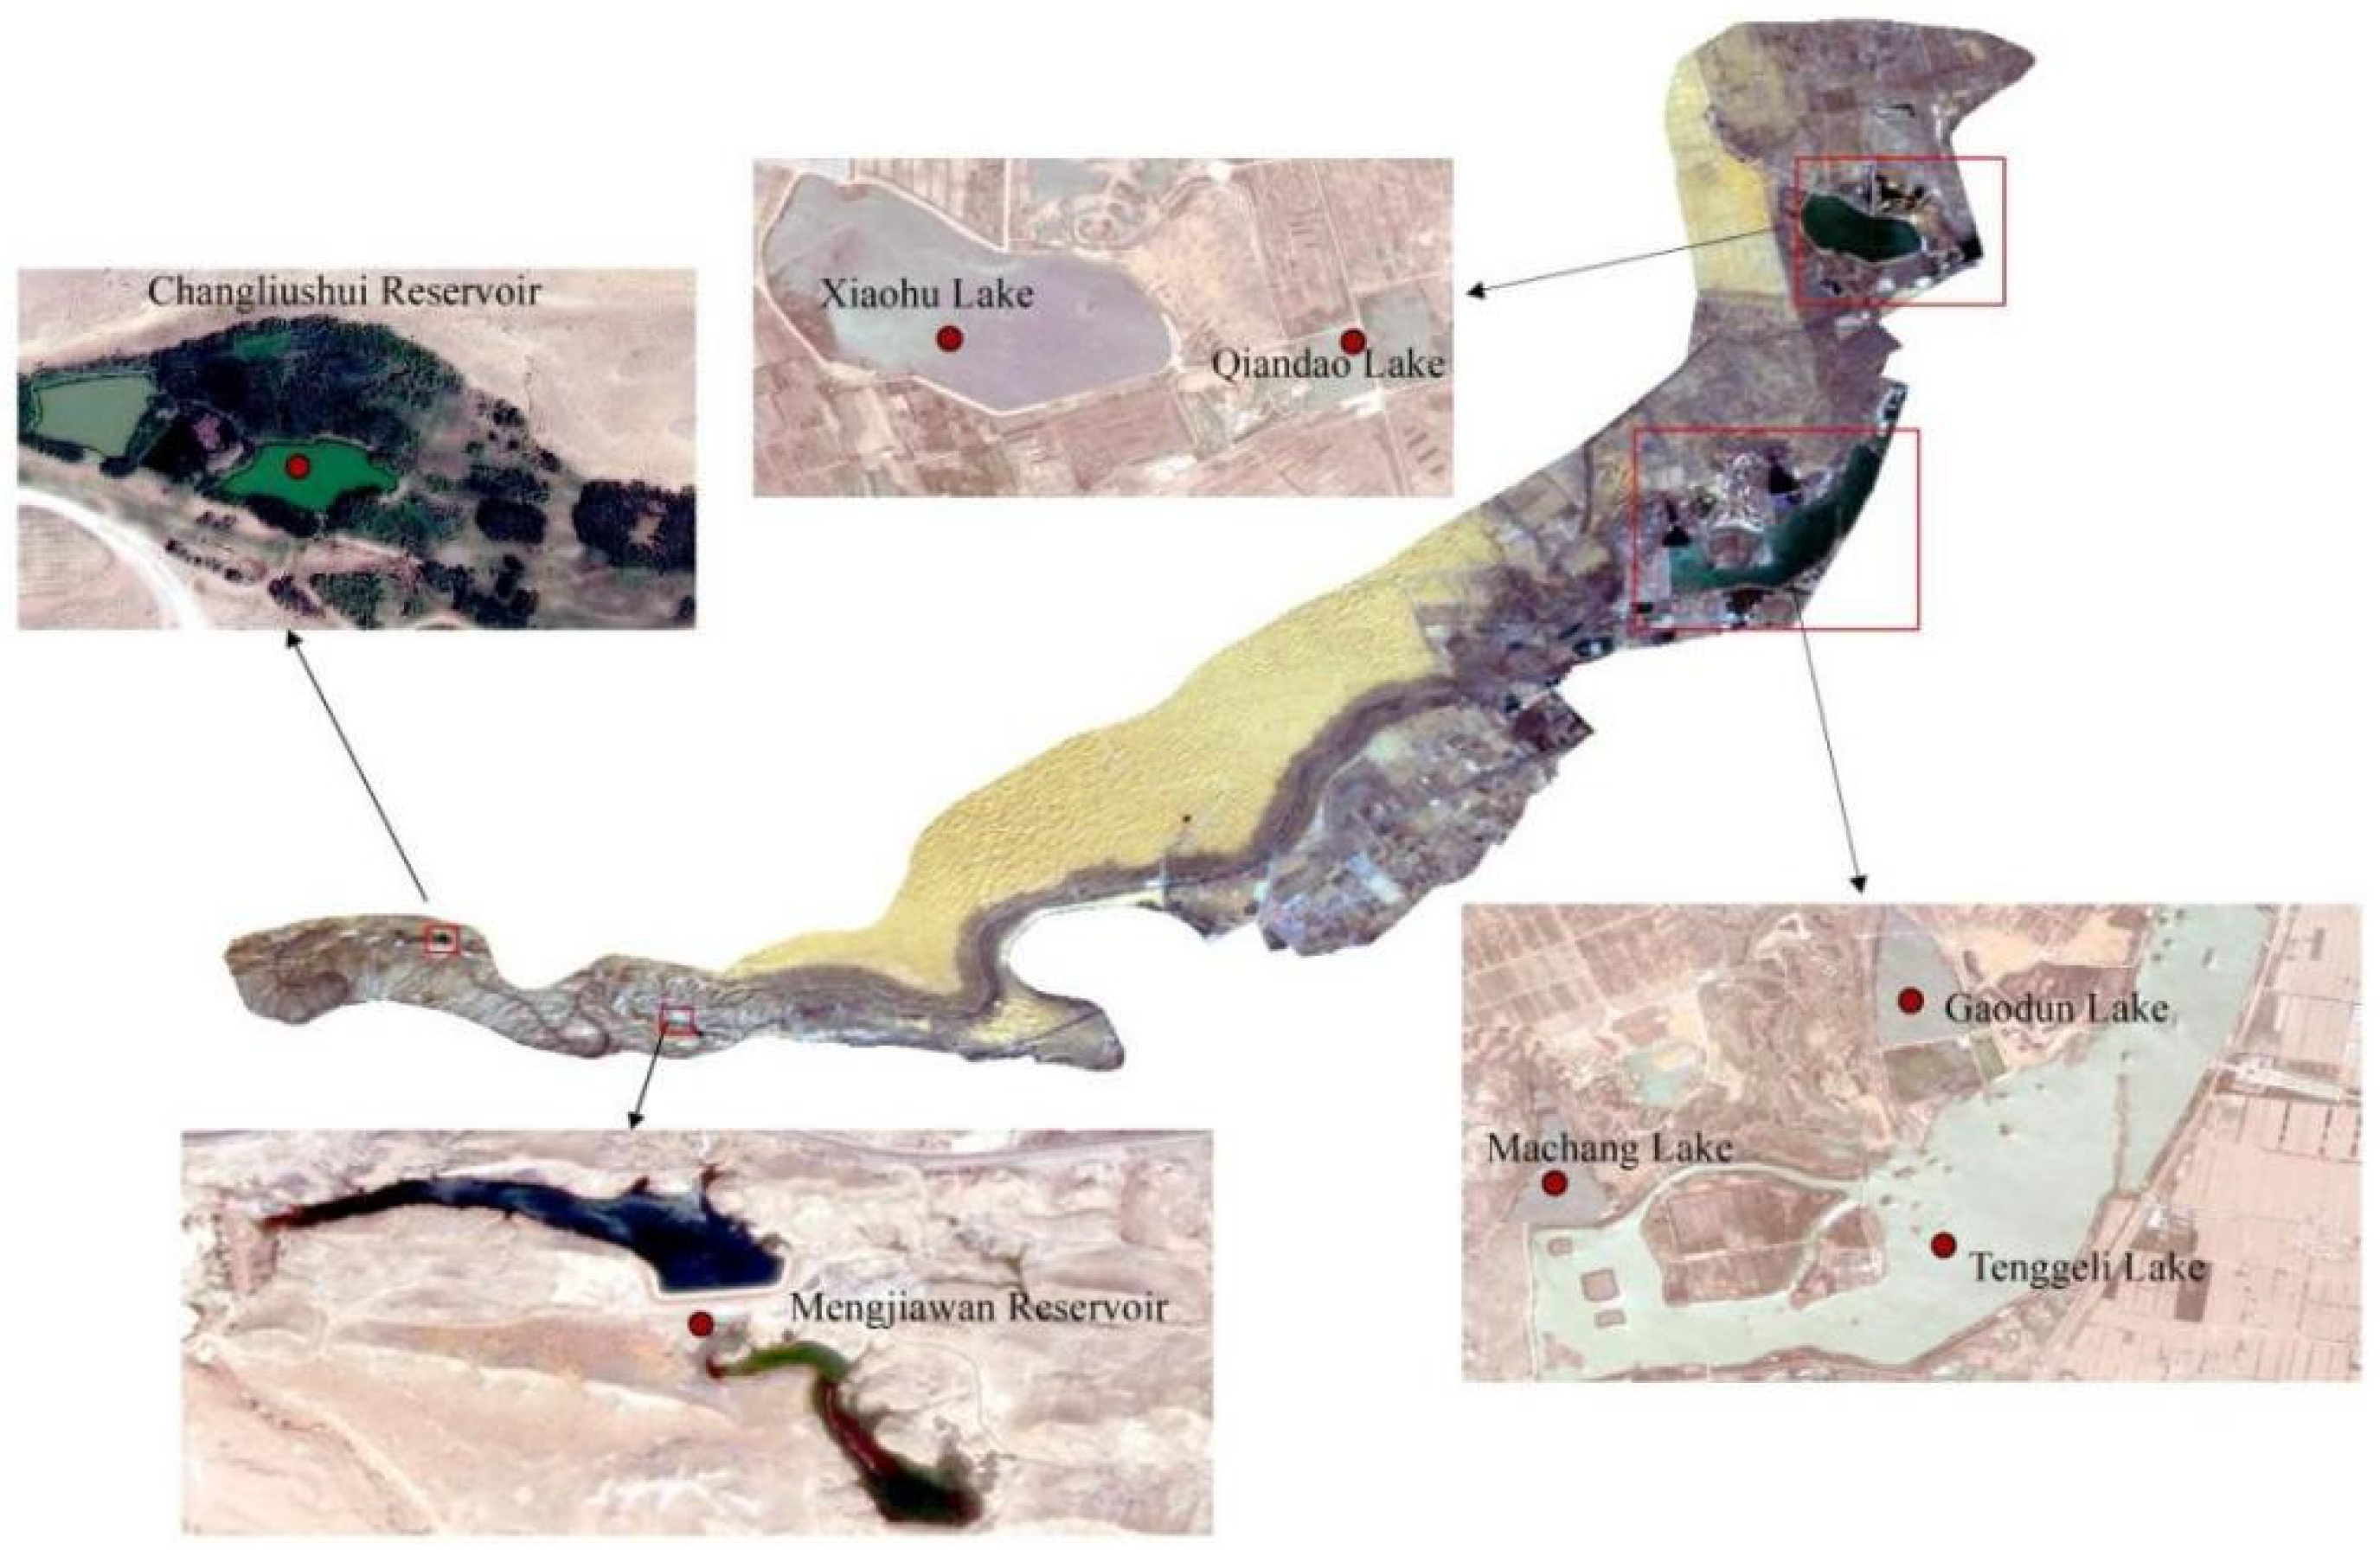
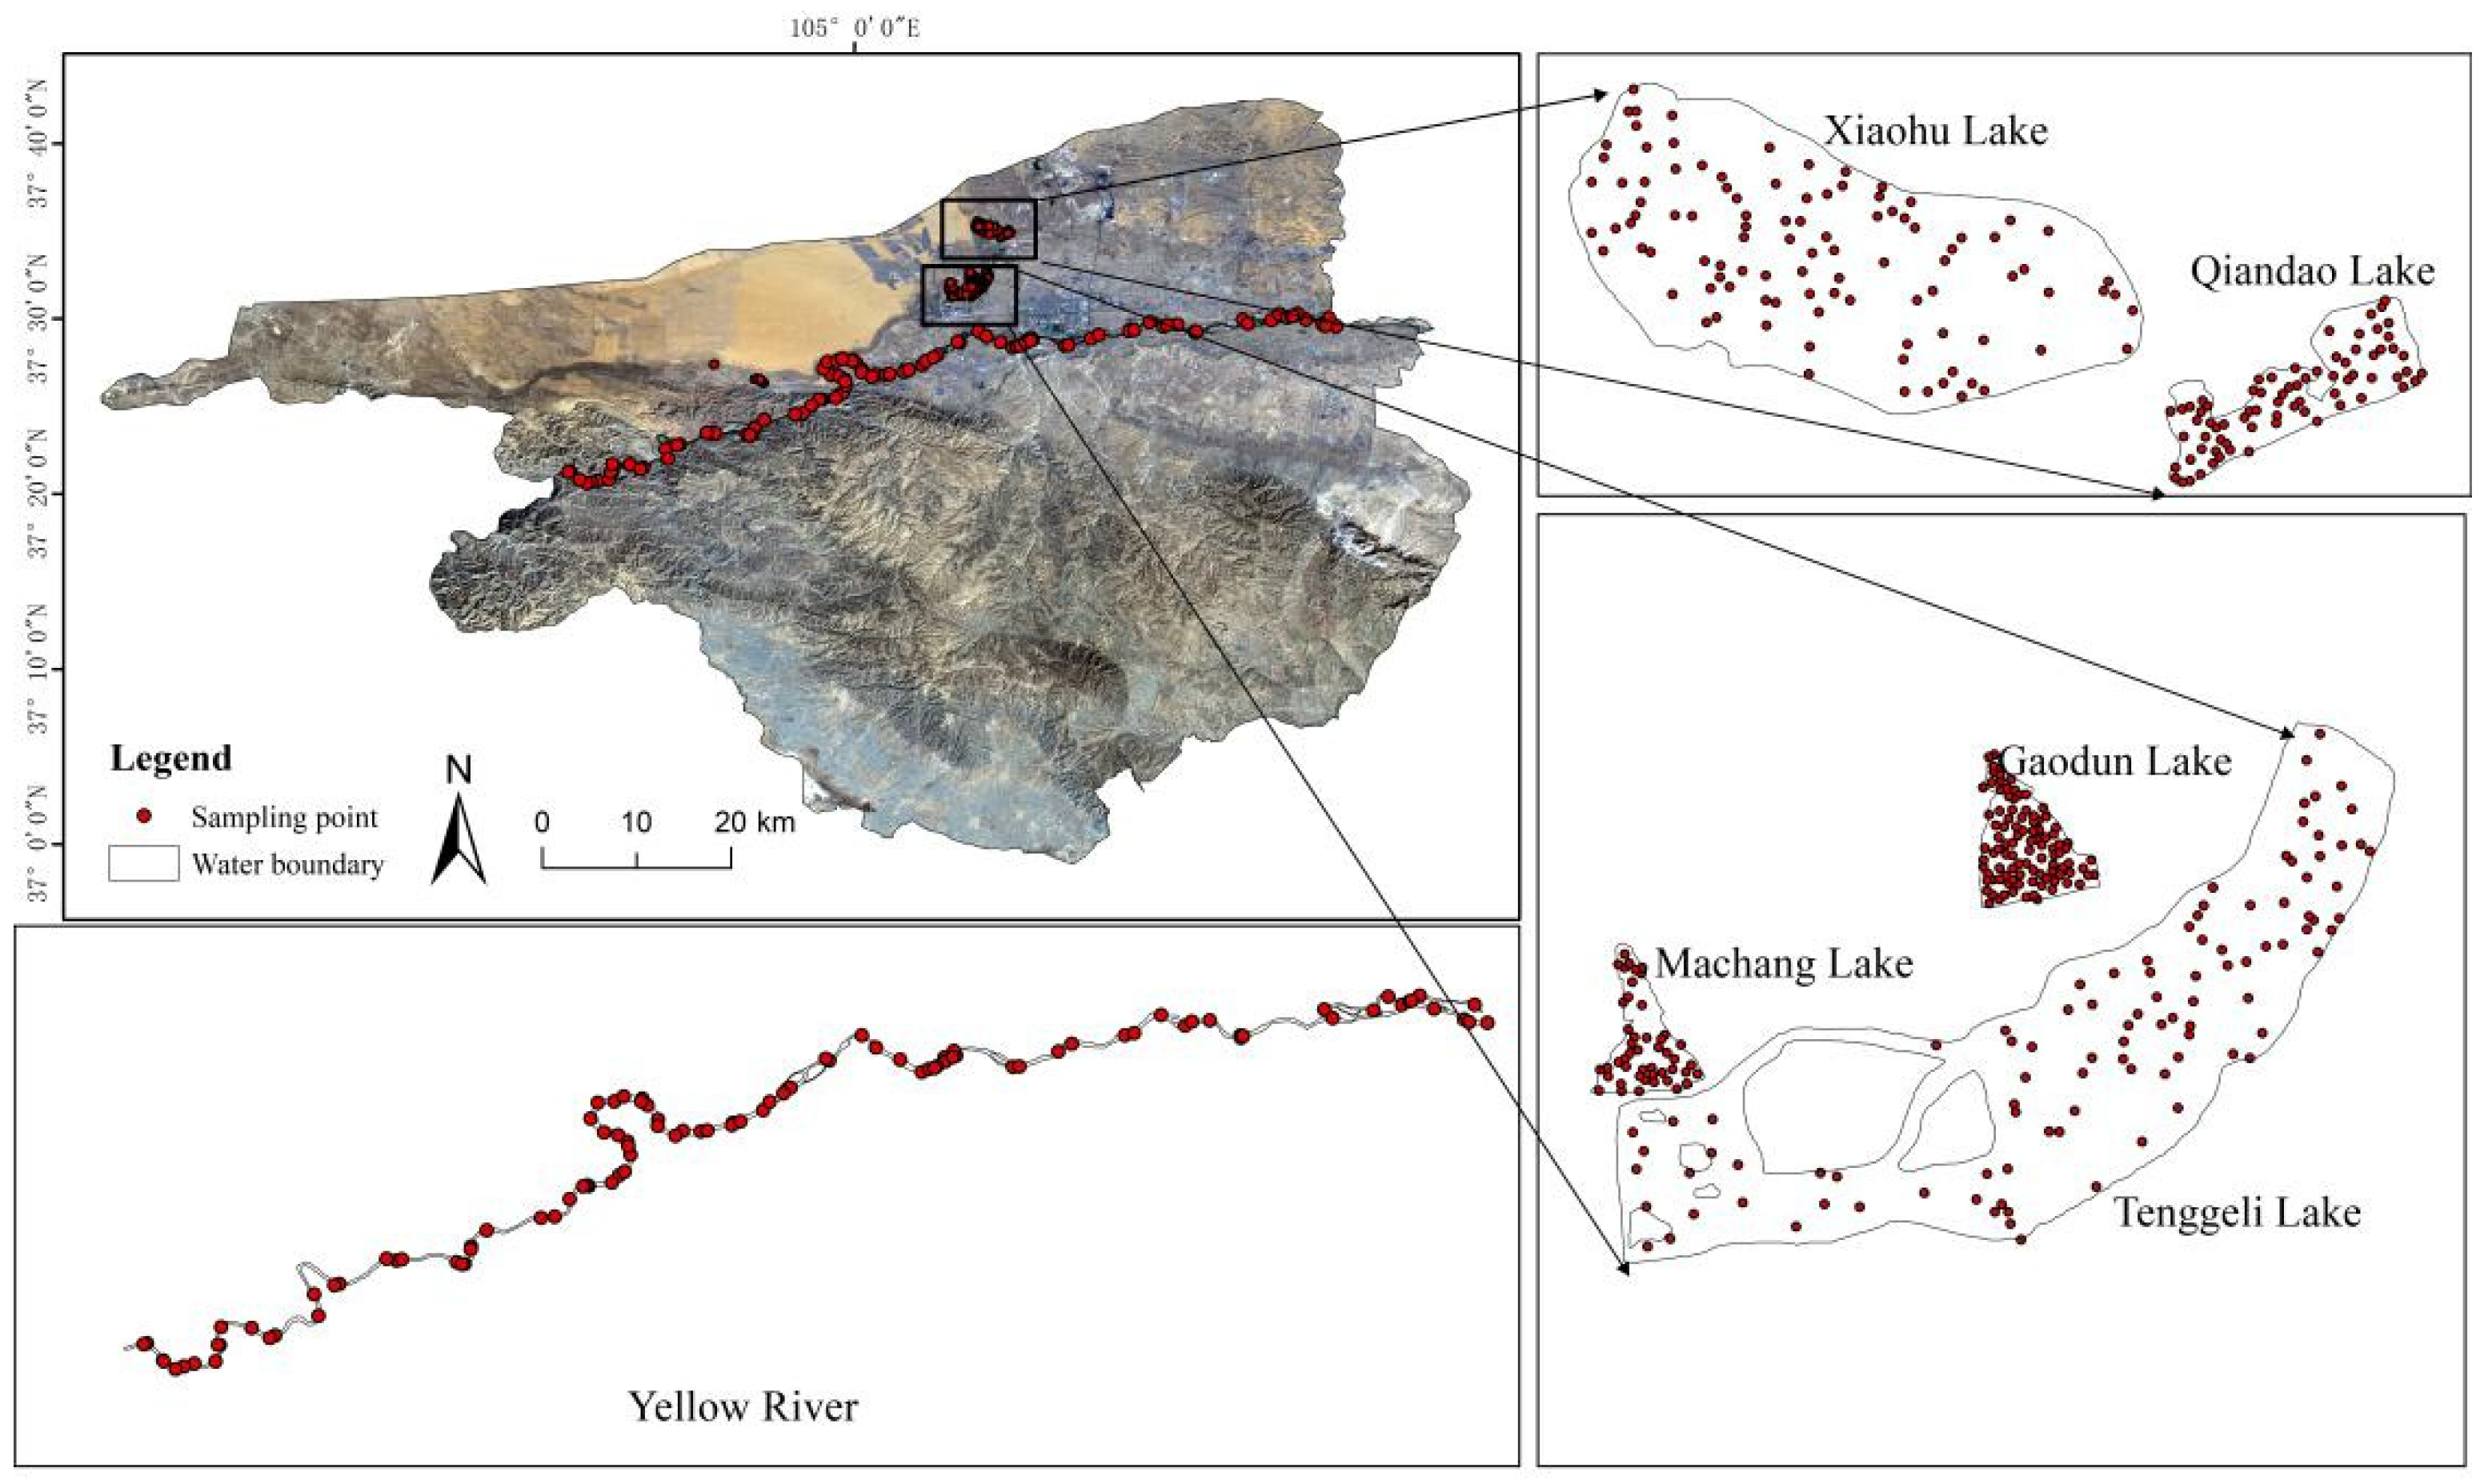
2.1. Study Area
2.2. Data
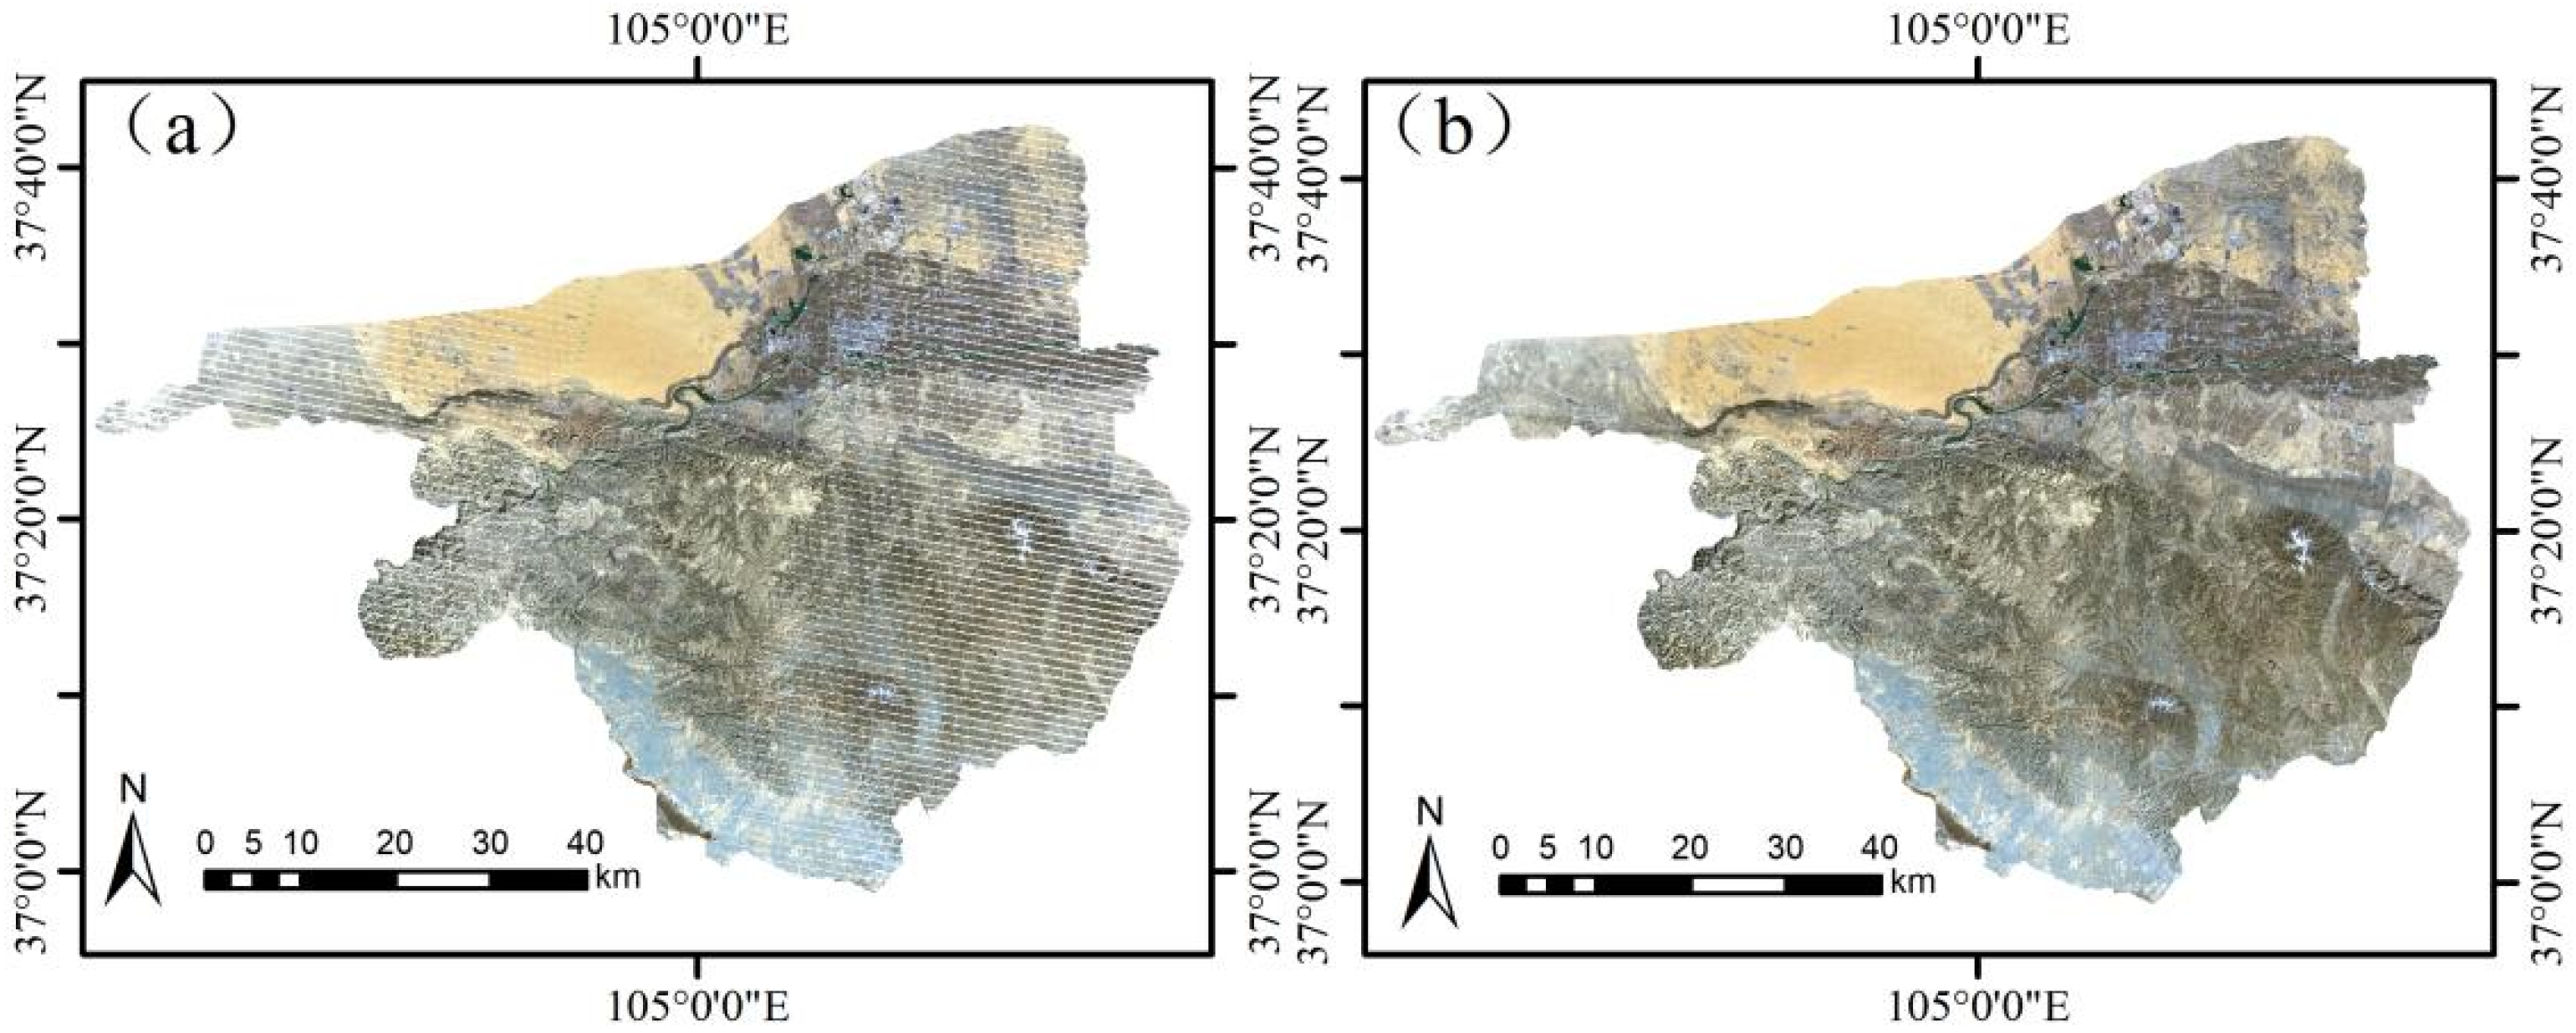
2.2.1. Landsat Series Data
2.2.2. Google Earth Satellite Imagery
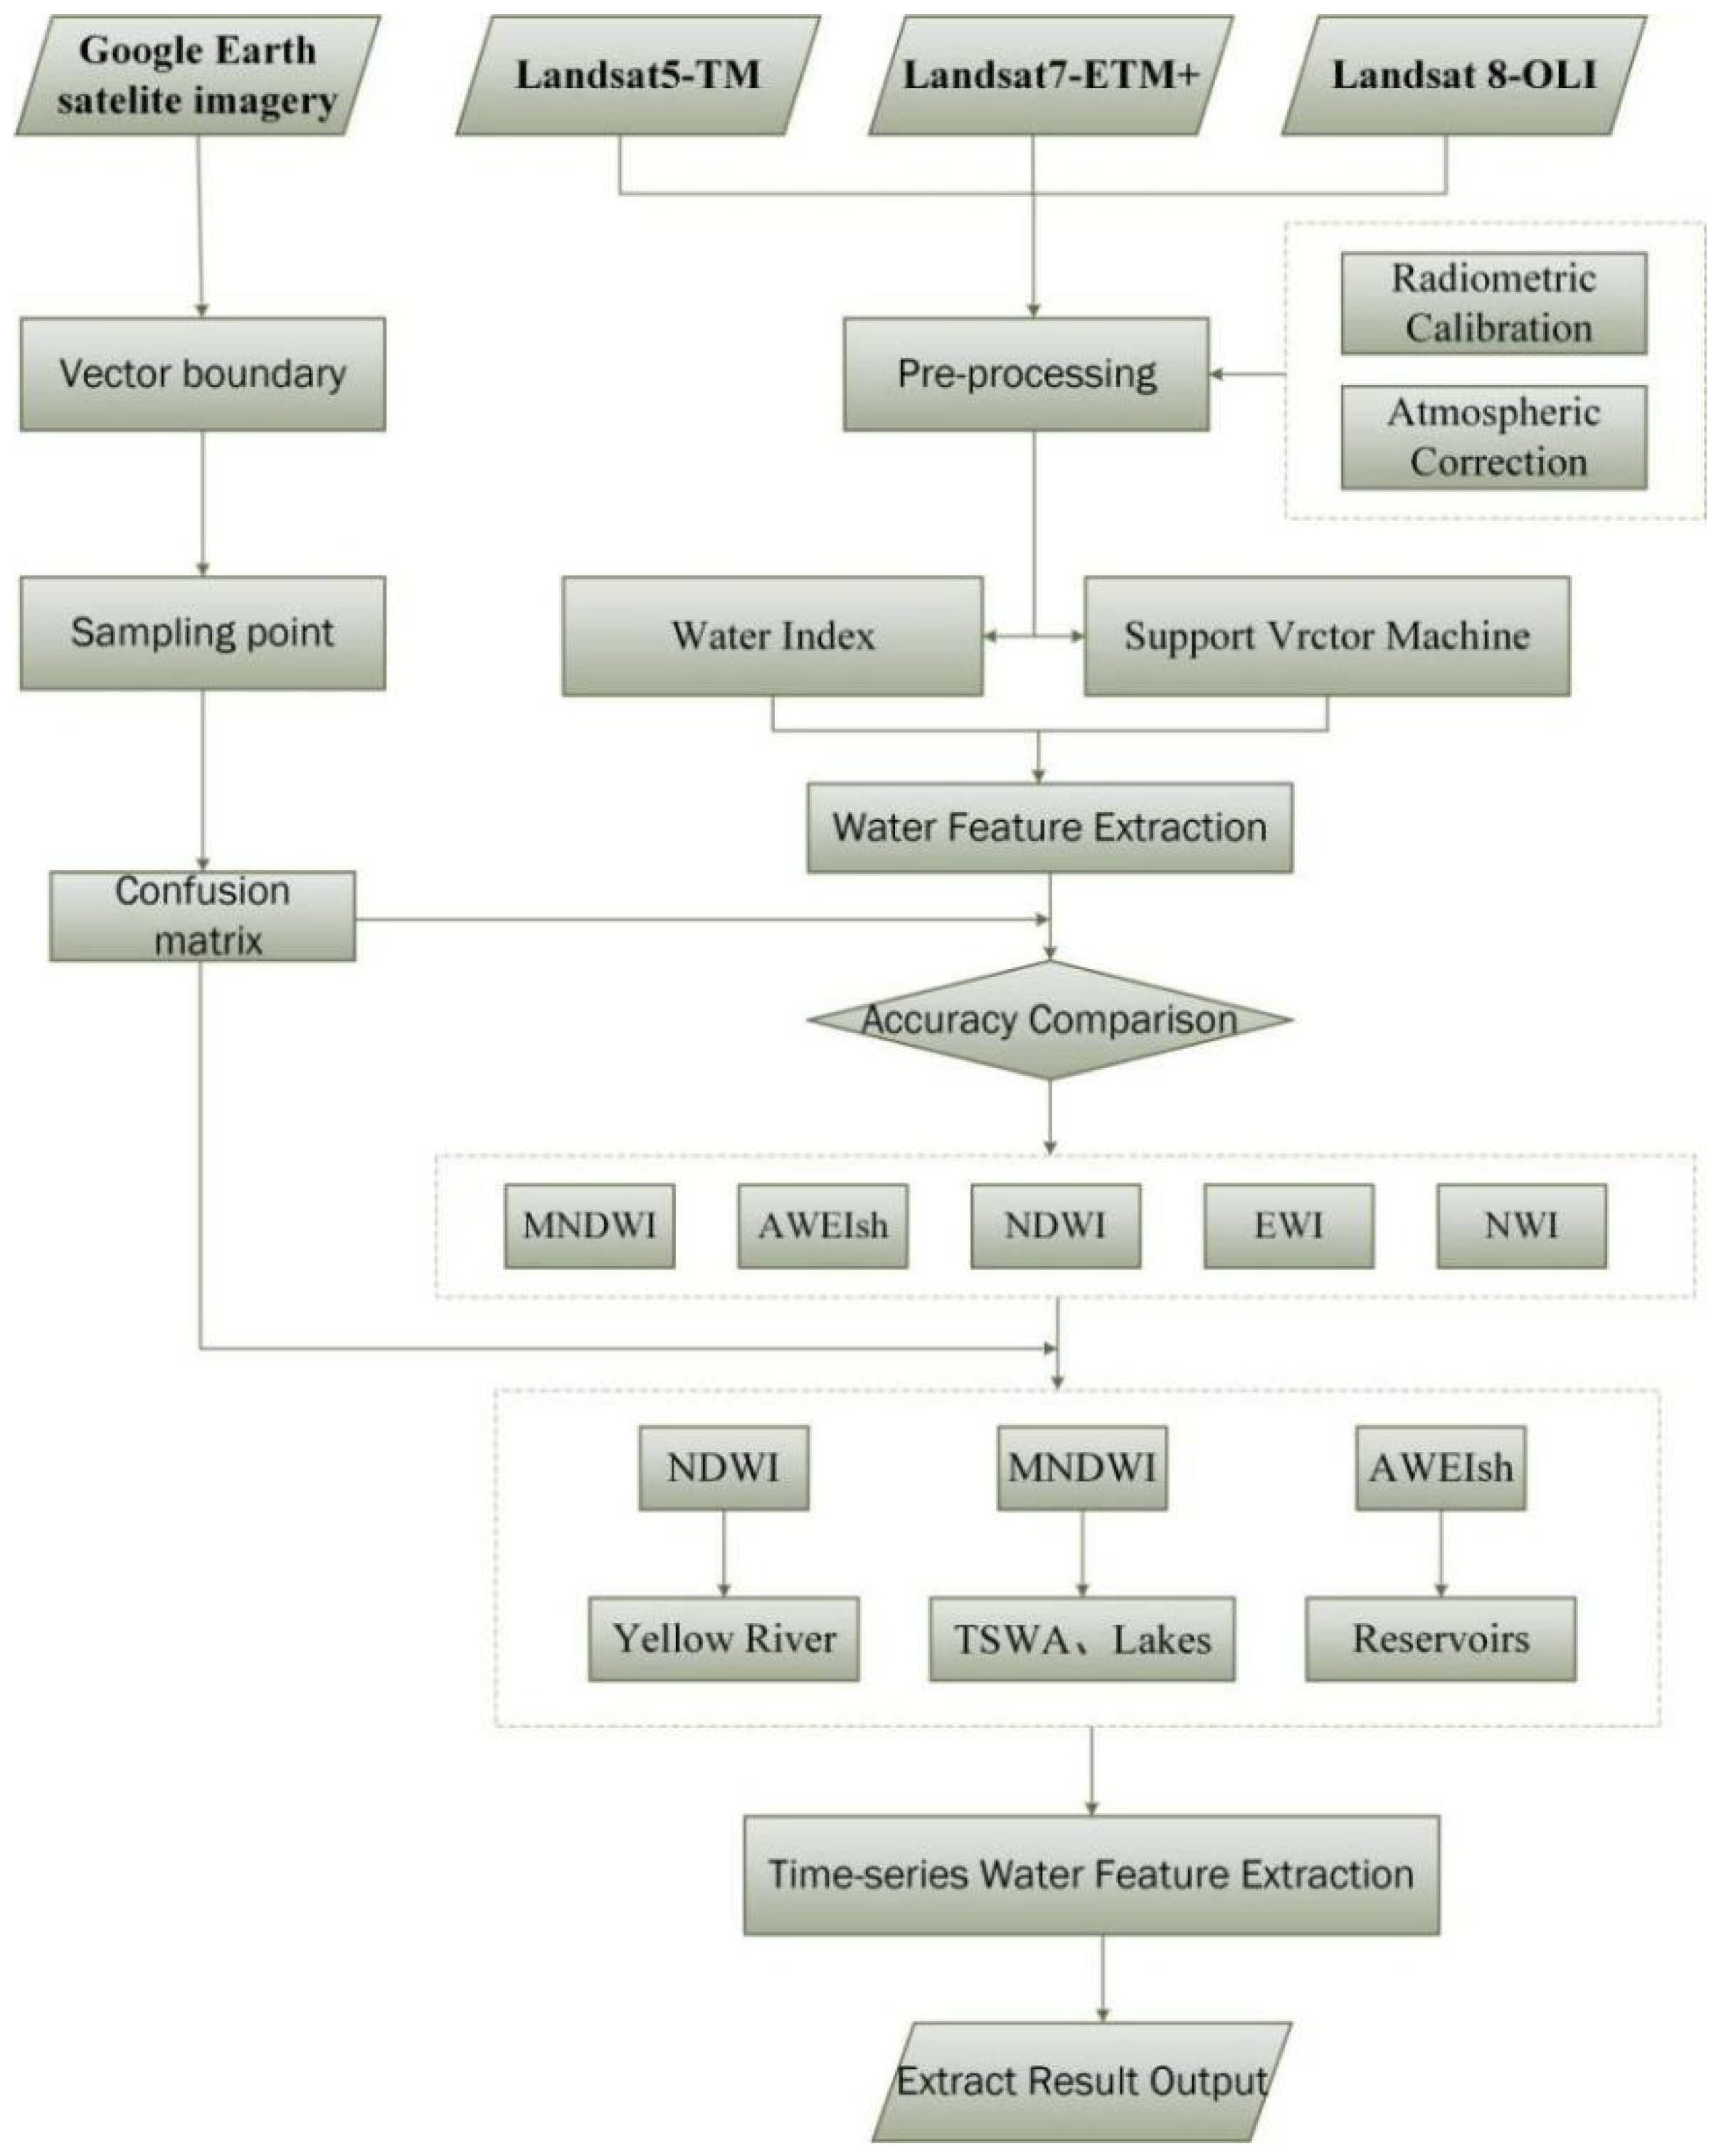
2.3. Methods
2.3.1. Water Indices
2.3.2. Accuracy Verification
2.3.3. Threshold Selection
2.3.4. Support Vector Machine Classification
2.3.5. Trend Slope Analysis Method
2.3.6. Pearson Correlation Coefficient
3. Results and Discussion
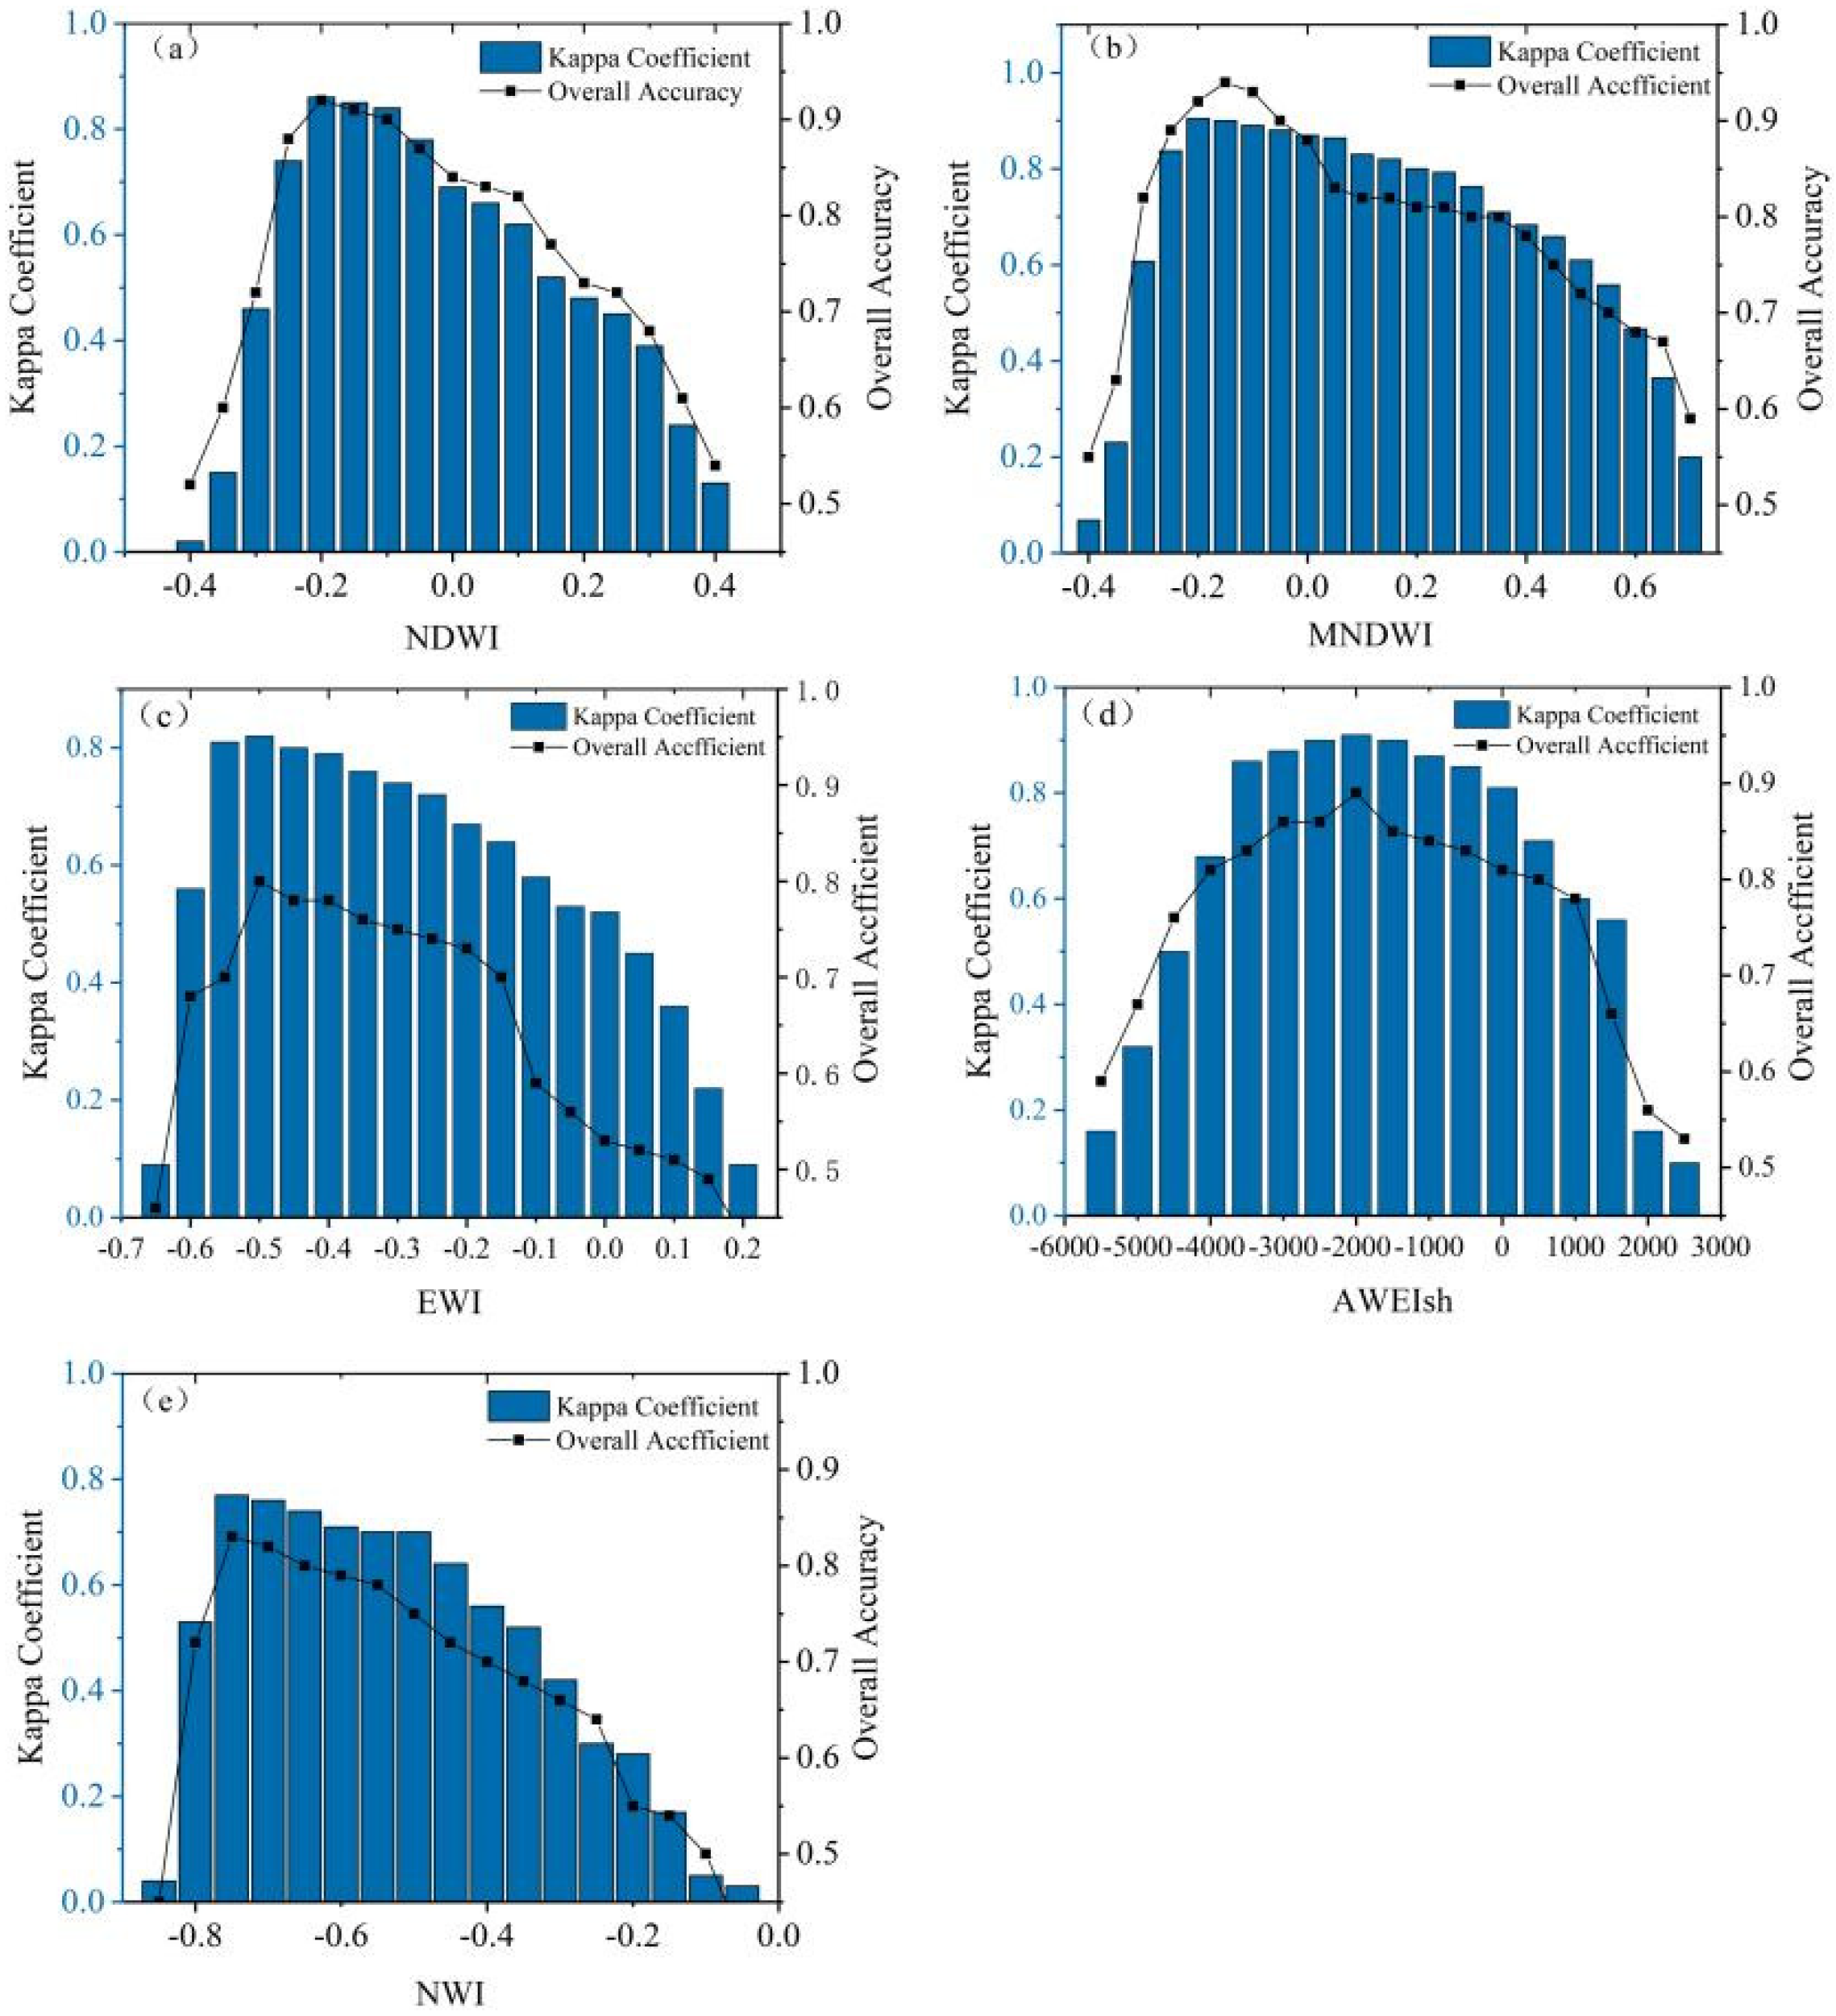
3.1. Initial Experimental Threshold Selection Results
3.2. Water Index and SVM Water Extraction Accuracy
3.2.1. Extraction Accuracy of Water Index
3.2.2. SVM Extraction Accuracy
3.3. Water Index Accuracy of Different Types of Water Bodies
3.4. Extraction Effect of Different Types of Water
3.4.1. Total Surface Water Area (TSWA)
3.4.2. Lakes
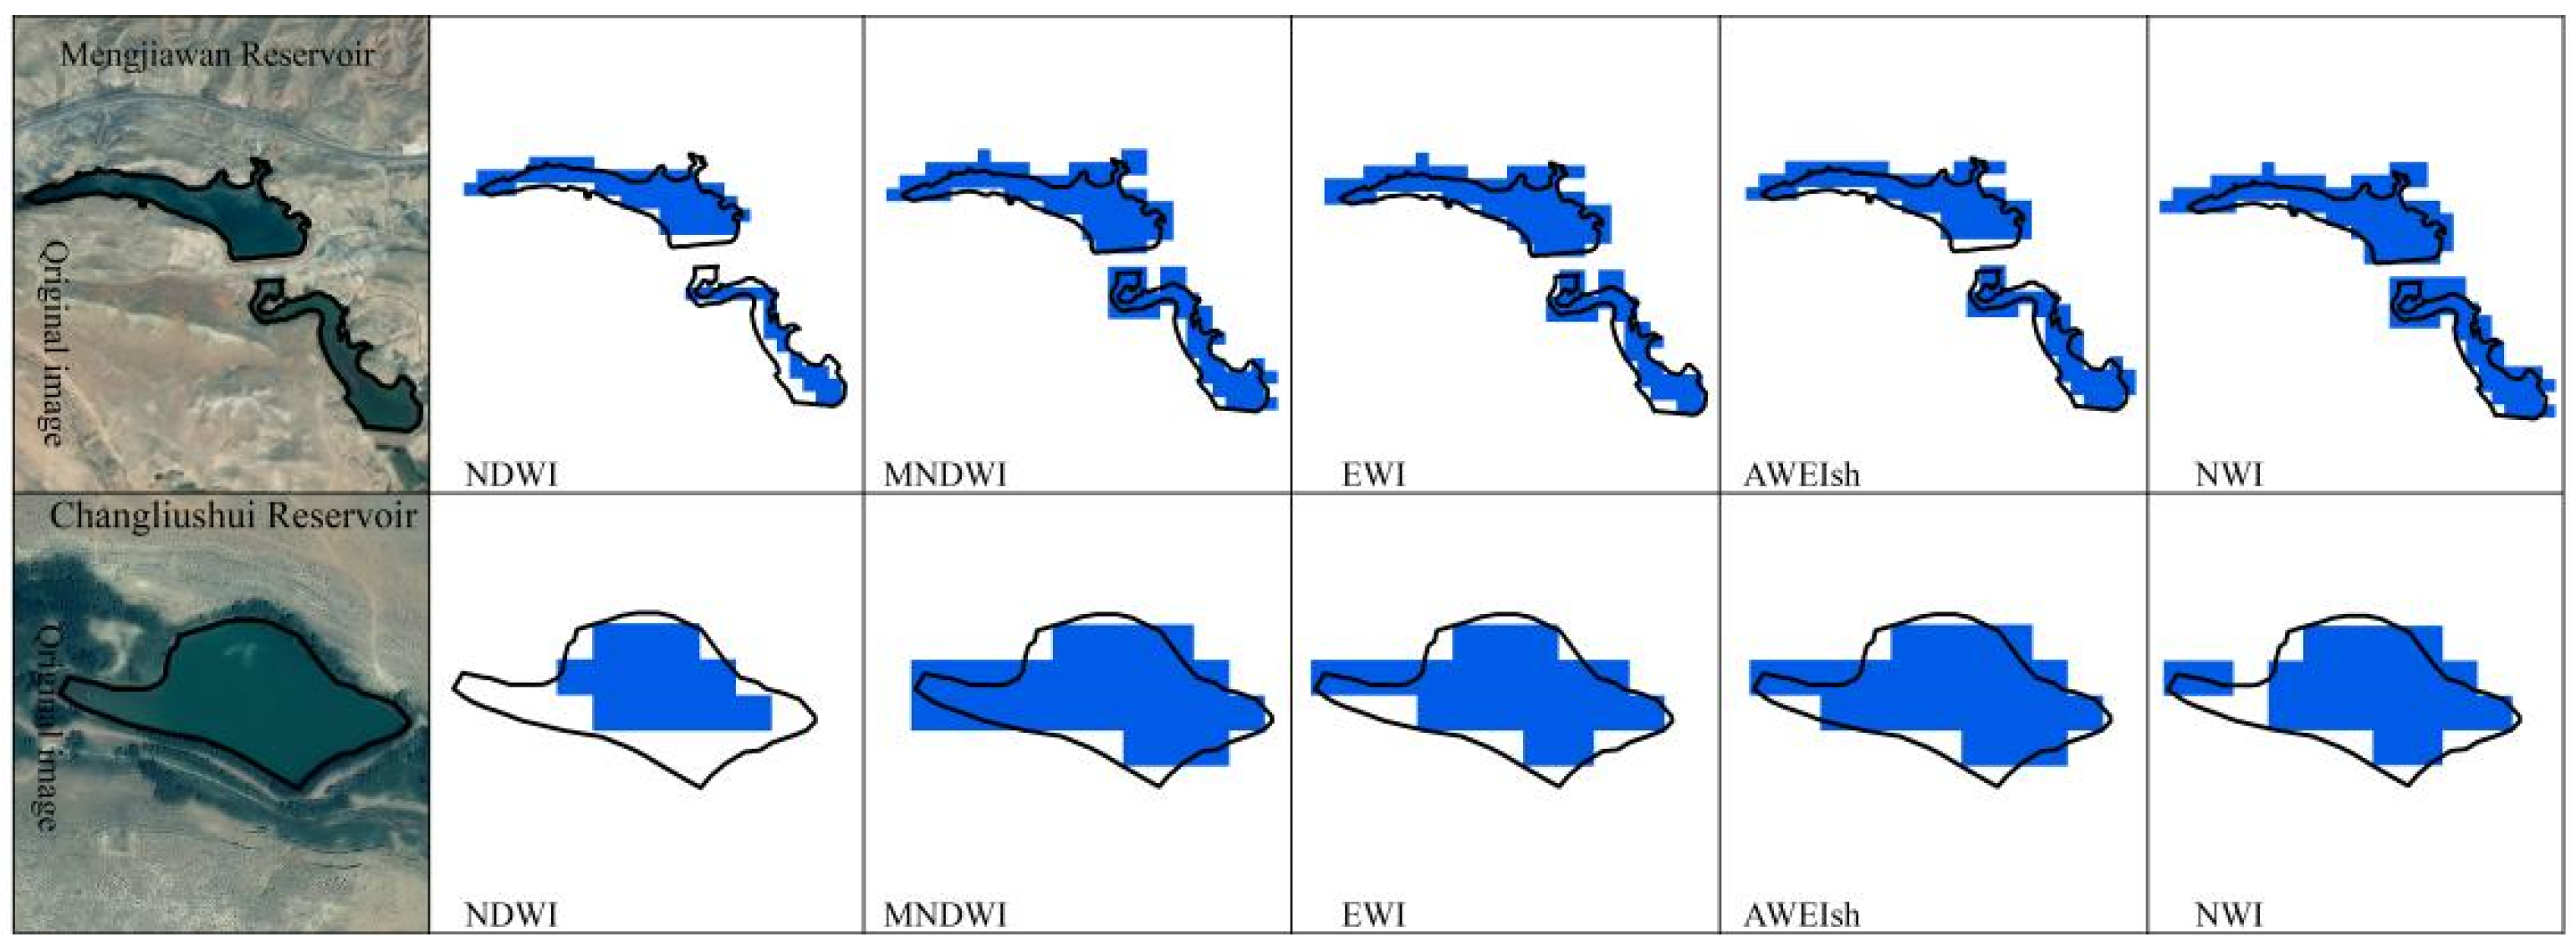
3.4.3. Reservoirs
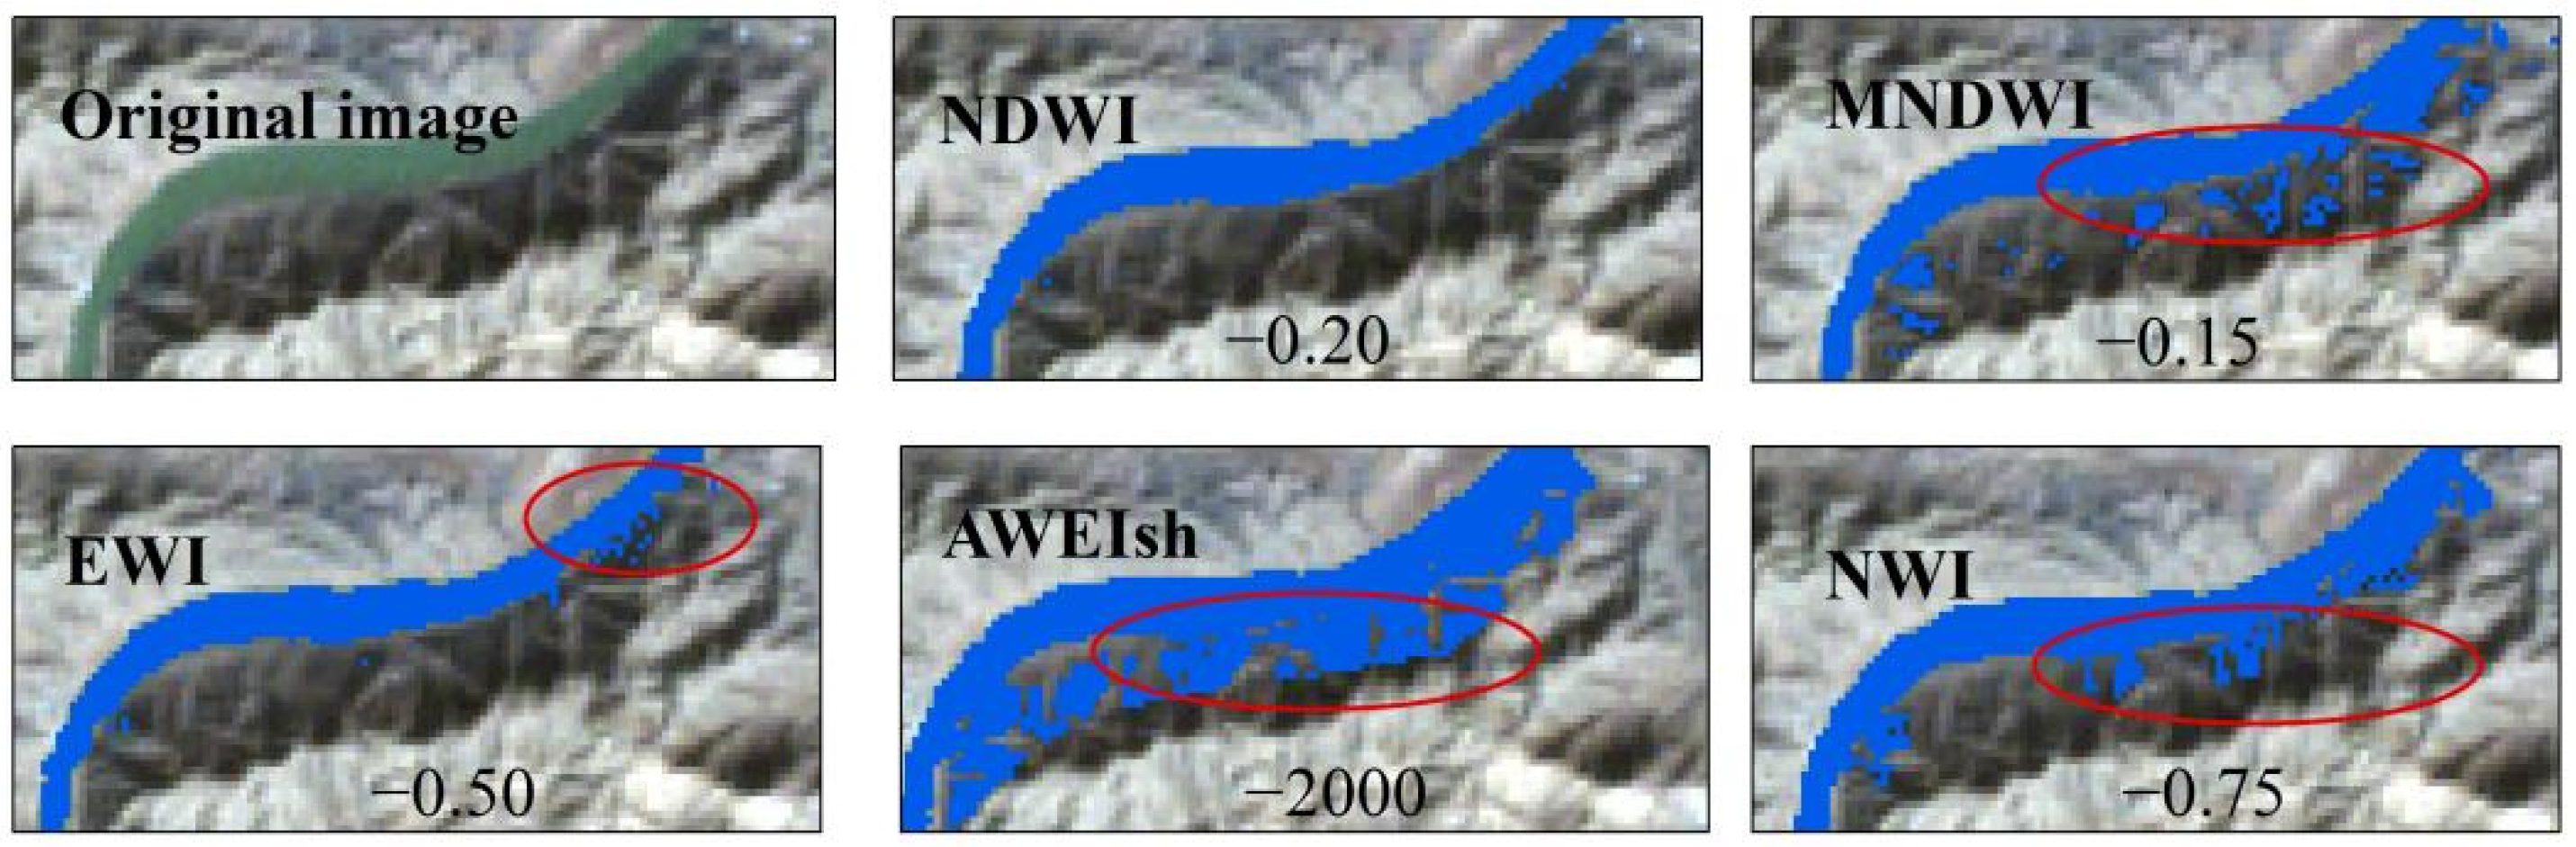
3.4.4. Yellow River
3.4.5. Optimal Threshold and Accuracy Verification Results
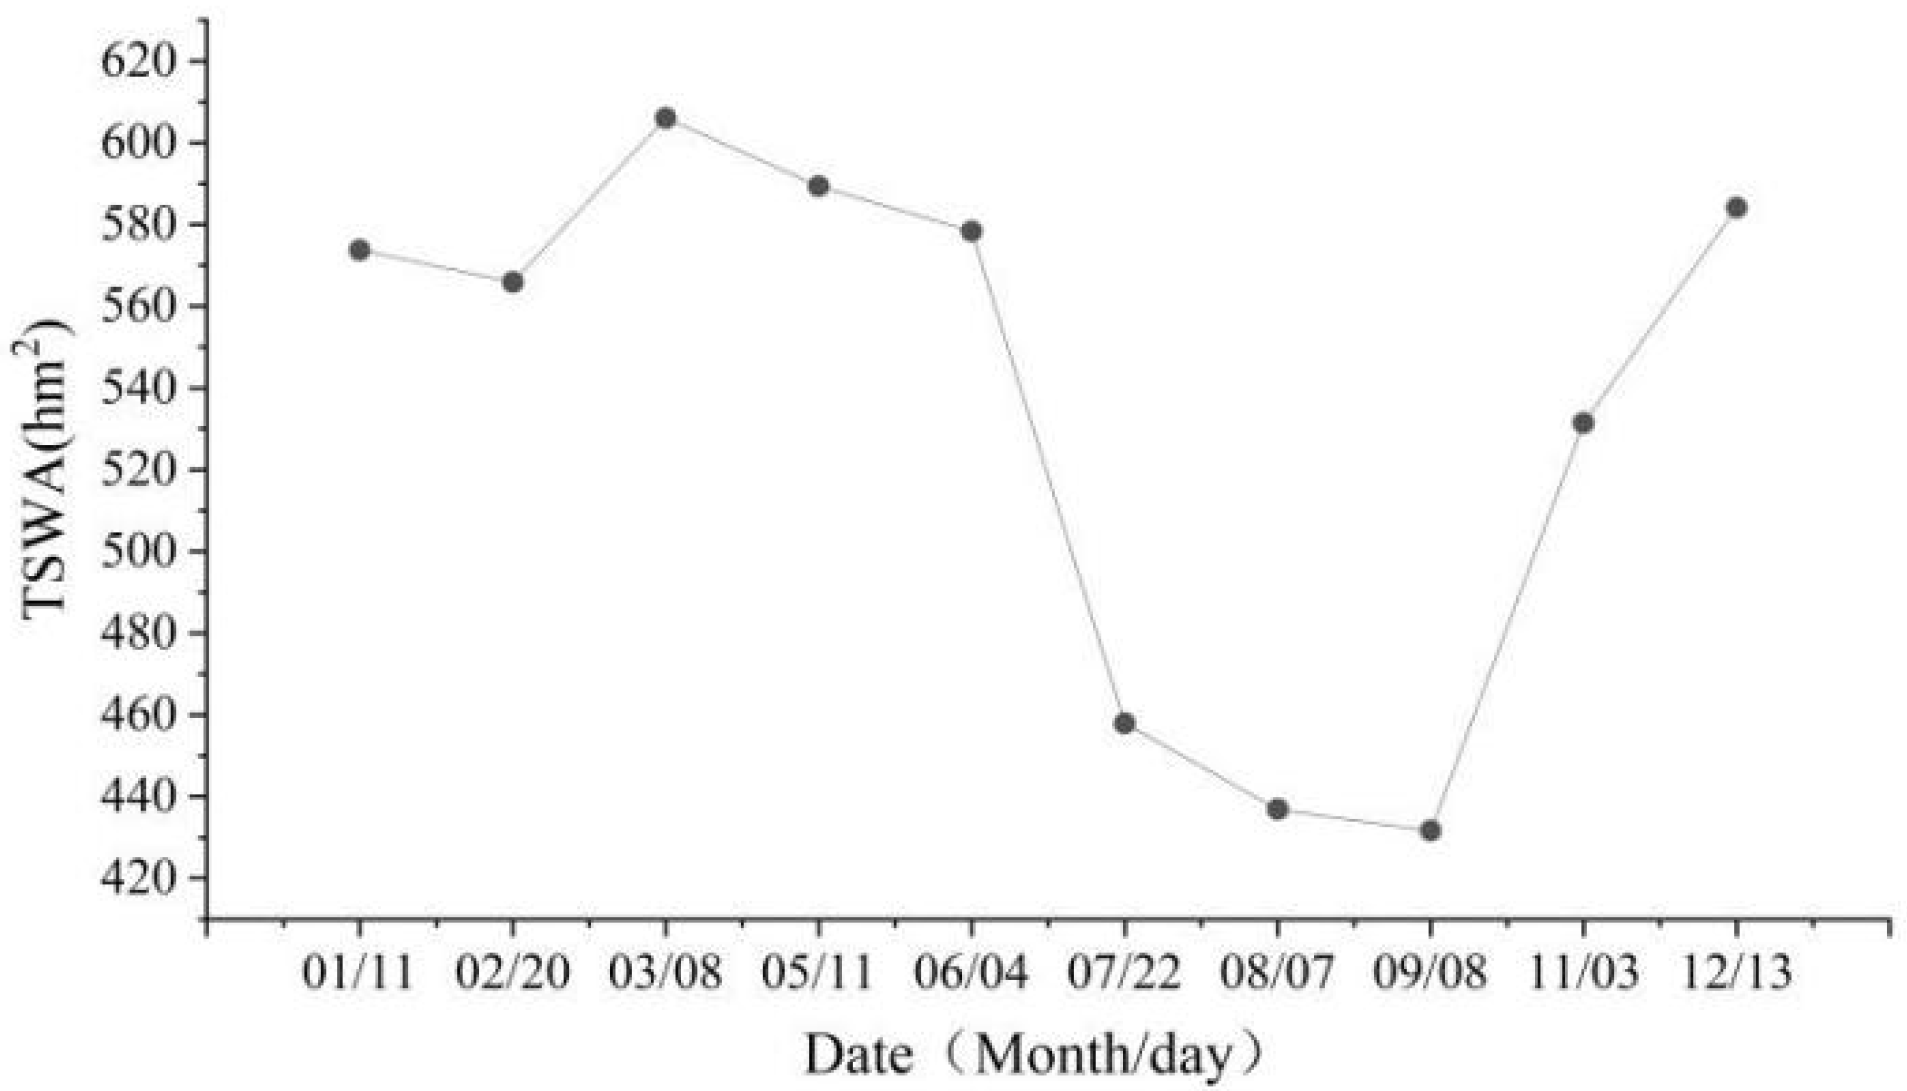
3.5. Annual Variation Pattern of the TSWA
3.6. Interannual Variation Pattern of the Water Body Area
3.6.1. Interannual TSWA Variation
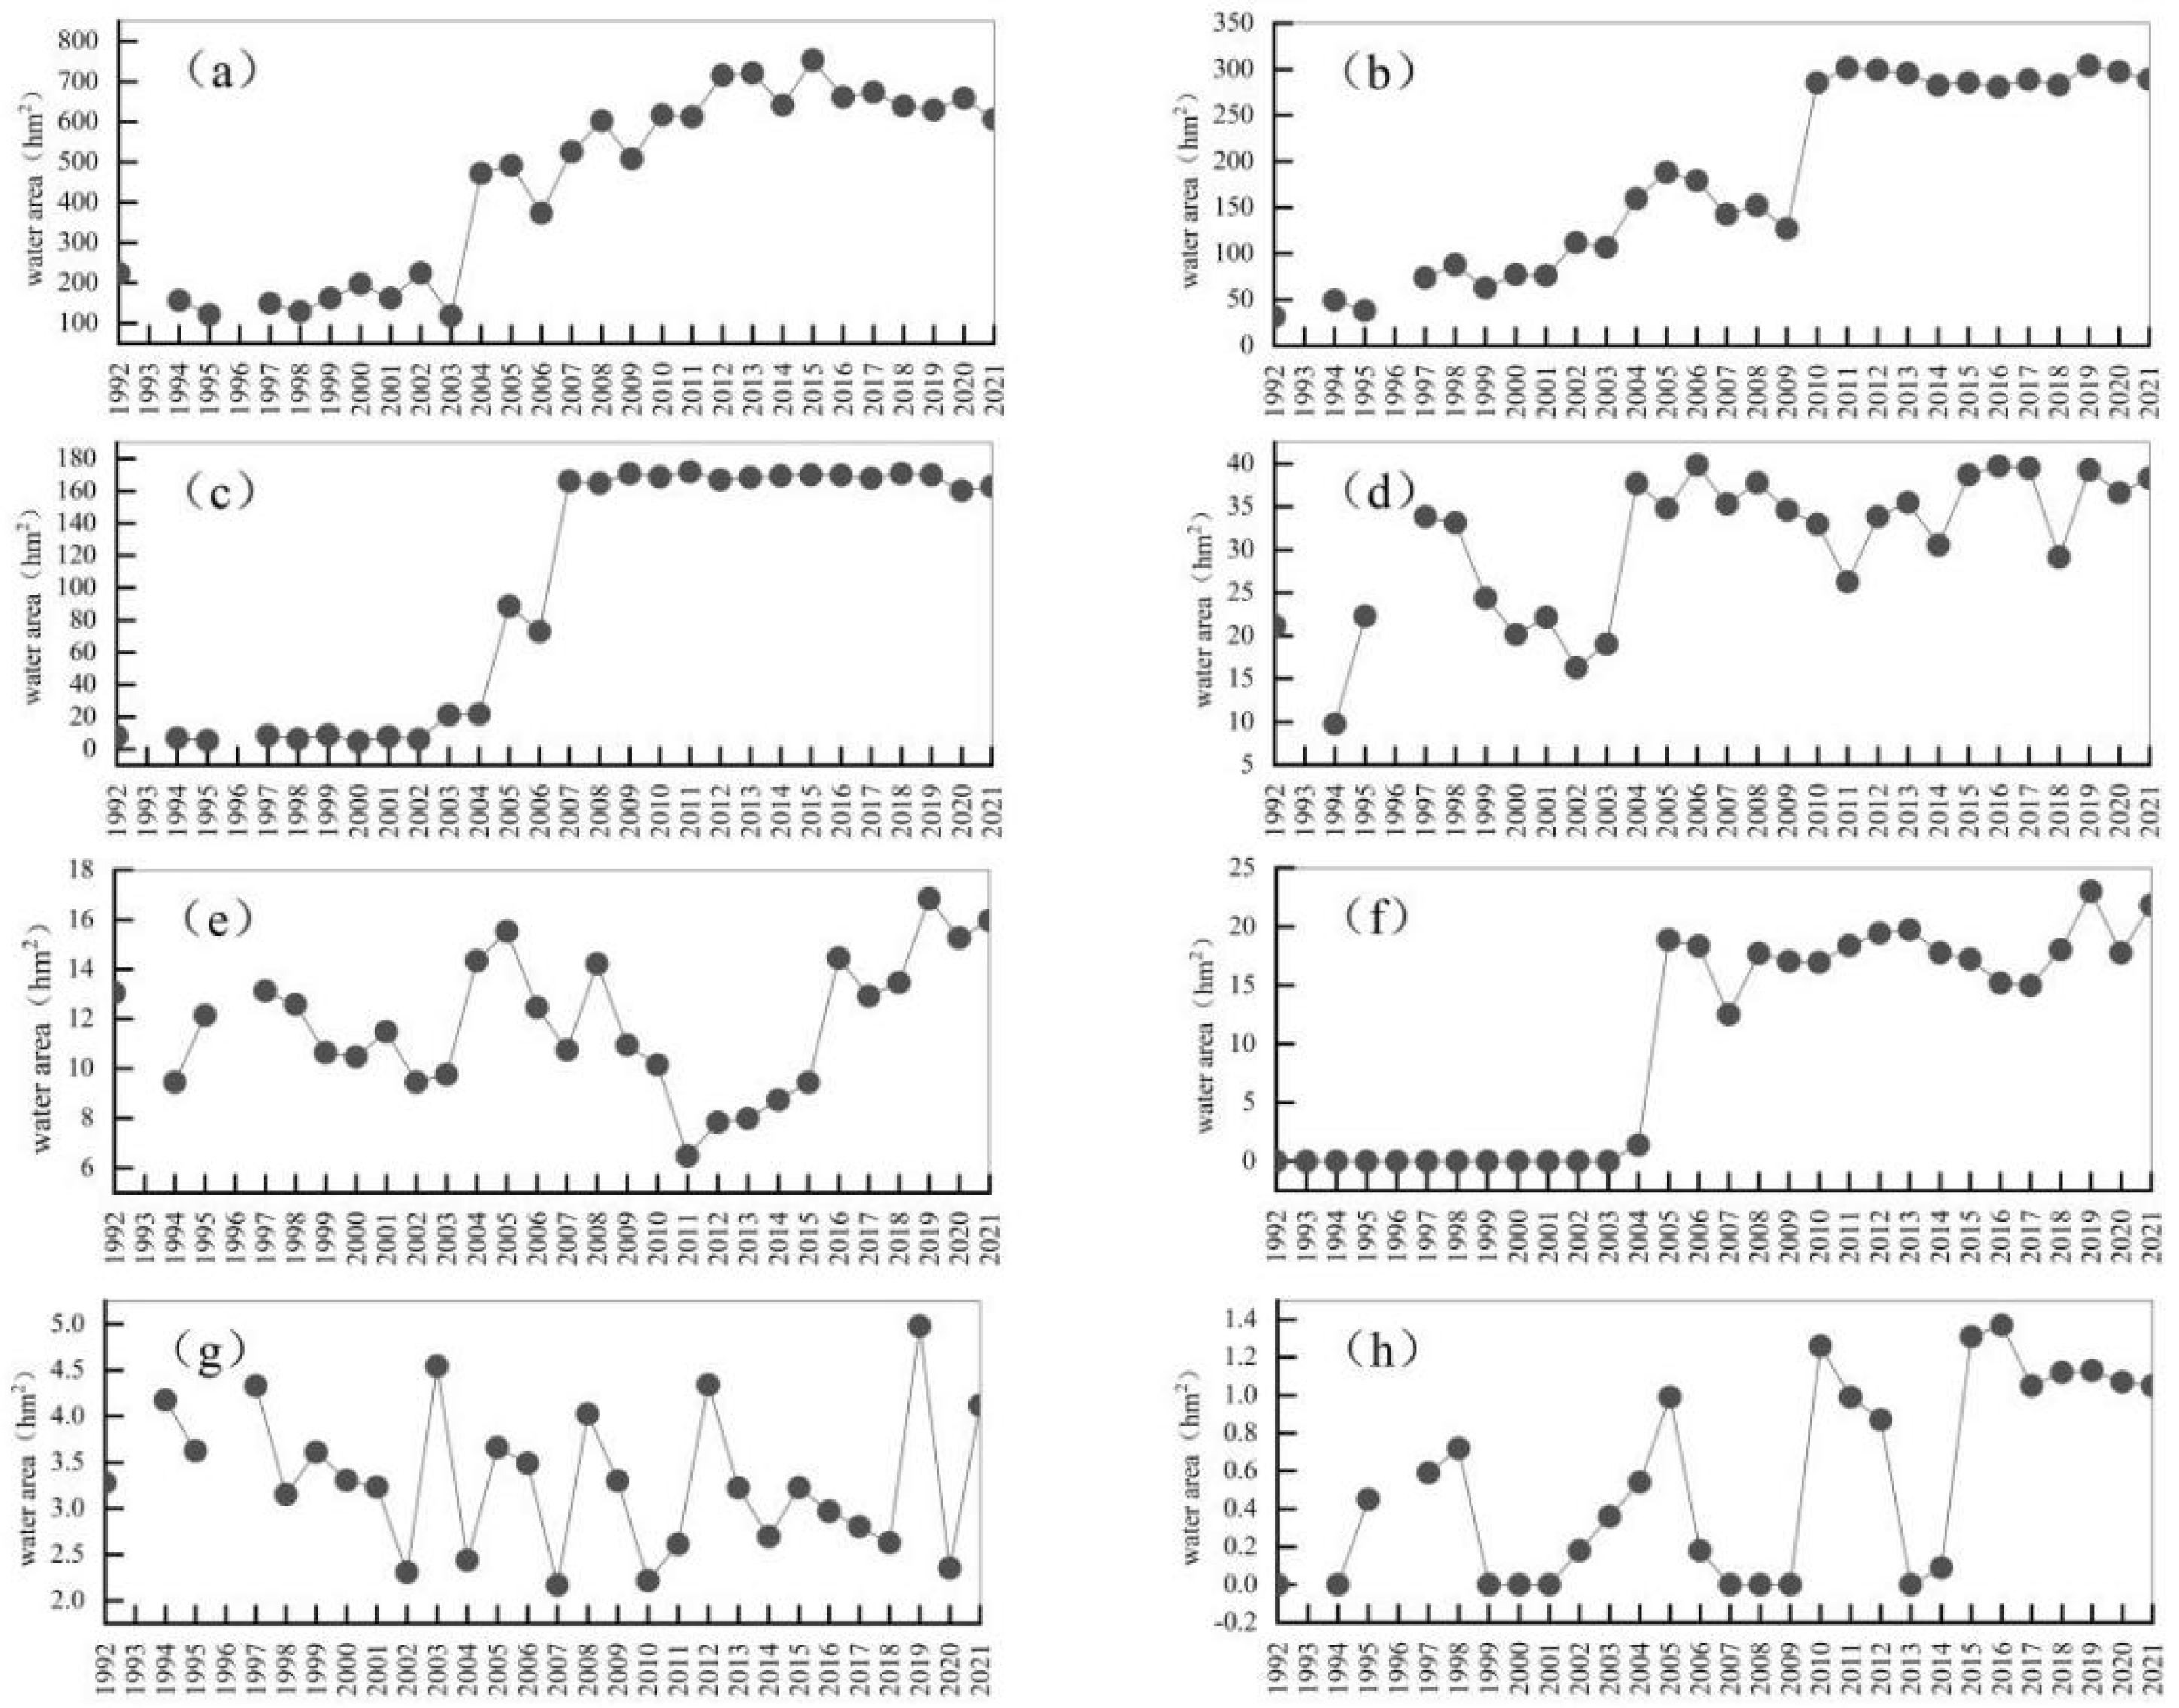
3.6.2. Interannual Variations in the Areas of Major Lakes and Reservoirs

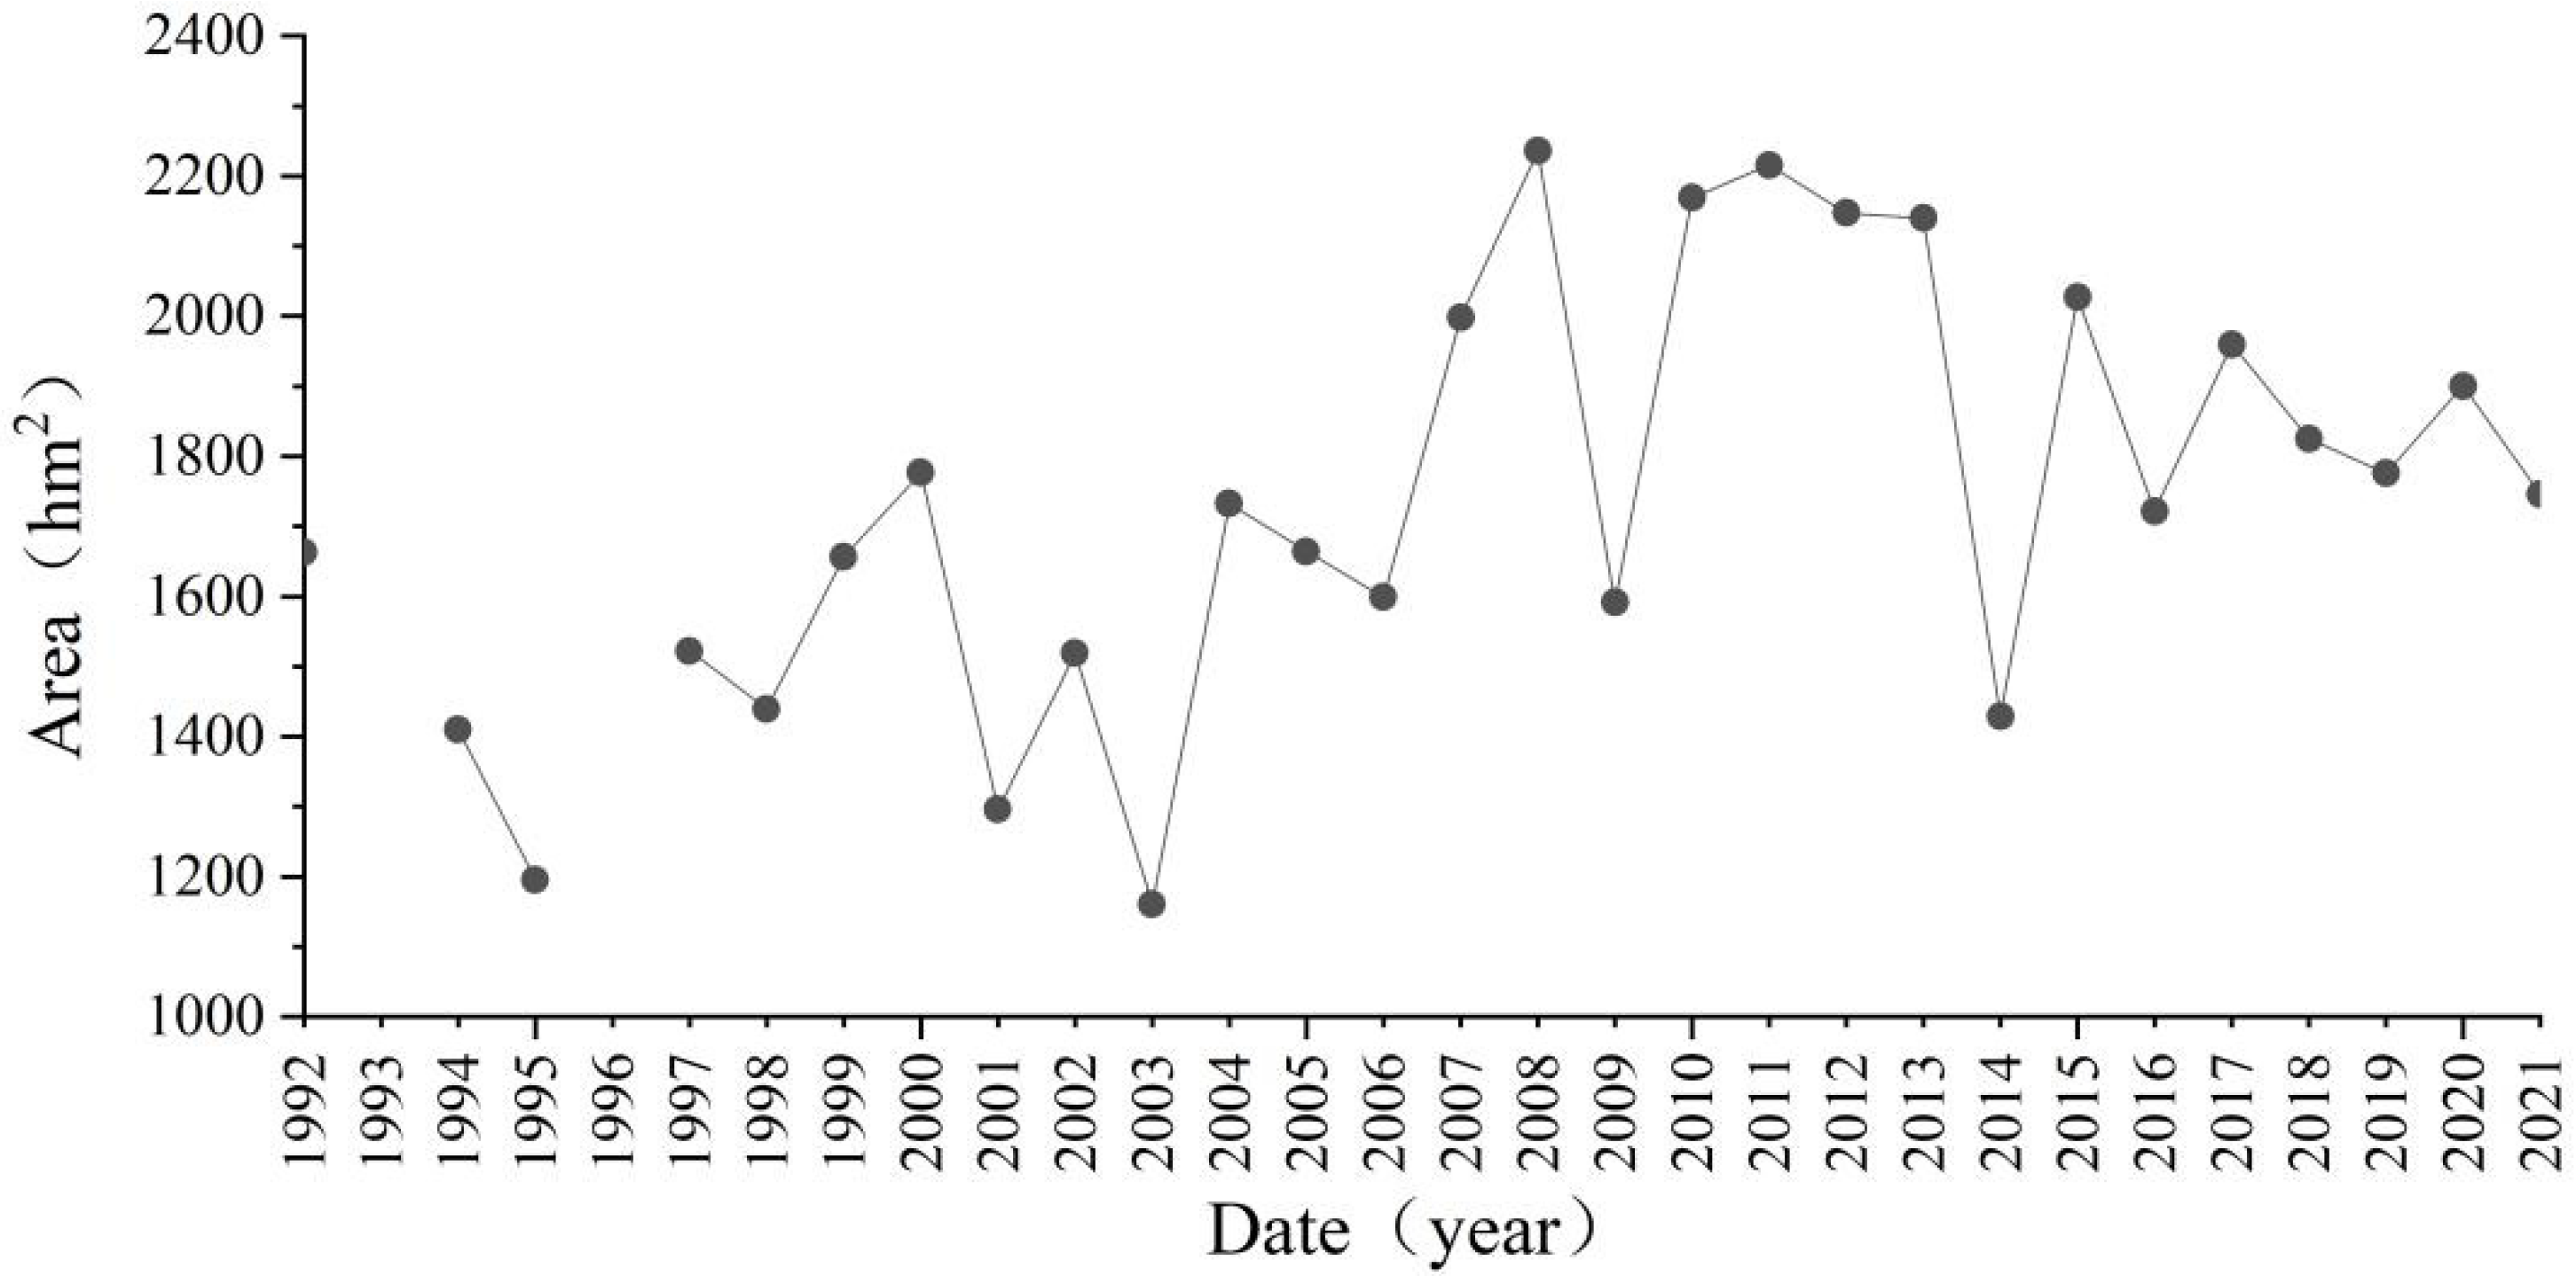
3.6.3. Characteristics of Interannual Variation in Surface Water Area of the Yellow River
3.7. Correlation Analysis
4. Conclusions
- (1)
- The validation results of the selected water body samples from Google Earth satellite imagery show that the three water body remote sensing indices NDWI, MNDWI and AWEIsh considered in this paper have high confidence in the extraction of water bodies in the study area, with average overall accuracies of 90.38%, 90.33% and 90.36%, respectively, and that the extraction results can adequately reflect the interannual dynamic trajectories of various surface water bodies. Compared with the support vector machine classification method, the water index method is more reliable after a strict threshold selection.
- (2)
- The TSWA in the study area showed an overall increasing trend between 1992 and 2021, from 223.78 hm2 in 1992 to 606.06 hm2 in 2021, with a multiyear average TSWA of 447.98 hm2. The main increase in area was caused by Tenggeli Lake, which increased by 257.27 hm2 by 2021.
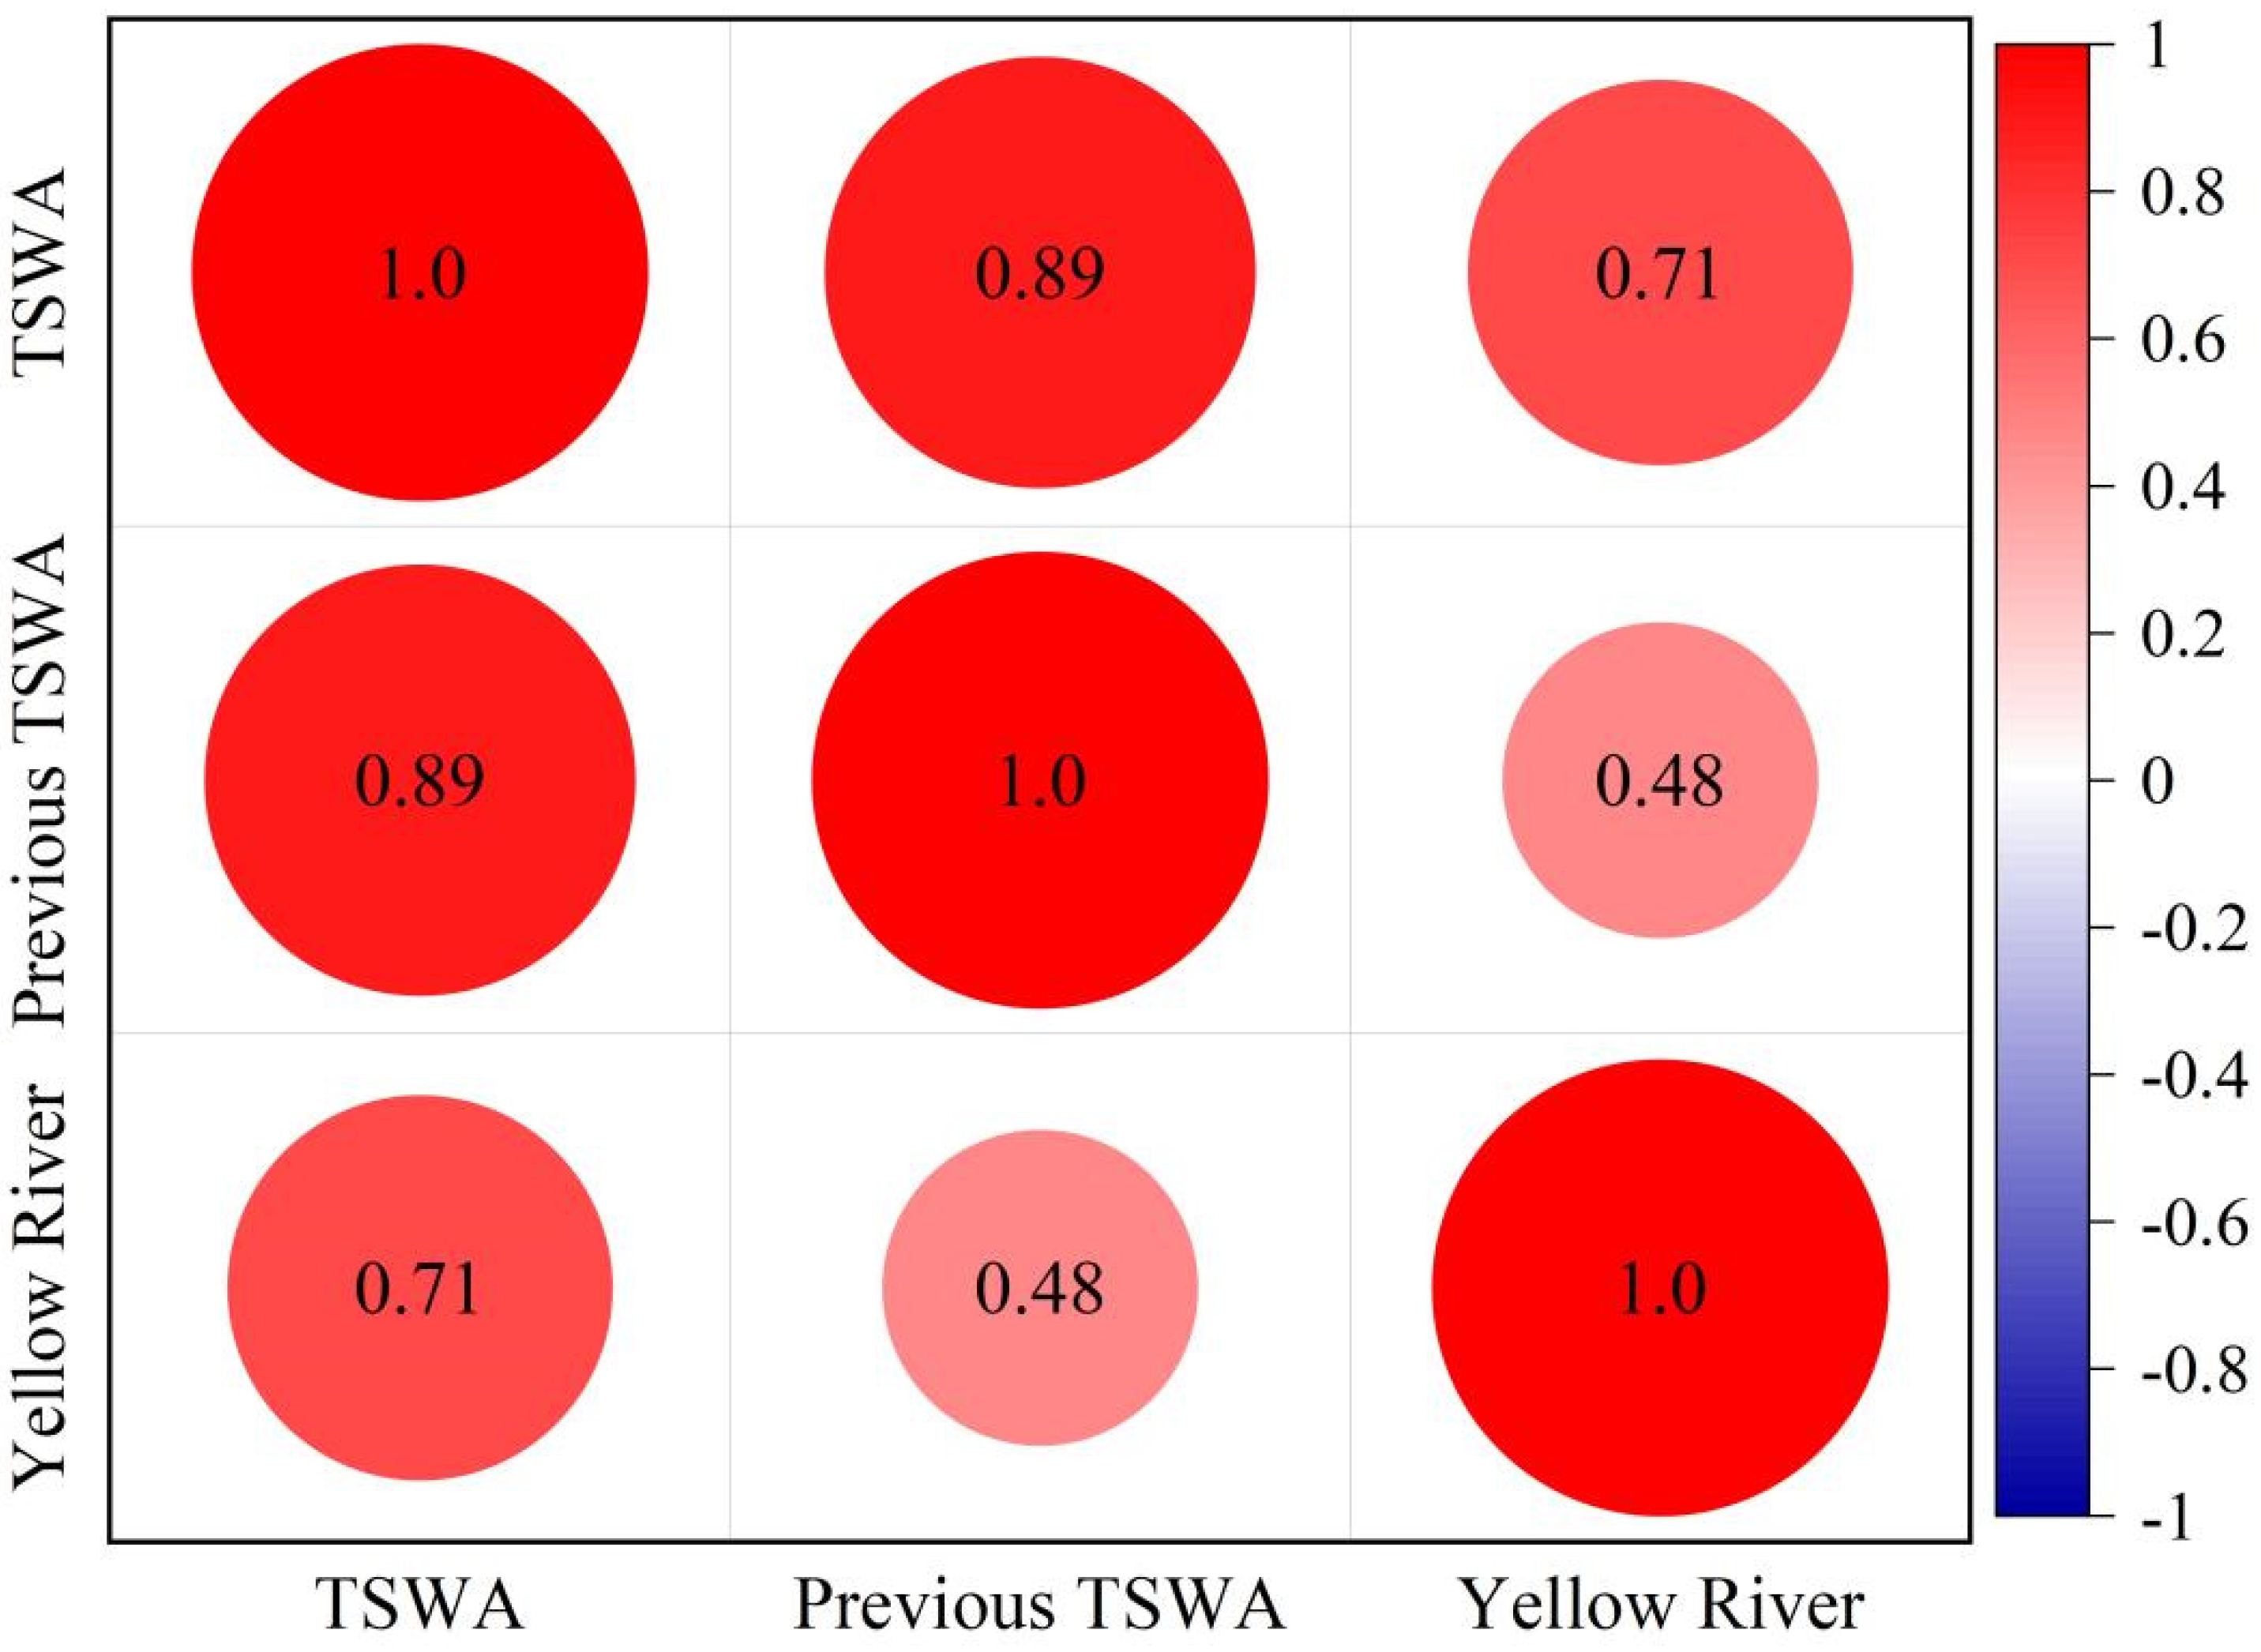
- (3)
- Pearson correlation coefficients were used to evaluate the correlation between each consideration and TSWA, and the correlation between water body extraction results and previous year TSWA and surface water area of the Yellow River over a 30-year period was analysed. The results showed that the correlations between the previous year TSWA and the TSWA were greater than those between the surface water area of the Yellow River and the TSWA. The influence of the previous year TSWA on the TSWA was the largest at 0.89, followed by the surface water area of the Yellow River at 0.71 for the same period. This also suggests that current water conservation in the study area should focus more on anthropogenic impacts.
Author Contributions
Funding
Data Availability Statement
Conflicts of Interest
References
- Zheng, C.; Imnek, J.; Lu, Y.; Liu, X.; Li, H. Monitoring and modeling the coupled movement of water, vapor, and energy in arid areas. J. Hydrol. 2020, 590, 125528. [Google Scholar] [CrossRef]
- Zhan, H.B.; Yang, W.B.; Jiang, Q.N.; Wang, Y.Q.; Guo, F.Q. An ecohydrological perspective of reconstructed vegetation in the semi-arid region in drought seasons. Agric. Water Manag. 2021, 243, 106488. [Google Scholar] [CrossRef]
- Fang, Z.; Ding, T.; Chen, J.; Xue, S.; Zhou, Q.; Wang, Y. Impacts of land use/land cover changes on ecosystem services in ecologically fragile regions. J. Sci. Total Environ. 2022, 831, 154967. [Google Scholar] [CrossRef]
- Zahra, K.; Tamara, A.; Mojtaba, S.; Bjørn, K.; Ali, T.H. Unconventional water resources: Global opportunities and challenges. Sci. Total Environ. 2022, 827, 154429. [Google Scholar] [CrossRef]
- Zhu, K.; Qiu, X.T.; Luo, Y.W.; Dai, M.L.; Lu, X.Q.; Zang, C.F.; Zhang, W.Q.; Gan, X.H.; Zhula, W.Y. Spatial and temporal dynamics of water resources in typical ecosystems of the Dongjiang River Basin, China. J. Hydrol. 2022, 614, 128617. [Google Scholar] [CrossRef]
- Xu, Y.; Lin, J.; Zhao, J.; Zhu, X. New method improves extraction accuracy of lake water bodies in Central Asia. J. Hydrol. 2021, 603, 127180. [Google Scholar] [CrossRef]
- Kumar, S.; Meena, R.S.; Sheoran, S.; Jangir, C.K.; Jhariya, M.K.; Banerjee, A.; Raj, A. Remote sensing for agriculture and resource management. In Natural Resources Conservation and Advances for Sustainability; Jhariya, M.K., Meena, R.S., Banerjee, A., Meena, S.N., Eds.; Elsevier: Amsterdam, The Netherlands, 2007; pp. 91–135. [Google Scholar] [CrossRef]
- Brivio, P.A.; Giardino, C.; Zilioli, E. Validation of satellite data for quality assurance in lake monitoring applications. Sci. Total Environ. 2001, 268, 3–18. [Google Scholar] [CrossRef] [PubMed]
- Li, Y.; Dang, B.; Zhang, Y.; Du, Z. Water body classification from high-resolution optical remote sensing imagery:Achievements and perspectives. ISPRS J. Photogramm. Remote Sens. 2022, 187, 306–327. [Google Scholar] [CrossRef]
- Chen, X.; Feng, L. 8.09—Remote Sensing of Lakes’ Water Environment. In Comprehensive Remote Sensing; Liang, S., Ed.; Elsevier: Amsterdam, The Netherlands, 2018; pp. 249–277. [Google Scholar] [CrossRef]
- Li, X.; Ling, F.; Foody, G.M.; Boyd, D.S.; Jiang, L.; Zhang, Y.; Zhou, P.; Wang, Y.; Chen, R.; Du, Y. Monitoring high spatiotemporal water dynamics by fusing modis, landsat, water occurrence data and DEM. Remote Sens. Environ. 2021, 265, 112680. [Google Scholar] [CrossRef]
- Yamazaki, D.; Trigg, M.A.; Ikeshima, D. Development of a global ~90m water body map using multi-temporal Landsat images. Remote Sens. Environ. 2015, 171, 337–351. [Google Scholar] [CrossRef]
- Cao, H.Y.; Han, L.; Liu, Z.H.; Li, L.Z. Monitoring and driving force analysis of spatial and temporal change of water area of Hongjiannao Lake from 1973 to 2019. Ecol. Inform. 2021, 61, 101230. [Google Scholar] [CrossRef]
- Xu, H.Q. Modification of normalised difference water index (NDWI) to enhance open water features in remotely sensed imagery. Int. J. Remote Sens. 2006, 27, 3025–3033. [Google Scholar] [CrossRef]
- Pei, Y.; Zhang, Y.J.; Zhang, Y. A study on information extraction of water system in semi-arid regions with the Enhanced Water Index (EWl) and GIS based noise remove techniques. Remote Sens. 2007, 6, 62–67, (In Chinese with English Abstract). [Google Scholar]
- Ding, F. Study on information extraction of water body with a new water index (NWI). Sci. Surv. Mapp. 2009, 34, 155–157, (In Chinese with English Abstract). [Google Scholar]
- Feyisa, G.L.; Meilby, H.; Fensholt, R.; Proud, S.R. Automated Water Extraction Index: A new technique for surface water mapping using Landsat imagery. Remote Sens. Environ. 2014, 140, 23–35. [Google Scholar] [CrossRef]
- Rad, A.M.; Kreitler, J.; Sadegh, M. Augmented normalized difference water index for improved surface water monitoring. Environ. Model. Softw. 2021, 140, 105030. [Google Scholar] [CrossRef]
- Xu, H.Q. Development of remote sensing water indices:A review. J. Fuzhou Univ. 2021, 49, 613–625, (In Chinese with English Abstract). [Google Scholar]
- Sekertekin, A. A survey on global thresholding methods for mapping open water body using Sentinel-2 satellite imagery and normalized difference water index. Arch. Comput. Methods Eng. 2021, 28, 1335–1347. [Google Scholar] [CrossRef]
- Xu, D.; Zhang, D.; Shi, D.; Luan, Z. Automatic Extraction of Open Water Using Imagery of Landsat Series. Water 2020, 12, 1928. [Google Scholar] [CrossRef]
- Seaton, D.; Dube, T.; Mazvimavi, D. Use of multi-temporal satellite data for monitoring pool surface areas occurring in non-perennial rivers in semi-arid environments of the Western Cape, South Africa. ISPRS J. Photogramm. Remote Sens. 2020, 167, 375–384. [Google Scholar] [CrossRef]
- Yang, X.; Qin, Q.; Grussenmeyer, P.; Koehl, M. Urban surface water body detection with suppressed built-up noise based on water indices from Sentinel-2 MSI imagery. Remote Sens. Environ. 2018, 219, 259–270. [Google Scholar] [CrossRef]
- Li, J.; Meng, Y.; Li, Y.; Cui, Q.; Yang, X.; Tao, C.; Wang, Z.; Li, L.; Zhang, W. Accurate water extraction using remote sensing imagery based on normalized difference water index and unsupervised deep learning. J. Hydrol. 2022, 612, 128202. [Google Scholar] [CrossRef]
- Wulder, M.A.; Roy, D.P.; Radeloff, V.C.; Loveland, T.R.; Anderson, M.C.; Johnson, D.M.; Healey, S.; Zhu, Z.; Scambos, T.A.; Pahlevan, N.; et al. Fifty Years of Landsat Science and Impacts. Remote Sens. Environ. 2022, 280, 113195. [Google Scholar] [CrossRef]
- Karaman, M. Comparison of thresholding methods for shoreline extraction from Sentinel-2 and Landsat-8 imagery: Extreme Lake Salda, track of Mars on Earth. J. Environ. Manag. 2021, 298, 113481. [Google Scholar] [CrossRef]
- Hu, M.; Ma, R.; Xiong, J.; Wang, M.; Cao, Z.; Xue, K. Eutrophication state in the Eastern China based on Landsat 35-year observations. Remote Sens. Environ. 2022, 277, 113057. [Google Scholar] [CrossRef]
- Tulbure, M.G.; Broich, M.; Stehman, S.V.; Kommareddy, A. Surface water extent dynamics from three decades of seasonally continuous Landsat time series at subcontinental scale in a semi-arid region. Remote Sens. Environ. 2016, 178, 142–157. [Google Scholar] [CrossRef]
- Bhangale, U.; More, S.; Shaikh, T.; Patil, S.; More, N. Analysis of surface water resources using Sentinel-2 imagery. Procedia Comput. Sci. 2020, 171, 2645–2654. [Google Scholar] [CrossRef]
- Yun, D.; Yihang, Z.; Feng, L.; Qunming, W.; Wenbo, L.; Xiaodong, L. Water bodies’ mapping from sentinel-2 imagery with modified normalized difference water index at 10-m spatial resolution produced by sharpening the swir band. Remote Sens. 2016, 8, 354. [Google Scholar] [CrossRef]
- Rokni, K.; Ahmad, A.; Solaimani, K.; Hazini, S. A new approach for surface water change detection: Integration of pixel level image fusion and image classification techniques. Int. J. Appl. Earth Obs. Geoinf. 2015, 34, 226–234. [Google Scholar] [CrossRef]
- Masocha, M.; Dube, T.; Makore, M.; Shekede, M.D.; Funani, J. Surface water bodies mapping in Zimbabwe using landsat 8 OLI multispectral imagery: A comparison of multiple water indices. Phys. Chem. Earth Parts A/B/C 2018, 106, 63–67. [Google Scholar] [CrossRef]
- Chen, F.; Chen, X.; Van de Voorde, T.; Roberts, D.; Jiang, H.; Xu, W. Open water detection in urban environments using high spatial resolution remote sensing imagery. Remote Sens. Environ. 2020, 242, 111706. [Google Scholar] [CrossRef]
- Chen, N.; Zhao, G.P.; Chen, X.G. Correlation Analyses between Interannual Changes of Cloud Cover and Surface Air Temperature in Ningxia in Recent 40 years. Plateau Meteor 2006, 6, 1176–1183, (In Chinese with English Abstract). [Google Scholar]
- Wulder, M.A.; Loveland, T.R.; Roy, D.P.; Crawford, C.J.; Masek, J.G.; Woodcock, C.E.; Allen, R.G.; Anderson, M.C.; Belward, A.S.; Cohen, W.B.; et al. Current status of landsat program, science, and applications. Remote Sens. Environ. 2019, 225, 127–147. [Google Scholar] [CrossRef]
- Pahlevan, N.; Mangin, A.; Balasubramanian, S.V.; Smith, B.; Alikas, K.; Arai, K.; Barbosa, C.; Belanger, S.; Binding, C.; Bresciani, M.; et al. ACIX-Aqua: A global assessment of atmospheric correction methods for Landsat-8 and Sentinel-2 over lakes, rivers, and coastal waters. Remote Sens. Environ. 2021, 258, 112366. [Google Scholar] [CrossRef]
- Claverie, M.; Vermote, E.F.; Franch, B.; Masek, J.G. Evaluation of the Landsat-5 TM and Landsat-7 ETM+ surface reflectance products. Remote Sens. Environ. 2015, 169, 390–403. [Google Scholar] [CrossRef]
- Chen, W.; Xu, Y.; Zhang, Z.; Yang, L.; Pan, X.; Jia, Z. Mapping Agricultural Plastic Greenhouses Using Google Earth Images and Deep Learning. Comput. Electron. Agric. 2021, 191, 106552. [Google Scholar] [CrossRef]
- Erdem, F.; Bayram, B.; Bakirman, T.; Bayrak, O.C.; Akpinar, B. An ensemble deep learning based shoreline segmentation approach (WaterNet) from Landsat 8 OLI images. Adv. Space Res. 2021, 67, 964–974. [Google Scholar] [CrossRef]
- Farhadi, H.; Esmaeily, A.; Najafzadeh, M. Flood monitoring by integration of Remote Sensing technique and Multi-Criteria Decision Making method. Comput Geosci. 2022, 160, 105045. [Google Scholar] [CrossRef]
- Candade, N.; Dixon, B. Performance evaluation of MLE, RF and SVM classification algorithms for watershed scale land use/land cover mapping using sentinel 2 bands. Remote Sens. Appl. 2020, 19, 100351. [Google Scholar] [CrossRef]
- Bodian, A.; Diop, L.; Panthou, G.; Dacosta, H.; Deme, A.; Dezetter, A.; Ndiaye, P.M.; Diouf, I.; Vichel, T. Recent trend in hydroclimatic conditions in the Senegal River Basin. Water 2020, 12, 436. [Google Scholar] [CrossRef]
- Zhang, W.; Zhang, Z.; Wei, X.; Hu, Y.; Li, Y.; Meng, L. Long-term spatiotemporal changes of surface water and its influencing factors in the mainstream of Han River, China. J. Hydrol. Reg. Stud. 2022, 40, 101009. [Google Scholar] [CrossRef]
- Zhang, H.; Ding, J.; Wang, Y.S.; Zhou, D.Y.; Zhu, Q. Investigation about the correlation and propagation among meteorological, agricultural and groundwater droughts over humid and arid/semi-arid basins in China. J. Hydrol. 2021, 603, 127007. [Google Scholar] [CrossRef]
- Mo, K.; Chen, Q.; Chen, C.; Zhang, J.; Wang, L.; Bao, Z. Spatiotemporal variation of correlation between vegetation cover and precipitation in an arid mountain-oasis river basin in Northwest China. J. Hydrol. 2019, 574, 138–147. [Google Scholar] [CrossRef]
- Li, C.W.; Wang, Z.H.; Tang, Q.H.; Hu, Q.F.; Xiao, P.Q.; Lyu, X.Z.; Liu, Y. Dynamics of surface water area in the Yellow River Basin and its influencing mechanism during 1986–2019 based on Google Earth Engine. Acta Geogr. Sin. 2022, 77, 1153–1168, (In Chinese with English Abstract). [Google Scholar]


| Type of Data | Source | Date |
|---|---|---|
| Landsat-5 TM | USGS | 1992/04/01; 1994/03/06; 1995/03/25; 1997/03/30; 1998/04/02; 1999/04/05; 2002/03/28; 2005/03/04; 2007/05/13; 2008/04/13; 2009/03/15; 2010/04/03 |
| Landsat-7 ETM+ | USGS | 2000/03/30; 2001/03/17; 2003/03/23; 2004/03/25; 2006/03/15; 2011/03/29; 2012/03/31; 2013/04/03; 2014/03/21; 2015/03/24; 2016/03/26; 2019/03/03; 2020/03/21; 2021/02/20; 2021/03/08; 2021/05/11; 2021/11/03 |
| Landsat-8 OLI | USGS | 2017/04/22; 2018/03/08; 2021/01/11; 2021/06/04; 2021/07/22; 2021/08/07; 2021/09/08; 2021/11/03; 2021/12/13 |
| Time Range | Sampling Point Year | Tenggeli Lake | Xiaohu Lake | Gaodun Lake | Machang Lake | Qiandao Lake | Mengjiawan Reservoir | Changliushui Reservoir | Yellow River |
|---|---|---|---|---|---|---|---|---|---|
| 1992–2003 | 2003 | 100 | 75 | 100 | 60 | 0 | 20 | 5 | 104 |
| 2004–2009 | 2009 | 100 | 100 | 100 | 52 | 100 | 22 | 4 | 102 |
| 2010–2021 | 2019 | 100 | 100 | 100 | 47 | 74 | 18 | 4 | 102 |
| Date | NDWI | MNDWI | EWI | ||||||
|---|---|---|---|---|---|---|---|---|---|
| Threshold | OA | Kappa | Threshold | OA | Kappa | Threshold | OA | Kappa | |
| 2012/3/31 | −0.15 | 90.16% | 0.83 | −0.15 | 90.42% | 0.84 | −0.5 | 79.15% | 0.68 |
| 2013/4/3 | −0.15 | 90.89% | 0.83 | −0.1 | 92.15% | 0.87 | −0.45 | 80.73% | 0.74 |
| 2014/3/21 | −0.15 | 93.37% | 0.85 | −0.15 | 89.34% | 0.83 | −0.4 | 83.65% | 0.75 |
| 2015/3/24 | −0.15 | 92.51% | 0.86 | −0.1 | 93.68% | 0.89 | −0.5 | 82.96% | 0.77 |
| 2016/3/26 | −0.15 | 89.65% | 0.80 | −0.1 | 89.56% | 0.87 | −0.5 | 80.18% | 0.64 |
| 2017/4/22 | −0.15 | 89.91% | 0.84 | 0 | 89.30% | 0.76 | −0.5 | 82.45% | 0.79 |
| 2018/3/8 | −0.15 | 90.22% | 0.81 | −0.1 | 89.36% | 0.85 | −0.45 | 84.71% | 0.78 |
| 2019/3/3 | −0.2 | 91.72% | 0.86 | −0.15 | 94.23% | 0.90 | −0.5 | 81.22% | 0.72 |
| 2020/3/21 | −0.2 | 90.78% | 0.88 | −0.1 | 93.75% | 0.88 | −0.5 | 73.87% | 0.54 |
| 2021/3/8 | −0.15 | 92.16% | 0.83 | −0.1 | 91.48% | 0.85 | −0.5 | 81.36% | 0.73 |
| AWEIsh | NWI | ||||||||
| 2012/3/31 | −2000 | 88.10% | 0.8 | −0.75 | 81.38% | 0.72 | |||
| 2013/4/3 | −2000 | 92.78% | 0.81 | −0.75 | 79.51% | 0.75 | |||
| 2014/3/21 | −2000 | 91.15% | 0.90 | −0.6 | 84.02% | 0.75 | |||
| 2015/3/24 | −2000 | 86.42% | 0.86 | −0.65 | 86.97% | 0.83 | |||
| 2016/3/26 | −2000 | 88.28% | 0.81 | −0.7 | 73.42% | 0.66 | |||
| 2017/4/22 | −2000 | 90.91% | 0.80 | −0.75 | 81.12% | 0.80 | |||
| 2018/3/8 | −2000 | 89.77% | 0.82 | −0.75 | 81.36% | 0.76 | |||
| 2019/3/3 | −2000 | 92.16% | 0.89 | −0.75 | 83.25% | 0.77 | |||
| 2020/3/21 | −2000 | 90.66% | 0.86 | −0.7 | 88.85% | 0.85 | |||
| 2021/3/8 | −1500 | 90.31% | 0.85 | −0.75 | 71.57% | 0.65 | |||
| Date | OA | Kappa |
|---|---|---|
| 2012/03/31 | 91.11% | 0.68 |
| 2013/04/03 | 90.93% | 0.73 |
| 2014/03/21 | 91.75% | 0.79 |
| 2015/03/24 | 84.33% | 0.54 |
| 2016/03/26 | 84.56% | 0.54 |
| 2017/04/22 | 89.67% | 0.57 |
| 2018/03/08 | 87.58% | 0.48 |
| 2019/03/03 | 87.82% | 0.56 |
| 2020/03/21 | 87.44% | 0.62 |
| 2021/03/08 | 89.37% | 0.72 |
| Date | MNDWI (Lake) | AWEIsh (Reservoir) | NDWI (Yellow River) | |||
|---|---|---|---|---|---|---|
| OA | Kappa | OA | Kappa | OA | Kappa | |
| 2012/3/31 | 87.66% | 0.81 | 92.27% | 0.82 | 97.29% | 0.83 |
| 2013/4/3 | 92.51% | 0.89 | 86.54% | 0.81 | 90.81% | 0.83 |
| 2014/3/21 | 94.63% | 0.87 | 87.19% | 0.87 | 92.08% | 0.83 |
| 2015/3/24 | 86.44% | 0.85 | 89.63% | 0.84 | 84.33% | 0.79 |
| 2016/3/26 | 87.57% | 0.90 | 94.40% | 0.90 | 92.66% | 0.87 |
| 2017/4/22 | 92.65% | 0.91 | 87.74% | 0.86 | 90.12% | 0.84 |
| 2018/3/8 | 95.12% | 0.93 | 94.65% | 0.89 | 82.18% | 0.82 |
| 2019/3/3 | 87.39% | 0.86 | 91.11% | 0.83 | 89.25% | 0.81 |
| 2020/3/21 | 95.38% | 0.92 | 89.20% | 0.84 | 96.49% | 0.92 |
| 2021/3/8 | 97.41% | 0.82 | 95.15% | 0.85 | 94.46% | 0.83 |
| Average Value | 91.68% | 0.88 | 90.79% | 0.85 | 90.97% | 0.84 |
| Date | MNDWI (TSWA) | NDWI (Yellow River) | AWEIsh (Reservoir) | ||||||
|---|---|---|---|---|---|---|---|---|---|
| Threshold | OA | Kappa | Threshold | OA | Kappa | Threshold | OA | Kappa | |
| 1992/4/1 | −0.15 | 89.54% | 0.80 | −0.15 | 87.96% | 0.74 | −2000 | 90.53% | 0.65 |
| 1993/3/19 | −0.15 | 90.09% | 0.83 | −0.15 | 86.68% | 0.73 | −2000 | 84.75% | 0.84 |
| 1994/3/6 | −0.15 | 93.36% | 0.91 | −0.15 | 95.01% | 0.85 | −2000 | 91.41% | 0.82 |
| 1995/3/25 | −0.2 | 93.12% | 0.87 | −0.15 | 90.27% | 0.81 | −2000 | 90.57% | 0.82 |
| 1997/3/30 | −0.15 | 89.35% | 0.87 | −0.15 | 93.47% | 0.77 | −2000 | 86.80% | 0.79 |
| 1998/4/2 | −0.15 | 94.75% | 0.91 | −0.15 | 93.85% | 0.79 | −2000 | 92.82% | 0.90 |
| 1999/4/5 | −0.15 | 90.23% | 0.88 | −0.15 | 92.45% | 0.73 | −2000 | 91.62% | 0.82 |
| 2000/3/30 | −0.15 | 92.41% | 0.82 | −0.15 | 89.12% | 0.58 | −2000 | 95.13% | 0.84 |
| 2001/3/17 | −0.2 | 86.93% | 0.81 | −0.15 | 97.51% | 0.93 | −2000 | 91.89% | 0.86 |
| 2002/3/28 | −0.15 | 89.10% | 0.81 | −0.15 | 90.16% | 0.68 | −2000 | 86.14% | 0.84 |
| 2003/3/23 | −0.15 | 86.14% | 0.84 | −0.2 | 89.91% | 0.68 | −2000 | 95.64% | 0.88 |
| 2004/3/25 | −0.15 | 90.60% | 0.87 | −0.15 | 92.40% | 0.76 | −2000 | 90.77% | 0.88 |
| 2005/3/4 | −0.15 | 85.13% | 0.83 | −0.15 | 94.77% | 0.85 | −2000 | 91.77% | 0.88 |
| 2006/3/15 | −0.15 | 92.14% | 0.82 | −0.15 | 92.78% | 0.78 | −2000 | 90.39% | 0.89 |
| 2007/5/13 | −0.15 | 87.60% | 0.86 | −0.2 | 87.17% | 0.62 | −1500 | 82.33% | 0.78 |
| 2008/4/13 | −0.15 | 84.33% | 0.81 | −0.2 | 80.97% | 0.62 | −1500 | 89.72% | 0.8 |
| 2009/3/15 | −0.15 | 90.13% | 0.81 | −0.15 | 86.57% | 0.73 | −2000 | 90.25% | 0.81 |
| 2010/4/3 | −0.15 | 90.46% | 0.81 | −0.15 | 93.63% | 0.87 | −2000 | 89.94% | 0.88 |
| 2011/3/29 | −0.15 | 91.22% | 0.88 | −0.15 | 89.41% | 0.79 | −2000 | 90.17% | 0.88 |
| 2012/3/31 | −0.15 | 90.42% | 0.84 | −0.15 | 97.29% | 0.83 | −2000 | 92.27% | 0.82 |
| 2013/4/3 | −0.1 | 92.15% | 0.87 | −0.15 | 90.81% | 0.83 | −2000 | 86.54% | 0.81 |
| 2014/3/21 | −0.15 | 89.34% | 0.83 | −0.15 | 92.08% | 0.83 | −2000 | 87.19% | 0.87 |
| 2015/3/24 | −0.1 | 93.68% | 0.89 | −0.15 | 84.33% | 0.79 | −2000 | 89.63% | 0.84 |
| 2016/3/26 | −0.1 | 89.56% | 0.87 | −0.15 | 92.66% | 0.87 | −2000 | 94.40% | 0.9 |
| 2017/4/22 | 0 | 89.30% | 0.76 | −0.15 | 90.12% | 0.84 | −2000 | 87.74% | 0.86 |
| 2018/3/8 | −0.1 | 89.36% | 0.85 | −0.15 | 82.18% | 0.82 | −2000 | 90.65% | 0.89 |
| 2019/3/3 | −0.15 | 94.23% | 0.90 | −0.2 | 89.25% | 0.81 | −2000 | 91.11% | 0.83 |
| 2020/3/21 | −0.1 | 93.75% | 0.88 | −0.2 | 96.49% | 0.92 | −2000 | 89.20% | 0.84 |
| 2021/1/11 | −0.1 | 95.37% | 0.85 | −0.2 | 90.79% | 0.82 | −1500 | 90.28% | 0.79 |
| 2021/2/20 | −0.1 | 85.41% | 0.85 | −0.2 | 93.63% | 0.87 | −1500 | 89.52% | 0.8 |
| 2021/3/8 | −0.1 | 91.48% | 0.85 | −0.15 | 90.97% | 0.84 | −1500 | 90.79% | 0.85 |
| 2021/5/11 | −0.15 | 92.34% | 0.88 | −0.2 | 90.56% | 0.81 | −1500 | 93.90% | 0.81 |
| 2021/6/4 | −0.15 | 91.56% | 0.90 | −0.2 | 92.33% | 0.85 | −2000 | 94.02% | 0.82 |
| 2021/7/22 | −0.15 | 84.90% | 0.87 | −0.2 | 83.42% | 0.67 | −2000 | 90.66% | 0.7 |
| 2021/8/7 | −0.15 | 91.20% | 0.79 | −0.2 | 80.12% | 0.61 | −2000 | 90.54% | 0.69 |
| 2021/9/8 | −0.15 | 90.23% | 0.91 | −0.2 | 89.79% | 0.67 | −2000 | 90.78% | 0.7 |
| 2021/11/3 | −0.15 | 93.12% | 0.81 | −0.2 | 89.66% | 0.71 | −2000 | 90.41% | 0.69 |
| 2021/12/13 | −0.15 | 90.23% | 0.89 | −0.15 | 91.91% | 0.76 | −2000 | 91.53% | 0.74 |
| Water Body | Slope | Man-Kendall |
|---|---|---|
| TSWA | 0.2293 | 5.34 |
| Tenggeli Lake | 0.0946 | 5.73 |
| Gaodun Lake | 0.0155 | 3.73 |
| Machang Lake | 0.0059 | 1.59 |
| Xiaohu Lake | 0.0516 | 4.87 |
| Qiandao Lake | 0.0057 | 4.43 |
| Mengjiawan Reservoir | 0.0016 | −0.23 |
| Changliushui Reservoir | 0.0003 | 3.32 |
Disclaimer/Publisher’s Note: The statements, opinions and data contained in all publications are solely those of the individual author(s) and contributor(s) and not of MDPI and/or the editor(s). MDPI and/or the editor(s) disclaim responsibility for any injury to people or property resulting from any ideas, methods, instructions or products referred to in the content. |
© 2022 by the authors. Licensee MDPI, Basel, Switzerland. This article is an open access article distributed under the terms and conditions of the Creative Commons Attribution (CC BY) license (https://creativecommons.org/licenses/by/4.0/).
Share and Cite
Pang, H.; Wang, X.; Hou, R.; You, W.; Bian, Z.; Sang, G. Multiwater Index Synergistic Monitoring of Typical Wetland Water Bodies in the Arid Regions of West-Central Ningxia over 30 Years. Water 2023, 15, 20. https://doi.org/10.3390/w15010020
Pang H, Wang X, Hou R, You W, Bian Z, Sang G. Multiwater Index Synergistic Monitoring of Typical Wetland Water Bodies in the Arid Regions of West-Central Ningxia over 30 Years. Water. 2023; 15(1):20. https://doi.org/10.3390/w15010020
Chicago/Turabian StylePang, Haiwei, Xinwei Wang, Ruiping Hou, Wanxue You, Zhen Bian, and Guoqing Sang. 2023. "Multiwater Index Synergistic Monitoring of Typical Wetland Water Bodies in the Arid Regions of West-Central Ningxia over 30 Years" Water 15, no. 1: 20. https://doi.org/10.3390/w15010020
APA StylePang, H., Wang, X., Hou, R., You, W., Bian, Z., & Sang, G. (2023). Multiwater Index Synergistic Monitoring of Typical Wetland Water Bodies in the Arid Regions of West-Central Ningxia over 30 Years. Water, 15(1), 20. https://doi.org/10.3390/w15010020