Article

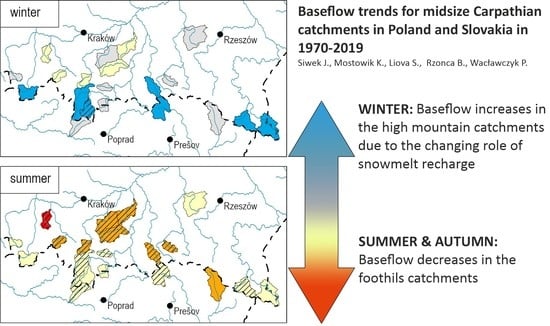
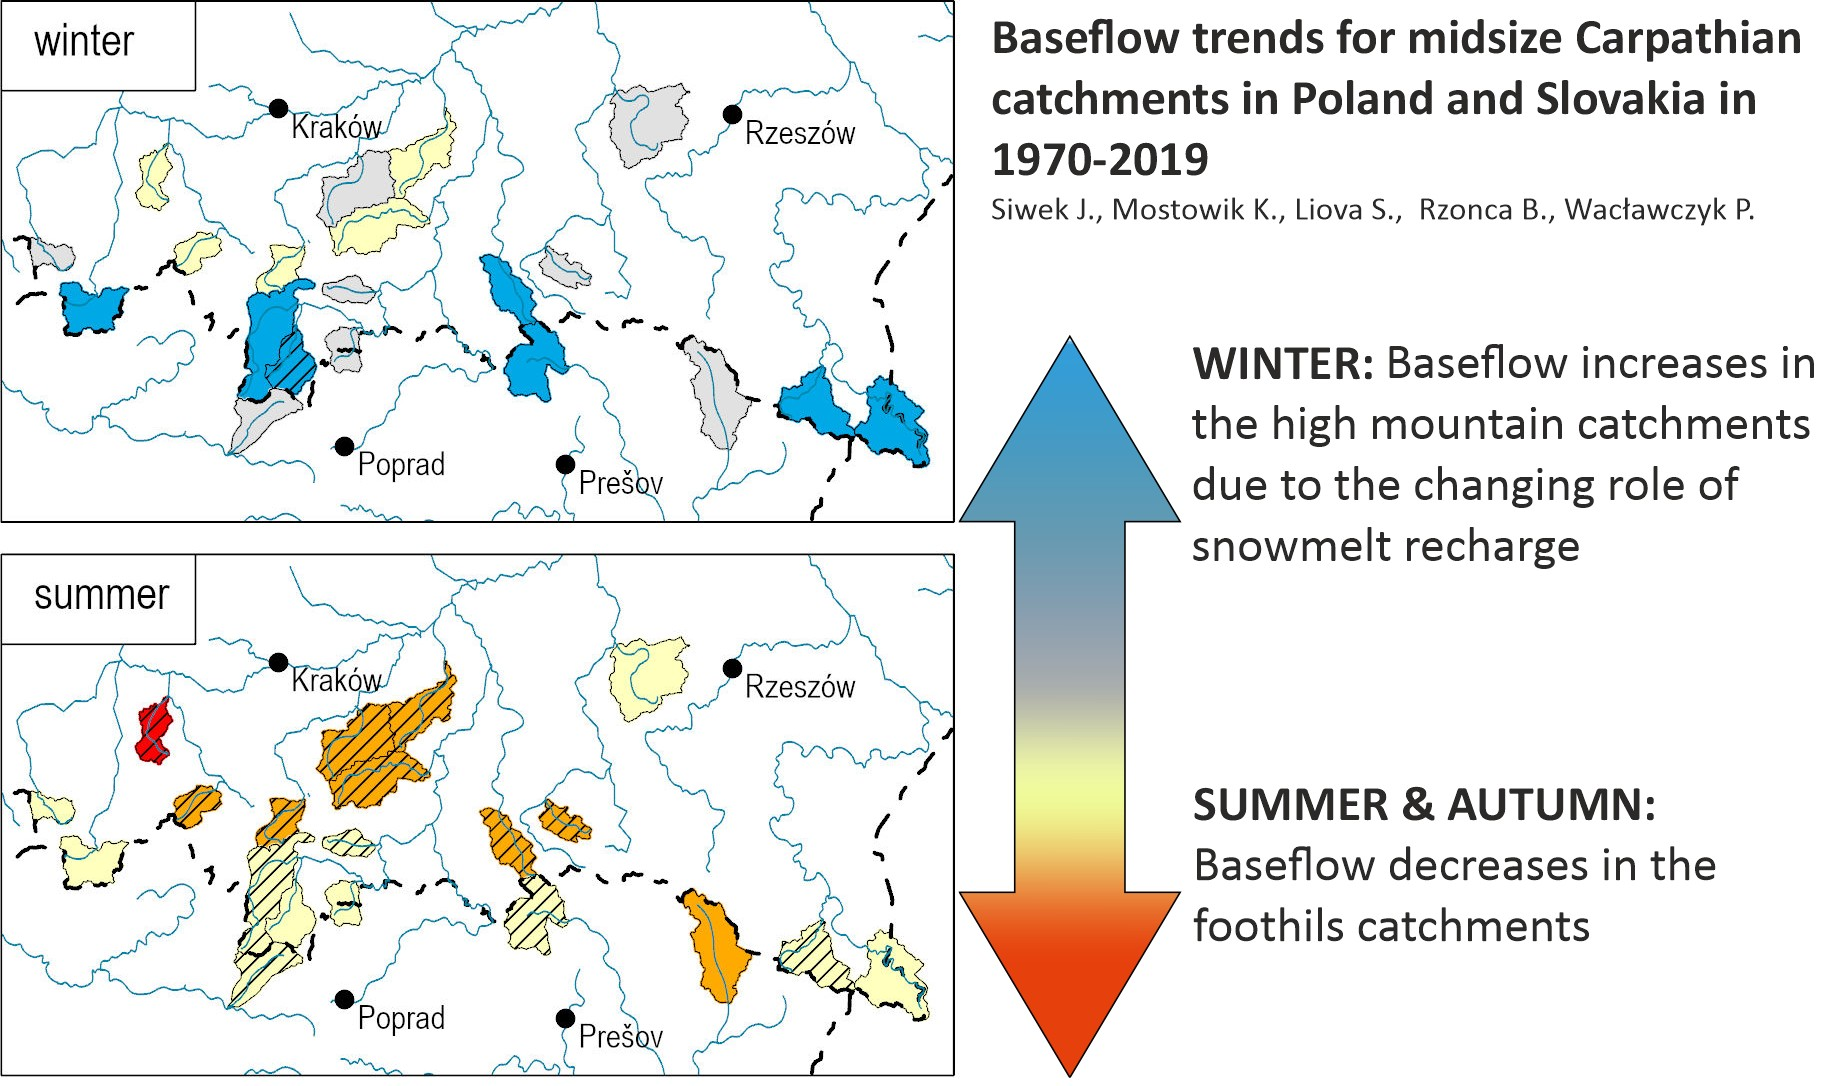
Baseflow Trends for Midsize Carpathian Catchments in Poland and Slovakia in 1970–2019

1
Jagiellonian University, Institute of Geography and Spatial Management, 30-387 Kraków, Poland
2
Regional Office Žilina, Slovak Hydrometeorological Institute, 011 13 Žilina, Slovakia
*
Author to whom correspondence should be addressed.
Water 2023, 15(1), 109; https://doi.org/10.3390/w15010109
Submission received: 6 October 2022 / Revised: 9 December 2022 / Accepted: 14 December 2022 / Published: 28 December 2022
(This article belongs to the Section Hydrology)

Abstract

:
Global warming affects, among many other things, groundwater recharge conditions. Over recent decades, this phenomenon in the Carpathians has been emphasized by the changing role of snowmelt recharge in winter and spring. The aim of the study was to assess baseflow trends in 20 medium-sized Carpathian catchments in Poland and Slovakia. The baseflow was calculated using Eckhardt’s digital filter. The trend analysis was performed using the non-parametric method separately for the series representing the baseflow throughout the whole year, and separately for seasons. The most evident changes were noted for the low baseflow in the summer and autumn, especially in foothill catchments. Statistically significant decreases in the low daily baseflow were expressed as a relative change, and ranged from −9% to −66% per 10 years for the summer, and from −12% to −82% per 10 years for the autumn. In winter and spring, trends in the low baseflow were not significant, except in high mountain catchments where 14% of increases in the low baseflow were noted in the winter and spring. The results indicate the changing role of snowmelt recharge in the Carpathians and the increasing problem of groundwater depletion in the summer and autumn, mainly in foothill areas.

Graphical Abstract

1. Introduction

Climate change associated with global warming is increasingly often reflected in the water cycle at the midsize catchment scale. Signs of this often include the accumulation of yearly runoff during flash flood events as well as increasingly severe drought events, declines in groundwater storage, and changes in the annual discharge regime [1,2,3,4]. Increases in air temperature lead not only to increased evaporation, but also affect groundwater recharge conditions, and in turn future catchment water resources [5]. Research on changes in the water supply constitutes one of the most important issues in science related to the effects of global warming. Recent studies concern not only trends in stream discharge at a variety of temporal and spatial scales, e.g., [2,3,6,7,8,9,10,11,12,13,14], but also the groundwater response to these changes, e.g., [5,15,16,17,18,19,20,21,22]. Finally, the said changes affect the amount of freshwater in catchments that may be used as drinking water by human populations [23,24,25,26].
In recent years, a number of papers have appeared focusing on changes in the baseflow driven by climate change as a direct indicator of changes in the groundwater recharge at the catchment scale, e.g., [27,28,29,30,31]. Baseflow (Qb) is distinguished in the total stream runoff as its most stable component, reflecting groundwater storage conditions in the catchment and being not attributed to a single rainfall event [32]. Periods of drought illustrate the critical importance of baseflow rates, as rivers and streams are reliant completely on groundwater recharge during such periods. It is crucial for ecological reasons as well as the source of drinking water for municipal water systems collecting water from local rivers. In the European Union, river water provides about 37% of the drinking water available in this region [33].
Researchers studying mountain areas have observed enhanced warming with elevation, although this is not a globally unified pattern due to the significant complexity of factors that affect mountain area climates [34]. In the Carpathian Mountains the potential impact of increases in air temperature on water circulation patterns remains much lower than in surrounding areas [13,14,35,36]. Both snow cover and snowmelt play an important role in the Carpathians in terms of their effects on the overall water supply in this region by recharging the aquifers during the spring season. Furthermore, overall water circulation patterns may change even when precipitation amounts remain similar over the long term, which further affects groundwater recharge conditions [5,7,8,9,10,13]. In the most recent few decades, the share of snowfall precipitation in the Carpathians available during the winter season has declined in relation to the share of rainfall. The occurrence of midwinter snowmelt events has also increased during this time period. However, the trend in atmospheric precipitation totals on the annual basis remains unclear [37,38,39,40]. Studies conducted in Central Europe show that one effect of ongoing climate change in the region will be more frequent and also more extreme drought events [8,20,41]. At the same time, other assessments created for the Carpathians and surrounding areas suggest an increase in precipitation and discharge totals over the next few decades [11,42,43]. In mountainous regions in Germany, Eckhardt and Ulbrich [44] predicted the consequences of climate change as the decreasing role of spring–snowmelt recharge and reduced spring–snowmelt discharge peaks. On the other hand, they expected the increase of flood risk in winter.
The western part of the Carpathian range constitutes a complicated system of mountain massifs running from west to east and clearly elevated over surrounding areas. Precipitation amounts across the Carpathians, as well as runoff, are much higher and more dynamic compared with surrounding areas in this area. For example, Carpathian river catchments constitute only 11% of the entire Vistula River drainage basin in Poland, but generate 40% of discharge in the Vistula basin [45]. Discharge occurs via a well-developed river network stretching across the entire Carpathian range in Poland. The Carpathian Mountains are, in many ways, a water tower for this part of the European continent [46]. This, in practice, means that climate conditions and hydrologic patterns in the Carpathians strongly affect the water supply and river regime not only in the Carpathians, but also across large lowland areas in Central Europe.
The Carpathian geographic region remains an area relatively weakly affected by human impact. Many catchments remain seminatural thanks to various environmental laws, including the establishment of national parks. This allows one to conclude that climate change will be a key factor in changes in water circulation patterns in this region. However, it would not be wise to assume that other factors such as urban growth, deforestation, road construction, and reservoir construction do not play some role in some of the said changes [47,48,49,50].
The purpose of the paper is to assess baseflow trends in the Western Carpathians in the period 1970–2019. The following research questions were used to achieve the stated purpose: (1) What is the magnitude and spatial variability of the baseflow in the Western Carpathians? (2) Are there any observable annual or seasonal changes in the baseflow over the studied period? (3) What is the spatial pattern of change in the baseflow? (4) What is the meaning of these changes in terms of the catchment’s water resources?

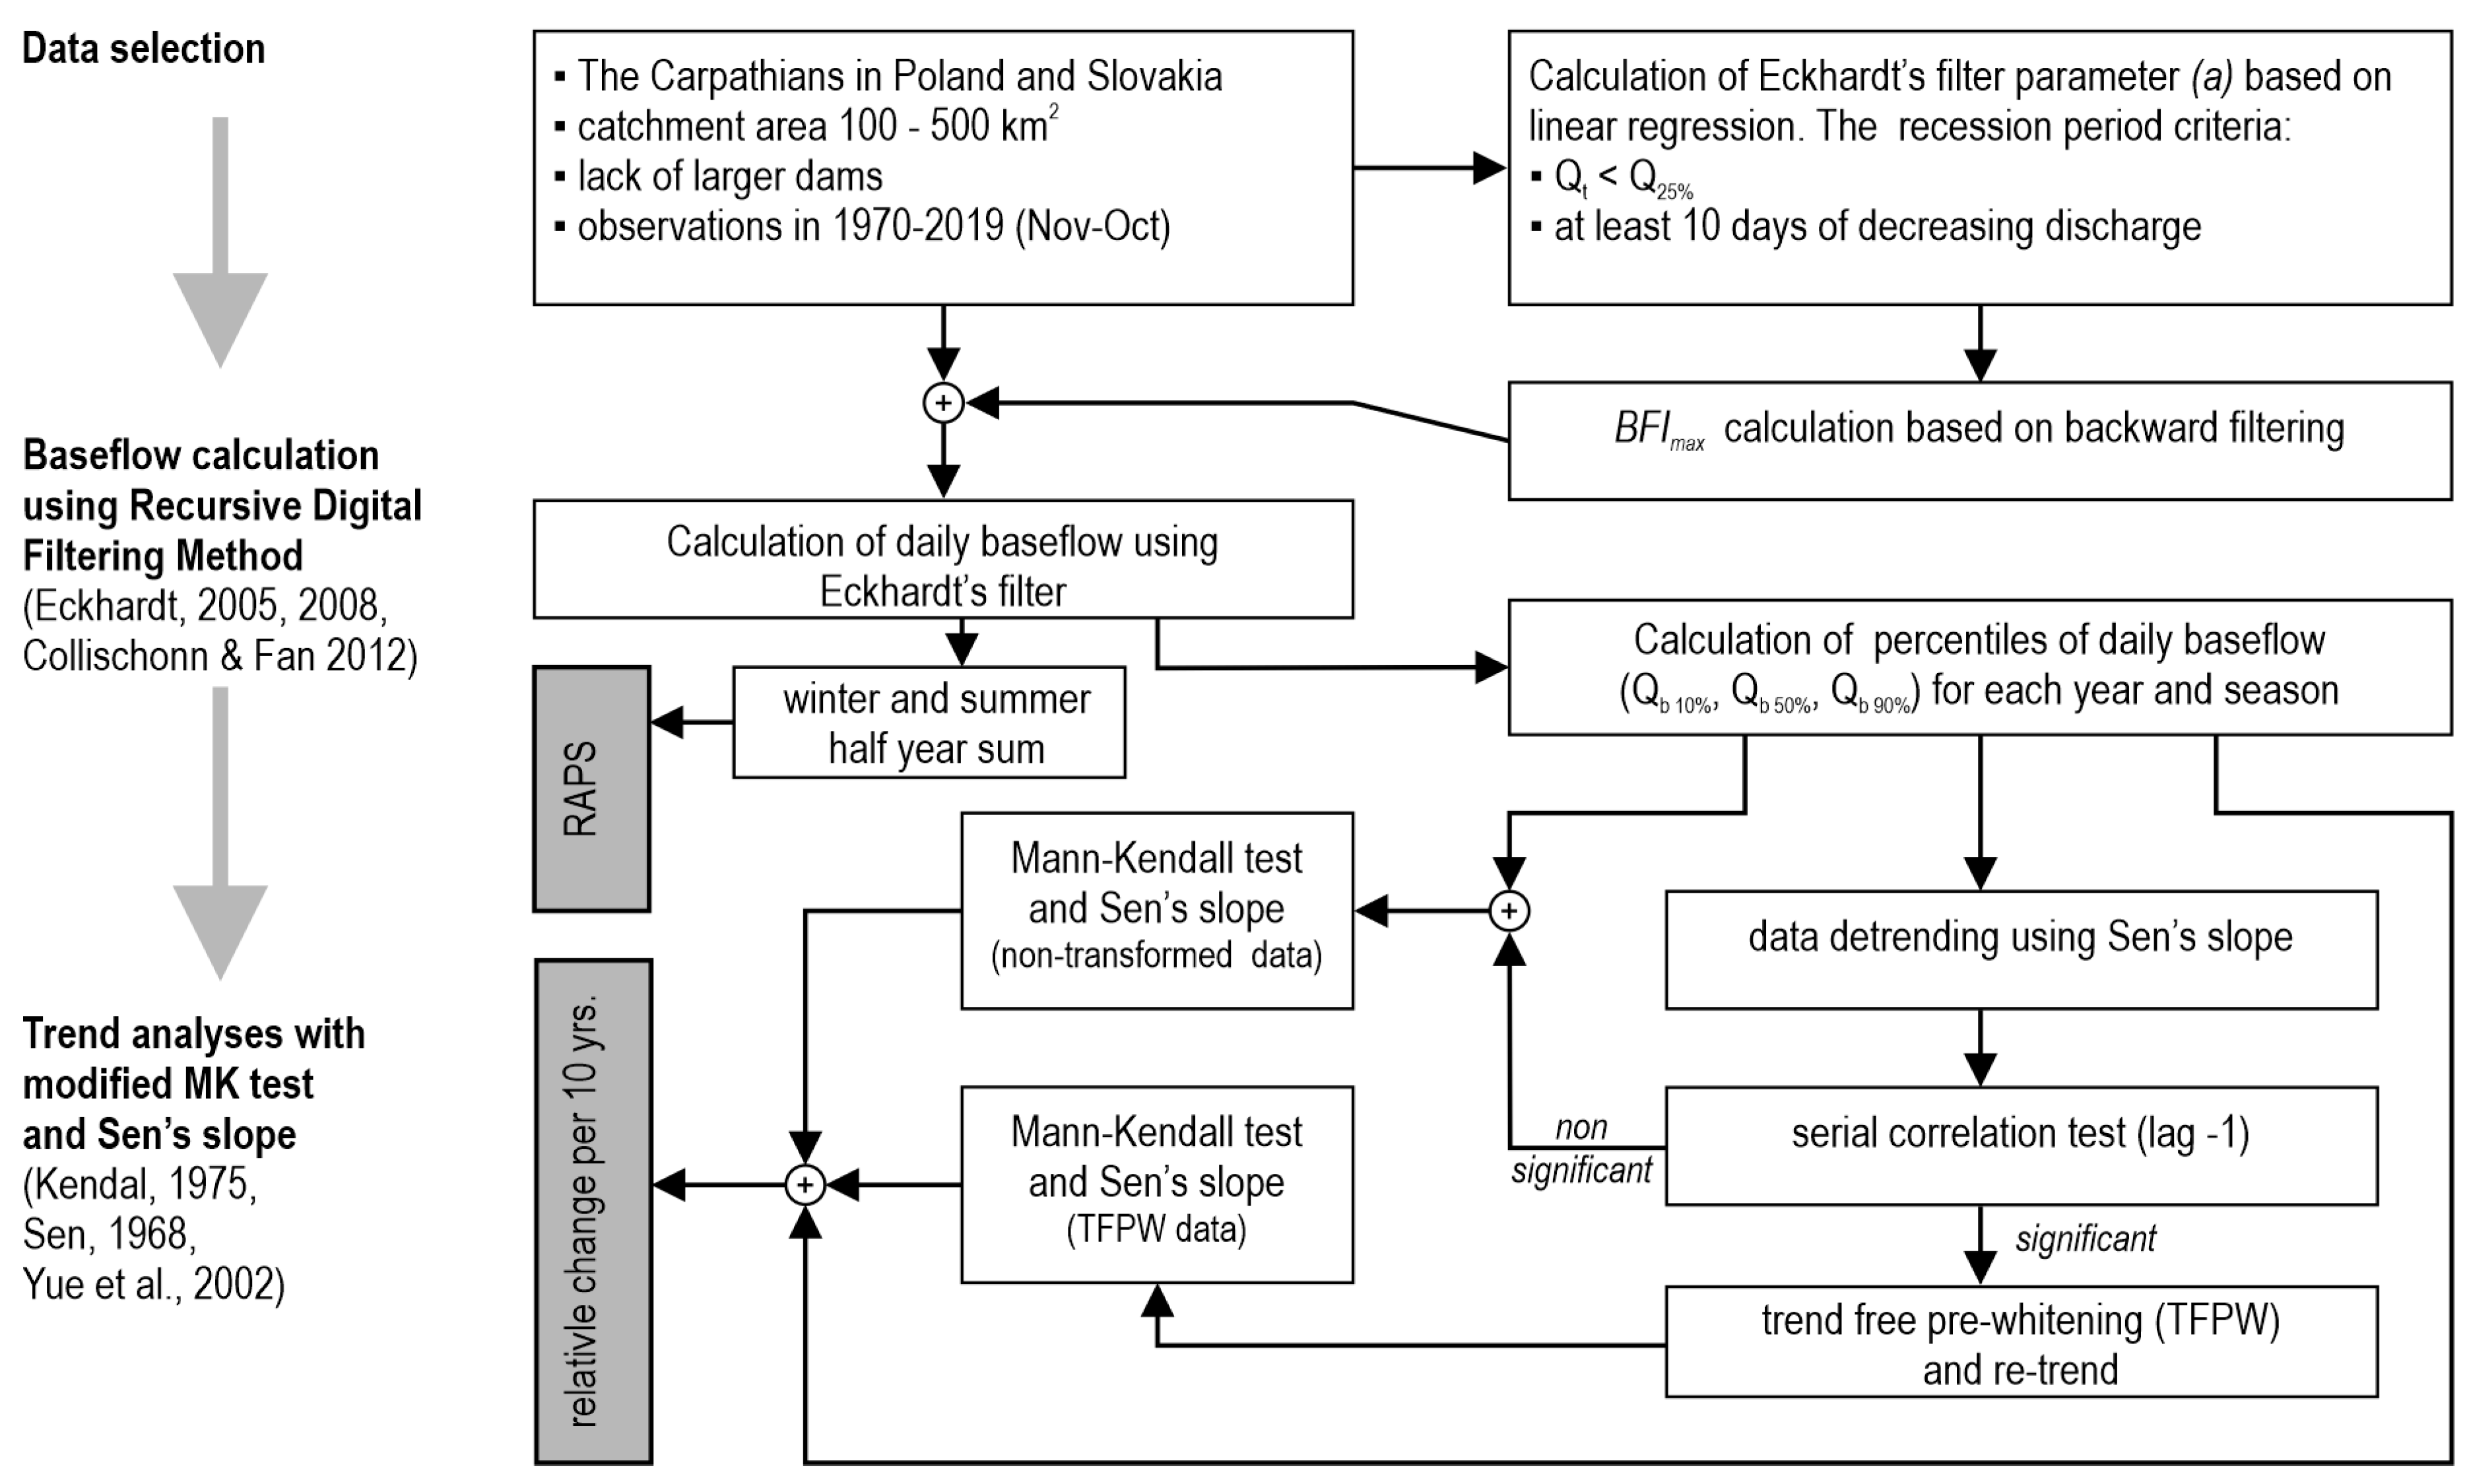
2. Material and Methods

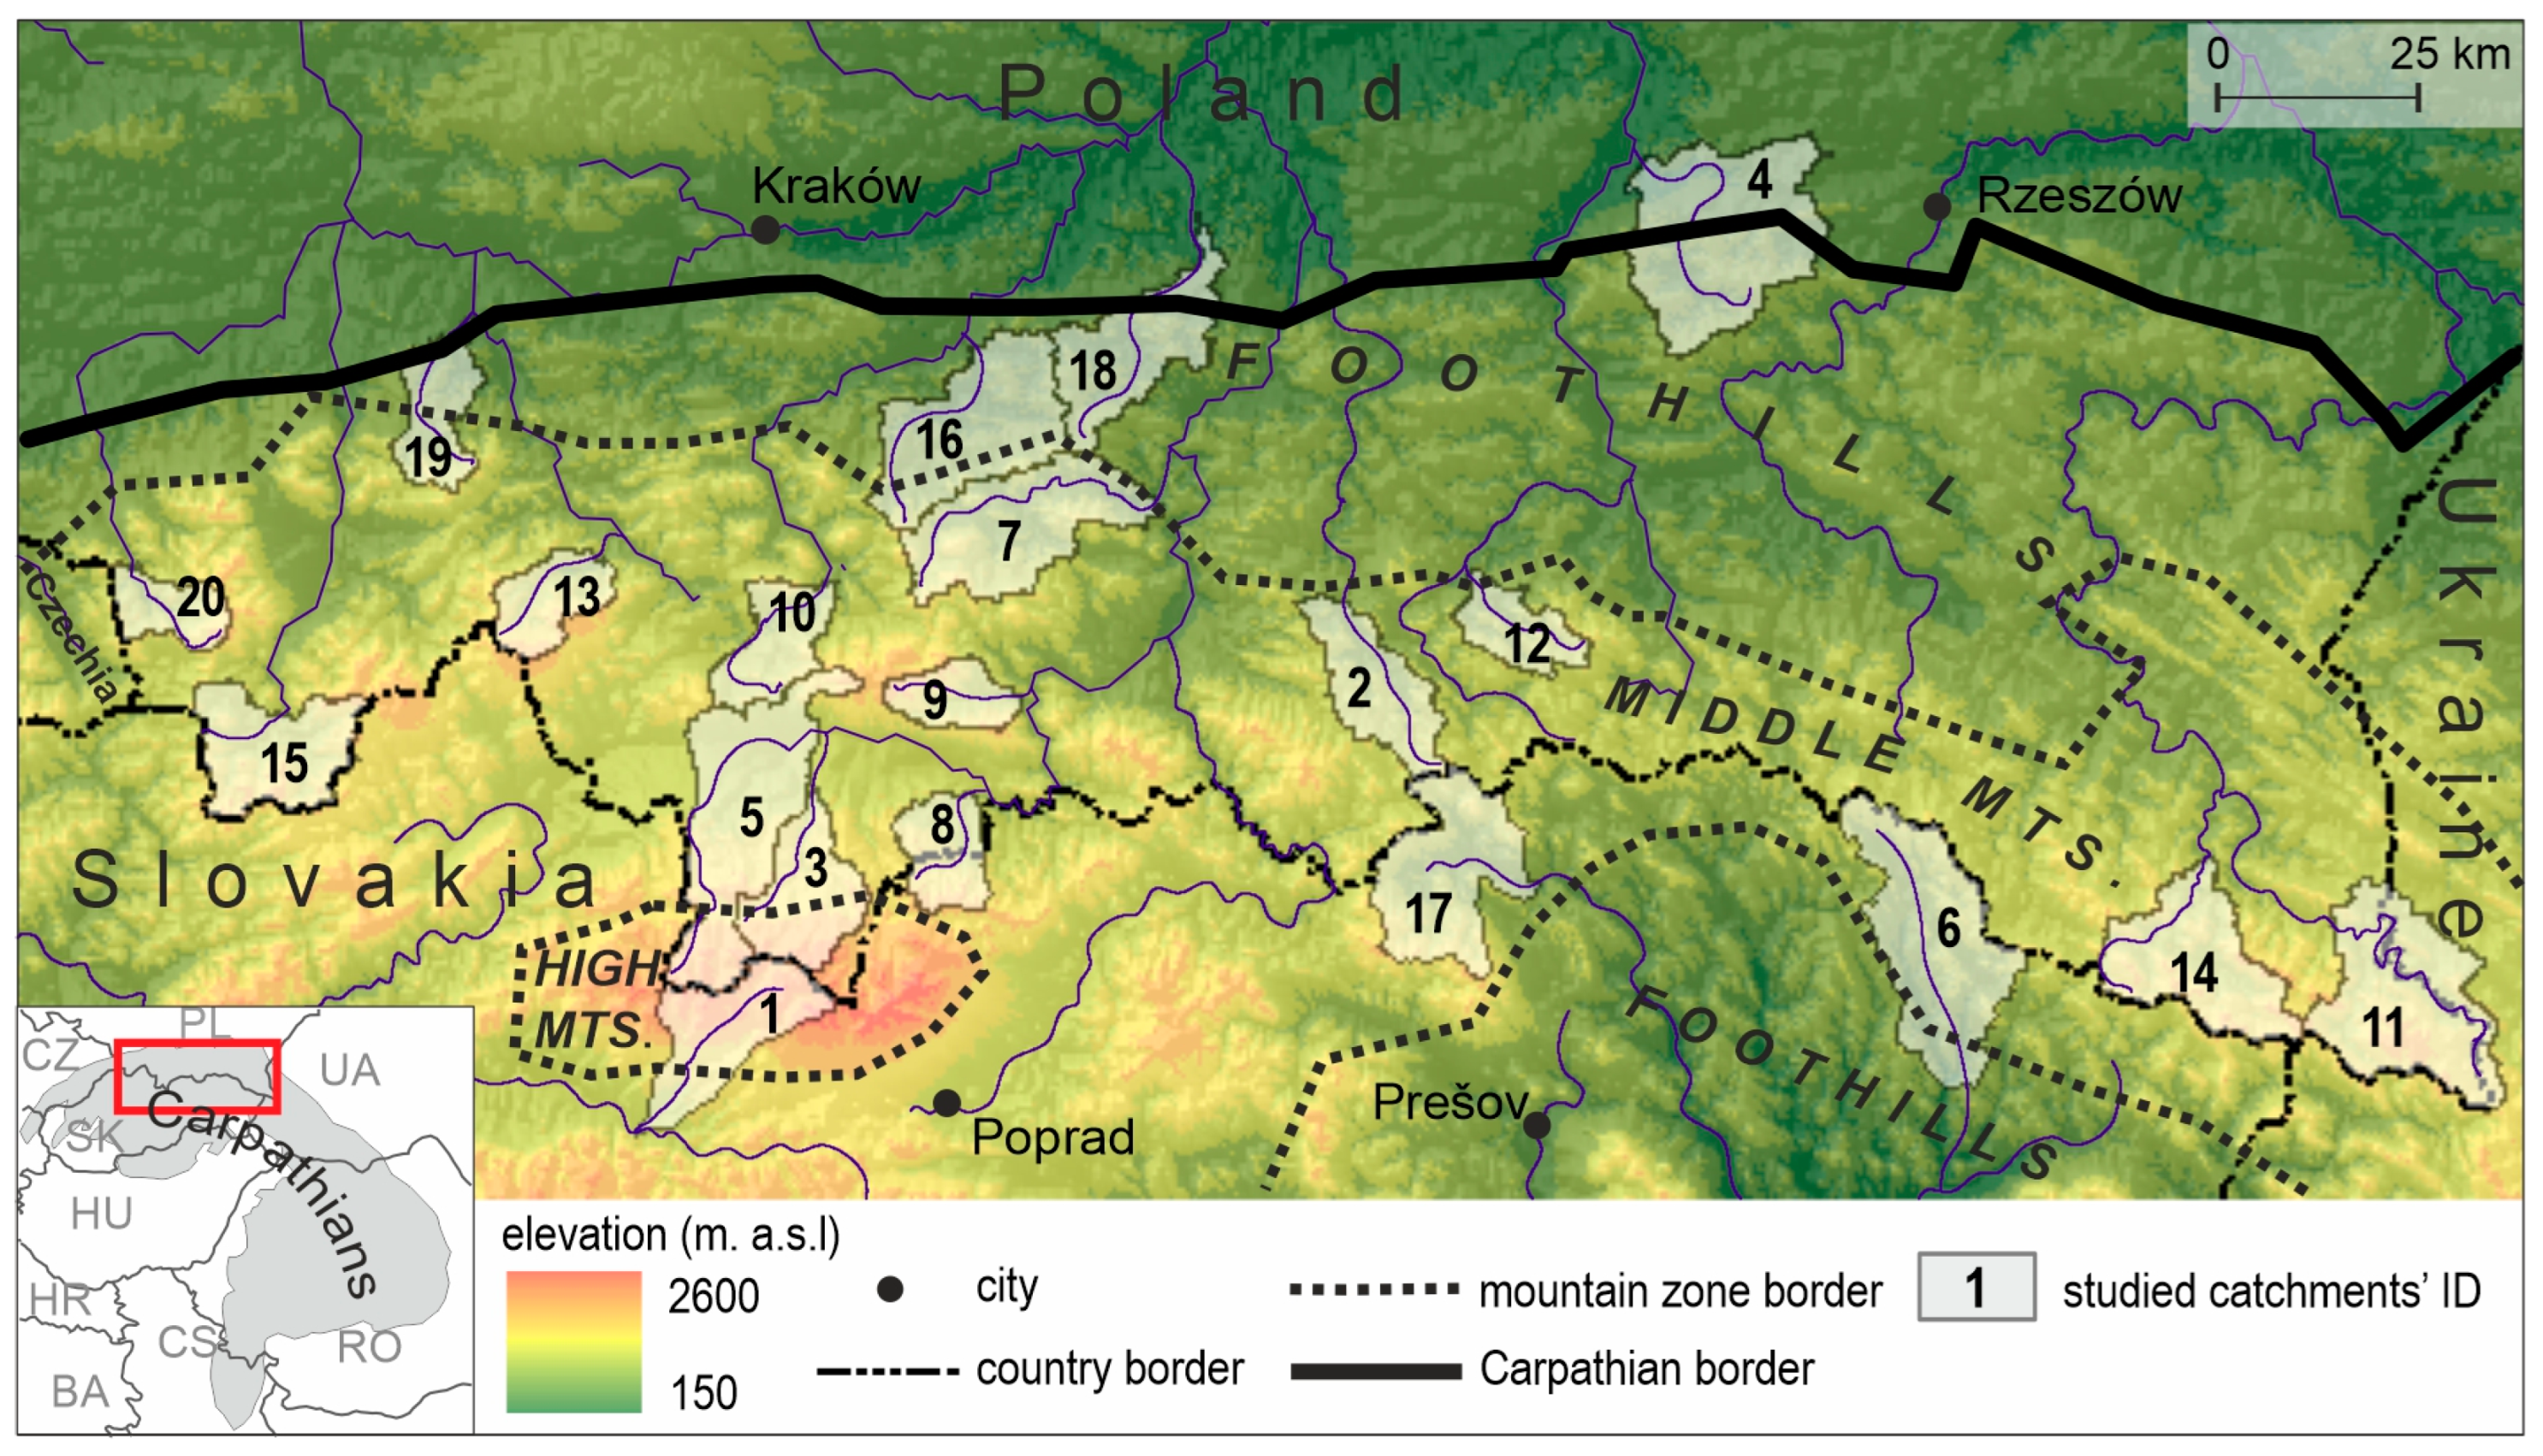
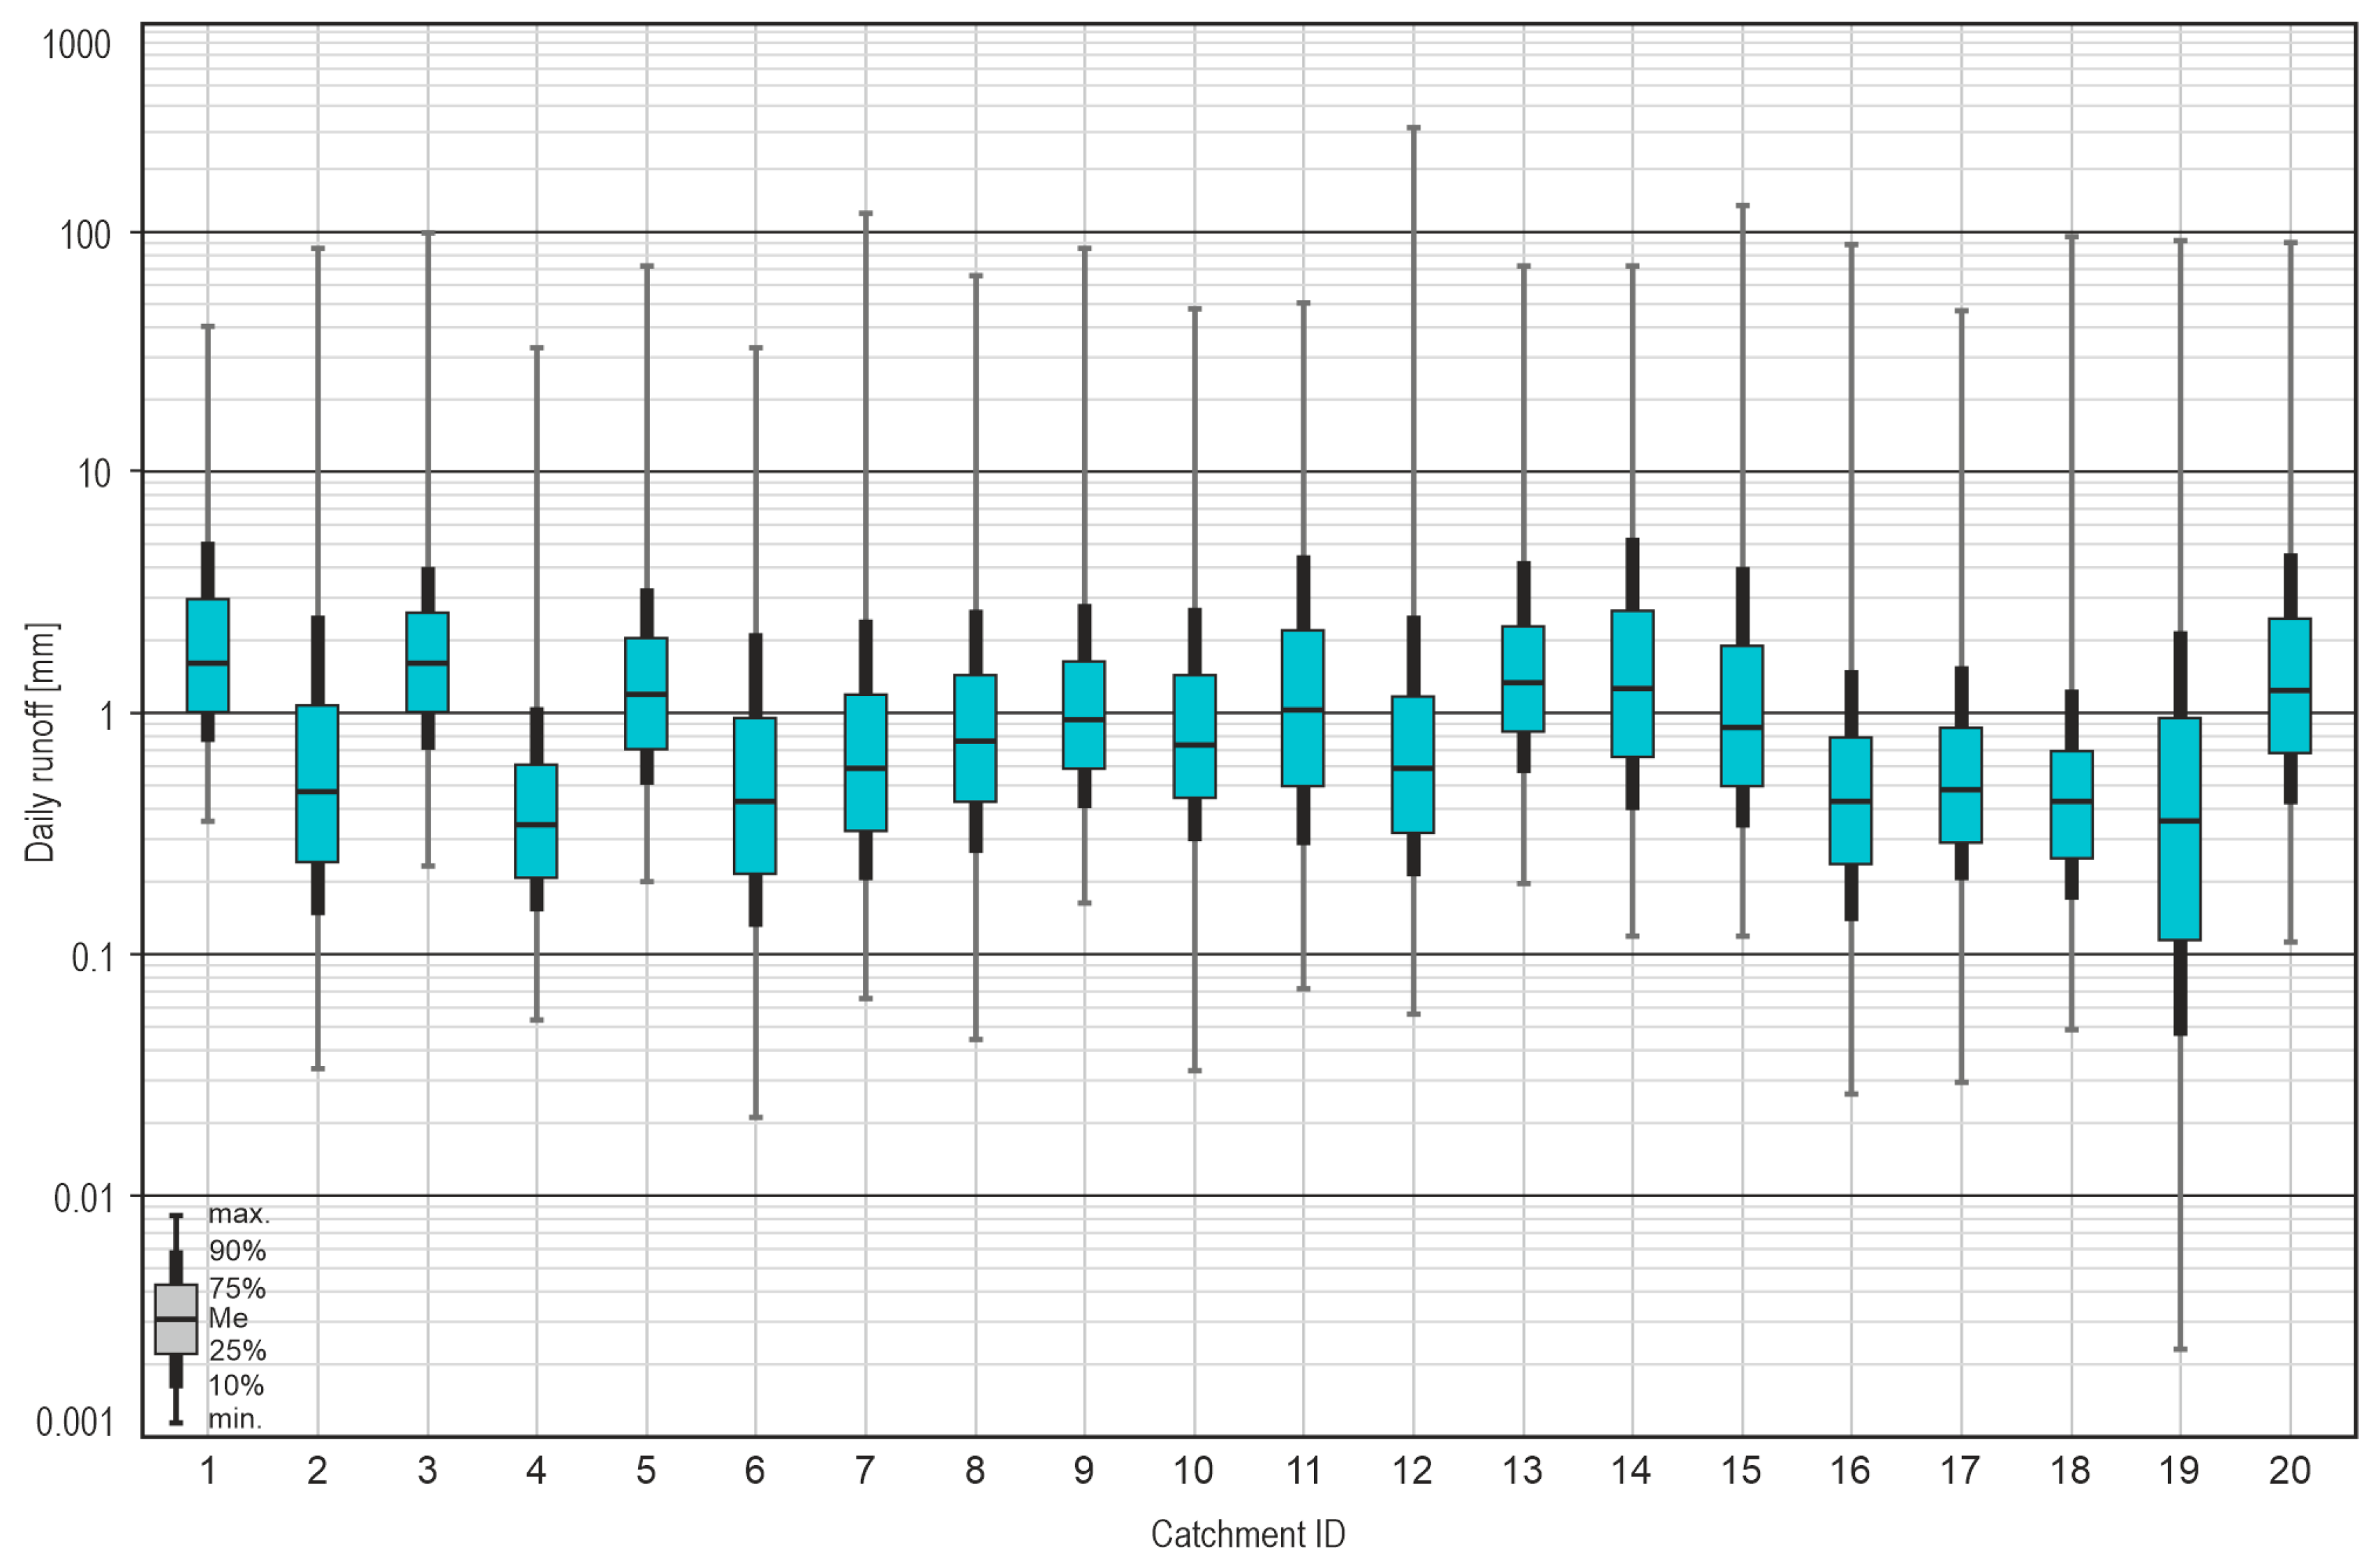
2.1. The Studied Catchments

The study area in the paper consists of the Polish and Slovak sections of the Carpathian Mountains, reaching 2655 m of elevation (Mount Gerlach, Tatra Mountains). Data from the hydrologic network of the Slovak Hydrometeorological Institute and Polish Institute of Meteorology and Water Management were used to identify 20 medium-sized (100–500 km2) catchments examined for the time period 1970–2019 for research purposes (Figure 1, Table 1). The selected catchments represent foothills, middle mountains and high mountains, based on the Carpathian Mountains division [51], and do not include any larger reservoirs or larger cities. The bedrock in the foothills and middle mountains is dominated by flysch (sandstone and shale), which forms structural nappe-type units. High mountain bedrock (nos. 1, 3, 5) consists of a crystalline core overlapped with sedimentary cover (mainly carbonate rocks) and surrounded by a post-tectonic basin filled with flysch rocks. Mean catchment elevation ranges from 272 m (Brzeźnica river catchment in the Carpathian foothills, no. 4) to 1286 m in the Belá river catchment (no. 1), covering the highest ranges of the Tatra Mountains (Table 1). Precipitation and runoff totals increase with increases in site elevation; therefore, average annual runoff in selected catchments varies from 216 to 876 mm (Table 1). The daily runoff median ranges from 0.3 to 0.4 mm in the foothill catchments and up to 1.6 mm in catchments dominated by high mountains (Figure 2). According to CORINE Land Cover 2018 data, most of the studied catchments are woodland areas, although some foothill catchments consist mainly of arable land (Table 1). Pasture and grassland areas constitute a substantial part of the Tatra Mountains and their surroundings.

2.2. Baseflow Calculation

Daily discharge values served as the basis for calculating daily baseflow by employing a recursive digital filter proposed by Eckhardt [52]. This approach is currently one of the most often used non-tracer methods for the estimation of baseflow in the mountainous areas [52,53,54]; however, it has not yet been used for the Polish part of the Carpathians. With this method, the daily baseflow is calculated using the following formula:
Q b , t = 1 B F I m a x a   Q b , t 1 + 1 a B F I m a x Q t 1 a B F I m a x
The calculation assumes that Qb,t ≤ Qt, where: Qb—baseflow; Q—total streamflow; t—time step (one day); a—filter parameter; BFImax—maximum baseflow that can be modeled via the said formula. Eckhardt [55] predefines representative values of the said filter parameters a and BFImax (0.25–0.80) for several aquifer types; however, additional research has shown that this method yields more accurate results after parametrization. In the present study, we perform the parametrization in a manner proposed by Collischonn and Fan [53], which is based on linear regression analysis (Figure 3). According to this method, the parameter a relates discharge values with a one-time step lag in the falling limbs, when direct runoff is assumed to be zero. In this study, the parameter a is averaged for each identified period with runoff below Q25% and discharge continuously decreasing for at least 10 days:
a = 1 n k = 1 n Q t Q t 1  
where: a—recession constant; t—time step (one day); n—number of recession days.
The estimated parameter a was used for the computation of BFImax, which is interpreted as a maximum ratio of baseflow to total river runoff. According to Collischonn and Fan [53], BFImax was estimated using a backward moving filter:
Q b , t 1 = Q b , t a
subject to the restriction Q’b,t−1 ≤ Qt, where Q’b,t stands for the first approximation of baseflow at time step t. This baseflow approximation was used to calculate the BFImax parameter individually for each of the studied catchments:
B F I m a x = t = 1 n Q b , t t = 1 n Q t

2.3. Trend Estimation

Trend analysis was performed for a series where each year in the period 1970–2019 was assigned a percentile value (10%, 50%, 90%) based on daily baseflow values during the whole hydrologic year as well as for winter, spring, summer, and autumn separately (Figure 3). This approach was used to estimate the trends calculated for low (Qb,10%), median (Qb,50%), and high (Qb,90%) values of daily baseflow for each studied year as a whole and individually for every season.
Trends in baseflow percentile values (Qb,10%, Qb,50%, Qb,90%) were analyzed using non-parametric methods including the Theil–Sen slope estimator [56,57] and Mann–Kendall test [58,59]. The assumed significance level was p ≤ 0.05. According to the procedure proposed by Yue et al. [57], all trend analyses were preceded by the identification of serial correlations in de-trended data. In the case of data series exhibiting significant (p ≤ 0.05) autocorrelation with lag −1, the trend-free pre-whitening procedure (TFPW) was used [57].
The trend estimator was expressed as a change in the daily baseflow percentile per 10 years, as well as a change in Sen’s slope relative to the appropriate percentile of baseflow in the period 1970–2019:
s r p , t = 10 s p , t Q b p , t
where: sr—relative change per 10 years; s—Sen’s slope estimator; p—baseflow percentile (10%, 50%, 90%); t—analyzed period (year, winter, spring, summer, autumn).
The same approach was used for the calculation of trends for total runoff.

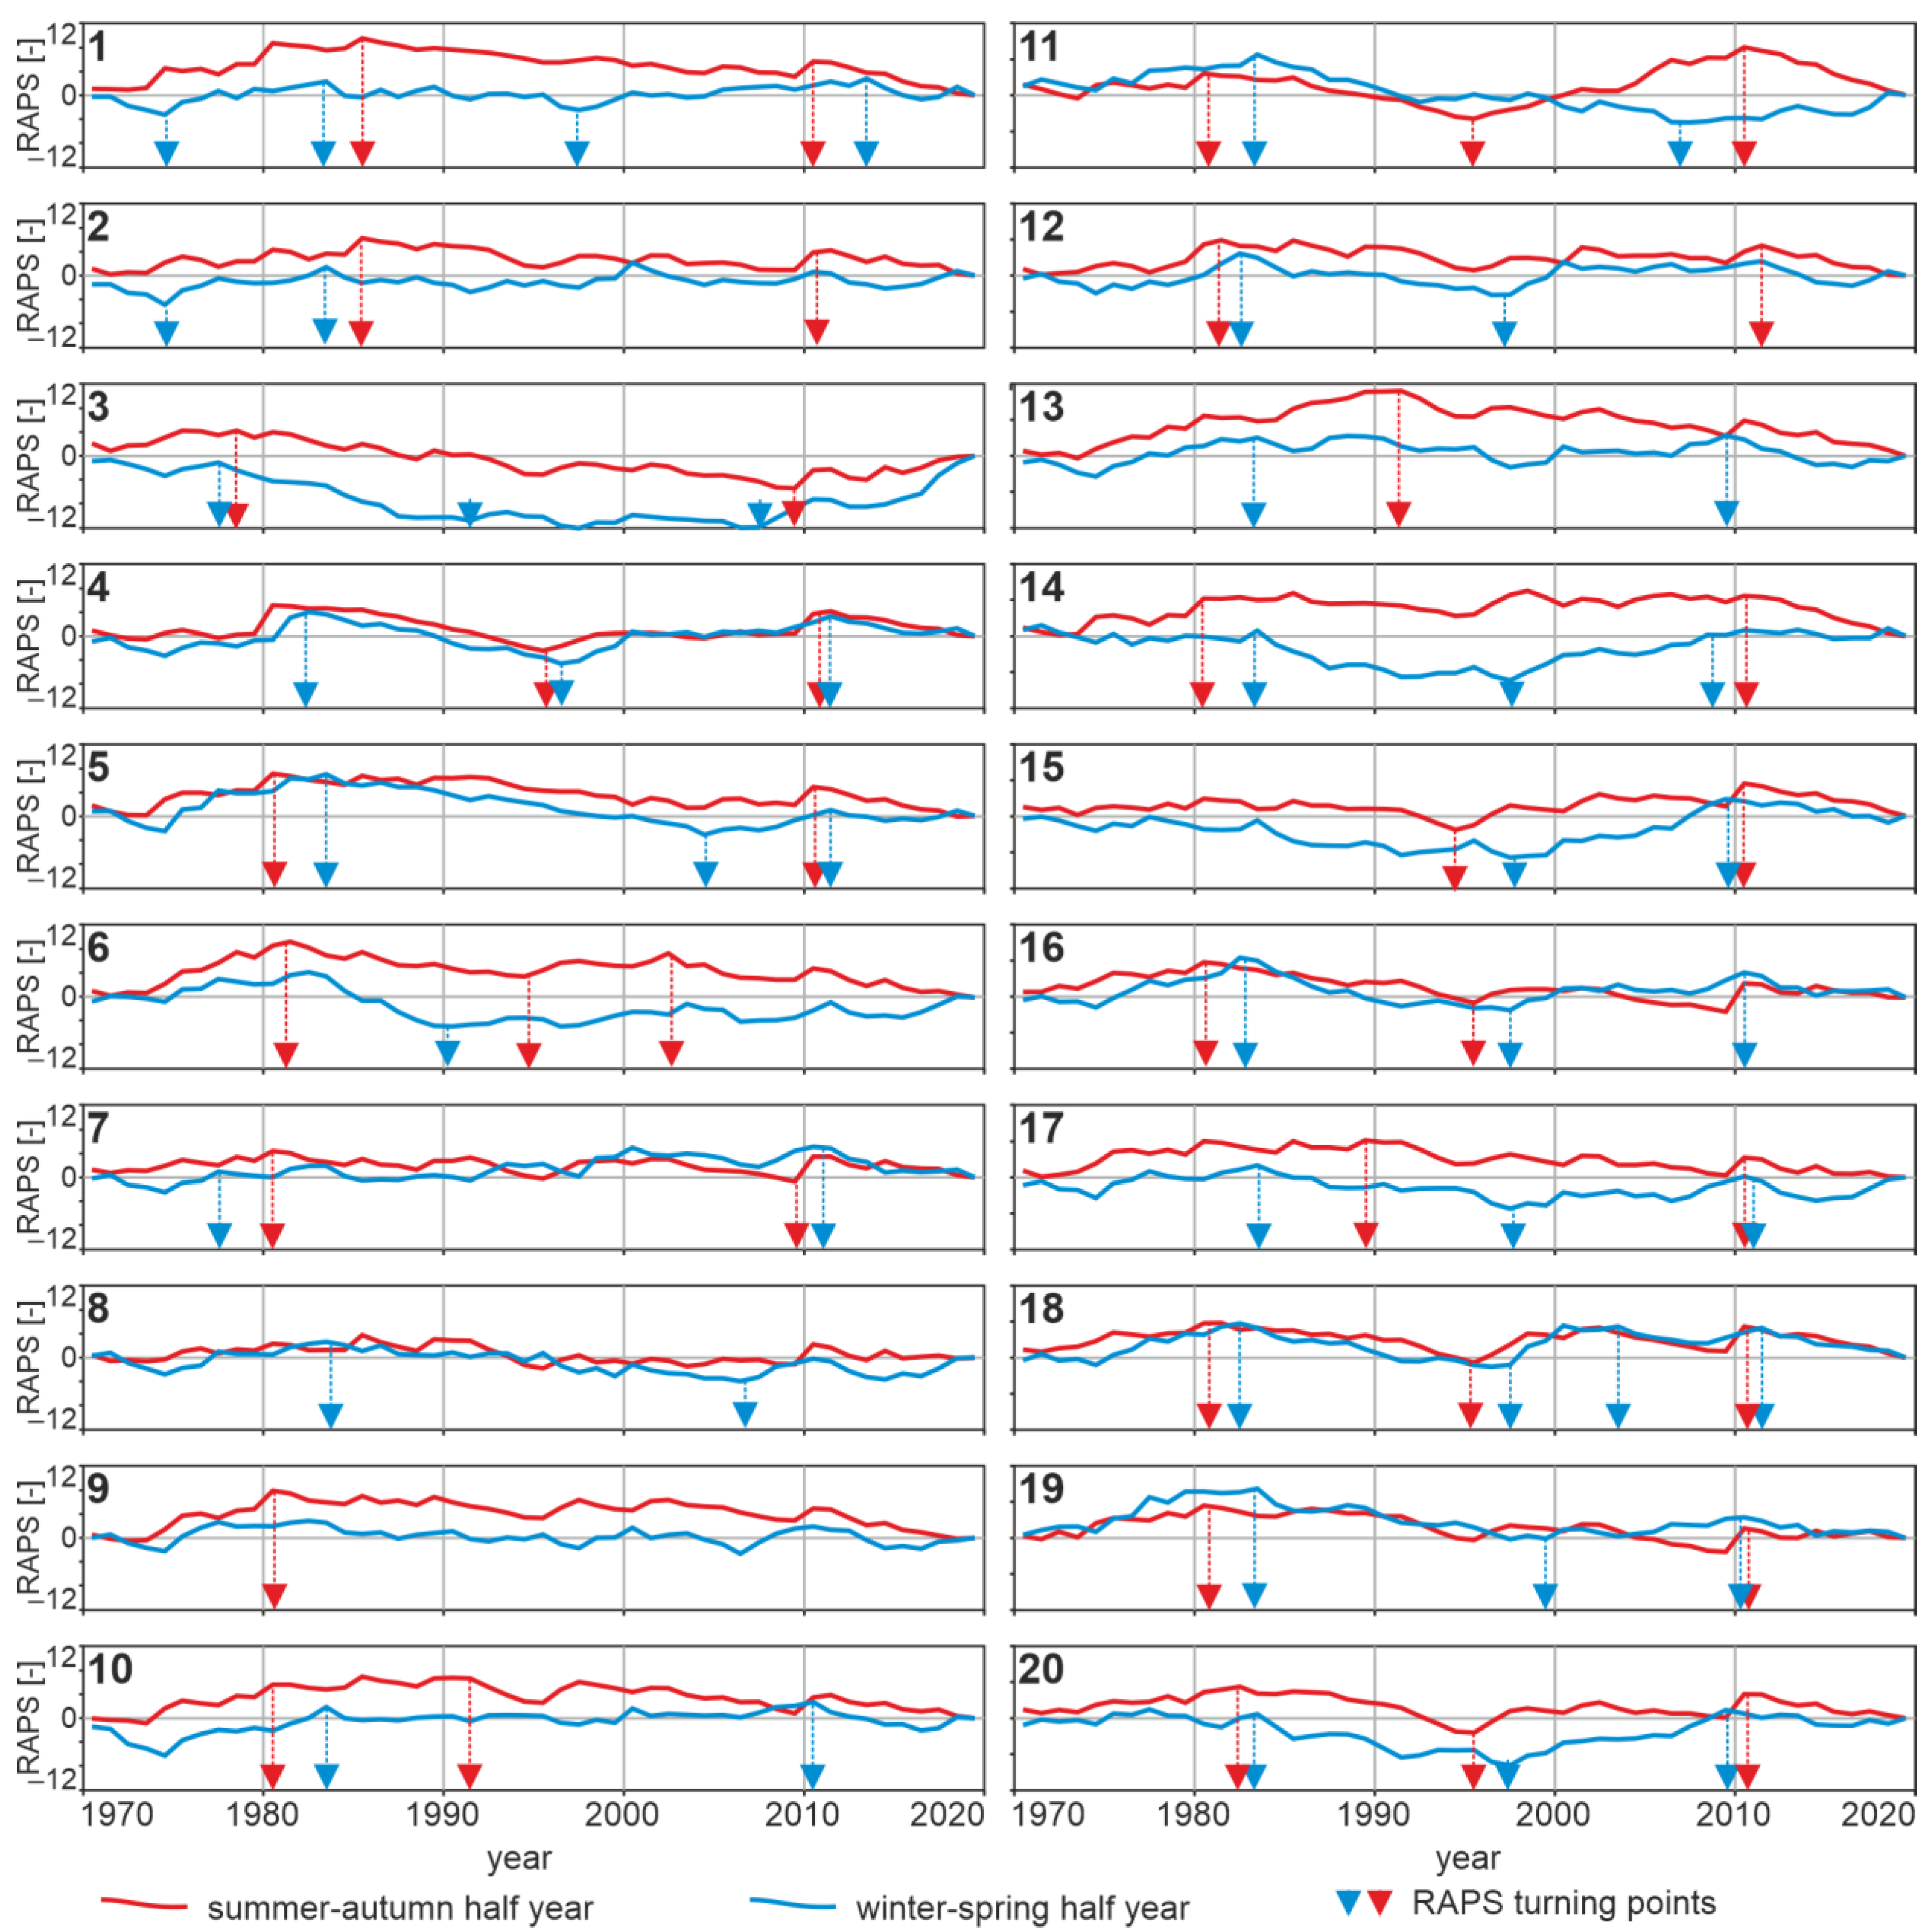
2.4. Rescaled Adjusted Partial Sums
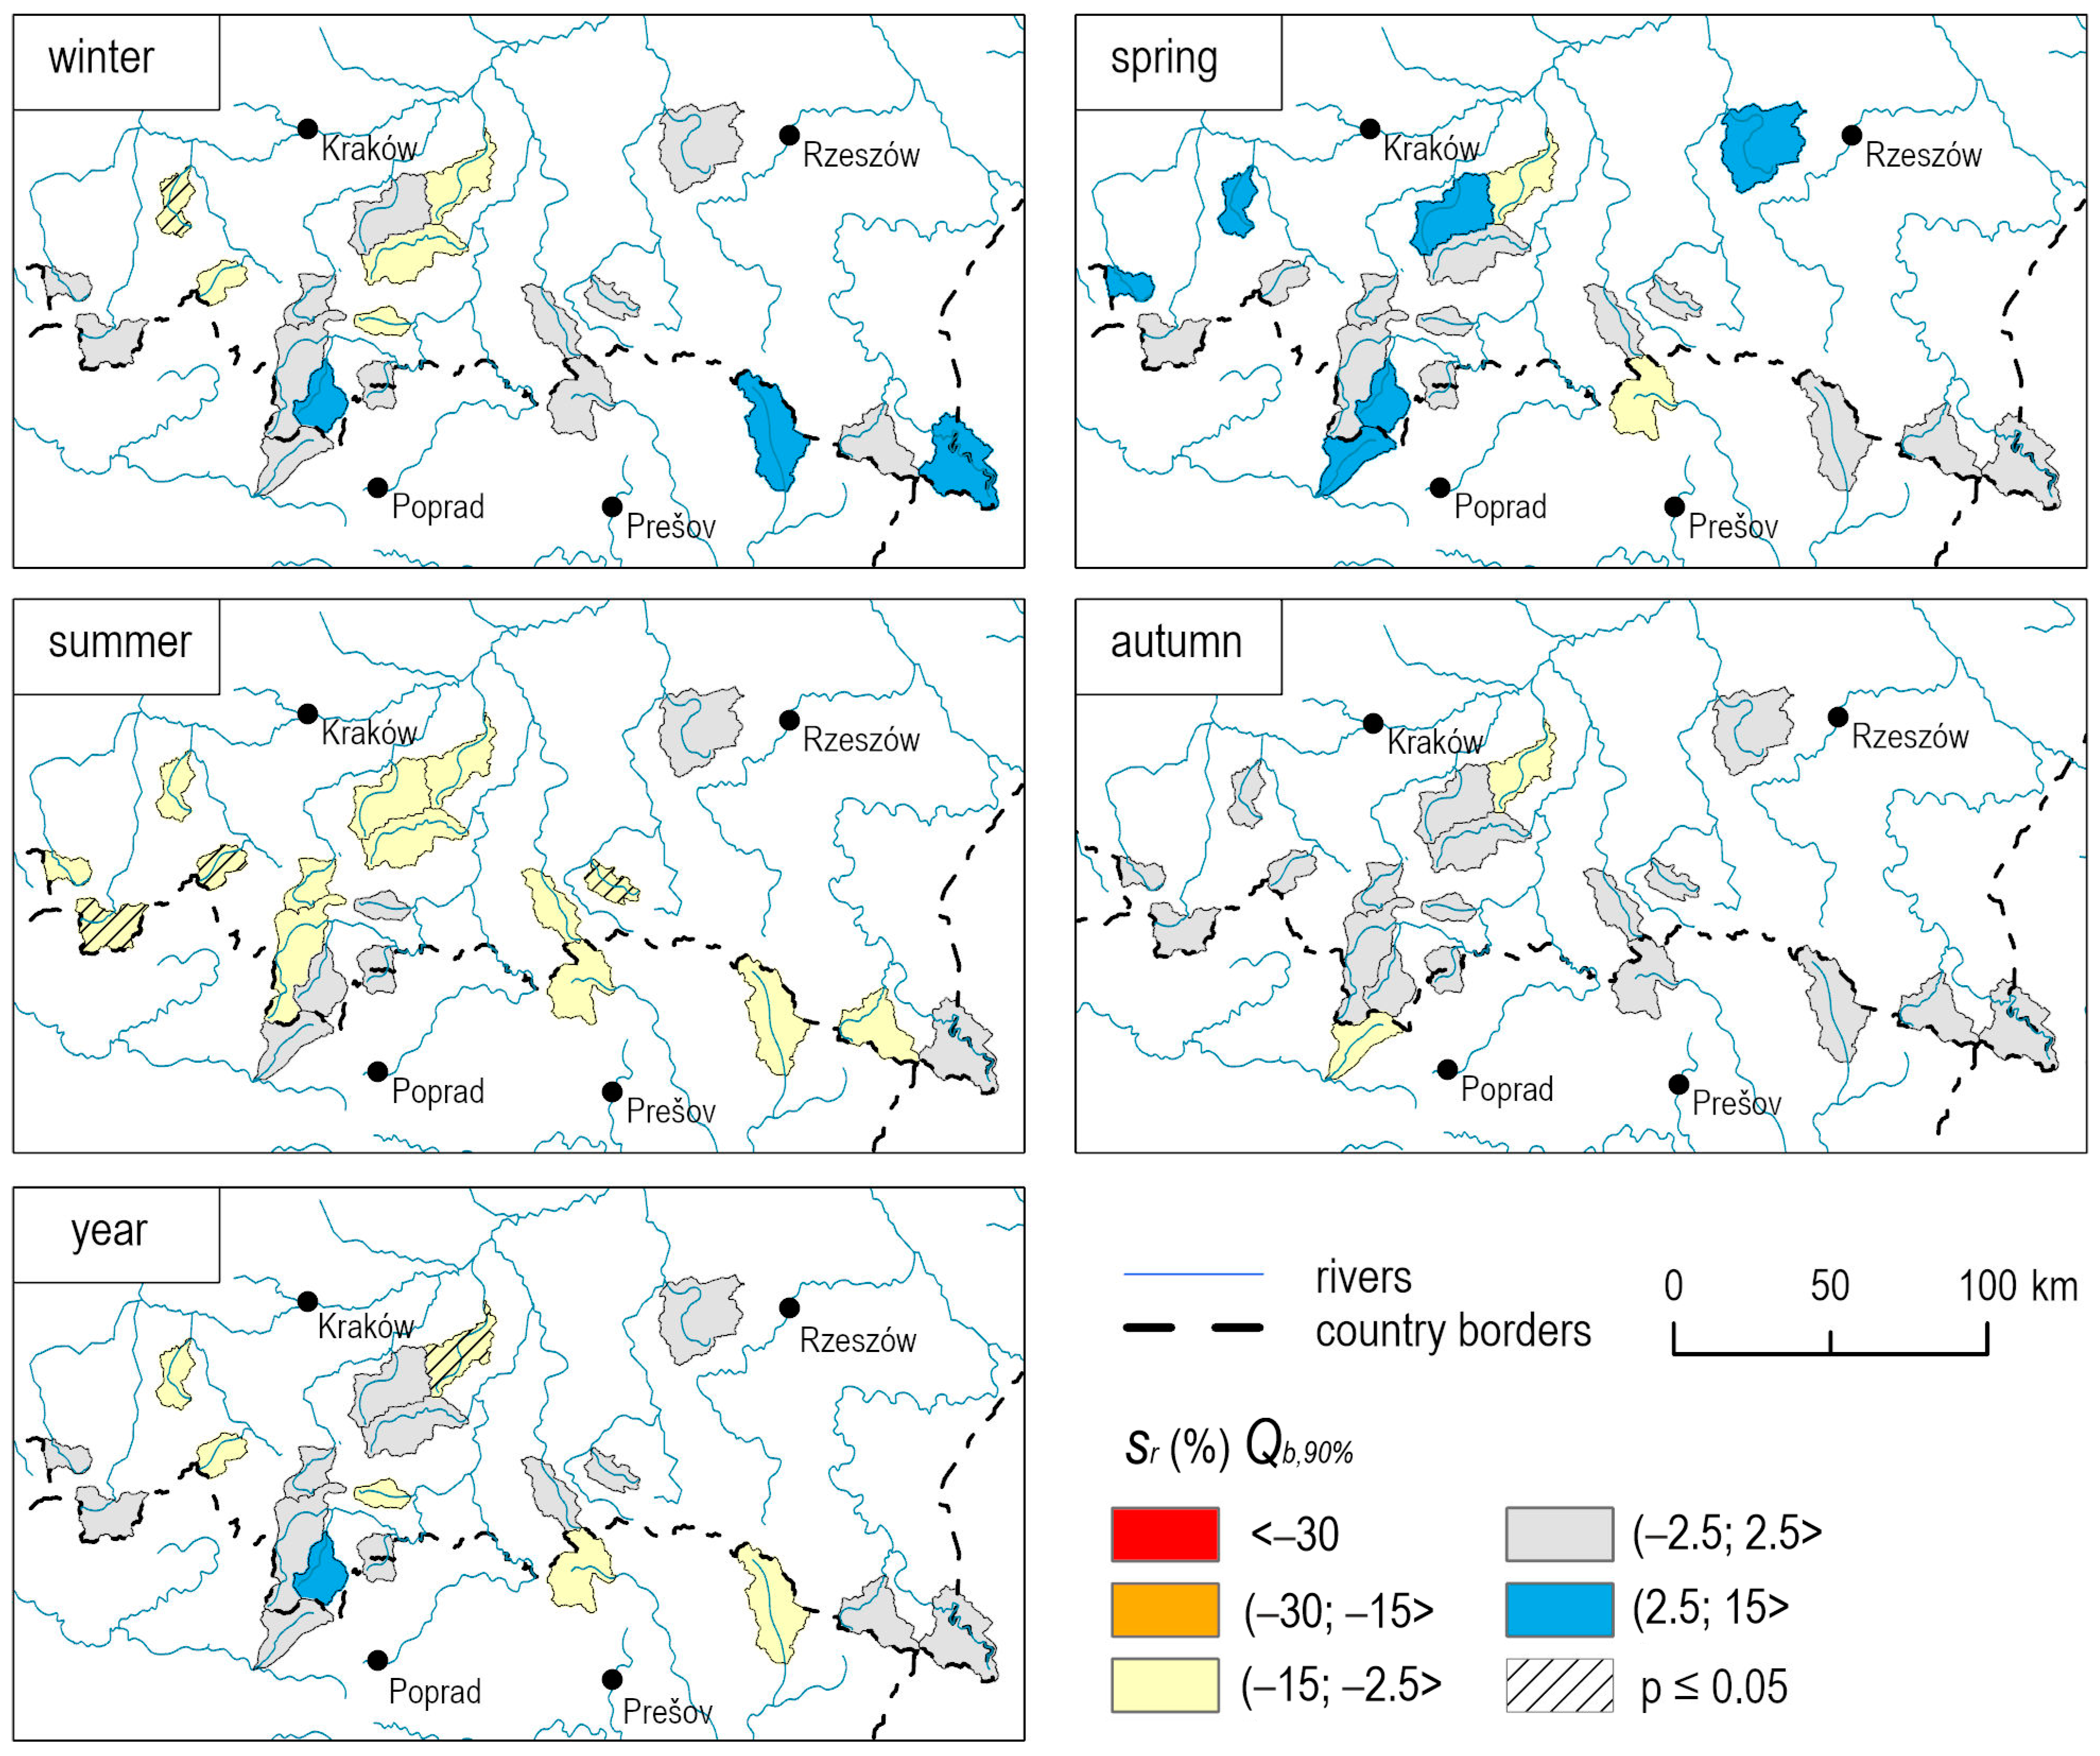
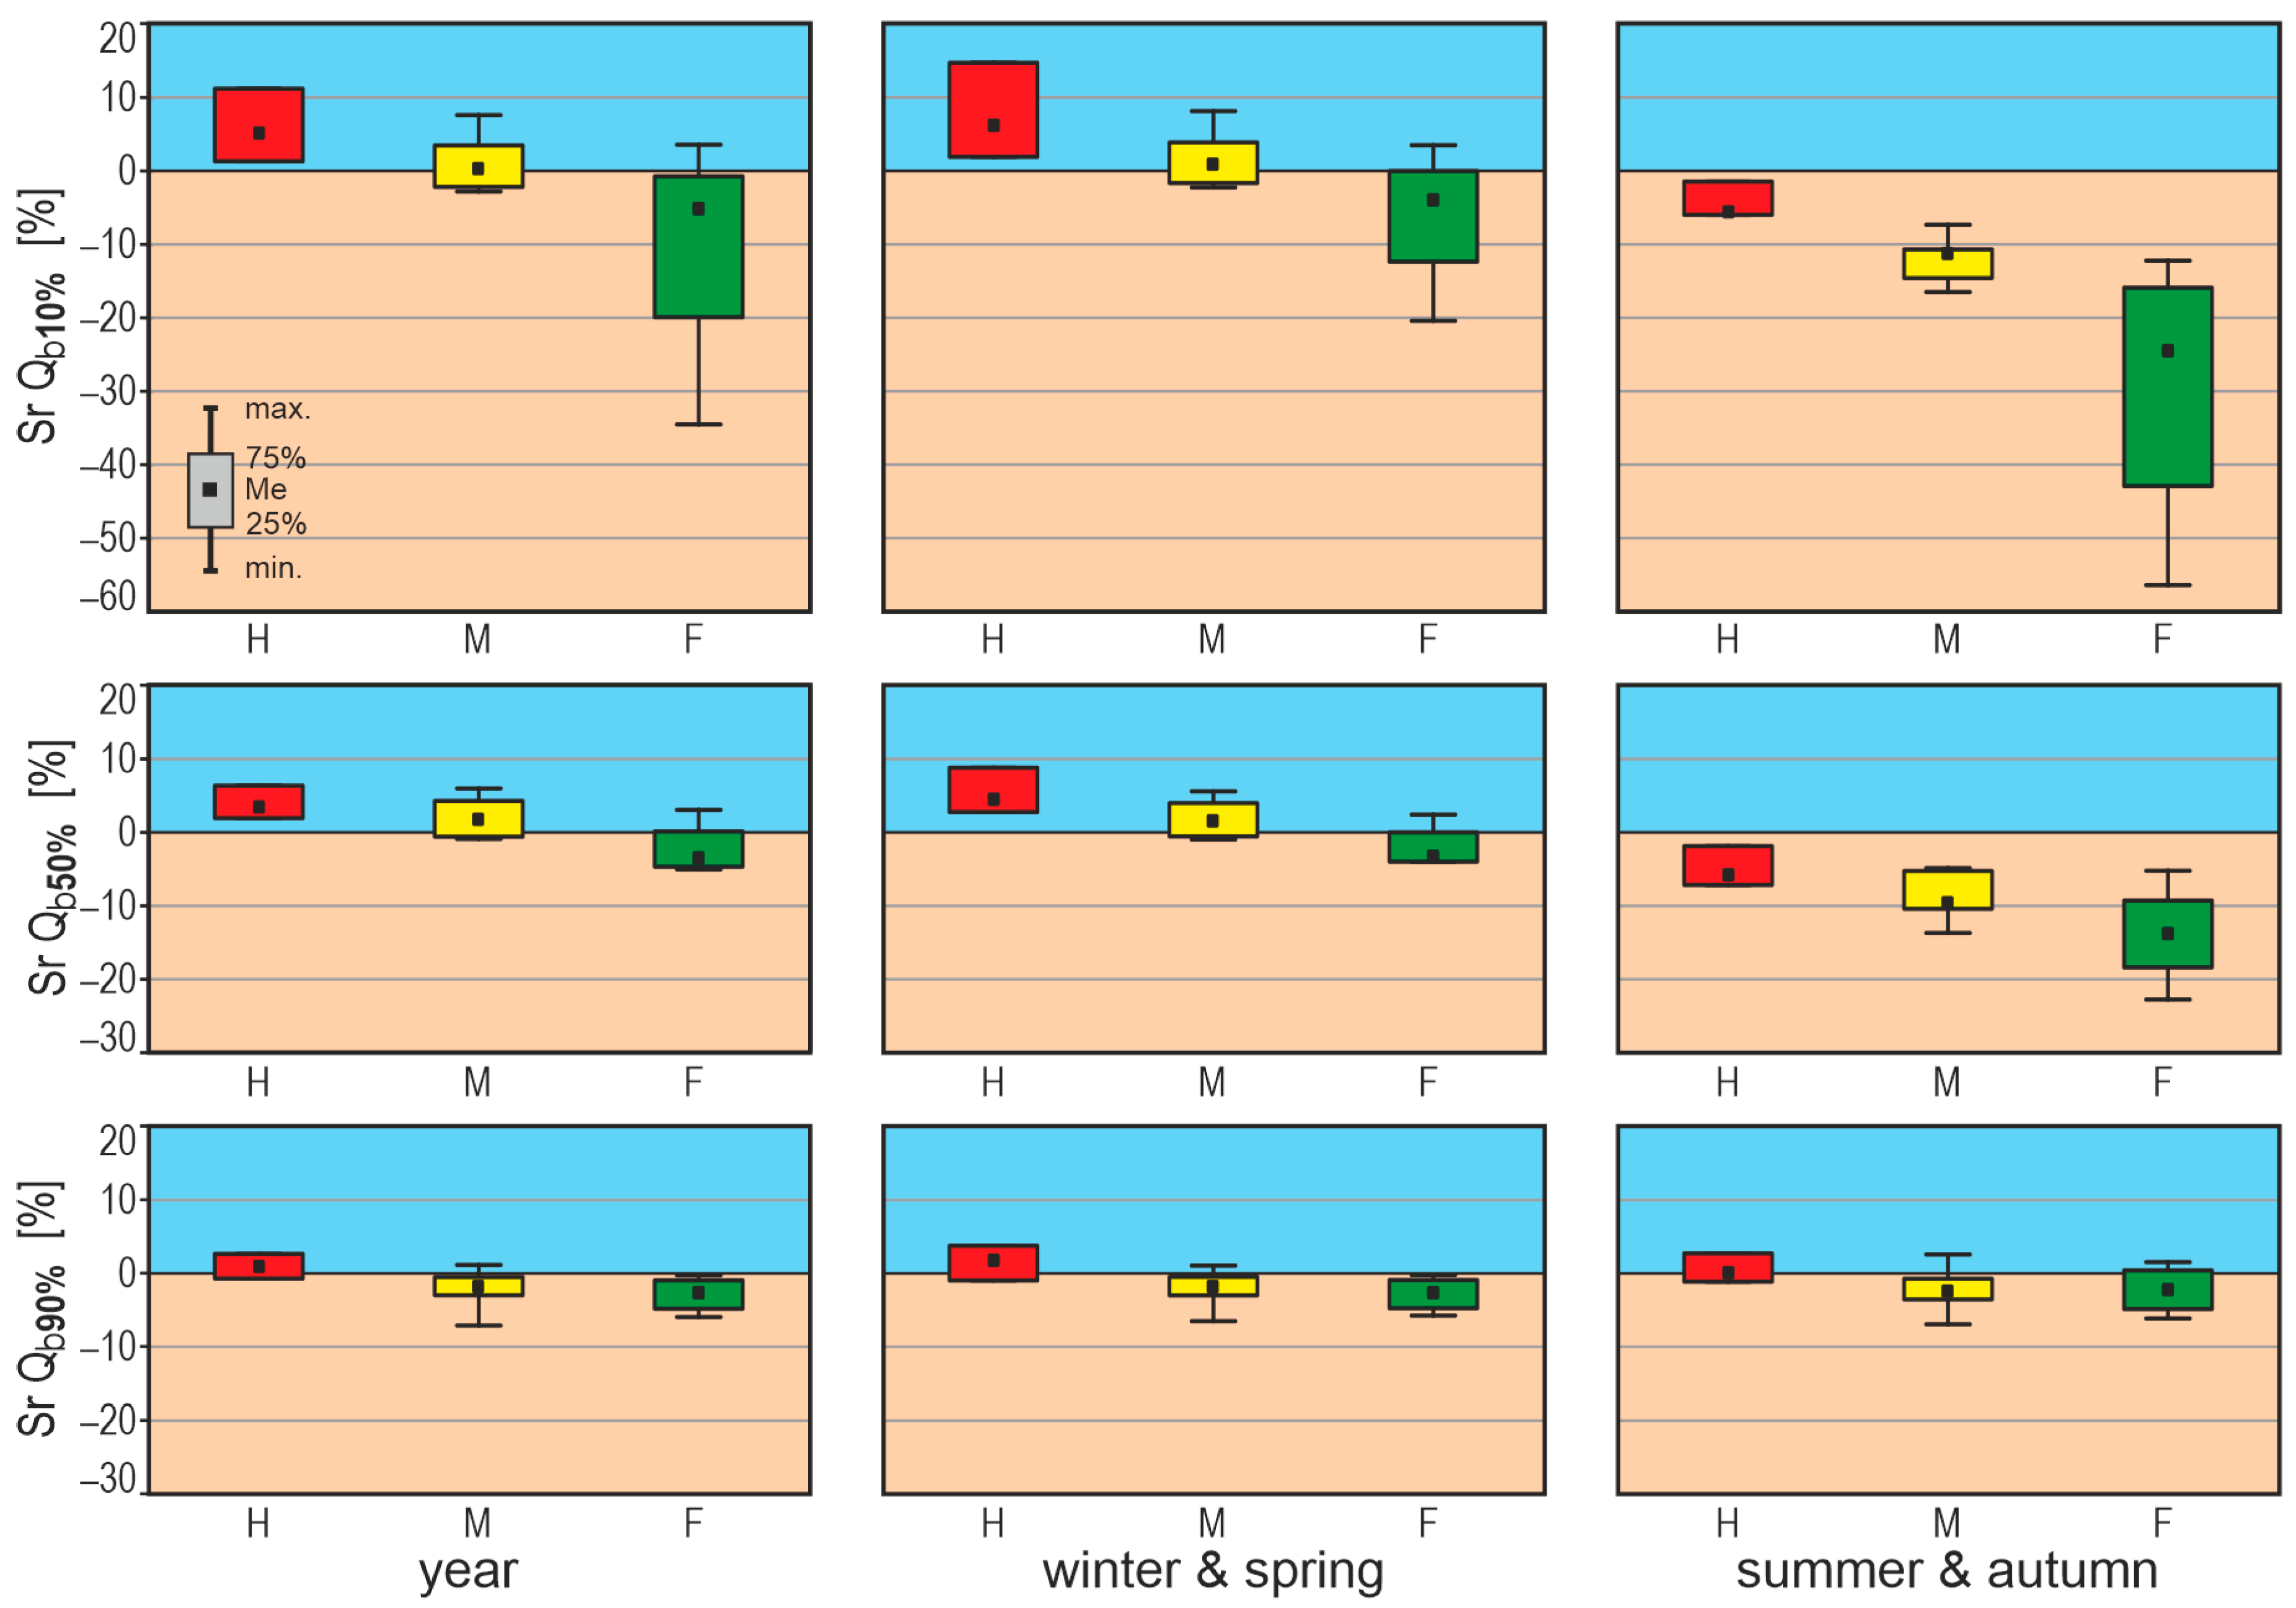
The analysis of fluctuations of baseflow time series was conducted using the rescaled adjusted partial sums (RAPS) method, which is based on cumulative standardized deviations from the average [60]. The calculations used the formula:
R A P S k = t = 1 k x t x ¯   s d x
where: xt—baseflow sum of the spring–winter or summer–autumn half year; x ¯ —average of half year baseflow sums in the whole period; sd(x)—standard deviation; k—the counter limit of the current summation step. The plots of RAPS values are useful for identifying the fluctuations in the time series. Periods of mostly above-average values produce an increasing pattern in the RAPS, while periods of mostly below-average values produce a decreasing plot. The method is considered as a complementary tool for distinguishing the changes of the trend in the time series record [60,61,62]. In the present study, RAPS analysis was carried out separately for baseflow sums of winter–spring half year and summer–autumn half year.

3. Results

Selected Carpathian rivers were characterized by the recession constant a in the range from 0.93 to 0.99 (Table 2); however, there was no clear pattern in the spatial distribution of recession rates. The maximum baseflow index BFImax, obtained using backward filtering, varied from 36% to 65%, indicating rather large differences in the groundwater storage capacity among the analyzed catchments (Table 2). The average annual baseflow index was the lowest for the Sękówka catchment, no. 12 (29%), and the highest values noted for the Tatra Mountains were for the Belá, no. 1 (57%), and Biały Dunajec, no. 3 (59%), catchments. The average annual baseflow ranged from approximately 100 mm in foothill areas to almost 500 mm in the high mountains (Table 2).
The highest baseflow was typical for the snowmelt season (mainly in April; May and June at higher elevations), whereas the lowest baseflow occurred in autumn (foothills, middle mountains) and in winter (high mountains) (Figure 4).
In the study period, several substantial changes in the baseflow of Carpathian rivers were noted, with a prevalence of declining trends. Significant trends in the annual median value of the daily baseflow varied from −0.02 to −0.06 mm per 10 years, whereas for the summer median value trends ranged from −0.02 to −0.16 mm per 10 years (Table 3). Significant decreases in annual and summer median daily baseflow values were observed only for foothills and middle mountains in the western part of the study area. Annually and in the summer, the strongest decreasing trends in relation to the median daily baseflow were noted for foothill catchments with ID nos. 16, 18, and 19 (Figure 5). Spring and autumn seasons lacked significant changes in the median baseflow. In winter only, the Biały Dunajec catchment (no. 3) in the Tatra Mountains followed a significant increasing trend in the median baseflow equal to 0.05 mm per 10 years, which translates into a −8% change in the baseflow median in the winter season (Figure 5).
The most substantial changes were noted for the low baseflow (Qb,10%) in the summer and autumn. Statistically significant decreases in the low baseflow ranged from −0.01 to −0.10 mm per 10 years for summer and from −0.01 to −0.04 mm per 10 years for autumn (Table 3). The analysis of relative changes (sr) showed a decline from −9% to −66% per 10 years for summer and from −12% to −82% per 10 years for autumn (Figure 6). In winter and spring, trends in the low baseflow were not significant, except for the Biały Dunajec catchment (no. 3), where increases in the low baseflow were noted: 0.06 mm/10 years in winter and 0.08 mm/10 years in spring (Table 3)—in both cases, the relative change was 14% per 10 years. Strong decreasing trends in the annual low baseflow were obtained for the western part of the study area, especially for the foothill catchments (Figure 6). An opposite trend was noted for the Biały Dunajec catchment (no. 3), where the increase equaled 0.05 mm/10 years (sr = 10%).
Changes in the high baseflow (Qb,90%) were mostly insignificant in the analyzed catchments (Figure 7). The decline in the high baseflow was strong in the summer in three catchments located in the middle mountains (nos. 12, 13, 15)—the relative change was about −8%. In the studied foothill area, significant trends were noted for the winter high baseflow in the Wieprzówka catchment, no. 19 (−0.05 mm/10 years, sr = −8%), and for the annual high baseflow in the Uszwica catchment, no. 18 (−0.03 mm/10 years, sr = −7%).
The comparison of the relative values of the Sen’s slope estimator calculated for high mountains (n = 3), medium mountains (n = 13), and foothill catchments (n = 4) indicated that changes in the baseflow differed among the altitudinal zones (Figure 8). In the winter and spring half-year in the high-mountain catchments, there was a common tendency of an increasing baseflow, visible especially in the case of percentiles representing the lowest values of runoff. In the same period, foothill catchments revealed tendencies of a decreasing baseflow. Changes in the middle mountains are ambiguous—the trend values are close to zero. On the other hand, in the summer and autumn half-year, negative trends prevailed in all catchments; however, in foothill catchments, they were the most evident. The occurring changes were best noticeable on the percentile values representing the lowest values of the baseflow.
The RAPS analysis showed that the described trends could not be treated as monotonic throughout the analyzed period, and changes of the baseflow were subject to several periodic fluctuations. The beginning of the period—the 1970s—was characterized by positive deviations from the long-term average in most of the studied catchments, especially with regard to the baseflow in the summer–autumn half year (Figure 9). In the 1980s and 1990s, no common pattern of baseflow changes was found for all the catchments. In the high-mountain catchments (ID 1, 3, 5), this period was characterized by a predominance of a baseflow below the long-term average in the summer as well as in the winter half year. From the middle of the 2000s, the baseflow in spring–winter was close to the long-term average. Only in the highest catchment of Bialy Dunajec River (ID 3) in the 2010s was a decade of a high baseflow in the winter–spring half-year. In addition, in the middle-mountains catchments, the 1980s and 1990s were the decades of a relatively low baseflow; however, the turning points of the RAPS analyses were often not evident. A characteristic feature of the RAPS analysis in the medium mountains catchments were the clear differences in the plot of the cumulative curves of the summer–autumn and winter–spring half-years. In the data from the summer–autumn half-year, the fluctuations of the baseflow were much more evident than in the case of the series from the spring–winter half-year. On the other hand, in the foothill catchments (ID 4, 16, 18, 19), the course of the RAPS curves of the summer–autumn and winter–spring half years was rather similar. The foothills revealed a relatively low baseflow in the last decade in winter as well as in summer (Figure 4 and Figure 9).

4. Discussion

Studies on the rates of change in shallow aquifers in the flysch Carpathians tend to focus on short-term characteristics. Given the short and incomplete measurement series that are available for the study area, such analyses yield only a limited picture of long-term changes in groundwater levels [18,63,64,65]. The general spatial pattern of groundwater storage may be estimated using gravimetric or multispectral satellite-based methods, e.g., [66,67]. However, given the shortage of long-term remote sensing data, it is not yet possible to study long-term change patterns in a precise resolution.
Seasonal changes in the baseflow in the studied part of the Carpathians manifest themselves first and foremost in terms of a large decrease in runoff in summer and autumn, and a small increase in winter and spring. The baseflow in most catchments did not change significantly over the course of the entire year. Such changes should be examined in terms of general patterns of change in the total river runoff. In the Western Carpathians, the baseflow trends strongly reflect the trends noted for the total runoff. Over recent decades, the predominant river runoff pattern in this area consisted of a decline in low and median discharge in summer in most of the studied catchments, and, in some catchments, also in autumn and throughout the entire year (Table 4). In the last few years, declines in the total river runoff in the studied catchments were found to be larger than those noted in previous papers on the studied region, which includes the Carpathians [11,13,14]. Our calculations showed 24% of cases of total runoff trends in the last 50 years as statistically significant, while in the case of the baseflow, the corresponding value was 17%. It is particularly interesting that the decreasing trends noted apply to seasons already characterized by low water levels and drought events. This suggests a problem with increasing droughts and the occurrence of periodic water deficits in the river ecosystem. Significant growth trends in river runoff are rarely noted despite the fact that many forecasts for the Carpathians assume an increase in runoff in the near future [68,69].
Trends for the groundwater storage may also be discerned from studies on low flow data using metrics such as the annual minimum of 7-day average flows [11,20] or a selected low quantile as a threshold value [9,13,70]. Thus far, no clear trends in the annual minimum of 7-day average flows have been observed in the Carpathians [11], although local growth trends have been noted on a seasonal basis for the winter, and declining trends for the summer and autumn [9,13,71], which are consistent with trends discussed in the present paper. In a broader sense, hydrological models show decreasing tendencies in non-anthropogenic groundwater storage in Central Europe [22].
Our research has shown that change tendencies observed in the Western Carpathians for the baseflow are characterized by strong spatial variation. The study area includes two regions with different baseflow trends: (1) foothill areas and middle mountains with a decline in the baseflow noted in summer and, to some extent, also in autumn, (2) high mountains with an increase in the baseflow in winter, and in the Biały Dunajec catchment (no. 3), an increase even in low baseflow percentiles (Qb,10%)—over the course of the whole year. The largest negative relative change was noted for foothill catchments with an established network of small towns and cities, agricultural production areas, and low water retention capacity of the flysch bedrock. On the other hand, an increase in runoff in the cooler months of the year is typical of catchments located at higher elevations and those with a higher capacity for water retention (e.g., thanks to the presence of carbonate rocks in the Tatras), where snow cover in the winter plays a major role in water circulation patterns.
Accelerated global warming has triggered the occurrence of exceptionally warm and dry years across the European continent in recent years, characterized by long-lasting periods of low water levels [36,72,73]. This pattern of change is also observable across the Carpathians [74,75]. When searching for the causes of changes in the baseflow, especially the declines in the summer and autumn, it is necessary to focus one’s attention on changes in air temperature and evapotranspiration, as well as the various forms of precipitation along with their temporal variances and totals. Increases in air temperature are noted in the study area, especially in the spring and summer months, as well as throughout the entire year [35,37,38]. On the other hand, these increases in the winter months are small or statistically not significant [35,76]. Similar tendencies are observed for the river water temperature in the Polish part of the Carpathians—warming here amounts to a maximum of 1.1 °C per decade in summer and up to 0.3 °C per decade in winter [77]. One fairly obvious consequence of increases in the air temperature is increasing potential evapotranspiration, which is currently readily observable in the Western and Southern Carpathians [78].
At the same time, no clear trends in the atmospheric precipitation totals were noted for the Carpathians [37,38,39,40]. Noteworthy here is the increased frequency of intense, short-lasting rainfall events and the increasing duration of dry periods as well as larger rainfall totals during the winter [13,79]. The studied mountain areas are not characterized by statistically significant changes in the duration and thickness of snow cover [76]. The lack of a decreasing trend for precipitation in winter along with relatively smaller increases in air temperature and increased amounts of rainfall in relation to snowfall are likely to effect the increased groundwater recharge of rivers—and consequently, the increased baseflow at higher elevations in winter. These are catchments where snow-based water strongly drives runoff in winter and spring—as early as the snowmelt season. On the other hand, rapid warming in the summer months along with an increase in the length of precipitation-free periods and accelerated evaporation lead to limited infiltration and lowered groundwater levels, which then leads to drought in the summer and autumn.

5. Conclusions

The present paper is the first of its kind in that it explores the subject of changes in the baseflow in the Carpathians over the last few decades. It also identifies changes in the groundwater storage in shallow aquifers recharging rivers and streams. The impact of climate change on the runoff from the Carpathian catchments is not fully understood, as the storage of water resources in mountain areas in the temperate climate zone is associated not only directly with atmospheric precipitation totals and evaporation rates, but also with snow cover accumulation and melting rates in the wintertime. Of particular importance is the frequency of the occurrence of midwinter snowmelt events and the relationship between snowfall and rainfall in the winter.
No trends in the annual baseflow total were determined for most of the examined catchments. However, changes are observable for various seasons of the year—a large decline in baseflow is noted in summer and autumn along with a small rise in winter and spring. Thus, the decline baseflow occurs during typical times of hydrologic drought in the Carpathians, which suggests a potential exacerbation of the water deficit affecting this geographic region during such periods of time.
Our research has shown that trends in the baseflow noted at the highest elevations in the Carpathians (Tatra Mountains) for each given season of the year are different than those noted for middle mountains and foothills. This area is characterized by a large increase in the baseflow in the winter, associated with the now changing role of snow cover in the storage of water resources over the course of the year. In foothill areas, declines in the baseflow are most pronounced in summer and autumn when lower runoff is most likely to occur.

Author Contributions

Conceptualization, J.S. and K.M.; methodology, J.S. and K.M; software, P.W., K.M. and J.S.; validation, J.S., B.R. and K.M.; formal analysis, J.S. and K.M.; investigation, K.M. and J.S.; resources, K.M. and S.L.; data curation, K.M. and S.L.; writing—original draft preparation, J.S., K.M.; writing—review and editing, B.R.; visualization, P.W.; supervision, J.S.; project administration, J.S.; funding acquisition, J.S. All authors have read and agreed to the published version of the manuscript.

Funding

The research for this publication has been supported by a grant from the Priority Research Area “Anthropocene” under the Strategic Program Excellence Initiative at Jagiellonian University.

Data Availability Statement

The data used for trend calculations were obtained from the Polish Institute of Meteorology and Water Management—National Research Institute and Slovak Hydrometeorological Institute. The database is available at: https://figshare.com/articles/dataset/Baseflow_trends_for_midsize_Carpathian_catchments_in_Poland_and_Slovakia_in_1970-2019/20088578/1 (accessed on 27 September 2022).

Conflicts of Interest

The authors declare no conflict of interest.

References

  1. Bates, B.; Kundzewicz, Z.W.; Wu, S.; Palutikof, J. Climate Change and Water; Technical Paper of the Intergovernmental Panel on Climate Change; IPCC Secretariat: Geneva, Switzerland, 2008. [Google Scholar]
  2. Blöschl, G.; Hall, J.; Viglione, A.; Perdigão, R.A.P.; Parajka, J.; Merz, B.; Lun, D.; Arheimer, B.; Aronica, G.T.; Bilibashi, A.; et al. Changing climate shifts timing of European floods. Science 2017, 357, 588–590. [Google Scholar] [CrossRef] [PubMed] [Green Version]
  3. Blöschl, G.; Hall, J.; Viglione, A.; Perdigão, R.A.P.; Parajka, J.; Merz, B.; Lun, D.; Arheimer, B.; Aronica, G.T.; Bilibashi, A.; et al. Changing climate both increases and decreases European river floods. Nature 2019, 573, 108–111. [Google Scholar] [CrossRef] [PubMed]
  4. UNESCO World Water Assessment Programme. The United Nations World Water Development Report 2020: Water and Climate Change; UNESCO: Paris, France, 2020. [Google Scholar]
  5. Wu, W.Y.; Lo, M.H.; Wada, Y.; Famiglietti, J.S.; Reager, J.T.; Yeh, P.J.-F.; Ducharne, A.; Yang, Z.-L. Divergent effects of climate change on future groundwater availability in key mid-latitude aquifers. Nat. Commun. 2020, 11, 3710. [Google Scholar] [CrossRef] [PubMed]
  6. Milly, P.C.D.; Dunne, K.A.; Vecchia, A.V. Global pattern of trends in streamflow and water availability in a changing climate. Nature 2005, 438, 347–350. [Google Scholar] [CrossRef]
  7. Stahl, K.; Hisdal, H.; Hannaford, J.; Tallaksen, L.; Van Lanen, H.; Sauquet, E.; Demuth, S.; Fendekova, M.; Jódar, J. Streamow trends in Europe: Evidence from a dataset of near-natural catchments. Hydrol. Earth Syst. Sc. 2010, 14, 2367–2382. [Google Scholar] [CrossRef] [Green Version]
  8. Van Vliet, M.T.H.; Franssen, W.H.P.; Yearsley, J.R.; Ludwig, F.; Haddeland, I.; Lettenmaier, D.P.; Kabat, P. Global river discharge and water temperature under climate change. Glob. Environ. Change 2013, 23, 450–464. [Google Scholar] [CrossRef]
  9. Birsan, M.V.; Zaharia, L.; Chendes, V.; Branescu, E. Seasonal trends in Romanian streamflow. Hydrol. Process. 2014, 28, 4496–4505. [Google Scholar] [CrossRef]
  10. Bard, A.; Renard, B.; Lang, M.; Giuntoli, I.; Korck, J.; Koboltschnig, G.; Janža, M.; D’Amico, M.; Volken, D. Trends in the hydrologic regime of Alpine rivers. J. Hydrol. 2015, 529, 1823–1837. [Google Scholar] [CrossRef]
  11. Piniewski, M.; Marcinkowski, P.; Kundzewicz, Z.W. Trend detection in river flows indices in Poland. Acta Geophys. 2018, 66, 347–360. [Google Scholar] [CrossRef] [Green Version]
  12. Gudmundsson, L.; Leonard, M.; Do, H.X.; Westra, S.; Seneviratne, S.I. Observed trends in global indicators of mean and extreme streamflow. Geophys. Res. Lett. 2019, 46, 756–766. [Google Scholar] [CrossRef]
  13. Mostowik, K.; Siwek, J.; Kisiel, M.; Kowalik, K.; Krzysik, M.; Plenzler, J.; Rzonca, B. Runoff trends in a changing climate in the Eastern Carpathians (Bieszczady Mountains, Poland). Catena 2019, 182, 104174. [Google Scholar] [CrossRef]
  14. Górnik, M. Changing trends of river flows in the Upper Vistula Basin (East-Central Europe). Acta Geophys. 2020, 68, 495–504. [Google Scholar] [CrossRef] [Green Version]
  15. Green, T.R.; Taniguchi, M.; Kooi, H.; Gurdak, J.J.; Allen, D.M. Beneath the surface of global change: Impacts of climate change on groundwater. J. Hydrol. 2011, 405, 532–560. [Google Scholar] [CrossRef] [Green Version]
  16. Buczyński, S.; Wcislo, M. Predicting climate-induced changes in groundwater resources on the basis of hydrogeological model research: Case study of the Carpathian flysch belt. Episodes 2013, 36, 105–114. [Google Scholar] [CrossRef] [PubMed]
  17. Famiglietti, J.S. The global groundwater crisis. Nat. Clim. Change 2014, 4, 945–948. [Google Scholar] [CrossRef] [Green Version]
  18. Freiwald, P.; Patorski, R.; Witek, K. Hydrogeological cycles in the light of monitoring studies in the Carpathians. Acta Sci. Pol. Form. Circumiectus 2014, 13, 11–19. (In Polish) [Google Scholar]
  19. Kløve, B.; Ala-Aho, P.; Bertrand, G.; Gurdak, J.J.; Kupfersberger, H.; Kvarner, J.; Muotka, T.; Mykra, H.; Preda, E.; Rosii, P.; et al. Climate change impacts on groundwater and dependent ecosystems. J. Hydrol. 2014, 518, 250–266. [Google Scholar] [CrossRef]
  20. Hellwig, J.; Stahl, K. An assessment of trends and potential future changes in groundwater-baseflow drought based on catchment response times. Hydrol. Earth Syst. Sci. 2018, 22, 6209–6224. [Google Scholar] [CrossRef] [Green Version]
  21. Bierkens, M.F.P.; Wada, Y. Non-renewable groundwater use and groundwater depletion: A review. Environ. Res. Lett. 2019, 14, 063002. [Google Scholar] [CrossRef]
  22. Li, B.; Rodell, M.; Sheffield, J.; Wood, E.; Sutanudjaja, E. Long-term, non-anthropogenic groundwater storage changes simulated by three global-scale hydrological models. Sci. Rep. 2019, 9, 10746. [Google Scholar] [CrossRef] [Green Version]
  23. Mekonnen, M.; Hoekstra, A. Four billion people facing severe water scarcity. Sci. Adv. 2016, 2, e1500323. [Google Scholar] [CrossRef] [PubMed]
  24. Bucak, T.; Trolle, D.; Andersen, H.E.; Thodsen, H.; Erdoğan, Ş.; Levi, E.E.; Filiz, N.; Jeppesen, E.; Beklioglu, M. Future water availability in the largest freshwater Mediterranean lake is at great risk as evidenced from simulations with the SWAT model. Sci. Total Environ. 2017, 581–582, 413–425. [Google Scholar] [CrossRef] [PubMed]
  25. Rodell, M.; Famiglietti, J.S.; Wiese, D.N.; Reager, J.T.; Beaudoing, H.K.; Landerer, F.W.; Lo, M.H. Emerging trends in global freshwater availability. Nature 2018, 557, 651–659. [Google Scholar] [CrossRef] [PubMed]
  26. Mankin, J.S.; Seager, R.; Smerdon, J.E.; Cook, B.I.; Park Williams, A. Mid-latitude freshwater availability reduced by projected vegetation responses to climate change. Nat. Geosci. 2019, 12, 983–988. [Google Scholar] [CrossRef]
  27. Ficklin, D.L.; Robeson, S.M.; Knouft, J.H. Impacts of recent climate change on trends in baseflow and stormflow in United States watersheds. Geophys. Res. Lett. 2016, 43, 5079–5088. [Google Scholar] [CrossRef]
  28. Buttle, J.M. Mediating stream baseflow response to climate change: The role of basin storage. Hydrol. Process. 2018, 32, 363–378. [Google Scholar] [CrossRef]
  29. Tan, X.; Liu, B.; Tan, X. Global changes in baseflow under the impacts of changing climate and vegetation. Water Resour. Res. 2020, 56, e2020WR027349. [Google Scholar] [CrossRef]
  30. Chen, H.; Teegavarapu, R.S.V. Spatial and temporal variabilities in baseflow characteristics across the continental USA. Theor. Appl. Climatol. 2021, 143, 1615–1629. [Google Scholar] [CrossRef]
  31. Lei, Y.; Jiang, X.; Geng, W.; Zhang, J.; Zhao, H.; Ren, L. The Variation Characteristics and Influencing Factors of Base Flow of the Hexi Inland Rivers. Atmosphere 2021, 12, 356. [Google Scholar] [CrossRef]
  32. Duncan, H.P. Baseflow separation—A practical approach. J. Hydrol. 2019, 527, 308–313. [Google Scholar] [CrossRef]
  33. Völker, J.; Borchardt, D. Drinking Water Quality at Risk: A European Perspective. In Atlas of Ecosystem Services; Schröter, M., Bonn, A., Klotz, S., Seppelt, R., Baessler, C., Eds.; Springer: Cham, Switzerland, 2019. [Google Scholar] [CrossRef]
  34. Pepin, N.; Bradley, R.S.; Diaz, H.F.; Baraer, E.B.; Caceres, N.; Forsythe, N.; Fowler, H.; Greenwood, C.; Hashmi, M.Z.; Liu, X.D.; et al. Elevation-dependent warming in mountain regions of the world. Nat. Clim. Change 2015, 5, 424–430. [Google Scholar] [CrossRef] [Green Version]
  35. Wypych, A.; Ustrnul, Z.; Schmatz, D.R. Long-term variability of air temperature and precipitation conditions in the Polish Carpathians. J. Mt. Sci. 2018, 15, 237–253. [Google Scholar] [CrossRef]
  36. Tomczyk, A.M.; Bednorz, E. The extreme year—analysis of thermal conditions in Poland in 2018. Theor. Appl. Climatol. 2020, 139, 251–260. [Google Scholar] [CrossRef] [Green Version]
  37. Bokwa, A.; Wypych, A.; Ustrnul, Z. Climate Changes in the Vertical Zones of the Polish Carpathians in the Last 50 Years. In The Carpathians: Integrating Nature and Society Towards Sustainability. Environmental Science and Engineering; Kozak, J., Ostapowicz, K., Bytnerowicz, A., Wyżga, B., Eds.; Springer: Berlin/Heidelberg, Germany, 2013; pp. 89–109. [Google Scholar] [CrossRef]
  38. Spinoni, J.; Szalai, S.; Szentimrey, T.; Lakatos, M.; Bihari, Z.; Nagy, A.; Nemeth, A.; Kovacs, A.; Mihic, D.; Dacic, M.; et al. Climate of the Carpathian Region in the period 1961–2010: Climatologies and trends of 10 variable. Int. J. Climatol. 2015, 35, 1322–1341. [Google Scholar] [CrossRef] [Green Version]
  39. Kubiak-Wójcicka, K. Variability of Air Temperature, Precipitation and Outflows in the Vistula Basin (Poland). Resources 2020, 9, 103. [Google Scholar] [CrossRef]
  40. Twardosz, R.; Cebulska, M. Temporal variability of the highest and the lowest monthly precipitation totals in the Polish Carpathian Mountains (1881–2018). Theor. Appl. Climatol. 2020, 140, 327–341. [Google Scholar] [CrossRef]
  41. Gudmundsson, L.; Seneviratne, I. European drought trends. Proc. IAHS 2015, 369, 75–79. [Google Scholar] [CrossRef] [Green Version]
  42. Madsen, H.; Lawrence, D.; Lang, M.; Martinkova, M.; Kjeldsen, T. R Review of trend analysis and climate change projections of extreme precipitation and floods in Europe. J. Hydrol. 2014, 519, 3634–3650. [Google Scholar] [CrossRef] [Green Version]
  43. Szwed, M. Variability of precipitation in Poland under climate change. Theor. Appl. Climatol. 2019, 135, 1003–1015. [Google Scholar] [CrossRef]
  44. Eckhardt, K.; Ulbrich, U. Potential impacts of climate change on groundwater recharge and streamflow in a central European low mountain range. J. Hydrol. 2003, 284, 244–252. [Google Scholar] [CrossRef]
  45. Chełmicki, W.; Skąpski, R.; Soja, R. The flow regime of Polish Carpathian rivers. Folia Geogr. Geogr. Phys. 1998/1999, 29–30, 67–80. (In Polish) [Google Scholar]
  46. Viviroli, D.; Dürr, H.H.; Messerli, B.; Meybeck, M.; Weingartner, R. Mountains of the world, water towers for humanity: Typology, mapping, and global significance. Water Resour. Res. 2007, 43, W07447. [Google Scholar] [CrossRef] [Green Version]
  47. Łajczak, A. Deltas in dam-retained lakes in the Carpathian part of the Vistula drainage basin. Pr. Geogr. 2006, 116, 99–110. [Google Scholar]
  48. Wyżga, B. A review on channel incision in the Polish Carpathian rivers during the 20th century. In Gravel-Bed Rivers VI: From Process Understanding to River Restoration; Habersack, H., Piégay, H., Rinaldi, M., Eds.; Elsevier: Amsterdam, The Netherlands, 2008. [Google Scholar]
  49. Griffiths, P.; Kuemmerle, T.; Baumann, M.; Radeloff, V.; Abrudan, I.V.; Lieskovsky, J.; Munteanu, C.; Ostapowicz, K.; Hostert, P. Forest disturbances, forest recovery, and changes in forest types across the Carpathian ecoregion from 1985 to 2010 based on Landsat image composites. Remote Sens. Environ. 2014, 151, 72–88. [Google Scholar] [CrossRef]
  50. Wiejaczka, Ł.; Olędzki, J.; Bucała-Hrabia, A.; Kijowska-Strugała, M. A spatial and temporal analysis of land use changes in two mountain valleys: With and without dam reservoir (Polish Carpathians). Quaest. Geogr. 2017, 36, 129–137. [Google Scholar] [CrossRef] [Green Version]
  51. Solon, J.; Borzyszkowski, J.; Bidłasik, M.; Richling, A.; Badora, K.; Balon, J.; Brzezińska-Wójcik, T.; Chabudziński, Ł.; Dobrowolski, R.; Grzegorczyk, I.; et al. Physico-geographical mesoregions of Poland: Verification and adjustment of boundaries on the basis of contemporary spatial data. Geogr. Pol. 2018, 91, 143–170. [Google Scholar] [CrossRef]
  52. Eckhardt, K. How to construct recursive digital filters for baseflow separation. Hydrol. Process. 2005, 19, 507–515. [Google Scholar] [CrossRef]
  53. Collischonn, W.; Fan, F.M. Defining parameters for Eckhardt’s digital baseflow filter. Hydrol. Process. 2013, 27, 2614–2622. [Google Scholar] [CrossRef]
  54. Kissel, M.; Schmalz, M. Comparison of Baseflow Separation Methods in the German Low Mountain Range. Water 2020, 12, 1740. [Google Scholar] [CrossRef]
  55. Eckhardt, K. A comparison of baseflow indices, which were calculated with seven different baseflow separation methods. J. Hydrol. 2008, 352, 168–173. [Google Scholar] [CrossRef]
  56. Sen, P.K. Estimates of the Regression Coefficient based on Kendall’s Tau. J. Am. Stat. Assoc. 1968, 63, 1379–1389. [Google Scholar] [CrossRef]
  57. Yue, S.; Pilon, P.; Phinney, B.; Cavadias, G. The influence of autocorrelation on the ability to detect trend in hydrological series. Hydrol. Process. 2002, 16, 1807–1829. [Google Scholar] [CrossRef]
  58. Mann, H.B. Nonparametric tests against trend. Econometrica 1945, 13, 245–259. [Google Scholar] [CrossRef]
  59. Kendall, M.G. Rank Correlation Methods; Griffin: London, UK, 1975; p. 202. [Google Scholar]
  60. Garbrecht, J.; Fernandez, G.P. Visualization of trends and fluctuations in climatic records. JAWRA J. Am. Water Resour. Assoc. 1994, 30, 297–306. [Google Scholar] [CrossRef]
  61. Shelton, M.L. Seasonal hydroclimate change in the Sacramento River basin, California. Phys. Geogr. 1998, 19, 239–255. [Google Scholar] [CrossRef]
  62. Kos, Ž.; Đurin, B.; Dogančić, D.; Kranjčić, N. Hydro-Energy Suitability of Rivers Regarding Their Hydrological and Hydrogeological Characteristics. Water 2021, 13, 1777. [Google Scholar] [CrossRef]
  63. Herbich, P.; Prażak, J.; Przytuła, E. Dynamics of the shallow groundwater retention in the hydrogeological units. Biuletyn PIG 2009, 436, 159–164. (In Polish) [Google Scholar]
  64. Kowalczyk, A.; Szydło, M.; Stępińska-Drygała, I.; Wesołowski, P.; Bejger, M.; Gołębiewski, M. Hydrogeological Droughts in Poland in the Period 1981–2015; PIG–PIB: Warszawa, Poland, 2017. (In Polish) [Google Scholar]
  65. Bartnik, A.; Moniewski, P. Multiannual variability of spring discharge in southern Poland. Episodes 2019, 42, 187–198. [Google Scholar] [CrossRef]
  66. Rzepecka, Z.; Biryło, M.; Kuczyńska-Siehień, J.; Nastula, J.; Pajak, K. Analysis of groundwater level variations and water balance in the area of the Sudety mountains. Acta Geodyn. Geomater. 2017, 14, 307–315. [Google Scholar] [CrossRef] [Green Version]
  67. Śliwińska, J.; Biryło, M.; Rzepecka, Z.; Nastula, J. Analysis of Groundwater and Total Water Storage Changes in Poland Using GRACE Observations, In-situ Data, and Various Assimilation and Climate Models. Remote Sens. 2019, 11, 2949. [Google Scholar] [CrossRef]
  68. Piniewski, M.; Szcześniak, M.; Mezghani, A.; Kundzewicz, Z.W. Hydroclimatic Projections for the Upper Vistula Basin. In Flood Risk in the Upper Vistula Basin; Kundzewicz, Z., Stoffel, M., Niedźwiedź, T., Wyżga, B., Eds.; GeoPlanet: Earth and Planetary Sciences; Springer: Berlin/Heidelberg, Germany, 2016; pp. 331–340. [Google Scholar] [CrossRef]
  69. Piniewski, M.; Szcześniak, M.; Huang, S.; Kundzewicz, Z.W. Projections of runoff in the Vistula and the Odra river basins with the help of the SWAT model. Hydrol. Res. 2018, 49, 303–317. [Google Scholar] [CrossRef]
  70. Raczyński, K.; Dyer, J. Multi-annual and seasonal variability of low-flow river conditions in southeastern Poland. Hydrol. Sci. J. 2020, 65, 2561–2576. [Google Scholar] [CrossRef]
  71. Kędra, M. Sensitivity of mountain catchments to global warming: A case study of the San Basin, Poland. Water Environ. J. 2020, 34, 648–660. [Google Scholar] [CrossRef]
  72. Boczoń, A.; Kowalska, A.; Dudzińska, M.; Wróbel, M. Drought in Polish Forests in 2015. Pol. J. Environ. Stud. 2016, 25, 1857–1862. [Google Scholar] [CrossRef] [PubMed]
  73. Büntgen, U.; Urban, O.; Krusic, P.J.; Rybnicek, M.; Kolar, T.; Kyncl, T.; Ac, A.; Konasova, E.; Caslavsky, J.; Esper, J.; et al. Recent European drought extremes beyond Common Era background variability. Nat. Geosci. 2021, 14, 190–196. [Google Scholar] [CrossRef]
  74. Rzonca, B.; Siwek, J.; Zawiło, M.; Bryndza, M.; Dojtrowska, I.; Lasota, J.; Piech, K.; Bryła, M. Drought in the Bieszczady Mts in 2015. Rocz. Bieszcz. 2016, 24, 263–279. (In Polish) [Google Scholar]
  75. Staśko, S.; Buczyński, S. Drought and its effects on spring discharge regimes in Poland and Germany during the 2015 drought. Hydrol. Sci. J. 2018, 63, 741–751. [Google Scholar] [CrossRef]
  76. Tomczyk, A.M.; Bednorz, E.; Szyga-Pluta, K. Changes in Air Temperature and Snow Cover in Winter in Poland. Atmosphere 2021, 12, 68. [Google Scholar] [CrossRef]
  77. Kędra, M. Regional Response to Global Warming: Water Temperature Trends in Semi-Natural Mountain River Systems. Water 2020, 12, 283. [Google Scholar] [CrossRef] [Green Version]
  78. Lakatos, M.; Weidinger, T.; Hoffmann, L.; Bihari, Z.; Horváth, Á. Computation of daily Penman–Monteith reference evapotranspiration in the Carpathian Region and comparison with Thornthwaite estimates. Adv. Sci. Res. 2020, 16, 251–259. [Google Scholar] [CrossRef] [Green Version]
  79. Pińskwar, I.; Choryński, A.; Graczyk, D.; Kundzewicz, Z.W. Observed changes in extreme precipitation in Poland: 1991–2015 versus 1961–1990. Theor. Appl. Climatol. 2019, 135, 773–787. [Google Scholar] [CrossRef]
Figure 1. The studied catchments (catchment ID refer to Table 1).
Water 15 00109 g001
Figure 2. Distribution percentiles for daily runoff in the studied catchments in the period 1970–2019 (catchment ID nos. explained in Table 1).
Water 15 00109 g002
Figure 3. Flowchart of methods used in the study [52,53,55,56,57,59].
Water 15 00109 g003
Figure 4. Monthly baseflow totals for the studied catchments in the years 1970–2019. Numbers refer to catchment ID numbers provided in Table 1.
Water 15 00109 g004
Figure 5. Relative change in the annual median value of daily baseflow (Qb, 50%) in the years 1970–2019.
Water 15 00109 g005
Figure 6. Relative changes in low baseflow values (Qb, 10%) in the years 1970–2019.
Water 15 00109 g006
Figure 7. Relative changes in high baseflow values (Qb, 90%) in the years 1970–2019.
Water 15 00109 g007
Figure 8. Relative changes of baseflow 10th, 50th, and 90th percentiles (Qb, p) in high mountains (H), medium mountains (M), and foothills catchments (F) in 1970–2019.
Water 15 00109 g008
Figure 9. RAPS analyses of baseflow totals in the half years in 1970–2019. Numbers refer to catchment ID numbers provided in Table 1.
Water 15 00109 g009
Table 1. Characteristics of the studied catchments.
NoRiverGauging StationArea
[km2]
Mean Elev.
[m a.s.l.]
Average Annual Runoff
[mm]
Land Cover [%]
ForestArable LandPasture and GrasslandUrban and IndustrialOther
1BeláLiptovský Hrádok244128687641.010.540.43.54.6
2BiałaGrybów20756042555.231.811.71.30.0
3Biały DunajecSzaflary210104780643.811.228.713.23.1
4BrzeźnicaBrzeźnica48227221625.661.44.48.30.3
5DunajecNowy Targ43586964828.428.234.67.21.6
6LaborecKoškovce43844734166.225.25.82.80.0
7ŁososinaJakubkowice34753842540.154.61.14.20.0
8NiedziczankaNiedzica13780048156.119.621.13.10.1
9OchotnicaTylamnowa10680551968.125.15.61.20.0
10RabaMszana Dolna15762847343.726.218.411.70.0
11SanDwernik41878070276.91.321.10.40.3
12SękówkaGorlice12251647872.017.88.22.00.0
13SkawicaSkawica Dolna13679076975.410.89.24.60.0
14SolinkaTerka30978984991.42.15.60.70.2
15SołaRajcza25478764472.512.113.02.40.0
16StradomkaStradomka36335829526.970.60.81.70.0
17TopľaBardejov32660129164.920.611.43.00.1
18UszwicaBorzęcin26629030430.659.12.67.70.0
19WieprzówkaRudze15240935331.053.41.412.81.4
20WisłaUstroń10770978174.616.21.37.60.3
Table 2. Parameters used for Eckhardt’s digital baseflow filter (a and BFImax) and baseflow characteristics for the studied catchments.
IDRiveraBFImax
[%]
Baseflow
BFI [%]Annual [mm]MaxMin
1Belá0.996357497JunFeb
2Biała0.963630128AprOct
3Biały Dunajec0.986559479JunFeb
4Brzeźnica0.985750107MarSep
5Dunajec0.985952339MayFeb
6Laborec0.964741141AprSep
7Łososina0.974337157AprOct
8Niedziczanka0.984842202AprFeb
9Ochotnica0.985852271AprFeb
10Raba0.975144210AprOct
11San0.955044307AprAug
12Sękówka0.983729141AprOct
13Skawica0.975447361AprOct
14Solinka0.955246393AprAug
15Soła0.974236233AprOct
16Stradomka0.965144131AprOct
17Topľa0.976256163AprSep
18Uszwica0.984435108AprOct
19Wieprzówka0.933631108AprNov
20Wisła0.965347364AprOct
Table 3. Theil–Sen estimator (mm/10 years) for daily baseflow (Qb) percentiles obtained for the entire year (Yr), winter (W), spring (SP), summer (SU), and autumn (A); statistically significant trends are marked in bold.
RiverQb, 10%Qb, 50%Qb, 90%
YrWSPSUAYrWSPSUAYrWSPSUA
1.Bela 0.010.000.02−0.10−0.03−0.020.000.04−0.16−0.04−0.050.010.09−0.04−0.06
2.Biała 0.000.000.00−0.02−0.01−0.020.010.01−0.04−0.010.000.00−0.02−0.040.00
3.Biały Dunajec 0.050.060.08−0.040.030.010.050.03−0.060.050.070.050.090.010.04
4.Brzeźnica 0.000.000.01−0.01−0.010.000.000.00−0.01−0.010.000.000.02−0.010.00
5.Dunajec 0.020.010.03−0.06−0.02−0.020.02−0.03−0.06−0.01−0.030.000.03−0.07−0.02
6.Laborec 0.000.000.00−0.01−0.01−0.01−0.01−0.01−0.02−0.01−0.030.04−0.02−0.040.00
7.Łososina −0.01−0.010.00−0.03−0.01−0.020.00−0.01−0.04−0.01−0.01−0.02−0.02−0.060.00
8.Niedziczanka −0.010.000.01−0.03−0.01−0.010.01−0.03−0.01−0.010.010.010.020.010.00
9.Ochotnica −0.010.000.01−0.05−0.03−0.010.00−0.02−0.04−0.02−0.03−0.030.00−0.03−0.01
10.Raba −0.01−0.010.00−0.04−0.01−0.020.000.01−0.06−0.010.00−0.020.03−0.08−0.02
11.San −0.010.010.02−0.02−0.03−0.020.03−0.06−0.03−0.05−0.020.05−0.01−0.010.02
12.Sękówka 0.000.000.00−0.02−0.01−0.02−0.010.00−0.04−0.010.000.00−0.01−0.060.00
13.Skawica −0.04−0.020.01−0.08−0.04−0.06−0.03−0.02−0.11−0.04−0.04−0.080.03−0.14−0.03
14.Solinka −0.020.010.03−0.03−0.03−0.040.02−0.06−0.07−0.05−0.020.040.04−0.070.01
15.Soła 0.000.010.02−0.01−0.01−0.010.020.01−0.030.010.01−0.010.02−0.090.01
16.Stradomka −0.010.00−0.01−0.03−0.02−0.02−0.01−0.01−0.04−0.01−0.01−0.010.04−0.060.00
17.Topla 0.000.010.00−0.020.00−0.020.01−0.01−0.03−0.01−0.040.01−0.08−0.05−0.01
18.Uszwica −0.010.000.00−0.02−0.02−0.020.00−0.02−0.04−0.01−0.03−0.02−0.02−0.04−0.01
19.Wieprzówka −0.010.00−0.01−0.01−0.02−0.02−0.02−0.01−0.03−0.02−0.03−0.050.04−0.060.00
20.Wisła Ustroń −0.01−0.010.02−0.03−0.02−0.020.030.01−0.07−0.02−0.01−0.010.09−0.06−0.01
Table 4. Theil–Sen estimator (mm/10 years) for total daily runoff (Q) percentiles obtained for the entire year (Yr), winter (W), spring (SP), summer (SU), and autumn (A); statistically significant trends are marked in bold.
RiverQ 10%Q 50%Q 90%
YrWSPSUAYrWSPSUAYearWSPSUA
1.Bela 0.010.000.03−0.09−0.04−0.010.010.08−0.18−0.01−0.040.020.09−0.320.02
2.Biała −0.010.010.00−0.03−0.02−0.030.01−0.02−0.07−0.03−0.060.08−0.06−0.190.03
3.Biały Dunajec0.070.070.08−0.040.020.020.080.02−0.100.070.090.060.20−0.060.17
4.Brzeźnica −0.010.000.01−0.02−0.020.000.010.01−0.01−0.01−0.040.000.00−0.020.01
5.Dunajec 0.010.010.05−0.07−0.03−0.010.01−0.06−0.12−0.01−0.07−0.03−0.06−0.200.05
6.Laborec −0.010.000.00−0.01−0.01−0.03−0.01−0.02−0.03−0.02−0.110.15−0.22−0.13−0.03
7.Łososina −0.02−0.010.00−0.02−0.02−0.03−0.010.00−0.07−0.02−0.04−0.09−0.10−0.170.03
8.Niedziczanka −0.01−0.010.01−0.02−0.010.000.01−0.01−0.030.01−0.050.01−0.06−0.080.01
9.Ochotnica −0.020.00−0.03−0.06−0.03−0.03−0.010.00−0.08−0.05−0.06−0.06−0.09−0.16−0.06
10.Raba −0.020.00−0.02−0.05−0.02−0.040.000.00−0.10−0.02−0.01−0.030.05−0.22−0.02
11.San −0.020.020.00−0.03−0.03−0.050.04−0.06−0.06−0.090.070.280.03−0.030.00
12.Sękówka −0.01−0.01−0.02−0.03−0.02−0.040.01−0.02−0.06−0.020.020.040.10−0.150.02
13.Skawica −0.06−0.02−0.03−0.09−0.05−0.09−0.06−0.01−0.14−0.06−0.16−0.240.00−0.540.08
14.Solinka −0.040.010.02−0.05−0.04−0.080.00−0.07−0.12−0.110.020.120.11−0.310.00
15.Soła −0.010.020.02−0.02−0.01−0.010.020.00−0.060.000.00−0.010.16−0.340.19
16.Stradomka −0.020.00−0.01−0.03−0.03−0.03−0.02−0.02−0.06−0.02−0.05−0.030.02−0.140.00
17.Topla 0.000.01−0.01−0.02−0.01−0.020.01−0.04−0.05−0.01−0.080.05−0.19−0.09−0.02
18.Uszwica −0.020.00−0.01−0.03−0.03−0.02−0.010.00−0.06−0.03−0.10−0.03−0.05−0.150.00
19.Wieprzówka −0.02−0.01−0.02−0.02−0.03−0.04−0.03−0.02−0.06−0.04−0.08−0.17−0.01−0.220.04
20.Wisła Ustroń −0.030.000.02−0.05−0.02−0.060.02−0.03−0.13−0.040.060.000.22−0.230.07
Disclaimer/Publisher’s Note: The statements, opinions and data contained in all publications are solely those of the individual author(s) and contributor(s) and not of MDPI and/or the editor(s). MDPI and/or the editor(s) disclaim responsibility for any injury to people or property resulting from any ideas, methods, instructions or products referred to in the content.

