Article

The Impact of Partial Deforestation on Solute Fluxes and Stream Water Ionic Composition in a Headwater Catchment

by
Eliza Płaczkowska
1,2,*,
Karolina Mostowik
3,
Heye Reemt Bogena
4 and
Michael Leuchner
1
1
Physical Geography and Climatology, Institute of Geography, RWTH Aachen University, 52062 Aachen, Germany
2
Institute of Geography and Spatial Organization, Polish Academy of Sciences, 31-018 Kraków, Poland
3
Institute of Geography and Spatial Management, Jagiellonian University, 30-387 Kraków, Poland
4
Institute of Bio- and Geosciences, Agrosphere (IBG-3), Forschungszentrum Jülich, 52428 Jülich, Germany
*
Author to whom correspondence should be addressed.
Water 2023, 15(1), 107; https://doi.org/10.3390/w15010107
Submission received: 5 December 2022 / Revised: 19 December 2022 / Accepted: 22 December 2022 / Published: 28 December 2022
(This article belongs to the Special Issue Fluvial Systems and River Geomorphology)

Abstract

:
To ensure the good chemical status of surface water across Europe, it is necessary to increase research on the comprehensive impact of land use and land cover changes, i.e., deforestation, on the natural environment. For this reason, we used data from 9-year environmental monitoring in the Wüstebach experimental catchment of the TERENO (Terrestrial Environmental Observatories) network to determine the impact of partial deforestation on solute fluxes and stream water ionic composition. In 2013, a partial deforestation experiment was conducted in the study area using a cut-to-length logging method. To this end, two headwater catchments were compared: one partially deforested (22% of the catchment area) and one untreated control catchment. The concentrations of ions in stream water, groundwater, and precipitation were analyzed: Ca2+, Mg2+, Na+, K+, Al3+, Fetot, Mn2+, NO3, SO4, and Cl. Most of the ions (Na+, Ca2+, Mg2+, Cl, and SO4) showed decreasing trends in concentrations after deforestation, indicating a dilution effect in stream water due to the reduction of the supply of solutes with precipitation in the open deforested area. The fluxes of these ions decreased by 5–7% in the first year after deforestation, although the stream runoff increased by 5%. In the second year, the decrease in ion fluxes was greater, from 6% to 24%. This finding confirms that only limited soil erosion occurred after the deforestation because the soil was well protected during logging works by covering harvester lanes with branches. Only K+ and NO3 ions showed increasing trends in both concentrations and fluxes in the partially deforested catchment in the first two to three years after deforestation. Spruce die-offs, common in Europe, may decrease the concentration and fluxes of base cations in surface water in a nutrient-limited environment. However, the simultaneous planting of young broad-leaved trees with post-harvesting regrowth could create a nutrient sink that protects the catchment area from nutrient depletion.

1. Introduction

Forest management in Europe in the 19th and 20th centuries, which focused on the rapid and mass harvesting of wood, has resulted in pure Norway spruce (Picea abies L.) forests growing today in many places where it would not naturally occur [1]. Recently, with respect to climate change and long-term droughts, spruce forests are dying off or being replaced by other tree species as a result of forest management aimed at rebuilding natural forests [2]. Such changes must be reflected not only in the water balance but also in the ionic composition of surface water. Nowadays, the main aim of the EU water policy is to ensure the good chemical status of surface water across Europe [3], which means an increase in the need for research on the comprehensive impact of land use and land cover changes, i.e., deforestation, on the environment, including the quality of surface water.
The effect of deforestation on water budget and chemistry has been studied for several decades [4,5,6]. The results of these studies show that streamflow increases after logging, especially in the first year following logging, which is related to reduced evapotranspiration. The increase in streamflow depends on the percentage of the deforested area [7,8]. Clear-cutting also causes the mobilization of nutrients from the upper soil horizons, resulting in an increased concentration of most ions in the stream water, and this effect could even persist for several decades following logging [9,10]. Increased transport and concentrations of nitrogen forms (NO3, NO2, NH4+, total N) in surface waters after logging is often reported, which is related to the limited uptake of nitrogen compounds by vegetation and the supply of nitrogen from the decomposition of organic matter left after logging [8,11,12]. According to the mobile anion theory, the mobilization of NO3 and NO2 should be accompanied by increased leaching of base cations [13]. Therefore, after deforestation, a short-term increase in the concentration of cations (Ca2+, Mg2+, K+) in surface waters is observed [10,14]. However, in the long term, this process leads to the depletion of cation pools in the soil and the acidification of surface waters [9,15]. The effect of deforestation on stream water chemistry also varies depending on the deforestation origin [16,17]. Changes in water chemistry after deforestation are thus complex and depend on the timing of deforestation, the length of time after deforestation, and the conditions of regrowth.
The Eifel Mountains in western Germany are excellent terrain for studying the effect of changes in forest cover on the natural environment, as it is an area currently undergoing dynamic changes in forest ecosystems. In recent years, the problem of the extinction of spruce trees has become common here [18], and since 2004 young beech trees (Fagus sylvatica L.) have been planted in many places in the Eifel National Park according to the forest management plan [19]. In this context, the paper contributes to a better understanding of changes in the environment on a regional scale. It has the potential to be helpful in decision-making by competent authorities to respond appropriately to these changes.
This area is also part of the Eifel/Lower Rhine Valley Observatory of the German network TERENO (Terrestrial Environmental Observatories; www.tereno.net (accessed on 1 October 2022)), including the Wüstebach experimental catchment (50°30′20″ N 6°20′01″ E) [20]. Complex monitoring of hydrological, climatological, and soil characteristics has been carried out here since 2007 [21,22]. In 2013, a partial deforestation experiment was conducted in the Wüstebach catchment, which affected the stream water chemistry. In this study, we hypothesize that the partial clear-cut in the catchment resulted in an initial increase in the concentration of ions (especially base cations) in the stream and an increase in the dissolved solute output from the catchment. This hypothesis is verified by:
  • Characterizing the stream water ionic composition before deforestation in the Wüstebach catchment and an adjacent undisturbed control catchment.
  • Identifying changes in stream water ionic composition and solute fluxes after deforestation in both catchments.

2. Study Area

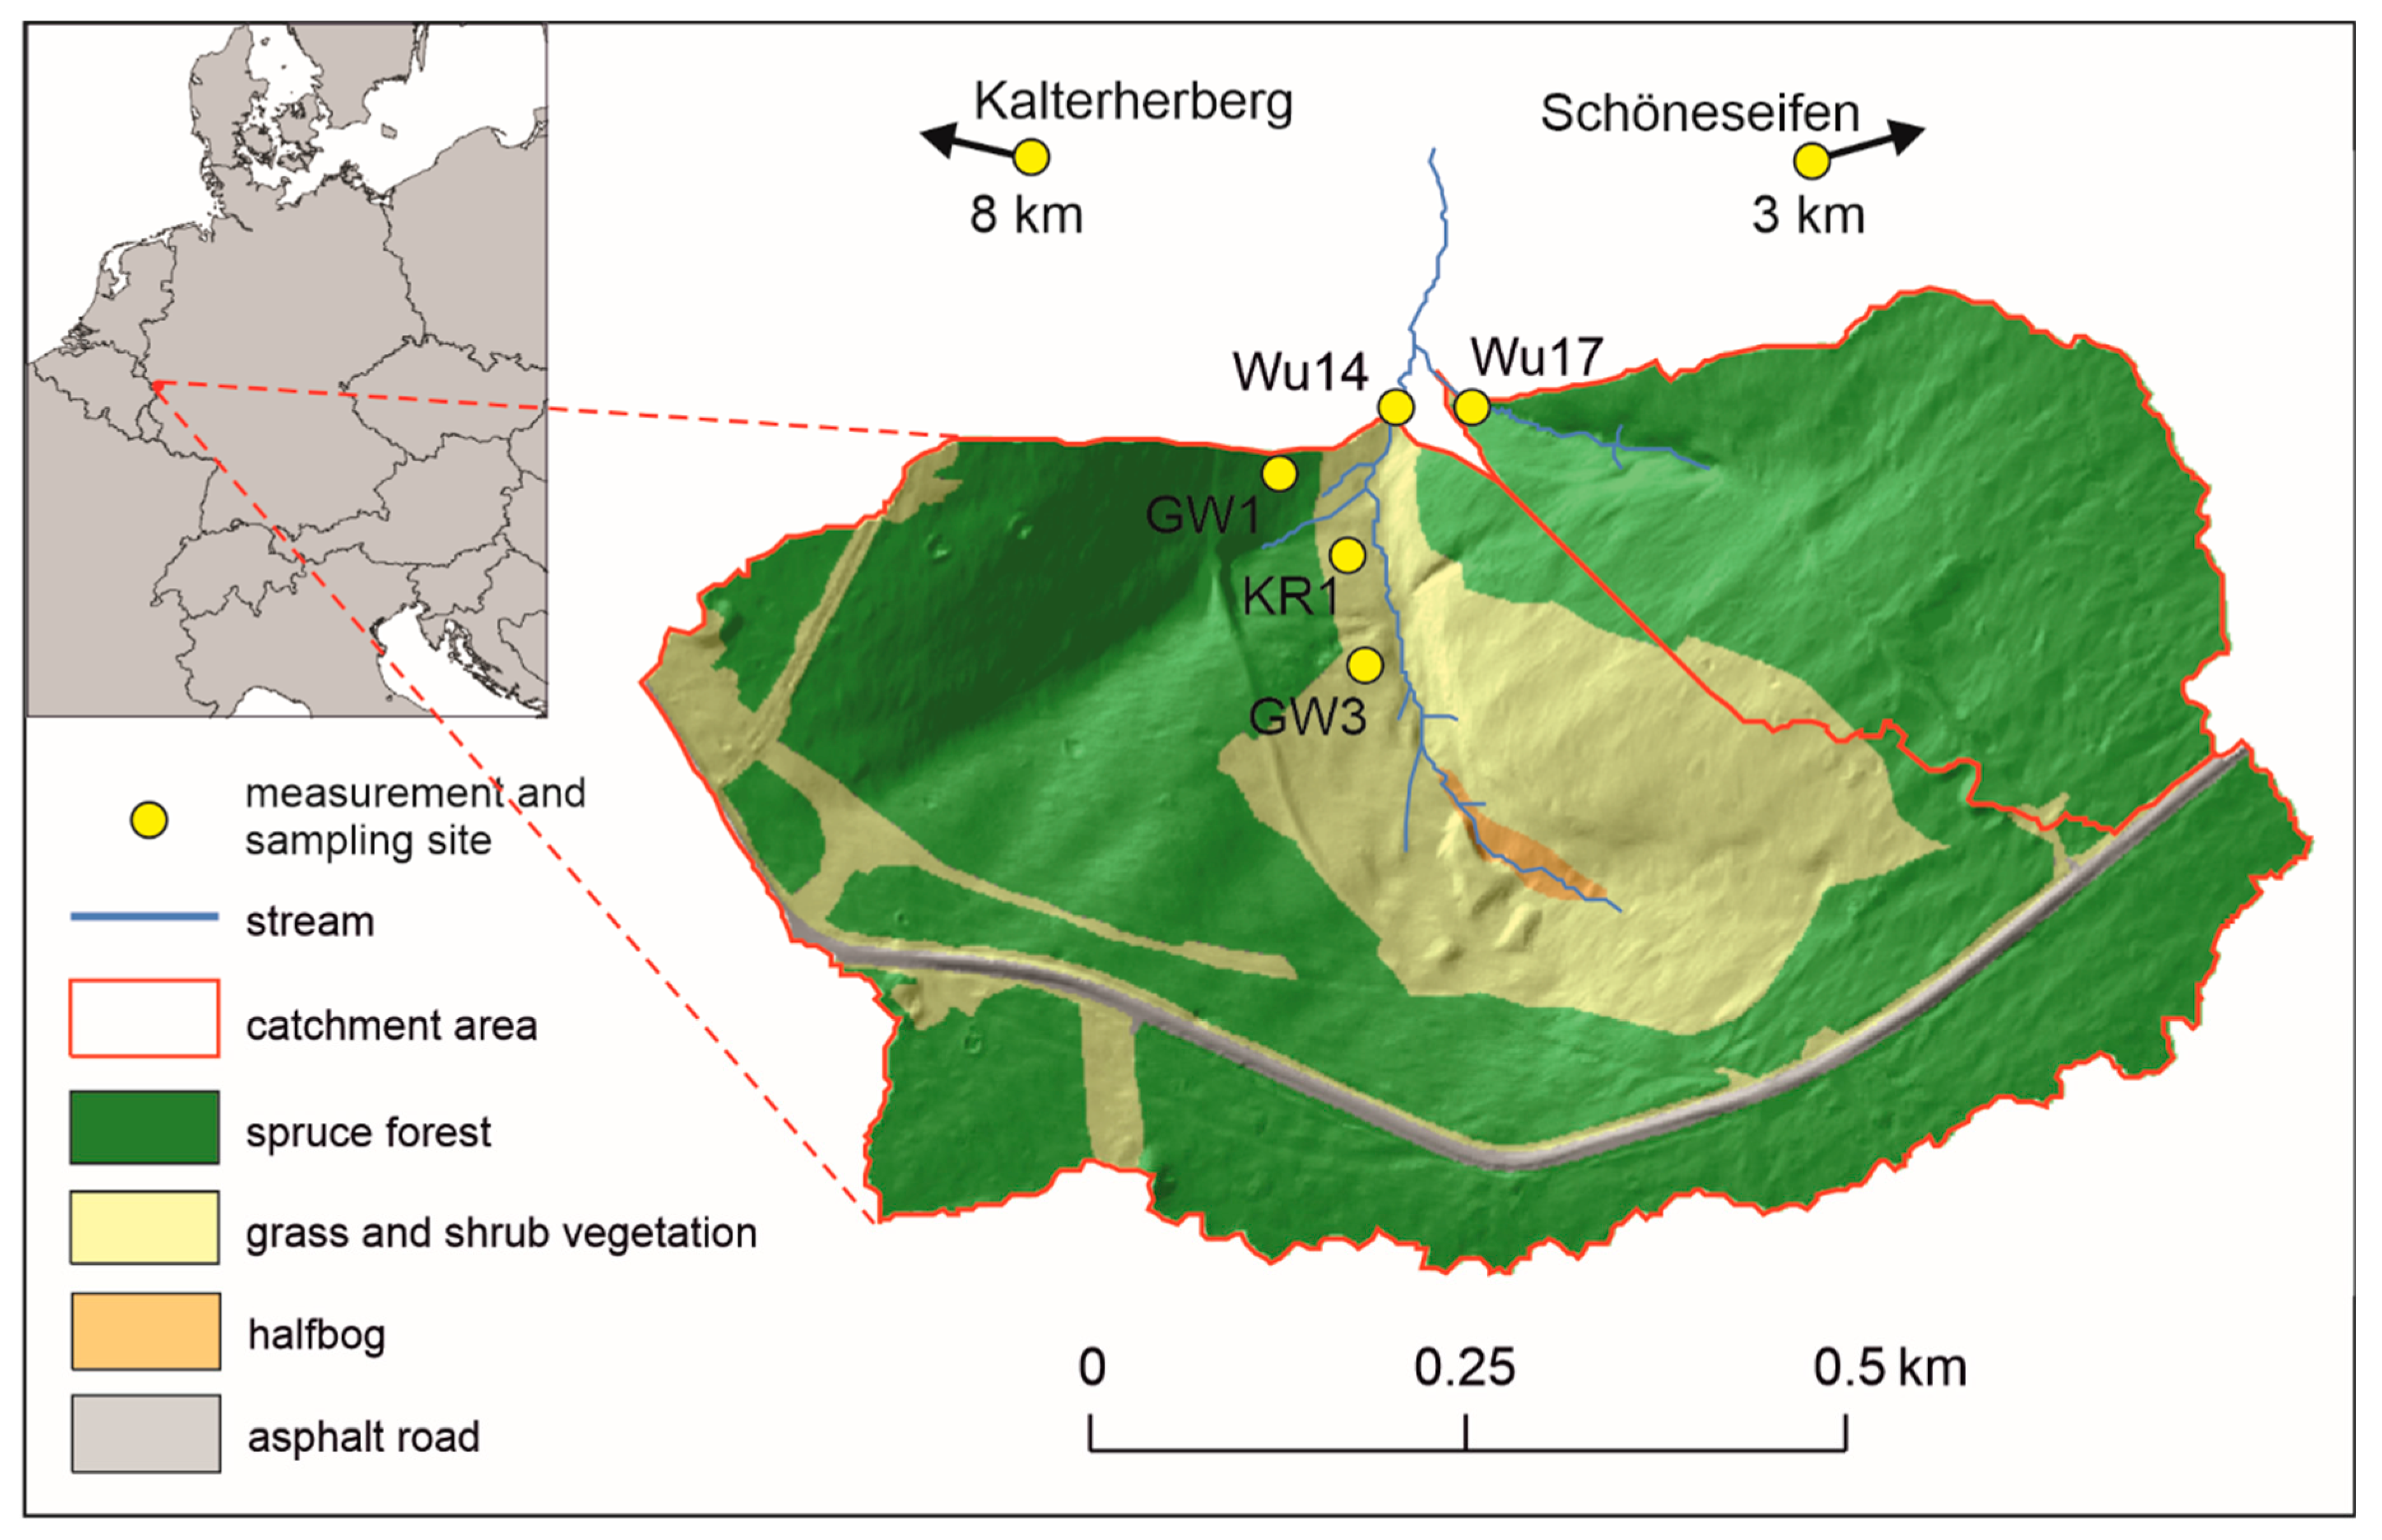
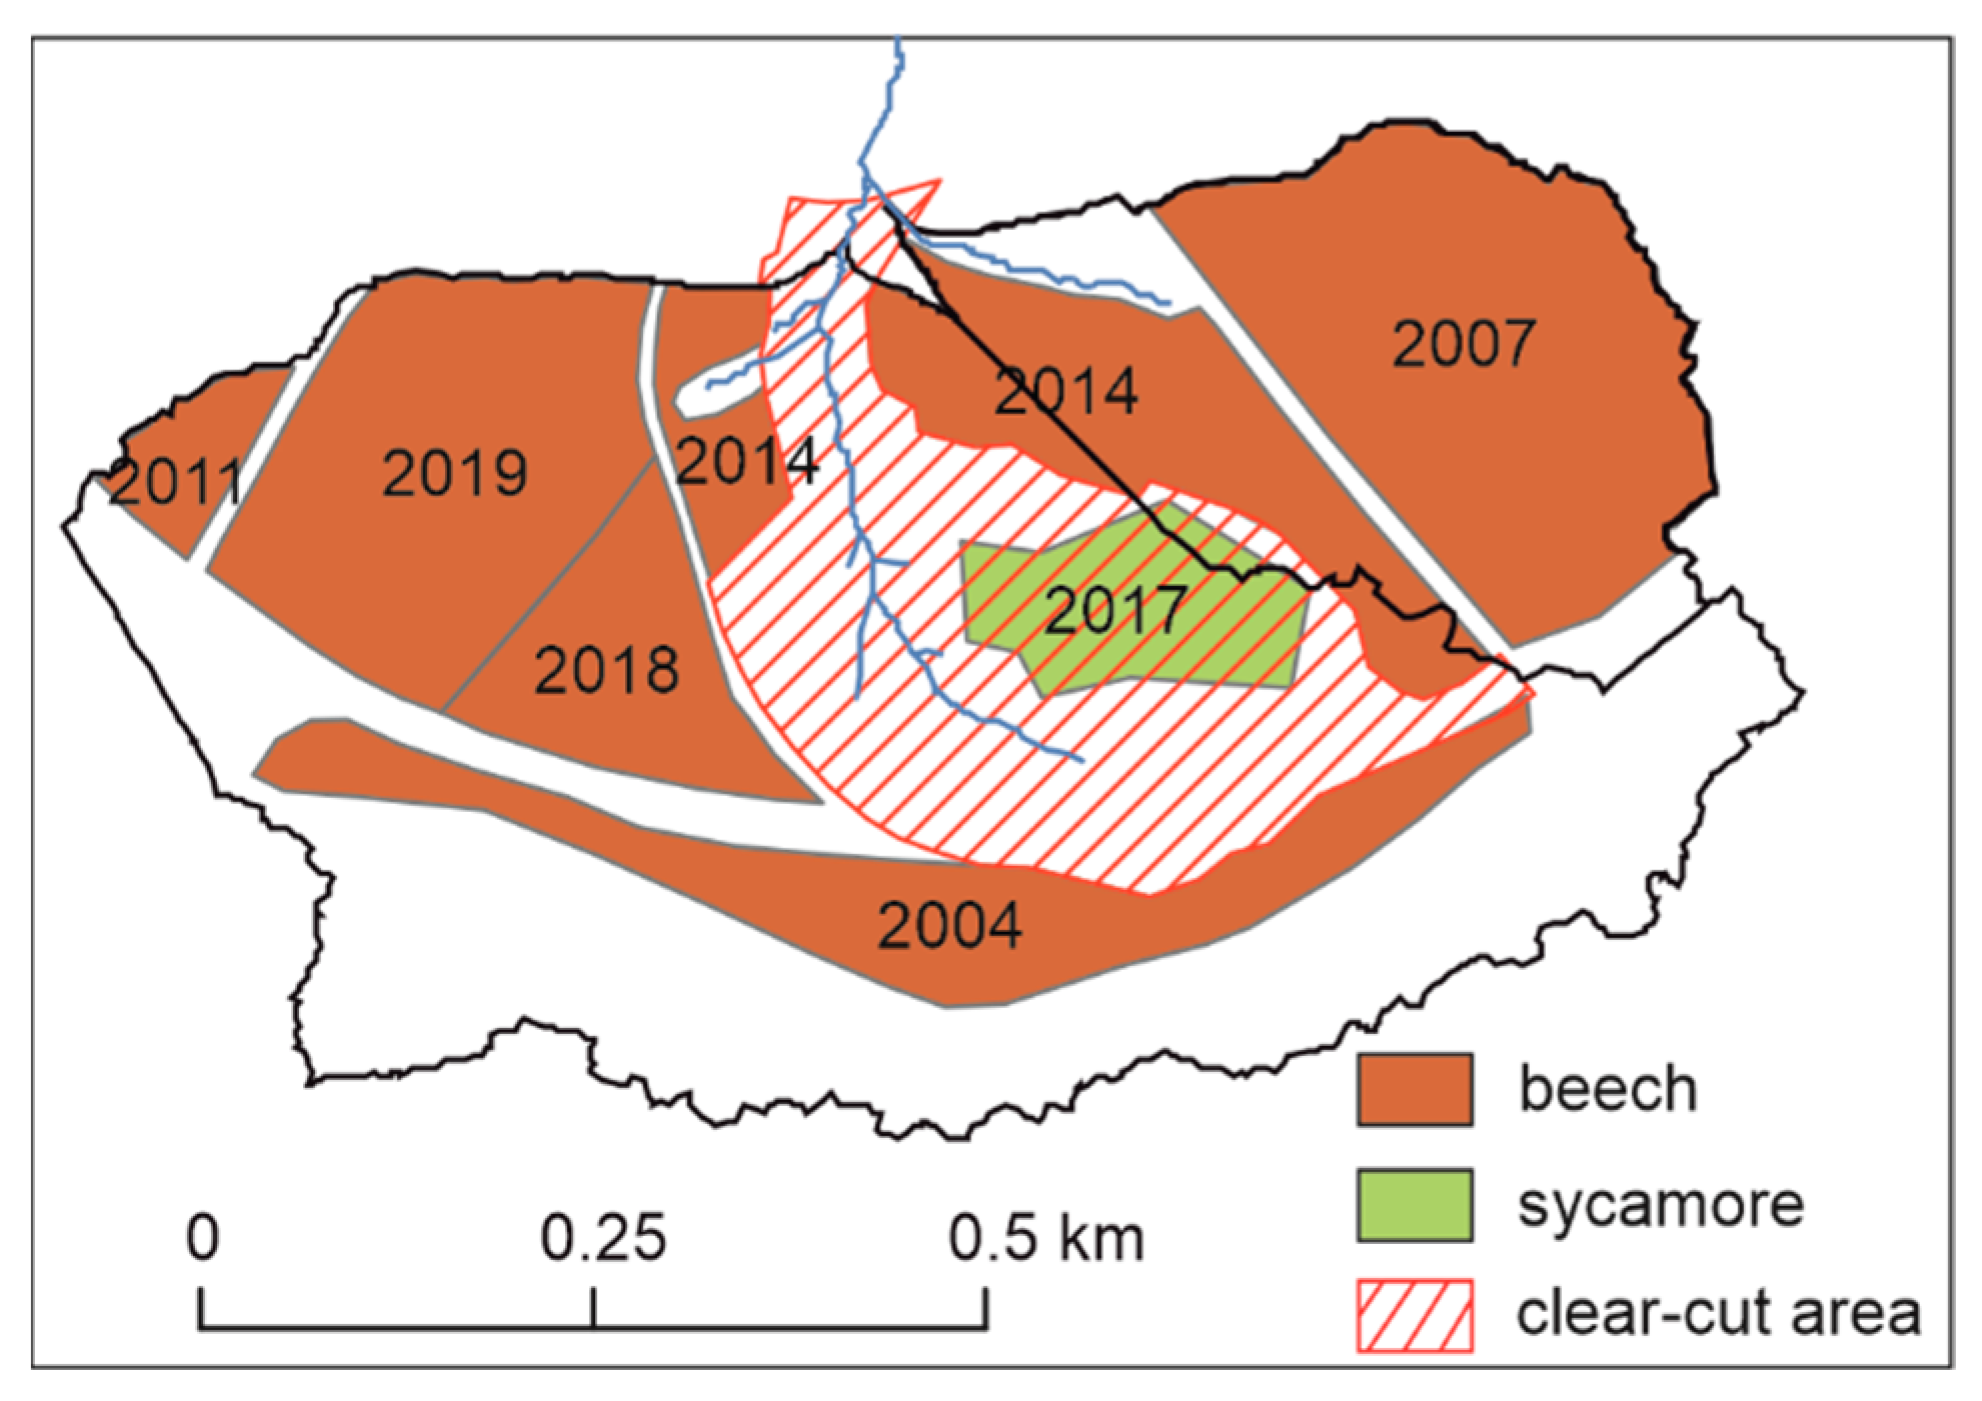
2.1. Site Description and Initial Conditions before the Deforestation Experiment

The Wüstebach catchment (38.5 ha) is located in the Eifel National Park in the Rhenish Massif in western Germany. Together with the control catchment of the Wüstebach tributary (11.4 ha), it forms the Wüstebach experimental site (Figure 1). The elevation of the study area is between 595 and 628 m a.s.l. The slope inclinations are up to 10.4%, with an average inclination of 3.6%.
The area is dominated by fractured Lower Devonian shales of very low hydraulic conductivity (10−9–10−7 m s−1) with occasional sandstone inclusions [23]. The mineral composition of shales is dominated by clay minerals (53–63 vol%), including illite (44 vol%), as well as quartz (38 vol%), albite (3 vol%), and K-feldspar (0.3 vol%) [24]. The bedrock is covered by 1–2 m thick periglacial solifluction sediments with a top layer (0–0.5 m) and a base layer (0.5–1.5 m). Both layers differ in terms of permeability, and the base layer has a lower hydraulic conductivity than the top layer. On the hillslopes, there are mainly Cambisols and Cambisol-Planosols, and in the riparian zone, Gleysols and Histosols [25].
The average annual precipitation is approx. 1200 mm. The water budget before deforestation was composed of 44% evapotranspiration and 56% runoff. Due to the low permeability of the bedrock, the deep percolation of water may be neglected [26]. The summer periods are characterized by low flows, while high flows occur mostly in winter periods [27].
After the Second World War, both catchments were reforested with Norway spruce, which is a dominant tree species (97% of forest biomass before deforestation) [28]. Besides the coniferous forest, there are also patches of open vegetation covered by herbaceous plants, fen sedges, ferns, and mosses [29].

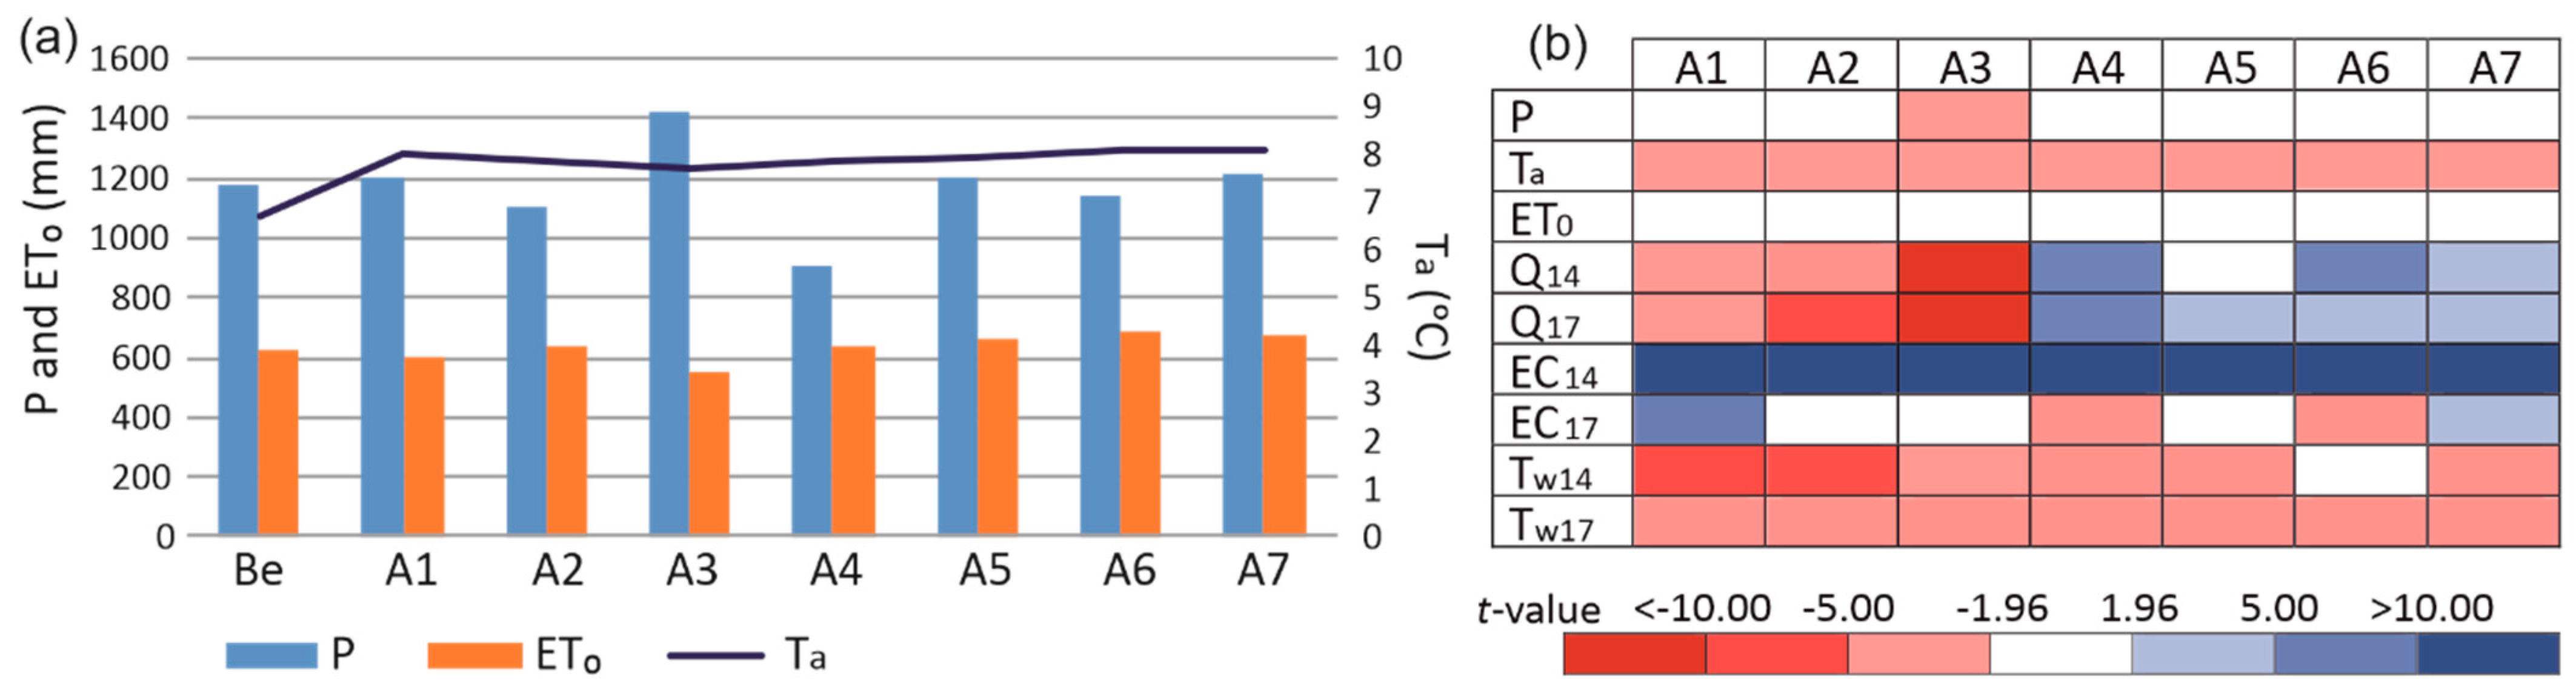
2.2. Deforestation Experiment and Its Effect on the Catchment Hydrology

At the end of August and the beginning of September 2013, about 9 ha (22% of the catchment area; Figure 2) of spruce forest in the Wüstebach catchment were clear-cut to promote the regeneration of near-natural beech forest. A cut-to-length logging method resulted in the remaining only 3% of the original biomass on-site (tree stumps and litter) [30]. The clearing work was carried out with light machinery, and the work paths were covered with tree branches to prevent soil compaction and thus minimize mechanical disturbance of the soil [31]. The clear-cut area remained unmanaged for natural revegetation, except for 2 ha, where sycamore (Acer Pseudoplatanus L.) was planted in 2017, while beech was planted in the remaining spruce forest (Figure 2). Between 2004 and 2019, 44% of the catchment area was planted with broad-leaved trees (unpublished data from the Eifel National Park).
Deforestation affected the catchment water balance [28]. However, the changes were rather short-term [27]. The actual evapotranspiration was reduced by approx. 50% in the deforested area, but it returned to pre-deforestation values within 2 years [32]. The decreased evapotranspiration resulted in increased soil water content in the first 2 years after deforestation, which led to an increase in stream runoff of about 10% in the first year compared to the stream runoff before deforestation [22,28]. After deforestation, the Wüstebach catchment also showed a more rapid response to rainfall events [33].

3. Materials and Methods

3.1. Data Collection

The field measurements of discharge and stream water properties, as well as a sampling of the stream water, groundwater, and precipitation, were done by the Agrosphere Institute of the Forschungszentrum Jülich and the data are available online at the TERENO data discovery portal (https://ddp.tereno.net/ddp/, accessed on 1 October 2022). Two gauging sites were used to compare changes in stream water chemistry: in the Wüstebach catchment (Wu14) and in the control catchment (Wu17; see Figure 1). Stream discharge was measured in 10-min intervals based on two weir types: V-notch for low water levels and Parshall flume for high water levels. Water physical and chemical properties such as water temperature, pH, and electrical conductivity, referred to as 25 ℃, were measured using multi-probes (YSI 6820, YSI Inc., Yellow Springs, OH, USA) in 15-min intervals. The chemical composition of stream water based on weekly sampling campaigns was measured: Cl, NO3, SO4, NH4+, PO42− (with ion chromatography), Al3+, Fetot, Mn2+, Ca2+, Mg2+, Na+, K+ (with inductively coupled plasma–optical emission spectrometry). The same physical and chemical parameters were determined for two groundwater sampling sites in the Wüstebach catchment: the site located on the hillslope ca. 60 m from the stream channel in the spruce forest (GW1) and the site located in the riparian zone ca. 25 m from the stream channel in the area treated in 2013 (GW3). For more information on field measurements and sampling, see Bogena et al. [21,22,27].
The daily precipitation totals were obtained from the Kalterherberg meteorological station of the German Weather Service due to discontinuity in the data measured on-site. Kalterherberg station is located 8 km west of the study area, and the precipitation data correlate very well with the data from the Wüstebach station [26]. Rainwater sampling for chemical analysis was performed at the TERENO Schöneseiffen site. The air temperature was measured in 10-min intervals at the TERENO KR1 meteorological station in the Wüstebach catchment (Figure 1). Additionally, the snowpack was sampled in the Wüstebach catchment: three times 1–2 m below the public road and four times in the riparian zone of the main stream. All snowpack samples were collected in February 2022 in order to analyze their chemical composition.

3.2. Data Analysis

The average daily values of stream discharge (Q), temperature (Tw), electrical conductivity (EC), and air temperature (Ta) were calculated and used for analyses. The Penman-Monteith method [34] was used to estimate daily reference evapotranspiration (ET0) using TERENO meteorological data. Concentrations of NH4+ and PO42− were very low, usually near or below the detection limit. Therefore, they were excluded from further analysis. Since the groundwater Fetot concentration data contain a large number of gaps, they were also excluded from the analyses. The concentration of HCO3 was calculated as the difference in the equivalent sum of base cations (Ca2+, Mg2+, Na+, K+) and acid anions (Cl, NO3, SO4). The analyzed data cover two years in the pre-deforestation period (B1: Sep 2011–Aug 2012, B2: Sep 2012–Aug 2013) and seven years in the post-deforestation period (A1: Sep 2013–Aug 2014, A2: Sep 2014–Aug 2015, ..., A7: Sep 2019–Aug 2020). A total of 411 water samples from the Wu14 sampling site and 408 water samples from the Wu17 sampling site were included in statistical analyses, as well as 309 groundwater samples from the GW1 sampling site and 318 groundwater samples from the GW3 sampling site.
For the variables that did not conform to the normal distribution, the log transformation was applied, and statistical analysis was based on standardized data. The relationship between streamflow and other parameters (EC, pH, Tw, ion concentrations) in the pre-deforestation period was determined using Pearson’s correlation coefficient. To determine whether the differences between means of parameters before and after deforestation were significantly different, a paired t-test was performed, with p ≤ 0.05. This method was chosen because it is one of the most popular statistical techniques used to test differences between the mean values of the same subject measured at different time points [35]. The pre-deforestation period was compared to each year after the clear-cut.
The daily stream output of each ion was calculated by multiplying the daily discharge with ion concentration from stream sampling campaigns by assuming that each sample represents the stream water chemistry of the previous 7 days. The daily total precipitation input (wet and dry deposition) of each ion was calculated by multiplying the daily amount of precipitation with ion concentration from rainwater sampling by assuming that each sample represents the rainwater chemistry of the previous 7 days with precipitation. The net stream output of each ion, indicating chemical denudation, was defined as the difference between total stream output and precipitation input. All analyses were based on the annual totals of stream outputs and the annual totals of precipitation input.

4. Results and Discussion

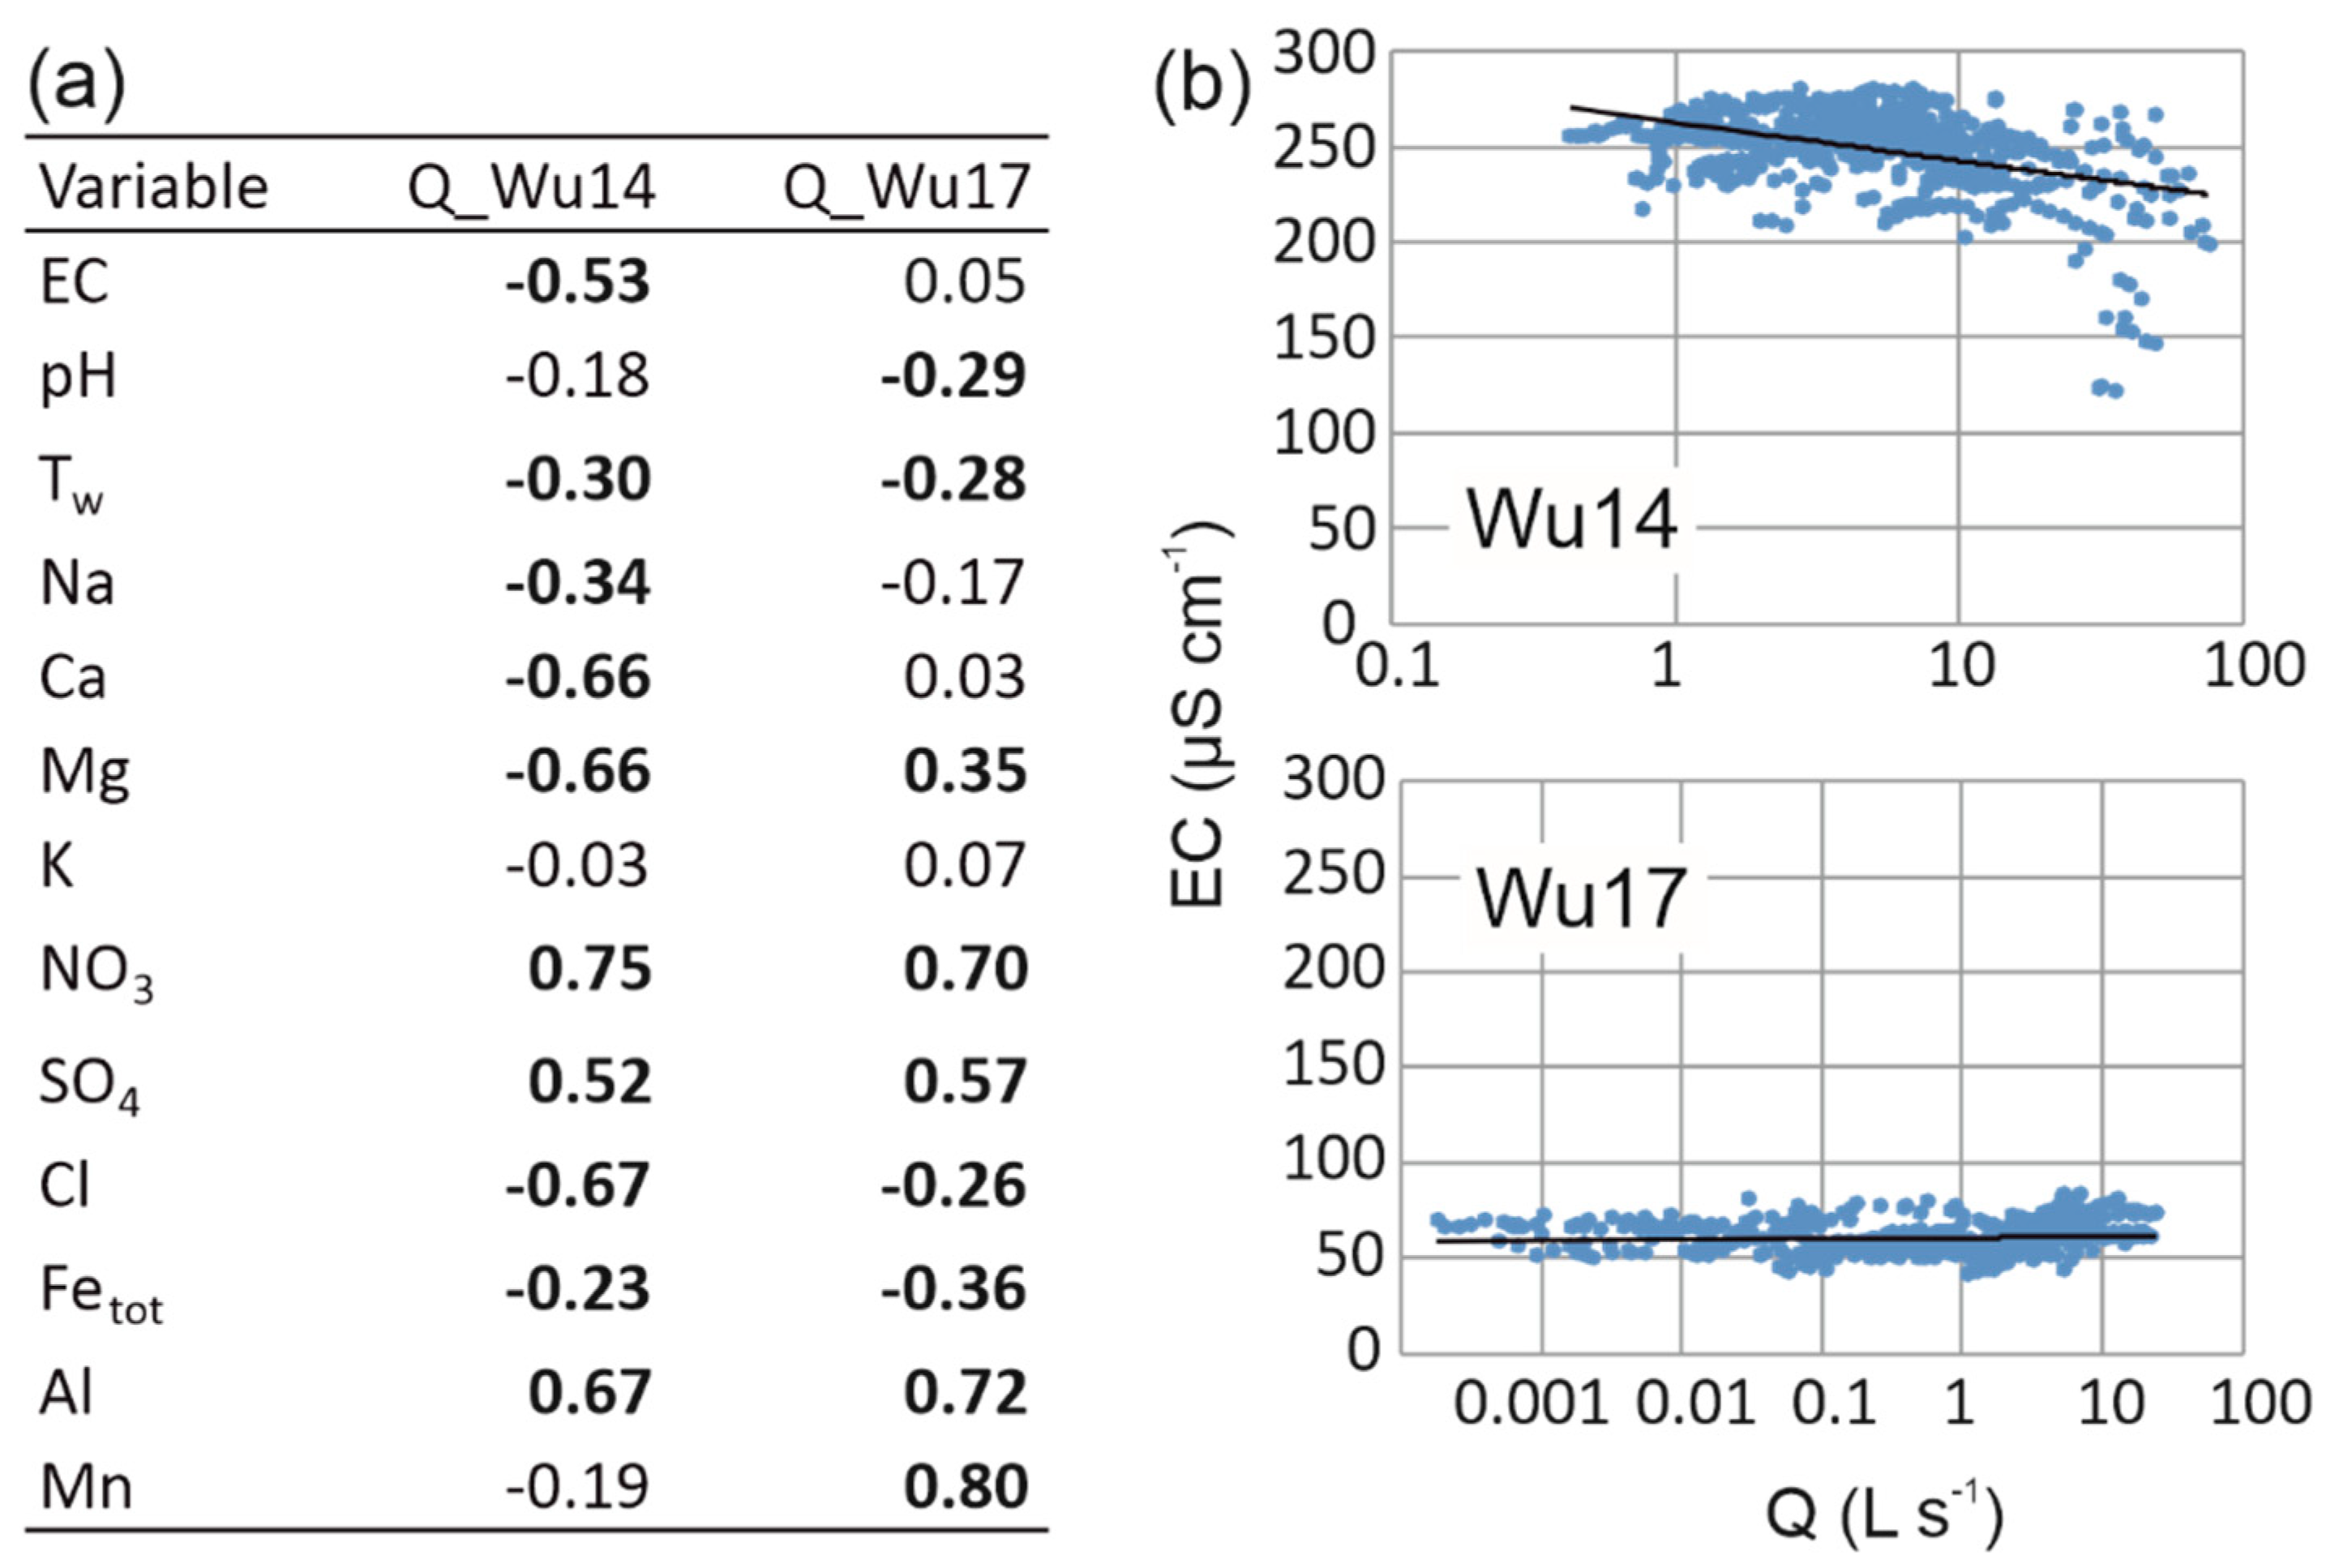
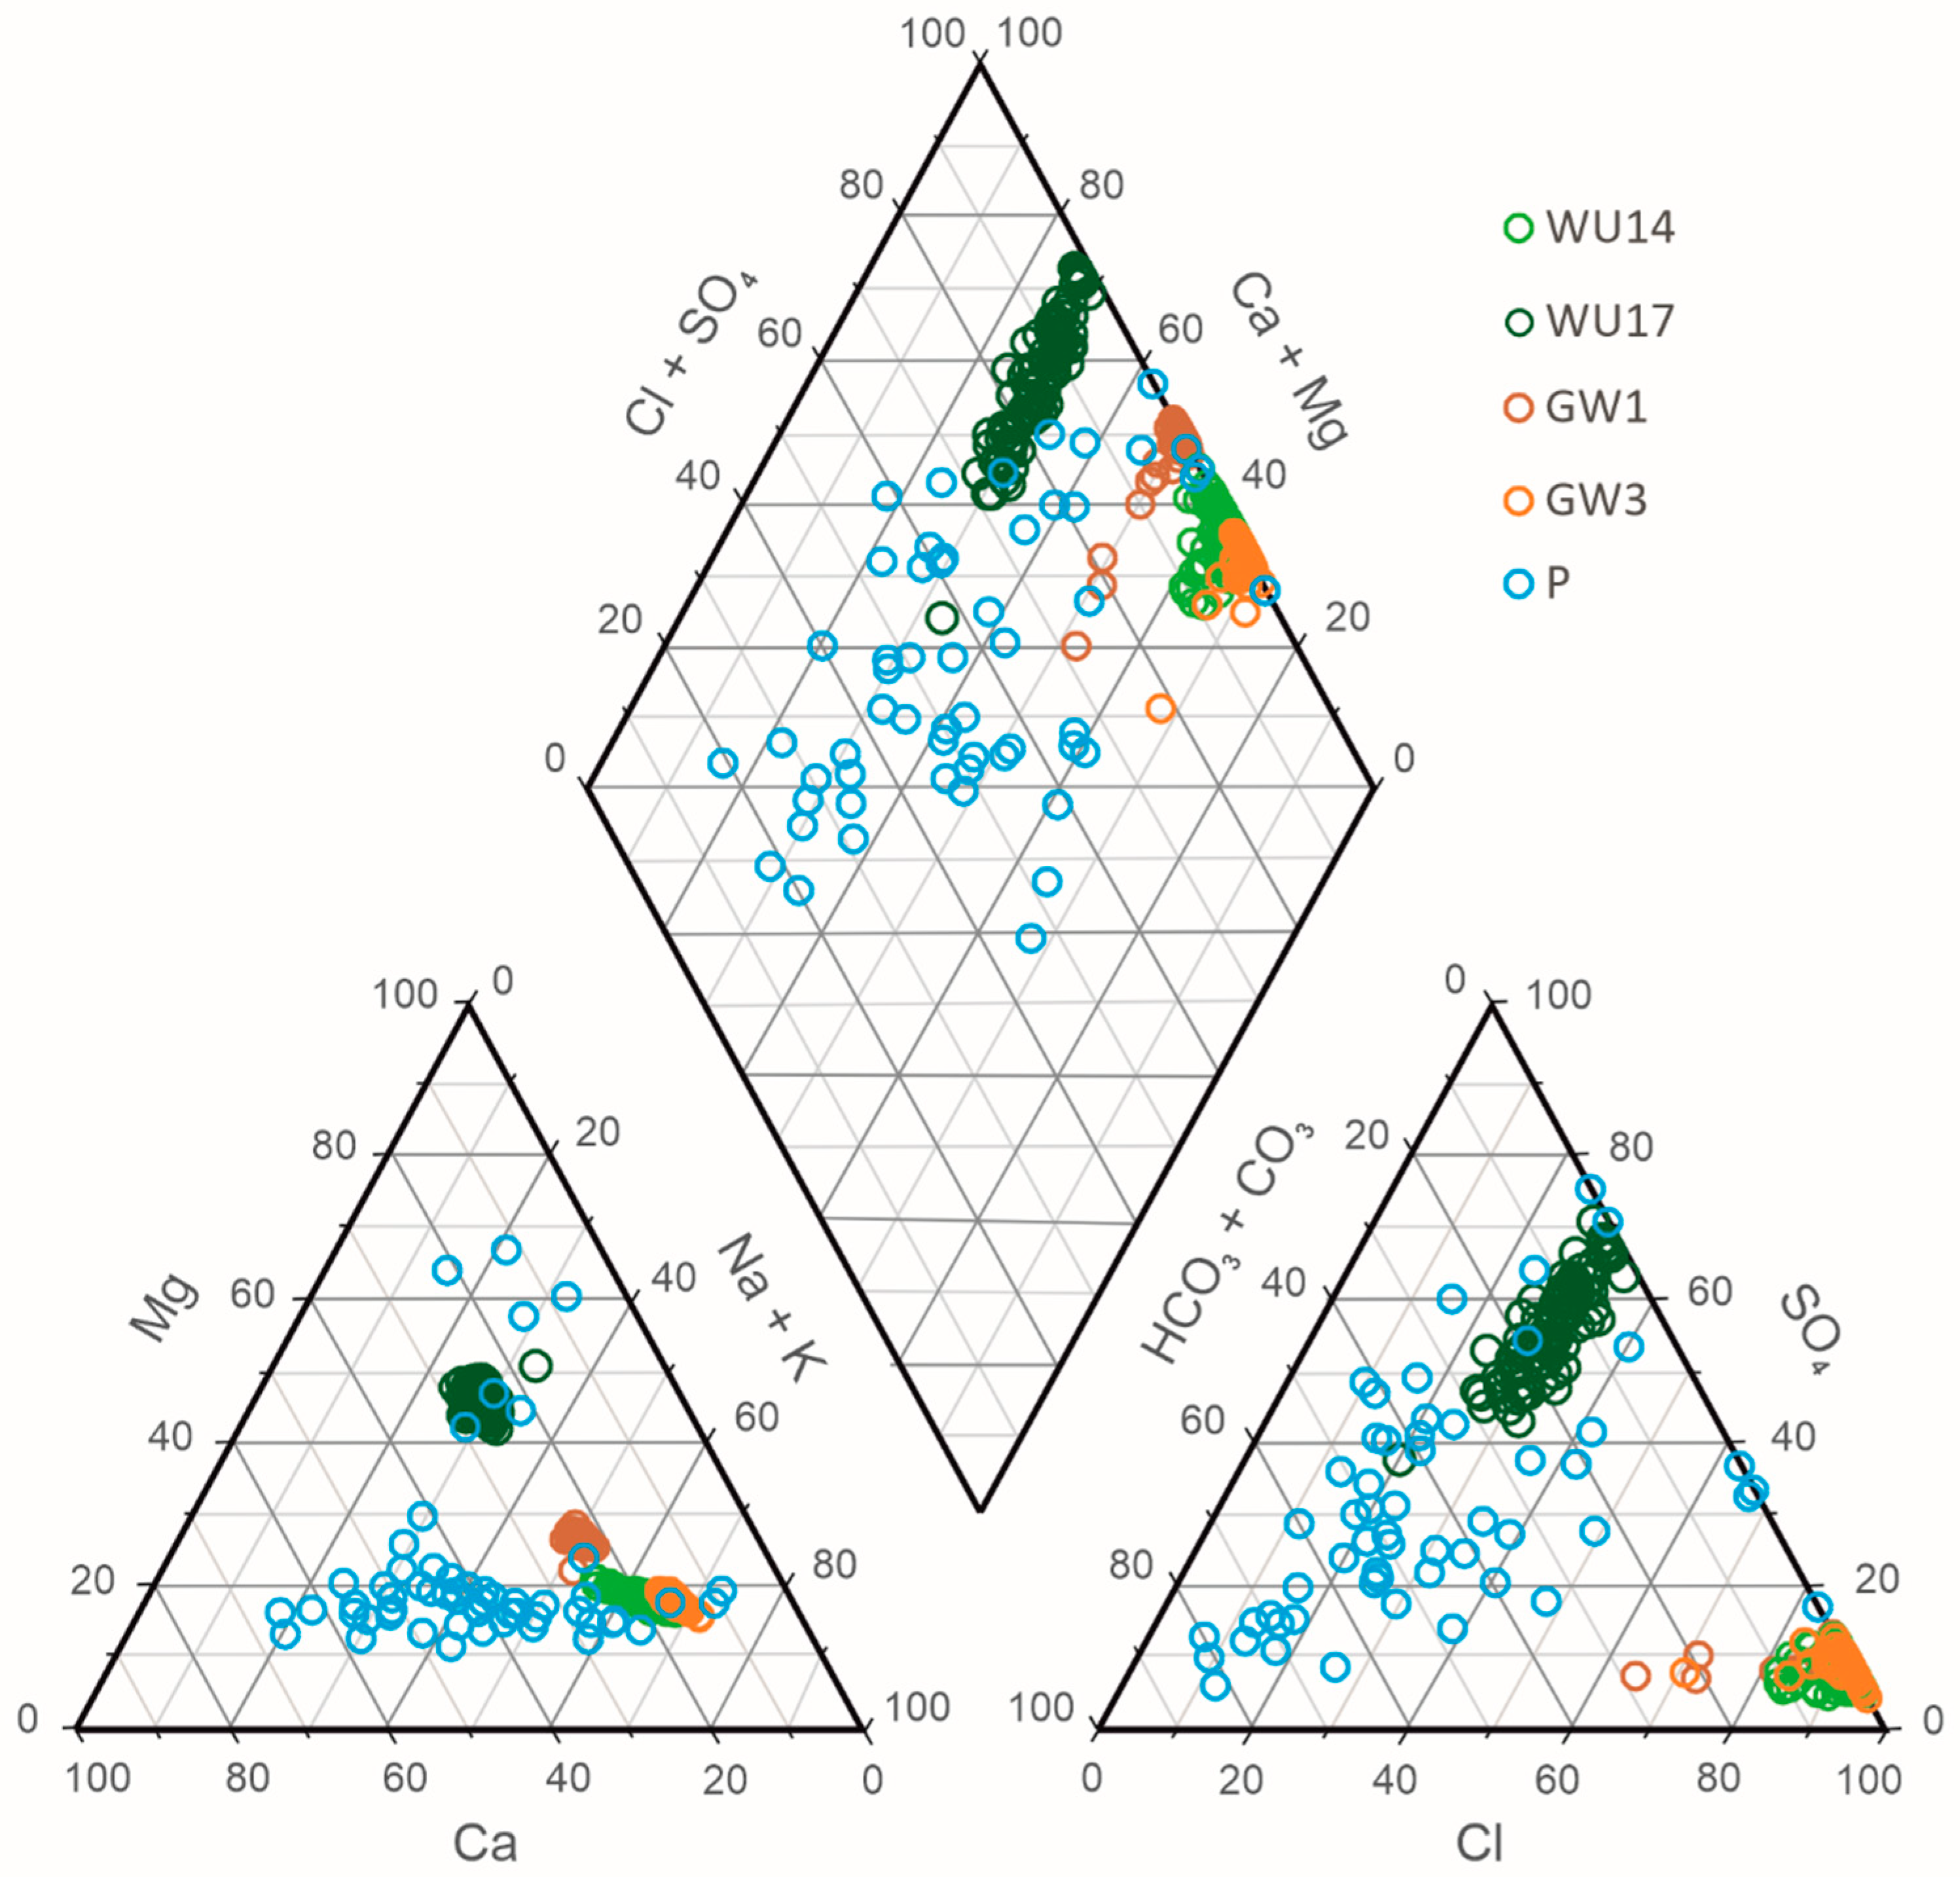
4.1. Ionic Composition of Streams and Groundwater in the Pre-Deforestation Period

The average EC in the period before deforestation was 250 μS cm−1 in the Wüstebach catchment and 61 μS cm−1 in the control catchment. The average stream flow of the Wüstebach was three times higher than that of the control stream (Table 1). The stream in the control catchment represented the Ca-Mg-SO4 hydrochemical type, which is typical for the Eifel region [36]. Stream and groundwater samples from the Wüstebach catchment represented the same Na-Cl-type and were located at the hydrochemical facies of ocean and brine waters in the Piper diagram, but ion concentration was much lower (Figure 3) [37]. However, the ionic composition of the groundwater site located on the hillslope ca. 60 m from the stream channel (GW1) was slightly shifted towards the control catchment. This site, like the control catchment, is located in a spruce forest where beech trees were planted. The ionic composition of the groundwater site located closer to the stream channel (ca. 25 m, GW3) in the riparian zone was similar to the Wüstebach stream. This may indicate the mixing of slope and channel waters in the riparian zone.
In the Wüstebach, there were ten times higher concentrations of Na+ and 12 times higher concentrations of Cl compared to the control catchment (Table 1). According to Hem [38], bedrock typical for the Wüstebach catchment (predominantly shales) cannot yield very high concentrations of chloride to normally circulating natural water. The only reasonable explanation for the high concentration of Na+ and Cl in this area is the use of de-icing salt during winter months on the public road crossing the upper part of the catchment [21]. Concentrations of Na+ and Cl in the snowpack samples collected next to the road were up to 70 times higher than the concentrations of these ions in the snowpack located next to the stream channel, up to 130 times higher than average concentrations of these ions in the control stream and up to 330 times higher than the concentrations of these ions in the precipitation (Table 2). This indicates a large input of Na+ and Cl into the stream due to the application of de-icing salts on the motorway that crosses the study area. The similar share of Na+ and Cl in the ionic composition of the stream water and both groundwater sites in the Wüstebach catchment, analogous to the brines (Figure 3), indicates that de-icing salts spread from the road to the stream at a distance of at least 300 m. The strong and long-term effect of using de-icing salt on increasing sodium and chloride concentrations in stream water was also found in other catchments in Germany [39] and around the world [40,41]. Kelly et al. [41] showed that despite the lack of increasing use of de-icing salt in the catchment, the concentration of chloride in the stream water was systematically increasing. The authors explain this with the increased storage effect associated with the long-term use of de-icing salt and the subsurface build-up of salt [41]. This may explain the high values of Na+ and Cl concentration in the Wüstebach also at other times of the year when de-icing salt is not used. An additional source of higher Cl and Na+ concentrations in surface water in the region can be sea-aerosols input [42], as the area is located relatively close (220 km) to the North Sea.
Higher concentrations of Ca2+, Mg2+, and K+ in the Wüstebach than in the control stream result likely also from using de-icing salts that usually, apart from NaCl, contain admixtures of CaCl2, MgCl2, and less often KCl [43]. A 9-fold greater concentration of Mn2+ in the Wüstebach stream compared to the control stream is probably associated with the occurrence of a halfbog in the upper part of the catchment as streams flowing through a bog are enriched with Mn2+ [44].
In the Wüstebach, the significant negative correlation of EC, Na+, Ca2+, Mg2+, Cl, and Fetot with the streamflow (Figure 4a,b) indicates a decrease in ion concentration with the increasing flow. Dilution of stream waters with rainwater or meltwater is a commonly observed effect in many catchments around the world [6,45,46,47]. In the control catchment, only pH, Cl−, and Fetot show negative relation with streamflow. Considering the slight variation in EC with the streamflow in the control catchment (Figure 4b), EC showed rather a “chemostatic behavior” [48]. Most of the ions (Mg2+, NO3, SO4, Al3+, and Mn2+) were positively correlated with streamflow (“mobilization behavior”), indicating washing out solutes from upper soil layers by infiltrating rainwater [48,49,50]. Thus, during the high-water stages, there is a large event water contribution (e.g., surface runoff, fast interflow) in the Wüstebach catchment. In contrast, in the control catchment, shallow groundwater flow (i.e., slow interflow) is dominant. This difference in runoff mechanisms is consistent with the findings of Bol et al. [51], which could also explain the higher concentrations of SO4 and HCO3 in the control stream compared to the Wüstebach stream (Table 1). An additional source of SO4 ions in surface water in the control catchment may also be beech litter, as 84% of the control catchment area was covered with beech trees planted in 2007 and 2014 (Figure 2). Beech trees have the ability to uptake more SO4 from the atmosphere and accumulate it in leaves than conifers [52], which is manifested by higher concentrations of this ion in surface waters in beech forests than in coniferous forests [53].

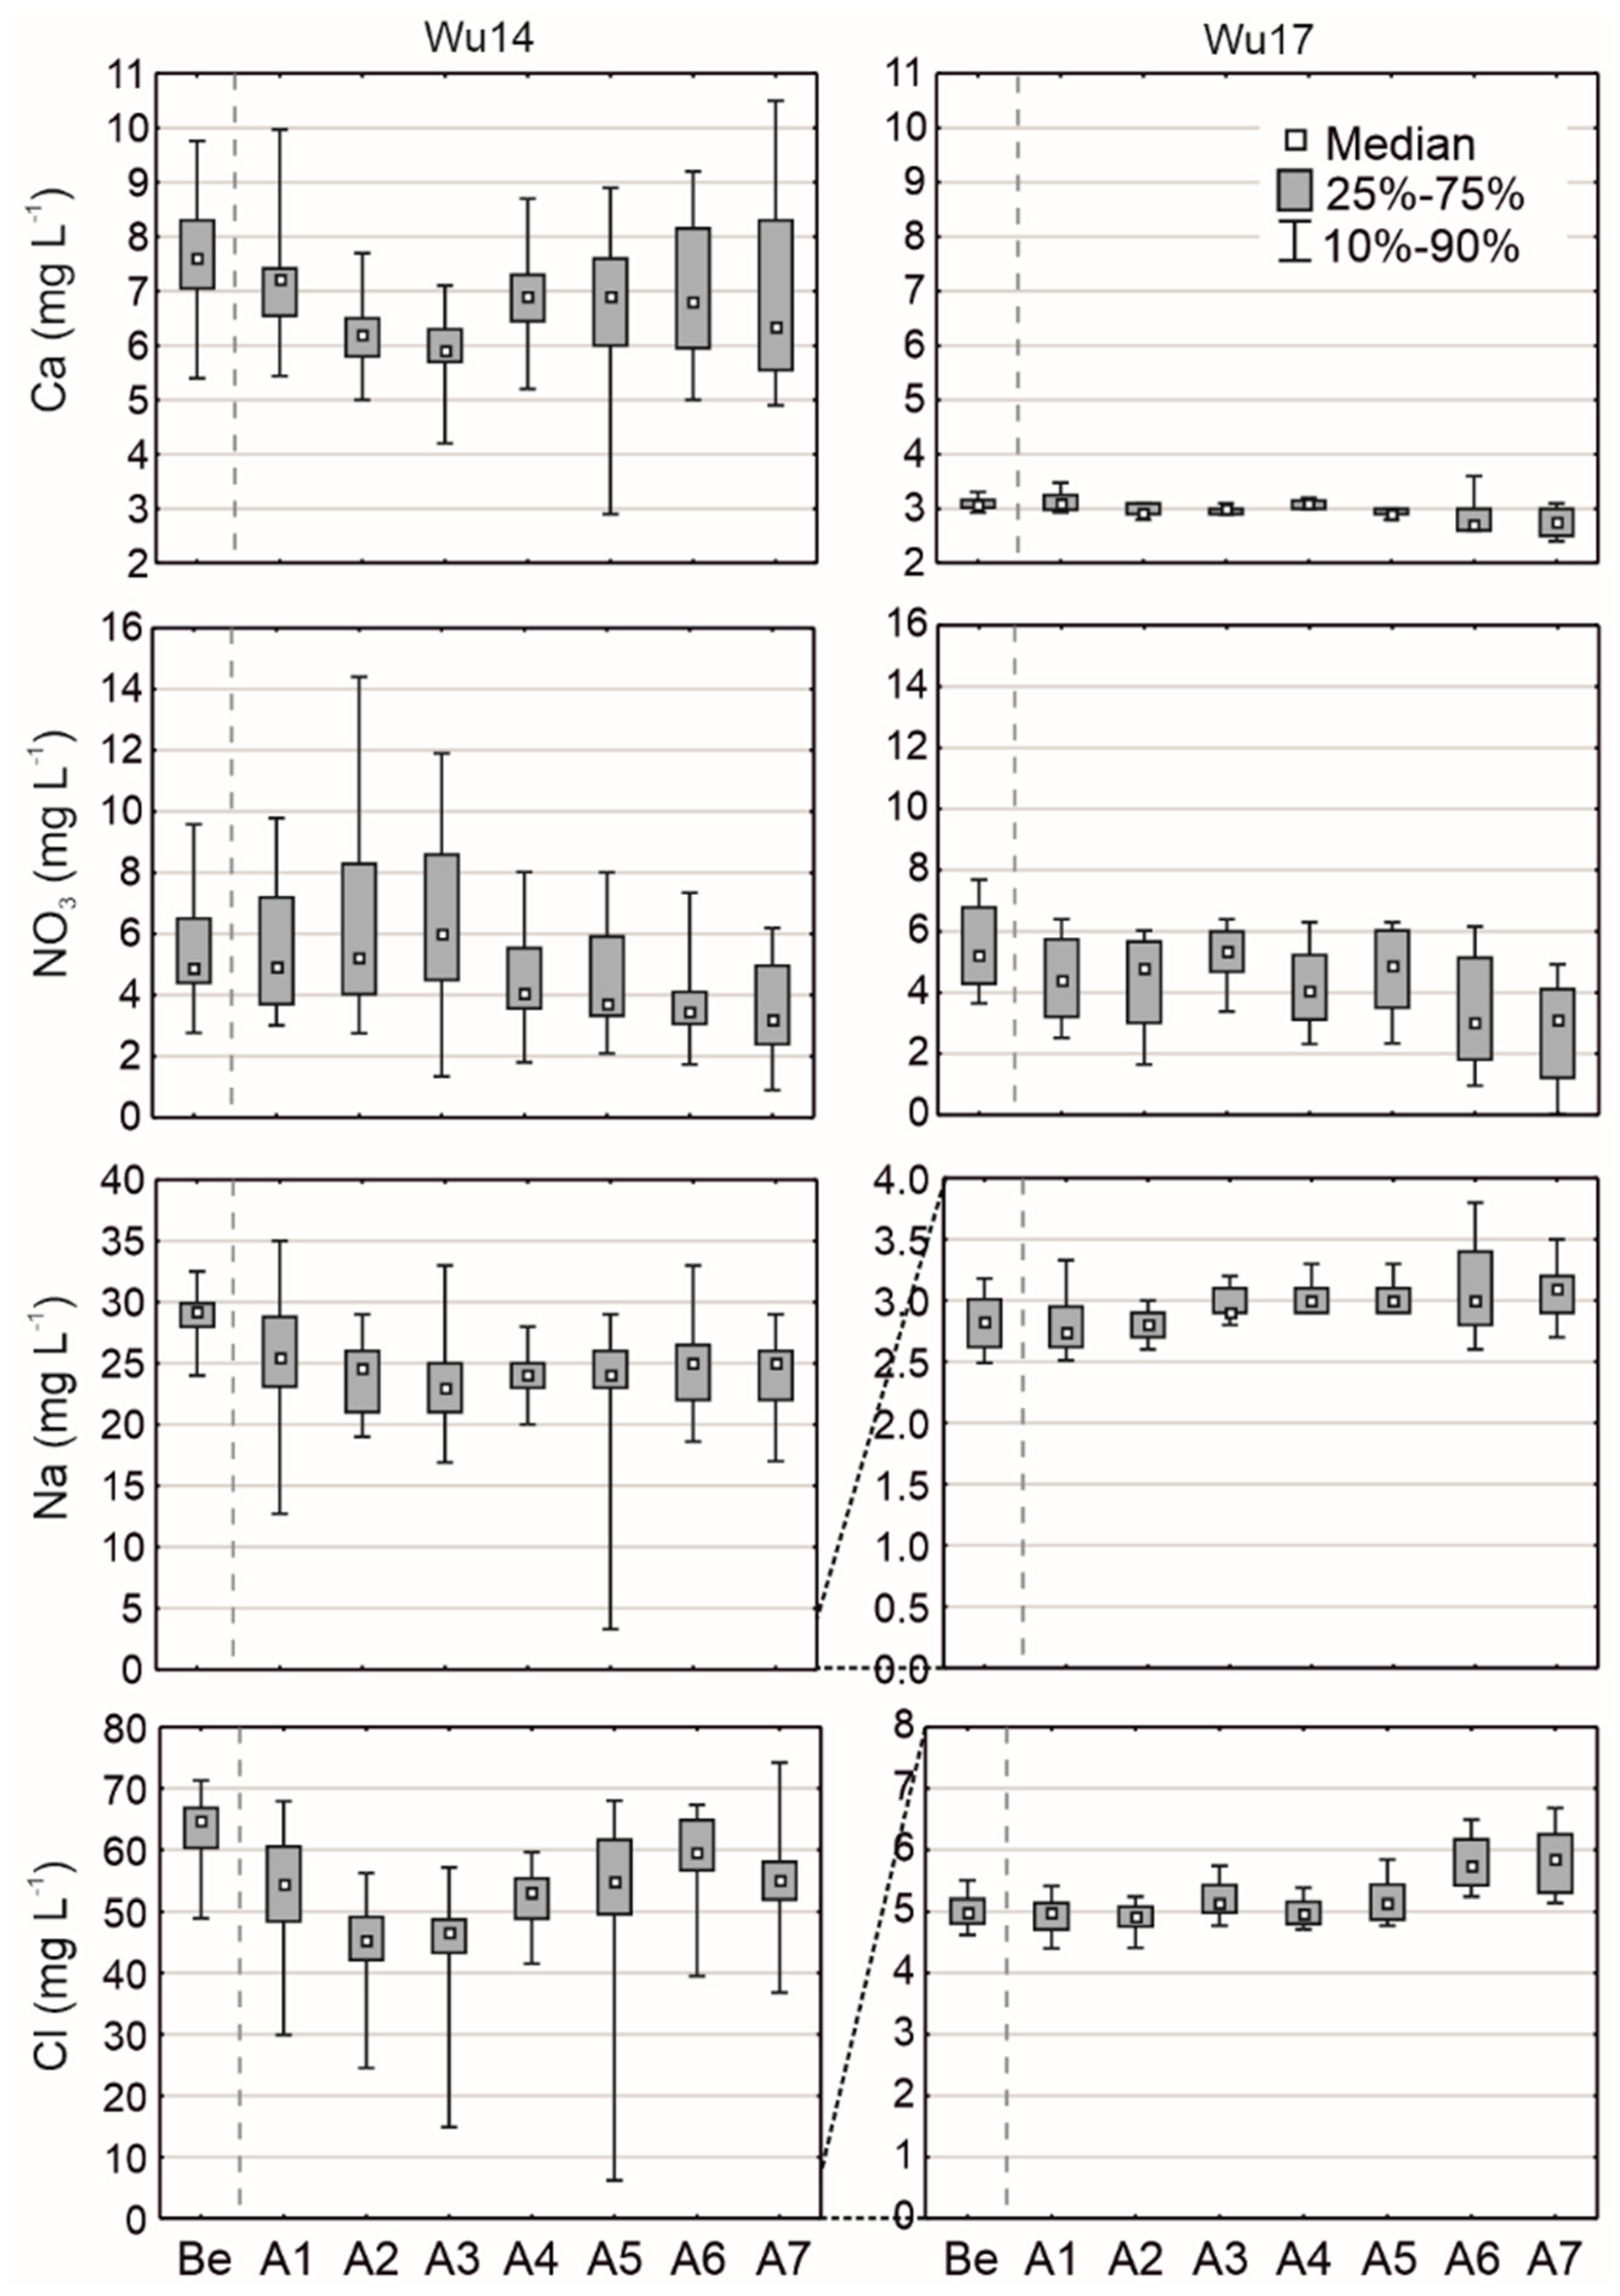
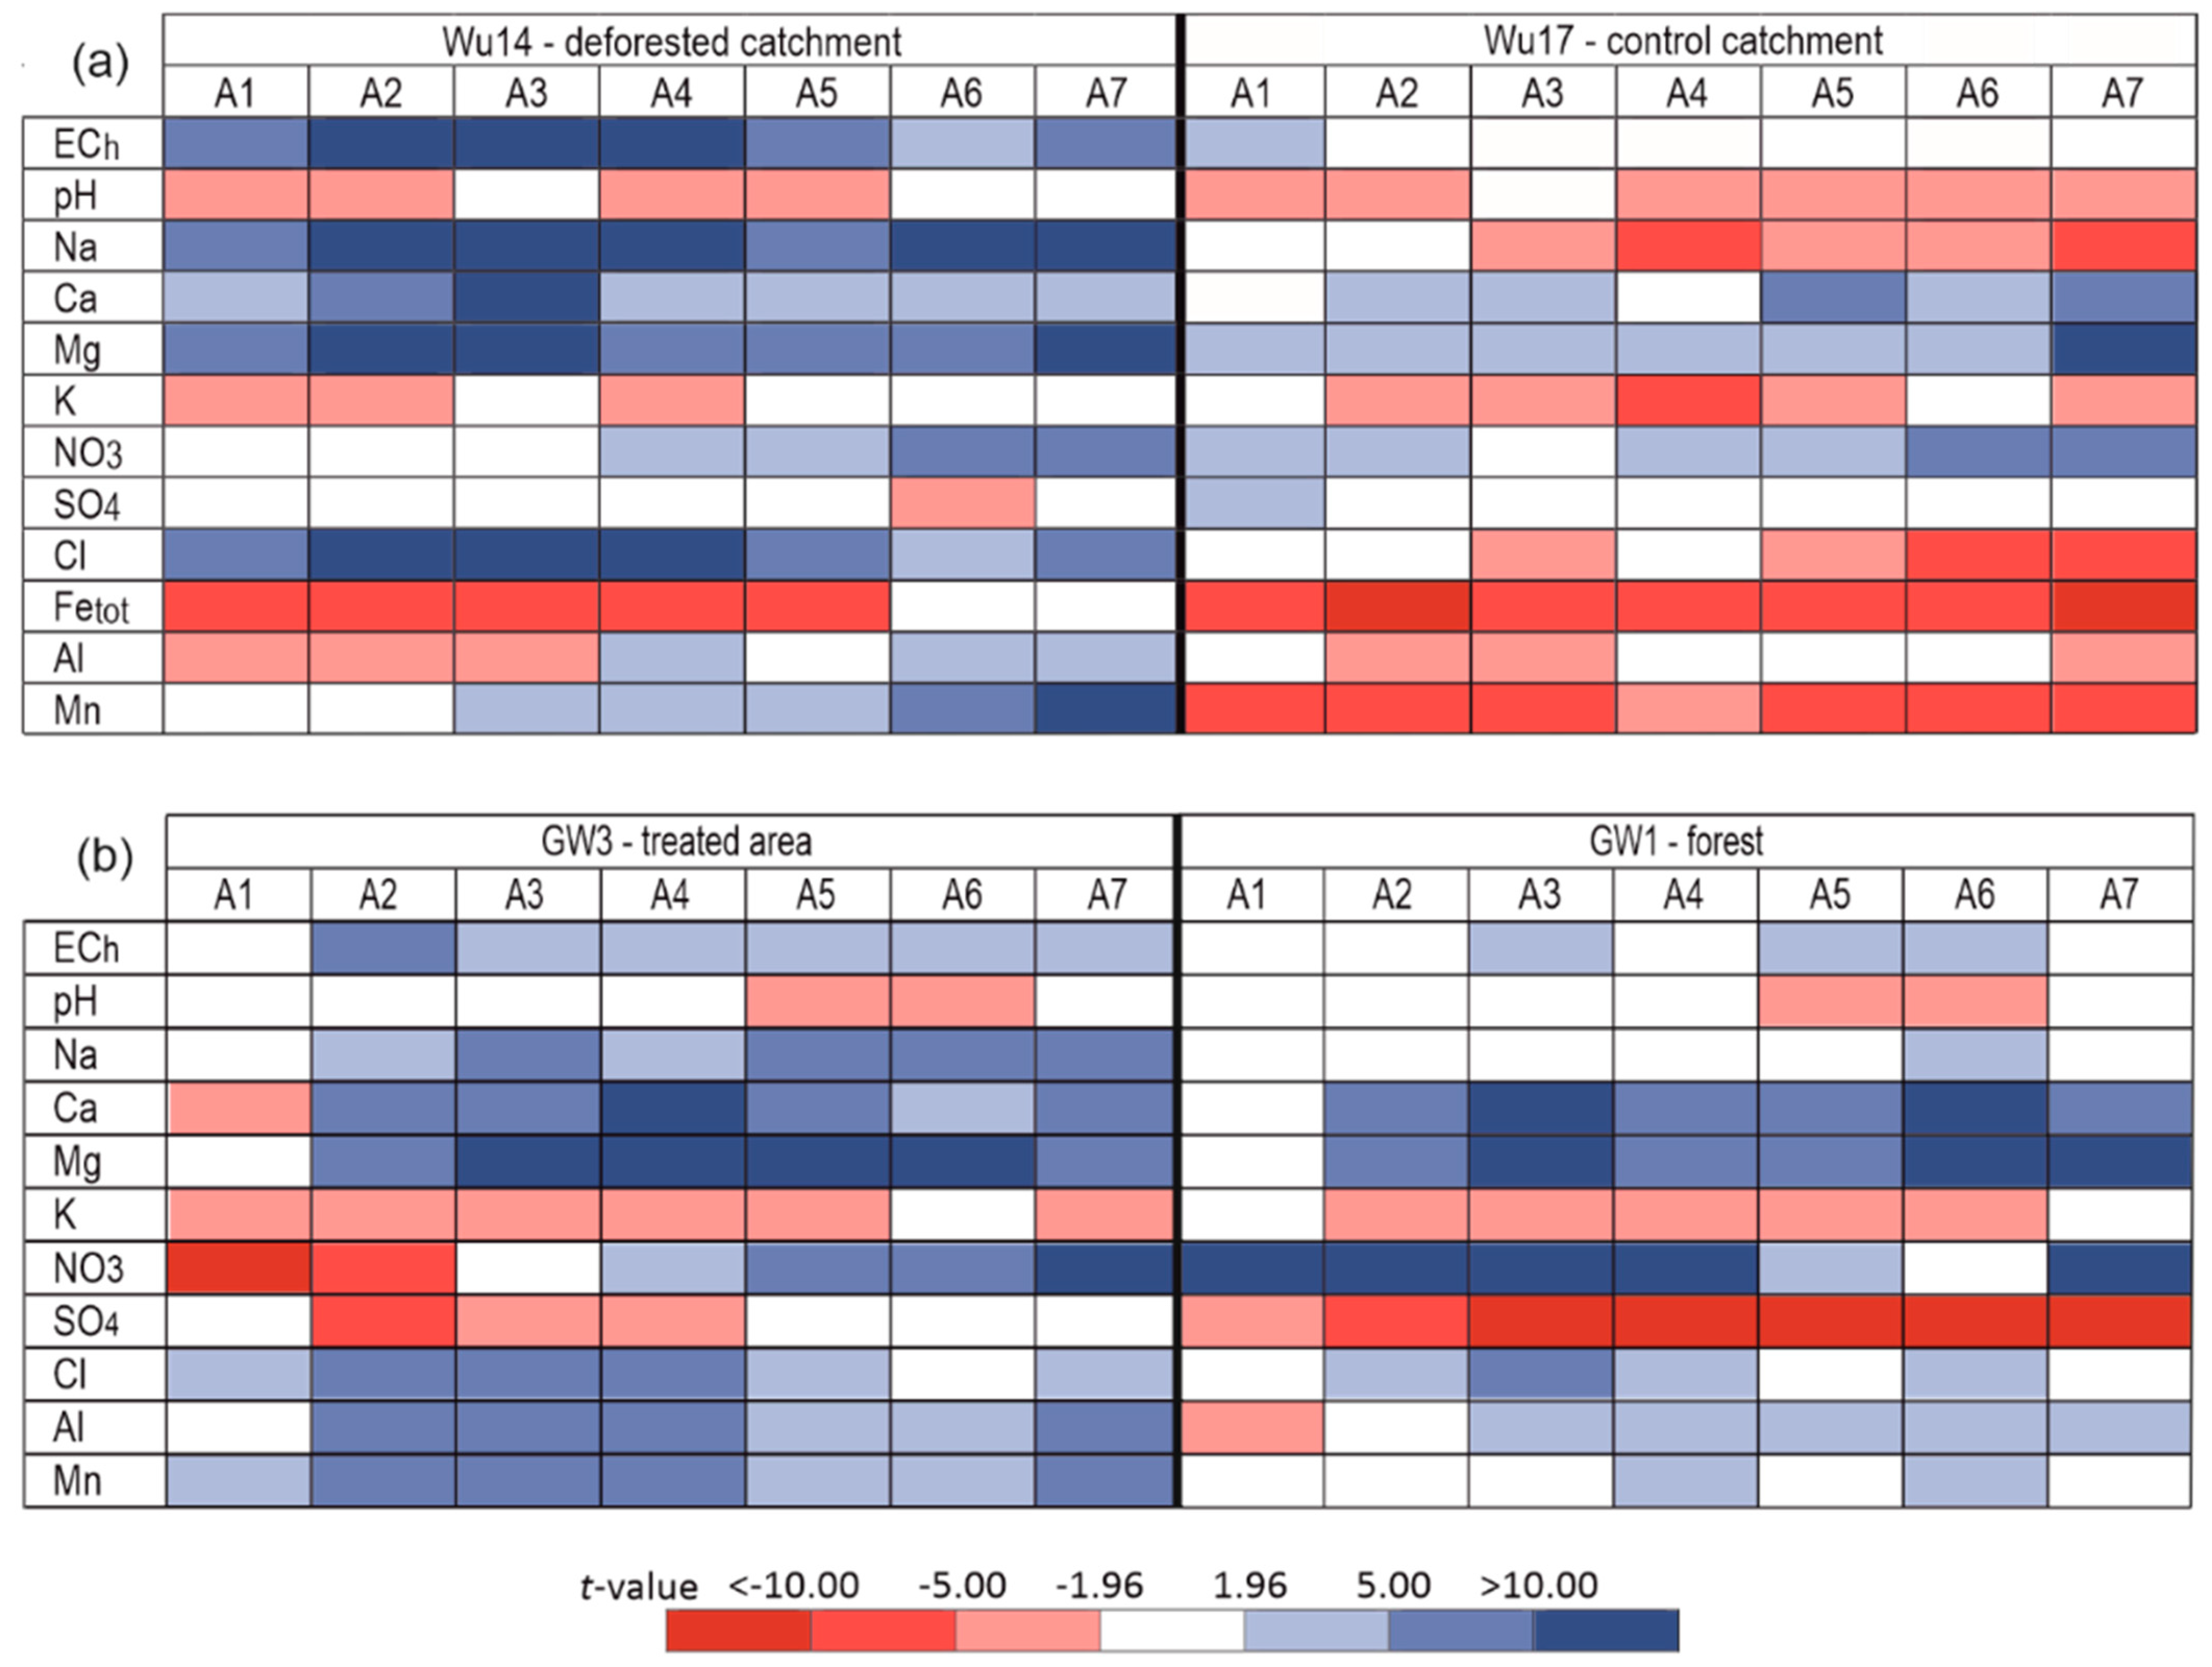
4.2. Changes in the Stream Water and Groundwater Chemistry Due to Deforestation

According to t-test analysis, the post-deforestation period was not characterized by significant differences in the precipitation totals compared to the pre-deforestation period, with the exception of the third year after deforestation (A3: 2015/2016), which was significantly wetter (Figure 5a,b). Nevertheless, in both catchments, the streamflow increased significantly in the first three years after deforestation as compared to the pre-deforestation period (Figure 5b). However, in the next four years, the flow was mostly significantly lower than in the pre-deforestation period. EC in the Wüstebach was significantly lower throughout the post-deforestation period than in the pre-deforestation period. In contrast, in the control catchment, most of the time, EC did not differ significantly from the pre-deforestation period. The temperature of both streams was significantly higher throughout the entire post-deforestation period, which was connected with a similar pattern of air temperature. However, in the post-deforestation period, the annual average air temperature did not vary much (Figure 5a). The reference evapotranspiration was the lowest in the third year after deforestation and increased slightly in the fourth year after deforestation, but the changes were not statistically significant (Figure 5a,b).
The greatest differences between both catchments in the post-deforestation period were found in EC and in the concentrations of Na+, Mn2+, and Cl (Figure 6a). The concentrations of these ions were lower in the Wüstebach throughout the entire post-deforestation period than in the pre-deforestation period, contrary to the control catchment. The EC was also lower in the Wüstebach throughout the entire post-deforestation period. At the same time, in the control catchment, EC did not differ from the pre-deforestation period for most of the time. The concentrations of Ca2+ and Mg2+ showed the same pattern in both catchments. They were significantly lower in the post-deforestation period. However, in the control catchment, the differences were smaller than in the Wüstebach (Figure 7). A similar pattern could be observed in groundwater sites, except at the forest site. There were no significant differences for Na+, Mn2+, and Cl concentrations after deforestation most of the time (Figure 6b).
Our results differ from what was usually observed in other catchments, where there was a short increase in the concentration of base cations immediately after deforestation and a return to the pre-deforestation level after a few years [10]. However, a decrease in Ca2+, Mg2+, and Na+ concentrations after deforestation was also observed in other catchments and explained by the increased runoff and associated dilution effect after the clear-cut [54]. This dilution effect is especially visible in the Wüstebach catchment in the case of Na+ and Cl ions in both surface and groundwater. Webster et al. [10] demonstrated that despite a short-term increase in the concentrations of Cl after clear-cutting, this ion generally showed a decreasing trend in both treated and control catchments. The authors explained this with the solubility and mobility mechanisms of low valence ions [10]. As the Wüstebach catchment represents a higher salt storage environment compared to the control catchment, which is not affected by road salting, Na+, and Cl ions could be tracers of changing hydrological conditions. The relatively short and low increase in Wüstebach runoff (10% in the first year after deforestation, according to Wiekenkamp et al. [28]) cannot fully explain either the long-term decline in EC and ion concentrations or the decrease in Ca2+ and Mg2+ concentrations in both streams. The decrease in ion concentration may also be associated with rapid plant regrowth [55]. However, Ney et al. [32] showed that especially in the first two years after deforestation in the Wüstebach catchment, net ecosystem exchange was positive, and gross primary production was very low in the clear-cut area, indicating the limited regrowth of vegetation during that time. The long-term dilution effect in the case of Ca2+, Mg2+, and Mn2+ in the stream and shallow groundwater in the Wüstebach catchment after deforestation probably resulted from the negative net canopy exchange (foliar leaching), as the throughfall in the deforested area equaled zero. In forest areas, throughfall is an important source of nutrients, especially base cations, to soils, and net canopy exchange for Ca2+ and Mg2+ is always positive [56]. An important source of manganese is foliar litter. As shown by previous studies, the average concentration of manganese in the spruce needle litter was 2.45 mg g−1, which was the highest value among the studied species of conifers and deciduous trees (including beech—1.63 mg g−1) [57]. The same decreasing pattern in Ca2+ and Mg2+ concentrations in the control catchment and groundwater in the forest, but less pronounced, was probably the result of planting beeches, which could contribute to increased nutrient uptake, as young trees are characterized by a higher net biomass increment compared to the older forest [58,59].
The higher K+ concentrations in the first years after harvesting in the Wüstebach could be related to deforestation, as the increase in K+ concentrations was observed in some deforested catchments [10,60]. However, higher K+ concentrations in the control stream and both groundwater sites indicate that deforestation is not the only reason for this. The increased K+ concentrations in the Wüstebach stream in the first two years were indeed due to deforestation, while increased K+ concentrations at forest sampling sites (control stream and groundwater; Figure 6) throughout the whole post-deforestation period might possibly result from beech planting in both catchments. The K+ enrichment in shallow soil was also observed up to 13 years after planting three-year-old trees in the Hubbard Brook Experimental Forest [61]. The enrichment of exchangeable K+ was associated with the biocycling connected with the regrowth of young trees that accelerated the weathering, accumulated cations in biomass, and returned K+ to the soil through decomposition [61]. In our study area, bedrock is rich in potassium (clay minerals and K-feldspars), and planting 3-to-4-year-old beeches could accelerate the weathering of K+ from the soil. Additionally, beech foliage provides a higher input of K+ to the soil through litterfall, throughfall, and stemflow compared to spruce [56] because soft beech leaves are very susceptible to leaching processes. The beech sheds its leaves every year [62]. The lack of significant differences in K+ concentrations in the Wüstebach in the last years was probably a result of the natural regrowth of new trees in the deforested area.
Although the concentrations of NO3 in the Wüstebach did not show a significant difference in the first three years after deforestation, they increased slightly (Figure 7), while NO3 concentrations in the control catchment were significantly lower at the same time (Figure 6a). The difference in NO3 concentrations were even more pronounced between groundwater sites. In the treated area, NO3 concentrations were significantly higher in the first two years after deforestation. In contrast, in the forest, they were significantly lower compared to the pre-deforestation period (Figure 6b). This indicates that partial deforestation resulted in increased NO3 concentrations in the Wüstebach stream and groundwater in the first 2–3 years after deforestation, which is in line with the findings of Robinson et al. [63]. The increase in NO3 concentration was observed in many deforested catchments and was associated with increased leaching and reduction in nutrient uptake by biomass [17,54,64].
The pH and concentrations of other ions (Fetot, SO4, Al3+) changed in a similar way in both catchments or in both groundwater sites, and they cannot be directly related to deforestation. The pH of stream water and concentrations of Fetot were significantly higher for most of the post-deforestation period in both streams. However, the pH of groundwater did not change significantly for most of the study period. The increased pH and Fetot concentrations in the studied catchment after deforestation were also reported by Wang et al. [65], who related it to climate change, especially to increased temperatures. The concentration of SO4 did not change significantly after deforestation in both streams, which also stays in line with Wang et al. [65]. However, the concentration of SO4 was significantly higher for most of the post-deforestation period in both groundwater sites. The Al3+ concentrations were significantly higher for three years after deforestation in both streams. They were then significantly lower than before deforestation in the Wüstebach (Wu14) or did not differ significantly from the pre-deforestation period in the control stream (Wu17), reflecting changes in the stream flows (Figure 5b and Figure 6a). At both groundwater sites, the Al3+ concentration was significantly lower throughout the post-deforestation period.

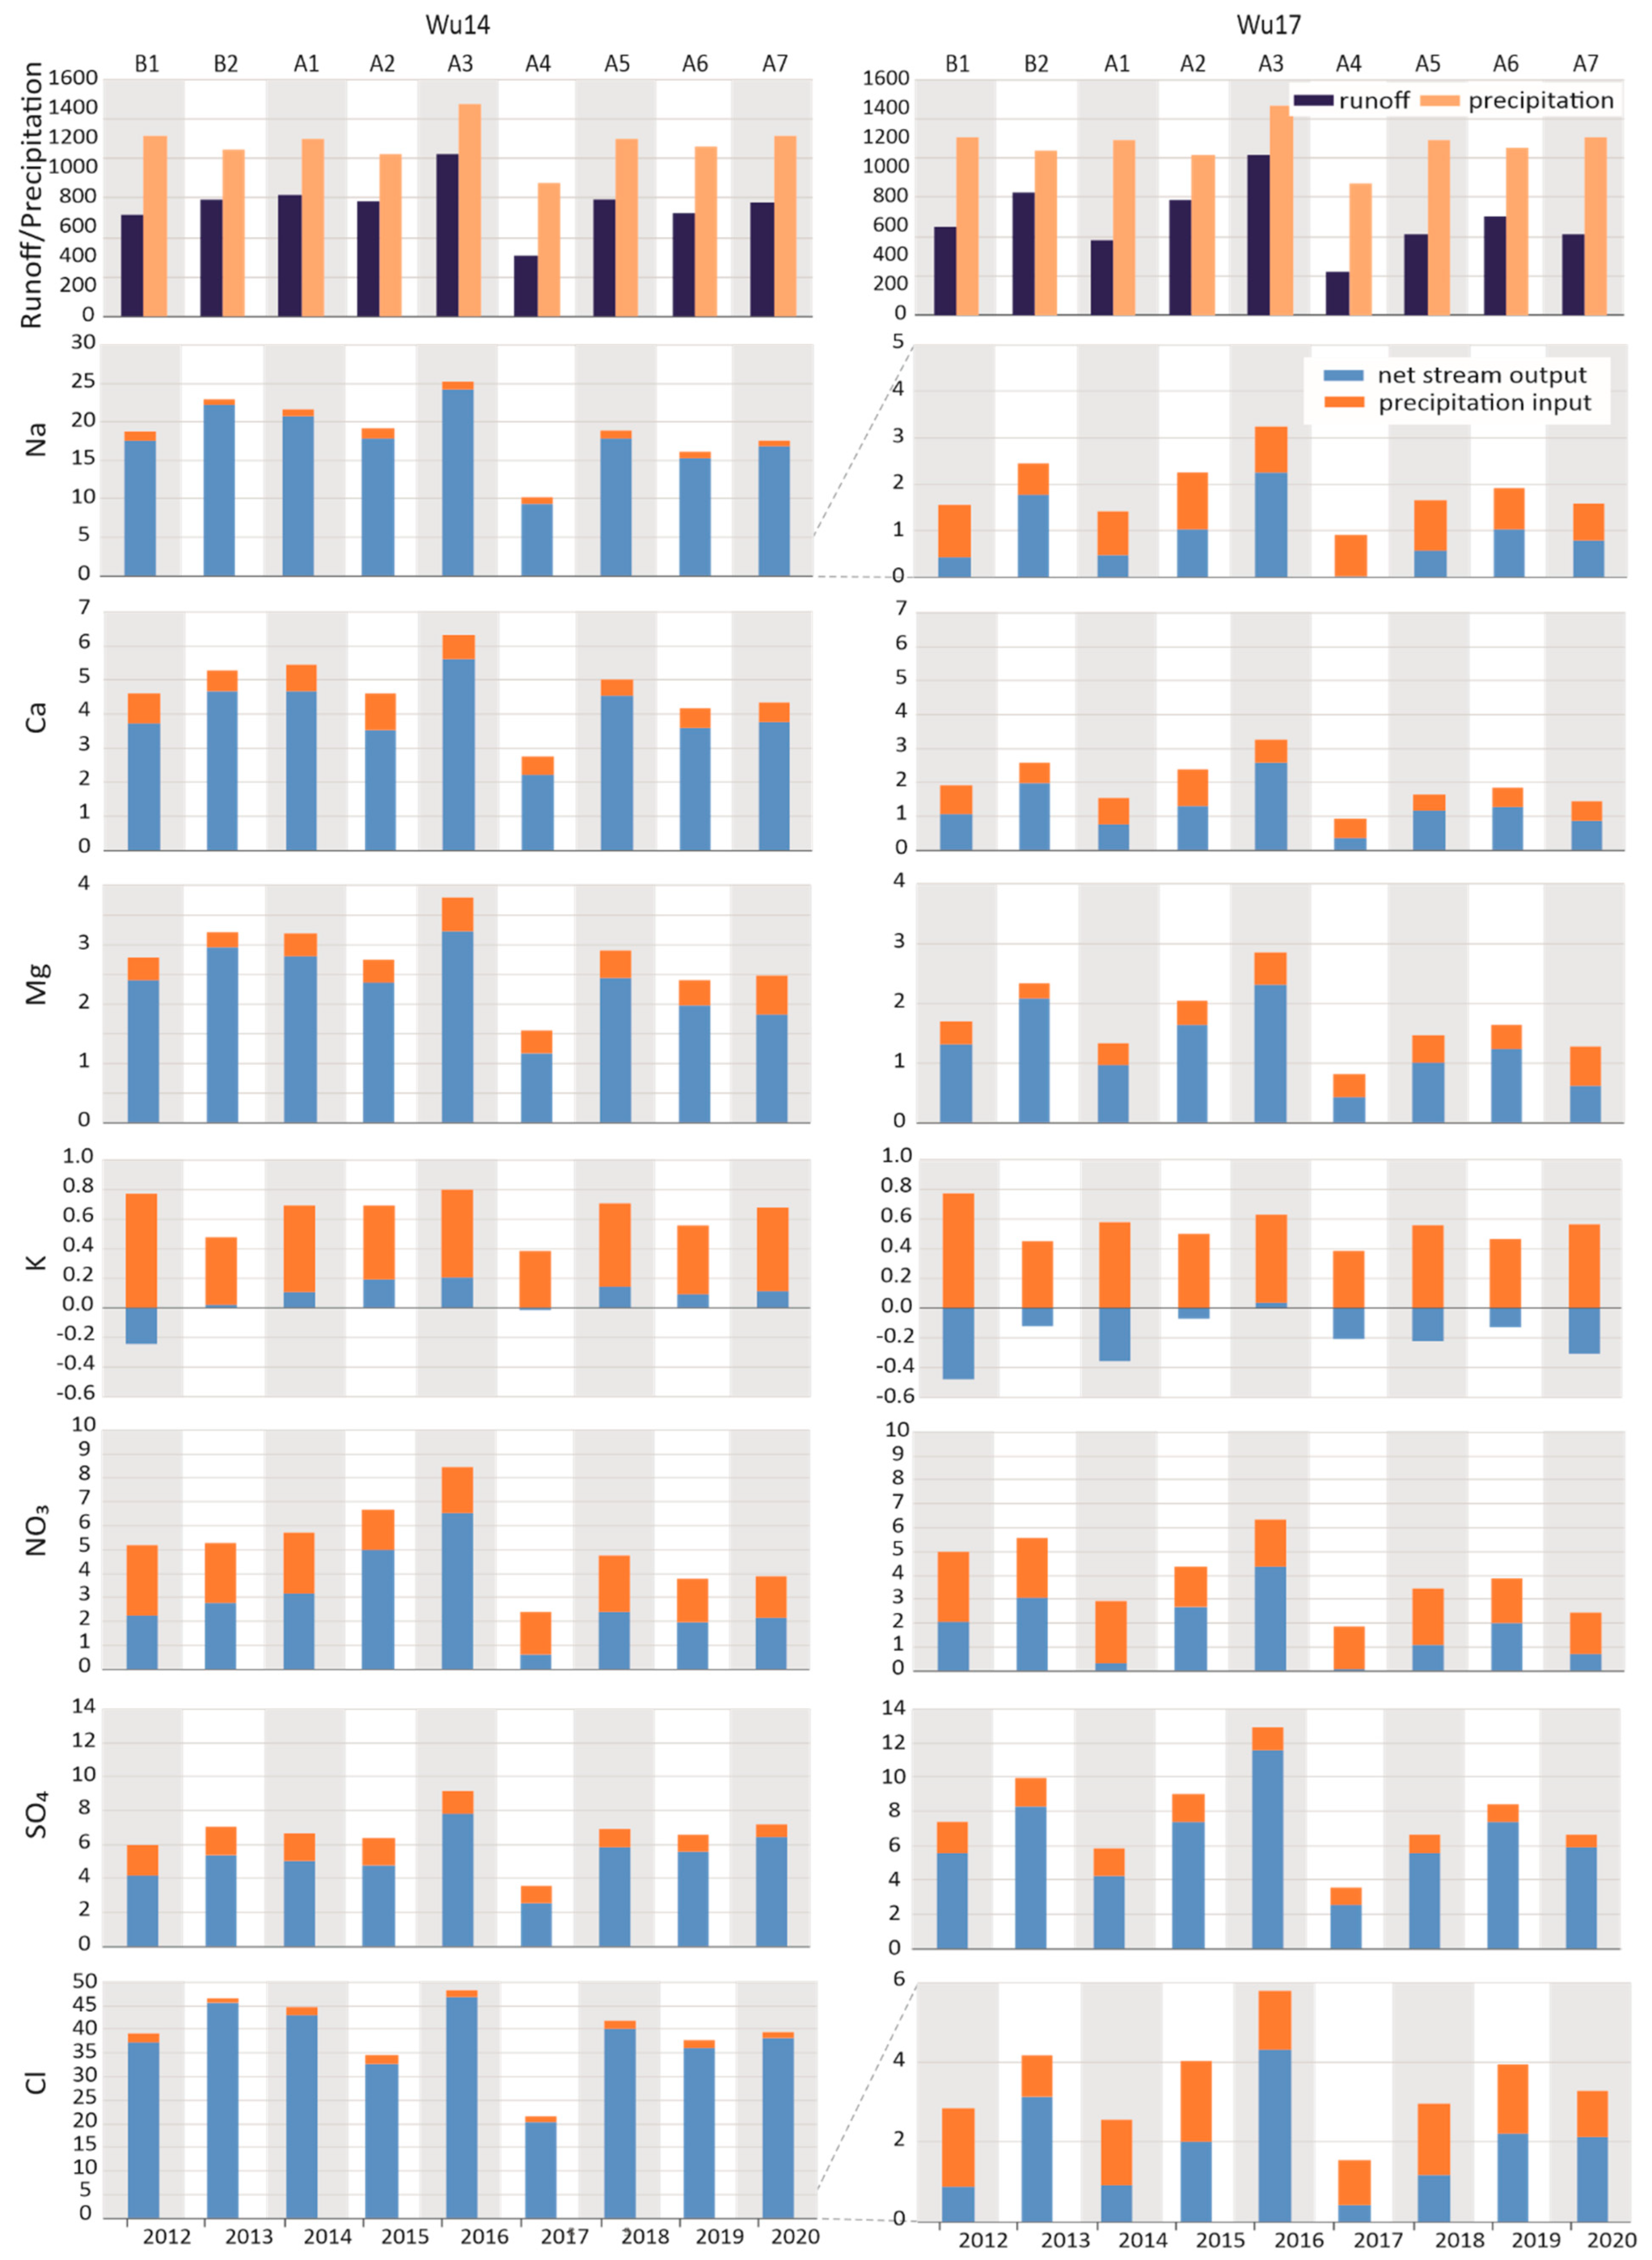
4.3. Ion Fluxes in the Headwater Catchment after Partial Deforestation

In the control catchment, the average total annual ion stream outputs were low and ranged from less than 2.0 t km−2 a−1 (Na+, Ca2+, Mg2+) to about 4.0 t km−2 a−1 (NO3 and Cl; Figure 8). Only total annual SO4 stream output was higher with approx. 8.0 t km−2 a−1 and total annual K+ stream output was usually below 0.5 t km−2 a−1. The total annual stream output of HCO3 was approx. 1.0 t km−2 a−1 and the total annual stream outputs of the rest of the ions (Al3+, Fetot, Mn2+) were very low (approx. 0.03 t km−2 a−1; not shown). Precipitation was an important source of most ions in the studied stream. About 50–60% of the total Na+, NO3, and Cl outputs and about one-third of the total Ca2+ and Mg2+ outputs are derived from the atmospheric input (Table 3). This confirms the supply of sea salt aerosols in the region [42].
In the Wüstebach, the average total annual ion outputs were at least a factor of two higher than in the control stream ranging from 2.0–3.0 t km−2 a−1 (Mg2+ and HCO3) to 5.0 t km−2 a−1 (Ca2+ and NO3), and less than 1.0 t km−2 a−1 for K+ (Figure 8). The total annual stream output of Na+ and Cl were ten times higher and were approx. 20 and 40 t km−2 a−1, respectively. However, the total SO4 stream output was lower than in the control stream (7.0 t km−2 a−1). The total annual stream outputs of Al3+, Fetot, and Mn2+ were also higher by approx. 0.1 t km−2 a−1 (not shown). Large differences between the stream outputs and the precipitation inputs in the Wüstebach, as opposed to the control catchment, support the origin of ions from road salting. This was especially true for Cl, Na+, and Ca2+, but also, to a lesser extent, for Mg2+ and K+. The share of precipitation input in the total output from the Wüstebach catchment was much smaller for these ions than in the control catchment (Table 3). Assuming that the control catchment is not affected by using de-icing salts, the road salting inputs in the Wüstebach catchment calculated based on the precipitation share for Na+, Ca2+, Mg2+, K+, and Cl ions were, on average, 88%, 53% 18%, 53%, and 90%, respectively, of the original stream output. Although these are only rough estimates, they show how significant the impact of road salting on the solute fluxes in the headwater catchment is.
The average net output (difference between total stream output and precipitation input) of K+ in the control stream was negative (−0.2 t km−2 a−1; Figure 8). This means that the total output of K+ in the control stream was lower than the atmospheric input and the share of the precipitation input of K+ was above 100%. Although we present the same inputs with open rainfall in both catchments, it can be expected that the K+ input with throughfall in the spruce forest in the control catchment was even greater. According to former studies, net canopy exchange for K+ is always positive, which indicates the throughfall input is higher than the total open rainfall input [56]. In the forested control catchment, low K+ concentrations (almost two times lower than in the Wüstebach) and low stream flow (over three times lower than in the Wüstebach) together with the large supply of K+ ions with precipitation resulted in always negative K+ net stream output. The opposite pattern was in the Wüstebach catchment, where the average net output of K+ was positive (0.1 t km−2 a−1), which might be associated not only with the delivery of de-icing salt from the road but also with partial deforestation, as the average net output of K+ before deforestation was negative. Strongly limited uptake by trees in the first three years after deforestation and washing K+ ions out to the stream together with lower input of K+ with open rainfall resulted in the positive net K+ stream output.
Changes in annual net stream outputs of most of the ions (Na+, Ca2+, Mg2+, K+, NO3, SO4, and Cl) in the control catchment followed the changes in stream runoff throughout the whole study period (Figure 8). In the Wüstebach catchment, this pattern was also present, but with some exceptions. Although there was a slight increase in stream runoff (by 5%) in the Wüstebach in the first year after deforestation (A1), most of the ion net outputs in the stream decreased by 5–7% (i.e., Na+, Mg2+, Cl, SO4). The Ca2+ net stream output did not change significantly compared to the previous year (B2). The decline in these ion outputs was even greater in the second year after deforestation (A2): from 6% for SO4 to 24% for Ca2+ and Cl, although then the runoff decreased only slightly (by 5%). A decline in solute output from the catchment area shortly after deforestation was rarely reported. Even in catchments where a decrease in ion concentration in the stream after deforestation was recorded, the ion flux rates increased as stream runoff increased [54,60]. The study area represents a nutrient-limited environment, as evidenced by the low EC in the control catchment. The main source of solutes is the atmospheric input, especially the throughfall in the spruce forest. The 22% clear-cut of the catchment area caused a dilution of surface waters with low mineralized open rainfall and, as a result, a significant decrease in ion concentrations and outputs in stream water.
The K+ and NO3 net stream outputs in the Wüstebach catchment showed a different pattern than in the control catchment. In the Wüstebach, they regularly increased in the first three years after deforestation, by 389%, 70%, and 8% respectively for K+; and by 14%, 57%, and 31% respectively for NO3, regardless of whether the stream flow was increasing or decreasing during this time (Figure 8). However, from the fourth year after deforestation to the end of the study period, changes in the K+ and NO3 net stream outputs followed changes in the stream flow. This is consistent with the increased concentrations of K+ in the first two years after deforestation and the increased concentrations of NO3 in the first three years after deforestation in the Wüstebach stream. K+ and NO3 are the ions that showed the strongest and longest response to the clear-cutting also in other catchments: the initial increase in ion concentrations was followed by a decrease [10,17].
The changes in net stream output of Al3+, Fetot, Mn2+, and HCO3 did not follow the changes in stream flow in both catchments. Moreover, the changes were identical in both catchments (Figure 9). This indicates that the fluxes of these ions were controlled to a greater extent by other environmental factors than the runoff or land cover. The fluxes of Al3+, Fetot, Mn2+, and HCO3 in the study area were generally very low, and the lack of differences between the two catchments may have resulted from generally limited sources of these ions.

5. Conclusions

The results of the research do not allow us to fully accept the hypothesis of an initial increase in the ion concentration and solute fluxes in stream water after partial deforestation. Only K+ and NO3 ions showed increasing trends in both concentrations and fluxes in the partially deforested catchment in the first two to three years after deforestation. Other ions, especially base cations (Na+, Ca2+, Mg2+), showed decreasing trends in concentrations and fluxes at the same time. The strong dilution effect of the Wüstebach stream after deforestation was due to, on the one hand, the lack of disturbance of the soil cover during logging works and limited soil erosion, and on the other hand, the reduction of the supply of solutes with precipitation in the open deforested area. The short response time of the stream’s chemistry to deforestation was likely due to the relatively small deforested area (22% of the catchment area) and the quite rapid revegetation of the deforested area two years after logging.
Significantly lower EC and concentrations of Na+, Ca2+, Mg2+, and Cl ions compared to the pre-deforestation period in the Wüstebach catchment persisted in the second half of the research period (A4–A7). This is probably the result of the growth of young native and planted trees, which take up considerable amounts of nutrients. The same pattern, decreasing in Ca2+ and Mg2+ concentrations, was observed in the control catchment, where beech trees had been planted since 2007 in 84% of the catchment area. However, Na+ and Cl concentrations increased in the post-deforestation period in the control catchment in contrast to the Wüstebach catchment. This means that in catchments where about 90% of Na+ and Cl are supplied with road salting, these ions can be treated as indicators of changes in hydrological conditions. Changes in the stream ion outputs (Na+, Ca2+, Mg2+, K+, NO3, SO4 and Cl) in the second half of the research period (A4–A7) indicate neither deforestation nor tree planting effects, but only followed the changes in the stream flow in both catchments.
Changes in the forest ecosystem, i.e., spruce die-off and species changes, are common in the Eifel region and in many places in Europe where monoculture spruce plantings had been carried out. We anticipate that in a nutrient-limited environment, spruce die-offs associated with long-term droughts and bark beetle gradation may result in a decrease in the concentration and fluxes of base cations in surface water. However, our results also show that the simultaneous planting of young broad-leaved trees with post-harvesting regrowth could create a nutrient sink that protects the catchment area from nutrient depletion.

Author Contributions

Conceptualization, E.P., K.M. and M.L.; Methodology, E.P, K.M. and H.R.B.; Formal Analysis, E.P. and K.M.; Investigation, E.P., K.M., H.R.B. and M.L.; Writing—Original Draft Preparation, E.P.; Writing—Review & Editing, K.M., H.R.B. and M.L.; Visualization, E.P. and K.M. All authors have read and agreed to the published version of the manuscript.

Funding

The research was carried out under a postdoctoral grant of the Bekker Program (PPN/BEK/2020/1/00140/U/00001) and funded by the Polish National Agency for Academic Exchange (NAWA). The results of the snowpack analysis were obtained under a research grant MINIATURA 5 (No. 2021/05/X/ST10/00415), funded by the National Science Center (NCN) Poland. All grants to E.P.

Data Availability Statement

The original datasets can be downloaded at the TERENO data portal www.tereno.net (accessed on 1 October 2022).

Acknowledgments

The authors gratefully acknowledge the TERENO (Terrestrial Environmental Observatories) funded by the Helmholtz-Gemeinschaft.

Conflicts of Interest

The authors declare no conflict of interest.

References

  1. Spiecker, H. Growth of Norway Spruce (Picea abies [L.] Karst.) under Changing Environmental Conditions in Europe. In Spruce Monocultures in Central Europe—Problems and Prospects; Klimo, E., Hager, H., Kulhavý, J., Eds.; EFI Proceedings No. 33; European Forest Institute: Joensuu, Finland, 2000; pp. 11–26. [Google Scholar]
  2. Matthes, U.; Ammer, U. Conversion of Norway Spruce (Picea abies L.) Stands into Mixed Stands with Norway Spruce and Beech (Fagus sylvatica L.)—Effects on the Stand Structure in Two Different Test Areas. In Spruce Monocultures in Central Europe—Problems and Prospects; Klimo, E., Hager, H., Kulhavý, J., Eds.; EFI Proceedings No. 33; European Forest Institute: Joensuu, Finland, 2000; pp. 71–79. [Google Scholar]
  3. European Environment Agency. European Waters—Assessment of Status and Pressures 2018; EEA Report 7; European Environment Agency: Copenhagen, Denmark, 2018; pp. 1–85.
  4. Keller, H.M. Der Chemismus kleiner Bache in teilweise bewaldeten Einzugsgebieten in der Flyschzone eines Voralpentales. Mitteilgn. Schweizerischen Anstalt forstliche Versuchswesen 1970, 46, 113–155. [Google Scholar]
  5. Swank, W.T. Stream Chemistry Responses to Disturbance. In Forest Hydrology and Ecology at Coweeta; Swank, W.T., Crossley, D.A., Jr., Eds.; Springer: New York, NY, USA, 1998; pp. 339–358. [Google Scholar]
  6. Feller, M.C. Forest harvesting and streamwater inorganic chemistry in Western North America: A review. J. Am. Water Resour. Assoc. 2005, 41, 785–811. [Google Scholar] [CrossRef]
  7. Swank, W.T.; Vose, J.M.; Elliott, K.J. Long-term hydrologic and water quality responses following commercial clearcutting of mixed hardwoods on a southern Appalachian catchment. For. Ecol. Manag. 2001, 143, 163–178. [Google Scholar] [CrossRef]
  8. Deval, C.; Brooks, E.S.; Gravelle, J.A.; Link, T.E.; Dobre, M.; Elliot, W.J. Long-term response in nutrient load from commercial forest management operations in a mountainous watershed. For. Ecol. Manag. 2021, 494, 119312. [Google Scholar] [CrossRef]
  9. Zetterberg, T.; Olsson, B.A.; Löfgren, S.; von Brömssen, C.; Brandtberg, P.-O. The effect of harvest intensity on long-term calcium dynamics in soil and soil solution at three coniferous sites in Sweden. For. Ecol. Manag. 2013, 302, 280–294. [Google Scholar] [CrossRef]
  10. Webster, K.L.; Leach, J.A.; Hazlett, P.W.; Buttle, J.M.; Emilson, E.J.S.; Creed, I.F. Long-term stream chemistry response to harvesting in a northern hardwood forest watershed experiencing environmental change. For. Ecol. Manag. 2022, 519, 120345. [Google Scholar] [CrossRef]
  11. Futter, M.N.; Ring, E.; Högbom, L.; Entenmann, S.; Bishop, K.H. Consequences of nitrate leaching following stem-only harvesting of Swedish forests are dependent on spatial scale. Environ. Pollut. 2010, 158, 3552–3559. [Google Scholar] [CrossRef]
  12. Kastendick, D.N.; Zenner, E.K.; Palik, B.J.; Kolka, R.K.; Blinn, C.R. Effects of harvesting on nitrogen and phosphorus availability in riparian management zone soils in Minnesota, USA. Can. J. For. Res. 2012, 42, 1784–1791. [Google Scholar] [CrossRef]
  13. Reuss, J.O.; Johnson, D.W. Acid Deposition and the Acidification of Soils and Waters; Springer: New York, NY, USA, 1986; pp. 1–115. [Google Scholar]
  14. Clinton, B.D. Stream water responses to timber harvest: Riparian buffer width effectiveness. For. Ecol. Manag. 2011, 261, 979–988. [Google Scholar] [CrossRef]
  15. Moldan, F.; Stadmark, J.; Fölster, J.; Jutterström, S.; Futter, M.N.; Cosby, B.J.; Wright, R.F. Consequences of intensive forest harvesting on the recovery of Swedish lakes from acidification and on critical load exceedances. Sci. Total Environ. 2017, 603–604, 562–569. [Google Scholar] [CrossRef] [Green Version]
  16. Kosmowska, A.; Żelazny, M.; Małek, S.; Stańczyk, T. Impact of deforestation on water chemistry in the western Tatras and Beskid Śląski range in the Polish Carpathians. Acta Sci. Pol. Form. Circumiectus 2018, 18, 89–99. [Google Scholar] [CrossRef]
  17. Sajdak, M.; Siwek, J.P.; Wasak-Sęk, K.; Kosmowska, A.; Stańczyk, T.; Małek, S.; Żelazny, M.; Woźniak, G.; Jelonkiewicz, Ł.; Żelazny, M. Stream water chemistry changes in response to deforestation of variable origin (case study from the Carpathians, southern Poland). Catena 2021, 202, 105237. [Google Scholar] [CrossRef]
  18. Montzka, C.; Bayat, B.; Tewes, A.; Mengen, D.; Vereecken, H. Sentinel-2 analysis of spruce crown transparency levels and their environmental drivers after summer drought in the Northern Eifel (Germany). Front. For. Glob. Change 2021, 4, 667151. [Google Scholar] [CrossRef]
  19. Röös, M.; Mauerhof, J. Nationalpark Eifel: Aktive Waldentwicklung bei Fichte und Douglasie. Natur NRW 2014, 4/14, 11–15. [Google Scholar]
  20. Zacharias, S.; Bogena, H.; Samaniego, L.; Mauder, M.; Fuß, R.; Pütz, T.; Frenzel, M.; Schwank, M.; Baessler, C.; Butterbach-Bahl, K.; et al. A network of terrestrial environmental observatories in Germany. Vadose Zone J. 2011, 10, 955–973. [Google Scholar] [CrossRef] [Green Version]
  21. Bogena, H.R.; Bol, R.; Borchard, N.; Brüggemann, N.; Diekkrüger, B.; Drüe, C.; Groh, J.; Gottselig, N.; Huisman, J.A.; Lücke, A.; et al. A terrestrial observatory approach to the integrated investigation of the effects of deforestation on water, energy, and matter fluxes. Sci. China Earth Sci. 2015, 58, 61–75. [Google Scholar] [CrossRef]
  22. Bogena, H.R.; Montzka, J.A.H.; Graf, A.; Schmidt, M.; Stockinger, M.; von Hebel, C.; Hendricks-Franssen, H.J.; van der Kruk, J.; Tappe, W.; Lücke, A.; et al. The TERENO-Rur hydrological observatory: A multiscale multi-compartment research platform for the advancement of hydrological science. Vadose Zone J. 2018, 17, 1–22. [Google Scholar] [CrossRef]
  23. Meyer, E. Geologie der Eifel; Schweizerbart: Stuttgart, Germany, 2013; pp. 28–34. [Google Scholar]
  24. Flehming, W. Mineral composition of pelitic sediments in the Rhenohercynian Zone. In Intracontinental Fold Belts; Martin, H., Eder, F.W., Eds.; Springer: Berlin, Germany, 1983; pp. 257–265. [Google Scholar]
  25. Borchardt, H. Einfluss periglazialer Deckschichten auf Abflusssteuerung am Beispel des Anthropogen Überprägten Wüstebaches (Nationalpark Eifel). Ph.D. Thesis, RWTH Aachen University, Aachen, Germany, 2012. [Google Scholar]
  26. Graf, A.; Bogena, H.R.; Drüe, C.; Hardelauf, H.; Pütz, T.; Heinemann, G.; Vereecken, H. Spatiotemporal relations between water budget components and soil water content in a forested tributary catchment. Water Resour. Res. 2014, 50, 4837–4857. [Google Scholar] [CrossRef] [Green Version]
  27. Bogena, H.R.; Stockinger, M.P.; Lücke, A. Long-term stable water isotope and runoff data for the investigation of deforestation effects on the hydrological system of the Wüstebach catchment, Germany. Hydrol. Process. 2020, 35, e14006. [Google Scholar] [CrossRef]
  28. Wiekenkamp, I.; Huisman, J.A.; Bogena, H.R.; Graf, A.; Lin, H.S.; Drüe, C.; Vereecken, H. Changes in measured spatiotemporal patterns of hydrological response after partial deforestation in a headwater catchment. J. Hydrol. 2016, 542, 648–661. [Google Scholar] [CrossRef]
  29. Deckers, J. Feinkartierung eines Fichtenforstes als Basis für ein Langzeitmonitoring. Natur NRW 2010, 4/10, 26–29. [Google Scholar]
  30. Baatz, R.; Bogena, H.R.; Hendricks Franssen, H.-J.; Huisman, J.A.; Montzka, C.; Vereecken, H. An empirical vegetation correction for soil water content quantification using cosmic ray probes. Water Resour. Res. 2015, 51, 2030–2046. [Google Scholar] [CrossRef] [Green Version]
  31. Siebers, N.; Kruse, J. Short-term impacts of forest clear-cut on soil structure and consequences for organic matter composition and nutrient speciation: A case study. PLoS ONE 2019, 14, e0220476. [Google Scholar] [CrossRef] [PubMed]
  32. Ney, P.; Graf, A.; Bogena, H.; Diekkrüger, B.; Drüe, C.; Esser, O.; Heinemann, G.; Klosterhalfen, A.; Pick, K.; Pütz, T.; et al. CO2 fluxes before and after partial deforestation of a Central European spruce forest. Agric. For. Meteorol. 2019, 274, 61–74. [Google Scholar] [CrossRef]
  33. Wiekenkamp, I.; Huisman, J.A.; Bogena, H.R.; Lin, H.S.; Vereecken, H. Spatial and temporal occurrence of preferential flow in a forested headwater catchment. J. Hydrol. 2016, 534, 139–149. [Google Scholar] [CrossRef]
  34. Allen, R.G.; Pereira, L.S.; Raes, D.; Smith, M. Crop Evapotranspiration—Guidelines for Computing Crop Water Requirements; FAO Irrigation and drainage paper 56; Food and Agriculture Organization: Rome, Italy, 1998. [Google Scholar]
  35. Mishra, P.; Singh, U.; Pandey, C.M.; Mishra, P.; Pandey, G. Application of Student’s t-test, Analysis of Variance, and Covariance. Ann. Card. Anaesth. 2019, 22, 407–411. [Google Scholar] [CrossRef] [PubMed]
  36. Schütt, B. Der Stoffhaushalt der Kall/Nordeifel—Untersuchungen zum Wasserhaushalt, Schwebstoffhaushalt und Haushalt gelöster Stoffe in einem Flußeinzugsgebiet auf silikatischen Gesteinen. Aachen. Geogr. Arb. 1993, 27, 1–357. [Google Scholar]
  37. Piper, A.M. A graphic procedure in the geochemical interpretation of water analyses. Eos Trans. Am. Geophys. Union 1944, 25, 914–928. [Google Scholar] [CrossRef]
  38. Hem, J.D. Study and Interpretation of the Chemical Characteristics of Natural Water, 3rd ed.; USGS: Alexandria, VI, USA, 1985; pp. 117–120.
  39. Armbruster, M.; Abiy, M.; Feger, K.-H. The biogeochemistry of two forested catchments in the Black Forest and the eastern Ore Mountains (Germany). Biogeochemistry 2003, 65, 341–368. [Google Scholar] [CrossRef]
  40. Ruth, O. The effects of de-icing in Helsinki urban streams, Southern Finland. Water Sci. Technol. 2003, 48, 33–43. [Google Scholar] [CrossRef] [Green Version]
  41. Kelly, V.R.; Lovett, G.M.; Weathers, K.C.; Findlay, S.E.G.; Strayer, D.L.; Burns, D.J.; Likens, G.E. Long-term sodium chloride retention in a rural watershed: Legacy effects of road salt on streamwater concentration. Environ. Sci. Technol. 2008, 42, 410–415. [Google Scholar] [CrossRef] [PubMed]
  42. Sucker, C.; von Wilpert, K.; Puhlmann, H. Acidification reversal in low mountain range streams of Germany. Environ. Monit. Assess. 2011, 174, 65–89. [Google Scholar] [CrossRef]
  43. Tiwari, A.; Rachlin, J.W. A Review of Road Salt Ecological Impacts. Northeast. Nat. 2018, 25, 123–142. [Google Scholar] [CrossRef]
  44. Ludin, L.; Bergquist, B. Effects on water chemistry after drainage of a bog for forestry. Hydrobiologia 1990, 196, 167–181. [Google Scholar] [CrossRef]
  45. Piñol, J.; Ávila, A.; Rodà, F. The seasonal variation of streamwater chemistry in three forested Mediterranean catchments. J. Hydrol. 1992, 140, 119–141. [Google Scholar] [CrossRef]
  46. Caissie, D.; Pollock, T.L.; Cunjak, R.A. Variation in stream water chemistry and hydrograph separation in a small drainage basin. J. Hydrol. 1996, 178, 137–157. [Google Scholar] [CrossRef]
  47. Siwek, J.P.; Żelazny, M.; Chełmicki, W. Influence of Catchment Characteristics and Flood Type on Relationship Between Streamwater Chemistry and Streamflow: Case Study from Carpathian Foothills in Poland. Water Air Soil Pollut. 2011, 214, 547–563. [Google Scholar] [CrossRef]
  48. Knapp, J.L.A.; von Freyberg, J.; Studer, B.; Kiewiet, L.; Kirchner, J.W. Concentration–discharge relationships vary among hydrological events, reflecting differences in event characteristics. Hydrol. Earth Syst. Sci. 2020, 24, 2561–2576. [Google Scholar] [CrossRef]
  49. Edwards, A.M.C. The variation of dissolved constituents with discharge in some Norfolk rivers. J. Hydrol. 1973, 18, 219–242. [Google Scholar] [CrossRef]
  50. Holloway, J.; Dahlgren, R.A. Seasonal and event-scale variations in solute chemistry for four Sierra Nevada catchments. J. Hydrol. 2001, 250, 106–121. [Google Scholar] [CrossRef]
  51. Bol, R.; Lücke, A.; Tappe, W.; Kummer, S.; Krause, M.; Weigand, S.; Pütz, T.; Vereecken, H. Spatio-temporal Variations of Dissolved Organic Matter in a German Forested Mountainous Headwater Catchment. Vadose Zone J. 2015, 14, 1–12. [Google Scholar] [CrossRef] [Green Version]
  52. Reimann, C.; Koller, F.; Frengstad, B.; Kashulina, G.; Niskavaara, H.; Englmaier, P. Comparison of the element composition in several plant species and their substrate from a 1,500,000-km2 area in Northern Europe. Sci. Total Environ. 2001, 278, 87–112. [Google Scholar] [CrossRef] [PubMed]
  53. Płaczkowska, E.; Wasak-Sęk, K.; Żelazny, M.; Jelonkiewicz, L.; Syvänperä, I.; Paavola, R.; Sippola, K.; Partanen, R.; Leuchner, M. Headwater chemistry in subarctic areas with different plant communities (Finnish Lapland). Episodes 2022. [Google Scholar] [CrossRef]
  54. Rosén, K.; Aronson, J.A.; Eriksson, H.M. Effects of clear-cutting on streamwater quality in forest catchments in central Sweden. For. Ecol. Manag. 1996, 83, 237–244. [Google Scholar] [CrossRef]
  55. Bormann, F.H.; Likens, G.E. Pattern and Process in a Forested Ecosystem: Disturbance, Development and the Steady State Based on the Hubbard Brook Ecosystem Study; Springer: New York, NY, USA, 1994; pp. 103–137. [Google Scholar]
  56. Johnson, D.W.; Turner, J. Nutrient cycling in forests: A historical look and newer developments. For. Ecol. Manag. 2019, 444, 344–373. [Google Scholar] [CrossRef]
  57. Berg, B.; Erhagen, B.; Johansson, M.-B.; Nilsson, M.; Stendahl, J.; Trum, F.; Vesterdal, L. Manganese in the litter fall-forest floor continuum of boreal and temperate pine and spruce forest ecosystems—A review. For. Ecol. Manag. 2015, 358, 248–260. [Google Scholar] [CrossRef]
  58. Johnson, P.L.; Swank, W.T. Studies of cation budgets in the southern Appalachians on four experimental watersheds with contrasting vegetation. Ecology 1973, 54, 70–80. [Google Scholar] [CrossRef]
  59. Vitousek, P.M.; Reiners, W.A. Ecosystem succession and nutrient retention: A hypothesis. BioScience 1975, 25, 376–381. [Google Scholar] [CrossRef]
  60. Jewett, K.; Daugharty, D.; Krause, H.H.; Arp, P.A. Watershed responses to clear-cutting: Effects on soil solutions and stream water discharge in central New Brunswick. Can. J. Soil Sci. 1995, 75, 475–490. [Google Scholar] [CrossRef]
  61. Balogh-Brunstad, Z.; Keller, C.K.; Bormann, B.T.; O’Brien, R.; Wang, D.; Hawley, G. Chemical weathering and chemical denudation dynamics through ecosystem development and disturbance. Glob. Biogeochem. Cycles 2008, 22, GB1007. [Google Scholar] [CrossRef]
  62. Rothe, A.; Huber, C.; Kreutzer, K.; Weis, W. Deposition and soil leaching in stands of Norway spruce and European Beech: Results from the Höglwald research in comparison with other European case studies. Plant Soil 2002, 240, 33–45. [Google Scholar] [CrossRef]
  63. Robinson, K.-L.; Bogena, H.R.; Cammeraat, E.; Bol, R. Effects of Deforestation on Dissolved Organic Carbon and Nitrate in Catchment Stream Water revealed by Wavelet Analysis. Front. Water 2022, 4, 1003693. [Google Scholar] [CrossRef]
  64. Houlton, B.Z.; Driscol, C.T.; Fahey, T.J.; Likens, G.E.; Groffman, P.M.; Bernhardt, E.S.; Buso, D.C. Nitrogen Dynamics in Ice Storm Damaged Forest Ecosystems: Implications for Nitrogen Limitation Theory. Ecosystems 2003, 6, 431–443. [Google Scholar] [CrossRef]
  65. Wang, Q.; Qu, Y.; Robinson, K.; Bogena, H.; Graf, A.; Vereecken, H.; Tietema, A.; Bol, R. Deforestation alters dissolved organic carbon and sulfate dynamics in a mountainous headwater catchment—A wavelet analysis. Front. For. Glob. Change 2022, 5, 1044447. [Google Scholar] [CrossRef]
Figure 1. Land cover map of the Wüstebach experimental catchment (as of 2020) and the location of the measurement and sampling sites used for this study.
Water 15 00107 g001
Figure 2. Planting areas of beech (Fagus sylvatica L.) and sycamore trees (Acer Pseudoplatanus L.) together with the planting year in the Wüstebach experimental catchment (according to unpublished data from the Eifel National Park) and the deforested area created in 2013.
Water 15 00107 g002
Figure 3. The ionic composition of stream water in the Wüstebach (Wu14) and control catchment (Wu17), groundwater on the slope (GW1) and in the riparian zone (GW3), and precipitation (P) in the pre-deforestation period.
Water 15 00107 g003
Figure 4. (a) Pearson’s correlation coefficients between stream discharge in the Wüstebach (Wu14; N = 93) and control catchments (Wu17; N = 93) and physicochemical properties of stream water in the pre-deforestation period (Sep 2011–Aug 2013). Correlations bolded are significant at p ≤ 0.05. (b) Relationship between daily streamflow (Q) and daily electric conductivity (EC) in both catchments in the pre-deforestation period (data points are shown in blue, and the black line indicates a trend line).
Water 15 00107 g004
Figure 5. (a) Annual totals of precipitation (P), reference evapotranspiration (ET0), and average annual air temperature (Ta) in the study area in the pre- (Be) and post-deforestation (A1–A7) periods. (b) Significant (colored) differences between the pre-deforestation period (Sep 2011–Aug 2013) and each year after deforestation (A1–A7) for P—precipitation, Ta—air temperature, ET0—reference evapotranspiration, Q14 and Q17—stream discharge at Wu14 and Wu17 measurement site, EC14 and EC17—water electric conductivity at Wu14 and Wu17 measurement site, Tw14 and Tw17—water temperature at Wu14 and Wu17 measurement site; average daily data for the whole period analyzed. Light, medium, and dark blue colors indicate small, medium, and large decreases, respectively (t > 1.96), and light, medium, and dark red colors indicate small, medium, and large increases, respectively (t < −1.96).
Water 15 00107 g005
Figure 6. Significant (colored) differences between the pre-deforestation period (Sep 2011–Aug 2013) and each year after deforestation (A1–A7) for (a) stream water and (b) groundwater. Average daily values for pH and concentration of ions were analyzed; ECh—water electric conductivity was measured at the time of sampling. Light, medium, and dark blue colors indicate small, medium, and large decreases, respectively (t > 1.96), and light, medium, and dark red colors indicate small, medium, and large increases, respectively (t < −1.96).
Water 15 00107 g006
Figure 7. Concentrations of selected ions (Ca2+, Na+, NO3 and Cl) in the post-deforestation period (A1–A7) compared to the pre-deforestation period (Be) in the partially deforested Wüstebach catchment (Wu14) and the control catchment (Wu17).
Water 15 00107 g007
Figure 8. Annual solute fluxes (t km−2 a−1) in stream water and precipitation together with runoff (mm) and precipitation (mm) in the partially deforested Wüstebach catchment (Wu14) and the control catchment (Wu17).
Water 15 00107 g008
Figure 9. Changes in annual discharge (Q; l s−1) and chosen ions net stream outputs (t km−2 a−1) compared to the previous year in the partially deforested Wüstebach catchment (Wu14) and the control catchment (Wu17): B2—second year before deforestation (2012/13), A1–A7—seven years after deforestation (2013/14–2019/20). Red—increase (>0 t km−2 a−1), blue—decrease (<0 t km−2 a−1).
Water 15 00107 g009
Table 1. Physical and chemical characteristics of stream water in the Wüstebach (Wu14) and the control catchment (Wu17) in the pre-deforestation period.
Wu14 Wu17
CharacteristicsMinAverageMaxSt.Dev.MinAverageMaxSt.Dev.
Q (L s−1)0.428.9875.3411.920.002.6323.453.85
Tw (°C)0.467.2714.183.540.017.1913.362.92
pH (-)4.106.287.830.764.005.897.250.62
EC (μS cm−1)122.51249.52281.0020.5042.0061.1884.006.99
Na (mg L−1)24.0028.9932.501.762.362.823.520.26
Ca (mg L−1)5.407.649.760.942.603.124.350.22
Mg (mg L−1)3.474.465.040.372.252.633.570.23
K (mg L−1)0.110.733.000.350.050.441.970.19
NO3 (mg L−1)2.765.499.581.542.785.569.171.58
SO4 (mg L−1)4.657.5810.901.648.7510.9414.801.20
Cl (mg L−1)48.9063.1371.304.963.375.016.120.40
Fe (mg L−1)0.040.110.620.080.000.020.070.02
Al (mg L−1)0.000.090.270.040.000.070.180.03
Mn (mg L−1)0.040.110.330.040.000.010.070.02
HCO3 (mg L−1)0.012.1313.513.410.043.5114.762.49
Table 2. Maximum ion concentrations (mg L−1) in the snowpack samples collected in February 2022: S_road—samples taken 1–2 m below the road, S_riparian—samples taken from the riparian zone, up to 10 m from the stream channel. Maximum ion concentrations in precipitation in February 2022 (Pfeb) are also given.
LonsNaCaMgKNO3SO4Cl
S_road393.009.941.443.061.007.00600.00
S_riparian5.630.460.670.541.202.109.40
Pfeb1.170.210.170.070.460.502.49
Table 3. The share of atmospheric input (%) in the total stream output in the Wüstebach (Wu14) and control catchment (Wu17).
LonWu14Wu17
Na556
Ca1538
Mg1628
K91176
NO34660
SO42118
Cl449
Disclaimer/Publisher’s Note: The statements, opinions and data contained in all publications are solely those of the individual author(s) and contributor(s) and not of MDPI and/or the editor(s). MDPI and/or the editor(s) disclaim responsibility for any injury to people or property resulting from any ideas, methods, instructions or products referred to in the content.

