
Sustainable Development and Efficiency Analysis of the Major Urban Water Utilities in Spain


Abstract
:1. Introduction
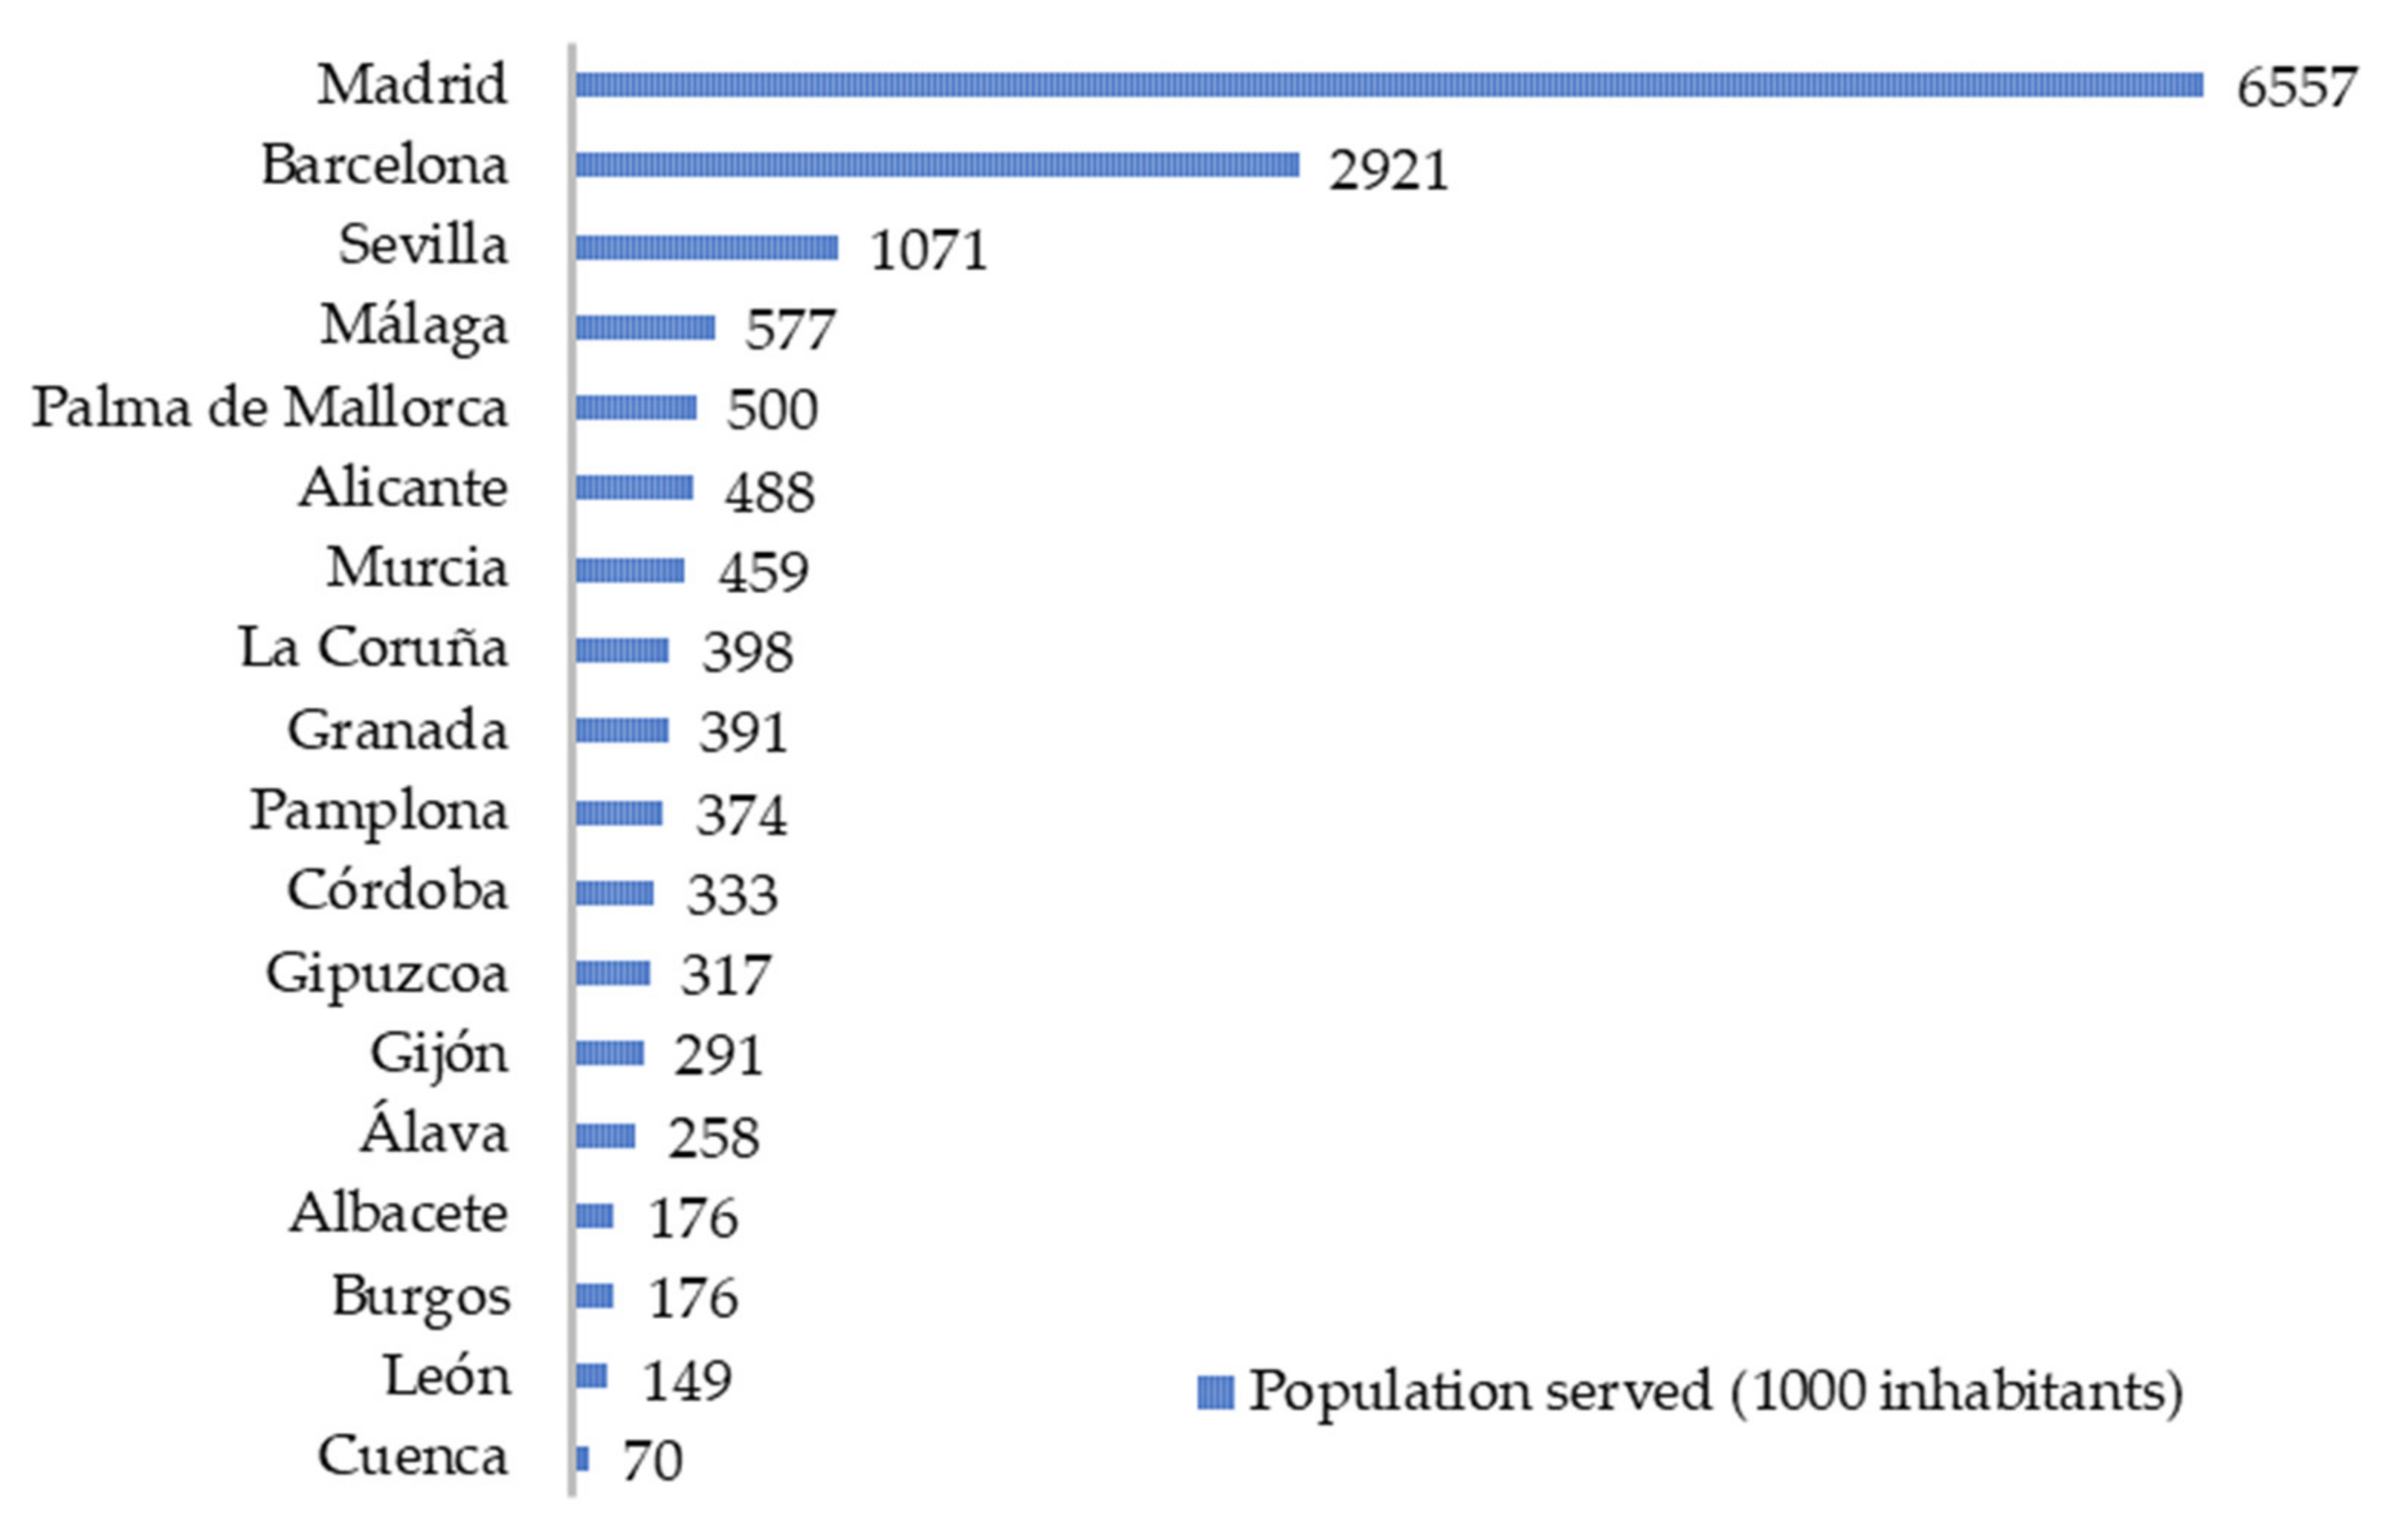
- The analysis of the largest water Spanish companies that have public ownership. These analyzed companies supply drinking water to cities with a population average of 860,000 inhabitants.
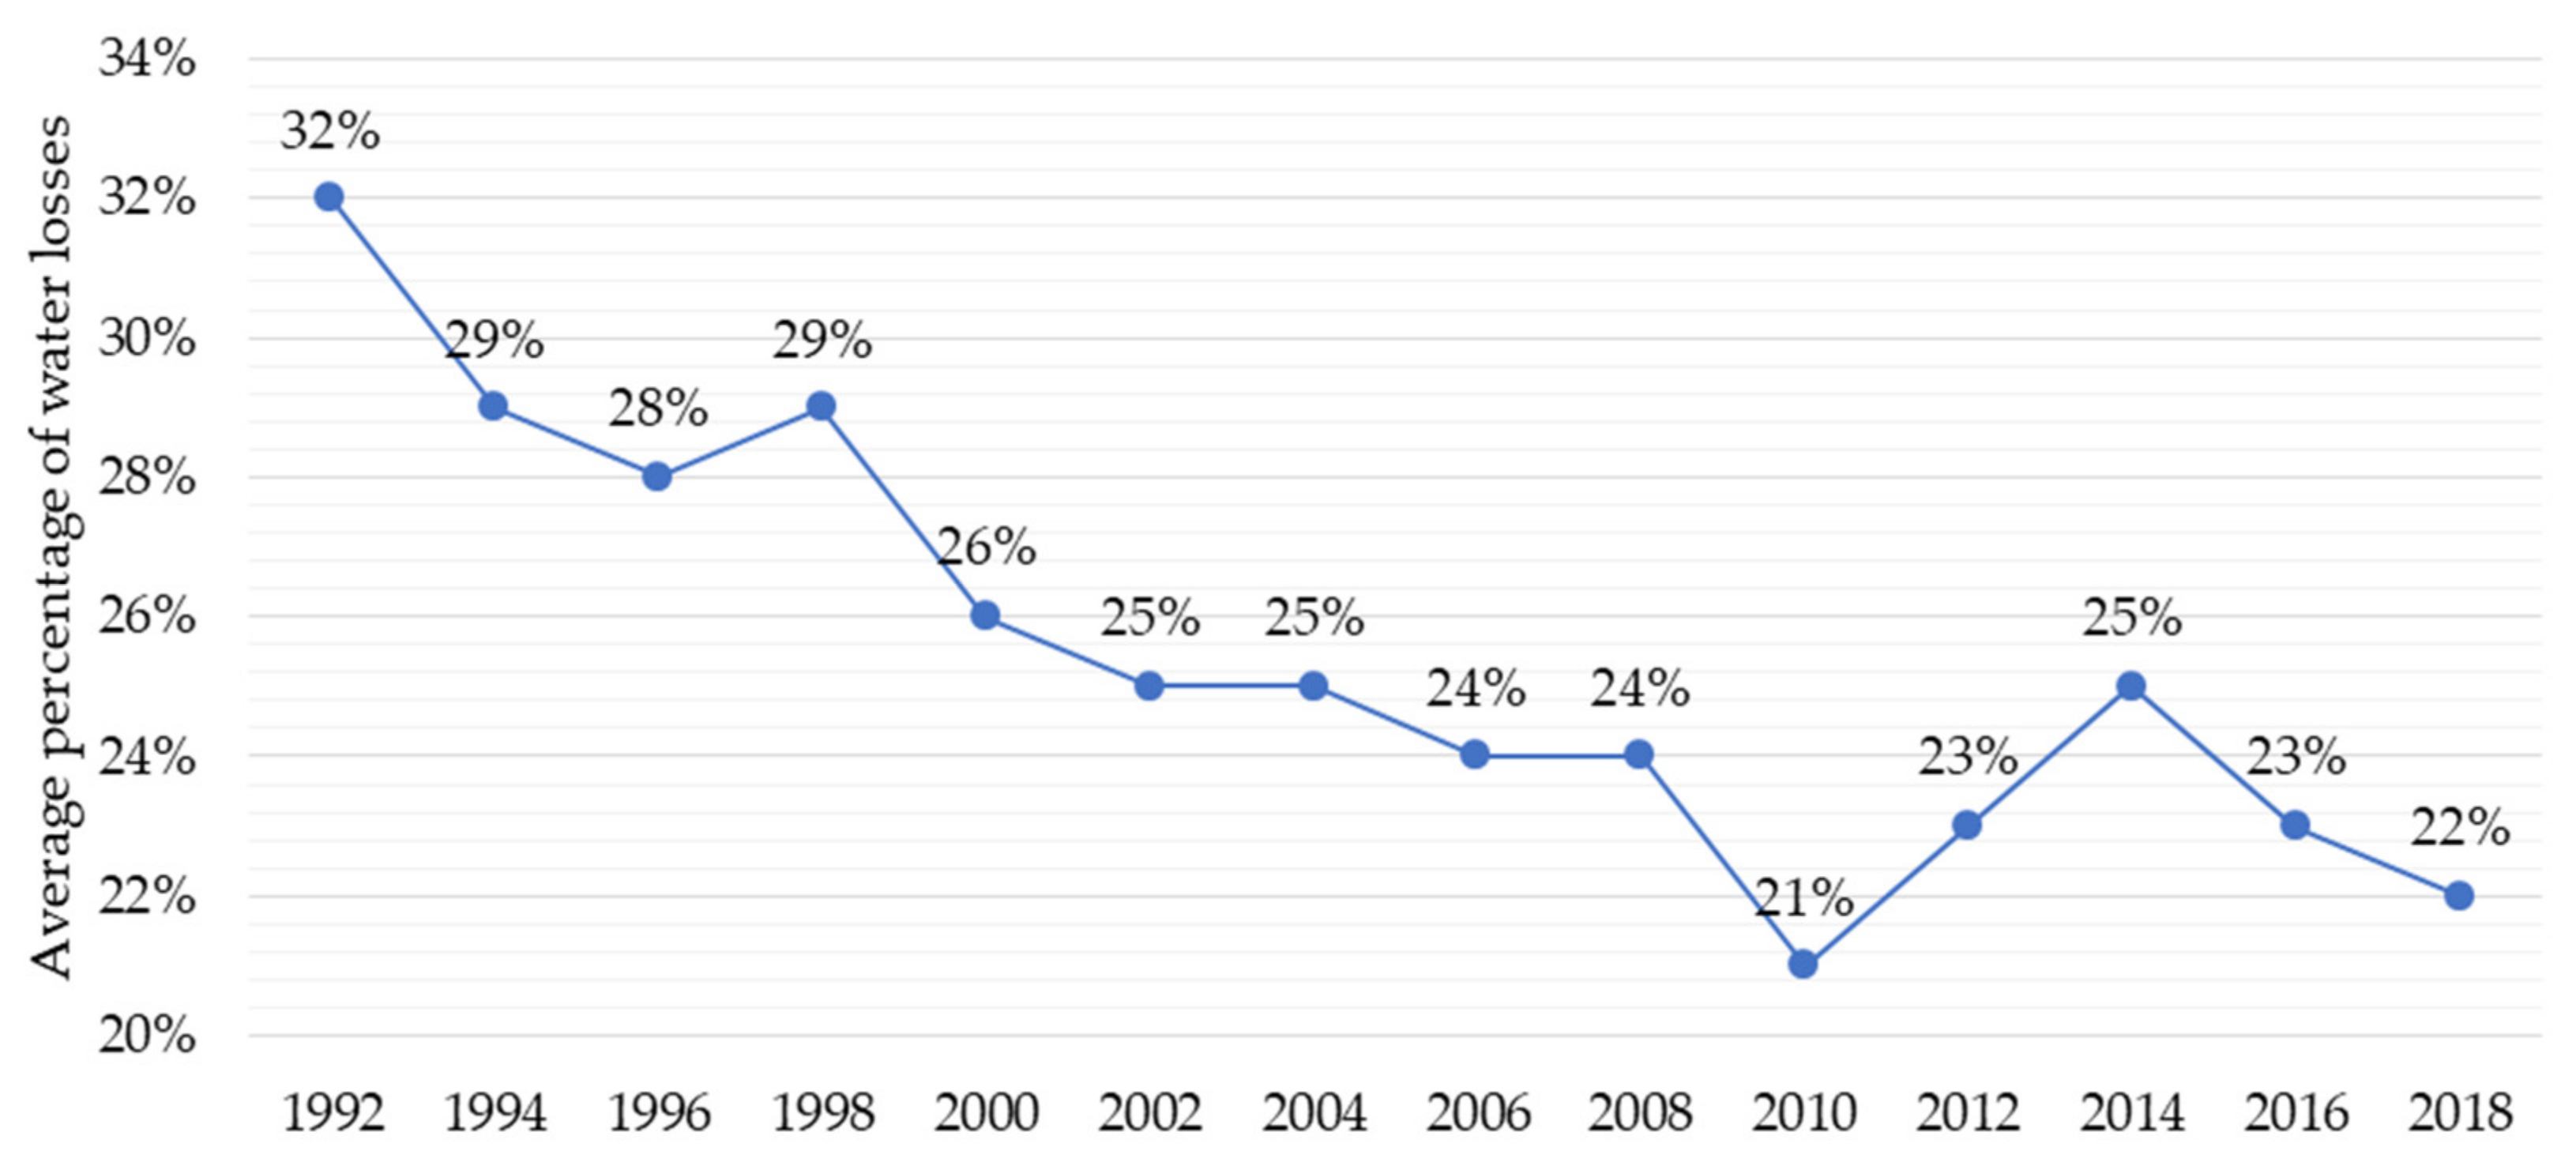
- The sustainable efficiency analysis of the water distribution networks by including the percentage of water losses as an output variable to be minimized.
2. Materials and Methods
2.1. Theoretical Frameworks of Efficiency Analyses of Water Companies
2.2. Economical and Financial Analysis of the Main Water Companies in Spain
2.3. Efficiency Analysis: Methodology and Data Description
2.3.1. Data Envelopment Analysis (DEA)
2.3.2. Data Description
2.3.3. DEA Input/Output Selection
3. Results and Discussion
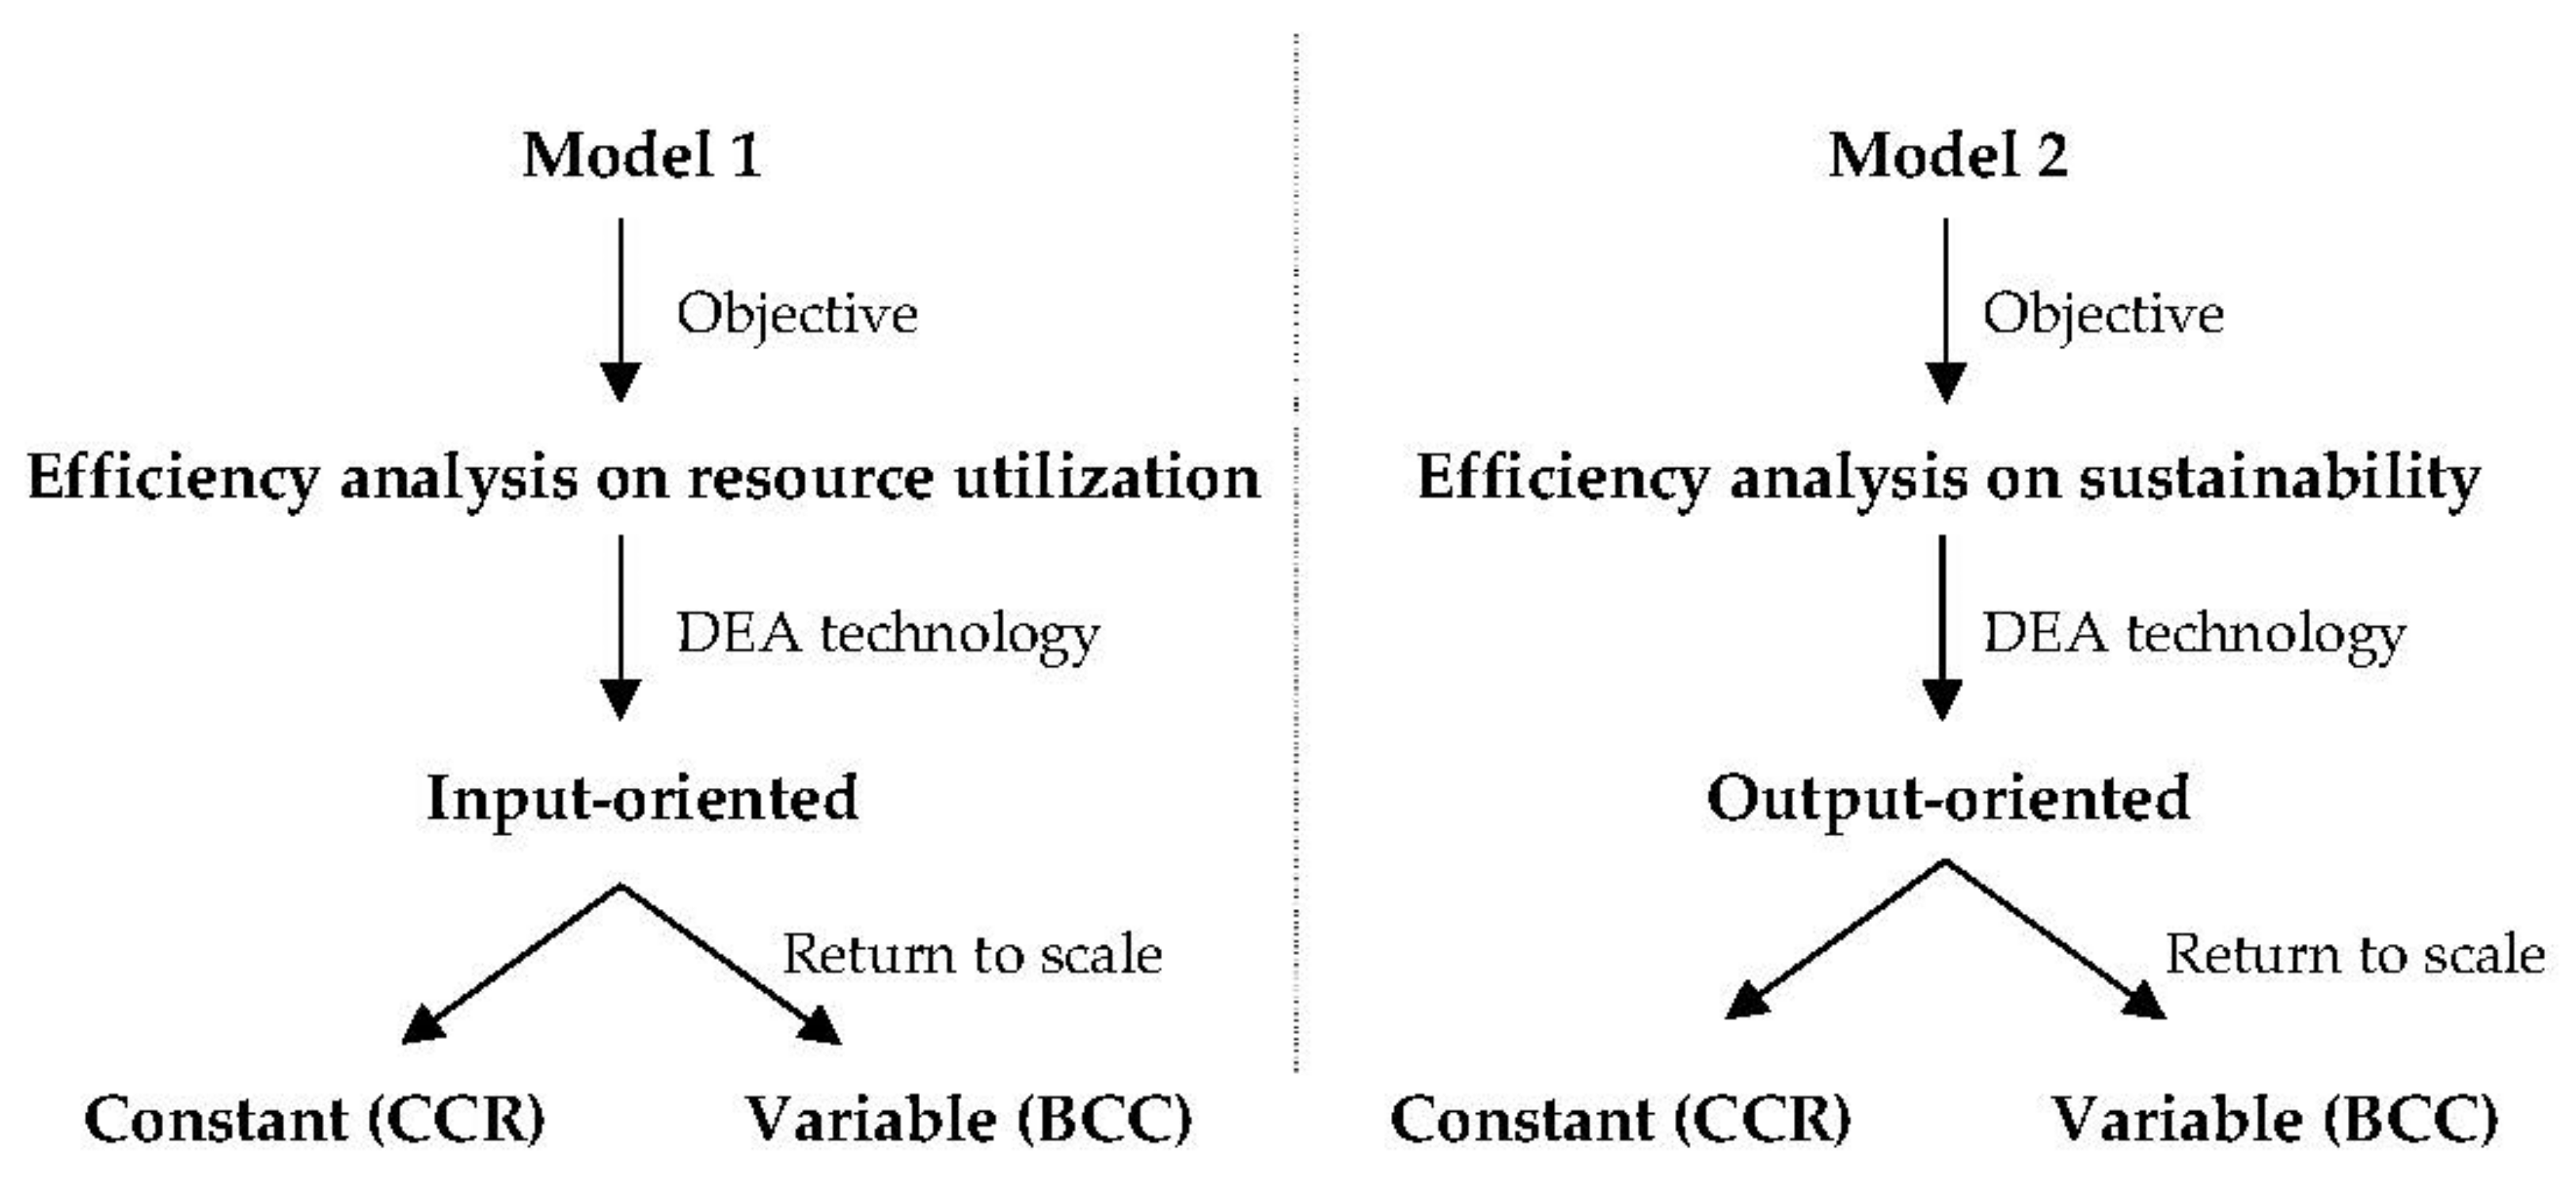
3.1. Efficiency Analysis on Resource Utilization
3.2. Efficiency Analysis on Sustainability
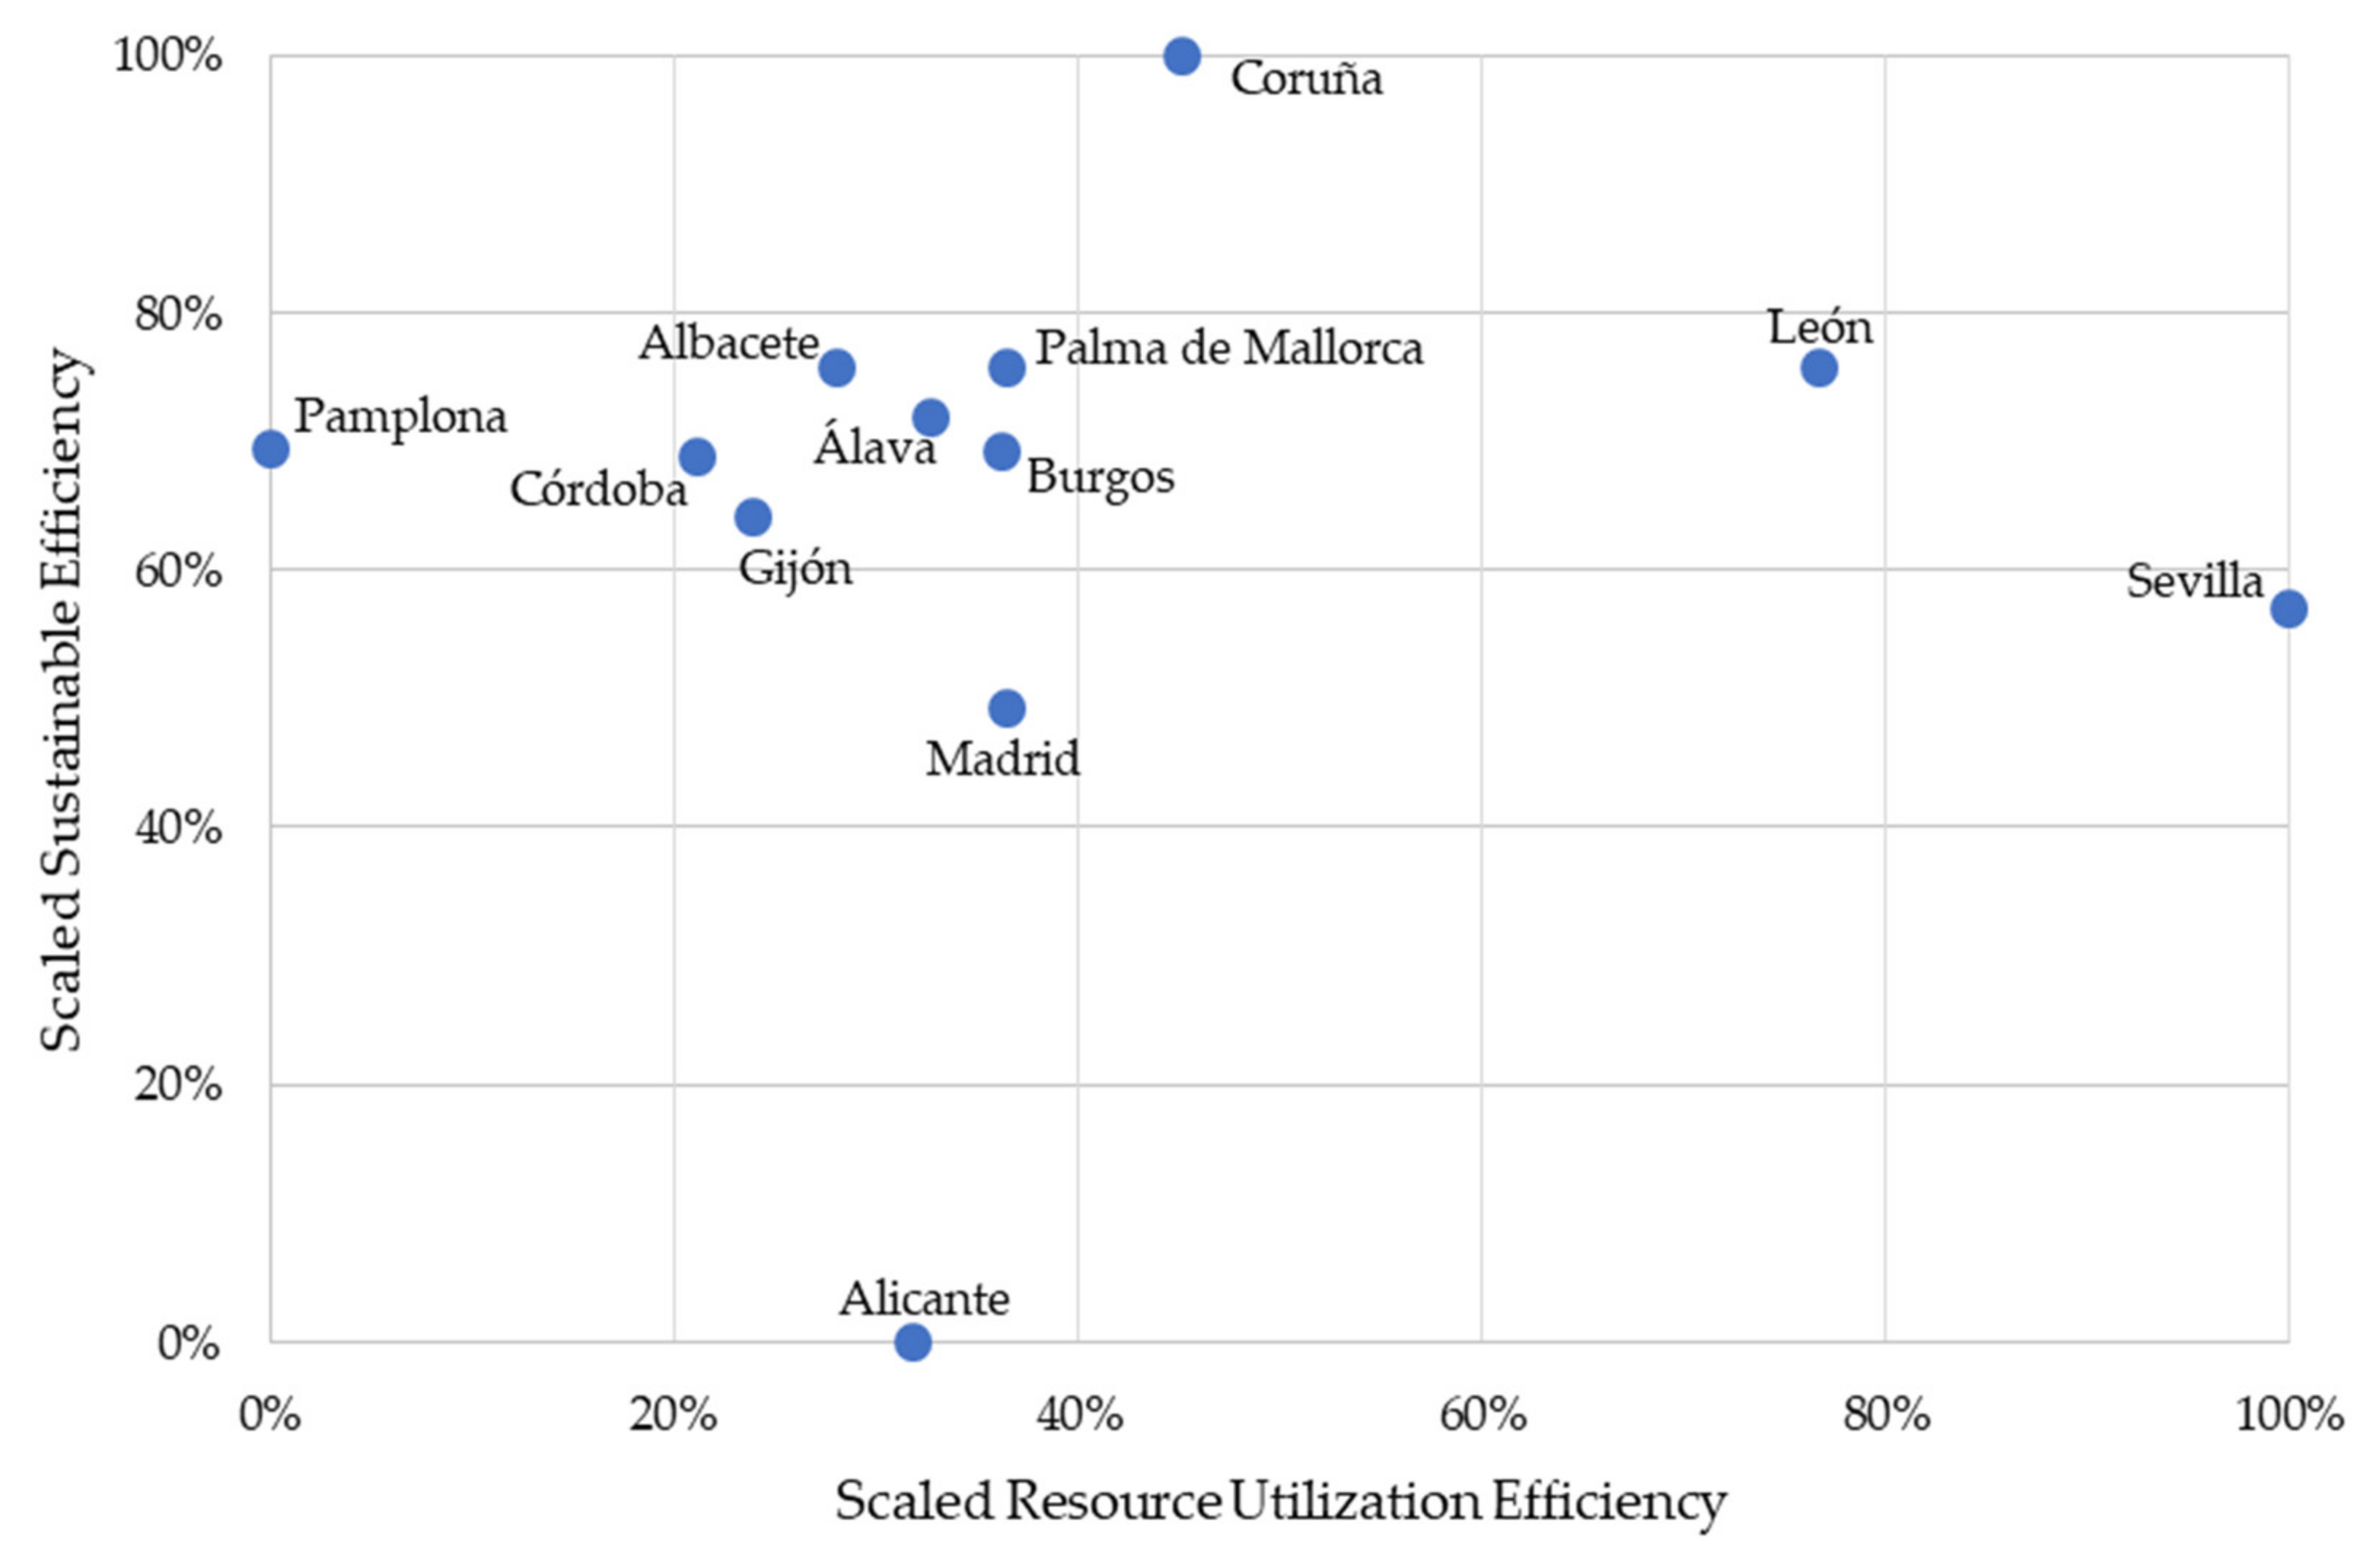
3.3. Comparison of Both Models
3.4. Discussion
4. Conclusions
- Analyzing data from public versus private management, since the research carried out by the authors show that there is a need for research on the efficiency analysis of the major urban water companies. For this purpose, data from private companies must be added to the study.
- Introducing data from sewer networks and wastewater plants in order to assess the sustainability of companies from a wider perspective.
Author Contributions
Funding
Informed Consent Statement
Acknowledgments
Conflicts of Interest
References
- United Nations Development Programme. Human Development Report 2019: Beyond Income, Beyond Averages, Beyond Today; United Nations Development Programme: New York, NY, USA, 2019. [Google Scholar]
- Picazo-Tadeo, A.J.; González-Gómez, F.; Fernandez, F.J.S. Accounting for operating environments in measuring water utilities’ managerial efficiency. Serv. Ind. J. 2009, 29, 761–773. [Google Scholar] [CrossRef]
- Suárez-Varela, M.; García-Valiñas, M.A.; González-Gómez, F.; Picazo-Tadeo, A.J. Ownership and Performance in Water Services Revisited: Does Private Management Really Outperform Public? Water Resour. Manag. 2017, 31, 2355–2373. [Google Scholar] [CrossRef]
- United Nations. Sustainable Development Goals. Available online: https://www.un.org/sustainabledevelopment/water-and-sanitation/ (accessed on 19 April 2022).
- Abbott, M.; Cohen, B. Productivity and efficiency in the water industry. Util. Policy 2009, 17, 233–244. [Google Scholar] [CrossRef]
- García-Valiñas, M.A.; Muñiz, M.A. Is DEA useful in the regulation of water utilities? A dynamic efficiency evaluation (a dynamic efficiency evaluation of water utilities). Appl. Econ. 2007, 39, 245–252. [Google Scholar] [CrossRef] [Green Version]
- Gidion, D.K.; Hong, J.; Adams, M.Z.; Khoveyni, M. Network DEA models for assessing urban water utility efficiency. Util. Policy 2019, 57, 48–58. [Google Scholar] [CrossRef]
- Lombardi, G.; Stefani, G.; Paci, A.; Becagli, C.; Miliacca, M.; Gastaldi, M.; Giannetti, B.; Almeida, C. The sustainability of the Italian water sector: An empirical analysis by DEA. J. Clean. Prod. 2019, 227, 1035–1043. [Google Scholar] [CrossRef]
- Hu, P.; Chen, N.; Li, Y.; Xie, Q. Efficiency Evaluation of Water Consumption in a Chinese Province-Level Region Based on Data Envelopment Analysis. Water 2018, 10, 793. [Google Scholar] [CrossRef] [Green Version]
- Song, M.; Wang, R.; Zeng, X. Water resources utilization efficiency and influence factors under environmental restrictions. J. Clean. Prod. 2018, 184, 611–621. [Google Scholar] [CrossRef]
- Romano, G.; Guerrini, A. Measuring and comparing the efficiency of water utility companies: A data envelopment analysis approach. Util. Policy 2011, 19, 202–209. [Google Scholar] [CrossRef]
- Singh, M.; Mittal, A.K.; Upadhyay, V. Efficient water utilities: Use of performance indicator system and data envelopment analysis. Water Supply 2014, 14, 787–794. [Google Scholar] [CrossRef]
- Dong, X.; Du, X.; Li, K.; Zeng, S.; Bledsoe, B.P. Benchmarking sustainability of urban water infrastructure systems in China. J. Clean. Prod. 2018, 170, 330–338. [Google Scholar] [CrossRef]
- Chen, C.-M.; Delmas, M.A. Measuring Eco-Inefficiency: A new frontier approach. Oper. Res. 2012, 60, 1064–1079. [Google Scholar] [CrossRef] [Green Version]
- Buafua, P.M. Efficiency of urban water supply in Sub-Saharan Africa: Do organization and regulation matter? Util. Policy 2015, 37, 13–22. [Google Scholar] [CrossRef]
- AEAS-AGA. XVI Estudio Nacional de Suministro de Agua Potable y Saneamiento en España 2020; AEAS-AGA: Madrid, Spain, 2020. [Google Scholar]
- Rodríguez-Palero, M.; Robles Velasco, A.; Barbadilla-Martín, E.; Ruiz, P.A.; Martín, J.G. Análisis económico y de tarifas del sector de aguas urbanas en España. In Proceedings of the 15th International Conference on Industrial Engineering and Industrial Management—XXV Congreso de Ingeniería de Organización, Burgos, Spain, 8–9 July 2021; pp. 205–206. [Google Scholar]
- AEAS-AGA. XV Estudio Nacional de Suministro de Agua Potable y Saneamiento en España; AEAS-AGA: Madrid, Spain, 2018; Available online: https://www.aeas.es/images/publicaciones/estudios-suministros/xv-notadeprensa.pdf (accessed on 20 February 2022).
- World Health Organization. Available online: https://www.who.int/data/gho (accessed on 7 March 2022).
- AEAS. XIV Estudio Nacional de Suministro de Agua Potable y Saneamiento en España; AEAS: Madrid, Spain, 2014; Available online: http://www.aeas.es/servlet/mgc?pg=ListNews&ret=next&news_id=1249&areaCode=publicarea&newsCategory=Noticias (accessed on 3 January 2019).
- INE. Estadística sobre el Suministro y Saneamiento del Agua; INE: Madrid, Spain, 2018. [Google Scholar]
- Charnes, A.; Cooper, W.W.; Rhodes, E. Measuring the efficiency of decision making units. Eur. J. Oper. Res. 1978, 2, 429–444. [Google Scholar] [CrossRef]
- Farrell, M.J. The Measurement of Productive Efficiency. J. R. Stat. Soc. Ser. A Gen. 1957, 120, 253–290. [Google Scholar] [CrossRef]
- Banker, R.D.; Charnes, A.; Cooper, W.W. Some Models for Estimating Technical and Scale Inefficiencies in Data Envelopment Analysis. Manag. Sci. 1984, 30, 1078–1092. [Google Scholar] [CrossRef] [Green Version]
- Bureau van Dijk. SABI: Sistema de Análisis de Balances Ibéricos. Available online: https://sabi.bvdinfo.com/version-2022221/home.serv?product=sabineo& (accessed on 1 February 2022).
- Khalid, B.; Naumova, E. Digital transformation SCM in view of Covid-19 from Thailand SMEs perspective. Glob. Chall. Digit. Transform. Mark. 2021, 2021, 49–66. [Google Scholar]
- Pietrucha-Urbanik, K.; Rak, J. Consumers’ Perceptions of the Supply of Tap Water in Crisis Situations. Energies 2020, 13, 3617. [Google Scholar] [CrossRef]
- Barykin, S.Y.; Kapustina, I.V.; Sergeev, S.M.; Kalinina, O.V.; Vilken, V.V.; de la Poza, E.; Putikhin, Y.Y.; Volkova, L.V. Developing the physical distribution digital twin model within the trade network. Acad. Strateg. Manag. J. 2021, 20, 1–18. [Google Scholar]


| Reference | Case study | No. DMUs | Methodology | |
|---|---|---|---|---|
| [6] | García-Valiñas and Muñiz (2007) | Spain, 1985–2000 | 3 | DEA-CCR |
| [2] | Picazo-Tadeo et al., (2009) | Spain, 2001 | 34 | DEA-BCC and SFA |
| [11] | Romano and Guerrini (2011) | Italy, 2007 | 43 | DEA-CCR and BCC |
| [12] | M. Singh et al., (2014) | India, 2005 | 13 | DEA-CCR |
| [3] | Suárez-Varela et al., (2017) | Spain, 2013 | 77 | DEA and others |
| [9] | Hu et al., (2018) | China, 2014 | 31 * | Adaptation of DEA-CCR |
| [10] | Song et al., (2018) | China, 2006–2015 | 30 * | DEA |
| [13] | Dong et al., (2018) | China, 2014 | 157 * | DEA-BCC |
| [8] | Lombardi et al., (2019) | Italy, 2011–2013 | 68 | DEA-CCR and BCC |
| [7] | Gidion et al., (2019) | Tanzania, 2014–2015 | 40 | Network DEA-BCC |
| Ref. | Orientation | Inputs (Number: Description) | Outputs (Number: Description) |
|---|---|---|---|
| [6] | Input | 2: Operational costs and density of rainfall | 3: WDN length, water supplied, and population served |
| [2] | Input | 4: WDN length, WSN length, labor, and operational costs | 3: Water supplied, collected, and treated wastewater |
| [11] | Input | 4: Cost of material, labor, services, and leases | 2: Water supplied and population served |
| [12] | Input | 2: Expenditure and labor | 2: Water supplied and no. connections |
| [3] | Input | 3: WDN length, labor, and operational costs | 2: Water supplied and population served |
| [9] | Radial (ratio model) | 5: Domestic water cons., industrial water cons., agricultural water cons., fixed assets, and labor | 2: GDP 3 and COD 4 |
| [10] | Output | 3: Fixed asset investment, labor, and water cons. | 2: GDP 3 and COD 4 |
| [13] | Input | 7: Fixed asset investment (WTP 1), fixed asset investment (WWTP 2), WDN length, WSN length, WDN elect. cons., WWTP elect. cons., and sludge production | 5: Water supplied, wastewater treated, COD 4, suspended solids removed, and nitrogen removed |
| [8] | Input and Output | 5: Capital expenditure, cost of material, labor, services, and leases | 3: WDN length, water supplied, and % of water delivered |
| [7] | N.M. 5 | 3: Percentage of non-revenue water, labor costs, and labor per connections. | 3: Population served, service continuity, and no. connections. |
| Variable | Description |
|---|---|
| xLEN | Total length of the water distribution network |
| xCAPEX | Capital expenditure |
| xCOST | Cost of material |
| xLABOR | Number of employees or staff |
| xPOP | Population served |
| xWDEL | Volume of treated water delivered |
| x% | Percentage of water delivered (1% of water losses or non-registered water) |
| Variable | Units | No. Samples | Mean | Std | Min | Max |
|---|---|---|---|---|---|---|
| xLEN | km | 18 | 2376 | 3901 | 54 | 17,699 |
| xCAPEX | 103 € | 18 | 10,800 | 15,339 | −3623 | 58,036 |
| xCOST | 103 € | 18 | 31,878 | 57,470 | 410 | 209,054 |
| xLABOR | persons | 18 | 494 | 692 | 30 | 2924 |
| xPOP | persons | 18 | 861,584 | 1,513,735 | 70,000 | 6,556,593 |
| xWDEL | 103 m3 | 16 | 68,147 | 116,932 | 10,257 | 488,270 |
| x% | % | 12 | 85 | 4 | 77 | 91 |
| Model and DEA-Technology | Inputs | Outputs |
|---|---|---|
| Model 1 (input-oriented) | xLEN xCAPEX xLABOR xCOST | yPOP yWDEL |
| Model 2 (output-oriented) | xLEN xPOP xWDEL xCAPEX | y% |
| UWU | DEA-CCR | DEA-BCC | Ranking | |
|---|---|---|---|---|
| DEA-CCR | DEA-BCC | |||
| Sevilla | 136.1% | 869.9% | 1 | 1 |
| León | 130.6% | 393.7% | 2 | 4 |
| Coruña | 125.4% | 134.6% | 3 | 6 |
| Gipuzkoa | 100.0% | 832.1% | 4 | 2 |
| Palma de Mallorca | 100.0% | 100.0% | 5 | 9 |
| Cuenca | 100.0% | 690.0% | 6 | 3 |
| Burgos | 96.4% | 99.1% | 7 | 11 |
| Álava | 85.9% | 88.2% | 8 | 13 |
| Barcelona | 83.7% | 157.9% | 9 | 5 |
| Madrid | 79.5% | 100.0% | 10 | 10 |
| Granada | 76.6% | 102.2% | 11 | 8 |
| Murcia | 76.3% | 113.9% | 12 | 7 |
| Albacete | 73.5% | 75.0% | 13 | 15 |
| Gijon | 62.7% | 65.4% | 14 | 16 |
| Alicante | 53.8% | 85.5% | 15 | 14 |
| Málaga | 51.4% | 93.5% | 16 | 12 |
| Córdoba | 49.7% | 59.4% | 17 | 17 |
| Pamplona | 25.4% | 28.9% | 18 | 18 |
| UWU | DEA-CCR | DEA-BCC | Rankings | |
|---|---|---|---|---|
| DEA-CCR | DEA-BCC | |||
| León | 47.4% | 100.0% | 1 | 2 |
| Albacete | 80.9% | 100.0% | 2 | 3 |
| Palma de Mallorca | 100.0% | 100.0% | 3 | 4 |
| Burgos | 118.9% | 101.3% | 4 | 6 |
| Álava | 132.4% | 100.8% | 5 | 5 |
| Coruña | 142.2% | 95.4% | 6 | 1 |
| Gijon | 161.6% | 102.3% | 7 | 9 |
| Córdoba | 179.4% | 101.4% | 8 | 8 |
| Pamplona | 208.8% | 101.3% | 9 | 7 |
| Alicante | 278.3% | 116.1% | 10 | 12 |
| Sevilla | 644.8% | 103.8% | 11 | 10 |
| Madrid | 3764.6% | 105.4% | 12 | 11 |
Publisher’s Note: MDPI stays neutral with regard to jurisdictional claims in published maps and institutional affiliations. |
© 2022 by the authors. Licensee MDPI, Basel, Switzerland. This article is an open access article distributed under the terms and conditions of the Creative Commons Attribution (CC BY) license (https://creativecommons.org/licenses/by/4.0/).
Share and Cite
Robles-Velasco, A.; Rodríguez-Palero, M.; Muñuzuri, J.; Onieva, L. Sustainable Development and Efficiency Analysis of the Major Urban Water Utilities in Spain. Water 2022, 14, 1519. https://doi.org/10.3390/w14091519
Robles-Velasco A, Rodríguez-Palero M, Muñuzuri J, Onieva L. Sustainable Development and Efficiency Analysis of the Major Urban Water Utilities in Spain. Water. 2022; 14(9):1519. https://doi.org/10.3390/w14091519
Chicago/Turabian StyleRobles-Velasco, Alicia, María Rodríguez-Palero, Jesús Muñuzuri, and Luis Onieva. 2022. "Sustainable Development and Efficiency Analysis of the Major Urban Water Utilities in Spain" Water 14, no. 9: 1519. https://doi.org/10.3390/w14091519
APA StyleRobles-Velasco, A., Rodríguez-Palero, M., Muñuzuri, J., & Onieva, L. (2022). Sustainable Development and Efficiency Analysis of the Major Urban Water Utilities in Spain. Water, 14(9), 1519. https://doi.org/10.3390/w14091519