Article

Hydrogeochemical Characteristics of Bottled Waters Sourced from Bedrock Aquifers in South Korea: Evaluation of Water Type and Natural Background Levels

1
Department of Earth and Environmental Sciences, College of Science, Korea University, Seoul 02841, Korea
2
Smart Subsurface Environment Management Research Center, Department of Earth and Environmental Sciences, College of Science, Korea University, Seoul 02841, Korea
3
Korea Environment Institute, Sejong 30147, Korea
4
Jeju Province Development Corporation, Jeju City 63345, Korea
5
National Institute of Environmental Research, Incheon 22689, Korea
*
Author to whom correspondence should be addressed.
Water 2022, 14(9), 1457; https://doi.org/10.3390/w14091457
Submission received: 3 April 2022 / Revised: 28 April 2022 / Accepted: 29 April 2022 / Published: 3 May 2022
(This article belongs to the Section Hydrogeology)

Abstract

:
The hydrogeochemical properties of bottled waters (n = 37) were examined to evaluate the factors governing their quality and to suggest the natural background levels (NBLs) of groundwater. The bottled waters were sourced from bedrock aquifers of various geological types and analyzed for 14 physicochemical parameters and 48 trace elements. The bottled waters mainly consisted of the Ca-HCO3 type with low TDS (mean = 158.4 mg/L; n = 33) regardless of geological type, indicating low degrees of water–rock interaction. The results of principal component analysis (PCA) showed that these waters were characterized by the dissolution of calcite and Ca-plagioclase (PC1) and the weathering of Na-plagioclase and cation exchange (PC2). The PCA results with low concentrations of TDS and F (mean = 0.4 mg/L) revealed that the waters represent slightly mineralized groundwater, probably because the boreholes were installed in fractured aquifers, avoiding high F concentrations (>1.5 mg/L). The 90th percentiles for the Ca-HCO3 type bottled waters were proposed as the NBLs for Korean groundwater for 11 major elements and 20 trace elements. The NBLs of NO3 (7.9 mg/L) and F (0.9 mg/L) were similar to the 90th percentiles of EU bottled waters (n = 1785), implying the suggested NBLs are acceptable for groundwater quality management.

1. Introduction

Groundwater has been a globally preferred resource as a supply of drinking water because its quality can be better preserved against pollutants as compared to surface water. However, intense human activity (e.g., agriculture, manufacturing, mining) has posed threats to groundwater quality worldwide for a few decades, which requires appropriate management strategies to prevent groundwater quality degradation. To determine a management strategy, it is essential to evaluate the contamination levels of bottled water compared to natural background levels (NBLs) in groundwater [1,2,3,4,5]. NBLs are naturally occurring substances present in groundwater and their concentrations depend on hydrogeological conditions [6] and have been used to ascertain anthropogenic influences or to establish water quality standards since NBLs are a response of groundwater to climate, hydrology, and, especially, to lithology; NBLs allow one to describe the hydrogeochemical characteristics of an aquifer [7,8].
The NBL of groundwater can be determined by analyzing groundwater samples collected from remote areas free from anthropogenic contamination [1]. However, only a few boreholes exist in pristine regions, which makes it difficult to define NBLs [5,9]. We note that the hydrochemistry of bottled mineral water may be used to evaluate the NBLs of groundwater since the sources of bottled water are the groundwater located in remote and mostly mountainous areas away from anthropogenic pollutants, and moreover, the bottled water quality can be representative of the source water due to the minimal treatment interventions performed before packing. In general, the bottled water manufacturing process includes physical treatments to reduce impurities, such as settling, filtration, aeration, ultraviolet sterilization, and adsorption, but few chemical treatments affecting the chemistry of the source water, other than ozone treatment [10]. In this manner, the water quality of bottled mineral water can provide a proxy for the chemistry of groundwater. What is more, bottled water is pre-packaged and analysis-ready for the assessment of NBLs [11].
As for the data analysis method to establish the NBLs, the preselection (PS) method is the most widely used [7,12,13,14,15,16,17,18], although the PS could limit the data representativeness with respect to groundwater types [6]. The PS method excludes samples affected by anthropogenic activities based on criteria that include the presence of nitrate concentrations exceeding 10 mg/L [2] and only uses samples from pristine groundwaters. Recently, Voutchkova et al. [6] compared three methods (BRIDGE modified, HOVER basis, and HOVER land-use) for excluding polluted sampling points and suggested that data preselection be based on the primary use of wells in order to assure the removal of anthropogenically influenced sampling points. Alternatively, Zhang et al. [19] removed outliers showing distinct hydrochemical properties by using a Piper diagram, a Gibbs diagram, and ionic ratio plots and then established NBLs using 90th percentiles. Apollaro et al. [20] differentiated PS criteria according to the hydrogeological setting of the aquifers because this factor can affect the chemical composition of groundwater, and they then presented NBL exceedance probability maps for As using the Kriging method. In addition, statistical approaches have been applied to assess NBLs, including the mean (m) added to two times the standard deviation (σ) (i.e., m + 2σ) [21], the Box and Whisker plot [22], and probability plots [7,18,23,24,25]. Recently, Atega et al. [26] incorporated qualitative data (e.g., hydrogeological, geomorphological, and anthropogenic inputs) with statistical analyses for determining the threshold between the natural and anthropogenic origins of water bodies and addressed the drawbacks of using qualitative data (e.g., concentrations) only.
The objectives of this study are (1) to identify the water types in South Korean bottled mineral water based on their hydrogeochemical properties and (2) to evaluate the NBLs of the predominant groundwater type for major and trace elements in South Korea, where the bottled water is sourced from bedrock aquifers that are relatively distant from anthropogenic activity, thus requiring only physical treatments before drinking [10]. Specifically, we examined the hydrogeochemical processes affecting the major ion chemistry of bottled water by using principal component analysis (PCA), and trace elements were evaluated with respect to major hydrogeochemical processes. Finally, the NBLs are suggested for major and trace elements, and these NBLs are expected to be used for bedrock groundwater management, especially for the representative groundwater type (i.e., Ca-HCO3).

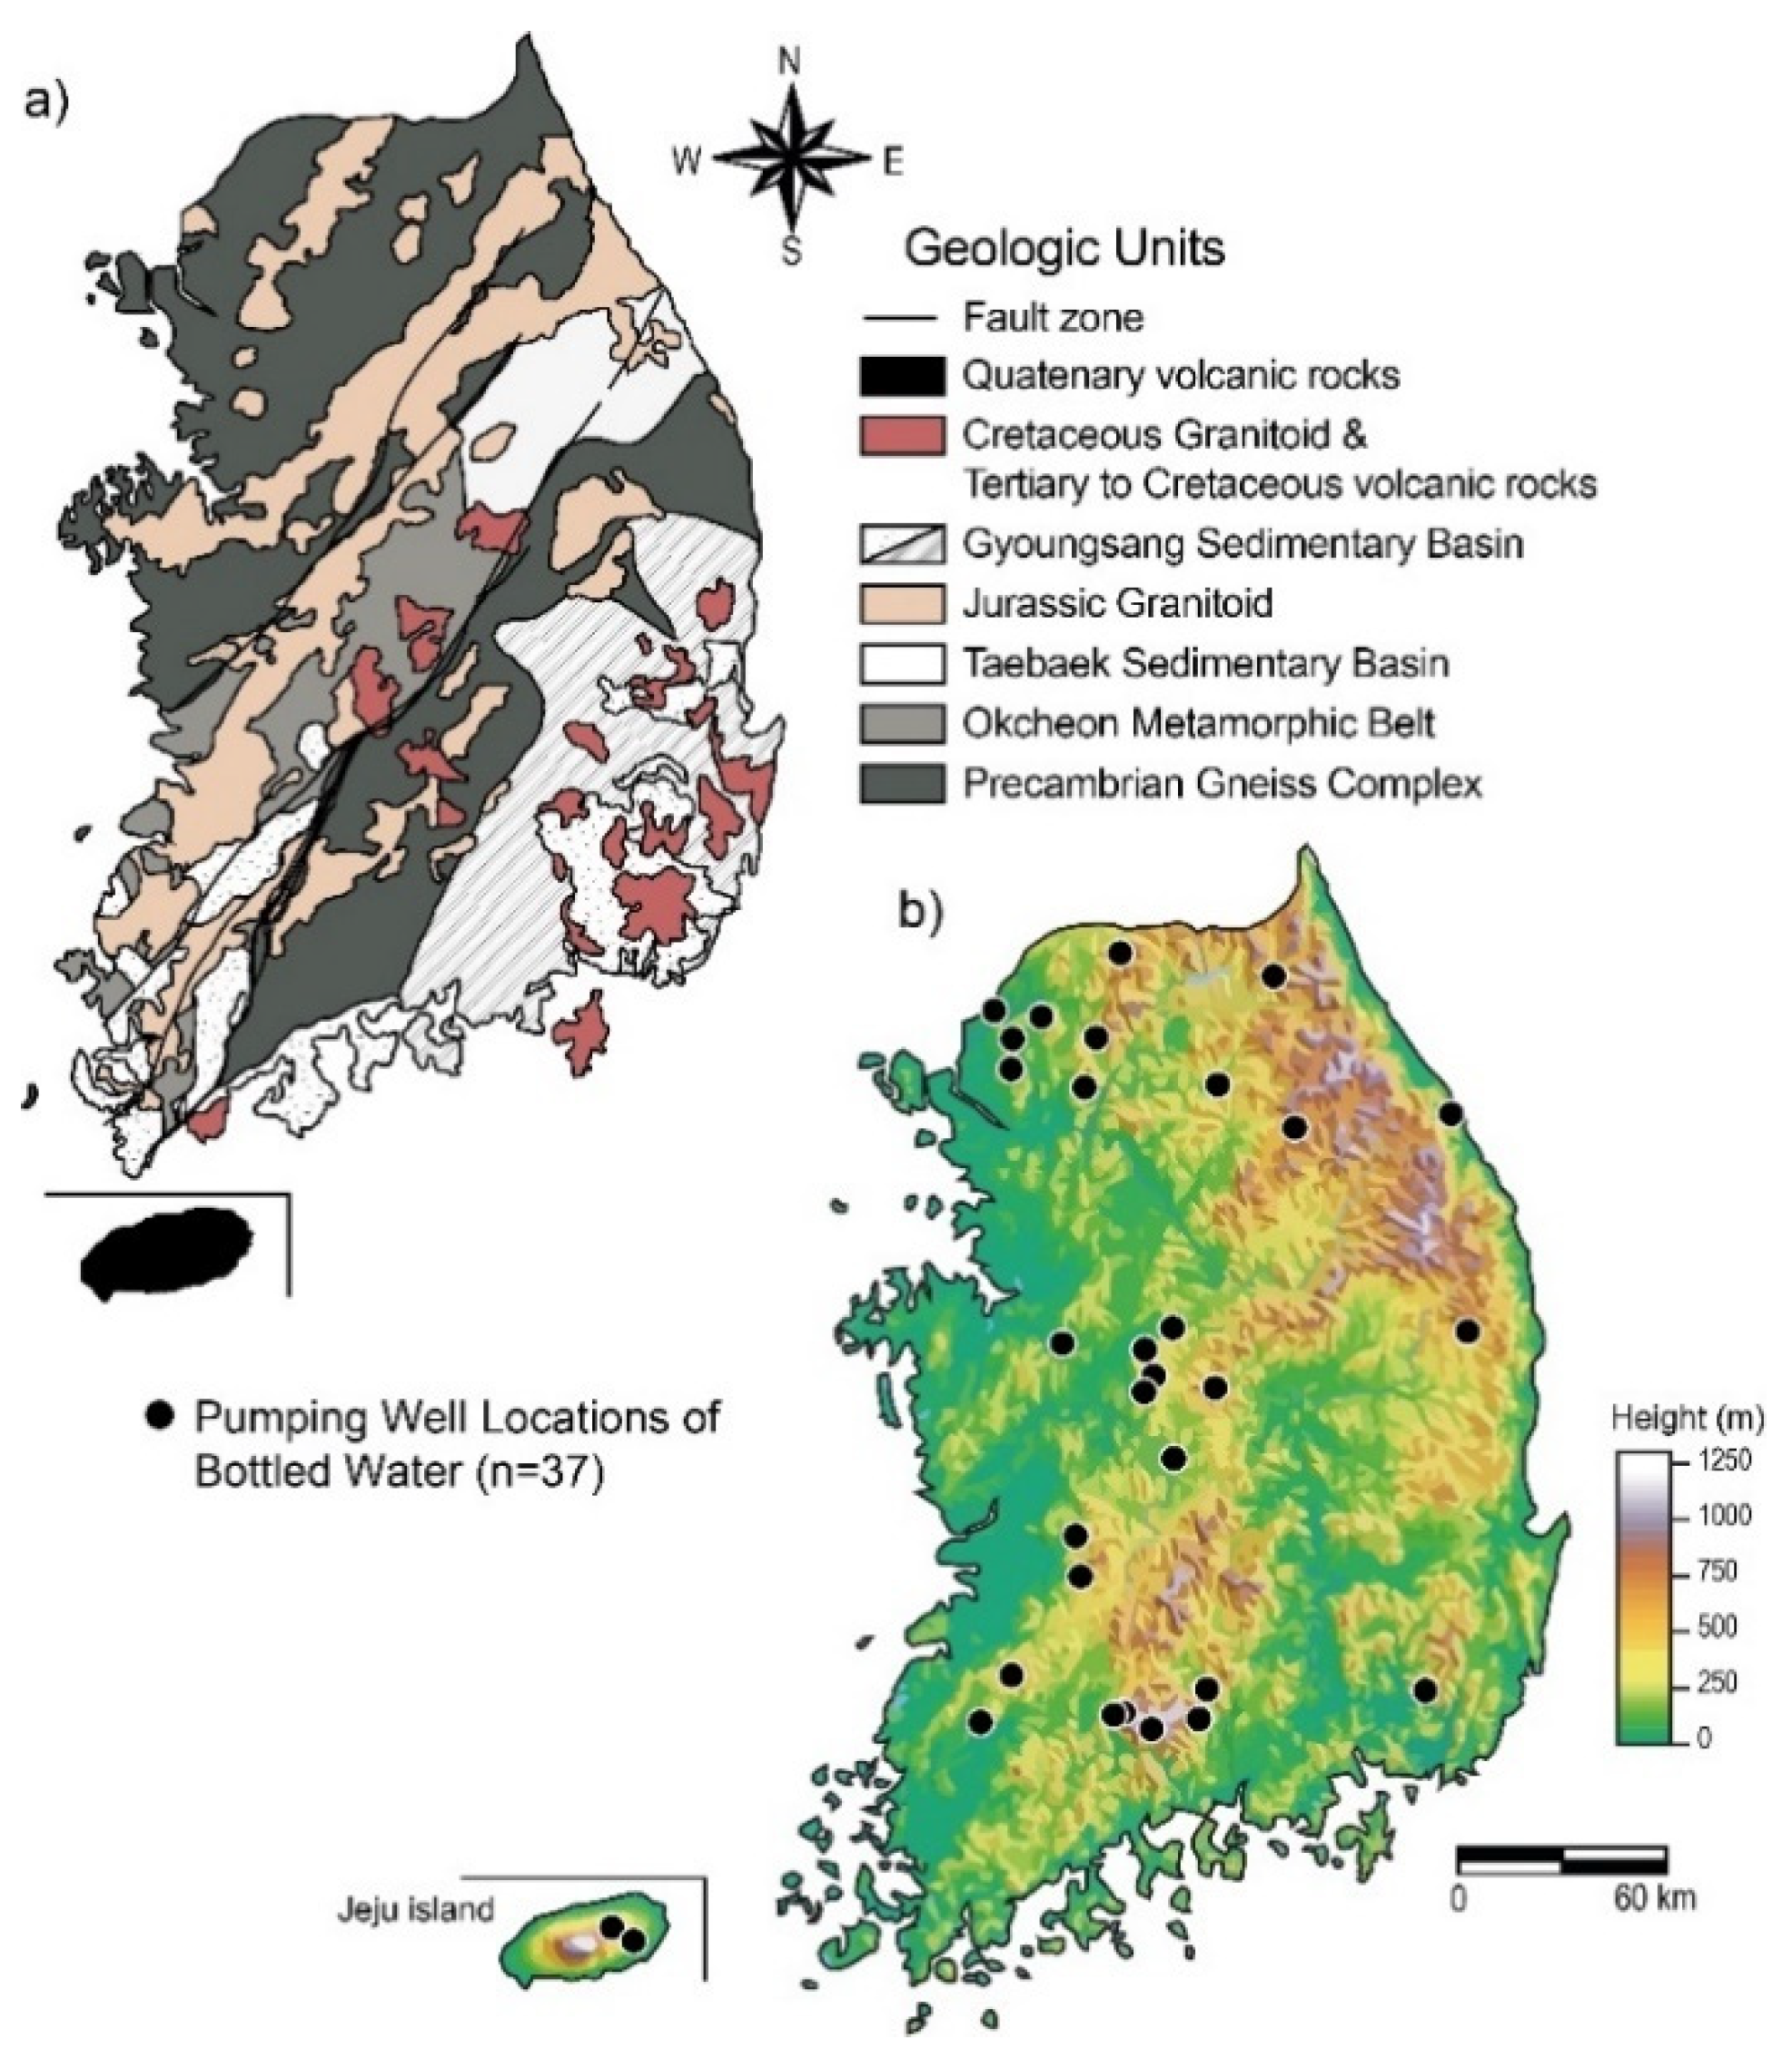
2. Study Area: Outline of the Geology and Hydrogeology of South Korea

South Korea mainly consists of seven geological units (Figure 1a) and four major hydrogeological units (Table 1), of which more than two-thirds consist of Precambrian schist and gneiss complexes (MP in Table 1) and Mesozoic intrusive rocks (IN in Table 1) [27]. The MP is the most frequently occurring geological unit on the South Korean peninsula and mainly comprises quartz, plagioclase, biotite, amphibole, and garnet [28,29]. The IN is the second most widespread unit and is largely divided into the Cretaceous ‘Bulguksa’ granitoids and the Jurassic ‘Daebo’ granitoids, both of which mainly consist of quartz, plagioclase, K-feldspar, biotite, and muscovite [30]. The Daebo granite represents the ilmenite series of either the I or S types, while the Bulguksa granite is predominantly of the magnetite series of type I [31,32]. In addition, Tertiary to Cretaceous volcanic rocks (VT) are found around the Bulguksa granitoids within fluvial sedimentary basins and are composed mainly of felsic to intermediate rocks, including rhyolite and andesite (Figure 1a). Moreover, Quaternary volcanic rocks (VQ) are distributed on Jeju Island and other small islands, with the main lithology of such rocks being alkali basalt consisting of olivine, pyroxenes, amphiboles, biotite, plagioclase, and volcanic glass [33,34]. The Cretaceous ‘Gyeongsang’ sedimentary basin comprises various rock types (SC), including non-marine sedimentary (e.g., mudrocks, sandstone, conglomerate), volcanic, and pyroclastic rocks [35,36], while Cambro–Ordovician rocks of the Great Limestone Series (SL) are predominantly composed of marine carbonates [37]. Lastly, the lithology of the ‘Okcheon’ group of metamorphic rocks (MO) includes slate, schist, metapelites, quartzite, phyllite, marble, conglomerate, amphibolite, and calc–silicates [37].
Fractured bedrock aquifers in South Korea are typical for groundwater occurrence and accompanied by faults, fractures, joints, or lithological boundaries and are commonly overlaid by shallow alluvial aquifers. The hydraulic conductivity of bedrock aquifers ranges over four orders of magnitude, with the average of 0.076 m/day, indicating substantial variability in hydrogeological properties. Available data of groundwater yields from bedrock aquifers also vary from about 10 to 5000 m3/day [38]. According to Jeon et al. [39], the factors controlling the amounts of groundwater yield include lithology, weathered zone thickness, and topographic features; groundwater wells with low groundwater yields are preferentially located in metamorphic areas and in high mountain areas, whereas wells with high yields are preferentially located in low-lying topography and sedimentary and/or volcanic bedrock.
Groundwater wells for bottled mineral water are in pristine areas free from pollution sources and mostly located around granitic and metamorphic rocks (31 of a total of 37, 84%; Table 1). Bottled water wells in South Korea are installed to avoid high F concentrations as it is well known that groundwater from granites or granitic gneisses carries the risk of high fluoride concentrations due to the dissolution of fluoride-bearing minerals (e.g., biotite) at deep depths [40,41]. Lee et al. [42] investigated groundwater in granitic aquifers (n = 233) in South Korea and reported the average fluoride contents in groundwater obtained from 100–300 m depths and >300 m depths were 0.5 and 2.6 mg/L, respectively. According to Cho et al. [43], the depths of the source wells that provide South Korean bottled water range between 48.7 and 470 m, with a mean of 199.5 m. The boreholes are cased with concrete down to the top of non-weathered bedrock, around 20 to 30 m below ground level (bgl), to prevent the inflow of pollutants from the ground surface [44,45].
The South Korean bottled water market has grown rapidly, with sales in 2015 increasing approximately 730 times compared to those in 1983 [46], due to rising incomes, hygiene awareness and interest in well-being [47]. According to this trend, several researchers have evaluated the chemical properties of South Korean bottled water to date [43,48,49,50,51,52]. Most of these studies are of major elements, but the distribution of trace elements is still poorly understood. Recently, Shin et al. [52] suggested that there is little relationship between trace element concentrations (Li, B, V, Ba, Rb, Cr and Ga) and geology.

3. Materials and Methods

For this study, we collected a total of 37 bottled water samples that were abstracted from groundwater wells (around 200 m bgl deep) within various geological units (see Figure 1b for localities) and hydrogeological units (see Table 1). Sparkling water or desalinated water was excluded from this study due to chemical alterations of the source water from CO2 injection or desalination [49,50]. All bottled mineral water was packed in PET bottles that can release some trace elements [11,54].

3.1. Hydrochemical Analysis

Sixty-two hydrochemical parameters including TDS (total dissolved solids) were determined for the 37 bottled water samples at the laboratory of the Jeju Province Development Co. (JPDC). Major cations (Ca, K, Mg, Na) and SiO2 were analyzed using ICP-OES (Varian 720-ES), while anions (Br, F, Cl, NO3, SO4) were analyzed using IC (Dionex ICS-2000). Alkalinity was measured using the acid titration technique and then converted to the equivalent inorganic carbon species (mainly HCO3). The pH and EC of water were measured using a portable meter (Orion 5-Star, Thermo Scientific). The analyses of 48 trace elements known to be dissolved in groundwater (Al, Ag, As, B, Ba, Be, Cd, Ce, Co, Cr, Cs, Cu, Dy, Er, Eu, Fe, Ga, Gd, Ge, Hf, Hg, Ho, La, Lu, Mn, Mo, Nb, Ni, Pb, Pr, Rb, Sb, Se, Sm, Sn, Sr, Ta, Te, Th, Ti, Tl, Tm, U, V, W, Yb, Zr, and Zn) were conducted by using ICP-MS (Varian 820-MS), the accuracy and detection limits (D.L.) of which are summarized in Supplementary Table S1.
Careful quality control of hydrochemical analysis was undertaken by analyzing blanks, duplicates, and standards and by checking the ion balance error for each sample. The calculated ion balance errors for samples were within ± 5%. The accuracy estimated using the percent relative error ranged from 0.2 to 9.7% for a certified standard reference material (SRM 1640 from US National Institute of Standards and Technology). The detection limits (D.L.) were obtained from the analytical results of blank solutions (n = 10) during the analytical procedure, and the value corresponding to 10 times the standard deviation was taken as the D.L. for each chemical substance (Supplementary Table S1).

3.2. Statistical Analysis

Principal component analysis (PCA) is a multivariate statistical technique to reduce high dimensional data into a few dimensional spaces consisting of principal components (PCs) that are linearly independent to each other. PCA has been widely applied to infer the underlying processes of groundwater chemistry [55,56,57,58]. Thus, PCA was conducted using major ion concentrations (Ca, Mg, Na, K, SiO2, Cl, Br, F, HCO3 and SO4) and pH to reveal the major hydrogeochemical processes controlling the chemistry of bottled mineral water. Concentration data, excluding pH, were log-transformed for PCA to improve the normality of the data [59] and to reduce the outlier effects, and the data were then scaled to unit variance.
In addition, trace elements, detected in more than half of the samples, were used as supplementary variables in PCA after imputing left-censored data by the log-ratio expectation-maximization method (lrEM). Note that for further statistical analysis such as PCA, the missing part of a dataset should be replaced with proper values reflecting the characteristics of the data. We compared a substitution with 1/√2 × D.L. and two imputation methods (i.e., Regression on Order Statistics (ROS) and lrEM) (see Supplementary Tables S2 and S3) and chose the lrEM for our left-censored data. The substitution with 1/√2 × D.L. is one of the most commonly used methods to deal with missing values because it is effortless, although it distorts the data distribution. The US EPA recommends ROS for the imputation of left-censored environmental data, especially when the number of samples is small [60]. The ROS provides the information about the data distribution and statistical summary, as shown in Supplementary Table S3, whereas further statistical analysis cannot be performed using ROS because ROS does not calculate a discrete value for each missing point. In contrast, the lrEM reflects the compositional characteristics of geochemical data and imputes the missing values with values smaller than D.L., although a multivariate normality should be assumed for lrEM [61].
In this study, PCA was carried out using the R package FactomineR [62], while the lrEM and ROS were conducted using R package zCompositions [61] and NADA [60], respectively (Supplementary Table S2). In addition, we used IBM SPSS Statistics for Windows, version 25 (IBM Corp., Armonk, NY, USA) for the Kruskal–Wallis H test to determine if there are statistically significant differences in the major and trace element concentrations according to geological unit.

4. Results and Discussion

4.1. Hydrochemical Properties

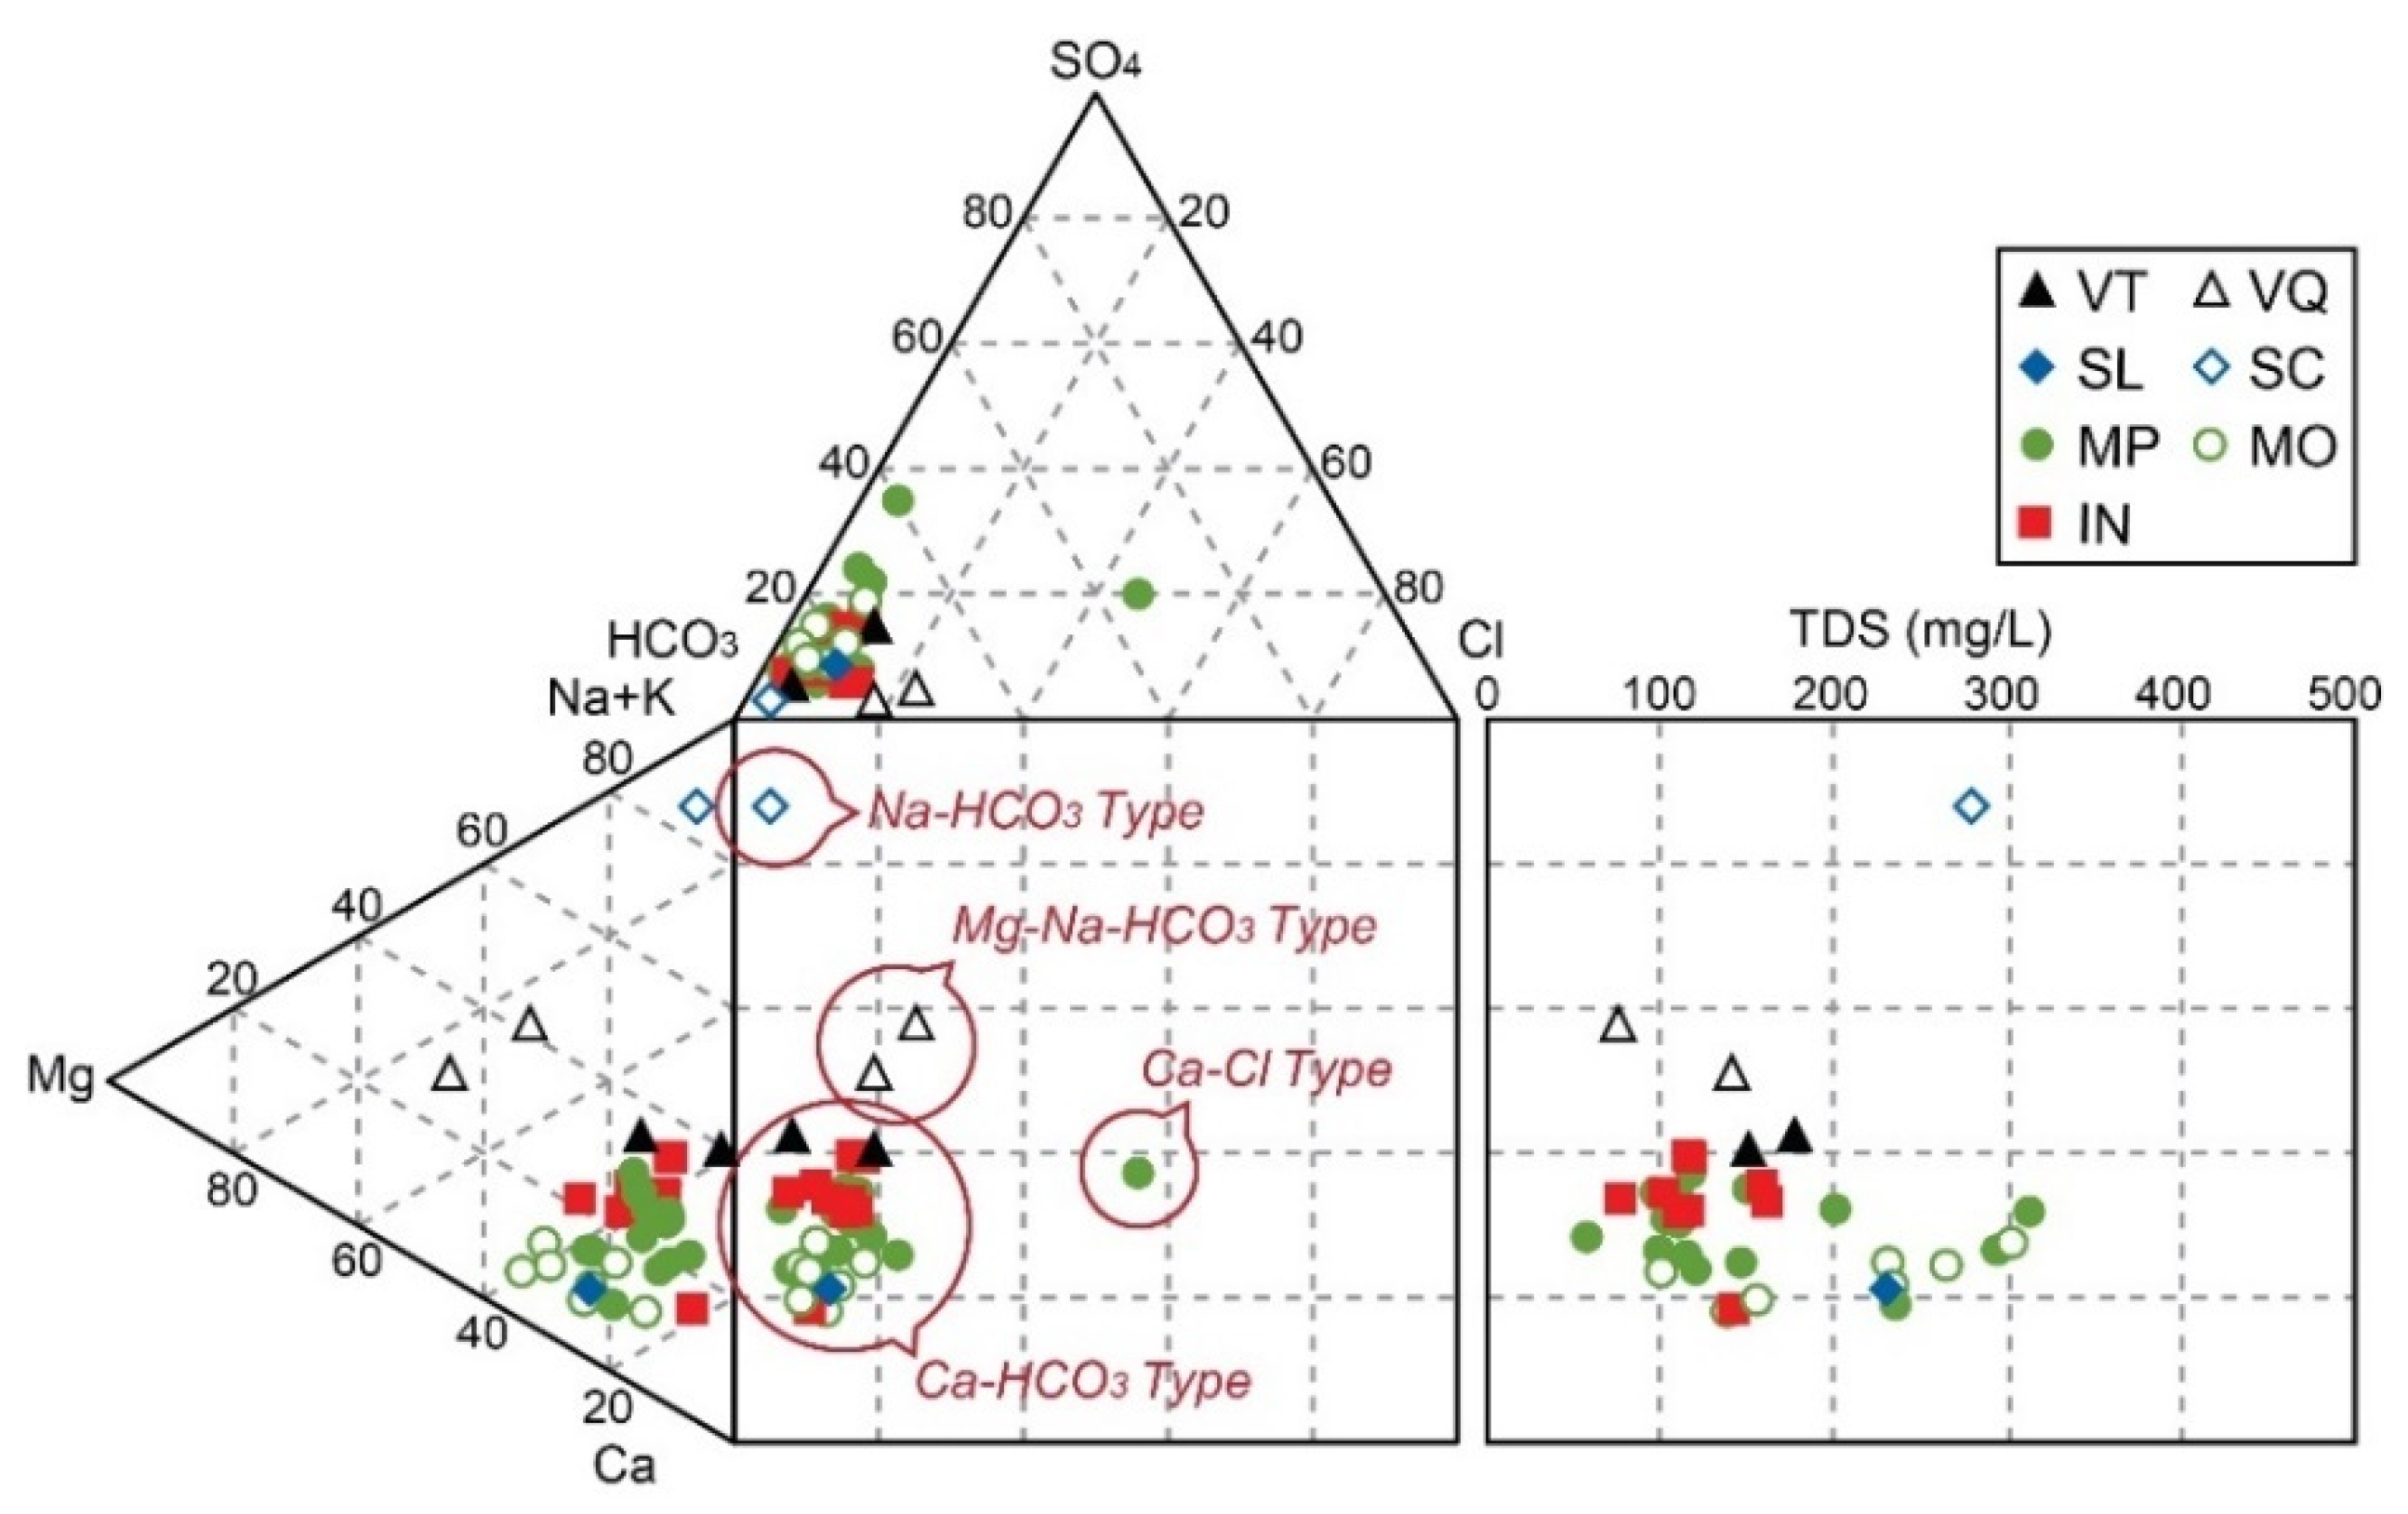
4.1.1. Major Constituents

Most of the bottled mineral water samples (33 of 37) belong hydrochemically to the Ca(-Na)-HCO3 type with low to moderate TDS and weakly alkaline pH (Table 2), regardless of geology (Figure 2). Similarly, Koh et al. [46] mentioned that South Korean bottled waters generally show lower TDS levels and less diversity in chemical properties than European bottled waters. Specifically, the Ca-HCO3-type bottled waters (n = 33) showed TDS contents between 57.3 and 312.2 mg/L, with a median value of 142.0 mg/L (Table 2). The pH varied from 6.65 to 8.22, with 7.49 for the median. Ca (median = 21.2 mg/L) and HCO3 (median = 75.3 mg/L) were the dominant cation and anion, respectively. In addition, the median of 0.2 mg/L for F concentrations was much lower than the median value (4.4 mg/L, n = 377) in the deep bedrock groundwater (average depth = 624 ± 262 m) of South Korea [40]. The low concentrations of TDS and F indicate a low degree of water–rock interaction for the Ca-HCO3-type bottled waters. Additionally, the concentrations of NO3 ranged from 0.1 to 10.0 mg/L, with a median value of 3.0 mg/L for the dominant Ca-HCO3-type water samples, which indicates the insignificant impact of anthropogenic sources when compared to the threshold for anthropogenic pollution from NO3 for South Korean bedrock aquifers (3.0 mg/L) [63] and the WHO guideline for drinking water (50 mg/L).
In contrast, the other four samples showed distinct hydrochemical characteristics (Figure 2; Supplementary Table S4). These were Mg-Na-HCO3-type for the samples N1 and N2, Ca-Cl-type for N12, and Na-HCO3-type for N22, similar to [52], which classified the bottled water manufactured in South Korea (n = 60) into three water types: Ca(-Mg)-Cl and Na-HCO3 as well as Ca-HCO3. The four outliers can be hydrogeochemically explained by the regional geology, unlike the Ca-HCO3-type bottled waters, as in [64], which showed that water types reflect the geochemical features of aquifers. Specifically, the samples N1 and N2 were sourced from basaltic aquifers on volcanic Jeju Island (VQ in Table 1; Figure 1), where the Mg-Na-HCO3-type groundwater is formed by the dissolution of Mg-rich silicate minerals in basalts by infiltrated rainwater [65,66,67]. Sample N12 of Ca-Cl-type from MP and N22 of Na-HCO3 type from SC showed the highest Cl concentration (24.6 mg/L) and highest pH (8.52, slightly above the Korean drinking water standard of 8.5) among the 37 bottled water samples (Supplementary Table S4), respectively, which probably resulted from relatively high degrees of water–rock interaction [68,69,70,71].

4.1.2. Trace Elements

The descriptive statistics for 27 trace elements that were detected in more than half of the Ca-HCO3-type water samples (i.e., ≥17 of 33) are given in Table 3, and their concentrations in the four outlier samples are shown in Supplementary Table S4. The other 21 trace elements (Ag, Be, Cd, Ce, Dy, Er, Ga, Gd, Ge, Ho, La, Lu, Mn, Nb, Pb, Pr, Se, Sm, Te, Tm, and Yb) are excluded from Table 3 and Supplementary Table S4 because they were detected in only a few bottled water samples (<17), which is not enough for statistical analysis. Among the 21 elements excluded from Table 3 and Supplementary Table S4, Cd, Mn, Pb and Se are included in the drinking water quality standards of South Korea and the WHO; none of the 37 samples exceeded the standards.
In addition, we further excluded Sb, Al, Ba, Co, Cu, Fe, and Ti from the interpretation of the Ca-HCO3-type water samples because their median values were similar to or less than the maximum concentration leachable from PET bottles (see Table 3) [11,54], implying that the concentrations of these trace elements in PET-bottled water cannot represent the hydrochemistry of the source groundwater.
Among the 20 trace elements remaining for interpretation and discussion, 11 elements (As, B, Hf, Hg, Rb, Sn, Sr, Ta, Th, Tl, and Zr) had a complete dataset for all the 33 Ca-HCO3-type water samples, while 9 trace elements (Cr, Cs, Eu, Mo, Ni, U, V, W, and Zn) had missing values. After the imputation of the left-censored data using the lrEM, two mean values were provided for the nine trace elements in Table 3: mean values without imputation (i.e., the sum divided by the number of detected values) and the means with imputed values. The mean obtained by excluding non-detected data was larger than the mean obtained after imputing the missing values, which indicates that the mean values calculated without considering the missing data may skew the real data distribution.
Consequently, we performed the Kruskal–Wallis H test on 33 Ca-HCO3-type water samples with imputed values to assess statistical differences in the concentrations of 20 trace elements according to the three geological units (i.e., MP (n = 14), MO (n = 7), and IN (n = 9)), excluding VT (n = 2) and SL (n = 1), as shown in Table 3. Differences according to geological unit were insignificant (p-value > 0.05), except for Rb and Cs, indicating that the concentrations of most trace elements in bottled water were not dependent on lithology. Similarly, Shin et al. [52] showed the limited effect of geology on trace elements in South Korean bottled water. Compared to the concentrations of B (1.52–378 μg/L; mean = 23.3 μg/L; n = 60), V (0.01–2.59 μg/L; mean = 0.7 μg/L), Rb (0.13–−4.37 μg/L; mean = 1.1 μg/L), and Cr (0.01–0.67 μg/L; mean = 0.2 μg/L) determined by Shin et al. [52], Table 3 shows similar values for each element, implying the representativeness of the data. Significant differences for Rb and Cs according to geological unit are discussed with their mobility in groundwater in Section 4.2.3.
The highest concentrations of As and U exceeded the standards for drinking water (DWS; Table 3). The arsenic concentrations were slightly higher than the WHO and South Korean DWS (10 μg/L) in two samples (N26 and N32) with 10.9 and 10.7 μg/L, respectively, which were abstracted from MP (esp. granitic gneiss) and MO (esp. granitoids), respectively (Table 1). Given that pyrite (mostly of hydrothermal origin) is often observed in granite and gneiss in South Korea [74], and arsenic in groundwater is mostly derived from the oxidation of As-bearing pyrite [75,76], local geological sources (e.g., pyrite) seem to cause the high As concentrations. In addition, the As concentration of groundwater under the conditions of granite dissolution can be controlled by the desorption/absorption of As from/onto Fe(OH)3, ferrihydrite, and especially Fe(III)-oxyhydroxide (HFO) [77]. As for uranium (U), a sample (N30) from MP had a concentration (20.3 μg/L) exceeding the WHO DWS (15 μg/L). In South Korea, uranium concentrations in groundwater were reported to be up to 3610 μg/L, with mean and median values of 8.0 and 0.7 μg/L, respectively (n = 4140; [78]), showing high U concentrations in granite and granitic gneiss, probably because of its enrichment in late-stage (highly evolved) igneous rocks [78,79,80]. Although one sample (N30) exceeded the WHO DWS, the Ca-HCO3-type bottled water showed mean and median U concentrations that were lower than the reported values (Table 3) [78], which also suggests a low degree of water–rock interaction in source water, similar to that of the low F concentrations.
None of the four outlier samples (N1, N2, N12, and N22) exceeded the DWSs, except for the pH (8.52) in N22 slightly exceeding the Korean standard (8.5) (see Supplementary Table S4). However, the four outlier samples showed some trace element concentrations exceeding the maximum values for the Ca-HCO3-type bottled waters, probably due to the geological effect, including prolonged water–rock interactions. For instance, N1 and N2, which are Mg-Na-HCO3-type bottled waters from volcanic Jeju Island, showed high Rb (10.1 μg/L and 12.4 μg/L, respectively) and V contents (8.2 μg/L and 5.5 μg/L, respectively). Vanadium is known to be elevated in mafic rocks such as basalt, which hosts the sample sites for N1 and N2. In addition, the sample N22, of Na-HCO3 type, exhibited high B, Ti, and Sn contents exceeding both the maximum concentrations of Ca-HCO3-type bottled water and the concentrations leachable from the PET bottles, probably due to prolonged water–rock interactions. In particular, the boron concentration (483.4 μg/L) of N22 was more than 10 times higher than the maximum B content (46.1 μg/L) of the Ca-HCO3-type waters. An enrichment of B in groundwater occurs in several environments, including volcanic bedrock aquifers, evaporite deposits, and the hydrothermal processes of late-stage igneous rocks [11].

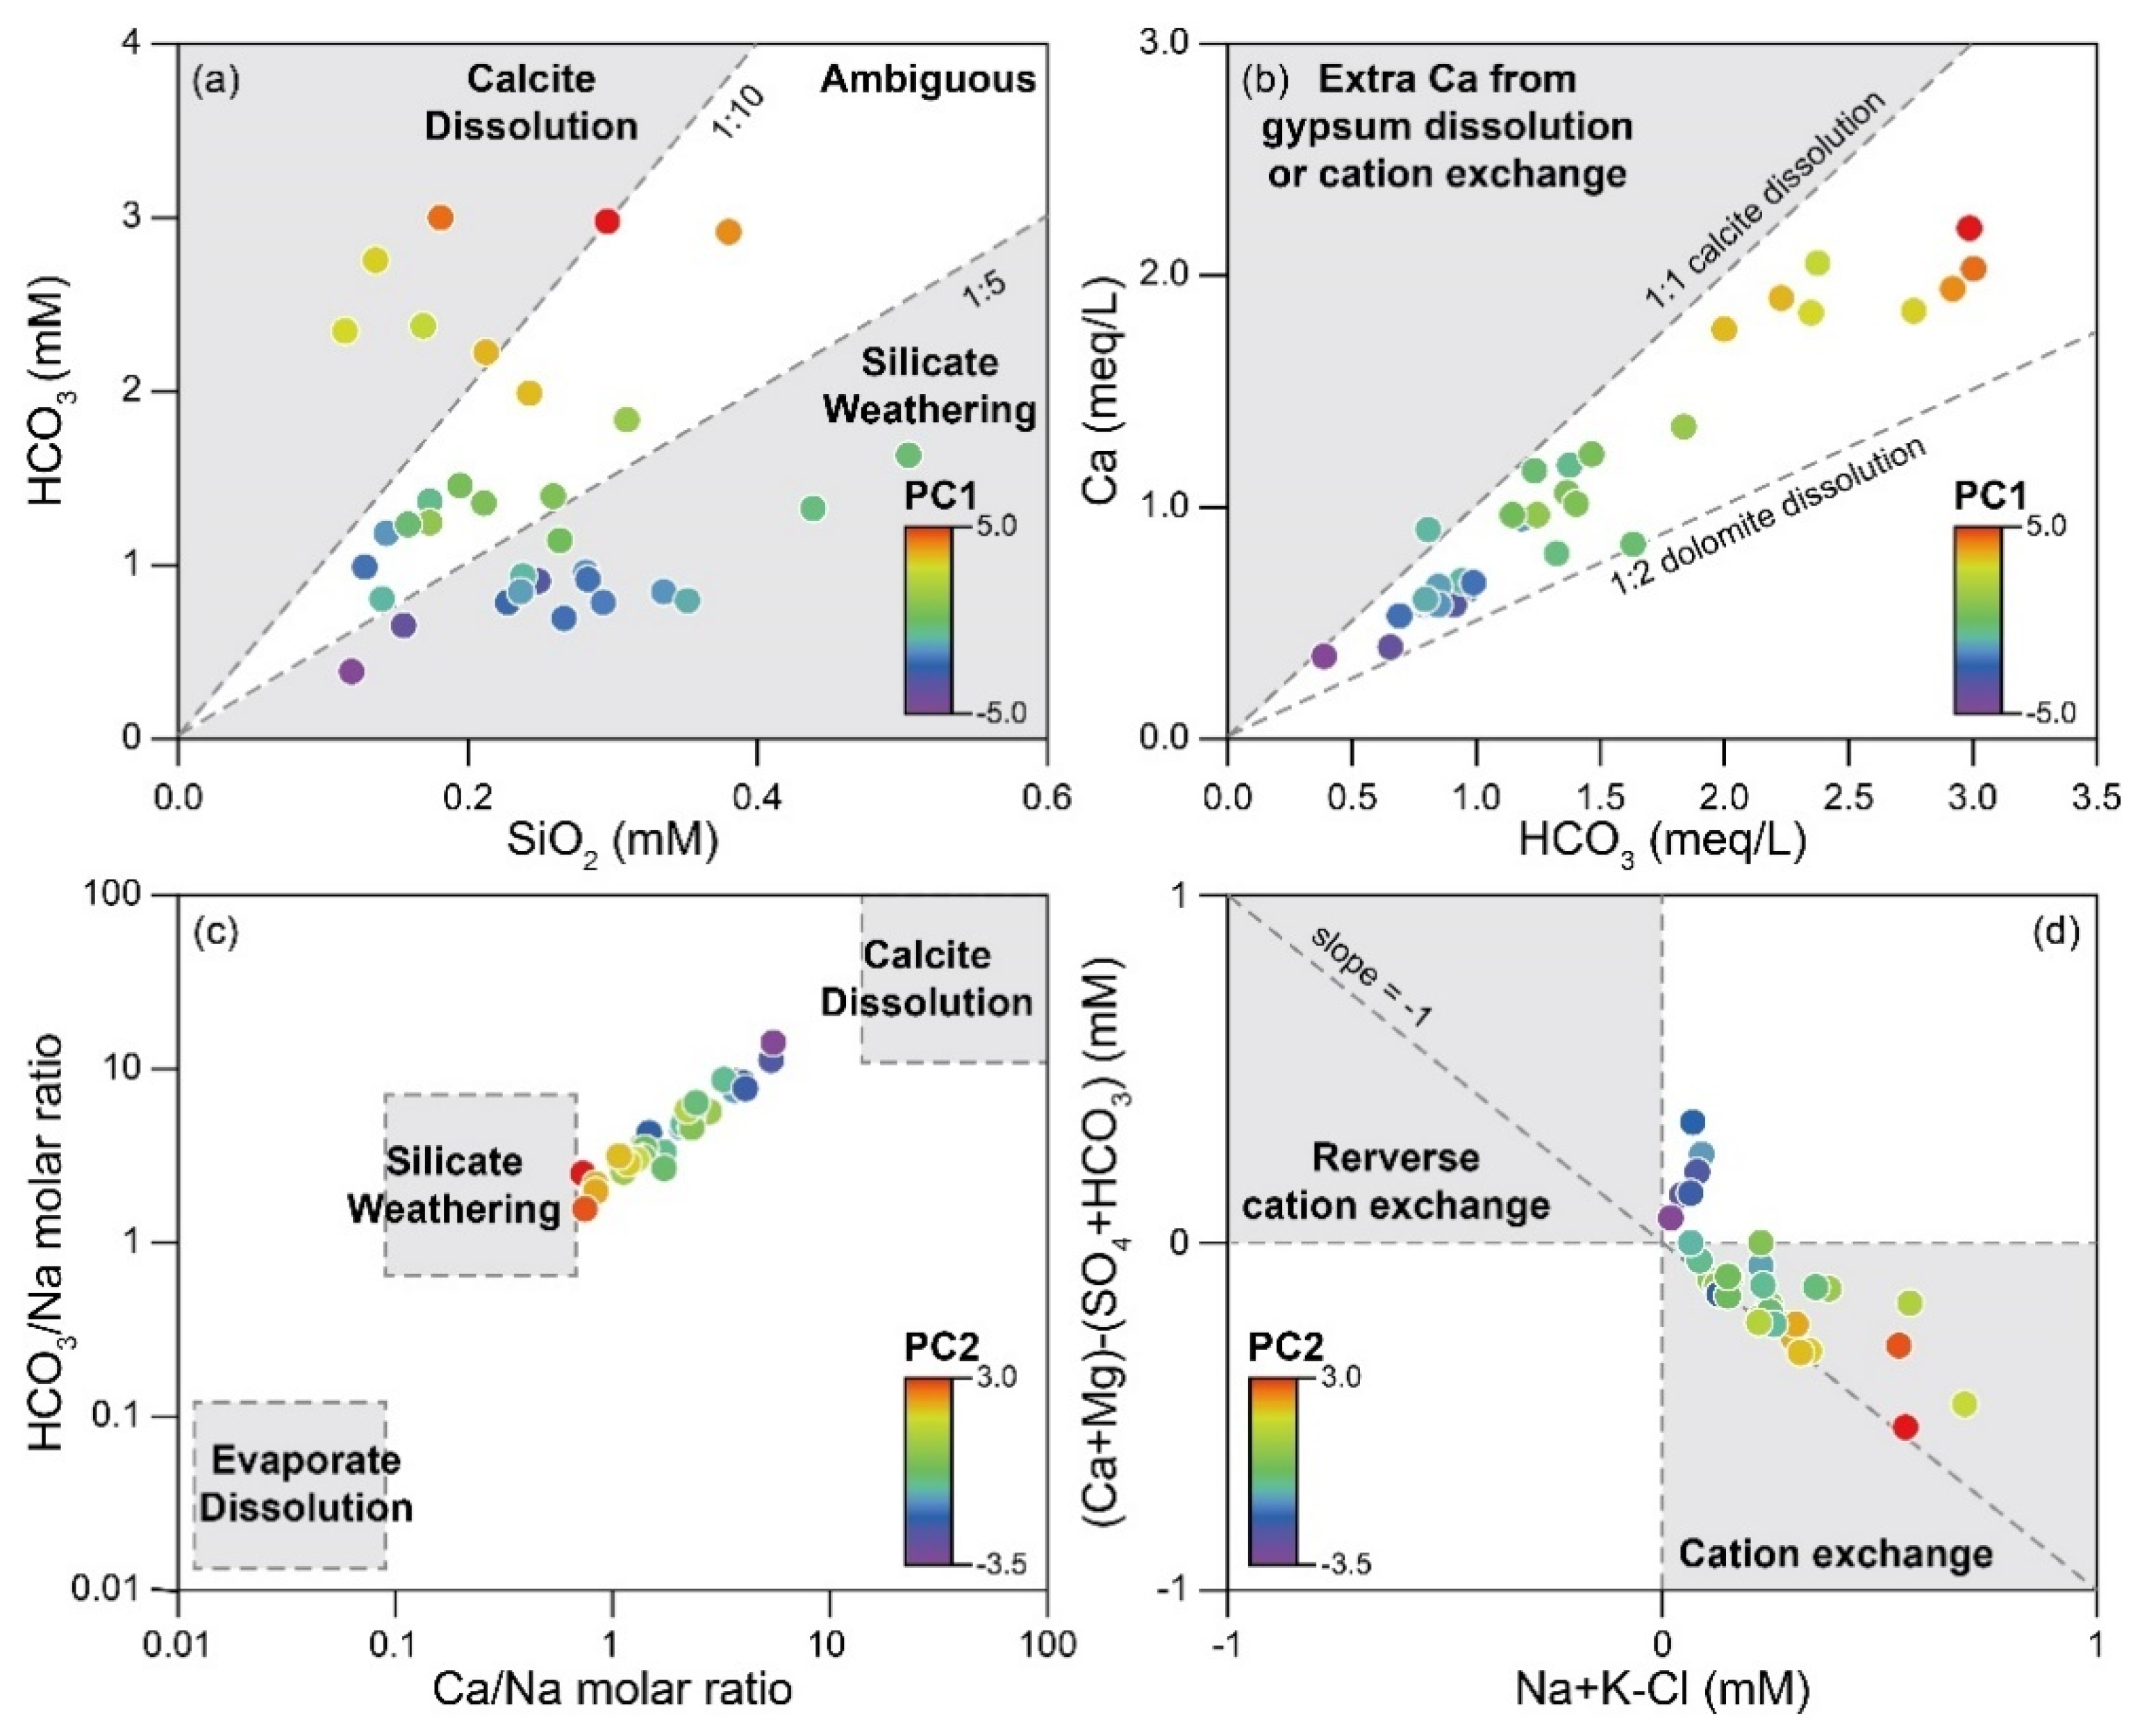
4.2. Major Hydrogeochemical Processes for Ca-HCO3-Type Bottled Water

Hydrogeochemical processes for the dominant Ca-HCO3-type water were assessed and their recharge pathways are discussed in this section.

4.2.1. Major Hydrochemical Processes

PCA was conducted for the dominant Ca-HCO3-type bottled water (n = 33), excluding the outliers, to identify the hydrogeochemical processes controlling the representative hydrochemistry of South Korean bottled water. Two PCs with eigenvalues of 5.0 and 2.3 were extracted, which explained 61.4% of the total variance (Figure 3a). The 33 samples of bottled water are plotted on the PC space (Figure 3b).
The first PC (PC1), accounting for 41.9% of the total variance, was significantly correlated with EC, Ca, Mg, Cl, SO4, and HCO3 (loading values > 0.6; Figure 3a), with the highest loadings with EC (0.98), Ca (0.96), and HCO3 (0.95). These patterns indicate that South Korean bottled groundwater represents the early evolution stage of water–rock interactions, closely associated with Ca and HCO3 derived from calcite dissolution and partially from the weathering of Ca-bearing plagioclase (Figure 4a). Gypsum dissolution has a negligible effect on Ca concentrations (Figure 4b). Generally, Ca and HCO3 are dominant in naturally recharging groundwater affected by the rapid dissolution of carbonates and calcium-bearing silicates (e.g., Ca-rich plagioclase). Mg can be accompanied by Ca in groundwater since both elements can be simultaneously elevated in groundwater from the dissolution of Mg-bearing carbonates [81]. Moreover, Cl and SO4 can originate from diverse natural sources, such as the dissolution of pyrite (possibly of fracture-filling hydrothermal origin) and by fluid inclusions in the rocks [82,83,84]. The atmospheric contribution of Cl and SO4 can be also considered in the early evolution stage due to their concentration levels in rainfall [85,86], similar to those in the Ca-HCO3-type bottled water.
The second PC (PC2), explaining 19.5% of the total variance, was significantly correlated with Na (loading = 0.76), SiO2 (loading = 0.80) and F (loading = 0.84), as shown in Figure 3a, and seems to address the weathering of Na-plagioclase and cation exchange given that the chemistry of bottled water samples falls between silicate weathering and carbonate dissolution and has higher PC2 scores as they are closer to the field of silicate weathering (Figure 4c). In addition, the bottled water samples had a linear relationship with a slope of −1 in the bivariate plot of Na + K − Cl versus (Ca + Mg) − (SO4 + HCO3), indicating the process of cation exchange, with the water samples having high PC2 scores in the field of cation exchange (Figure 4d). Additionally, the high correlation of PC2 with fluoride (F), shown in Figure 3a, suggests that PC2 represents cation exchange since the precipitation of CaF2 is inhibited and thus the F concentration increases when Ca in groundwater decreases by replacement with Na [41,87,88,89].
In general, elevated concentrations of Na, F, and SiO2 are known to indicate the prolonged chemical evolution of groundwater in silicate bedrock aquifers, and variations in hydrochemistry and lithology reflect differences in groundwater maturity [90]. For instance, Fuoco et al. [91] described the increases of Na and F during the maturation of groundwater chemistry through the simultaneous/sequential reactions of the weathering of Na-bearing minerals, precipitation of calcite, Ca-Na exchange, and the dissolution of fluorite induced by decreasing calcium concentrations. However, PC2 seems to explain the dissolution of Na-, SiO2-, and F-rich minerals (likely, Na-rich plagioclase and biotite in rocks of granitic composition) rather than the maturity of groundwater chemistry, given the low concentrations of Na, SiO2, and F (Table 2) observed, their low correlations with EC (Figure 3a), and the high PC2 scores for the samples from the geological unit IN, which contains relatively high contents of Na-, SiO2-, and F-rich minerals (Figure 3b). Na-plagioclase is the next most hydrolysable rock-forming mineral following the carbonate minerals and Ca-rich plagioclase, and its weathering elevates the concentrations of Na and SiO2 in groundwater [92], while F-rich biotite is ubiquitous in Mesozoic granitoids in South Korea [31,93].
In Figure 3b, bottled water samples (n = 14) from the geological unit MP are widely distributed along the PC1 axis, probably because of various protoliths in MP. Similarly, Sung et al. [94] explained that South Korean groundwater from Precambrian metamorphic bedrock regions show diverse water types in chemistry compared to groundwater from other geological units, owing to various factors including the chemical composition of protoliths and the degree of metamorphism. It is noticeable, however, that the chemistry of groundwater samples is distinct between MP (n = 14) and IN (n = 9), shown in Figure 3b, which may indicate that the dissolution of reactive minerals (PC1) is enriched in the samples from MP (esp. granitic gneiss), while the silicate weathering and cation exchange (PC2) are higher in the IN samples. According to Lee et al. [74], reactive minerals such as calcite and pyrite occur more often in gneiss than in granite, although the mineralogy is not significantly different between granite and gneiss in South Korea [95]. Lee et al. [51] also reported that the EC value of bottled groundwater from Precambrian metamorphic aquifers (average = 177.8 μS/cm) is higher than that from granite aquifers (average = 138.2 μS/cm).
Meanwhile, the higher PC1 and lower PC2 scores for the samples of the geological unit MO (n = 7) compared to the samples from other geological units can be explained by the dissolution of more calcareous compositions (e.g., calc–mafic silicates and carbonates) from MO bedrock (Table 1; see Section 2). Similarly, a sample from SL exhibited elevated Ca (41.0 mg/L), Mg (8.5 mg/L), and HCO3 (143.3 mg/L) concentrations and showed a high positive PC1 score (Figure 3b), which can be explained by the dissolution of calcite and/or dolomite in the limestone basin. In addition, the two samples from VT showed the highest PC2 scores and little correlation with PC1 (Figure 3b), probably because the bedrock aquifer of the VT samples consists of Si- and/or Na-rich volcanic rocks containing quartz, plagioclases, and especially, amorphous silica (see Section 2).

4.2.2. Causes for Short-Circulating Pathways

Although some of South Korean Ca-HCO3-type bottled water samples are differentiated by the geological setting (e.g., VT, SL, MO and IN) in the PC space, the low values of EC and F concentration (Table 2) and insignificant difference of trace element concentrations among the geological units (p-value > 0.05 in Table 3) indicate the low degrees of water–rock interactions through short-circulating pathways. The hydrochemical processes through short-circulating pathways are attributed to the following three facts.
First, because South Korean bedrock aquifer groundwater often has high F concentrations [40,96], the borehole depth for bottled water is adjusted to avoid high F concentrations exceeding the drinking water standard (1.5 mg/L). Note again that most of the bedrock formations in South Korea are composed of felsic rocks (especially granitoids and granitic gneiss), which have the elevated concentrations of harmful elements, such as F [40,97] and U (Figure 5), that consequently cause their high levels in groundwater [40,78].
Second, the short-circulating pathways to the deep (around 200 m) groundwater are possible because the groundwater recharges mainly through fracture networks [98,99,100]. According to Koo et al. [101], flow and recharge velocities through fractured rock systems can be relatively fast based on tritium-based groundwater ages (2–9 years) of moderately deep bedrock aquifer systems in South Korea. Similarly, Choi et al. [102] showed high tritium contents (6.1–12.0 TU) and the absence of spatial/seasonal change of O–H isotope data in the groundwater of Seoul, the capital of South Korea, indicating that the groundwaters within aquifers are well mixed with recently recharged waters. According to Lee et al. [103], there was no significant difference in the rate of water-level rise responding to precipitation and in the NO3 concentrations between the alluvial and bedrock aquifers in the National Groundwater Monitoring Network (NGMN) of South Korea, probably due to the permeable fractures in unconfined bedrock aquifers.
Third, groundwater for bottled water production is abstracted through all permeable fracture zones below the bottom of the casing, resulting in the mixing of shallow and deep groundwater, given that the casing is constructed only in the soil layer down to 20–30 m bgl to ensure adequate water supply [44]. Similarly, Cho et al. [43] analyzed the pH, F, As, and NO3 concentrations in South Korean bottled water collected from 1998 to 2002 and concluded that both geology and well-depth barely affect the water quality since many of the bottled mineral waters might have been abstracted through imperfect well casings and grouting.

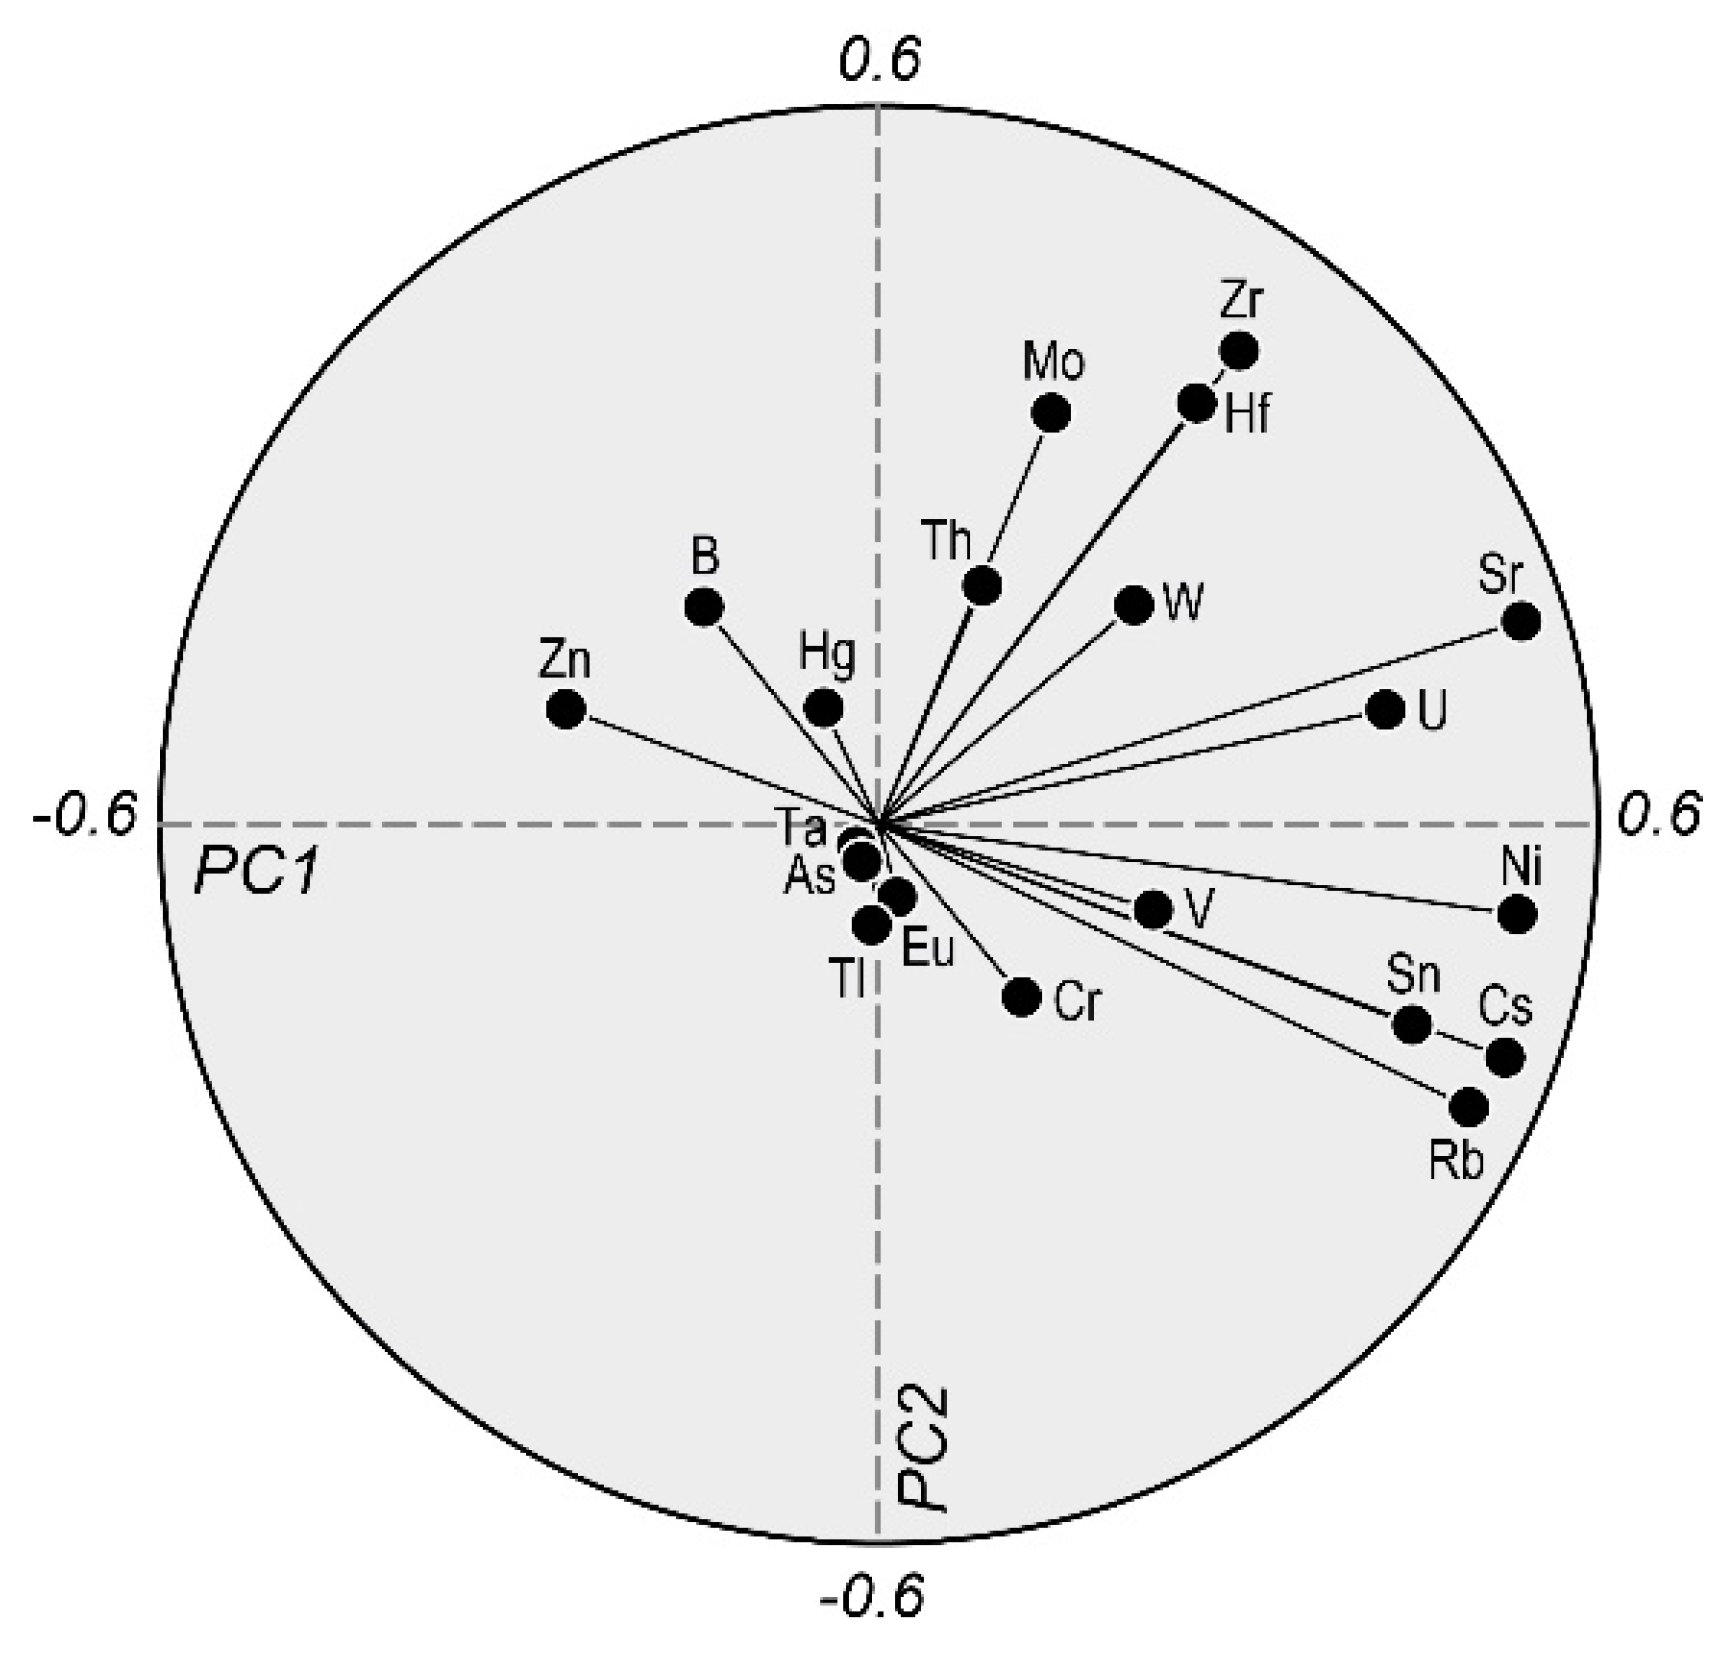
4.2.3. Trace Elements in Major Hydrochemical Processes

The concentrations of 20 trace elements in Table 3 were assessed with respect to major hydrochemical processes (i.e., PC1 and PC2) after the left-censored data were imputed using the lrEM to examine the hydrogeochemical controls on the trace element contents in South Korean bottled mineral water. As a result, Cs, Ni, Rb, and Sr showed highly positive correlations with PC1, whereas none significantly correlated with PC2 (loading ≥ 0.5), except for Zr, which exhibited a relatively high correlation with PC2 (Figure 6).
Highly positive correlations of Cs, Rb, and Sr with PC1 suggest their high mobility (and solubility) in groundwater, even through short-circulating pathways (Figure 6), which may cause the significant difference between the three geological units, shown in Table 3. According to Edmunds et al. [104], Cs, Rb, and Sr are reactive residence-time indicators since they are easily released during the weathering of carbonate and/or silicate minerals, and their solubilities are ideally unlimited and unaffected by adsorption or precipitation. In addition, the high correlation of PC1 with these elements indicates that PC1 addresses the dissolution of highly reactive minerals such as carbonates and Ca-bearing plagioclase. Moreover, the high positive correlation of PC1 with Ni is probably because of its high mobility in aquatic environments [105] and the high Ni content in various bedrock formations (Figure 5). Ni is found in various rock-forming minerals (e.g., olivine, micas, pyroxenes, amphiboles) and accessory minerals, such as pyrite [106]. We considered pyrite may be a major source of Ni because SO4 in bottled water has a significant correlation with PC1.

4.3. Natural Background Levels in Shallow to Moderately Deep Bedrock Groundwater in South Korea

The water quality of Ca-HCO3-type bottled groundwater, shown in Table 2 and Table 3 with the elimination of the four outliers in Figure 2, as in [19], represents the hydrochemistry of short-circulating and non-contaminated groundwater occurring in pristine bedrock aquifers based on the following facts: The dominant Ca-HCO3-type bottled waters with low TDS and NO3 from bedrock aquifers (~200 m depth), regardless of geology (see Figure 2), are consistent with the most common groundwater types with low TDS and nitrate in the bedrock aquifers of the NGMN in South Korea (n = 299; Figure 7) and correspond to one of the dominant geochemical groups, called fresh (dilute) bedrock groundwater, by [70]. According to Kim et al. [70], the dilute bedrock groundwater exhibits low TDS due to low degrees of water–rock interaction during groundwater flow after recharge from rainwater and shows the relatively high proportions of Ca and HCO3 because Ca and HCO3 can rapidly increase by the congruent dissolution of carbonates, such as disseminated calcite [107,108]. In addition, plagioclase feldspars are very reactive among the major rock-forming minerals in crystalline rocks [109], and thus, among cations, Ca and Na are preferentially dissolved into the groundwater as the major cations [110]. Then, the dilute bedrock groundwater can evolve to either alkaline Na-HCO3-type water (e.g., N22) through cation exchange [68,69,70] or Ca-Cl-type water (e.g., N12) through mixing with old Na-Cl-type water and reverse cation exchange [111,112] as residence time increases with increasing depth.
Thus, we now provide the 90th percentiles in the statistical distribution of the hydrochemical parameters of Ca-HCO3-type bottled water (Table 2 and Table 3; Supplementary Figures S1–S3) as the NBLs of dilute bedrock groundwater in South Korea, following the approach of the EU’s BRIDGE (Background Criteria for the Identification of Groundwater Thresholds) project [2,6,12,19]. The EU’s BRIDGE project proposed three methods to estimate NBLs: (1) the 97.7th percentile of a statistical distribution if the hydrochemical properties of the samples from a target aquifer are well proven to be free from human impact, (2) the 90th percentile after removing samples failing to meet the criteria (e.g., charge balance error under ±10%, nitrate concentration below 10 mg/L) if the data are insufficient to characterize the groundwater body, and (3) the 90th percentile of the data from the same type of aquifer in other countries if only a few samples are available to define the NBLs. Note that we did not eliminate the sample (N11) with the NO3 concentration (10.01 mg/L) slightly above 10 mg/L when assessing the NBLs (Supplementary Figure S1) because the NO3 concentration did not deviate significantly from 10 mg/L, and there were no obvious pollution sources (e.g., agricultural fields) around the source well. In addition, the BRIDGE project considers the redox conditions of aquifers as PS criteria since the redox state of aquifers can affect their hydrogeochemistry and thus the determination of the NBLs. However, the redox could not be considered using bottled water because the redox conditions of source groundwater were disturbed during treatment and packing. For instance, the aeration process might affect Fe concentrations in bottled water.
As a result, the NBL of NO3 is suggested to be 7.9 mg/L (Table 2; Supplementary Figure S1), which is far lower than the drinking water standards of WHO (50 mg/L) and South Korea (44.3 mg/L), a little higher than the thresholds for anthropogenic pollution in South Korea (i.e., 5.5 mg/L for alluvial aquifers and 3.0 mg/L for bedrock aquifers) suggested by [63], and similar to the 90th percentile of European bottled water (8.8 mg/L; n = 1785) [11]. According to Marcussen et al. [10], the concentration levels of dissolved constituents in European bottled water represent natural European groundwater quality barely affected by anthropogenic activities, despite a few issues such as bottle leaching (e.g., Sb from PET package). Thus, we consider the chemical composition of European bottled water (n = 1785) as a proxy of less polluted European groundwater quality and take the 90th percentiles as the NBLs of European groundwater for the comparison with those of South Korean bottled water as the NBLs shown in Table 2 and Table 3.
Although the NBLs of nitrate are similar, the 90th percentiles of European bottled waters are significantly higher than those of South Korean bottled water for the other major ions, except F (Table 2). This is probably because South Korean Ca-HCO3-type bottled water represents a relatively more diluted bedrock groundwater with lower TDS through shorter circulating pathways. On the other hand, the similar NBLs of F (0.9 mg/L) are likely due to the geology containing F-rich minerals typically found in South Korea.
Among the 20 trace elements, 7 elements (i.e., B, Hg, Rb, Sr, Cs, Ni, ands) show higher 90th percentiles in EU bottled water than in South Korean bottled water (Table 3). In contrast, the 90th percentiles of As, Hf, Sn, Ta, Th, Tl, Zr, Cr, Eu, Mo, U, V, and W are higher in South Korean bottled water than in EU bottled water. In particular, Hf, Ta, and Th show significantly higher levels in South Korean bottled water, at least 10 times higher than those in EU bottled water. Trace elements such as Hf, Sn, Ta, Th, Tl, Eu, U, and W are known to increase in felsic (granitic) rocks compared to other rock types [11]. The geological characteristics of South Korea, mostly consisting of granitoids or granitic gneiss, and the production of bottled water dominantly (84%) from aquifers of granitic composition (Table 1), seem to cause the observed tendency of elevation or depletion for some trace elements in South Korean bottled water. We acknowledge that the much smaller number of South Korean bottled water samples compared with the number of European bottled water samples(n = 1785) also may affect the results, which remains future work with the temporal variation in NBLs.

5. Conclusions and Suggestions

The hydrochemistry of South Korean bottled mineral waters (n = 37) is identified to have a dominant groundwater type (the Ca-HCO3 type) and three other minor types (Mg-Na-HCO3, Ca-Cl and Na-HCO3 types), consistent with the previous results on the hydrochemistry of bedrock aquifers from the Korean National Groundwater Monitoring Network. Major hydrogeochemical processes for the dominant Ca-HCO3-type bottled water (n = 33) include the dissolution of highly reactive minerals (e.g., carbonates and Ca-bearing plagioclase; PC1) and the dissolution of Na-plagioclase and cation exchange (PC2), whereas the four outliers are explained by the regional geology around the source wells. For the 20 trace elements that are often detected and for which the median values exceed the concentrations leachable from PET bottles, their concentrations were assessed regarding major hydrochemical processes (i.e., PC1 and PC2) after the left-censored data were imputed using the log-ratio expectation-maximization method, which showed the high correlation of Cs, Rb, and Sr with PC1 and indicates that PC1 nicely addresses the dissolution of reactive minerals in bedrock.
The PCA results, along with the low TDS, F, and NO3 concentrations, indicate that the water quality of Ca-HCO3-type bottled mineral waters (n = 33) represents the less mineralized and uncontaminated bedrock groundwater in the pristine aquifers of South Korea. The low degree of water–rock interaction through short-circulating recharge pathways of rainwater to boreholes for bottled water is probably because of the highly fractured bedrock below the shallow soil layers, resulting in the groundwater mixing below the bottom of the casing for the 200-m boreholes. Moreover, the boreholes are installed to avoid high F content because the geology typically found in South Korea is associated with high F levels.
Based on the study results, it is concluded that the Ca-HCO3-type bottled water can be used as a proxy for shallow-to-intermediate-depth fractured bedrock groundwater. Thus, the 90th percentiles of the Ca-HCO3-type bottled waters are suggested for the NBLs of dilute bedrock groundwater for 11 major and 20 trace elements and were compared with the 90th percentiles of EU bottled water. Most major ions show higher 90th percentiles in EU bottled water, while NO3 and F show similar 90th percentiles in EU and South Korean bottled waters despite the different sample sizes, indicating that the suggested NBLs reflect water–rock interactions unaffected by anthropogenic activities and can be used as baselines for groundwater management. In addition, this study shows that the left-censored data should be imputed to present the distribution of trace element concentrations without distortion and to subject them to further statistical analysis, such as PCA. As was proven in many geochemical studies, PCA is very effective for assessing the major geochemical processes and fro identifying geological effects on groundwater quality despite the low degree of water–rock interactions.

Supplementary Materials

The following supporting information can be downloaded at https://www.mdpi.com/article/10.3390/w14091457/s1 Table S1: Detection limit (D.L.) and accuracy of 48 trace elements determined by ICP Mass spectrometry; Table S2: Advantages and disadvantages of imputation methods and their functions in R software; Table S3: Minimum, mean, and standard deviation (Std. Dev.) determined by 3 imputation methods for 9 trace elements in South Korean bottled water samples (n = 33). The imputed values by lrEM are also shown in Supplementary Figure S3; Table S4: Physicochemical parameters of bottled mineral water samples classified as outliers (n = 4; see Figure 2). Bold italic numbers indicate the values exceeding the maximum concentration of the Ca-HCO3-type water samples (see Table 2 and Table 3); Figure S1: Cumulative density plots of 11 major elements for the Ca-HCO3-type bottled water samples (n = 33). The 90th percentile was suggested for the natural background levels (NBLs); Figure S2: Cumulative density plots of 11 trace elements which were detected in all the 33 Ca-HCO3-type bottled water samples and exceeded the maximum concentration levels leachable from PET bottles. The 90th percentile was suggested for the natural background levels (NBLs); Figure S3: Cumulative density plots of 9 trace elements, the non-detected data of which were imputed by the lrEM method for the Ca-HCO3-type bottled water samples (n = 33). The 90th percentile was suggested for the natural background levels (NBLs). D.L. indicates detection limits in Supplementary Table S1. Reference [113] is cited in the supplementary materials.

Author Contributions

The authors have contributed to this work as follows: conceptualization, S.-T.Y., K.-G.K., S.-H.M. and M.-S.K.; methodology, K.-J.L., S.Y., K.-H.K. and S.-T.Y.; formal analysis, K.-J.L.; investigation, K.-J.L.; writing—original draft preparation, K.-J.L. and K.-H.K.; writing—review and editing, S.Y. and S.-T.Y.; supervision, S.-T.Y.; project administration, S.-T.Y.; funding acquisition, S.-T.Y. All authors have read and agreed to the published version of the manuscript.

Funding

This study was financially supported by the 2021 project from the Jeju Province Development Corporation (JPDC). Dr. S.H. Moon, Mr. S.E. Lee, and other researchers at JPDC helped us to obtain the hydrochemical data sets for this study. Partial support was also provided by a National Institute of Environmental Research project (20190210474-00) that was funded by the Korean Ministry of Environment.

Institutional Review Board Statement

Not applicable.

Informed Consent Statement

Not applicable.

Data Availability Statement

Not applicable.

Conflicts of Interest

The authors declare no conflict of interest.

References

  1. Banks, D.; Reimann, C.; Røyset, O.; Skarphagen, H.; Sæther, O.M. Natural concentrations of major and trace elements in some Norwegian bedrock groundwaters. Appl. Geochem. 1995, 10, 1–16. [Google Scholar] [CrossRef]
  2. Müller, D.; Blum, A.; Hart, A.; Hookey, J.; Kunkel, R.; Scheidleder, A.; Tomlin, C.; Wendland, F. Final Proposal for a Methodology to Set up Groundwater Threshold Values in Europe. Report to the EU Project “BRIDGE”. 2006. Available online: http://www.keriel.org/BIB/Publ_UNESCO/SOG_BRIDGE/Deliverables/WP3/D18.pdf (accessed on 26 March 2022).
  3. Sellerino, M.; Forte, G.; Ducci, D. Identification of the natural background levels in the Phlaegrean fields groundwater body (Southern Italy). J. Geochem. Explor. 2019, 200, 181–192. [Google Scholar] [CrossRef]
  4. Jiang, H.H.; Cai, L.M.; Wen, H.H.; Luo, J. Characterizing pollution and source identification of heavy metals in soils using geochemical baseline and PMF approach. Sci. Rep. 2020, 10, 1–11. [Google Scholar]
  5. Bondu, R.; Humez, P.; Mayer, B.; Chaste, E.; Naumenko-Dèzes, M.O.; Cloutier, V.; Rosa, E.; Kloppmann, W. Estimating natural background concentrations for dissolved constituents in groundwater: A methodological review and case studies for geogenic fluoride. J. Geochemical Explor. 2022, 233, 106906. [Google Scholar] [CrossRef]
  6. Voutchkova, D.D.; Ernstsen, V.; Schullehner, J.; Hinsby, K.; Thorling, L.; Hansen, B. Roadmap for determining natural background levels of trace metals in groundwater. Water 2021, 13, 1267. [Google Scholar] [CrossRef]
  7. Molinari, A.; Guadagnini, L.; Marcaccio, M.; Guadagnini, A. Natural background levels and threshold values of chemical species in three large-scale groundwater bodies in Northern Italy. Sci. Total Environ. 2012, 425, 9–19. [Google Scholar] [CrossRef] [PubMed]
  8. Cruz, J.V.; Andrade, C. Natural background groundwater composition in the Azores archipelago (Portugal): A hydrogeochemical study and threshold value determination. Sci. Total Environ. 2015, 520, 127–135. [Google Scholar] [CrossRef]
  9. Reimann, C.; Garrett, R.G. Geochemical background—concept and reality. Sci. Total Environ. 2005, 350, 12–27. [Google Scholar] [CrossRef]
  10. Marcussen, H.; Holm, P.E.; Hansen, H.C.B. Composition, flavor, chemical foodsafety, and consumer preferences of bottled water. Compr. Rev. Food Sci. Food Saf. 2013, 12, 333–352. [Google Scholar] [CrossRef]
  11. Reimann, C.; Birke, M. Geochemistry of European Bottled Water; Borntraeger Science Publishers: Stuttgart, Germany, 2010; ISBN 978-3-443-01067-6. [Google Scholar]
  12. Hinsby, K.; Condesso de Melo, M.T.; Dahl, M. European case studies supporting the derivation of natural background levels and groundwater threshold values for the protection of dependent ecosystems and human health. Sci. Total Environ. 2008, 401, 1–20. [Google Scholar] [CrossRef]
  13. Wendland, F.; Berthold, G.; Blum, A.; Elsass, P.; Fritsche, J.G.; Kunkel, R.; Wolter, R. Derivation of natural background levels and threshold values for groundwater bodies in the Upper Rhine Valley (France, Switzerland and Germany). Desalination 2008, 226, 160–168. [Google Scholar] [CrossRef]
  14. Griffioen, J.; Passier, H.F.; Klein, J. Comparison of selection methods to deduce natural background levels for groundwater units. Environ. Sci. Technol. 2008, 42, 4863–4869. [Google Scholar] [CrossRef] [PubMed]
  15. Coetsiers, M.; Blaser, P.; Martens, K.; Walraevens, K. Natural background levels and threshold values for groundwater in fluvial Pleistocene and Tertiary marine aquifers in Flanders, Belgium. Environ. Geol. 2009, 57, 1155–1168. [Google Scholar] [CrossRef]
  16. European Commission. Common Implementation Strategy for the Water Framework Directive (2000/60/EC)—Guidance Document No. 18 Guidance on Groundwater Status and Trend Assessment; European Communities: Luxembourg, 2009. [Google Scholar]
  17. Rotiroti, M.; Fumagalli, L. Derivation of preliminary natural background levels for naturally Mn, Fe, As and NH4+ rich groundwater: The case study of Cremona area (Northern Italy). Rend. Online Soc. Geol. Ital. 2013, 24, 284–286. [Google Scholar]
  18. Preziosi, E.; Parrone, D.; Del Bon, A.; Ghergo, S. Natural background level assessment in groundwaters: Probability plot versus pre-selection method. J. Geochemical Explor. 2014, 143, 43–53. [Google Scholar] [CrossRef]
  19. Zhang, Y.; Chen, Z.; Sun, J.; Wang, J. Natural background levels of chemical components in groundwater of Hutuo River catchment area, North China Plain. Environ. Forensics 2017, 18, 62–73. [Google Scholar] [CrossRef]
  20. Apollaro, C.; Di Curzio, D.; Fuoco, I.; Buccianti, A.; Dinelli, E.; Vespasiano, G.; Castrignanò, A.; Rusi, S.; Barca, D.; Figoli, A.; et al. A multivariate non-parametric approach for estimating probability of exceeding the local natural background level of arsenic in the aquifers of Calabria region (Southern Italy). Sci. Total Environ. 2022, 806, 150345. [Google Scholar] [CrossRef]
  21. Hawkes, H.E.; Webb, J.S. Geochemistry in Mineral Exploration; Harper and Row: New York, NY, USA, 1962; ISBN 978-0060427108. [Google Scholar]
  22. Reimann, C.; Filzmoser, P.; Garrett, R.G. Background and threshold: Critical comparison of methods of determination. Sci. Total Environ. 2005, 346, 1–16. [Google Scholar] [CrossRef]
  23. Wendland, F.; Hannappel, S.; Kunkel, R.; Schenk, R.; Voigt, H.J.; Wolter, R. A procedure to define natural groundwater conditions of groundwater bodies in Germany. Water Sci. Technol. 2005, 51, 249–257. [Google Scholar] [CrossRef]
  24. Panno, S.; Kelly, W.; Martinsek, A.; Hackley, K. Estimating background and threshold nitrate concentrations using probability graphs. Ground Water 2006, 44, 697–709. [Google Scholar] [CrossRef]
  25. Walter, T.; Beer, A.; Brose, D.; Budziak, D.; Clos, P.; Dreher, T.; Fritsche, H.G.; Hübschmann, M.; Marczinek, S.; Peters, A.; et al. Determining natural background values with probability plots. In Groundwater Quality Sustainability; Piotr, M., Stanislaw, W., Grzegorz, M., Eds.; CRC Press: London, UK, 2012; pp. 331–342. [Google Scholar]
  26. Atega, P.L.E.; Vinches, M.; Casiot, C.; Pistre, S. Development and implementation of a multi-criteria aggregation operator to estimate the contributions of the natural geochemical background and anthropogenic inputs in groundwater in former mining regions: An application to arsenic and antimony in the Gardon river watershed (southern France). Sci. Total Environ. 2022, 814, 151936. [Google Scholar]
  27. NGII. The National Atlas of Korea; Volume 2. 2017. Available online: http://nationalatlas.ngii.go.kr/pages/page_668.php (accessed on 24 January 2022).
  28. Turek, A.; Kim, C.B. U-Pb zircon ages for Precambrian rocks in southwestern Ryeongnam and southwestern Gyeonggi massifs, Korea. Geochem. J. 1996, 30, 231–249. [Google Scholar] [CrossRef]
  29. Cho, B.W.; Kim, M.S.; Kim, T.S.; Yun, U.; Lee, B.D.; Hwang, J.H.; Choo, C.O. Characteristics of occurrence and distribution of natural radioactive materials, uranium and radon in groundwater of the Danyang area. J. Eng. Geol. 2013, 23, 399–407. (In Korean) [Google Scholar]
  30. Cho, B.W.; Sung, H.I.; Choo, C.O.; Lee, B.D.; Kim, T.K. Hydrochemical characteristics of natural mineral water in the Daebo and Bulguksa granites. J. Eng. Geol. 1998, 8, 247–259. (In Korean) [Google Scholar]
  31. Tsusue, A.; Mizuta, T.; Watanabe, M.; Min, K.G. Jurassic and Cretaceous granitic rocks in South Korea. Min. Geol. 1981, 31, 261–280. [Google Scholar]
  32. Uchida, E.; Choi, S.G.; Baba, D.; Wakisaka, Y. Petrogenesis and solidification depth of the Jurassic Daebo and Cretaceous Bulguksa granitic rocks in South Korea. Resour. Geol. 2012, 62, 281–295. [Google Scholar] [CrossRef]
  33. Choi, S.H.; Lee, J.; Park, C.; Moutte, J. Geochemistry of peridotite xenoliths in alkali basalts from Jeju Island, Korea. Isl. Arc 2002, 11, 221–235. [Google Scholar] [CrossRef]
  34. Tatsumi, Y.; Shukuno, H.; Yoshikawa, M.; Chang, Q.; Sato, K.; Lee, M. The petrology and geochemistry of volcanic rocks on Jeju Island: Plume magmatism along the Asian continental margin. J. Petrol. 2004, 46, 523–553. [Google Scholar] [CrossRef]
  35. Jeon, Y.M.; Sohn, Y.K. Sedimentary characteristics and stratigraphic implications of the Kusandong Tuff, Cretaceous Gyeongsang Basin, Korea. Geosci. J. 2003, 7, 53–64. [Google Scholar] [CrossRef]
  36. Hwang, B.H.; Son, M.; Yang, K.; Yoon, J.; Ernst, W.G. Tectonic evolution of the Gyeongsang Basin, southeastern Korea from 140 Ma to the present, based on a strike-slip and block rotation tectonic model. Int. Geol. Rev. 2008, 50, 343–363. [Google Scholar] [CrossRef]
  37. Chough, S.K. Geology and Sedimentology of the Korean Peninsula; Elsevier: London, UK, 2013; ISBN 9780124055124. [Google Scholar]
  38. MOCT. Master Plan for Groundwater Management of Korea: 2007~2011 (in Korean); Ministry of Construction & Transportation: Sejong, Korea, 2007.
  39. Jeon, S.K.; Koo, M.H.; Kim, Y.; Kang, I.O. Statistical analysis of aquifer characteristics using pumping test data of national groundwater monitoring well of Korea. J. Korean Soc. Environ. Eng. 2005, 10, 32–44. (In Korean) [Google Scholar]
  40. Chae, G.T.; Yun, S.T.; Mayer, B.; Kim, K.H.; Kim, S.Y.; Kwon, J.S.; Kim, K.; Koh, Y.K. Fluorine geochemistry in bedrock groundwater of South Korea. Sci. Total Environ. 2007, 385, 272–283. [Google Scholar] [CrossRef] [PubMed]
  41. Edmunds, W.M.; Smedley, P.L. Fluoride in natural waters. In Essentials of Medical Geology; Selinus, O., Alloway, B., Centeno, J.A., Finkelman, R.B., Fuge, R., Lindh, U., Smedley, P.L., Eds.; Springer: Amsterdam, The Netherlands, 2013; pp. 311–336. [Google Scholar]
  42. Lee, J.U.; Chon, H.T.; John, Y.W. Geochemical characteristics of deep granitic groundwater in Korea. J. Korean Soc. Groundw. Environ. (Korea) 1997, 4, 199–211. (In Korean) [Google Scholar]
  43. Cho, B.W.; Lee, B.D.; Lee, I.H.; Choo, C.O. Speculation on the water quality for the natural mineral water. J. Eng. Geol. 2002, 12, 395–404. (In Korean) [Google Scholar]
  44. Son, D.; Park, S.; Jeong, G.C. A Study on the water withdrawal permit rate and monitoring well management of bottled water manufacturers. J. Eng. Geol. 2019, 29, 329–337. (In Korean) [Google Scholar]
  45. KIGAM. Study on an Improvement Plan for Proper Management of Drinking Water Production Wells (in Korean); Ministry of Environment: Sejong, Korea, 2019.
  46. Koh, D.C.; Ko, K.S. Recent trends of domestic and international management and research of natural mineral water used for bottled water. J. Korean Soc. Environ. Eng. 2018, 23, 9–27. (In Korean) [Google Scholar]
  47. Ra, W.C. Analysis of the Chinese bottled water market and export strategy for Korean firms. Korea Trade Rev. 2014, 39, 77–108. (In Korean) [Google Scholar]
  48. Bong, Y.S.; Ryu, J.S.; Lee, K.S. Characterizing the origins of bottled water on the South Korean market using chemical and isotopic compositions. Anal. Chim. Acta 2009, 631, 189–195. [Google Scholar] [CrossRef]
  49. Kim, G.E.; Ryu, J.S.; Shin, W.J.; Bong, Y.S.; Lee, K.S.; Choi, M.S. Chemical and isotopic compositions of bottled waters sold in Korea: Chemical enrichment and isotopic fractionation by desalination. Rapid Commun. Mass Spectrom. 2012, 26, 25–31. [Google Scholar] [CrossRef]
  50. Kim, G.E.; Shin, W.J.; Ryu, J.S.; Choi, M.S.; Lee, K.S. Identification of the origin and water type of various Korean bottled waters using strontium isotopes. J. Geochem. Explor. 2013, 132, 1–5. [Google Scholar] [CrossRef]
  51. Lee, B.D.; Oh, Y.H.; Cho, B.W.; Yun, U.; Choo, C.O. Hydrochemical properties of ground water used for Korea bottled waters in relation to geology. Water 2019, 11, 1043. [Google Scholar] [CrossRef]
  52. Shin, W.J.; Ryu, J.S.; Shin, H.S.; Jung, Y.Y.; Ko, K.S.; Lee, K.S. Major and trace element geochemistry of Korean bottled waters. Water 2020, 12, 2585. [Google Scholar] [CrossRef]
  53. Lee, J.Y.; Yi, M.J.; Yoo, Y.K.; Ahn, K.H.; Kim, G.B.; Won, J.H. A review of the national groundwater monitoring network in Korea. Hydrol. Process. 2007, 21, 907–919. [Google Scholar] [CrossRef]
  54. Westerhoff, P.; Prapaipong, P.; Shock, E.; Hillaireau, A. Antimony leaching from polyethylene terephthalate (PET) plastic used for bottled drinking water. Water Res. 2008, 42, 551–556. [Google Scholar] [CrossRef]
  55. Helena, B.; Pardo, R.; Vega, M.; Barrado, E.; Fernandez, J.M.; Fernandez, L. Temporal evolution of groundwater composition in an alluvial aquifer (Pisuerga River, Spain) by principal component analysis. Water Res. 2000, 34, 807–816. [Google Scholar] [CrossRef]
  56. Güler, C.; Thyne, G.; McCray, J.; Turner, K. Evaluation of graphical and multivariate statistical methods for classification of water chemistry data. Hydrogeol. J. 2002, 10, 455–474. [Google Scholar] [CrossRef]
  57. Thyne, G.; Güler, C.; Poeter, E. Sequential analysis of hydrochemical data for watershed characterization. Ground Water 2004, 42, 711–723. [Google Scholar] [CrossRef]
  58. Kim, K.H.; Yun, S.T.; Choi, B.Y.; Chae, G.T.; Joo, Y.; Kim, K.; Kim, H.S. Hydrochemical and multivariate statistical interpretations of spatial controls of nitrate concentrations in a shallow alluvial aquifer around oxbow lakes (Osong area, central Korea). J. Contam. Hydrol. 2009, 107, 114–127. [Google Scholar] [CrossRef]
  59. Holland, S.M. Principal components analysis (PCA); Department of Geology, University of Georgia: Athens, Georgia, 2008. [Google Scholar]
  60. Bolks, A.; DeWire, A.; Harcum, J.B. Baseline Assessment of Left-Censored Environmental Data Using R.; Tech Notes 10; 2014. Available online: https://www.epa.gov/polluted-runoff-nonpointsource-pollution/nonpoint-source-monitoring-technical-notes (accessed on 26 March 2022).
  61. Palarea-Albaladejo, J.; Martín-Fernández, J.A. ZCompositions—R package for multivariate imputation of left-censored data under a compositional approach. Chemom. Intell. Lab. Syst. 2015, 143, 85–96. [Google Scholar] [CrossRef]
  62. Husson, A.F.; Josse, J.; Le, S.; Mazet, J.; Husson, M.F. Package ‘FactoMineR’. 2020. Available online: https://cran.r-project.org/web/packages/FactoMineR/FactoMineR.pdf (accessed on 26 March 2022).
  63. Kim, K.H.; Yun, S.T.; Kim, H.K.; Kim, J.W. Determination of natural backgrounds and thresholds of nitrate in South Korean groundwater using model-based statistical approaches. J. Geochem. Explor. 2015, 148, 196–205. [Google Scholar] [CrossRef]
  64. Maghrebi, M.; Noori, R.; Partani, S.; Araghi, A.; Barati, R.; Farnoush, H.; Haghighi, A.T. Iran’s groundwater hydrochemistry. Earth Space Sci. 2021, 8, e2021EA001793. [Google Scholar] [CrossRef]
  65. Join, J.L.; Coudray, J.; Longworth, K. Using principal components analysis and Na/Cl ratios to trace groundwater circulation in a volcanic island: The example of Reunion. J. Hydrol. 1997, 190, 1–18. [Google Scholar] [CrossRef]
  66. Koh, D.C.; Ko, K.S.; Kim, Y.; Lee, S.G.; Chang, H. Effect of agricultural land use on the chemistry of groundwater from basaltic aquifers, Jeju Island, South Korea. Hydrogeol. J. 2007, 15, 727–743. [Google Scholar] [CrossRef]
  67. Jung, H.W.; Yun, S.T.; Kim, K.H.; Oh, S.S.; Kang, K.G. Role of an impermeable layer in controlling groundwater chemistry in a basaltic aquifer beneath an agricultural field, Jeju Island, South Korea. Appl. Geochem. 2014, 45, 82–93. [Google Scholar] [CrossRef]
  68. Chae, G.T.; Yun, S.T.; Kim, K.; Mayer, B. Hydrogeochemistry of sodium-bicarbonate type bedrock groundwater in the Pocheon spa area, South Korea: Water–rock interaction and hydrologic mixing. J. Hydrol. 2006, 321, 326–343. [Google Scholar] [CrossRef]
  69. Gascoyne, M.; Kamineni, D.C. The hydrogeochemistry of fractured plutonic rocks in the Canadian Shield. Appl. Hydrogeol. 1994, 2, 43–49. [Google Scholar] [CrossRef]
  70. Kim, K.H.; Yun, S.T.; Yu, S.; Choi, B.Y.; Kim, M.J.; Lee, K.J. Geochemical pattern recognitions of deep thermal groundwater in South Korea using self-organizing map: Identified pathways of geochemical reaction and mixing. J. Hydrol. 2020, 589, 125202. [Google Scholar] [CrossRef]
  71. Toran, L.E.; Saunders, J.A. Modeling alternative paths of chemical evolution of Na-HCO3-type groundwater near Oak Ridge, Tennessee, USA. Hydrogeol. J. 1999, 7, 355–364. [Google Scholar] [CrossRef]
  72. WHO. Guidelines for Drinking-Water Quality, 3rd ed.; Volume 1—Recommendations Incorporating the First and Second Addenda; World Health Organization: Geneva, Swiss, 2008; ISBN 978-92-4-154761-1. [Google Scholar]
  73. ME. Drinking Water Quality Standards of South Korea (in Korean); Ministry of Environment: Sejong, Korea, 2019.
  74. Lee, P.K.; Chae, B.G.; Yu, S.; Choi, J.; Oh, C.; Ji, S.W. Assessment of the alteration and acid-generating potential of deep boreholes for geological disposal. Environ. Earth Sci. 2016, 75, 572. [Google Scholar] [CrossRef]
  75. Welch, A.H.; Stollenwerk, K.G. Arsenic in Ground Water—Geochemistry and Occurrence; Kluwer Academic Publishers Group: Dordrecht, The Netherlands, 2003; ISBN 978-1402073175. [Google Scholar]
  76. Ahmed, K.M.; Bhattacharya, P.; Hasan, M.A.; Akhter, S.H.; Alam, S.M.M.; Bhuyian, M.A.H.; Imam, M.B.; Khan, A.A.; Sracek, O. Arsenic enrichment in groundwater of the alluvial aquifers in Bangladesh: An overview. Appl. Geochem. 2004, 19, 181–200. [Google Scholar] [CrossRef]
  77. Fuoco, I.; De Rosa, R.; Barca, D.; Figoli, A.; Gabriele, B.; Apollaro, C. Arsenic polluted waters: Application of geochemical modelling as a tool to understand the release and fate of the pollutant in crystalline aquifers. J. Environ. Manage. 2022, 301, 113796. [Google Scholar] [CrossRef] [PubMed]
  78. Shin, W.; Oh, J.; Choung, S.; Cho, B.W.; Lee, K.S.; Yun, U.; Woo, N.C.; Kim, H.K. Distribution and potential health risk of groundwater uranium in Korea. Chemosphere 2016, 163, 108–115. [Google Scholar] [CrossRef] [PubMed]
  79. Adams, J.A.; Osmond, J.K.; Rogers, J.J. The geochemistry of thorium and uranium. Phys. Chem. Earth 1959, 3, 298–348. [Google Scholar] [CrossRef]
  80. Hwang, J. Occurrence of U-minerals and Source of U in groundwater in daebo granite, Daejeon area. J. Eng. Geol. 2013, 23, 399–407. (In Korean) [Google Scholar] [CrossRef]
  81. Drever, J.I. The Geochemistry of Natural Waters: Surface and Groundwater Environments; Prentice Hall: Upper Saddle River, NJ, USA, 1997; ISBN 978-0132727907. [Google Scholar]
  82. Nordstrom, D.K.; Andrews, J.N.; Carlsson, L.; Fontes, J.C.; Frits, P.; Moser, H.; Olsson, T. Hydrogeological and Hydrogeochemical Investigations in Boreholes—Final Report of the Phase I Geochemical Investigations of the Stripa Groundwaters; Swedish Nuclear Fuel and Waste Management Co.: Stockholm, Sweden, 1985. [Google Scholar]
  83. Nordstroem, D.K.; Lindblom, S.; Donahoe, R.J.; Barton, C.C. Fluid inclusions in the Stripa granite and their possible influence on the groundwater chemistry. Geochim. Cosmochim. Acta 1989, 53, 1741–1755. [Google Scholar] [CrossRef]
  84. Fontes, J.C.; Fritz, P.; Louvat, D.; Michelot, J.L. Aqueous sulphates from the Stripa groundwater system. Geochim. Cosmochim. Acta 1989, 53, 1783–1789. [Google Scholar] [CrossRef]
  85. Al-Khashman, O.A. Chemical characteristics of rainwater collected at a western site of Jordan. Atmos. Res. 2009, 91, 53–61. [Google Scholar] [CrossRef]
  86. Yu, S.; Chae, G.; Oh, J.; Kim, S.H.; Kim, D.I.; Yun, S.T. Hydrochemical and isotopic difference of spring water depending on flow type in a stratigraphically complex karst area of South Korea. Front. Earth Sci. 2021, 736, 712865. [Google Scholar] [CrossRef]
  87. Srivastava, S.K.; Ramanathan, A.L. Geochemical assessment of groundwater quality in vicinity of Bhalswa landfill, Delhi, India, using graphical and multivariate statistical methods. Environ. Geol. 2007, 53, 1509–1528. [Google Scholar] [CrossRef]
  88. Kumar, M.; Ramanathan, A.; Keshari, A.K. Understanding the extent of interactions between groundwater and surface water through major ion chemistry and multivariate. Hydrol. Process. 2009, 23, 297–310. [Google Scholar] [CrossRef]
  89. Luo, W.; Gao, X.; Zhang, X. Geochemical processes controlling the groundwater chemistry and fluoride contamination in the yuncheng basin, China—An area with complex hydrogeochemical conditions. PLoS ONE 2018, 13, e0199082. [Google Scholar] [CrossRef] [PubMed]
  90. Frengstad, B.; Banks, D. The natural inorganic chemical quality of crystalline bedrock groundwaters of Norway. In Natural Groundwater Quality; Edmunds, W.M., Shand, P., Eds.; Blackwell Publishing Ltd.: Malden, MA, USA, 2008; pp. 421–440. [Google Scholar]
  91. Fuoco, I.; Marini, L.; De Rosa, R.; Figoli, A.; Gabriele, B.; Apollaro, C. Use of reaction path modelling to investigate the evolution of water chemistry in shallow to deep crystalline aquifers with a special focus on fluoride. Sci. Total Environ. 2022, 830, 154566. [Google Scholar] [CrossRef] [PubMed]
  92. Frengstad, B.S.; Lax, K.; Tarvainen, T.; Jæger, Ø.; Wigum, B.J. The chemistry of bottled mineral and spring waters from Norway, Sweden, Finland and Iceland. J. Geochem. Explor. 2010, 107, 350–361. [Google Scholar] [CrossRef]
  93. Chae, G.T.; Yun, S.T.; Kwon, M.J.; Kim, S.Y.; Mayer, B. Batch dissolution of granite and biotite in water: Implication for fluorine geochemistry in groundwater. J. Hydrol. 2006, 40, 95–102. [Google Scholar] [CrossRef]
  94. Sung, I.H.; Choo, C.O.; Cho, B.W.; Lee, B.D.; Kim, T.K.; Lee, I.H. Hydrochemical properties of the groundwater used for the natural mineral waters in Precambrian metamorphic terrains, Korea. J. Korean Soc. Environ. Eng. 1998, 5, 203–209. (In Korean) [Google Scholar]
  95. Wakatsuki, T.; Tanaka, Y.; Matsukura, Y. Soil slips on weathering-limited slopes underlain by coarse-grained granite or fine-grained gneiss near Seoul, Republic of Korea. Catena 2005, 60, 181–203. [Google Scholar] [CrossRef]
  96. Kim, K.; Jeong, G.Y. Factors influencing natural occurrence of fluoride-rich groundwaters: A case study in the southeastern part of the Korean Peninsula. Chemosphere 2005, 58, 1399–1408. [Google Scholar] [CrossRef]
  97. Yun, S.T.; Chae, G.T.; Koh, Y.K.; Kim, S.R.; Choi, B.Y.; Lee, B.H.; Kim, S.Y. Hydrogeochemical and environmental isotope study of groundwaters in the Pungki area. J. Kor. Soc. Environ. Eng. 1998, 5, 177–191. (In Korean) [Google Scholar]
  98. Lee, J.Y.; Lee, K.K. Use of hydrologic time series data for identification of recharge mechanism in a fractured bedrock aquifer system. J. Hydrol. 2000, 229, 190–201. [Google Scholar] [CrossRef]
  99. Joo, Y.; Brumback, B.; Lee, K.; Yun, S.T.; Kim, K.H.; Joo, C. Clustering of temporal profiles using a Bayesian logistic mixture model: Analyzing groundwater level data to understand the characteristics of urban groundwater recharge. J. Agric. Biol. Environ. Stat. 2009, 14, 356–373. [Google Scholar] [CrossRef]
  100. Chae, G.T.; Yun, S.T.; Kim, D.S.; Kim, K.H.; Joo, Y. Time-series analysis of three years of groundwater level data (Seoul, South Korea) to characterize urban groundwater recharge. Q. J. Eng. Geol. Hydrogeol. 2010, 4, 117–127. [Google Scholar] [CrossRef]
  101. Koo, J.; Kim, G.; Hwang, Y. Groundwater age analysis using tritium in gneiss of the Samkwang mine in Korea. J. Environ. Sci. Health Part A Environ. Sci. Eng. Toxicol. 1995, 30, 2093–2109. [Google Scholar] [CrossRef]
  102. Choi, B.Y.; Yun, S.T.; Yu, S.; Lee, P.K.; Park, S.S.; Chae, G.T.; Mayer, B. Hydrochemistry of urban groundwater in Seoul, South Korea: Effects of land-use and pollutant recharge. Environ. Geol. 2005, 48, 979–990. [Google Scholar] [CrossRef]
  103. Lee, J.M.; Ko, K.S.; Woo, N.C. Characterization of groundwater level and water quality by classification of aquifer types in South Korea. Econ. Environ. Geol. (Korea) 2020, 53, 619–629. (In Korean) [Google Scholar]
  104. Edmunds, W.M.; Smedley, P.L. Residence time indicators in groundwater: The East Midlands Triassic sandstone aquifer. Appl. Geochem. 2000, 15, 737–752. [Google Scholar] [CrossRef]
  105. Ford, R.G.; Wilkin, R.T.; Puls, R.W. Monitored Natural Attenuation of Inorganic Contaminants in Ground Water—Volume 2: Assessment for non-Radionuclides Including Arsenic, Cadmium, Chromium, Copper, Lead, Nickel, Nitrate, Perchlorate and Selenium; USA Environmental Protection Agency: Washington, DC, USA, 2007.
  106. Shand, P.; Edmunds, W.M. The baseline inorganic chemistry of European groundwaters. In Natural groundwater quality; Edmunds, W.M., Shand, P., Eds.; Blackwell Publishing Ltd.: Malden, MA, USA, 2008; pp. 22–58. [Google Scholar]
  107. White, A.F.; Bullen, T.D.; Vivit, D.V.; Schulz, M.S.; Clow, D.W. The role of disseminated calcite in the chemical weathering of granitoid rocks. Geochim. Cosmochim. Acta 1999, 63, 1939–1953. [Google Scholar] [CrossRef]
  108. White, A.; Schulz, M.; Lowenstern, J.; Vivit, D.; Bullen, T. The ubiquitous nature of accessory calcite in granitoid rocks: Implications for weathering, solute evolution, and petrogenesis. Geochim. Cosmochim. Acta 2005, 69, 1455–1471. [Google Scholar] [CrossRef]
  109. Goldich, S.S. A study in rock-weathering. J. Geol. 1938, 46, 17–58. [Google Scholar] [CrossRef]
  110. Choi, B.Y.; Yun, S.T.; Kim, K.H.; Kim, J.W.; Kim, H.M.; Koh, Y.K. Hydrogeochemical interpretation of South Korean groundwater monitoring data using Self-Organizing Maps. J. Geochem. Explor. 2014, 137, 73–84. [Google Scholar] [CrossRef]
  111. Zaidi, F.; Nazzal, Y.; Jafri, M.; Naeem, M.; Ahmed, I. Reverse ion exchange as a major process controlling the groundwater chemistry in an arid environment: A case study from northwestern Saudi Arabia. Environ. Monit. Assess. 2015, 187, 607. [Google Scholar] [CrossRef]
  112. Kim, J.H.; Kim, K.H.; Thao, N.T.; Batsaikhan, B.; Yun, S.T. Hydrochemical assessment of freshening saline groundwater using multiple end-members mixing modeling: A study of Red River delta aquifer, Vietnam. J. Hydrol. 2017, 549, 703–714. [Google Scholar] [CrossRef]
  113. Hornung, R.W.; Reed, L.D.; Thao, N.T. Estimation of average concentration in the presence of nondetectable values. Appl. Occup. Environ. 1990, 5, 46–51. [Google Scholar] [CrossRef]
Figure 1. Maps of South Korea, showing (a) regional geology and (b) topography (elevation in m above sea level) with borehole locations for bottled water production (n = 37). In (a), Cretaceous granitoids and Tertiary to Cretaceous volcanic rocks are shown as one because they often occur together in time and space. In (b), 32 points are shown because 5 wells are located very close to the others at this scale.
Water 14 01457 g001
Figure 2. Durov diagram showing the hydrochemical types of South Korean bottled water samples (n = 37) classified, which were clustered into 7 groups according to geological units around boreholes. Four samples with hydrochemical types other than the Ca-HCO3 type were classified as outliers (see Supplementary Table S4). The geological units of the index are as follows (see also Table 1): VT and VQ = volcanic rocks; SL and SC = sedimentary rocks; MP and MO = metamorphic rocks; IN = intrusive rocks (see also Table 1).
Water 14 01457 g002
Figure 3. Principal component analysis (PCA) results for Ca-HCO3-type bottled water (n = 33), showing (a) loadings for physicochemical parameters (p = 11) and (b) scores for each sample. In (b), water samples are grouped into geological units around the borehole (see also Table 1): VT = Tertiary to Cretaceous volcanic rocks; SL = Cambro–Ordovician rocks of Great Limestone group; MP and MO = metamorphic rocks; IN = intrusive rocks.
Water 14 01457 g003
Figure 4. Assessment of natural processes (i.e., mineral dissolution and cation exchange) influencing hydrogeochemical characteristics of Ca-HCO3-type bottled water in South Korea (n = 33), showing (a) SiO2 versus HCO3 concentrations (in mM), (b) HCO3 versus Ca concentrations (in meq/L), (c) Ca/Na versus HCO3/Na molar ratios, and (d) Na + K—Cl versus (Ca + Mg)—(SO4 + HCO3) (in mM). Data points are colored with PC1 scores in (a,b) and PC2 scores in (c,d).
Water 14 01457 g004
Figure 5. Comparison of median concentrations of 20 chemical components of South Korean granitoids (n = 31) [32] and Ca-HCO3-type bottled water (n = 33). (a) rock to bottled water and (b) rock to bottled water/rock ratio.
Water 14 01457 g005
Figure 6. PC loading plots for 20 trace elements in Ca-HCO3-type bottled water in South Korea (n = 33). The seven shaded elements in Table 3 are not shown.
Water 14 01457 g006
Figure 7. Durov diagram comparing the hydrochemical types of South Korean bottled water samples (n = 37) of groundwater (n = 299) from South Korean National Groundwater Monitoring Network (NGMN) (modified after [110]).
Water 14 01457 g007
Table 1. Major geological units of bedrock aquifers in South Korea (after [53]) and the assignment of bottled mineral water samples according to the geology around boreholes.
Hydrogeological
Units
Geological UnitsLithologyAbbreviationsBottled Water
Samples for This Study
Volcanic rocksQuaternary volcanic rocksBasalt, trachybasalt, tuffVQN1, N2
Tertiary to Cretaceous volcanic rocksRhyolite, andesite, basaltic andesite, tuffVTN16, N27
Intrusive rocksCretaceous (Bulguksa) granitoidsMainly granite with minor diorite, gabbro, and hypabyssal igneous rocksINN4, N5, N6, N7, N8, N20, N21, N29, N36
Jurassic (Daebo) granitoids
Sedimentary rocksCretaceous clastic sedimentary rocks in Gyeongsang sedimentary basinMainly fluvial and lacustrine sedimentary rocks (sandstone, shale, others) with volcanic intercalationsSCN22
Cambro–Ordovician carbonate rocks of Great Limestone groups in Taebaeksan basinMarine carbonate rocks with interbedded clastic sedimentary rocksSLN3
Metamorphic rocksEarly Paleozoic metasedimentary rocks of Okcheon metamorphic beltPhyllite, slate, schist, quartzite, etc.MON28, N31, N32, N33, N34, N35, N37
Precambrian basement rocks of metamorphic complexMainly gneiss and schist with minor metabasiteMPN9, N10, N11, N12, N13, N14, N15, N17, N18, N19, N23, N24, N25, N26, N30
Table 2. Statistical summary of major physicochemical parameters of Ca-HCO3-type bottled water in South Korea (n = 33). WHO and South Korean drinking water quality standards are also shown.
VariablesMeanStd.dev.MinimumMedianQ90 aMaximumEU Q90 bWHO cSouth
Korea d
p-Value e
EC (μS/cm)177.383.465.0152.5298.6356.32546.0 0.04
TDS (mg/L)158.468.157.3142.0258.6312.2- 0.17
pH7.50.46.77.58.18.27.86.5–9.55.8–8.5 (4.5–9.5) f0.04
Ca (mg/L)24.012.48.021.243.049.1282.0 0.02
Mg (mg/L)4.13.40.42.98.714.571.0 0.00
Na (mg/L)7.94.41.66.513.122.3290.0 0.82
K (mg/L)0.90.50.20.71.32.815.0 0.00
SiO2 (mg/L)14.35.66.914.220.930.334.2 0.05
Cl (mg/L)4.62.81.43.88.512.3180.02502500.69
SO4 (mg/L)10.56.33.58.518.727.5447.0-2000.08
NO3 (mg/L)4.22.80.13.07.910.08.85044.30.38
HCO3 (mg/L)87.345.423.775.3163.9183.3- 0.05
F (mg/L)0.40.30.030.20.91.10.91.51.5 (2.0) f0.25
Br (mg/L)0.020.010.0010.010.00.06313.0 0.15
a 90th percentile of the statistical distribution; b 90th percentile value for European bottled water samples (n = 1785) (after [11]); c Drinking water quality standard of the World Health Organization [72]; d Drinking water quality standard of South Korea [73]; e Results of the Kruskal–Wallis H test to show significant hydrochemical differences in bottled water samples according geological unit (MP (n = 14), MO (n = 7), and IN (n = 9), excluding VT (n = 2) and SL (n = 1) in Figure 3b); f Data in parentheses are applied to spring and ground water for drinking.
Table 3. Statistical summary of 27 trace elements in South Korean Ca-HCO3-type bottled mineral waters (n = 33). WHO and South Korean drinking water quality standards are also shown. Seven, gray-shaded elements were excluded from further interpretation as their median concentrations were lower or similar to the maximum concentration level leachable from PET bottles.
Element (μg/L)N aMean bMean cStd.DevMinimumMedianQ90 eMaximumEU Q90 fWHOgSouth Korea hMax. from PET ip-Value l
Al04.41-3.080.673.569.1811.691320020036
As03.16-2.810.092.265.5510.942.31010-0.31
B06.48-8.800.693.8811.8646.066025001000-0.55
Ba017.24-41.450.703.7636.11228.26181700-36
Hf00.30-0.060.220.280.360.470.004--0.00140.75
Hg00.38-0.080.290.350.510.59-61-0.75
Rb01.55-1.620.121.142.578.9538--0.010.02
Sb00.46-0.410.040.340.772.090.5320--k
Sn00.10-0.020.060.100.130.160.031---0.46
Sr0215.40-195.7249.21115.72387.96843.054360--370.78
Ta00.13-0.020.100.130.150.16<0.005--0.0050.88
Th00.56-0.180.420.500.781.290.004---0.38
Tl00.11-0.050.060.080.170.170.039--0.011.00
Zr00.29-0.050.210.270.350.450.29--0.0730.57
Co140.090.050.05 d<0.010.040.110.170.12--0.16
Cr130.830.530.61 d<0.140.301.093.030.975050-0.96
Cs130.200.120.16 d<0.030.050.380.576.6--0.0150.01
Cu110.190.140.26 d<0.030.060.251.471.6200010000.68
Eu140.030.020.01 d<0.010.010.040.040.004--0.0090.17
Fe142.201.471.75 d<0.891.102.008.3712-300599
Mo13.683.576.04 d<0.111.159.7125.86270700.0060.45
Ni30.400.370.25 d<0.020.310.691.022.4---0.29
Ti90.150.120.10 d<0.050.080.280.370.3--0.07
U21.941.823.82 d<0.060.424.6320.252.415300.060.74
V50.970.830.87 d<0.020.632.273.550.88--0.060.67
W80.440.350.56 d<0.110.200.612.800.099---0.36
Zn24.434.168.67 d<0.031.545.4638.971130003000-0.31
a Number of observations below detection limits; b Mean value excluding non-detected data; c Mean value obtained after imputing missing values using the log-ratio expectation-maximization method (lrEM); d Standard deviation obtained after imputing missing values using lrEM; e 90th percentile of the statistical distribution; f 90th percentile of European bottled water samples (n = 1785) [11]; g Drinking water quality standard by World Health Organization [72]; h Drinking water quality standard of South Korea [73]; i Maximum concentration attainable by leaching of PET bottles [11]; k [54] found antimony between 0.095 to 0.521 ppb in PET bottles; l Results of the Kruskal–Wallis H test to show significant hydrochemical differences in bottled water samples according to geological unit (MP (n = 14), MO (n = 7), and IN (n = 9), excluding VT (n = 2) and SL (n = 1) in Figure 3b).
Publisher’s Note: MDPI stays neutral with regard to jurisdictional claims in published maps and institutional affiliations.

