Article

Assessment of Spatial Distribution and Temporal Variations of the Phreatic Groundwater Level Using Geostatistical Modelling: The Case of Oued Souf Valley—Southern East of Algeria

1
Department of Landscape Protection and Environmental Geography, University of Debrecen, 4032 Debrecen, Hungary
2
Laboratory of Geology and Environment (LGE), Université Frères Mentouri Constantine 1, Constantine 25020, Algeria
3
Research Laboratory of Civil and Hydraulic Engineering, Sustainable Development and Environment, Université de Biskra, Biskra 07000, Algeria
*
Author to whom correspondence should be addressed.
Water 2022, 14(9), 1415; https://doi.org/10.3390/w14091415
Submission received: 24 March 2022 / Revised: 20 April 2022 / Accepted: 25 April 2022 / Published: 28 April 2022
(This article belongs to the Section Hydrogeology)

Abstract

:
Since the beginning of the 1980s, several regions in the northern Sahara of Algeria have been confronting the rising groundwater. Among all these regions, Oued Souf Valley represented one of the most acute affected by this phenomenon. Due to the natural topography and the insufficient/weakness of water management and miscoordination between different sectors that are represented by intensive exploitation of deep groundwater reservoirs which returns to the shallow aquifer, absence of sewage and drainage network, leakage from drinking water supply system, the groundwater has raised to the surface or near to the surface, affecting the traditional cultural environment and urban areas and degrading all socio-economic aspects of the Oued Souf habitants. To preserve the Oued Souf environment, a vertical drainage system has been constructed. Consequently, in this research, an evaluation of the vertical drainage system performance and its impact on groundwater level stabilization has been performed by mapping the water table of the phreatic groundwater level using geostatistical modeling using ordinary kriging (OK) interpolation method, which has been applied to analyze the spatial and temporal structure of groundwater level fluctuation. Meanwhile, hierarchical cluster analysis (HCA) was applied for grouping the wells based on the groundwater fluctuations for 2008, 2009, 2014, 2016, 2018, and 2021. However, the vertical drainage system reflected a significant decline of groundwater from 2009 to 2018 due to the important drained volumes through it but another rising phenomenon might be threatening the region in the near future and this is what was indicated in the 2021 groundwater level data. Cluster analysis has generated four groups based on their fluctuation means that are increasing from the first group to the fourth group ascendingly. The first cluster grouped the drains that have a shallow depth (average mean of 5.91 mbgl) and declined over the clusters. The clusters are spatially combined with significant separation of the fourth cluster which represents the deepest group (12.89 mbgl). Based on this research, several factors are influencing the stability of the phreatic groundwater level and even the performance of the drainage system, the most important of which is the overexploitation from deep groundwater reservoirs such as complex terminal and continental intercalary (in drinking and irrigation) and even the illegal use of the phreatic groundwater with important quantities for irrigation and illegal industries.

1. Introduction

Groundwater is one of the most important elements of the water cycle and is found almost everywhere beneath the Earth’s surface (hills, mountains, plains, deserts, coasts, and even seas and oceans). A total of 98% of the freshwater present on the Earth in liquid form comes from groundwater, which serves as a vital source of supply for domestic and agriculture, especially in the arid and semi-arid regions of the world. Globally, 2.5 billion people rely exclusively on groundwater to satisfy their basic daily water needs [1,2,3]. The role of groundwater is becoming increasingly important as a crisis in surface water supply develops over time [4]. Therefore, groundwater management is extremely imperative in order to counteract various challenges qualitatively and quantitatively and to know the behavior of groundwater in spatial and temporal terms [5]. Moreover, climate change, rapid population growth, poor management, and misunderstanding of the nature of the resources caused by improper coordination and integration of approaches are the main causes affecting the continuous degradation of this natural resource [6]. As a result, several problems have emerged, such as the depletion of aquifers and decline in groundwater levels due to climate change associated with global warming, which has led to rainfall deficit and an increase in evapotranspiration due to temperature rise, directly affecting groundwater recharge in a region [7], and extensive abstraction of groundwater from shallow aquifers for agriculture, industry and other domestic purposes [8].
Algeria has 19.2 billion m3 of potential water resources, including 12.4 billion m3 of surface water and 6.92 billion m3 of groundwater, located mainly in the Sahara [9]. A total of 2 billion m3 per year is extracted from aquifers in the north of the country, which are intensively exploited. However, some aquifers are over-exploited in certain regions. Extracted volumes in the Saharan regions are estimated at 1.7 billion m3 [10]. Precipitation is the main source of aquifers recharge in Algeria, which is irregularly distributed in time and space. A total of 1.5 billion m3 of water is estimated to be extracted and used each year. On the other hand, 75% of Algeria’s renewable resources are concentrated in only 6% of the country [11,12]. On the other hand, there are extensive reservoirs in the south of the country [13]. The total amount of usable reserves is estimated at 5 billion m3 per year, with only 1.6 billion m3 being used [14]. This water resource covers about 66% of the country’s annual water demand [15]. The Algerian sources of fresh and potable are divided into three sections: surface water (rainwater reservoir), groundwater reservoirs, and unconventional water sources [16]. In terms of water quality, Algeria’s national report states that “the water collected is of 44% high quality, 44% is of satisfactory quality and 12% is of poor quality”, without distinguishing between surface and groundwater [17].
Since the early 1980s, several regions in the north of the Sahara (Oued Righ valley and its oasis, Ziban mountains, Ouargla oasis, El-Goléa) have been confronted with the upwelling of shallow groundwater, which poses a threat to many structures and a nuisance to farms due to strong population growth and economic change, which exerts high pressure on the environment and its resources. Nowhere is the severity of these problems more evident than in the Souf region [18]. Moreover, the reality of the desert and the combination of the modern world have brought about brutal and accelerating changes that have dramatically altered the environment and living conditions, placing the northern Saharan region in a vulnerable equilibrium. Despite this damage, local communities have created a traditional cultural environment of great beauty through the use of a special technique for planting palms, the Ghouts, which has produced original and unique landscapes [19]. The shallow aquifer was the main source of drinking water in the region, but due to the exponential demand for water caused by population growth, urbanization, and the need for economic development, local authorities had to make extensive use of deep groundwater from the complex terminal and continental intercalary. As a result of the intensive pumping of the deep aquifers and the discharge of these volumes directly into the environment, which returns to the unconfined aquifer (shallow aquifer) without sufficient treatment, the lack of a sewerage network and a natural outlet has caused polluted groundwater to rise to or near the surface, severely threatening the equilibrium and validity of the production system in El Oued Souf region [20].
Since then, the situation has continued to worsen and spread. In the 1980s, the phenomenon initially led to the flooding of almost all the Ghouts of El Oued city (destroying the ecosystem and the traditional urban character of the city), as well as the lower-lying areas of the city and its suburbs. Then the phenomenon progressed to the point of touching a large part of Souf from Guemar in the north to El Ogla in the south. At the same time, it was reported that other areas in the east of the region, around Z’goum were exposed to the rising groundwater but its effect was limited. Scattered areas around Ourmes, Reguiba in the northwest, Oued Alenda and Mih Ouenssa in the southwest were affected. At that time, serious pollution and health problems have arisen, such as the rise of the polluted water table, which is filling with blackish and nauseating water mixed with all kinds of waste, because of the flooding of septic tanks or cesspools that allows bacteriological pollution to spread in the superficial aquifer and the contamination of the water by nitrates of domestic and agricultural origin. The heavy mineralization of the water is also caused by the heavy evaporation from open water bodies and the dissolution of salts. This is because the Ghouts are also used as wild rubbish dumps. On the other hand, the stagnant water leads to a proliferation of mosquitoes and increases the number of inhabitants affected by waterborne diseases and parasitic diseases, skin diseases, leishmaniasis, malaria, and typhoid. For example, several hundred cases of typhoid fever have been recorded in the town of El Oued, according to the municipal health service [21].
In an attempt to halt this tragedy, Algerian authorities responded in 2005 by launching a megaproject to combat increasing groundwater levels and pollutant spread. The Sewerage Plan, Purification Plan, Evacuation Plan, and Drainage Plan are the four plans that make up this project. Unfortunately, this project failed to combat its main objective due to several problems. However, Oued Souf was and still is an open book for various studies to understand the principal reasons for shallow groundwater upwelling and its forecasting trying to refer this phenomenon to the hydrogeological setting of the region or anthropogenic activities [22,23,24,25,26,27,28].
The fluctuations of the water table and its formation in a region are largely controlled by various conditions such as terrain, slope, topography, lithology, rainfall patterns, surface water bodies, etc. Despite all these factors, we believe that there are influencing factors more related to anthropogenic activities that affect the spatial and temporal fluctuation of the groundwater table, especially in Saharan regions such as Oued Souf valley. Therefore, this research aims to answer the following questions:
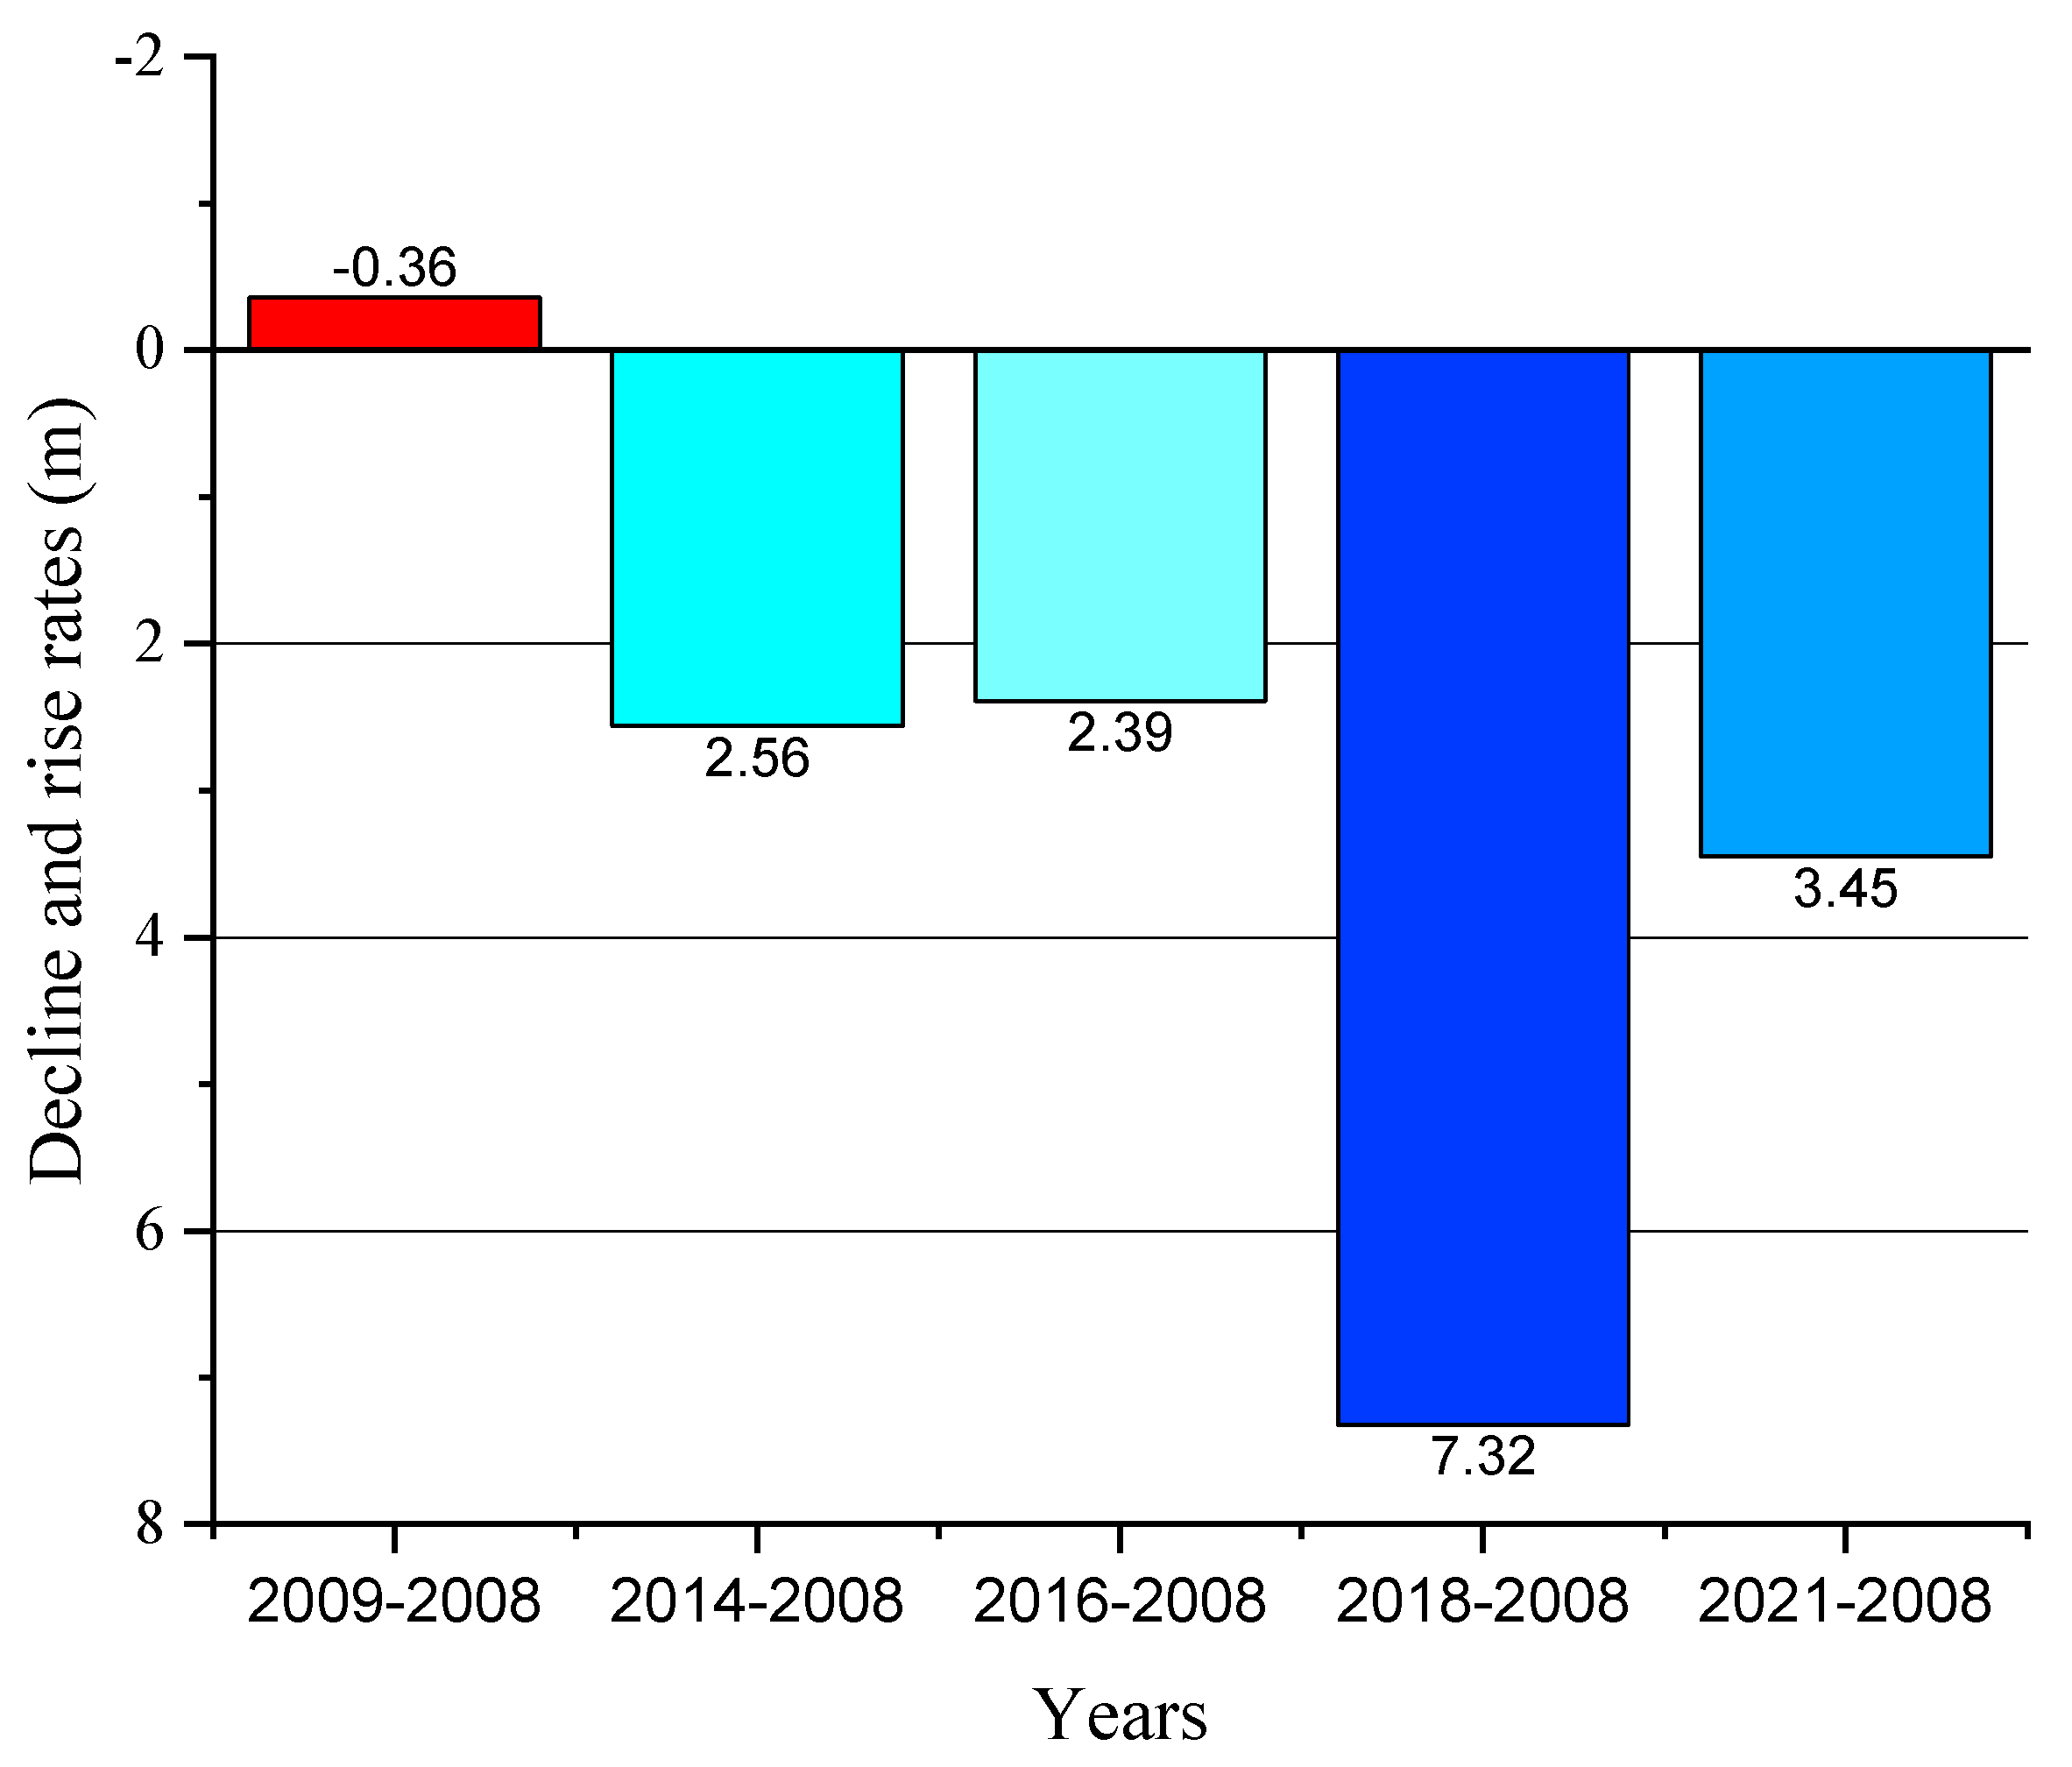
  • How is the vertical drainage system performing and what is its impact on fighting upwelling of the phreatic groundwater table and its stability between 2008, 2009, 2014, 2016, 2018, and 2021 in terms of spatial distribution and temporal variation of the phreatic groundwater fluctuation?
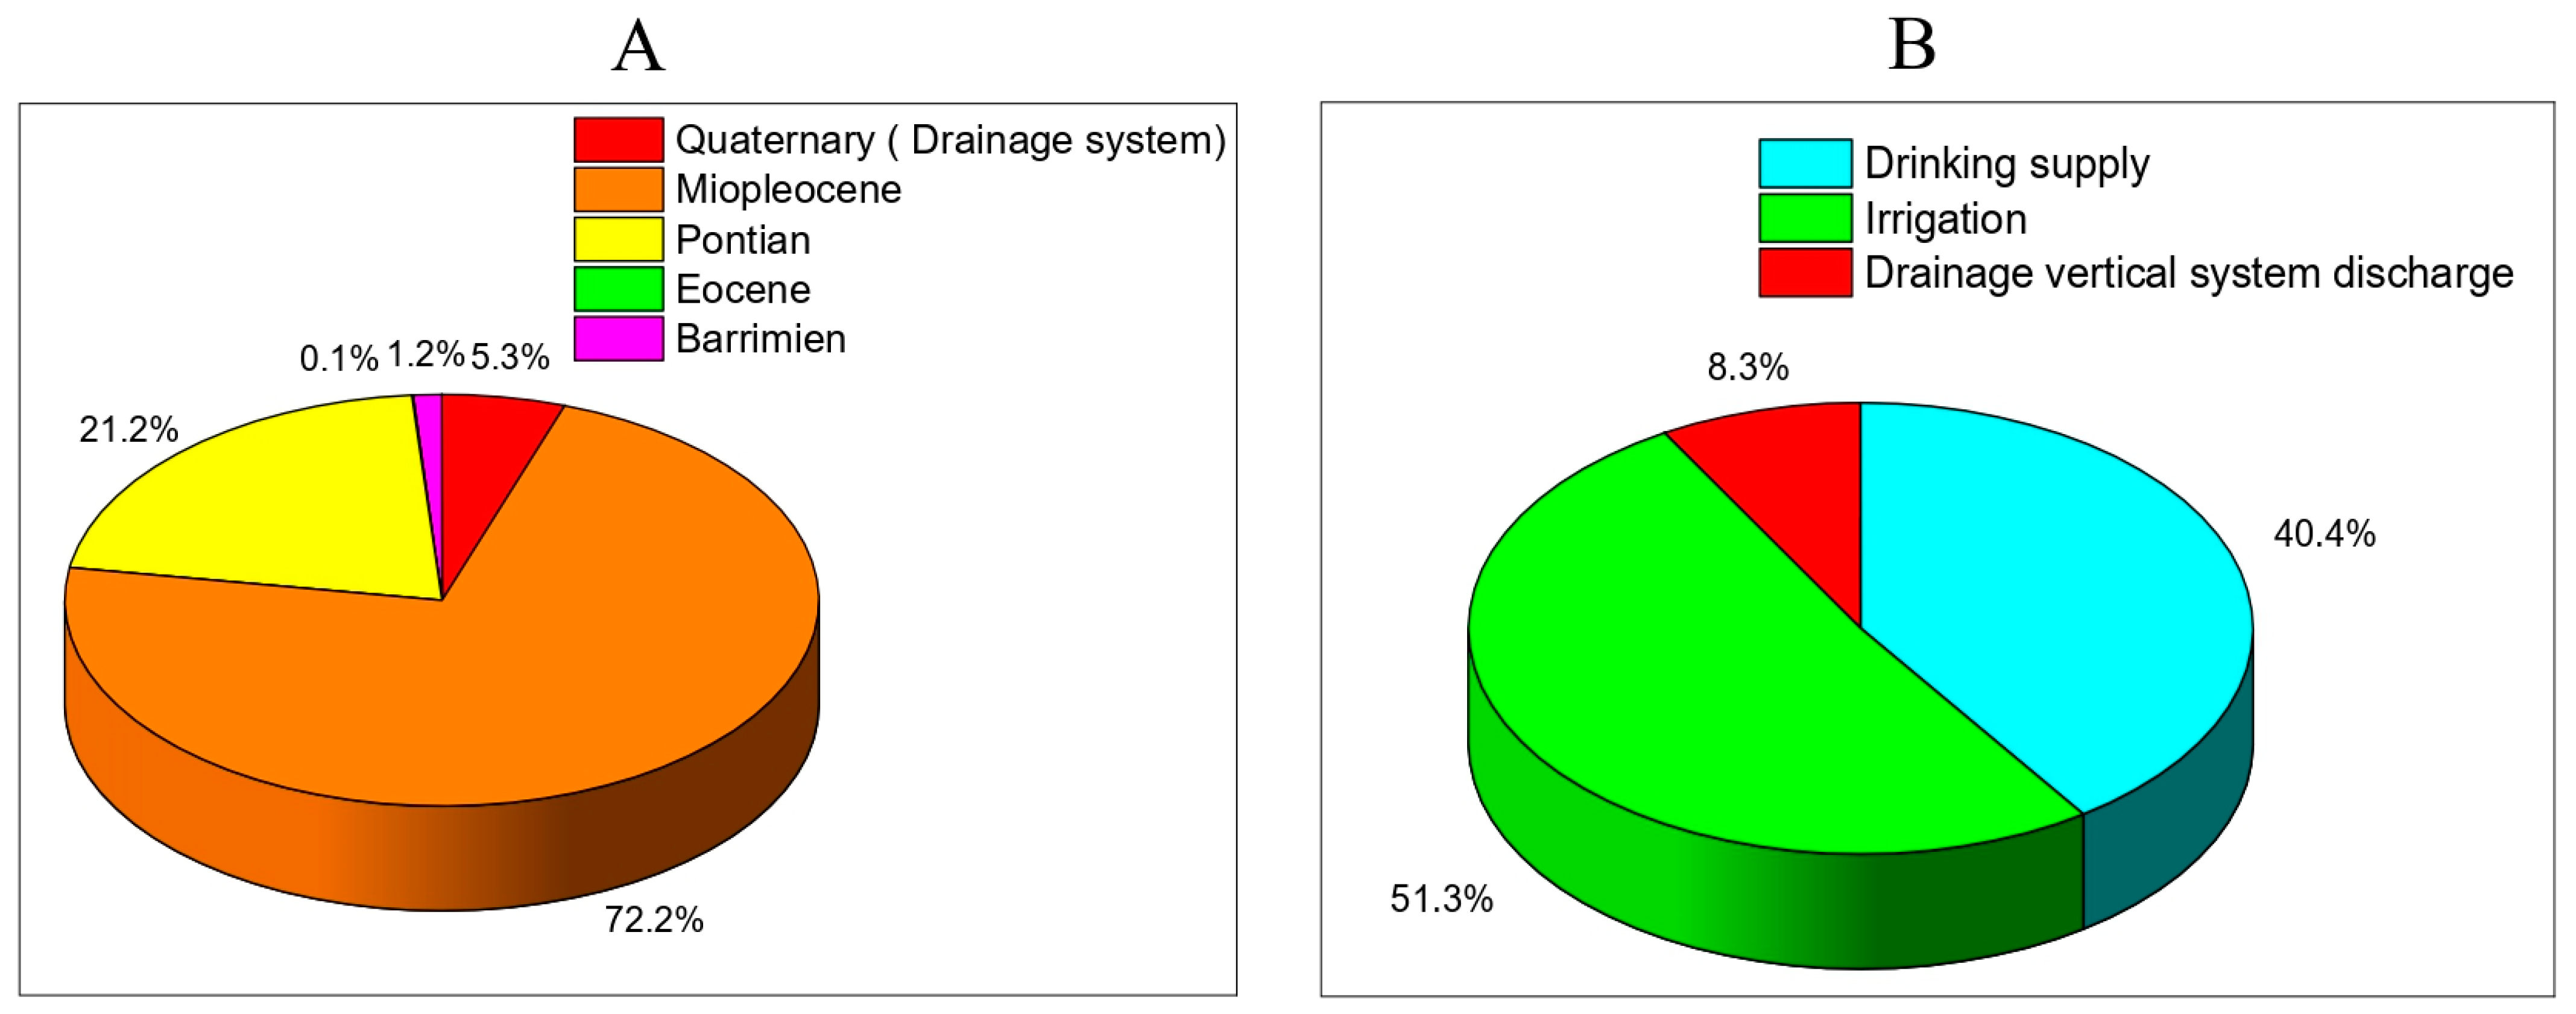
  • How can the weakness of water resources management in El Oued contribute to the continuity of the upwelling of groundwater?
However, the phreatic groundwater level fluctuations point to the need for a precise and complete investigation to understand how groundwater level fluctuations behave on both temporal and spatial dimensions. Geostatistical modeling is an extremely valuable technique for studying such processes [29]. Artificial Intelligence methodologies, especially statistical modeling techniques that are from the family of machine learning (ML), algorithms, have proven to successfully complement or even replace the classical process-based models, usually requiring considerably less data elaboration and computing time; they are therefore more easily implemented in computes the dynamics of groundwater [30].
Geostatistical techniques with its various interpolation methods such as ordinary Kriging interpolation (OK), simple Kriging interpolation (SK) and universal Kriging interpolation (UK), deterministic interpolation comprise global polynomial interpolation (GPI), inverse distance weighted interpolation (IDW) and planar spline interpolation and local polynomial interpolation (LPI) are commonly used to generate maps of soil properties and have been described in many studies [31,32,33], mapping and predicting groundwater quality and its contamination [34,35,36] and mapping and predicting the groundwater level [37,38,39,40,41,42]. On the other hand, hierarchical cluster analysis (HCA) is one of the most commonly used methods to classify instances of variables according to their variance or similarity. The wide application of this method has recently extended to practical hydrochemistry investigations for clustering the hydrogeochemical processes in groundwater in samples into different groups that are important in the geological and hydrogeological sense [43,44,45,46].
Therefore, for a better understanding of this problem and to answer the questions generated previously, a methodology was used based on geostatistical modeling based on (OK) interpolation method which has been applied to analyze the spatial and temporal structure of groundwater level fluctuation. Meanwhile, (HCA) was applied for grouping the wells based on the groundwater fluctuations.

2. Materials and Methods

2.1. Study Area Description

Geographically, the Oued Souf valley lies in the southeast of Algeria in the province of El-Oued, in the middle of a large synclinal basin. It is known as the low Sahara because of its low position between 32°30′00″ and 34°12′00″ N as latitude and 6°15′00″ and 7°20′00″ E as longitude. Historically and administratively, Oued Souf became a municipality in 1957 and an official province in 1984. Today, the Oued Souf valley covers an area of 11,738 km2, divided into 18 municipalities. In 2009, 500,000 inhabitants lived in the 18 municipalities. According to 2015 data from the National Statistics Office, the population of Oued Souf exceeds half a million, mainly concentrated in a group of large cities in the region (41.41 inhabitants/km2) [47]. The Oued Souf region borders the Republic of Tunisia to the east and the province of Tebessa to the northeast, Biskra, and Khenchla to the north, and Biskra to the northwest. At the same time, it is bordered to the west and southwest by Djelfa and Ouargla, respectively, as is shown in Figure 1.
Agricultural activities in the region, shown on a land use/land cover map published in [48], consist mainly of irrigated agriculture, particularly the cultivation of date palms planted in large hand-dug craters in the dunes. This method of palm cultivation is known in the local vernacular as “Ghout” or “Ghout hollows”. Due to the capillarity of the cultivation method, water from the shallow aquifer can rise to the deep roots of the date palms, allowing farmers to irrigate at a low cost. However, in recent years, agriculture in Oued Souf has expanded to include other crops such as potatoes, olives, maize, and other vegetables, all of which are irrigated using groundwater from the aquifer beneath the whole Oued Souf region [49,50].
The topographical nature of the El Oued Souf region, also known as the lower Sahara region because of its low altitude and is located in the Septentrional Sahara. As it is exposed in Figure 2, the study area has an average elevation of 78.54 m above sea level (m.a.s.l), with a notable significant decrease from the southwest to the northeast of the study area, reaching about 66.42 m.a.s.l in drain 13 (D13).

2.2. Climatology of the Study Area

Oued Souf is characterized by a hyper-arid climate characterized by low precipitation, high temperatures, furthermore, intensive evaporation. Based on climatic data from the meteorological station of Geumar Airport over 42 years (1978–2020), the total annual rainfall was 67.63 mm per year. The maximum total rainfall was observed in 2009 at 233.7 mm/year, and the lowest annual total rainfall was remarked in 2020. The origin of precipitation in the Saharan regions is different according to the seasons. During the summer they are due to monsoon depressions, in winter they are due to depressions accompanying the southward migration of the polar fronts. During the intermediate period, these precipitations are due to the Sudano-Saharan depressions crossing the Sahara from the south to the north [51].
The monthly variability of rainfall and temperature analysis over 42 years (1978–2020) revealed that the maximum rainfall is around 13.89 mm recorded during January, while the minimum is around 0.23 mm recorded during July. The maximum value of temperature recorded between (1978–2020) is 37.43 °C during July. While the minimum observed temperature is 14.76 °C during January. The hydrological year of the study area is branded by the presence of a dry period and the total absence of a wet period over the year, even during January when it was observed lowest temperature and highest precipitation.
The application of the Thronthwaite approach revealed that the potential evapotranspiration (PET) decreases from July to January from 260.13 mm to 62.16 mm, then inversely increases again, the annual amount of PET is 1850.7 mm. After the real evapotranspiration calculation (RET), it was observed that the amount of precipitation is lower than the RET value.
The easily utilizable reserve (EUR) [52,53], computation gave negligible value. After the application of the Tixeront-Berkaloff formula, the runoff (R) was also negligible (0.0025 mm) with a runoff coefficient equal to 0.000445. Consequently, the infiltration amount (I) was null due to high evapotranspiration which is more than the precipitation (P). At the same time, according to the obtained results, there is an agricultural deficit (AD) throughout the year, hence the need for irrigation Table 1.

2.3. Geomorphology, Geology and Hydrogeology

The valley of Oued Souf is located on the northern side of the Great Oriental Erg and is typified by continental sand dunes formed during the recent Quaternary. The Quaternary formations (sand dunes) are mainly composed of fine-grained, compact, homogeneous, and uniform sand that covers the entire region, especially in the south where the dunes can reach up to 100 m high. Between the sand dunes occur corridors that form deepened plateaus (known as Sahans), which are typically quite extensive, sometimes stony, and covered with Quaternary gypsum deposits. The saline depressions (Sebkha) are located in the northernmost part of the study area and occupy the basal part of the vast lower Saharan basin [54,55,56,57]. The Oued Souf region lies in the northeastern Mesozoic basin of the Sahara (also called the Triassic basin), which is situated to the northeast of the Sahara platform. The region is underlain by sediment formations ranging in age from the Lower Cretaceous to the Quaternary [58]. The base of the sedimentary basin is formed by water-rich marine formations from the Paleozoic era, overlain by a sequence of layers that can extend over 2000 m [59,60,61]. Despite the geology and geomorphology of the region, the prevailing climatic conditions hinder the development of surface water resources [51]. Therefore, groundwater is the only accessible water resource in the Souf region that can be used for various purposes [62,63].
The study area is part of the Northwest Sahara Aquifer System (NWSAS), which is the second-largest reservoir in the world. This aquifer system is shared by three countries: Algeria, Tunisia, and Libya [64]. It has a total area of about one million km2, of which 70% is located in Algeria, 6% in Tunisia, and 24% in Libya. The aquifer system of the study area consists of three primary aquifers that differ in depth and physiochemical characteristics [65,66,67]. The phreatic aquifer is the uppermost aquifer in the region [68]. The free water table in this aquifer consists of fine sands interbedded locally with sandy clays and gypsum lenses. This aquifer has a thickness of about 100 m and a depth to groundwater of 1 to 40 m. Underlying this aquifer is an impermeable clay substrate. Thousands of traditionally dug wells extract groundwater from the phreatic aquifer. The total number of traditional wells exceeded 35,000 in 2015. The average permeability of the phreatic aquifer is 10−4 m/s, while the horizontal transmissivity and storage coefficient is estimated to be 10−2 m2/s and 0.2, respectively. Natural recharge of the phreatic aquifer can be represented by infiltration of precipitation and runoff from the rock formations on the southern margin of the Great Oriental Erg and, simultaneously, by rare torrential local rain events, such as those that fell in the region in April 1947 and May 1967 [69,70,71,72,73,74]. The complex terminal is the term for the next deeper aquifer. This complex aquifer consists of several aquifers in different geological formations. The complex terminal aquifer belongs to the continental formations of the Cretaceous to Miocene. Its depth is between 400 and 600 m, while its thickness is usually around 400 m. This aquifer contains fossil water that is between 20,000 and 30,000 years old. In 2015, about 182 deep wells were drilled in this aquifer, 28 of which are for irrigation and 154 are for municipal purposes and drinking water supply [13,75,76].
The third deepest aquifer is called the continental intercalary aquifer and consists of continental deposits from the Middle Jurassic to the Lower Cretaceous (Barremian and Albian). The lithology of the aquifer consists of sandstones and clayey sandstones. This aquifer is located at varying depths from 1800 to 2200 m and has a thickness of 200 to 400 m. This aquifer contains fossil water that is at least 20,000 to 30,000 years old. Only four deep wells have been drilled in the continental aquifer of the region, all of which are used for drinking water production, as the groundwater from this depth has a temperature of over 70 °C [50,77]. The reservoirs composition of the Northwest Sahara Aquifer System (NWSAS) is revealed in Figure 3.

2.4. Vertical Drainage System

Oued Souf was and still is among the areas that knew an aggressive rising of polluted groundwater over the last years, Figure 4 addresses the main effects that exacerbated the phenomena. For this reason, a sanitation project (mega project) was constructed to counteract the rising water level in the phreatic aquifer via an additional drainage system (vertical drainage system). It consists of draining excess water from agriculture through a network of 58 drainages drilled at a depth of 21 to 40 m and equipped with submersible pumps capable of pumping 6 L per second. The drainages are spaced about 500 m apart and connected to 37 km of pipelines to equalize the water level in Oued Souf City. To stabilize the water table in the flooded neighborhoods and ensure a minimum depth of 1.5 m, as well as to reverse the phenomenon of upwelling in the rest of the city and prevent new areas from being flooded, a general drawdown of 5 to 10 m deep will be ensured, allowing autonomous sanitation of the areas that cannot be connected. The drainage system is currently managed by the El-Oued National Sanitation Office (l’Office National d’Assainissement d’El-Oued ONA). The principle of this system is to collect all the infiltration water under the agglomeration of El-Oued by pumping it into 58 drilled wells and to use as much of this water as possible on-site for the irrigation of green spaces, while the rest of this water is collected in the pumping station and piped over a distance of about 4200 m to the collector of the treated wastewater of the treatment plant to be treated by aerated lagoons then discharged in the discharging site (Chott Halloufa) [79].

2.5. Data Collection

The research covered 58 monitoring wells that are part of the vertical drainage system and are located in Oued Souf valley. A total of 55 drains are located in El Oued, while three drains are located northwest of Bayadha. Groundwater levels were measured in 2008, 2009, 2014, 2016, 2018, and 2021 by ANRH (Agence National des Roussources Hydrauliques—National Agency for Water Resources) and ONA (Office National de l’Assainissement—National Sanitation Office). The measurements of the groundwater level were carried out in May of each year to avoid seasonal fluctuations in the groundwater level.
The groundwater depth measurements were taken from the land surface using level probes and piezometers installed in each drain of the entire system. As all drains are equipped with pumps, the measurement was carried out before or after the pumping phase, leaving enough time for the groundwater level to return to its static state. In the meantime, the water flow and volumes were measured.
The geographical coordinates of these monitoring wells were determined using a Globe Positioning System (GPS). Climate data for the period 1978 to 2020 were obtained from the meteorological station of El Oued—Guemar airport. These data include monthly rainfall and monthly temperature data. The meteorological station is located in the coordinates Latitude: 33°30′ N and Longitude 06°47′ E with an altitude of 63 m.a.s.l.
On the other hand, the deep groundwater reservoirs data including the extracted volumes and their usage from the Complex terminal and Continental intercalary aquifers were obtained from the ANRH company.

2.6. Geostatistical Modelling

Geographical information systems (GIS) have increasingly facilitated environmental protection and resource planning recently has extended its utilizations in different fields such as geology, hydrology, environmental monitoring by integrating spatial data with other information for the generation of the spatial distribution of groundwater parameters and their evaluation using geostatistics [80,81,82,83,84,85,86]. Kriging is a stochastic interpolation approach for spatial surface prediction. Because it incorporates statistical models, it is adaptable and provides for the analysis of data spatial autocorrelation. The data are assumed to come from a stationary stochastic process in Kriging, and some methods necessitate that the data be regularly distributed. The process of kriging is separated into two parts: measuring the spatial structure of the data and producing a predicted surface. Kriging will utilize the fitted model from the variogram, the spatial data configuration, and the values of the measured sample points surrounding the prediction location to predict an unknown value for a specific location [36,87,88]. Since ordinary kriging is widely employed as a dependable estimate method among the many kinds of kriging, it was introduced in this research for producing spatial prediction maps [89,90,91].
The selection of the best-fitted semi-variogram models was done based on the mean error (ME) and root mean square standardized error (RMSSE) values. Furthermore, each one of the models is evaluated according to the precision of the predictions when RMSSE is close to unity and ME is minimized.
Several classes were accustomed to illustrating the structural spatial dependency and this is relying on nuggets’ variance/sill ratio. Strong when the ratio is less than 25% when the ratio is between 25% and 75% it is moderate, and weak when the ratio is larger than 75%. All the geostatistical analyses were made using ArcGIS 10.4.1 software.

2.7. Clustering Analysis

Hierarchical clustering analysis (HCA) is an unsupervised grouping method that distinguishes variables based on their similarity. Euclidean distances were used to classify the parameters into initial clusters, while Ward’s agglomeration method was used to link the resulting initial clusters [44,92,93,94,95]. In this research, this technique was used to group the groundwater depths of the phreatic groundwater aquifer for elaborating the differences according to their similarity using Originpro 2021 software.

3. Results and Discussion

3.1. Hierarchical Clustering of Groundwater Levels

Hierarchical clustering analysis (Q-mode) has been applied to classify the monitoring wells (drains) from 2008, 2009, 2014, 2016, 2018, and 2021 according to their fluctuation variability using Ward’s linkage technique and Euclidean distance. It is an important statistical tool that divides each case into a distinct group or cluster and links each cluster until only one is remaining. The application of HCA has generated a dendrogram of spatial hierarchical clustering analysis. However, four groups have been created (Figure 5). The mean of each group was the distinguishing factor that contributes to the classification of these groups (it is increasing from the first group to the fourth group ascendingly), (Table 2).
The Spatio-temporal variation in the wells of different clusters in Figure 6 revealed that 22 wells in cluster 1 showed similar fluctuation variability, with the mean fluctuation ranging between 2.64 in 2009 to 11.44 m below ground level (mbgl) (2018), and the mean fluctuation of this group represent the shallowest level (5.91 mbgl). The clustered wells of the first group are concentrated in the center and expand to the southeast of the study area, while only one well is located in the northeast of the stud area. The second cluster consists of eighteen wells whose mean fluctuation varied from 4.33 in 2009 to 14.30 mbgl (2018). This group has a mean fluctuation that can be considered deeper than the first cluster. This clustered group is spread over the study area (the southern east, the center to the northwest, and in one well located in the northeast of the study area).
The third cluster entails the group of wells that have a depth level that fluctuates from 6.90 (2009) to 10.96 mbgl (2018), while the total mean fluctuation of this cluster was 9.31 mbgl. The wells of this group are graduating spatially from the center to the northest of the study area, except for one well located in the northeast. The deepest fluctuation means were represented in the fourth cluster, whereas the mean fluctuations were ranging from 11.64 (2009) to 15.61 mbgl (2018). On the other hand, the total mean fluctuation of this group was 12.98 mbgl. The wells of this cluster are located separately in the southwest of the central part to the southwest of the study area. The third and fourth groups consist of the same number of wells as the second group.

3.2. Geostatistical Modelling and Groundwater Level Fluctuations

The first step in statistical analysis entails creating frequency tables, histograms, and basic statistical calculations. Summary statistics, including the mean, coefficient of variation, minimum, maximum, skewness, and kurtosis values, are given in Table 3. Based on the histograms, kurtosis, and skewness values, 2008, 2014, 2016, and 2021 can be considered approximately normal distributed Figure 7. A logarithmic transformation has been applied to the data from 2009 and 2018 before performing a geostatistical analysis. The anisotropy of the phreatic aquifer was verified using semivariance analysis and ordinary kriging to understand more about the upwelling of groundwater in the study area. For the groundwater levels of 2008, 2009, 2014, 2016, 2018, and 2021, omnidirectional experimental semivariograms were generated in the four main directions E–W, NE–SW, N–S, and NW–SE.
There is a slight degree of anisotropy, which means that the created experimental semivariograms for the different directions have some differences in their sills and influence ranges. As a result, the discovered anisotropies were overlooked, and isotropic models were used instead. At the same time, mean error (ME) and root mean square standardized error (RMSSE) values have been considered for the selection of the best fitted semi-variogram models. Whereas, the evaluation of the selected model was conducted based on the predictions, especially, when RMSSE is close to unity and ME is very low. The adopted model parameters for the examined annual groundwater levels are summarized in Table 4 and Table 5. Hypothetical models were then fitted to the more typical non-directional semivariograms as illustrated in Figure 8.
The groundwater level of each selected year was found to fit a different model (Pentaspherical in 2008, Hole effect in 2009, Gaussian in 2014, Circular in 2016, Spherical in 2018, and Stable in 2021) based on the mean error and the root mean square standardized error as is shown in Table 4 and Table 5. The range of influence and the sill values of the adopted models reveals some significant differences. The range of influence is the distance within which the groundwater level values are spatially dependent. The minimum spatial dependence (702.55 m) was encountered in 2018, and the maximum one (5061.97 m) was marked in 2021. The presence of the nugget effect indicates inherited variability or variability across shorter distances than the spacing between observation wells, as well as other unaccounted for recording errors. Based on [96] structural spatial dependence, the aquifer structure exhibits strong spatial dependence that remained almost constant over the years except in 2009 and 2021 when the spatial structures were moderate. Very low nugget effects show that the groundwater level fluctuation is severely time-correlated and depicts a strong temporal structure.
As observed by the generated prediction maps of ordinary kriging for the water table status in 2008, several patterns were detected in the study area. Variations extend from the northwest to the southeast of the study area, where groundwater depths are almost 3–4 m and upwelling near the surface (1–3 m) till up to the surface (−0.3 in D20), mainly in the center El-Oued municipality. In the southwest of the research region, where the depth to groundwater was more than 6 mbgl and dropping (going deeper). Another observation was that the depth was decreasing by around 2 m near two drains, D05 (northeast) and D45 (south). In 2008 the beginning of the vertical drainage system functioning occurred, the groundwater levels were very shallow and, in some drains, the groundwater level was up to the surface such as D20 with −0.3 m below the ground level (mbgl). Besides this drain, other drains recorded very low levels that are near to the surface such as D13, D17, D18,32, and D33 where the levels ranged from 0.43 to 1.88 m below the ground surface. On average, the depth of groundwater fluctuated by about 5.42 mbgl during 2008. Similarly, during 2009 the groundwater level was continuing its upwelling from the northwest part to the southeast, where the shallowest level was recorded in D20 with −0.4 mbgl, while the deepest level was noted in the same drain as 2008, which is D52 with 15.17 mbgl. D13, D17, D18, 32, and D33 had the same trend as in 2008, where their levels varied from 0.41 to 1.75 mbgl. The mean groundwater level in 2009 was 5.06 mbgl which was less than in 2008 indicating increasing in the upwelling average in the study area during 2009 as is exposed in Figure 9A,B.
The groundwater level started its significant decline from 2014 and 2016, respectively. However, the shallowest groundwater levels were observed as usual in a gradual upwelling state from the central northwest part to the southeast of the study area to reach the minimum value that was marked in D13 with 0.6 mbgl in 2014 and 1 mbgl in 2016. The deepest levels were noted in the southwest of the study area, where the levels were more than 8 mbgl and increased deeply (significant decline) to 18.23 and 19.53 mbgl marked in D52 in 2014 and 2016, respectively, as is illustrated in Figure 9C,D. Fluctuation rates ranged from 7.97 mbgl in 2014 and 7.81 mbgl in 2016, Table 3. Moreover, the minimum groundwater level in 2018 has shifted to D32 with 5.1 mbgl and is located in the southeast part of the city, while the deepest also has shifted to D37 with 28.8 mbgl situated in the south of El Oued city. Meanwhile, the fluctuation rate in 2018 was 12.74 mbgl. Nevertheless, between 2008 and other years the difference in groundwater decline and rising rates are predicted to be −0.36 m in 2009, 2.56 m in 2014, 2.39 m in 2016, and 7.32 m in 2018 as is shown in Figure 10 and Figure 11E.
Suddenly, the groundwater level status in 2021 revealed a considerable change that happened in the study area in terms of groundwater level fluctuation, decline, and rising rates. The deepest groundwater level can be highlighted in the center of the study area where the deepest level was reached to a maximum in D34 (15 mbgl), and in the northwest of the study area where the deepest level was registered in D10 (15 mbgl). On the other hand, other drains recorded deep values such as D52, D53, and D54 in Figure 11F and Table 4. Meanwhile, the minimum groundwater level appeared in the central east of the study area registered in D32 (2.1 mbgl). Although a significant decline during the previous years, the depth of groundwater fluctuated by around 8.87 mbgl in 2021, which indicates a significant rise compared especially to 2018 with 3.9 m on average as is shown in Figure 10.
Since the water table in the study area is determined by several factors. Therefore, there are several explanations for the decline of groundwater and its fluctuations during the study period. However, the independence of groundwater use in the study area from the phreatic aquifer has promoted the decline in water returning to the phreatic aquifer. Similarly, 94.7% of the groundwater withdrawn from the entire aquifer system is used for various purposes. In addition, 93.5% of the water comes from the complex terminal aquifer (72.2% from the Mioleocene, 21.2% from the Pontian, 0.1% from the Eocene), and 1.2% from the continental intercalary (Barrimian). The rest (5.3%) is drained by the vertical drainage system, which drains the rest of the phreatic groundwater (Quaternary). On the other hand, a large part of groundwater resources is used for drinking water supply (40.4%) and irrigation (51.3%), and the percentage may be higher, while 8.3% is drained by the drainage system (Figure 12A,B). The rapid growth of agriculture and its development around the city of El Oued Souf also contribute to the rapid decline of the phreatic aquifer.
At the same time, the primary results of the drainage vertical system have indicated bad results (upwelled phreatic groundwater level with a rising rate of −0.36 m) between 2008–2009 then these bad results were shifted to be better over the study period. In terms of groundwater level, due to the changing of the sewage system (from septic tanks to vertical drainage system) of El Oued the groundwater started to decline over time and reduced the contamination level significantly in the phreatic groundwater aquifer. Also connecting most of the agglomerations to the sewage network and stopping wastewater disposal into the environment with huge quantities which were returning to the phreatic aquifer previously. About, 27.5 million cubic meters per year are discharged through the drainage system to the treatment station as schematized in Figure 13, with 7.74 L/s as discharge flow. However, the results of 2021 can generate several questions about the groundwater level and can increase fears about returning to the groundwater upwelling catastrophe again. Numerous influences might be leading the study area to another rising groundwater level such as the inefficient drinking water supply network, which is struggling with considerable water leakages, for example, the unaccounted withdrawals from connections (lack of meters or failure of the measurement system), and the illegal withdrawals (such as illegal connections, manipulation of meters).
In terms of the drinking water supply network losses, we can highlight that the network of Oued Souf is struggling with several problems such as defective joints of pipe connections, and conduits (steel, asbestos, concrete, polyvinyl chloride) and valves, leaking tanks, etc. Similarly, the bad connections with other supply systems and finally other non-remunerated withdrawals such as taking for firefighting, withdrawals for inspection work, maintenance of the network, rinsing of pipes, etc. In addition to this, the existence some industries that consume a considerable amount of water such as the gypsum production industry. On the other hand, some problems in the drainage system can generate a rerising in the groundwater level such as the power outage break which affects the pumping process, and also the maintenance of the system. During the measurement of 2021, several drains had not functioned since 2018. Another explanation can be mentioned here but we cannot adopt it since it is out of the scope of this research, which is the non-homogeneity of the unconfined aquifer (phreatic aquifer) and its intercalation by clay lenses at a shallow depth that act as a substrate to support groundwater to rise [25]. Furthermore, the responsible purification plant for purifying the wastewater collected from the study area is suffering from different problems such as the breakdown of some pumps in different purification stages, especially in the Desander and this is mainly because of the high level of wastewater in the grit trap causes the two suction pumps to break down and the third insufficient, which creates considerable pressure on the plant and consequently reducing the required purified of the drained wastewater volumes.

4. Conclusions

Under the arid and semi-arid climate, groundwater is the only reachable resource, especially in Oued Souf valley. However, the decline and rise in groundwater levels in the study area were attributed primarily to human activities.
The availability of huge groundwater reservoirs in Oued Souf turned out to be a disadvantage instead of an advantage for the region due to the failure of draining large quantities that have been originally pumped from deep aquifers and consequently returned to the unconfined aquifer (phreatic aquifer). This is affecting the non-stability of the phreatic groundwater level and this is reflecting directly on the leaving environment in the Oued Souf region qualitatively and quantitatively.
The used methodology for studying the non-stability of the phreatic groundwater aquifer indicated that the anthropogenic activities are the direct reasons for the rising of groundwater. Despite the vertical drainage system reflecting a significant decline in groundwater from 2009 to 2018, other rerising phenomena might be threatening the region in the near future and this is what was indicated in the 2021 groundwater level data.
Cluster analysis has indicated that the most vulnerable area is represented by group 1 which has a shallow depth (average mean of 5.91 mbgl). The non-vulnerable area is totally separated from the other clusters and represented by the fourth cluster with a deep depth (12.89 mbgl) that signified no threat of rising groundwater levels.
Geostatistical analysis performed by kriging revealed that a certain heterogeneity appeared in the 2009 and 2021 data and were represented by moderate spatial dependence as opposed to 2008, 2014, 2016, and 2018 which have a strong spatial dependence. The used interpolation technique indicated the most vulnerable area over the years located and extended from the center to the east of the study area.
Several factors affect the stability of the phreatic groundwater level and the vertical drainage system performance. However, all the most crucial factors are of anthropogenic origins such as the overexploitation from deep groundwater reservoirs from the complex terminal and continental intercalary (in drinking and irrigation purposes) and even the illegal use of the phreatic groundwater with important quantities for irrigation and illegal industries although its contamination and unsuitability for the utilization.
The results of this research can be highly important to draw the attention and increase the awareness of all water experts locally and globally about the consequences of inadequate water management and negligence in the implementation of the integrated management of water resources.
For future research work, deep and machine learning techniques (Support Vector Machines (SVMs), Gradient Boosting Machine, and M5 and M5-cubist Convolutional Neural Networks) will be used, as well as several modified DRASTIC methods, to estimate the degree of pollution and place the areas most vulnerable to pollution due to the heavy use of underground water for irrigation and industry, which makes the first step towards developing a model for some desert areas.

Author Contributions

Conceptualization, A.B.; methodology, A.B., G.S. and F.B.; software, A.B.; validation, A.B., G.S., F.B., M.D. and T.M.; formal analysis, A.B.; investigation, A.B.; resources, A.B. and M.D.; data curation, A.B., G.S., F.B., M.D. and T.M.; writing—original draft preparation, A.B.; writing—review and editing, A.B., F.B. and G.S.; visualization, A.B.; supervision, G.S. and F.B. All authors have read and agreed to the published version of the manuscript.

Funding

Project no. TKP2021-NKTA-32 has been implemented with the support provided from the National Research, Development and Innovation Fund of Hungary, financed under the TKP2021-NKTA funding scheme.

Institutional Review Board Statement

Not applicable.

Informed Consent Statement

Not applicable.

Data Availability Statement

Not applicable.

Acknowledgments

The authors gratefully acknowledge the assistance for sharing the groundwater level of the phreatic aquifer and the aquifer system data to perform this study from the ONA ANRH companies.

Conflicts of Interest

The authors declare no conflict of interest.

References

  1. Táany, R.A.; Tahboub, A.B.; Saffarini, G.A. Geostatistical Analysis of Spatiotemporal Variability of Groundwater Level Fluctuations in Amman-Zarqa Basin, Jordan: A Case Study. Environ. Geol. 2009, 57, 525–535. [Google Scholar] [CrossRef]
  2. UNWWDR. The United Nations World Water Development Report; UNESCO Publishing: Paris, France, 2015. [Google Scholar]
  3. Nayak, P.C.; Satyaji Rao, Y.R.; Sudheer, K.P. Groundwater Level Forecasting in a Shallow Aquifer Using Artificial Neural Network Approach. Water Resour. Manag. 2006, 20, 77–90. [Google Scholar] [CrossRef]
  4. Tatawat, R.K.; Chandel, C.P.S. A Hydrochemical Profile for Assessing the Groundwater Quality of Jaipur City. Environ. Monit. Assess. 2008, 143, 337–343. [Google Scholar] [CrossRef] [PubMed]
  5. Kumar, V.; Remadevi. Kriging of Groundwater Levels-A Case Study. J. Spat. Hydrol. 2006, 6, 81–92. [Google Scholar]
  6. Ravikumar, P.; Somashekar, R.K.; Angami, M. Hydrochemistry and Evaluation of Groundwater Suitability for Irrigation and Drinking Purposes in the Markandeya River Basin, Belgaum District, Karnataka State, India. Environ. Monit. Assess. 2011, 173, 459–487. [Google Scholar] [CrossRef]
  7. Luna, M.C.D.M.; Parteli, E.J.R.; Herrmann, H.J. Model for a Dune Field with an Exposed Water Table. Geomorphology 2012, 159–160, 169–177. [Google Scholar] [CrossRef] [Green Version]
  8. Jha, M.K.; Chowdhury, A.; Chowdary, V.M.; Peiffer, S. Groundwater Management and Development by Integrated Remote Sensing and Geographic Information Systems: Prospects and Constraints. Water Resour. Manag. 2007, 21, 427–467. [Google Scholar] [CrossRef]
  9. Drouiche, N.; Ghaffour, N.; Naceur, M.W.; Mahmoudi, H.; Ouslimane, T. Reasons for the Fast Growing Seawater Desalination Capacity in Algeria. Water Resour. Manag. 2011, 25, 2743–2754. [Google Scholar] [CrossRef]
  10. Harrat, N.; Achour, S. Pollution Physico-Chimique Des Eaux de Barrage de La Région d’El Tarf. Impact Sur La Chloration. Larhyss J. 2010, 8, 47–54. [Google Scholar]
  11. Sekkoum, K.; Talhi, M.F.; Cheriti, A.; Bourmita, Y.; Belboukhari, N.; Boulenouar, N.; Taleb, S. Water in Algerian Sahara: Environmental and Health Impact. Adv. Desalin. 2012, 197–216. [Google Scholar] [CrossRef] [Green Version]
  12. (Ministère des Ressources en eau) Ministry of Water Resources. Available online: https://www.mre.gov.dz/?page_id=1991 (accessed on 1 January 2020).
  13. Abdous, B.; Besbes, M.; Fezzani, C.; Latrech, D.; Mamou, A. Systeme Aquifere du Sahara Septentrional: Gestion Commune d’un Bassin Transfrontière; La Houille Blanche: Ouargla, Algeria, 2005; Volume 12. [Google Scholar]
  14. ANRH. Ressources En Eau et En Sols de l’Algérie; Rapport Technique; ANRH: Alger, Algeria, 1986. [Google Scholar]
  15. Daoudi, A.; Lejars, C.; Benouniche, N. La Gouvernance de l’Eau Souterraine Dans Le Sahara Algérien: Enjeux, Cadre Légal et Pratiques Locales. Cah. Agric. 2017, 26, 35004. [Google Scholar] [CrossRef] [Green Version]
  16. Negm, A.; Omran, E.; Bouderbala, A.; Chenchouni, H.; Barcelo, D. Introduction to “Water Resources in Algeria: Assessment of Surface and Groundwater Resources”. In Water Resources in Algeria-Part I.; Springer: Cham, Germany, 2020; ISBN 978-3-030-57894-7. [Google Scholar]
  17. Drouiche, N.; Ghaffour, N.; Naceur, M.W.; Lounici, H.; Drouiche, M. Towards Sustainable Water Management in Algeria. Desalin. Water Treat. 2012, 50, 272–284. [Google Scholar] [CrossRef]
  18. Côte, M. Si Le Souf m’était Conté: Comment Se Fait et Se Défait Un Paysage; Hannachi, S., Ed.; Média-Plus: Constantine, Algeria, 2006; ISBN 9961-922-42-5. [Google Scholar]
  19. Bataillon, C. Le Souf, Étude de Géographie Humaine; Université d’Alger: Algiers, Algeria, 1955. [Google Scholar]
  20. Kadri, S.R.; Chaouche, S. La Remontée Des Eaux Dans La Région Du Souf: Une Menace Sur Un Écosystème Oasien. Les Cah. D’emam 2018, 30. [Google Scholar] [CrossRef]
  21. Côte, M. Dynamique Urbaine Au Sahara. Rev. Algérienne D’anthropologie Sci. Soc. 1998, 5, 85–92. [Google Scholar] [CrossRef]
  22. Bouzegag, C.; Bouzid-Lagha, S.; Djelal, N. Forecasting the Upwelling Phenomenon Using an Artificial Neural Network. Pol. J. Soil Sci. 2020, 53, 245–259. [Google Scholar] [CrossRef]
  23. Khezzani, B.; Bouchemal, S. Variations in Groundwater Levels and Quality Due to Agricultural Over-Exploitation in an Arid Environment: The Phreatic Aquifer of the Souf Oasis (Algerian Sahara). Environ. Earth Sci. 2018, 77, 1–18. [Google Scholar] [CrossRef]
  24. Messekher, I.; Chabour, N.; Menani, R. Remontée de La Nappe Phréatique Du Souf. Conséquences et Solutions Envisagées. Ann. Univ. Buchar. Geogr. Ser. 2012, LXI, 179–197. [Google Scholar]
  25. Khechana, S.; Miloudi, A.; Ghomri, A.; Guedda, E.H.; Derradji, E.F. Failure of a Vertical Drainage System Installed to Fight the Rise of Groundwater in El-Oued Valley (SE Algeria): Causes and Proposed Solutions. J. Fail. Anal. Prev. 2016, 16, 216–224. [Google Scholar] [CrossRef]
  26. Medareg Narou, B.H.; Farhi, A. Le Rôle Des Services et Des Investissements Dans l’hypertrophie de La Ville d’El Oued Au Bas Sahara Algérien. Environ. Urbain 2009, 3, c-1–c-18. [Google Scholar] [CrossRef] [Green Version]
  27. Remini, B. La disparition des ghouts dans la region d’el oued (Algérie). Larhyss J. 2006, 5, 49–62. [Google Scholar]
  28. Remini, B.; Kechad, R. Impact of the Water Table Razing on the Degradation of El Oued Palm Plantation (Algeria) Mechanisms and Solutions. Geogr. Tech. 2011, 13, 48–56. [Google Scholar]
  29. Rouhani, S.; Wackernagel, H. Multivariate Geostatistical Approach to Space-Time Data Analysis. Water Resour. Res. 1990, 26, 585–591. [Google Scholar] [CrossRef] [Green Version]
  30. Kenda, K.; Peternelj, J.; Mellios, N.; Kofinas, D.; Čerin, M.; Rožanec, J. Usage of Statistical Modeling Techniques in Surface and Groundwater Level Prediction. J. Water Supply Res. Technol. AQUA 2020, 69, 248–265. [Google Scholar] [CrossRef]
  31. Goovaerts, P. Geostatistics for Natural Resources Evaluation; Oxford University Press on Demand: Oxford, UK, 1997. [Google Scholar]
  32. Isaaks, E.; Srivastava, R.M. An Introduction to Applied Geostatistics; Oxford University Press: New York, NY, USA, 1989. [Google Scholar]
  33. Journel, A.; Huijbregts, C. Mining Geostatistics; Academic Press: London, UK, 1978. [Google Scholar]
  34. Seyedmohammadi, J.; Esmaeelnejad, L.; Shabanpour, M. Spatial Variation Modelling of Groundwater Electrical Conductivity Using Geostatistics and GIS. Model. Earth Syst. Environ. 2016, 2, 1–10. [Google Scholar] [CrossRef] [Green Version]
  35. Venkatramanan, S.; Chung, S.Y.; Kim, T.H.; Kim, B.W.; Selvam, S. Geostatistical Techniques to Evaluate Groundwater Contamination and Its Sources in Miryang City, Korea. Environ. Earth Sci. 2016, 75, 1–14. [Google Scholar] [CrossRef]
  36. Barkat, A.; Bouaicha, F.; Bouteraa, O.; Ata, B.; Balla, D.; Rahal, Z.; Szabó, G. Assessment of Complex Terminal Groundwater Aquifer for Different Use of Oued Souf Valley (Algeria) Using Multivariate Statistical Methods, Geostatistical Modeling, and Water Quality Index. Water 2021, 11, 1609. [Google Scholar] [CrossRef]
  37. Knotters, M.; Bierkens, M.F.P. Predicting Water Table Depths in Space and Time Using a Regionalised Time Series Model. Geoderma 2001, 103, 51–77. [Google Scholar] [CrossRef]
  38. Desbarats, A.J.; Logan, C.E.; Hinton, M.J.; Sharpe, D.R. On the Kriging of Water Table Elevations Using Collateral Information from a Digital Elevation Model. J. Hydrol. 2002, 255, 25–38. [Google Scholar] [CrossRef]
  39. Theodossiou, N.; Latinopoulos, P. Evaluation and Optimisation of Groundwater Observation Networks Using the Kriging Methodology. Environ. Model. Softw. 2006, 21, 991–1000. [Google Scholar] [CrossRef]
  40. Gundogdu, K.S.; Guney, I. Spatial Analyses of Groundwater Levels Using Universal Kriging. J. Earth Syst. Sci. 2007, 116, 49–55. [Google Scholar] [CrossRef] [Green Version]
  41. Uyan, M.; Cay, T. Spatial Analyses of Groundwater Level Differences Using Geostatistical Modeling. Environ. Ecol. Stat. 2013, 20, 633–646. [Google Scholar] [CrossRef]
  42. Xiao, Y.; Gu, X.; Yin, S.; Shao, J.; Cui, Y.; Zhang, Q.; Niu, Y. Geostatistical Interpolation Model Selection Based on ArcGIS and Spatio-Temporal Variability Analysis of Groundwater Level in Piedmont Plains, Northwest China. Springerplus 2016, 5, 1–15. [Google Scholar] [CrossRef] [PubMed] [Green Version]
  43. Güler, C.; Thyne, G.D.; McCray, J.E.; Turner, A.K. Evaluation of Graphical and Multivariate Statistical Methods for Classification of Water Chemistry Data. Hydrogeol. J. 2002, 10, 455–474. [Google Scholar] [CrossRef]
  44. Belkhiri, L.; Boudoukha, A.; Mouni, L.; Baouz, T. Multivariate Statistical Characterization of Groundwater Quality in Ain Azel Plain, Algeria. Afr. J. Environ. Sci. Technol. 2010, 4, 526–534. [Google Scholar] [CrossRef]
  45. Yang, Q.; Zhang, J.; Wang, Y.; Fang, Y.; Martín, J.D. Multivariate Statistical Analysis of Hydrochemical Data for Shallow Ground Water Quality Factor Identification in a Coastal Aquifer. Pol. J. Environ. Stud. 2016, 24, 769–776. [Google Scholar] [CrossRef]
  46. Massart, D.; Kaufman, L. The Interpretation of Analytical Chemical Data by the Use of Cluster Analysis; Wiley: New York, NY, USA, 1983. [Google Scholar]
  47. Khezzani, B.; Bouchemal, S. Demographic and Spatio-Temporal Distribution of Cutaneous Leishmaniasis in the Souf Oasis (Eastern South of Algeria): Results of 13 Years. Acta Trop. 2017, 166, 74–80. [Google Scholar] [CrossRef]
  48. Abdaoui, G.R.; Amine, T.A.; Foued, B.; Ahmed, B. Bouchemal Salah Sprawl, Specificity and Dynamics of Inter-Municipal Urban Agglomerations of Sprawl, Specificity and Dynamics of Inter-Municipal Urban Agglomerations of the Souf Valley (South East Algeria): Using GIS Techniques. Int. J. Innov. Appl. Stud. 2020, 4, 991–1014. [Google Scholar]
  49. Miloudi, A.M.; Remini, B. The Ghout of Souf: An Original Hydroagricultural System. Geosci. Eng. 2019, 64, 30–37. [Google Scholar] [CrossRef]
  50. Djennane, A. Constat de Situation Dans Des Zones Sud Des Oasis Algériennes. Les Systèmes Agric. Oasiens 1990, 11, 29–40. [Google Scholar]
  51. Dubief, J. Le Climat Du Sahara. Ann. Georgr. 1965, 74, 360–361. [Google Scholar] [CrossRef]
  52. Debaeke, P.; Puech, J.; Casals, M.L.; Petibon, P. Élaboration Du Rendement Du Blé d’hiver En Conditions de Déficit Hydrique. I. Étude En Lysimètres. Agronomie 1996, 16, 3–23. [Google Scholar] [CrossRef]
  53. Bouchet, R.; Hallaire, M. La Réserve Hydrique Du Sol Facilement Utilisable, Ses Variations et Sa Signification. In Proceedings of the Comm. Colloque Franco-Polonais de L’aménagemen t et de L’économi e de l’eau, Varsovie, Poland; 1964; p. 15. Available online: https://hal.archives-ouvertes.fr/hal-01595478/document (accessed on 23 March 2022).
  54. Bel, F.; Demargne, F.F. Etude Géologique Du Continental Terminal; Rapport Technique; ANRH: Algiers, Algeria, 1966. [Google Scholar]
  55. Bel, F.; Cuche, D. Etude Des Nappes Du Complexe Terminal Du Bas Sahara; Données Géologiques et Hydrogéologiques Pour La Construction Du Modèle Mathématique; DHW: Ouargla, Algeria, 1970. [Google Scholar]
  56. Sebaa, A.; Berroussi, S.; Bouhanna, M.; Benazzouz, M. Utilisation des Methodes Traditionnelles de Lutte Contre L’ensablement Dans le Bas—Sahara Algerien: Le Tas De Remblai. J. Algérien Des. Régions Arid. 2009, 21, 96–107. [Google Scholar]
  57. Ballais, J.; Côte, M.; Bensaad, A. L’influence de La Géomorphologie Sur Le Comportement de La Nappe Phréatique Du Souf. Ph.D. Thesis, Université de Provence, Marseille, France, 2002. [Google Scholar]
  58. Fabre, J. Introduction à La Géologie Du Sahara Algérien et Des. Régions Voisines; Société Nationale d’Édition et de Diffusion: Algiers, Algeria, 1976; ISBN 84-499-2264-X. [Google Scholar]
  59. Nesson, C. L’évolution Des Ressources Hydrauliques Dans Les Oasis Du Bas-Sahara Algérien. GéoProdig Portail D’information Géographique 1975, 17, 7–99. [Google Scholar]
  60. Busson, G. Principes, Méthodes et Résultats d’une Étude Stratigraphique Du MésozoÏque Saharien; Éditions du Muséum: Paris, France, 1972; Volume 26. [Google Scholar]
  61. Giraud, R. Le Continental Terminal En Algérie; Ann. Fac. Sci.: Dakkar, Senegal, 1978; Volume 31. [Google Scholar]
  62. Chebbah, M.; Allia, Z. Geochemistry and Hydrogeochemical Process of Groundwater in the Souf Valley of Low Septentrional Sahara, Algeria. Afr. J. Environ. Sci. Technol. 2015, 9, 261–273. [Google Scholar] [CrossRef]
  63. Drouiche, A.; Chaab, S.; Khechana, S. Impact Du Deversement Direct Des Eaux Usees et de Drainage Dans La Nappe Libre de l’Oued Souf et Son Influence Sur La Qualite Des Eaux Souterraines. Synthèse Rev. Sci. Technol. 2013, 62, 50–62. [Google Scholar]
  64. Kerényi, A.; McIntosh, R. Sustainable Development in Changing Complex Earth Systems; Springer: Berlin/Heidelberg, Germany, 2020; ISBN 9783030216443. [Google Scholar]
  65. Khechana, S.; Derradji, F.; Mega, N. Caractéristiques Hydrochimiques Des Eaux de La Nappe Phréatique Du Vallée d’Oued-Souf (SE Algérien). Eur. J. Sci. Res. 2011, 62, 207–215. [Google Scholar]
  66. Messekher, I.; Menani, M. Evolution de La Piezometrie de La Ville d’Oued Souf (Entre 1993, 2002 et 2007): Perspectives de La Maitrise Du Phenomene de Remont e de La Nappe Phréatique. J. Int. Net. Environ. Manag. Conf. 2010, 1, 259–266. [Google Scholar]
  67. Meziani, A.; Dridi, H. The Aquifer System of the Souf Valley: Algerian Northern Sahara. Eur. J. Sci. Res. 2011, 65, 416–423. [Google Scholar]
  68. Guendouz, A.; Michelot, J.L. Chlorine-36 Dating of Deep Groundwater from Northern Sahara. J. Hydrol. 2006, 328, 572–580. [Google Scholar] [CrossRef]
  69. Castany, G. Sedimentary Basin of the Northern Sahara (Algeria, Tunisia). Intercalary Continental and Terminal Complex Aquifers [Confined Groundwater, Multilevel System, Hydrodynamics, Management of Water Resources, and Environment. Bull. Du Bur. Rech. Geol. Min. Sect. 3 Hydrogeol. Geol. L’ingenieur 1982, 2, 127–147. [Google Scholar]
  70. Najah, A. Le Souf Des. Oasis; Editions La Maison des Livres: Alger, France, 1970. [Google Scholar]
  71. Dervierux, F. La Nappe Phréatique Du Souf (Région d’El Oued, Algérie)-Etude Du Renouvellement de La Nappe. Terres Eaux OCRS 3trim 1957, 56, 12–39. [Google Scholar]
  72. Ben Hamida, S. Iventaire Des Forages d’eau de La Wilaya d’El Oued; Agence National des Ressources Hydraulique (ANRH): Ouargla, Algérie, 2005. [Google Scholar]
  73. DRE Inventaire Des Puits Traditionnels de La Wilaya d’El-Oued; Direction des Ressources en Eau de Wilaya (DRE): El Oued, Algeria, 2015.
  74. Kherici, N.; Zounini, D.; Kherici, H. Origine de La Remontee Des Eaux Dans La Nappe Superficielle de Souf (Nord-Est Du Sahara Septentrional Algerien). Hidrogeología 1996, 12, 49–59. [Google Scholar]
  75. Guendouz, A.; Moulla, A.S.; Edmunds, W.M.; Zouari, K.; Shand, P.; Mamou, A. Hydrogeochemical and Isotopic Evolution of Water in the Complexe Terminal Aquifer in the Algerian Sahara. Hydrogeol. J. 2003, 11, 483–495. [Google Scholar] [CrossRef]
  76. Gonçalvès, J.; Petersen, J.; Deschamps, P.; Hamelin, B.; Baba-Sy, O. Quantifying the Modern Recharge of the “Fossil” Sahara Aquifers. Geophys. Res. Lett. 2013, 40, 2673–2678. [Google Scholar] [CrossRef]
  77. Cornet, A. Introduction à l’hydrogéologie Saharienne. Géorg. Phys. Géol. Dyn 1946, 6, 5–72. [Google Scholar]
  78. UNESCO. Etude Des Ressources En Eau de Sahara Septentrional; UNESCO: Paris, France, 1972; Volume 7. [Google Scholar]
  79. Burri, J.; Burri, J. Vallée Du Souf: Etudes d’assainissement Des Eaux Résiduaires, Pluviales et d’irrigation. In Mesures Complémentaires de Lutte Contre La Remontée de La Nappe Phréatique; Bonard et Gardel (BG): Lausanne, Switzerland, 2004. [Google Scholar]
  80. Chen, L.; Feng, Q. Geostatistical Analysis of Temporal and Spatial Variations in Groundwater Levels and Quality in the Minqin Oasis, Northwest China. Environ. Earth Sci. 2013, 70, 1367–1378. [Google Scholar] [CrossRef]
  81. Montero, J.; Fernández-Avilés, G.; Mateu, J. Spatial and Spatio-Temporal Geostatistical Modeling and Kriging; John Wiley & Sons: Hoboken, NJ, USA, 2015. [Google Scholar]
  82. Webster, R.; Oliver, M. Geostatistics for Environmental Scientists; John Wiley & Sons: Hoboken, NJ, USA, 2007. [Google Scholar]
  83. Kumar, A.; Maroju, S.; Bhat, A. Application of ArcGIS Geostatistical Analyst for Interpolating Environmental Data from Observations. Environ. Prog. 2007, 26, 220–225. [Google Scholar] [CrossRef]
  84. Ahmadi, S.H.; Sedghamiz, A. Geostatistical Analysis of Spatial and Temporal Variations of Groundwater Level. Environ. Monit. Assess. 2007, 129, 277–294. [Google Scholar] [CrossRef]
  85. Mei, K.; Liao, L.; Zhu, Y.; Lu, P.; Wang, Z.; Dahlgren, R.A.; Zhang, M. Evaluation of Spatial-Temporal Variations and Trends in Surface Water Quality across a Rural-Suburban-Urban Interface. Environ. Sci. Pollut. Res. 2014, 21, 8036–8051. [Google Scholar] [CrossRef] [Green Version]
  86. Seo, Y.; Kim, S.; Singh, V.P. Estimating Spatial Precipitation Using Regression Kriging and Artificial Neural Network Residual Kriging (RKNNRK) Hybrid Approach. Water Resour. Manag. 2015, 29, 2189–2204. [Google Scholar] [CrossRef]
  87. Cressie, N.; Hawkins, D. Robust Estimation of the Variogram: I. J. Int. Assoc. Math. Geol. 1980, 12, 115–125. [Google Scholar] [CrossRef]
  88. Oliver, M.A.; Webster, R. A Tutorial Guide to Geostatistics: Computing and Modelling Variograms and Kriging. Catena 2014, 113, 56–69. [Google Scholar] [CrossRef]
  89. Delhomme, J.P. Kriging in the Hydrosciences. Adv. Water Resour. 1978, 1, 251–266. [Google Scholar] [CrossRef]
  90. Pebesma, E.J. Multivariable Geostatistics in S: The Gstat Package. Comput. Geosci. 2004, 30, 683–691. [Google Scholar] [CrossRef]
  91. Adhikary, P.P.; Chandrasekharan, H.; Chakraborty, D.; Kamble, K. Assessment of Groundwater Pollution in West Delhi, India Using Geostatistical Approach. Environ. Monit. Assess. 2010, 167, 599–615. [Google Scholar] [CrossRef] [PubMed]
  92. Bhuiyan, M.A.H.; Suruvi, N.I.; Dampare, S.B.; Islam, M.A.; Quraishi, S.B.; Ganyaglo, S.; Suzuki, S. Investigation of the Possible Sources of Heavy Metal Contamination in Lagoon and Canal Water in the Tannery Industrial Area in Dhaka, Bangladesh. Environ. Monit. Assess. 2011, 175, 633–649. [Google Scholar] [CrossRef] [PubMed]
  93. Bouaicha, F.; Dib, H.; Belkhiri, L.; Manchar, N.; Chabour, N. Hydrogeochemistry and Geothermometry of Thermal Springs from the Guelma Region, Algeria. J. Geol. Soc. India 2017, 90, 226–232. [Google Scholar] [CrossRef]
  94. Bouteraa, O.; Mebarki, A.; Bouaicha, F.; Nouaceur, Z.; Laignel, B. Groundwater Quality Assessment Using Multivariate Analysis, Geostatistical Modeling, and Water Quality Index (WQI): A Case of Study in the Boumerzoug-El Khroub Valley of Northeast Algeria. Acta Geochim. 2019, 38, 796–814. [Google Scholar] [CrossRef]
  95. Emenike, P.G.C.; Nnaji, C.C.; Tenebe, I.T. Assessment of Geospatial and Hydrochemical Interactions of Groundwater Quality, Southwestern Nigeria. Environ. Monit. Assess. 2018, 190, 440. [Google Scholar] [CrossRef] [Green Version]
  96. Cambardella, C.A.; Moorman, T.B.; Novak, J.M.; Parkin, T.B.; Karlen, D.L.; Turco, R.F.; Konopka, A.E. Field-Scale Variability of Soil Properties in Central Iowa Soils. Soil Sci. Soc. Am. J. 1994, 58, 1501–1511. [Google Scholar] [CrossRef]
Figure 1. Location map of the study area exemplifying the distribution of the monitoring wells (drains of the vertical drainage system).
Water 14 01415 g001
Figure 2. Topographic map of the study area.
Water 14 01415 g002
Figure 3. The three aquifers are shown in a hydrogeological section that passes through the study area modified from [78].
Water 14 01415 g003
Figure 4. The generating factors of groundwater rising modified from [27].
Water 14 01415 g004
Figure 5. Dendrogram of hierarchical clustering analysis (Q-mode) of the phreatic groundwater levels.
Water 14 01415 g005
Figure 6. Map showing four clusters of drains.
Water 14 01415 g006
Figure 7. Histograms of normality tests: (A) 2008, (B) 2009, (C) 2014 ,(D) 2016, (E) 2018, (F) 2021.
Water 14 01415 g007
Figure 8. Fitted experimental semivariograms of groundwater level over the years: (A) 2008, (B) 2009, (C) 2014, (D) 2016, (E) 2018, (F) 2021.
Water 14 01415 g008
Figure 9. Spatial distribution maps: (A) 2008, (B) 2009, (C) 2014, (D)2016.
Water 14 01415 g009
Figure 10. Decline and rise rates over the years of the observation period.
Water 14 01415 g010
Figure 11. Spatial distribution maps: (A) 2018, (B) 2021.
Water 14 01415 g011
Figure 12. (A). Distribution of the extracted water in percentage from the aquifer system of the study area; (B). Distribution of the extracted water in percentage depending on the usage.
Water 14 01415 g012
Figure 13. Groundwater exploitation, Sewerage, treatment of wastewater, evacuation, and drainage systems of the study area.
Water 14 01415 g013
Table 1. Water balance for Guemar airport climatic station between (1978–2020).
MonthsJanFebMarAprMayJunJulAugSepOctNovDecTotal
P (mm)13.895.067.847.384.471.440.231.815.626.567.415.9267.63
PET (mm)62.1681.14133.59177.32222.80246.43260.13234.27175.67124.9575.4456.751850.66
EUR (mm)0000000000000
RET (mm)13.895.067.847.384.471.440.231.815.626.567.415.9267.63
AD (mm)48.2876.08125.75169.94218.33244.99259.90232.46170.05118.3868.0350.831783.03
R (mm)0000000000000
I (mm)0000000000000
Table 2. Statistical summary of the four main groundwater levels recorded from the drainage system in the studied period grouped by HCA.
GroupsYears200820092014201620182021Mean
Group 1N total2222222222225.91
Min−0.3−0.40.615.12.1
Mean2.992.645.66.4311.446.37
Max5.925.4610.3614.4815.89.5
Standard deviation1.691.532.453.773.012.48
Group 2N total1818181818187.74
Min2.222.164.91.1110.448.4
Mean4.624.347.184.9514.3111.07
Max7.137.0412.617.6328.815
Standard deviation1.431.301.741.944.511.74
Group 3N total1818181818189.31
Min4.494.057.317.227.86.2
Mean7.196.909.9110.6210.9610.31
Max11.310.5114.0215.114.415
Standard deviation1.841.712.122.742.382.48
Group 4N total18181818181812.98
Min8.57.8611.211.714.466.3
Mean12.3111.6414.4215.0915.618.8
Max15.315.1718.2319.5319.812.5
Standard deviation2.152.262.562.381.872.37
Table 3. Summary statistic of groundwater levels during 2008, 2009, 2014, 2016, 2018, and 2021.
YearsN totS.DMeanC.V(%)Min1st
Quartile
Median3rd
Quartile
MaxSkewnessKurtosis
2008583.415.4163.068−0.33.424.566.5615.31.02980.92
2009583.285.0664.974−0.42.754.156.5315.171.07321.07
2014583.577.9744.8510.65.577.389.518.230.71050.80
2016584.427.8056.70614.947.139.7319.530.5096−0.33
2018583.7112.7429.1865.110.512.5114.728.81.369855.309
2021583.028.8634.1582.17.29.221115−0.34105−0.054
Table 4. Fitted experimental semivariograms parameters and their cross-validation results.
YearModelNugget (C0)Partial Sill (C)Sill
(C0 + C)
Range (m)(C0/C0 + C) ×100Spatial Dependence
2008Pentaspherical2.099813.960616.06043054.913.0744Strong
2009Hole effect3.63929.238712.87793000.328.2593Moderate
2014Gaussian4.294813.19217.4868193124.5602Strong
2016Circular5.829618.575624.40521865.223.8867Strong
2018Spherical1.426913.006714.4336702.559.8860Strong
2021STABLE3.636.410.035061.9736.1914Moderate
Table 5. Prediction errors of the selected models.
YearsPrediction Errors
MeanRoot Mean
Square
Average Standard
Error
Mean
Standardized
Root Mean Square
Standardized
2008−0.03342.55892.5203−0.00951.0346
2009−0.03072.45342.2109−0.01021.1262
20140.00242.68452.58780.00281.0643
20160.04153.18523.57930.00440.9129
20180.01573.46353.77260.00830.948
2021−0.0082.98682.9775−0.00401.0024
Publisher’s Note: MDPI stays neutral with regard to jurisdictional claims in published maps and institutional affiliations.

