Article

Quantifying the Spatial Distribution of Soil Nitrogen under Long-Term Drip Fertigation

1
Institute of Water Resources and the Environment, China University of Geosciences, Beijing 100083, China
2
State Key Laboratory of Simulation and Regulation of Water Cycle in River Basin, China Institute of Water Resources and Hydropower Research, Beijing 100038, China
3
College of Land Science and Technology, China Agricultural University, Beijing 100083, China
4
Nan Jing Institute of Agricultural Sciences, Nanjing 210000, China
*
Authors to whom correspondence should be addressed.
Water 2022, 14(9), 1337; https://doi.org/10.3390/w14091337
Submission received: 15 February 2022 / Revised: 17 March 2022 / Accepted: 22 March 2022 / Published: 20 April 2022
(This article belongs to the Special Issue Advances in Sprinkler Irrigation Systems and Water Saving)

Abstract

:
Quantifying the spatial distribution of nitrogen (N) in the soil under long-term drip fertigation events is essential for the optimal regulation of drip fertigation systems. In this study, a greenhouse soil that had been under drip irrigation for 20 years was selected as the research object, and soil samples were collected from the 0–50 cm soil depth. The concentrations of N in the soil samples were measured and their spatial distribution characteristics were quantified by classical statistical analysis and multifractal analysis. The results showed that long-term drip fertigation and the influence of natural factors resulted in the nitrate N mainly accumulating in the shallow layer of the soil and within a distance from the drip irrigation belt, and the spatial heterogeneity gradually decreased with increasing depth. The content of ammonium N was low, and its distribution was observed in the whole section. Multifractal analysis indicated that the Δα value of nitrate N and inorganic N gradually increased with the increase in the research scale, i.e., the spatial heterogeneity gradually increased, and it did not appreciably change for ammonium N. Meanwhile, the local high value region was the main factor leading to the spatial heterogeneity of N, and this dominant effect gradually increased with increasing depth. Multifractal analysis can effectively reflect the local information of the N spatial distribution in the soil and provide a more detailed description of the spatial heterogeneity of soil properties.

1. Introduction

Facility greenhouse drip fertigation can directly transport water and nutrients to the root zone of crops, resulting in wetting, high yield, and efficient use of water and fertilizer [1,2,3]). It is widely used in countries throughout the world [4,5,6]. Due to the characteristics of point infiltration and local wetting of drip irrigation, it is inevitable that soil nitrogen shows different degrees of variability in terms of spatial distribution. The spatial distribution and variability of soil nitrogen is essential for maintaining soil quality and improving water and fertilizer use efficiency.
During recent years, most studies have focused on improving the economic benefits, aiming to determine the effects of drip fertigation strategies on crop yield and quality [7,8,9], and less attention has been paid to the effects of long-term drip fertigation on the nitrogen distribution and variability in soil profiles. Nitrogen content analysis showed that although drip fertigation can reduce the deep leakage of nitrogen and improve the efficiency of water and fertilizer use, the weak single-time irrigation amount and irrigation intensity tend to result in the accumulation nitrogen in the shallow layers [10,11]. At present, the research methods used to investigate the spatial variability of soil properties are summarized by traditional statistical methods, geostatistical methods [12,13], spectral analysis, and fractal theory [14,15] of these methods. The traditional analysis methods mostly average the original data to a certain extent, which has certain limitations in reflecting the variability of local information, and fractal theory can quantitatively characterize the complex structure of material properties. To overcome the deficiencies of single fractal analysis, multifractal theory fully considers the difference between the feature quantities in each small sampling unit in the study area, and is unaffected by the data distribution, and thus, multifractal theory can better reflect the variation information neglected. Therefore, multifractal methods are widely used to describe the spatial variability of soil properties and their scale effects [16,17,18,19] while fewer related research studies have focused on the spatial variability of soil nitrogen [20].
In this study, the spatial distribution and variability of soil nitrogen in greenhouses under long-term drip irrigation were analyzed based on the combination of traditional analysis methods and multifractal theory. The objective of this paper was to provide a theoretical basis for the development of greenhouse water and fertilizer control measures.

2. Materials and Methods

2.1. Study Area

The experiment was carried out in the solar greenhouse of the Panggezhuang Experimental Station of the National Water-saving Irrigation Beijing Engineering Technology Research Center during June 2017. This greenhouse has been subjected to drip irrigation and fertilization management for 20 consecutive years. The planting area of the solar greenhouse is 600 m2; the layout of the plot is shown in Figure 1 and Figure 2. Before a crop is planted, organic, potassium, and phosphate fertilizers are applied as the base fertilizer. During the growth period, nitrogen fertilizer is applied during several stages once every two weeks, and the amount of fertilizer applied to different crops is determined based on China’s Major Crop Fertilization Guidelines.
The tested soil was a silty loam with a density of 1.44 g/cm3 and a pH of 8.48. The soil was a weakly alkaline soil with a field moisture capacity of 24.48%. The 0–40 cm basic soil layer had a total nitrogen of 0.79 g/kg, alkali nitrogen of 268 mg/kg, effective phosphorus of 124 mg/kg, available potassium of 138 mg/kg, and organic matter of 11.9 g/kg, as shown in Table 1.

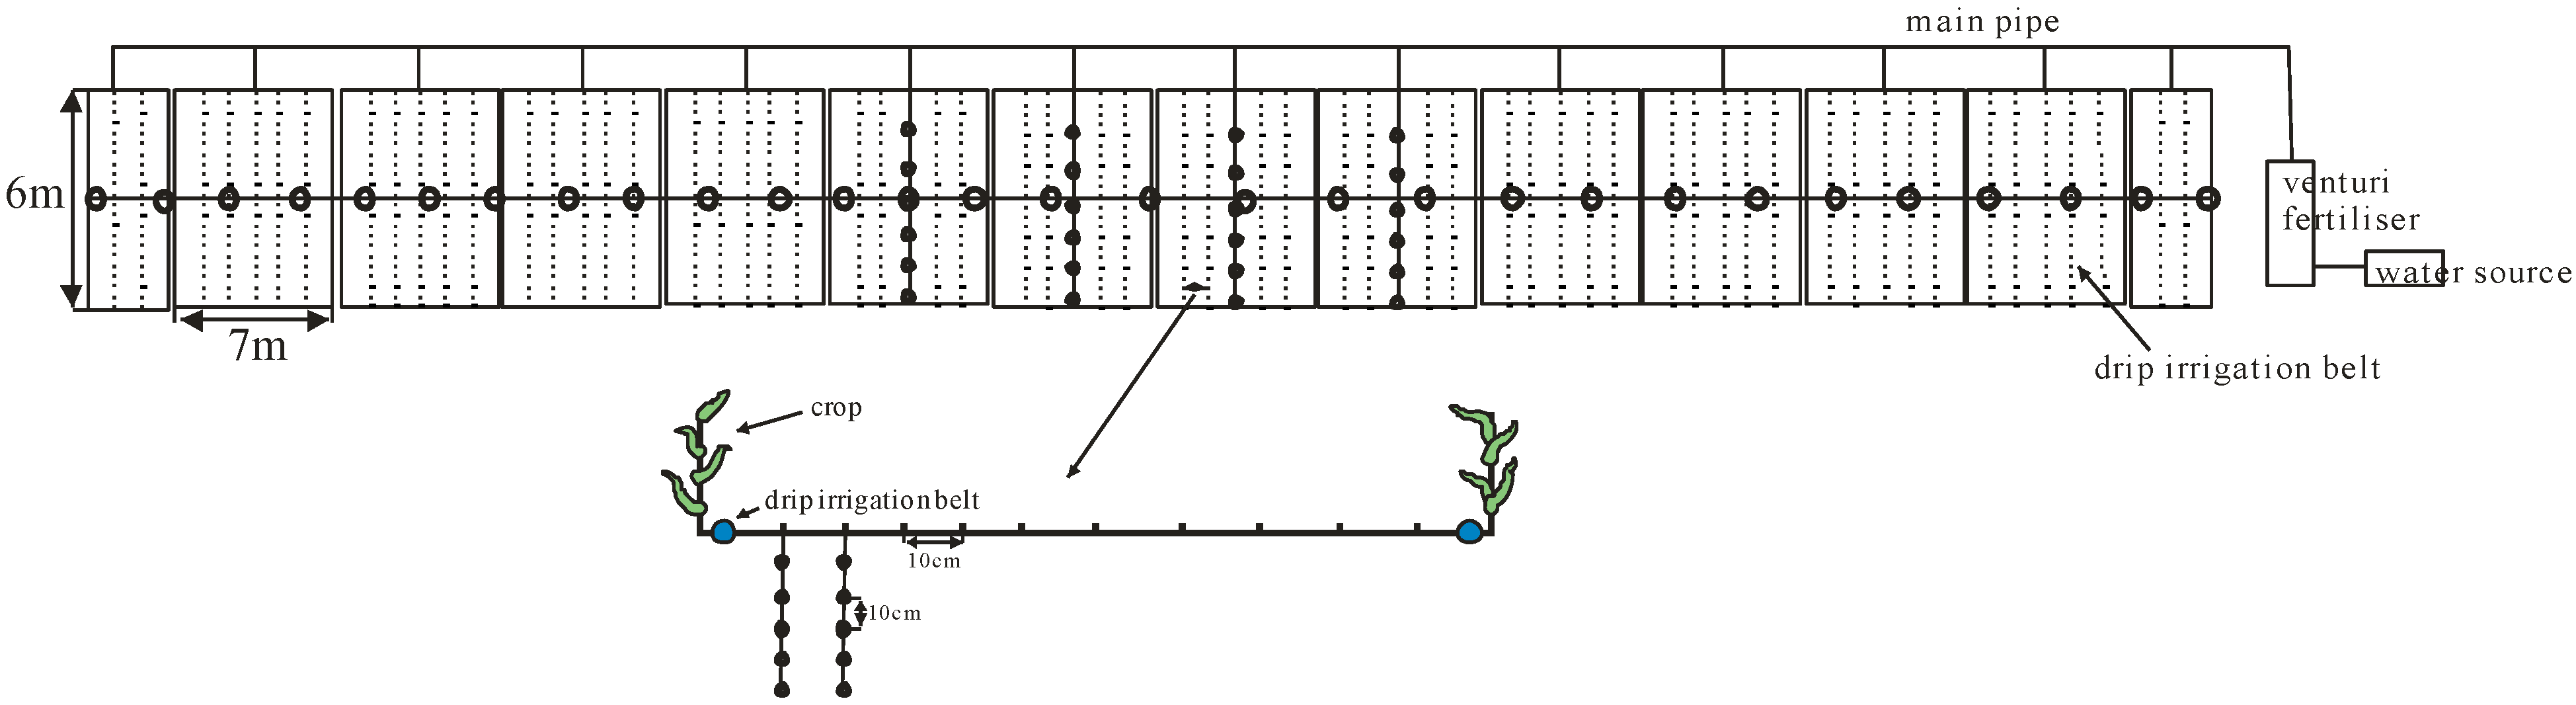
2.2. Sampling Methods

The experiment was conducted on the greenhouse soil of the facility subject to multiyear drip fertigation management and was sampled at the end of the spring sap crop on 28 June 2018. Three kinds of soil sampling methods were used: the large-scale section of the vertical drip irrigation zone (the sampling point interval was 2 m and the number of sampling points was 43), the section parallel to the drip irrigation zone (the sampling point interval was 1 m with 4 repeats for a total of 24 sampling points at 6 points per row), and a small-scale section of the vertical drip irrigation zone (the sampling point interval was 10 cm, each sampling section had 10 sampling points in the horizontal direction with 4 repetitions for a total of 40 sampling points). In total, 107 sample points were established. Each sampling point was sampled in the following soil layers: 0–10, 10–20, 20–30, 30–40, and 40–50 cm depth, for a total of 535 soil samples. The samples were collected for air drying and grinding, and then leached with a liquid to soil ratio of 5:1 in a 0.01 mol/L CaCl2 solution. The samples were then subjected to an AA3 continuous flow analyzer (AutoAnalyser-III, Bran+Luebbe, Germany) to assess the nitrate nitrogen and ammonium nitrogen contents in the leaching liquid. The arrangement of the sampling points was as follows:
The descriptive statistical analysis of soil nitrate nitrogen and ammonium nitrogen content data was carried out using SPSS 20.0. The spatial distribution contour map and the anomaly distribution map were drawn by kriging interpolation using the Surfer 14.0 software. The spatial variability of soil nitrate nitrogen, ammonium nitrogen, and inorganic nitrogen in different soil layers was analyzed by the coefficient of variation (CV) and multifractal theory. The larger the CV, the more dispersed the data, thus showing higher spatial heterogeneity of the indicator. The calculation formula is as follows:
CV = SD MN × 100 %
The variation in the soil nitrogen content was graded according to the CV. A CV < 10% is a weak mutation, a CV between 10% and 100% is moderate variation, and a CV > 100% is strong variation [21].
The multifractal method distinguishes the eigenvalues in each small unit by the mass probability distribution set, and analyzes the variation in structures with complex fractals at different scales using important parameters, such as generalized dimensions Dq, singularity strength α(q), and multifractal spectrum f(α), which is another method of geostatistics [22], and the calculation of parameters mainly refers to the previous literature [22,23,24]. This test samples the soil profile in the study area at an equal distance. Therefore, the measured value reflects the average content level of the 10 cm height soil column. According to the multifractal principle, the multifractally distributed measure of nitrogen is first determined. The sampling section is divided into n meshing elements with scales of ε. If the nitrogen content in the ith meshing is Mi, the calculation formula of the probability measure pi(ε) of the meshing is as follows:
p i ( ε ) = M i i = 1 n M i
where ε is the grid scale, n is the number of grids at the scale, and Mi is the measured value of the nitrogen content in the i-th grid. Then, the partition function χq(ε) is constructed, which is a weighted summation of the q-th power of pi(ε) as follows:
χ q ( ε ) = i = 1 n p i q ( ε ) = ε τ ( q )
This equation shows that for the multifractal measure, the partition function χq(ε) has a power function relationship at a research scale ε. Then, the quality index τ(q) can be obtained by fitting the slope of the lgχq(ε)–lgε curve as follows:
τ ( q ) = lg χ ( ε ) lg ε ( ε 0 )
Then, the following parameters are obtained from the relationship between τ(q) and q, where the generalized multifractal dimension is as follows:
D q = τ ( q ) q 1 = lg χ q ( ε ) ( q 1 ) lg ε ( ε 0 )
The multifractal singularity index of the soil property distribution is as follows:
α ( q ) = i = 1 n χ i ( q , ε ) lg p i ( ε ) lg ε ( ε 0 )
The multifractal spectrum is as follows:
f ( α ) = i = 1 n χ i ( q , ε ) lg χ i ( q , ε ) lg ε ( ε 0 )

3. Results and discussion

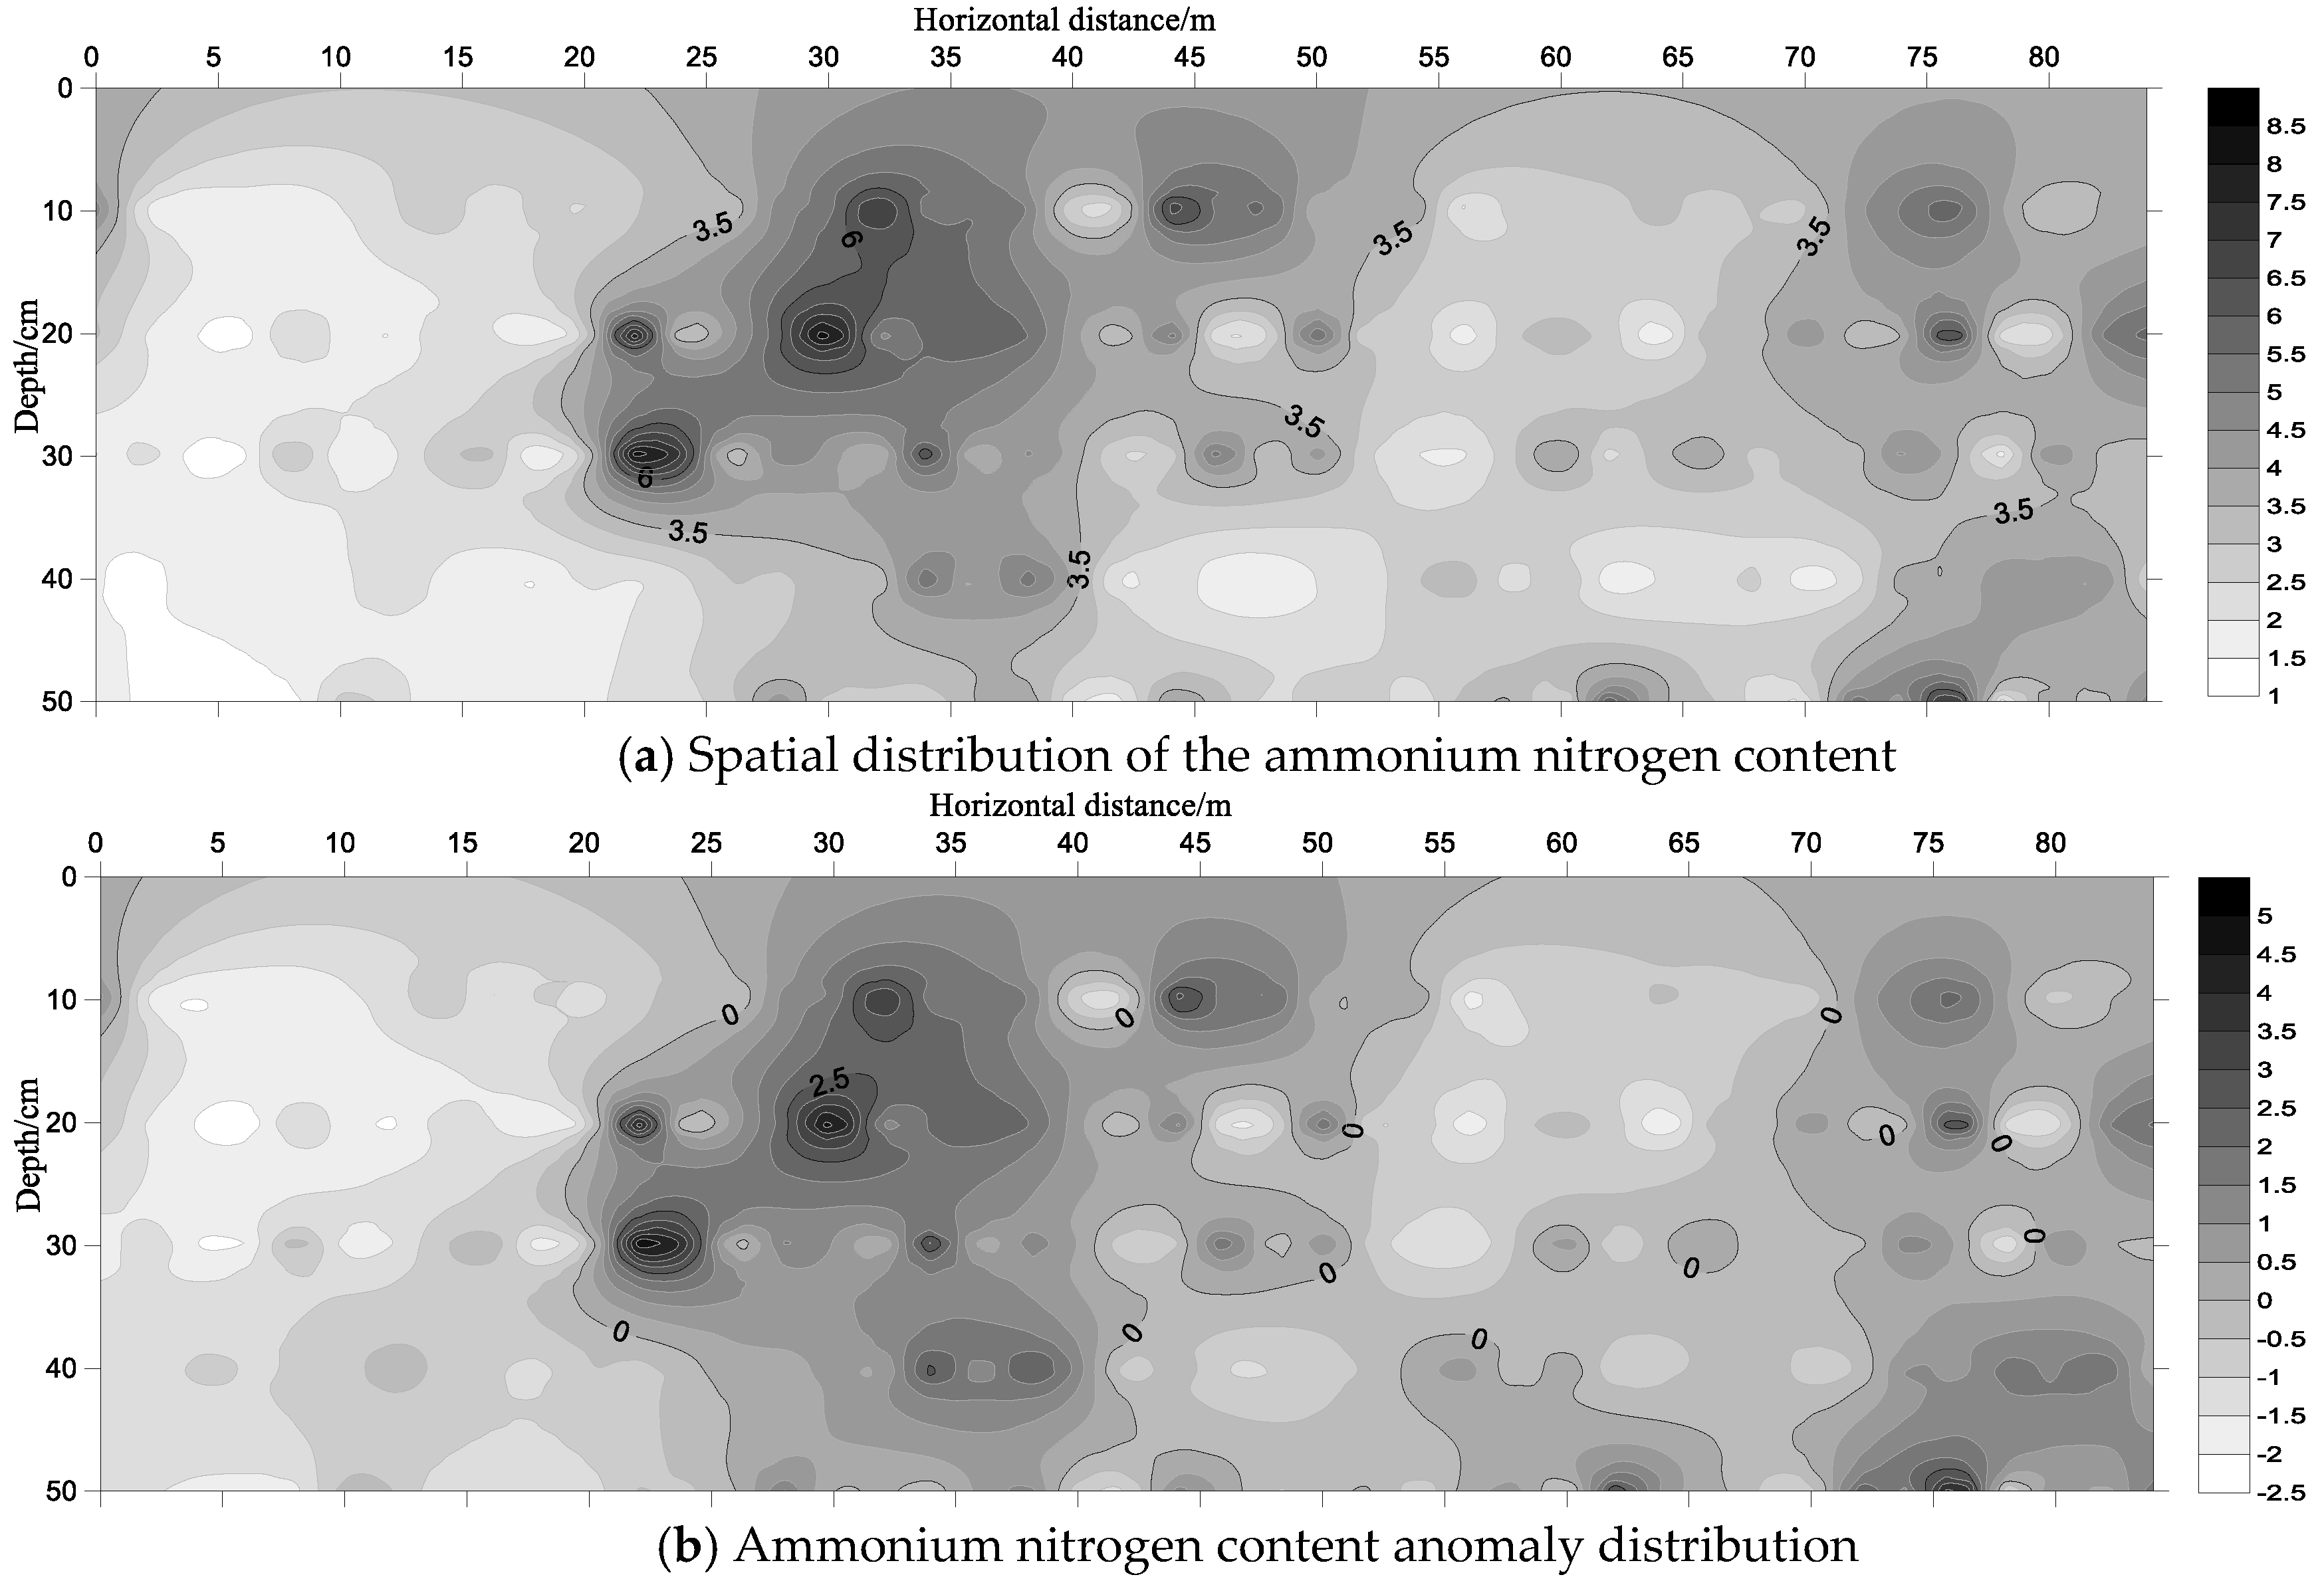
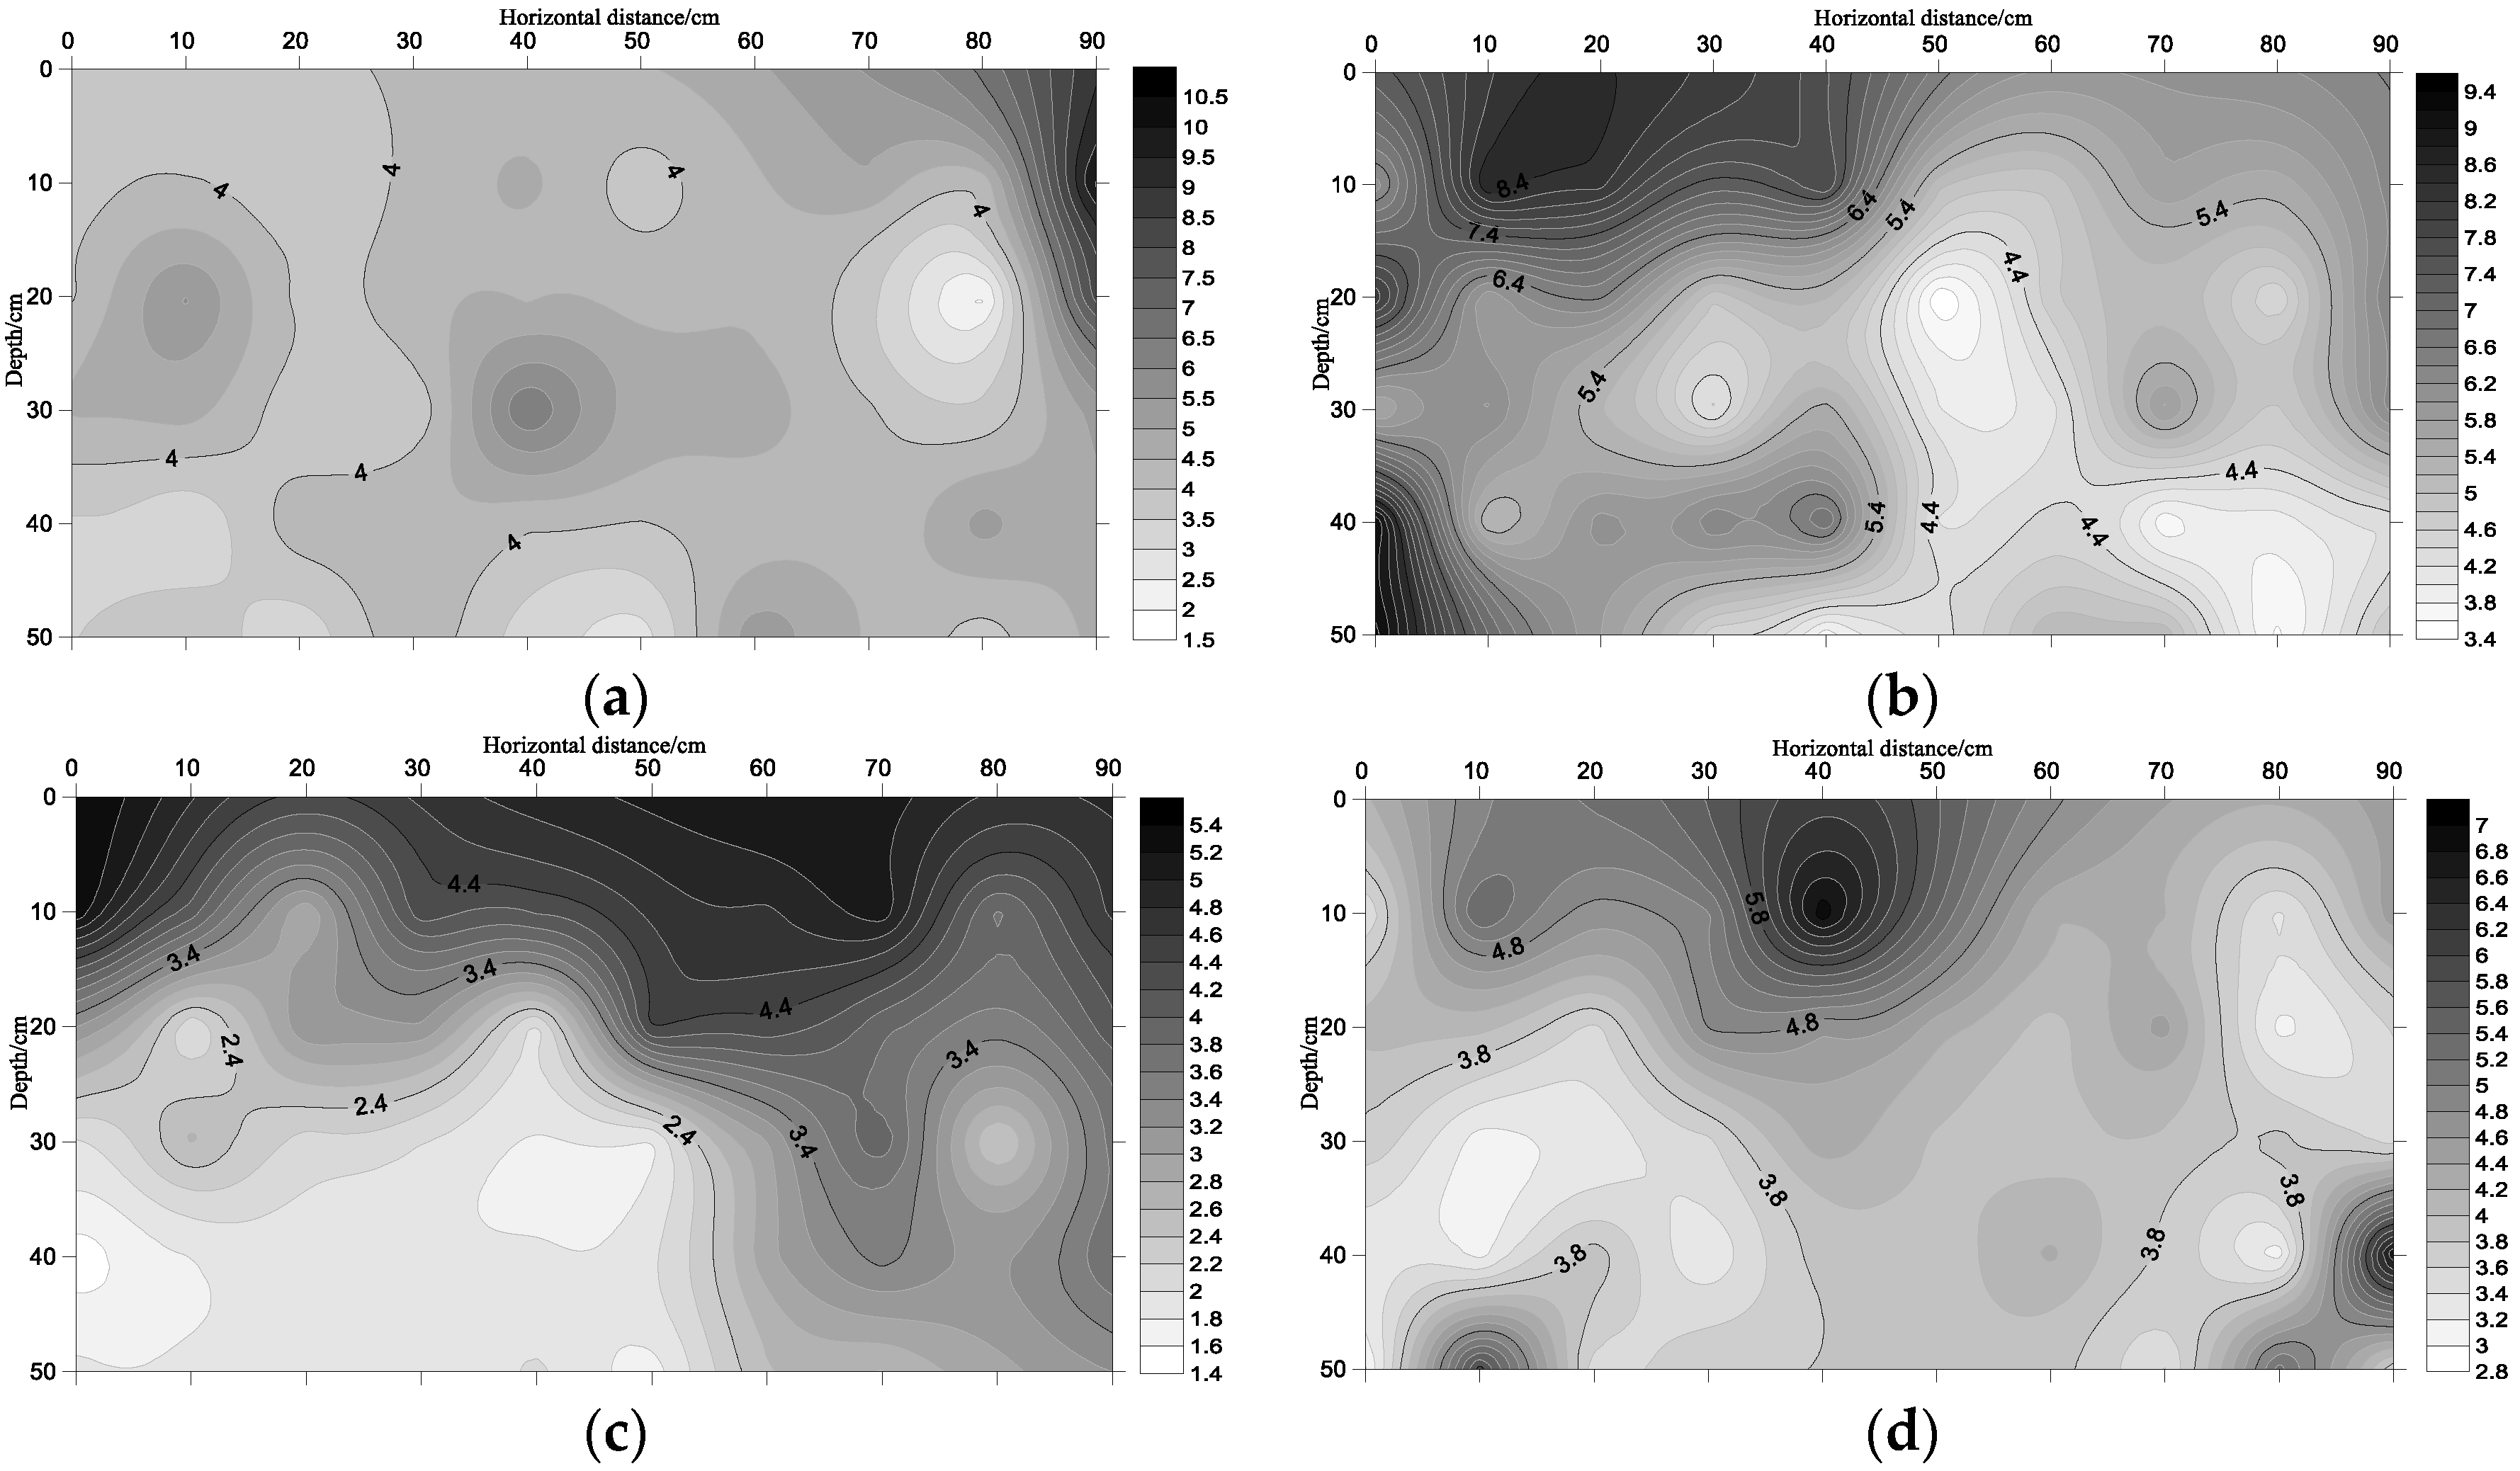
3.1. Spatial Distribution Characteristics of Nitrate Nitrogen and Ammonium Nitrogen under Drip Fertigation

As shown in Figure 3, the nitrate nitrogen is mainly distributed in the 0–30 cm soil layer in the vertical direction, particularly in the 10–20 cm soil layer, and the nitrate nitrogen content is significantly lower below 30 cm. In the horizontal direction, the content contour is not parallel with the ground, but a local nitrate-nitrogen peak region appears at nearly equal intervals, and the highest content appears at a depth of approximately 10 cm. In general, nitrate nitrogen is more motile in the soil, and it is also more likely to result in leakage loss. However, in the study area of the soil environment with long-term drip fertigation, nitrate nitrogen has a certain “energy” phenomenon. First, the soil in the greenhouse below 40 cm is at the bottom of the plow. It can be seen from the grain fraction of different depths that the average sand content of the 0–40 cm soil layer is approximately 26%, which is 5 times higher than that of the 40–60 cm soil layer. Changes in soil permeability hinder the migration of nitrate nitrogen to depth, which causes nitrogen to accumulate near the interface of the 40 cm soil layer [25]. As shown in Figure 3, the nitrate nitrogen content at a depth of approximately 40 cm is low, which may be because when the soil porosity is high, the movement of solute in the pores is mainly driven by gravity [26]. At this time, the soil water content is the key factor of nitrogen transportation and distribution. In the closed environment of the solar greenhouse, the soil moisture mainly originates from drip irrigation, and the distribution of soil water and nitrogen is affected by the way the drip irrigation pipe is laid. At the same time, the environment lacks the rainfall leaching effect of open-air conditions, which obstructs the nitrate nitrogen from washing into the deep part of the soil, and it migrates to the shallow layer of soil via the evaporation of water. It can be seen from the anomalous distribution of nitrate nitrogen on the horizontal layer (Figure 3b) that most of the anomalies are negative, and the positive anomalies are as high as 35 or more, mainly distributed in the 0–30 cm soil layer, which indicates that the content of surface nitrogen greatly varies in the horizontal direction.
This phenomenon can be explained well by decreasing the study scale between two-drip irrigation tubes (Figure 4). The vertical profiles between the four randomly selected drip irrigation belts show that nitrate nitrogen is mainly distributed in the surface layer of the soil within the 0–30 cm depth under long-term drip fertigation conditions, and the accumulation phenomenon between the drip irrigation pipes. Because, during the process of drip fertigation, nitrate nitrogen easily migrates with water and accumulates at the edge of the wetting front, the absorption of nitrogen by the crop causes the nitrate nitrogen content around the drip irrigation zone to be lower. The high value area of intermediate nitrate nitrogen is the superimposed effect of fertilization on both sides of the drip irrigation. Following irrigation and fertilization at the end of the crop period, the small amount of nitrogen remaining in the profile continues to migrate via the evaporation of water and accumulates in the surface layer. Thus, nitrate nitrogen accumulates in the surface layer and a plurality of nearly equally spaced high value regions appears in the horizontal direction.
Compared with nitrate nitrogen, ammonium nitrogen is easily adsorbed by soil particles. Figure 5 shows the distribution of ammonium nitrogen along an east-west profile under long-term drip fertigation conditions. Perhaps because the soil is weakly alkaline (pH > 8) and the content of ammonium nitrogen in the whole section is at a low level (≤ 6 mg/kg), the relatively high value area is mainly distributed at 5–40 cm. First, the soil surface layer is greatly affected by external factors, which increases the loss of ammonium nitrogen. In general, ammonium nitrogen is less affected by water movement in the soil and more affected by soil texture. Studies have shown that the migration ability of ammonium nitrogen in soil is sandy loam > clay loam > loamy clay [27]; that is, the larger the soil particles are, the better the migration of ammonia nitrogen to depth is. The test soil was a sandy loam; thus, the ammonium nitrogen migrates to greater depths and is more evenly distributed at different depths. In the horizontal direction, the anomaly distribution is consistent with the content distribution, and most of the anomalies are 0; thus, the ammonium nitrogen is evenly distributed throughout the entire section.
Figure 6 shows the distribution of ammonium nitrogen in the profile between the two drip zones. From the overall trend shown in the four sections, it is shown that ammonium nitrogen is mainly distributed around the drip irrigation zone and mainly because the movement of ammonium nitrogen in the soil is greatly affected by the soil colloidal particles. Zhang et al. [28] concluded that the mass concentration has a significant positive correlation with the flow rate, indicating that hydraulic shearing and infiltration of the water flow is the main mechanism of colloid release and migration.

3.2. Descriptive Statistics of the Spatial Variability of Nitrate Nitrogen and Ammonium Nitrogen under Drip Fertigation

Table 2 shows the average levels and variability of the nitrate and ammonium nitrogen contents at different soil depths under drip fertigation. It can be seen that the average content of the nitrate nitrogen decreases with an increase in the soil depth. The highest average content occurred in the surface layer of 0–10 cm, which was 26.2 mg/kg. The content in the 10–20 cm soil layer rapidly decreased to 12.5 mg/kg. The content below 20 cm was stable at approximately 7.5 mg/kg. The ammonium nitrogen was uniformly distributed within the upper 0–30 cm, slightly decreased below 30 cm, and stabilized at approximately 2.7 mg/kg. Therefore, after comparing the two changes in the vertical direction, it is evident that nitrate nitrogen has a higher content and variability than ammonium nitrogen, and there is a significant “aggregation” phenomenon. In the horizontal direction, the variability analysis showed that the coefficient of variation of ammonium nitrogen fluctuated between 0.42 and 0.54, which was moderately variable; the coefficient of variation of nitrate nitrogen first decreased and then increased in the 0–50 cm soil layer; and the coefficient of variation in the 0–10 cm soil layer was the largest, at 1.48, which is a strong change. The nitrate content in the soil below 10 cm was moderately variable, and the variability of the 20–30 cm soil layer was reduced to a minimum.

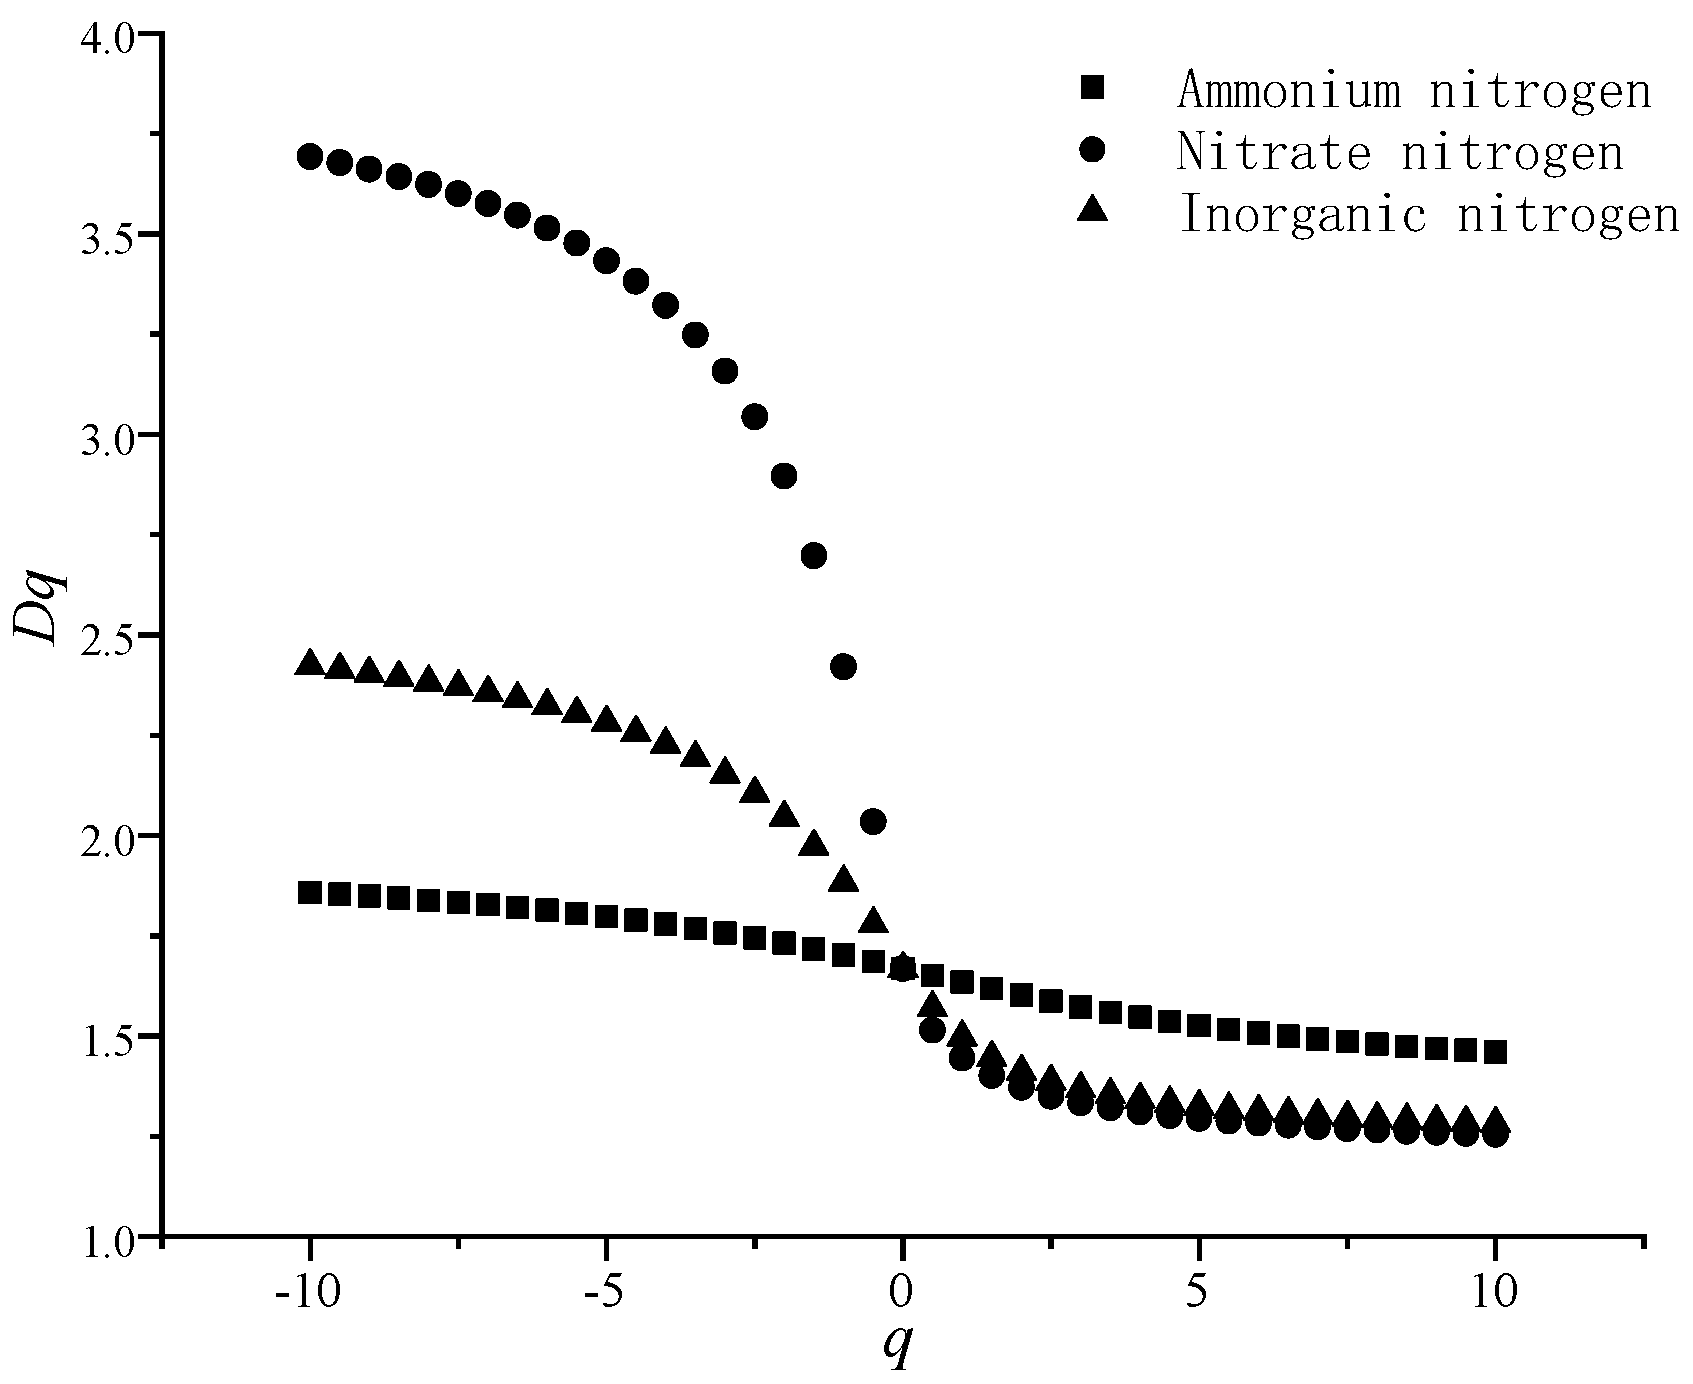
3.3. Multifractal Characteristics of Nitrogen under Drip Fertigation

If the generalized dimension Dq decreases with the increase in q within the range of the statistical distance order q, the research index has obvious multifractal characteristics [23]. Figure 7 shows the variation in the generalized dimensions Dq of the soil nitrogen index with the statistical probability order q of the mass probability, which indicates that the generalized dimension Dq of the ammonium nitrogen, nitrate nitrogen, and inorganic nitrogen in the study area decreased with the increase in q. When q > 0, the decrease in ammonium nitrogen, inorganic nitrogen, and nitrate nitrogen Dq decreased, indicating that the multifractal characteristics of the nitrogen content index in the study area are obvious. Thus, multifractal theory can be used to study its spatial variability.
The coefficient of variation can reflect the overall variation of the data, but there are some limitations to the description of local variability, which can be better reflected by multifractal spectrums. Figure 8 shows the multifractal singular spectrum curves of different forms of nitrogen at different depths. The shape of the multifractal spectrum function with the singular exponent (symmetry, peak, width, etc.) reflects the difference in the spatial distribution variation type of nitrogen indicators. Generally, the shape of the curve is parabolic or hook-shaped the open side downward, and the better the symmetry, the weaker the degree of variation.
Table 3 shows the statistical comparison of multiple fractal parameters of the soil nitrogen distribution. From the perspective of the generalized fractal dimension, the Dq value at q = 0, D0, is called the capacity dimension of the geometric support of the measure. The Dq value at q = 1 is referred to as the information dimension and provides information about the degree of heterogeneity in the distribution of the measure in analogy to the entropy of an open system in thermodynamics. The closer the D1 value to the capacity dimension, the more homogeneous the distribution of the measure [29,30]. According to the data in Table 3, the D0–D1 values of ammonium nitrogen in the 0–50, 0–30, and 40–50 cm soil layers are 0.0340, 0.0336, and 0.0286, respectively, which are significantly lower than nitrate nitrogen and inorganic nitrogen but in the longitudinal direction. The values of D0–D1 at the 0–30 and 0–50 cm soil layers are not much different and are significantly larger than the 40–50 cm soil layer, indicating that ammonium nitrogen is more evenly distributed than nitrate nitrogen in nitrogen form. At the same time, as the depth increases, the degree of variation is significantly reduced. Therefore, the point source drip irrigation model and natural factors have an important influence on the spatial distribution of nitrogen.
The singularity strength α reflects the singularity of each small unit segment during the fractal process. If the quality measure of the research index is evenly distributed throughout the study area, α is a certain value; otherwise, α will have a certain difference. Therefore, the width of the singularity strength Δα = αmax − αmin can quantitatively characterize the irregularity of the spatial distribution of the nitrogen content. The larger the Δα, the more irregular the research data [31], and the corresponding Δf = f (αmin) − f (αmax) is mainly used to characterize the difference between the maximum number of probabilities and the minimum number of probabilities. Δf > 0 indicates that the overall variability of the research index is mainly caused by the smaller value, and the multifractal spectrum curve shows a left hook shape; otherwise, the larger value is the main factor that determines the overall variability.
As seen from Table 3, the Δα value of the ammonium nitrogen in the 0–50 cm profile is 0.5608 and that of 0–30 and 40–50 cm is 0.5741 and 0.5424, respectively, which indicates that the variability of ammonium nitrogen in the entire profile is not appreciably different and tends to be evenly distributed. Because nitrate nitrogen accounts for a large proportion of inorganic nitrogen, the spatial variability characteristics of the 2 are similar, and the spatial heterogeneity of both in the 0–30 cm soil layer is greater than that in the 40–50 cm soil layer. The degree of variation in the entire section (0–50 cm) is larger, with Δα values of 1.0676 and 1.0402, respectively, mainly because the contribution value of the variation degree not only shows a small variation in the content value at a short distance but also has long-range variation from high values at a shallow depth to low values at deep depths when the research scale is increased. According to the magnitude of the Δf value, the contribution of the local high value to the overall variability gradually increases as the depth increases.

4. Conclusions

Through statistical analysis and multifractal theory, the spatial distribution and variability of residual ammonium, nitrate, and inorganic nitrogen in soil under long-term drip fertigation conditions were compared and analyzed, achieving the following conclusions:
Statistical analysis showed that at a large scale, ammonium nitrogen had a low content and was evenly distributed throughout the cross-section. The high nitrate content area was mainly distributed in the 0–30 cm soil layer, which shows high content and strong variability in the surface soil layer. The 0–10 cm soil layer showed the strongest variability, with a CV value of 1.48, and the content and variability gradually decreased with depth. Small-scale studies showed that nitrate nitrogen easily moves with water and is mainly distributed between drip irrigation tubes, and ammonium nitrogen is easily adsorbed by colloidal particles, such that it is evenly distributed between drip irrigation belts.
According to the physical meaning of the multifractal parameters, both the values of D0–D1 and the fractal spectrum width Δα showed that the spatial heterogeneity of the nitrogen content in the 0–30 cm soil layer was greater than that in the 40–50 cm soil layer, and the spatial variability was gradually enhanced with an increase in the research scale. This feature was more obvious in the nitrate nitrogen and inorganic nitrogen content data, indicating that a single research scale is not sufficient for fully characterizing the spatial variability of soil nitrogen. Multifractal analysis has been recognized to provide a more detailed description of the spatial heterogeneity of soil properties.

Author Contributions

Y.B. and W.W. conceived and designed the experiments; Y.B. performed the experiments and analyzed the data; Y.B., W.W., R.L., X.B., Y.C. and L.W. wrote the paper; W.W. and L.H. revised the paper. All authors have read and agreed to the published version of the manuscript.

Funding

This work was funded by the National Key Research and Development Program of China (2021YFD1900702).

Institutional Review Board Statement

Not applicable.

Informed Consent Statement

Not applicable.

Acknowledgments

I also gratefully acknowledge the technical support of the Pang Gezhuang Experimental Station of the National Engineering of Water-saving Irrigation Beijing Engineering Technology Research Center.

Conflicts of Interest

The authors declare no competing interests.

References

  1. Shen, L.F.; Bai, L.Y.; Zeng, X.B.; Wang, Y.Z. Effects of Fertilization on NO3--N Accumulation in Greenhouse Soils. J. Agro-Environ. Sci. 2012, 7, 1350–1356. [Google Scholar]
  2. Wang, H.; Xiang, Y.; Zhang, F.; Tang, Z.; Guo, J.; Zhang, X.; Hou, X.; Wang, H.; Cheng, M.; Li, Z. Responses of yield, quality and water-nitrogen use efficiency of greenhouse sweet pepper to different drip fertigation regimes in Northwest China. Agric. Water Manag. 2022, 260, 107279. [Google Scholar] [CrossRef]
  3. Hu, J.; Gettel, G.; Fan, Z.; Lv, H.; Zhao, Y.; Yu, Y.; Wang, J.; Butterbach-Bahl, K.; Li, G.; Lin, S. Drip fertigation promotes water and nitrogen use efficiency and yield stability through improved root growth for tomatoes in plastic greenhouse production. Agric. Ecosyst. Environ. 2021, 313, 107379. [Google Scholar] [CrossRef]
  4. Guo, S.R.; Sun, S.; Li, J. General situations, charactics and trends of protected horticulture in foreigns. J. Nanjing Agric. Univ. 2012, 5, 43–52. [Google Scholar]
  5. Liao, R.K.; Yu, H.L.; Yang, P.L. Multifractal analysis of soil particle size distribution to evaluate the effects of gypsum on the quality of sodic soils. Eur. J. Soil Sci. 2021, 72, 1726–1741. [Google Scholar] [CrossRef]
  6. Contreras, J.I.; Baezar, R.; Alonso, F.; Cánovas, G.; Gavilán, P.; Lozano, D. Effect of Distribution Uniformity and Fertigation Volume on the Bio-Productivity of the Greenhouse Zucchini Crop. Water 2020, 12, 2183. [Google Scholar] [CrossRef]
  7. Wang, Y.; Dannenmann, M.; Lin, S.; Lv, H.; Li, G.; Lian, X.; Wang, Z.; Wang, J.; Butterbach-Bahl, K. Improving soil respiration while maintaining soil C stocks in sunken plastic greenhouse vegetable production systems-Advantages of straw application and drip fertigation. Agric. Ecosyst. Environ. 2021, 316, 107464. [Google Scholar] [CrossRef]
  8. Lv, H.F.; Lin, S.; Wang, Y.F.; Lian, X.; Zhao, Y.; Li, Y.; Du, J.; Wang, Z.; Wang, J.; Butterbach-Bahl, K. Drip fertigation significantly reduces nitrogen leaching in solar greenhouse vegetable production system. Environ. Pollut. 2019, 245, 694–701. [Google Scholar] [CrossRef]
  9. Cai, Y.H.; Yao, C.P.; Wu, P.T.; Zhang, L.; Zhu, D.; Chen, J.; Du, Y. Effectiveness of a subsurface irrigation system with ceramic emitters under low-pressure conditions. Agric. Water Manag. 2021, 243, 106390. [Google Scholar] [CrossRef]
  10. Hou, X.H.; Zhu, Y.H.; Li, F.Y.; Xia, Z.Y.; Meng, X.G.; Jia, H.K. Effects of irrigation methods on soil available nu-trient state and its spatial heterogeneity in jujube root zone. China Rural Water Hydropower 2018, 11, 125–135. [Google Scholar]
  11. Chen, W.L.; Ran, S.H.; Liu, T.T. Distribution characteristics of soil salinity in cotton fields under different irrigation methods-taking the manas river midstream irrigation district as an example. J. Irrig. Drain. 2018, 37, 33–37. [Google Scholar]
  12. Ma, C.X.; Ding, J.L.; Yang, A.X.; Wang, L.; Niu, Z.Y. Spatial heterogeneity analysis of main parameters of soil sali-nization in Oasis region. J. Arid. Land Resour. Environ. 2015, 29, 144–149. [Google Scholar]
  13. Gouri, S.B.; Pravat, K.S.; Rabindranath, C. Assessment of spatial variability of soil properties using geostatistical approach of lateritic soil (West Bengal, India). Ann. Agrar. Sci. 2018, 16, 436–443. [Google Scholar]
  14. Liu, J.L.; Liu, L.; Ma, X.Y.; Fu, Q.; Wang, H.J.; Zhang, Z.H.; Zhang, L.L.; Yu, P. Spatial variability of soil salinity in different soil layers with different scales. J. Basic Sci. Eng. 2018, 26, 305–311. [Google Scholar]
  15. Liao, R.K.; Zhang, S.R.; Zhang, X.; Wang, M.; Wu, H.; Zhangzhong, L. Development of smart irrigation systems based on real-time soil moisture data in a greenhouse: Proof of concept. Agric. Water Manag. 2021, 245, 106632. [Google Scholar] [CrossRef]
  16. Guan, X.Y.; Yang, P.L.; Lv, Y. Spatial variability analysis of farmland soil properties based on multifractal theory. J. Sci. Eng. 2001, 19, 712–720. [Google Scholar]
  17. Liu, J.L.; Ma, X.Y.; Zhang, Z.H. Multifractal study on spatial variability of soil water and salt and its scale effect. Trans. CSAE 2010, 26, 81–86. [Google Scholar]
  18. Guan, X.Y.; Wang, S.L.; Lv, Y.; Fu, X.J. Multifractal analysis of spatial variability of soil water and salt and its scale effect. J. Hydraul. Eng. 2013, 44, 8–14. [Google Scholar]
  19. Wang, J.M.; Zhang, J.R.; Yu, F. Characterizing the spatial variability of soil particle size distribution in an under-ground coal mining area: An approach combining multi-fractal theory and geostatistics. Catena 2019, 176, 94–103. [Google Scholar] [CrossRef]
  20. Guan, X.Y.; Yang, P.L.; Li, L.; Tan, Y.N. Multifractal characteristics of soil pore distribution after long-term recycled water irrigation. J. Drain. Irrig. Mach. Eng. 2018, 36, 1163–1167. [Google Scholar]
  21. Yao, R.J.; Yang, J.S.; Liu, G.M.; Zou, P. Spatial variability of soil salinity in characteristic field of the Yellow River delta. Trans. Chin. Soc. Agric. Eng. 2006, 22, 61–66. [Google Scholar]
  22. Caniego, F.; Espejo, R.; Martin, M.A.M.; José, F. Multifractal scaling of soil spatial variability. Ecol. Model. 2005, 182, 291–303. [Google Scholar] [CrossRef]
  23. Eghball, B.; Schepers, J.S.; Negahban, M.; Schlemmer, M.R. Spatial and temporal variability of soil nitrate and corn yield: Multifractal analysis. Agron. J. 2003, 95, 339–346. [Google Scholar] [CrossRef]
  24. Zeleke, T.B.; Si, B. Characterizing scale-dependent spatial relationships between soil properties using multifractal techniques. Geoderma 2006, 134, 440–452. [Google Scholar] [CrossRef]
  25. Li, J.S.; Yang, F.Y.; Li, Y.F. Water and nitrogen distribution under subsurface drip fertigation as affected by lay-ered-textura1 soils. Trans. Chin. Soc. Agric. Eng. 2009, 25, 25–30. [Google Scholar]
  26. Cote, C.M.; Bristow, K.L.; Charlesworth, P.B.; Cook, F.J.; Thorburn, P.J. Analysis of soil wetting and solute transport in subsurface trickle irrigation. Irrig. Sci. 2003, 22, 143–156. [Google Scholar] [CrossRef]
  27. Huang, Y.H.; Wang, K.; Yang, J.H. Distribution of soil water and available nitrogen in purple soil under drip fertilization. J. Soil Water Conserv. 2014, 28, 87–95. [Google Scholar]
  28. Zhang, W.; Lv, Y.J.; Tang, X.Y. Study on water movement and output dynamics of colloidal particles in purple soil slope farmland. J. Irrig. Drain. 2018, 37, 58–63. [Google Scholar]
  29. Biswas, A.; Cresswell, H.P.; Chau, H.W.; Rossel, R.A.V.; Si, B.C. Separating scale-specific soil spatial variability: A comparison of multi-resolution analysis and empirical mode decomposition. Geoderma 2013, 209–210, 57–64. [Google Scholar] [CrossRef]
  30. Zeleke, T.B.; Si, B.C. Scaling properties of topographic indices and crop yield: Multifractal and joint multifractal approaches. Agron. J. 2004, 96, 1082–1090. [Google Scholar] [CrossRef]
  31. Kravchenko, A.N.; Bullock, D.G.; Boast, C.W. Joint Multifractal Analysis of Crop Yield and Terrain Slope. Agron. J. 2000, 92, 1279–1290. [Google Scholar] [CrossRef] [Green Version]
Figure 1. Layout of the study area.
Water 14 01337 g001
Figure 2. Description of the sampling positions.
Water 14 01337 g002
Figure 3. Spatial distribution characteristics of nitrate nitrogen. The bar scale on the right of the figure is the concentration index, and its unit is mg/kg.
Water 14 01337 g003
Figure 4. Distribution of nitrate nitrogen in the vertical section between two drip tapes (ad). Note: Points (0,0) and (90,0) are the positions of the drip irrigation belt, and the selection of the 4 sections is random. The bar scale on the right of the figure is the concentration index, and its unit is mg/kg.
Water 14 01337 g004
Figure 5. Spatial distribution characteristics of ammonium nitrogen. The bar scale on the right of the figure is the concentration index, and its unit is mg/kg.
Water 14 01337 g005
Figure 6. Distribution of ammonium nitrogen in the vertical section between two drip tapes (ad). Note: Points (0,0) and (90,0) are the positions of the drip irrigation belt, and the selection of the 4 sections is random. The bar scale on the right of the figure is the concentration index, and its unit is mg/kg.
Water 14 01337 g006
Figure 7. Generalized multifractal dimension of the nitrogen content with the statistical distance curve.
Water 14 01337 g007
Figure 8. Multifractal spectrum curve of the soil nitrogen content (a) ammonium nitrogen, (b) nitrate nitrogen and (c) inorganic nitrogen.
Water 14 01337 g008
Table 1. Basic physical properties of the experimental soils.
Depth (cm)Particle Size Fraction (%)Soil Bulk Density (g/cm3)pH
SandSiltClay
0–2028.7565.006.251.428.38
20–4024.0061.5014.501.468.58
40–605.7576.5017.751.628.72
Table 2. Statistical feature values of the nitrogen content under long-term drip fertigation.
Depth/(cm)Mean/(mg/kg)SDMax/(mg/kg)Min/(mg/kg)CV
0–1026.2038.71171.135.181.48
10–2012.5010.9866.964.840.88
NO3–N20–307.293.7123.454.730.43
30–407.774.9630.014.730.64
40–507.056.0645.004.750.85
0–103.591.537.531.480.43
10–203.571.938.791.120.54
NH4–N20–303.321.598.501.220.48
30–402.621.115.731.280.42
40–502.891.397.891.130.48
Table 3. Multifractal parameters of the soil nitrogen content.
Nitrogen Index.DepthD0–D1αmin(q)f(αmin)αmax(q)f(αmax)Δα(q)Δf(α)
Ammonium Nitrogen0–50 cm0.03401.38410.70231.95210.91500.5680−0.2127
0–30 cm0.03361.25000.63951.82410.68630.5741−0.0468
40–50 cm0.02861.07510.23311.61750.71690.5424−0.4838
Nitrate
Nitrogen
0–50 cm0.17311.98181.37680.91420.22761.0676−1.1492
0–30 cm0.17351.89931.10600.84120.22760.8784−0.8784
40–50 cm0.04881.50011.22020.83360.03370.6665−1.1865
Inorganic Nitrogen0–50 cm0.16151.96151.35420.92130.22481.0402−1.1294
0–30 cm0.16271.87391.08830.84650.22481.0274−0.8635
40–50 cm0.04331.48781.20140.84500.03580.6428−1.1656
Publisher’s Note: MDPI stays neutral with regard to jurisdictional claims in published maps and institutional affiliations.

