Article

Ranking Three Water Sensitive Urban Design (WSUD) Practices Based on Hydraulic and Water Quality Treatment Performance: Implications for Effective Stormwater Treatment Design

1
College of Chemistry and Environmental Engineering, Shenzhen University, Shenzhen 518060, China
2
Faculty of Engineering, Queensland University of Technology (QUT), P.O. Box 2434, Brisbane, QLD 4001, Australia
*
Author to whom correspondence should be addressed.
Water 2022, 14(8), 1296; https://doi.org/10.3390/w14081296
Submission received: 24 February 2022 / Revised: 13 April 2022 / Accepted: 14 April 2022 / Published: 15 April 2022

Abstract

:
Bioretention basins, constructed wetlands and roadside swales are among the most common Water-Sensitive Urban Design (WSUD) or stormwater quality treatment systems. Although these systems can reduce stormwater quantity and improve quality, their hydraulic and water quality treatment performances are different. The aim of this study was to investigate the hydraulic and water quality performance of a bioretention basin, a constructed wetland and a roadside swale by analyzing monitored water quantity and quality data from a range of rainfall events using a ranking approach. The study outcomes showed that a bioretention basin performed better in relation to peak flow and runoff volume reduction while the constructed wetland tended to produce better outflow water quality. The roadside swale had a relatively lower capacity for treating stormwater. These results suggest that a bioretention basin could be the preferred option when the primary requirement is water quantity improvement. However, if water quality improvement is the primary consideration, a constructed wetland could be more efficient. Additionally, when designing a treatment train, it appears to be preferable to place a bioretention basin prior to a constructed wetland. Further, a swale appears to be more appropriate for use as a pretreatment device. The research study outcomes will contribute to effective stormwater treatment design.

1. Introduction

Urbanisation results in an increase in impervious surfaces and the occurrence of diverse anthropogenic activities common to such areas [1,2,3]. These lead to increased stormwater runoff volume, peak flow and flow velocities and the introduction of a range of physical, chemical and biological pollutants, resulting in the degradation of stormwater quality and increased pollutant loads to receiving water bodies [4,5,6,7,8,9,10]. Water-Sensitive Urban Design (WSUD) measures are commonly implemented to mitigate quantity and quality impacts in relation to stormwater runoff from urban areas [11,12,13]. WSUDs primarily use vegetation and retention/detention systems placed close to stormwater source areas to reduce peak flow and runoff volume and to remove pollutants [14,15,16].
Bioretention basins, constructed wetlands and swales are among the most common WSUD measures used worldwide [16,17,18,19,20]. Bioretention basins operate by passing stormwater runoff through prescribed filter media with planted vegetation [18,21]. Therefore, bioretention basins treat stormwater by both, vegetation and filter media. Stormwater runoff reaching a bioretention basin will infiltrate and percolate through the filter media, while excessive flow can bypass the system. Generally, the stormwater runoff does not have high velocity when flowing through a bioretention basin due to the design features. Constructed wetlands are artificial, shallow and extensively vegetated water bodies. They aim to remove pollutants including dissolved pollutants from stormwater runoff, enhance landscape amenity as well as ensure stormwater reuse as a supplementary benefit [22,23]. Commonly, a constructed wetland contains an inlet zone, a macrophyte zone and a bypass channel. Roadside swales are vegetated strips with a shallow channel and commonly located along a road. Roadside swales disconnect impervious surfaces from downstream waterways and are generally designed with side slopes. Roadside swales can reduce flow velocities and remove large particles from stormwater runoff [24,25].
Although all three treatment measures are capable of mitigating stormwater quantity impacts, such as runoff peak and volume, and improving quality, their hydraulic and water quality performances can be different due to the involvement of different mechanisms and the influence exerted by rainfall–runoff characteristics [26,27]. For example, the treatment efficiency of a bioretention basin is significantly influenced by the antecedent dry period [26], while rainfall depth is the primary influential factor in the case of constructed wetlands [27]. Additionally, the placements of WSUDs are generally different. For instance, swales are commonly placed along roadsides, while bioretention basins and constructed wetlands require relatively lager land extents. In this regard, selecting appropriate WSUDs for a given urban area to ensure effective stormwater treatment is a challenging task. Furthermore, since each WSUD has varied performance characteristics in relation to the treatment of stormwater, a treatment train is commonly adopted to increase stormwater treatment efficiency. A treatment train refers to a combination of WSUD measures in series for effective flow volume reduction and pollutant removal [28].
For treatment system design, it is essential to define the pollutant loads and/or concentrations to be reduced prior to stormwater entering receiving waters in order to achieve specific water quality objectives [29,30]. In this context, in-depth knowledge of the treatment efficiency of commonly used WSUDs is essential for appropriate system selection and their placement in order to guide the treatment strategy.
Accordingly, the aim of this study was to investigate the hydraulic and water quality performance of a bioretention basin, a constructed wetland and a roadside swale by analyzing monitored water quantity and quality data for a range of rainfall events. The scientific question addressed is: What is the ranking of these systems in relation to their hydraulic and water quality treatment efficiency? The research outcomes will contribute to effective stormwater treatment design.

2. Materials and Methods
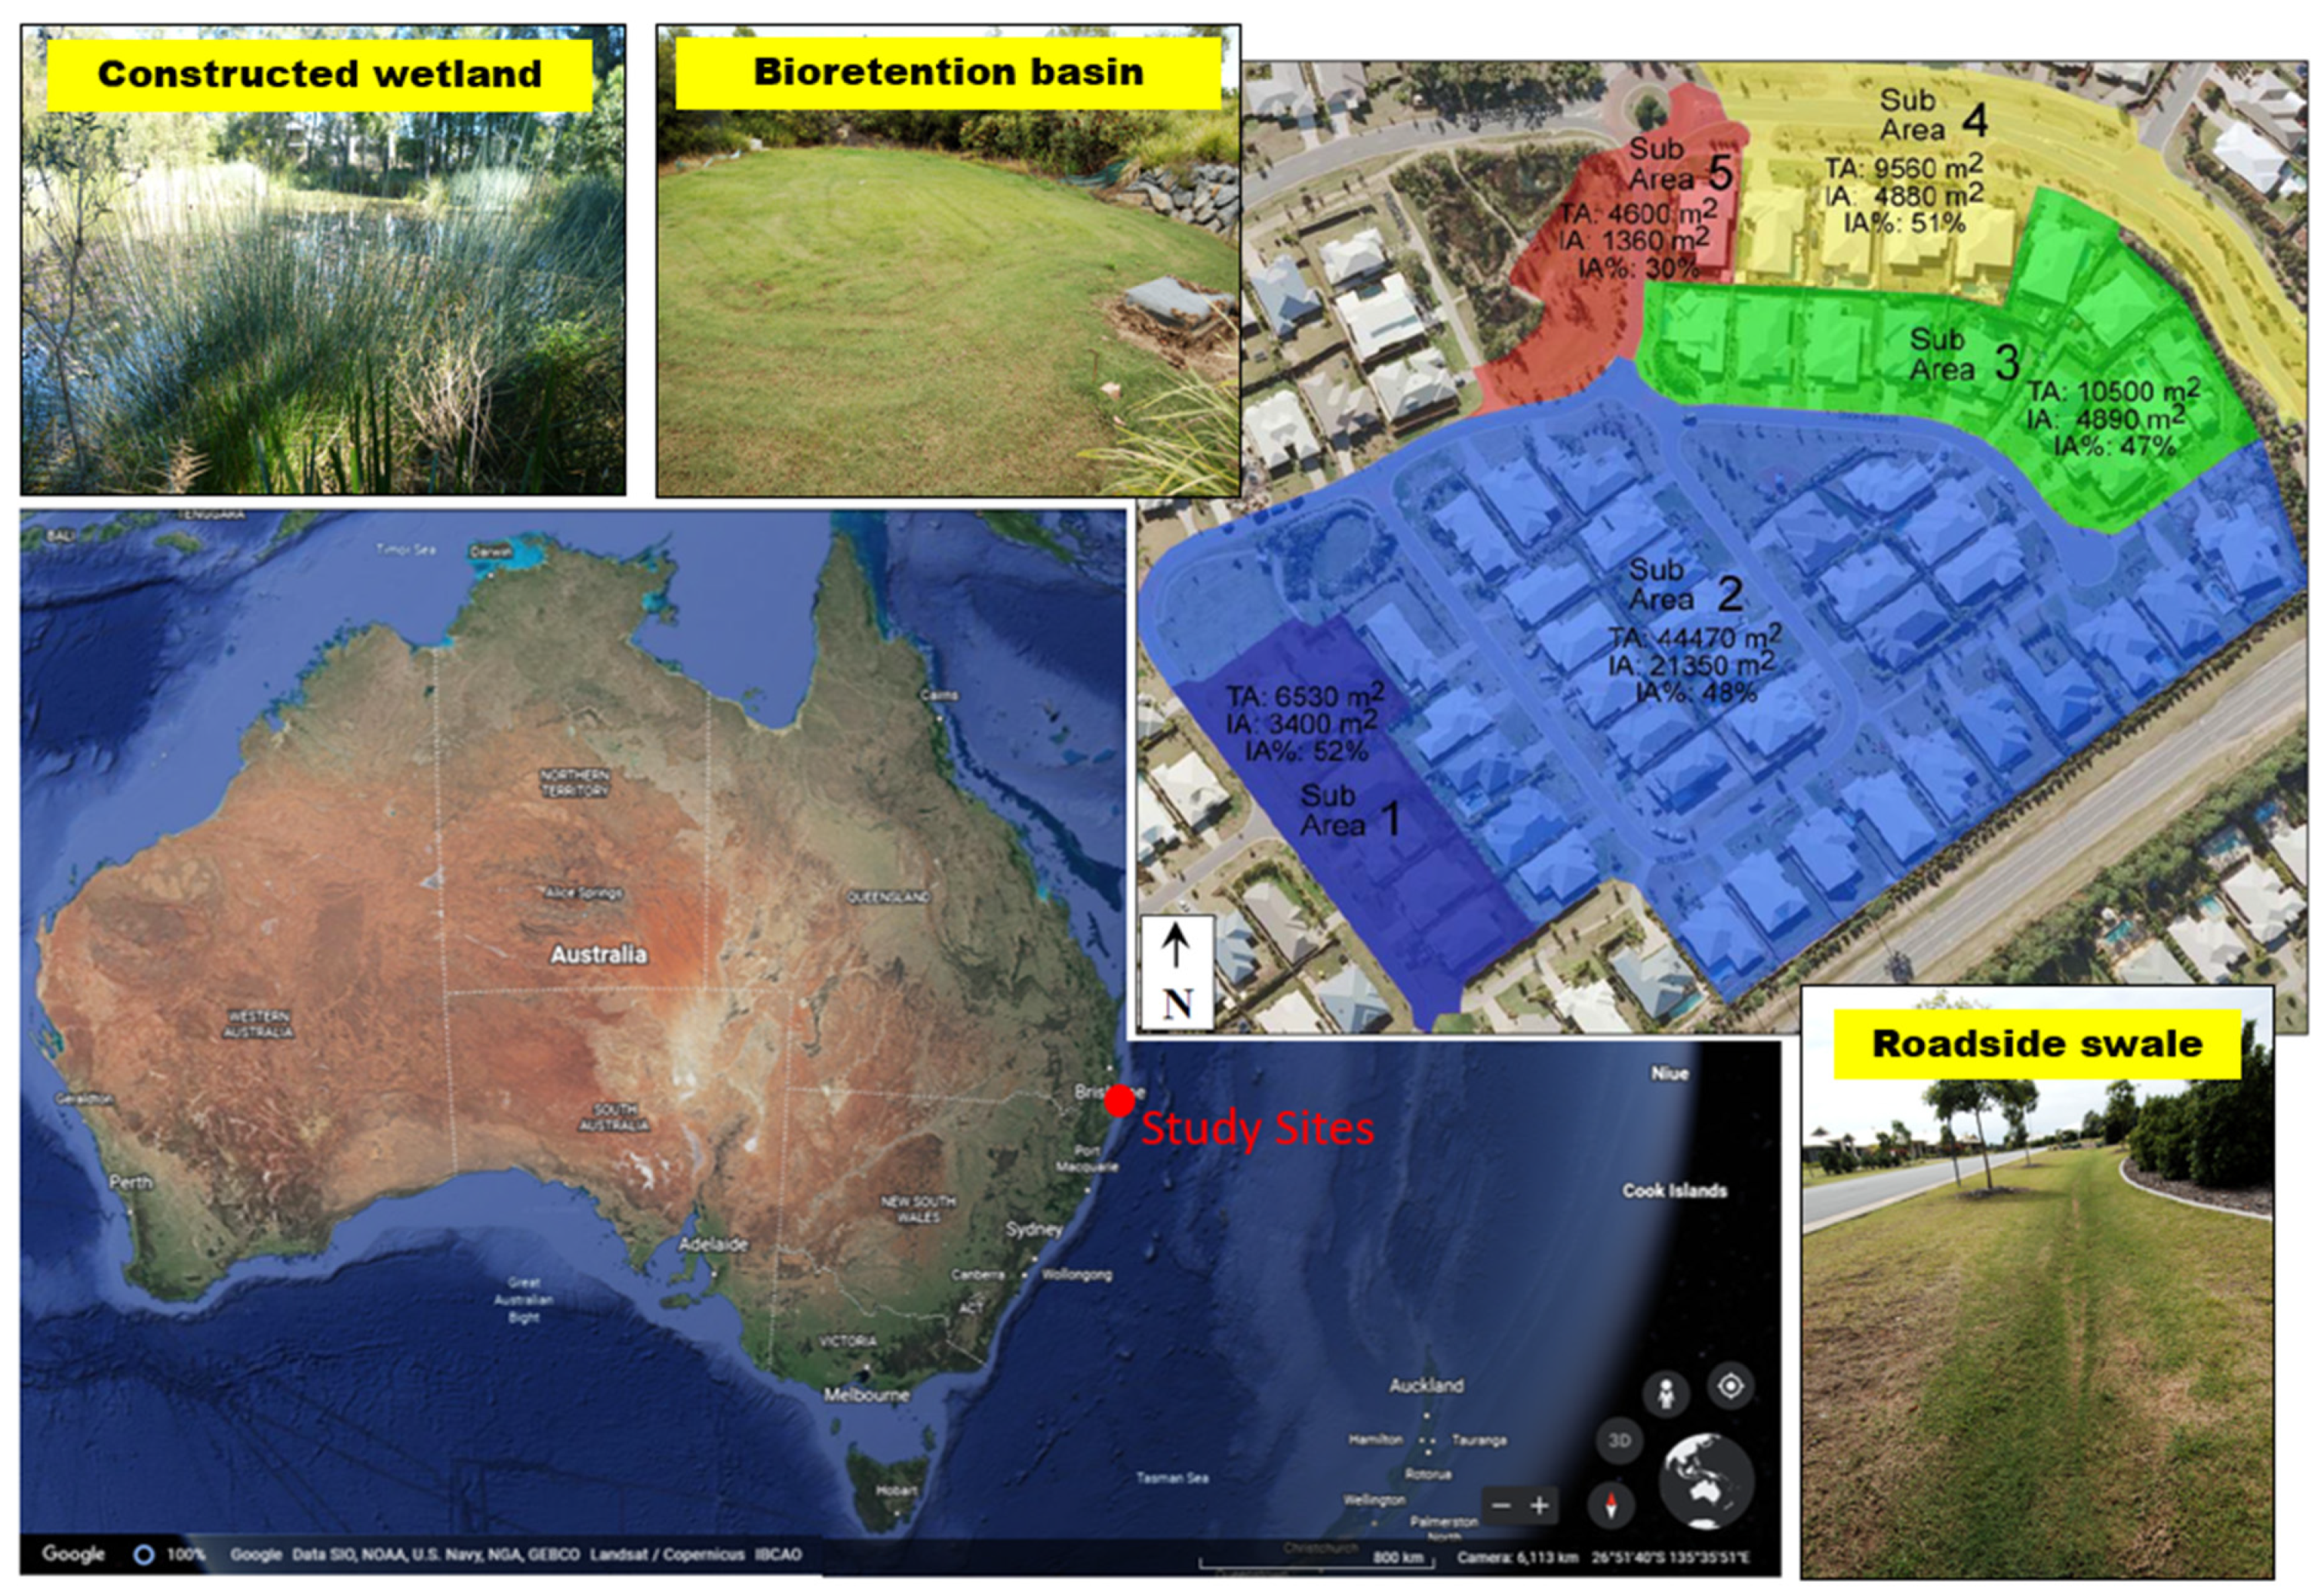
2.1. Study Sites

Coomera Waters was selected as the study site. This is a newly developed residential estate in Gold Coast City, Australia. The residential area includes a bioretention basin (B), a constructed wetland (W) and roadside swales (S). The study site location and the three stormwater treatment systems in the field are shown in Figure 1. Detailed information about the three WSUD systems, including engineered characteristics, is provided in the Supplementary Materials.

2.2. Data Collection

2.2.1. Monitoring Program

The inlets and outlets of the three systems (B, W and S) were monitored using automatic monitoring stations. These monitoring stations recorded rainfall–runoff data and captured time-based stormwater runoff samples for water quality parameter testing. Flow measurements were conducted using calibrated V-notch weirs, while stormwater samples were collected using stage triggered, peristaltic pumping. Accordingly, flow measurements from 22 events for B, 17 events for W and 13 events for S were collected, while the corresponding values for water quality data were 12 events for B, 7 events for W and 7 events for S. The primary reason for the inconsistency in rainfall event numbers was due to equipment malfunction. The characteristics of the rainfall events monitored were, 1.0–93.6 mm depth, which are within the 1-year ARI (Average Recurrence Interval) range. The 1-year ARI is the rainfall range on which most WSUD system designs are based [31]. For each event, 10–24 samples were collected using an automatic sampler, according to the rainfall characteristics. The characteristics of the rainfall events monitored, including sampling dates, are provided in Table S1 in the Supplementary Materials.

2.2.2. Parameter Selection and Laboratory Testing

The peak flow and runoff volume at inlets and outlets were recorded as the primary hydraulic characteristics [21,32]. Based on this, the peak and volume reduction percentages were determined and considered as important parameters representing the quantity mitigation performance of the WSUDs. In terms of water quality, the samples collected were tested for total suspended solids (TSS), total phosphorus (TP) and total nitrogen (TN). The testing methods used were according to the Standard Methods for the Examination of Water and Wastewater [33]. The detailed information about TSS, TN and TP testing is provided in the Supplementary Materials. TN, TP and TSS were selected due to the fact that they are among the primary stormwater pollutants [6,34]. Additionally, total pollutant loads as well as event mean concentrations (EMCs) were determined for each selected rainfall event.

2.2.3. An Assumption Made When Using Outflow Water Quality

In terms of S, the inflowing stormwater flows along both sides of the road (see Figure 1). This resulted in difficulty in collecting inflow stormwater samples from S. Due to this limitation, it was not possible to compare water quality between the inlet and outlet of S. Therefore, a water quality analysis was undertaken by comparing outflow pollutant EMCs and loads from the three WSUDs. EMC data and loads in relation to the three WSUDs are provided in Table S2 in the Supplementary Materials. The analysis was based on the premise that the inflow stormwater quality into B and W is similar to the inflow stormwater quality into S. This was considered reasonable since these three systems are located close to each other and all receive stormwater from the Coomera Waters catchment with similar land use characteristics (see Figure 1).

2.3. Data Analyses

The study approach included two primary steps. Step 1 was to initially compare the hydraulic and water quality treatment performances of the three systems (B, W and S). This was conducted using boxplots. Step 2 was to rank the three WSUDs. The rankings were initially undertaken for hydraulic performance, pollutant EMCs and pollutant loads, separately. Thus, it was possible to gain an individual comparison of the different treatment systems. For example, only hydraulic performance needs to be understood if a WSUD is only designed for quantity mitigation. However, if a WSUD is also expected to undertake quantity and quality mitigation, knowledge of hydraulic and water quality treatment performance is required. Secondly, comprehensive ranking was conducted by taking into account both, water quantity and quality treatment performance.
The PROMETHEE method was used for the data analysis because of its capability to rank objects with a range of variables [35]. In PROMETHEE, a ranking order is developed according to the net ranking flow, the Φ values, for a number of objects (the WSUDs) on the basis of a range of variables (hydraulic and water quality performance). The Φ values are calculated for each object based on the partial ranking outflow indices, + Φ and – Φ. The objects are rank-ordered from the most preferred (the most positive (+) Φ value) to the one with the lowest performance (the most negative (–) Φ value). A large difference between two net ranking outflow values, Φ values, indicates that the two objects are dissimilar. Detailed information regarding the PROMETHEE method is provided in the Supplementary Materials. It can also be found in Keller et al. [36] and Khalil et al. [37].

3. Results and Discussions

3.1. Analysis of Hydraulic and Water Quality Treatment Performance

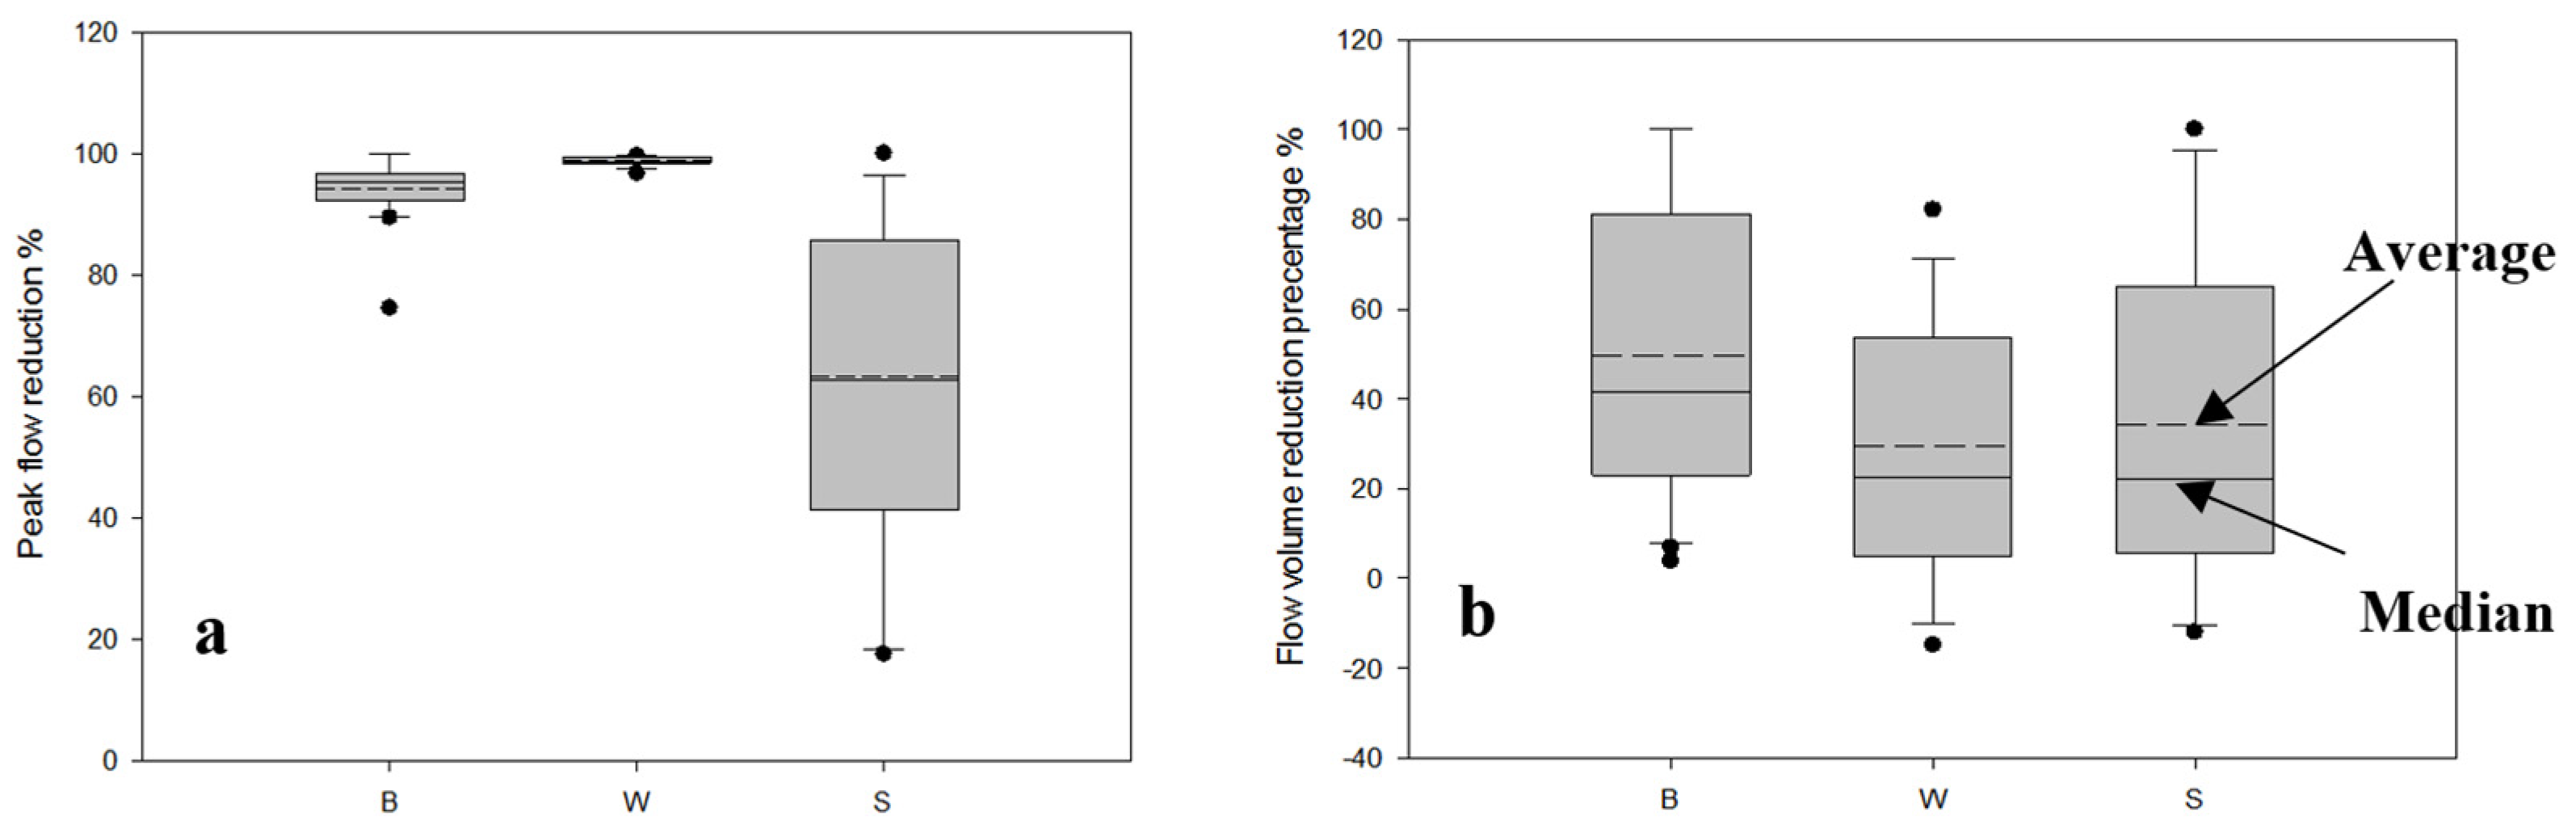
3.1.1. Hydraulic Performance

Figure 2 compares the peak flow and runoff volume reduction percentages of B, W and S. It was noted that B and W showed higher peak flow reduction percentages than S. The average peak flow reduction percentages were 94.2% and 98.7% for B and W, respectively, while the corresponding value was 63.2% for S. Additionally, B and W indicated more consistent peak flow reduction performance than S since the data ranges of B and W are much narrower than for S (see Figure 2a). In terms of runoff volume reduction percentage (see Figure 2b), B shows a slightly higher value than the other two systems, since the average runoff volume reduction percentages were 49.5%, 29.6% and 34.1% for B, W and S, respectively. However, all three systems have wide ranges of runoff volume reduction percentages. This means that the volume reduction efficiency of the three systems varies highly with rainfall characteristics as the data were collected for a range of rainfall events.

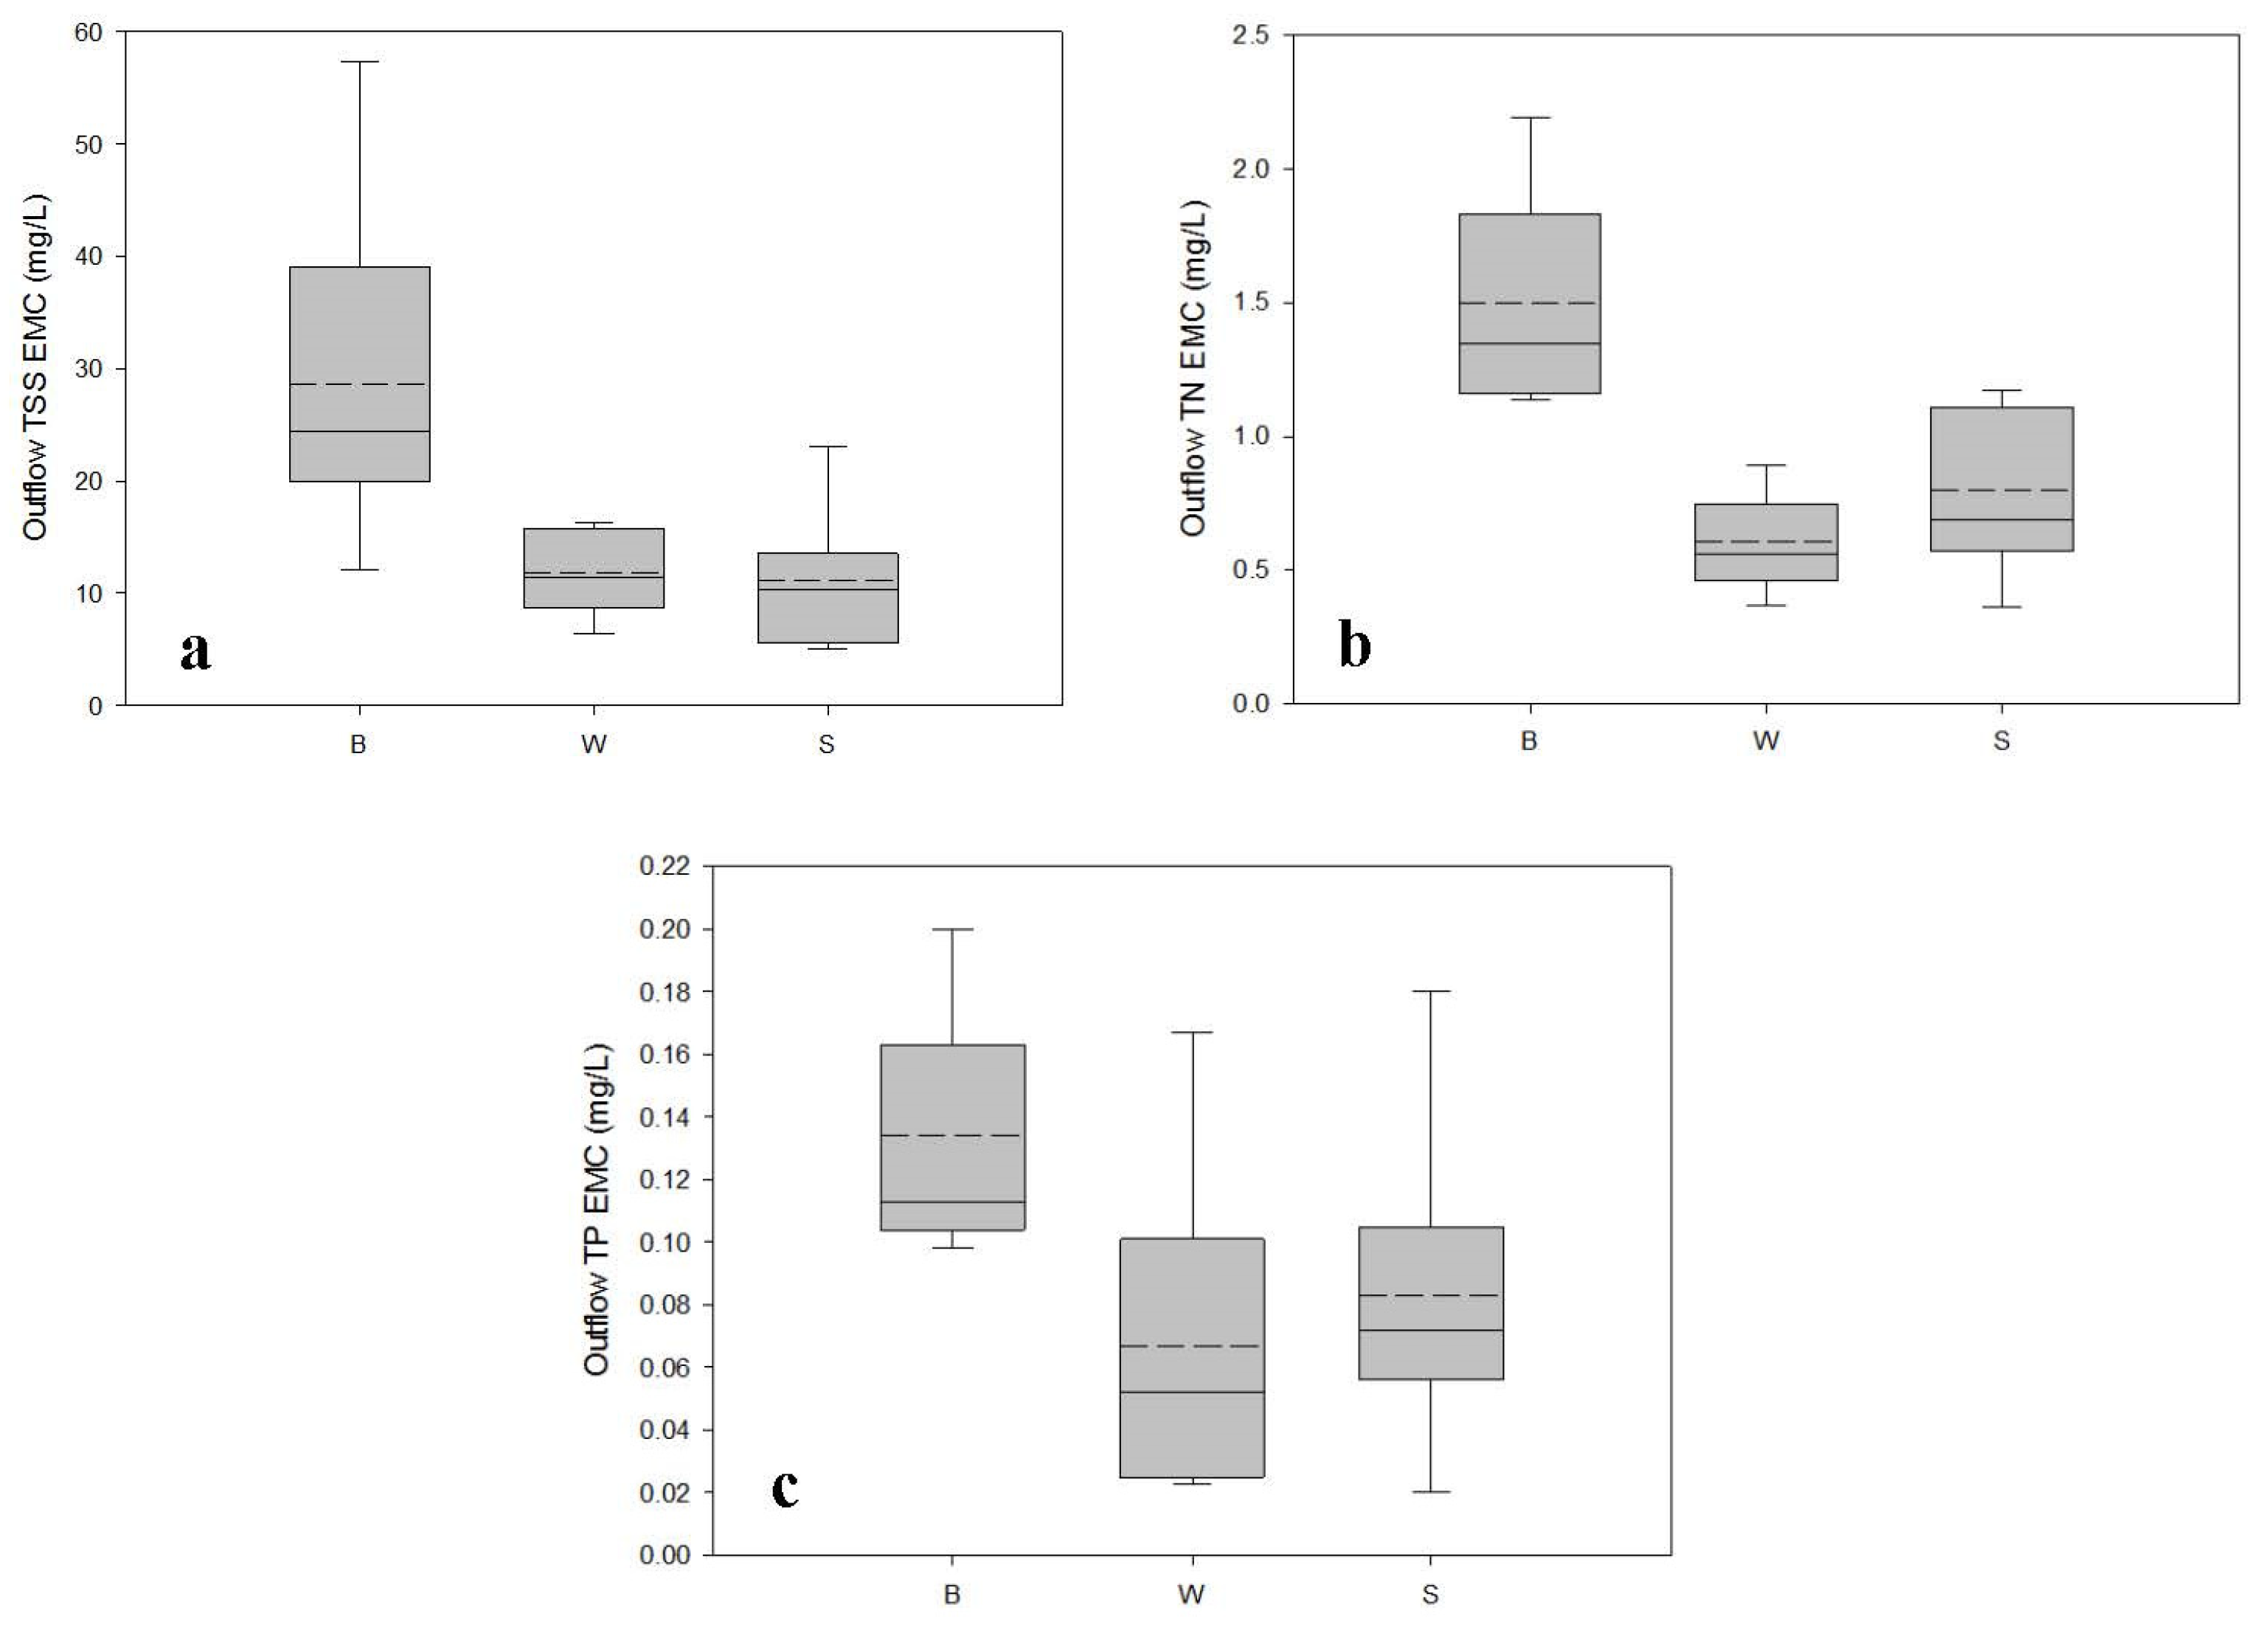
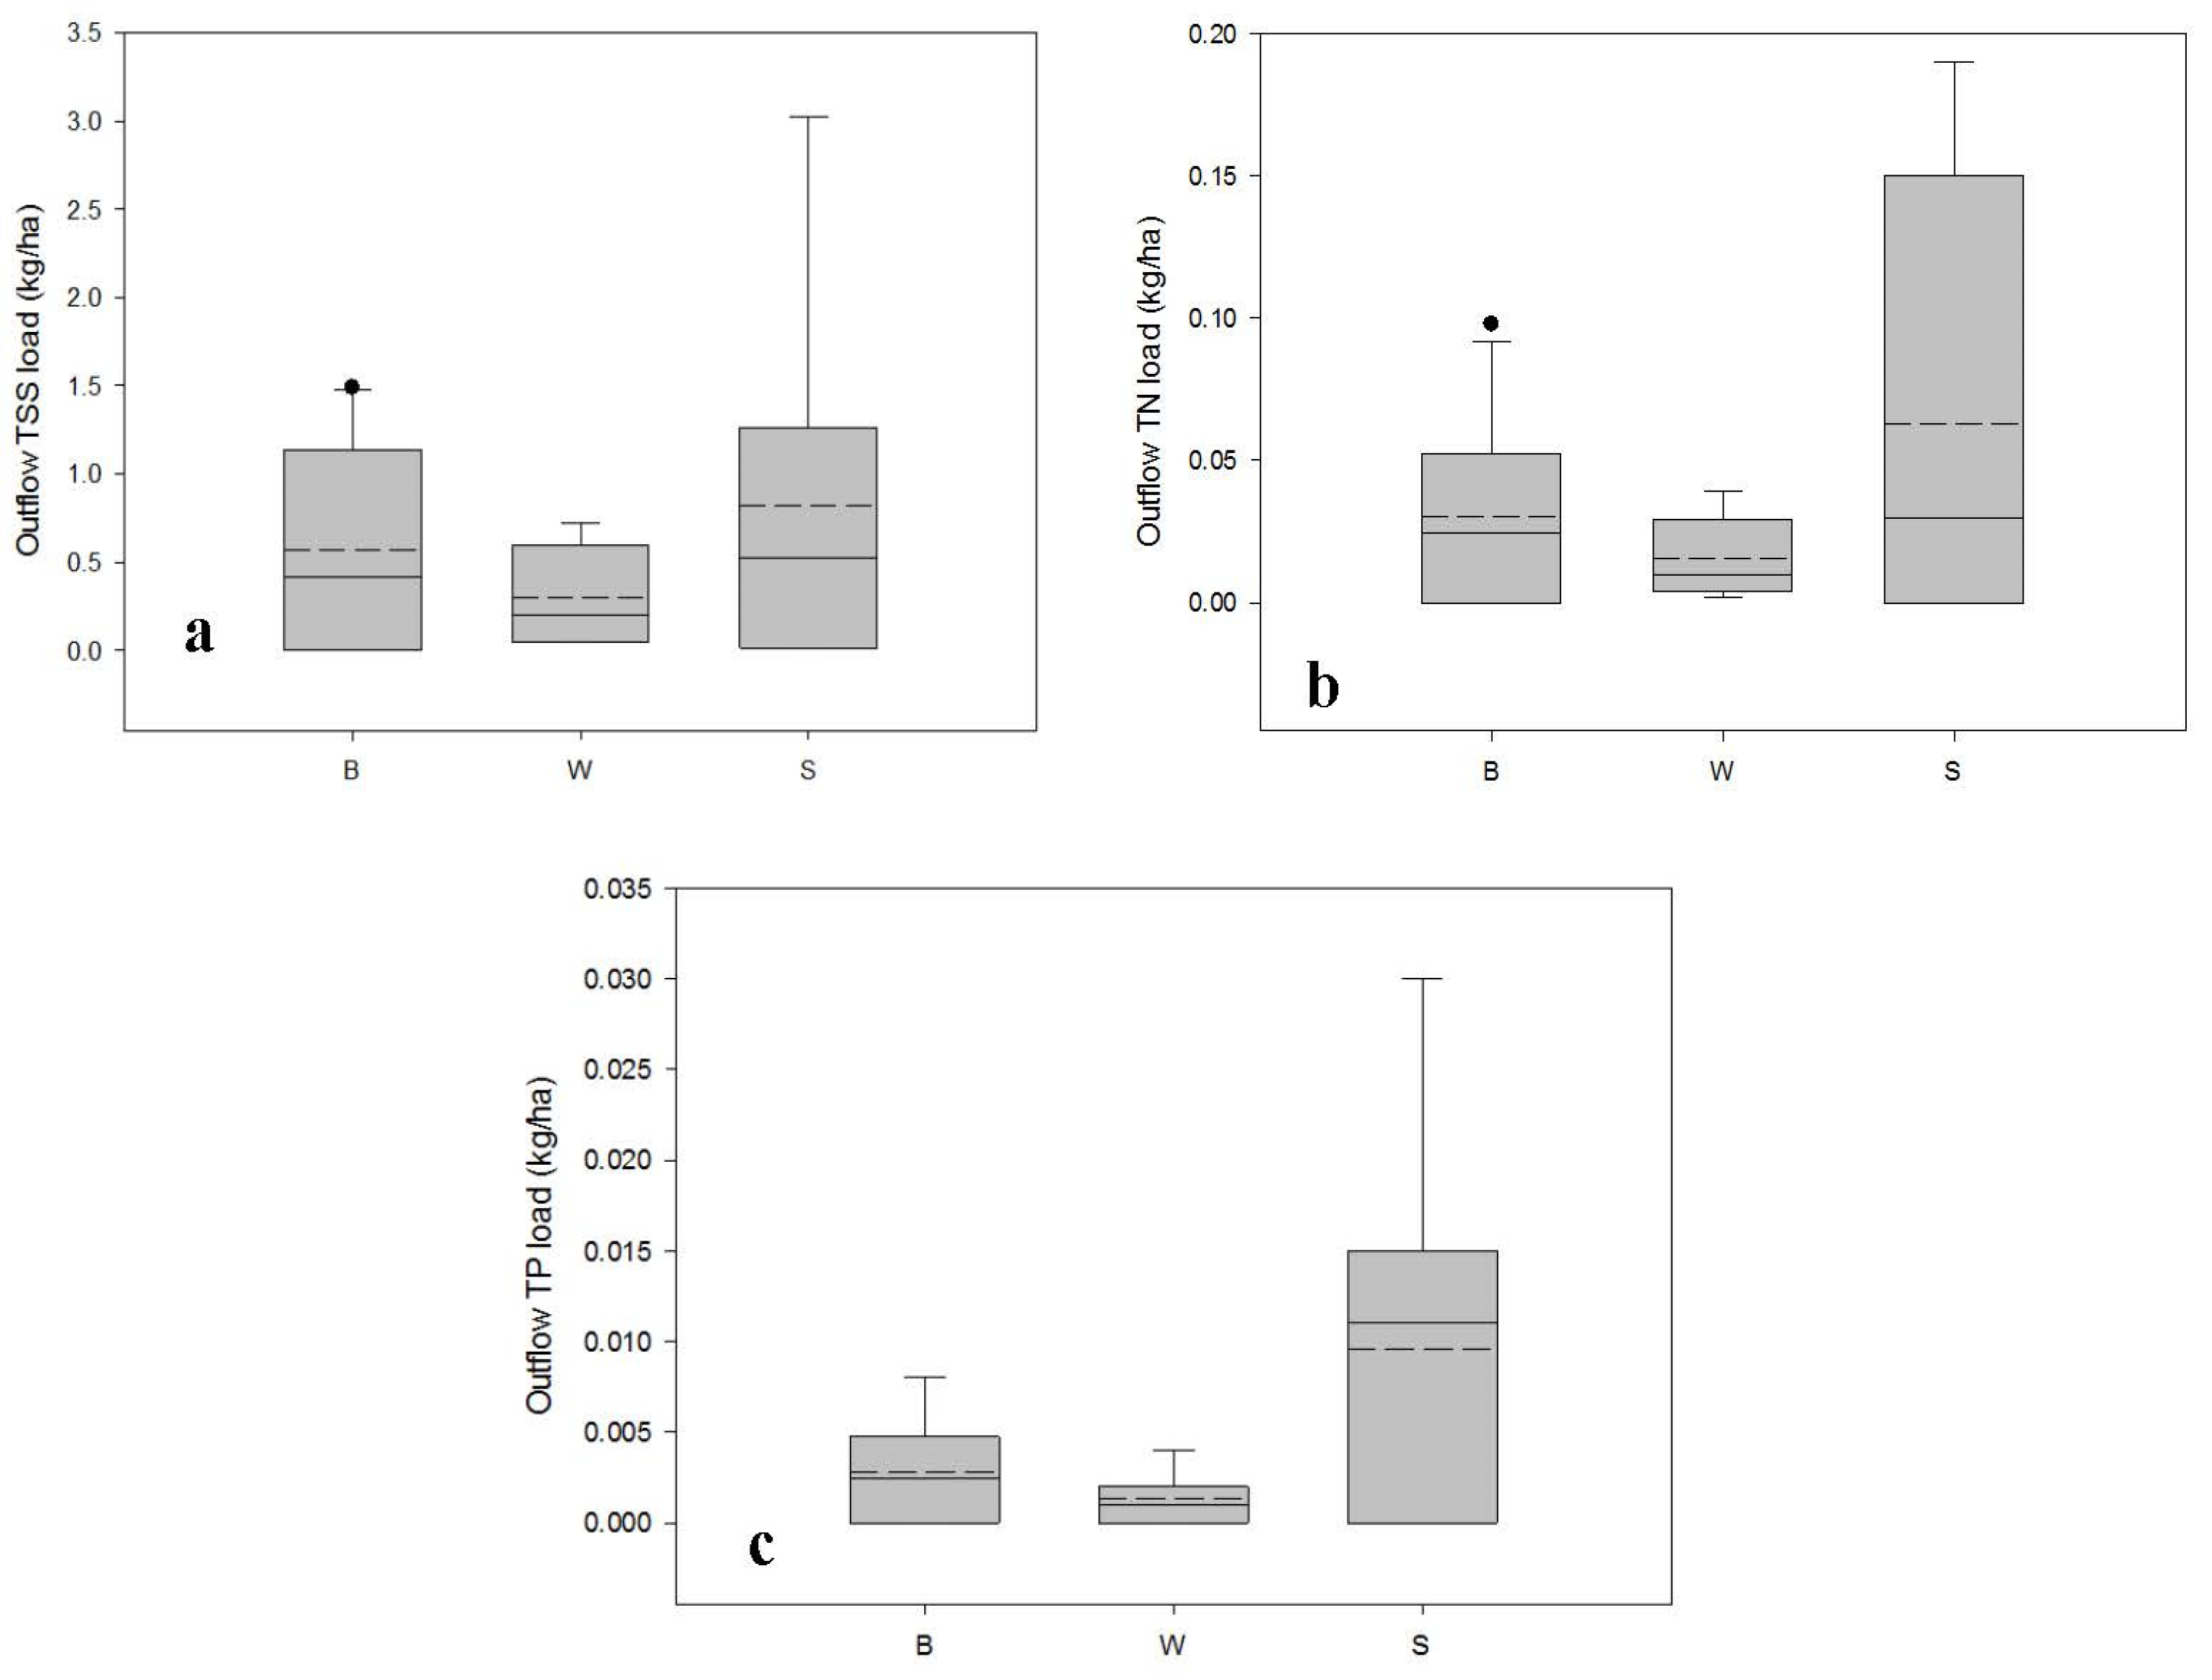
3.1.2. Water Quality Performance

Figure 3 shows the outflow pollutant EMCs of B, W and S (Figure 3a for TSS, Figure 3b for TN and Figure 3c for TP). It is evident that B has the highest outflow of pollutant EMCs (the average values were 28.4 mg/L for TSS, 1.49 mg/L for TN and 0.14 mg/L for TP) regardless of the pollutant species, while W has the lowest outflow EMC values for TN and TP. W and S have a relatively similar outflow of TSS EMCs. These results imply that the bioretention basin is relatively less effective in terms of pollutant EMC reduction than the wetland and swale, since the bioretention basin produced the highest pollutant EMCs in the outflow of. It is also noteworthy that the outflow pollutant EMCs for B have a wider data range than for the other two systems. This indicates the high variability of outflow water quality from the bioretention basin compared to the constructed wetland and roadside swale.
In the case of outflow pollutant loads (see Figure 4), S shows the highest average values for TSS (0.57 kg/ha), TN (0.03 kg/ha) and TP (0.003 kg/ha) among the three WSUD systems, while W is the lowest for all three pollutants. Additionally, the data range of S is the widest, followed by B, while W has the narrowest data range. This means that the outflow pollutant loads from the constructed wetland are relatively consistent, having lower variability, compared to the other two systems. These observations imply that the constructed wetland performs better in terms of removing pollutant loads since it has the lowest and the most consistent outflow pollutant loads, while the roadside swale is the least effective among the three WSUDs as it has higher outflow pollutant loads as well as the highest variation.

3.2. Ranking of WSUD Systems

As discussed above, the three WSUD systems showed significant differences in treatment performance in terms of water quantity and quality. For example, the bioretention basin exhibited good hydraulic performance while the constructed wetland demonstrated relatively better water quality treatment performance. These differences in performance among the WSUDs make it difficult to directly compare their overall stormwater treatment capabilities, particularly when considering both quantity and quality mitigation. This results in the inability to provide technically robust guidance in relation to the selection of appropriate WSUDs and their arrangement in a treatment train. In this context, a comprehensive approach to ranking these systems based on their hydraulic and water quality treatment efficiencies needs to be employed.
The parameters used for ranking were average values and coefficient of variation (CV) values for peak flow reduction, runoff volume reduction, TSS, TN and TP outflow EMCs and loads for rainfall events monitored for each WSUD. For example, there were 22 rainfall events monitored for peak flow reduction in the bioretention basin (see Section 2.2.). Therefore, parameters used for ranking were the average and CV values of peak flow reduction percentages for the 22 rainfall events. The same method was applied for the other WSUDs to assess their hydraulic and water quality treatment performance. The CV represents the variability in data and was obtained from the ratio of the standard deviation and the average values. The reason for considering both average and CV values was because not only treatment efficiency but also stability in treatment performance (representing the variability in treatment performance for different rainfall events) plays an important role in representing a WSUD’s performance. Accordingly, three matrices were generated, including 3 × 4 (hydraulic performance: average peak flow reduction, average runoff volume reduction, peak flow reduction CV value and runoff volume reduction CV value for the three WSUDs), 3 × 6 (outflow pollutant EMCs: average TSS, TN and TP outflow EMCs and their CV values for the three WSUDs) and 3 × 6 (outflow pollutant loads: average TSS, TN and TP outflow loads and their CV values for the three WSUDs).
For PROMETHEE ranking, three matrices were separately developed, while comprehensive ranking was undertaken using data from all three matrices together. The PROMETHEE analysis requires: (i) an assignment of the ranking sense (maximise or minimise); (ii) the selection of a preference function from Linear, V-shape and Usual functions; and (iii) the weighting of each variable based on importance. In this case, average peak flow reduction and runoff volume reduction were maximised, while all CV values and outflow pollutant EMCs and loads were minimised. This was to top-rank the WSUD system with high peak and volume reductions, low outflow pollutant amounts and low outflow quantity and quality variability. The V-shape preference function was chosen because it is commonly applied in stormwater quality research [38,39]. Furthermore, each variable was equally weighted since they were considered to be equally important. Accordingly, the resulting ranking is given in Table 1.
As shown in Table 1, the three WSUDs have different rankings based on hydraulic and water quality treatment performance. For hydraulic performance, the ranking was B > W > S, which indicates that the bioretention basin performed best in terms of peak and volume reduction. For outflow EMCs, the ranking was W > S ≈ B (S and B have similar Φ values), while it was W > B > S for outflow pollutant loads. This means that the constructed wetland shows the best pollutant treatment efficiency compared to the bioretention basin and roadside swale. Considering both hydraulic and water quality treatment performance, the ranking was W > B > S. This implies that the constructed wetland has the best treatment performance in relation to both water quantity and quality. These results suggest that the bioretention basin should be the preferred option when the primary design focus is water quantity. However, if the focus is water quality improvement, the constructed wetland would be more efficient. Furthermore, in the case of a treatment train, a bioretention basin should be placed prior to a constructed wetland. This is because the bioretention basin would initially reduce the runoff volume as it has better hydraulic performance, resulting in reduced inflow into the constructed wetland. This is also supported by the fact that a smaller runoff volume can generally enhance treatment performances in a constructed wetland [31]. In the case of the roadside swale, due to the relatively lower capacity for treating stormwater, it can be used as a pretreatment system prior to the stormwater flow into other WSUD devices, such as a bioretention basin and/or a constructed wetland.

4. Conclusions

This research study investigated three typical WSUDs, namely, a bioretention basin, a constructed wetland and a roadside swale. Both, water quantity and quality treatment capacities were compared using a ranking analysis. The ranking took into consideration treatment efficiency and treatment stability (representing the variability in treatment performance with different rainfall events). The three WSUDs exhibited different characteristics in the mitigation of water quantity and quality. The bioretention basin showed better performance in relation to peak flow and runoff volume reduction, while the constructed wetland tended to produce better outflow water quality. These results may imply that, when designing a treatment train, it is important to place a bioretention basin prior to a constructed wetland. This is due to the better hydraulic performance of a bioretention basin which could initially reduce runoff volume, resulting in smaller inflow into the constructed wetland. The stormwater treatment performance of the roadside swale was comparatively low. Hence, it might be more appropriate for use as a pretreatment device. These research outcomes can provide important guidance for stormwater treatment strategy design and are expected to contribute to effective stormwater management. However, it should be noted that additional investigations are needed to further confirm these results by monitoring more rainfall events with complete hydraulic and water quality data. Additionally, it is also recommended for future research that more WSUD systems should be investigated in order to achieve a more in-depth understanding of their water quantity and quality treatment performance. These additional studies will provide robust guidance to system designers for the selection of appropriate treatment systems and their placement for effective performance.

Supplementary Materials

The following supporting information can be downloaded at www.mdpi.com/article/10.3390/w14081296/s1, Table S1: Characteristics of rainfall events selected and hydraulic performance of the bioretention basin, constructed wetland and roadside swale; Table S2: Water quality performance of the bioretention basin, constructed wetland and roadside swale; Pollutant testing methods; PROMETHEE method; Information about the three WSUD systems. References [40,41] are cited in the supplementary materials.

Author Contributions

Methodology, P.E. and A.L.; formal analysis, A.L.; investigation, A.L.; writing—original draft preparation, A.L.; writing—review and editing, A.G. and P.E.; All authors have read and agreed to the published version of the manuscript.

Funding

This research was funded by the National Natural Science Foundation of China, grant numbers 52170100 and U21A2036, the Guangdong Basic and Applied Basic Research Foundation, grant number 2019A1515010843 and the Shenzhen Science and Innovation Commission, grant numbers 20200813094050001 and JCYJ20200109113006046.

Conflicts of Interest

The authors declare no conflict of interest.

References

  1. Franczyk, J.; Chang, H. The effects of climate change and urbanisation on the runoff of the Rock Creek basin in the Portland metropolitan, Oregon, USA. Hydrol. Process. 2009, 23, 805–815. [Google Scholar] [CrossRef]
  2. Barron, O.V.; Pollock, D.; Dawes, W. Evaluation of catchment contributing areas and storm runoff in flat terrain subject to urbanisation. Hydrol. Earth Syst. Sci. 2011, 15, 547–559. [Google Scholar] [CrossRef] [Green Version]
  3. Perera, T.; McGree, J.; Egodawatta, P.; Jinadasa, K.B.S.N.; Goonetilleke, A. A Bayesian approach to model the trends and variability in urban stormwater quality associated with catchment and hydrologic parameters. Water Res. 2021, 197, 117076. [Google Scholar] [CrossRef] [PubMed]
  4. Liu, A.; Egodawatta, P.; Guan, Y.T.; Goonetilleke, A. Influence of rainfall and catchment characteristics on urban stormwater quality. Sci. Total Environ. 2013, 444, 255–262. [Google Scholar] [CrossRef] [Green Version]
  5. Zhang, X.Y.; Chen, L.; Liu, G.W.C.; Yu, Y.; Ma, Y.K.; Shen, Z.Y. Unexpected river water quality deterioration due to stormwater management in an urbanizing watershed. Water Resour. Res. 2021, 57, e2021WR030181. [Google Scholar] [CrossRef]
  6. Liu, A.; Li, D.Z.; Liu, L.; Guan, Y.T. Understanding the role of urban road surface characteristics in influencing stormwater quality. Water Resour. Manag. 2014, 28, 5217–5229. [Google Scholar] [CrossRef]
  7. Pappas, E.A.; Smith, D.R.; Huang, C.; Shuster, W.D.; Bonta, J.V. Impervious surface impacts to runoff and sediment discharge under laboratory rainfall simulation. Catena 2008, 72, 146–152. [Google Scholar] [CrossRef]
  8. Brabec, E.A. Imperviousness and land use policy: Toward an effective approach to watershed planning. J. Hydrol. Eng. 2009, 14, 425–433. [Google Scholar] [CrossRef]
  9. Jacobson, C.R. Identification and quantification of the hydrological impacts of imperviousness in urban catchments: A review. J. Environ. Manag. 2011, 92, 1438–1448. [Google Scholar] [CrossRef]
  10. Miller, J.D.; Kim, H.; Kjeldsen, T.R.; Packman, J.; Grebby, S.; Dearden, R. Assessing the impact of urbanization on storm runoff in a peri-urban catchment using historical change in impervious cover. J. Hydrol. 2014, 515, 59–70. [Google Scholar] [CrossRef] [Green Version]
  11. Walaszek, M.; Bois, P.; Laurent, J.; Lenormand, E.; Wanko, A. Micropollutants removal and storage efficiencies in urban stormwater constructed wetland. Sci. Total Environ. 2018, 645, 854–864. [Google Scholar] [CrossRef] [PubMed]
  12. Yang, Y.; Chui, T.F.M. Optimizing surface and contributing areas of bioretention cells for stormwater runoff quality and quantity management. J. Environ. Manag. 2018, 206, 1090–1103. [Google Scholar] [CrossRef] [PubMed]
  13. Yuan, D.H.; An, Y.C.; Wang, J.Z.; Chu, S.X.; Lim, B.S.; Chen, B.; Xiong, Y.; Kou, Y.Y.; Li, J.Q. Dissolved organic matter characteristics of urban stormwater runoff from different functional regions during grassy swale treatment. Ecol. Indic. 2019, 107, 105667. [Google Scholar] [CrossRef]
  14. Baek, S.S.; Choi, D.H.; Jung, J.W.; Lee, H.J.; Lee, H.; Yooh, K.S.; Cho, K.H. Optimizing low impact development (LID) for stormwater runoff treatment in urban area, Korea: Experimental and modeling approach. Water Res. 2015, 86, 122–131. [Google Scholar] [CrossRef] [PubMed]
  15. Chen, S.S.; Tsang, D.C.W.; He, M.J.; Sun, Y.Q.; Lau, L.S.Y.; Leung, R.W.M.; Lau, E.S.C.; Hou, D.Y.; Liu, A.; Mohanty, S. Designing sustainable drainage systems in subtropical cities: Challenges and opportunities. J. Clean. Prod. 2021, 280, 124418. [Google Scholar] [CrossRef]
  16. Piacentini, S.M.; Rossetto, R. Attitude and actual behaviour towards water-related green infrastructures and sustainable drainage systems in four North-Western Mediterranean regions of Italy and France. Water 2020, 12, 1474. [Google Scholar] [CrossRef]
  17. Bledsoe, R.B.; Bean, E.Z.; Austin, S.S.; Peralta, A.L. A microbial perspective on balancing trade-offs in ecosystem functions in a constructed stormwater wetland. Ecol. Eng. 2020, 158, 106000. [Google Scholar] [CrossRef]
  18. Hong, N.; Cheng, Q.; Wijesiri, B.; Bandala, E.R.; Goonetilleke, A.; Liu, A. Integrating Tank Model and adsorption/desorption characteristics of filter media to simulate outflow water quantity and quality of a bioretention basin: A case study of biochar-based bioretention basin. J. Environ. Manag. 2022, 304, 114282. [Google Scholar] [CrossRef]
  19. Neo, T.H.; Xu, D.; Fowdar, H.; McCarthy, D.; Chen, E.Y.; Lee, T.M.; Ong, G.S.; Lim, F.Y.; Ong, S.L.; Hu, J.Y. Evaluation of active, beautiful, clean waters design features in tropical urban cities: A case study in Singapore. Water 2022, 14, 468. [Google Scholar] [CrossRef]
  20. Meng, X.L.; Li, X.; Nghiem, L.D.; Ruiz, E.; Johir, M.A.; Gao, L.; Wang, Q.L. Improved stormwater management through the combination of the conventional water sensitive urban design and stormwater pipeline network. Process Saf. Environ. Prot. 2022, 159, 1164–1173. [Google Scholar] [CrossRef]
  21. de Macedo, M.B.; do Lago, C.A.F.; Mendiondo, E.M. Stormwater volume reduction and water quality improvement by bioretention: Potentials and challenges for water security in a subtropical catchment. Sci. Total Environ. 2019, 647, 923–931. [Google Scholar] [CrossRef] [PubMed]
  22. Sacco, A.; Cirelli, G.L.; Ventura, D.; Barbagallo, S.; Licciardello, F. Hydraulic performance of horizontal constructed wetlands for stormwater treatment: A pilot-scale study in the Mediterranean. Ecol. Eng. 2021, 169, 106290. [Google Scholar] [CrossRef]
  23. Ventura, D.; Ferrante, M.; Copat, C.; Grasso, A.; Milani, M.; Sacco, A.; Licciardello, F.; Girelli, G.L. Metal removal processes in a pilot hybrid constructed wetland for the treatment of semi-synthetic stormwater. Sci. Total Environ. 2021, 754, 142221. [Google Scholar] [CrossRef] [PubMed]
  24. Garcia-Serrana, M.; Gulliver, J.S.; Nieber, J.L. Non-uniform overland flow-infiltration model for roadside swales. J. Hydrol. 2017, 552, 586–599. [Google Scholar] [CrossRef]
  25. Gavric, S.; Leonhardt, G.; Marsalek, J.; Viklander, M. Processes improving urban stormwater quality in grass swales and filter strips: A review of research findings. Sci. Total Environ. 2019, 669, 431–447. [Google Scholar] [CrossRef]
  26. Mangangka, I.R.; Liu, A.; Egodawatta, P.; Goonetilleke, A. Performance characterisation of a stormwater treatment bioretention basin. J. Environ. Manag. 2015, 150, 173–178. [Google Scholar] [CrossRef] [Green Version]
  27. Mangangka, I.R.; Liu, A.; Egodawatta, P.; Goonetilleke, A. Sectional analysis of stormwater treatment performance of a constructed wetland. Ecol. Eng. 2015, 77, 172–179. [Google Scholar] [CrossRef] [Green Version]
  28. Drapper, D.; Hornbuckle, A. Field evaluation of a stormwater treatment train with pit baskets and filter media cartridges in Southeast Queensland. Water 2015, 7, 4496–4510. [Google Scholar] [CrossRef] [Green Version]
  29. Ekka, S.A.; Rujner, H.; Leonhardt, G.; Blecken, G.T.; Viklander, M.; Hunt, W.F. Next generation swale design for stormwater runoff treatment: A comprehensive approach. J. Environ. Manag. 2021, 279, 111756. [Google Scholar] [CrossRef]
  30. Glaister, B.J.; Fletcher, T.D.; Cook, P.L.M.; Hatt, B.E. Interactions between design, plant growth and the treatment performance of stormwater biofilters. Ecol. Eng. 2017, 105, 21–31. [Google Scholar] [CrossRef]
  31. Liu, A.; Goonetilleke, A.; Egodawatta, P. Taxonomy for rainfall events based on pollutant wash-off potential in urban areas. Ecol. Eng. 2012, 47, 110–114. [Google Scholar] [CrossRef] [Green Version]
  32. Jenkins, G.A.; Greenway, M.; Polson, C. The impact of water reuse on the hydrology and ecology of a constructed stormwater wetland and its catchment. Ecol. Eng. 2012, 47, 308–315. [Google Scholar] [CrossRef]
  33. APHA. Standard Methods for the Examination of Water and Wastewater; American Public Health Association: Washington, DC, USA, 2017. [Google Scholar]
  34. Liu, A.; Egodawatta, P.; Goonetilleke, A. Role of Rainfall and Catchment Characteristics on Urban Stormwater Quality; Springer: Berlin/Heidelberg, Germany, 2015. [Google Scholar]
  35. Boujelben, M.A. A unicriterion analysis based on the PROMETHEE principles for multicriteria ordered clustering. Omega 2017, 69, 126–140. [Google Scholar] [CrossRef]
  36. Keller, H.R.; Massart, D.L.; Brans, J.P. Multicriteria decision making: A case study. Chemom. Intell. Labortory Syst. 1991, 11, 175–189. [Google Scholar] [CrossRef]
  37. Khalil, W.A.; Goonetilleke, A.; Kokot, S.; Carroll, J. Use of chemometrics methods and multicriteria decision-making for site selection for sustainable on-site sewage effluent disposal. Anal. Chim. Acta 2004, 506, 41–56. [Google Scholar] [CrossRef] [Green Version]
  38. Hong, N.; Guan, Y.J.; Yang, B.; Zhong, J.; Zhu, P.F.; Ok, Y.S.; Hou, D.Y.; Tsang, D.C.W.; Guan, Y.T.; Liu, A. Quantitative source tracking of heavy metals contained in urban road deposited sediments. J. Hazard. Mater. 2020, 393, 122362. [Google Scholar] [CrossRef]
  39. Zhan, Y.T.; Hong, N.; Yang, B.; Du, Y.; Wu, Q.Y.; Liu, A. Toxicity variability of urban road stormwater during storage processes in Shenzhen, China: Identification of primary toxicity contributors and implications for reuse safety. Sci. Total Environ. 2020, 745, 140964. [Google Scholar] [CrossRef]
  40. Mangangka, I.R. Role of Hydraulic Factors in Constrcuted Wetland and Bioretention Basin Treatment Performance. Ph.D. Thesis, Queensland University of Technology, Brisbane, Australia, 2013. [Google Scholar]
  41. Parker, N. Assessing the Effectiveness of Water Sensitive Urban Desgin in Southeast Queensland. Master’s Thesis, Queensland University of Technology, Brisbane, Australia, 2009. [Google Scholar]
Figure 1. Study site. TA: total area; IA: impervious surface area; IA%: impervious surface percentage. Stormwater runoff from sub-area 1 primarily contributes to B. After passing through B, the stormwater enters the constructed wetland. Stormwater runoff from sub-area 2 and sub-area 3 directly flows to W. Sub-area 4 distributes flow to roadside swales, while sub-area 5 is the bypass of W, which does not receive treatment from any of the WSUDs.
Water 14 01296 g001
Figure 2. Hydraulic performance of WSUDs, (a) peak flow reduction; (b) flow volume reduction. B = bioretention basin; W = constructed wetland; S = roadside swale.
Water 14 01296 g002
Figure 3. Outflow pollutant EMCs of WSUDs, (a) TSS; (b) TN; (c) TP. B = bioretention basin; W = constructed wetland; S = roadside swale.
Water 14 01296 g003
Figure 4. Outflow pollutant loads of WSUDs, (a) TSS; (b) TN; (c) TP. B = bioretention basin; W = constructed wetland; S = roadside swale.
Water 14 01296 g004
Table 1. Ranking results. B = bioretention basin; W = constructed wetland; S = roadside swale.
Treatment PerformanceWSUD SystemΦ ValueRanking
Hydraulic performanceB0.25001
W0.12502
S−0.37503
Outflow pollutant EMCsW0.16671
S−0.08332
B−0.08343
Outflow pollutant loadsW0.41671
B0.08332
S−0.50003
Hydraulics and water quality combinedW0.21881
B0.09382
S−0.31253
Publisher’s Note: MDPI stays neutral with regard to jurisdictional claims in published maps and institutional affiliations.

