
Integrating Ecosystem Services into Risk Assessments for Drinking Water Protection

 ,
,  , , , and
Abstract
:1. Introduction
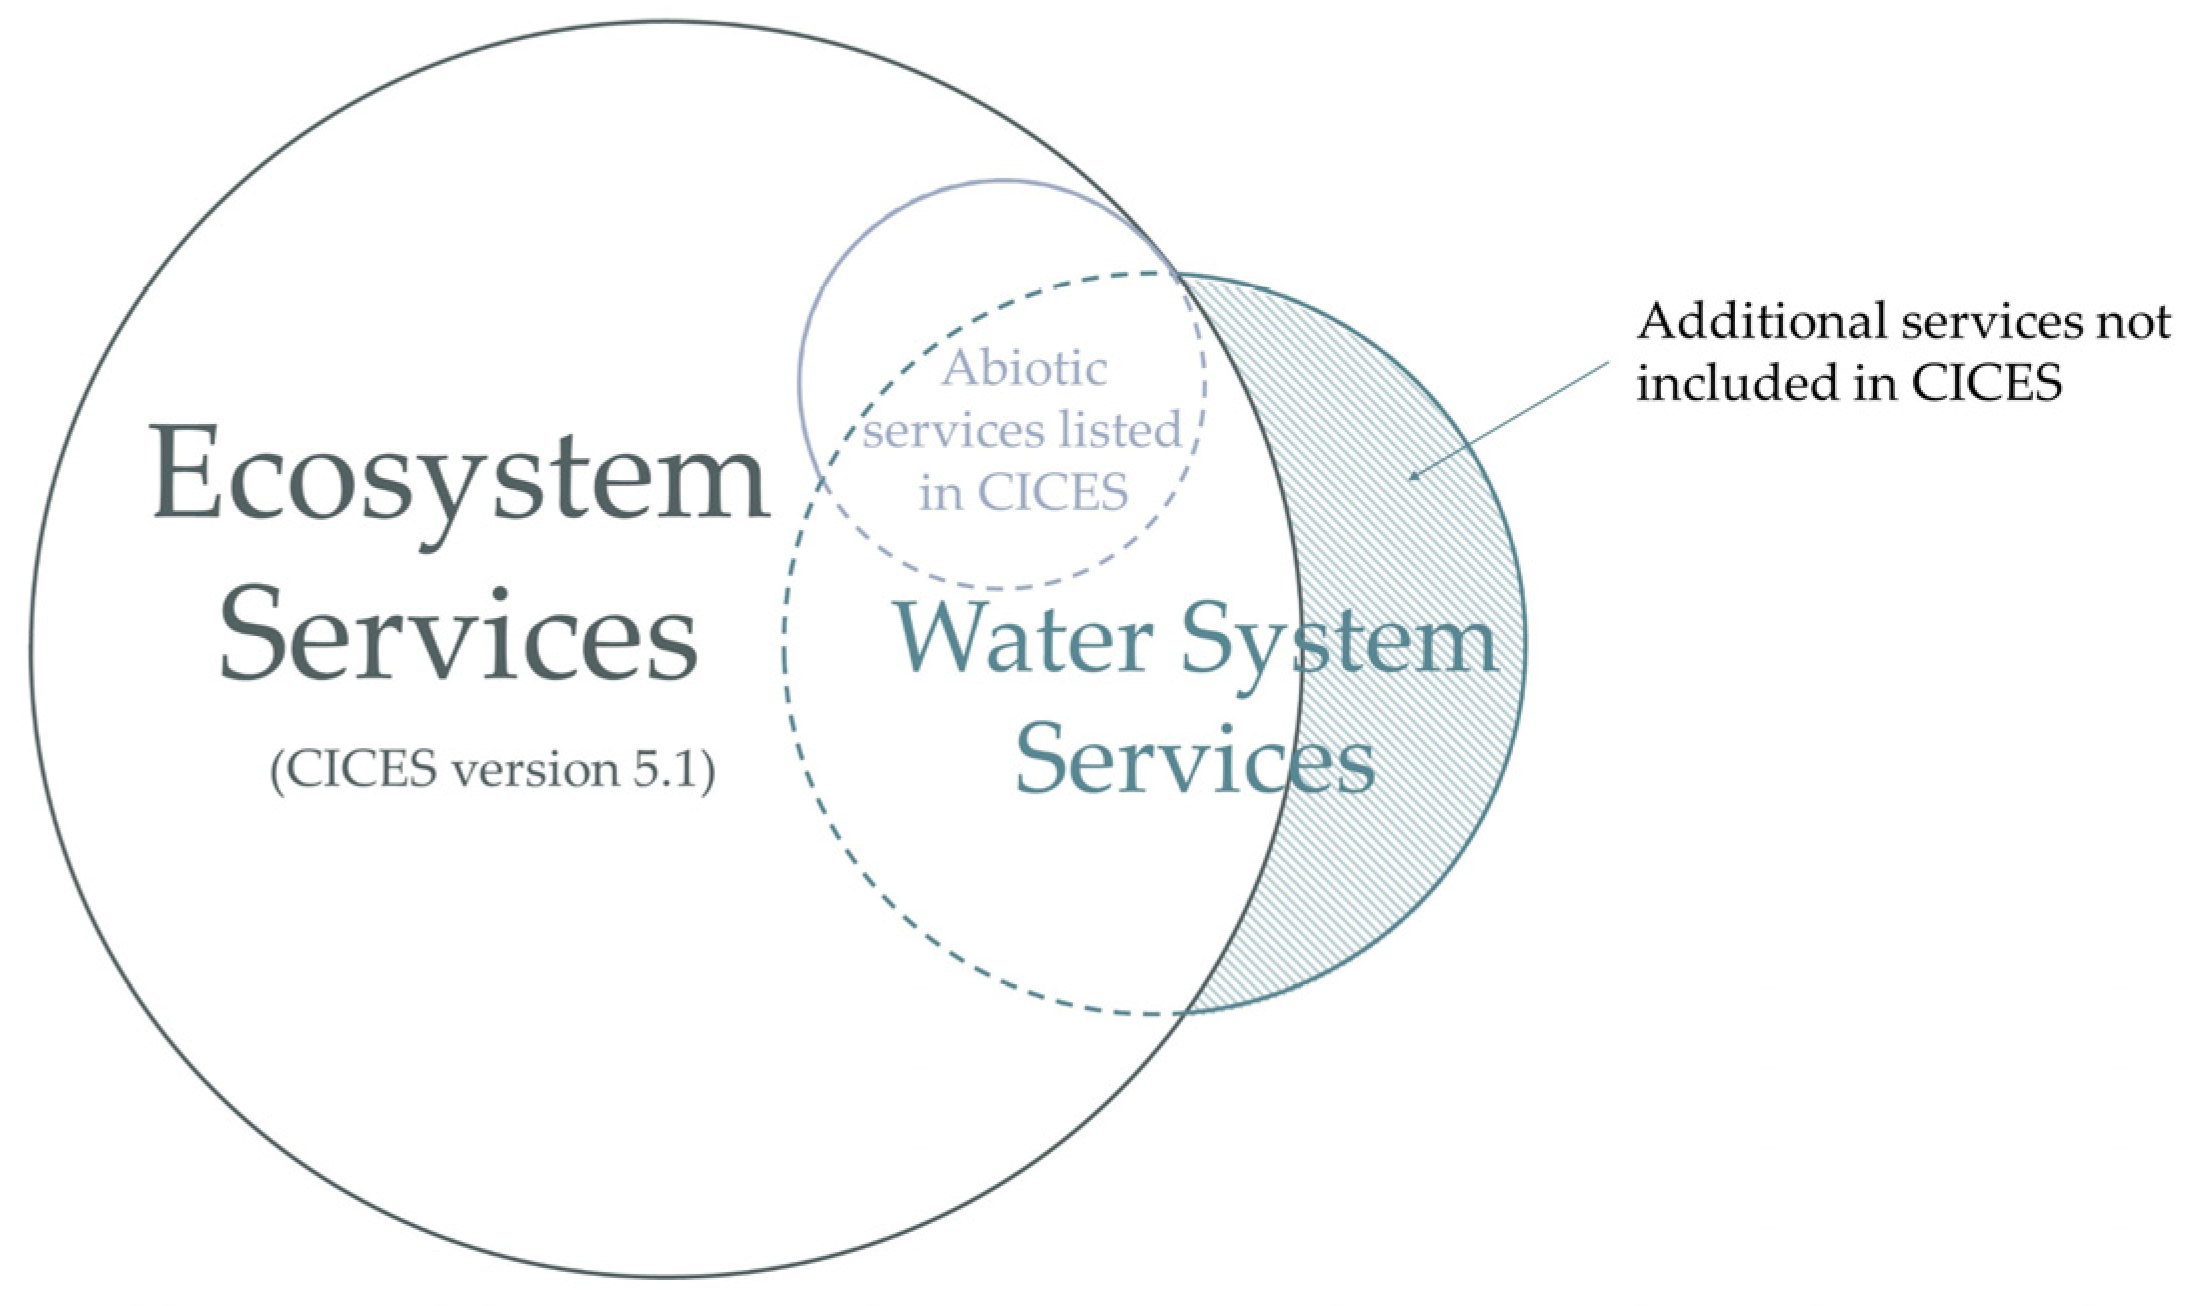
2. From Ecosystem Services to Water System Services
3. Materials and Methods
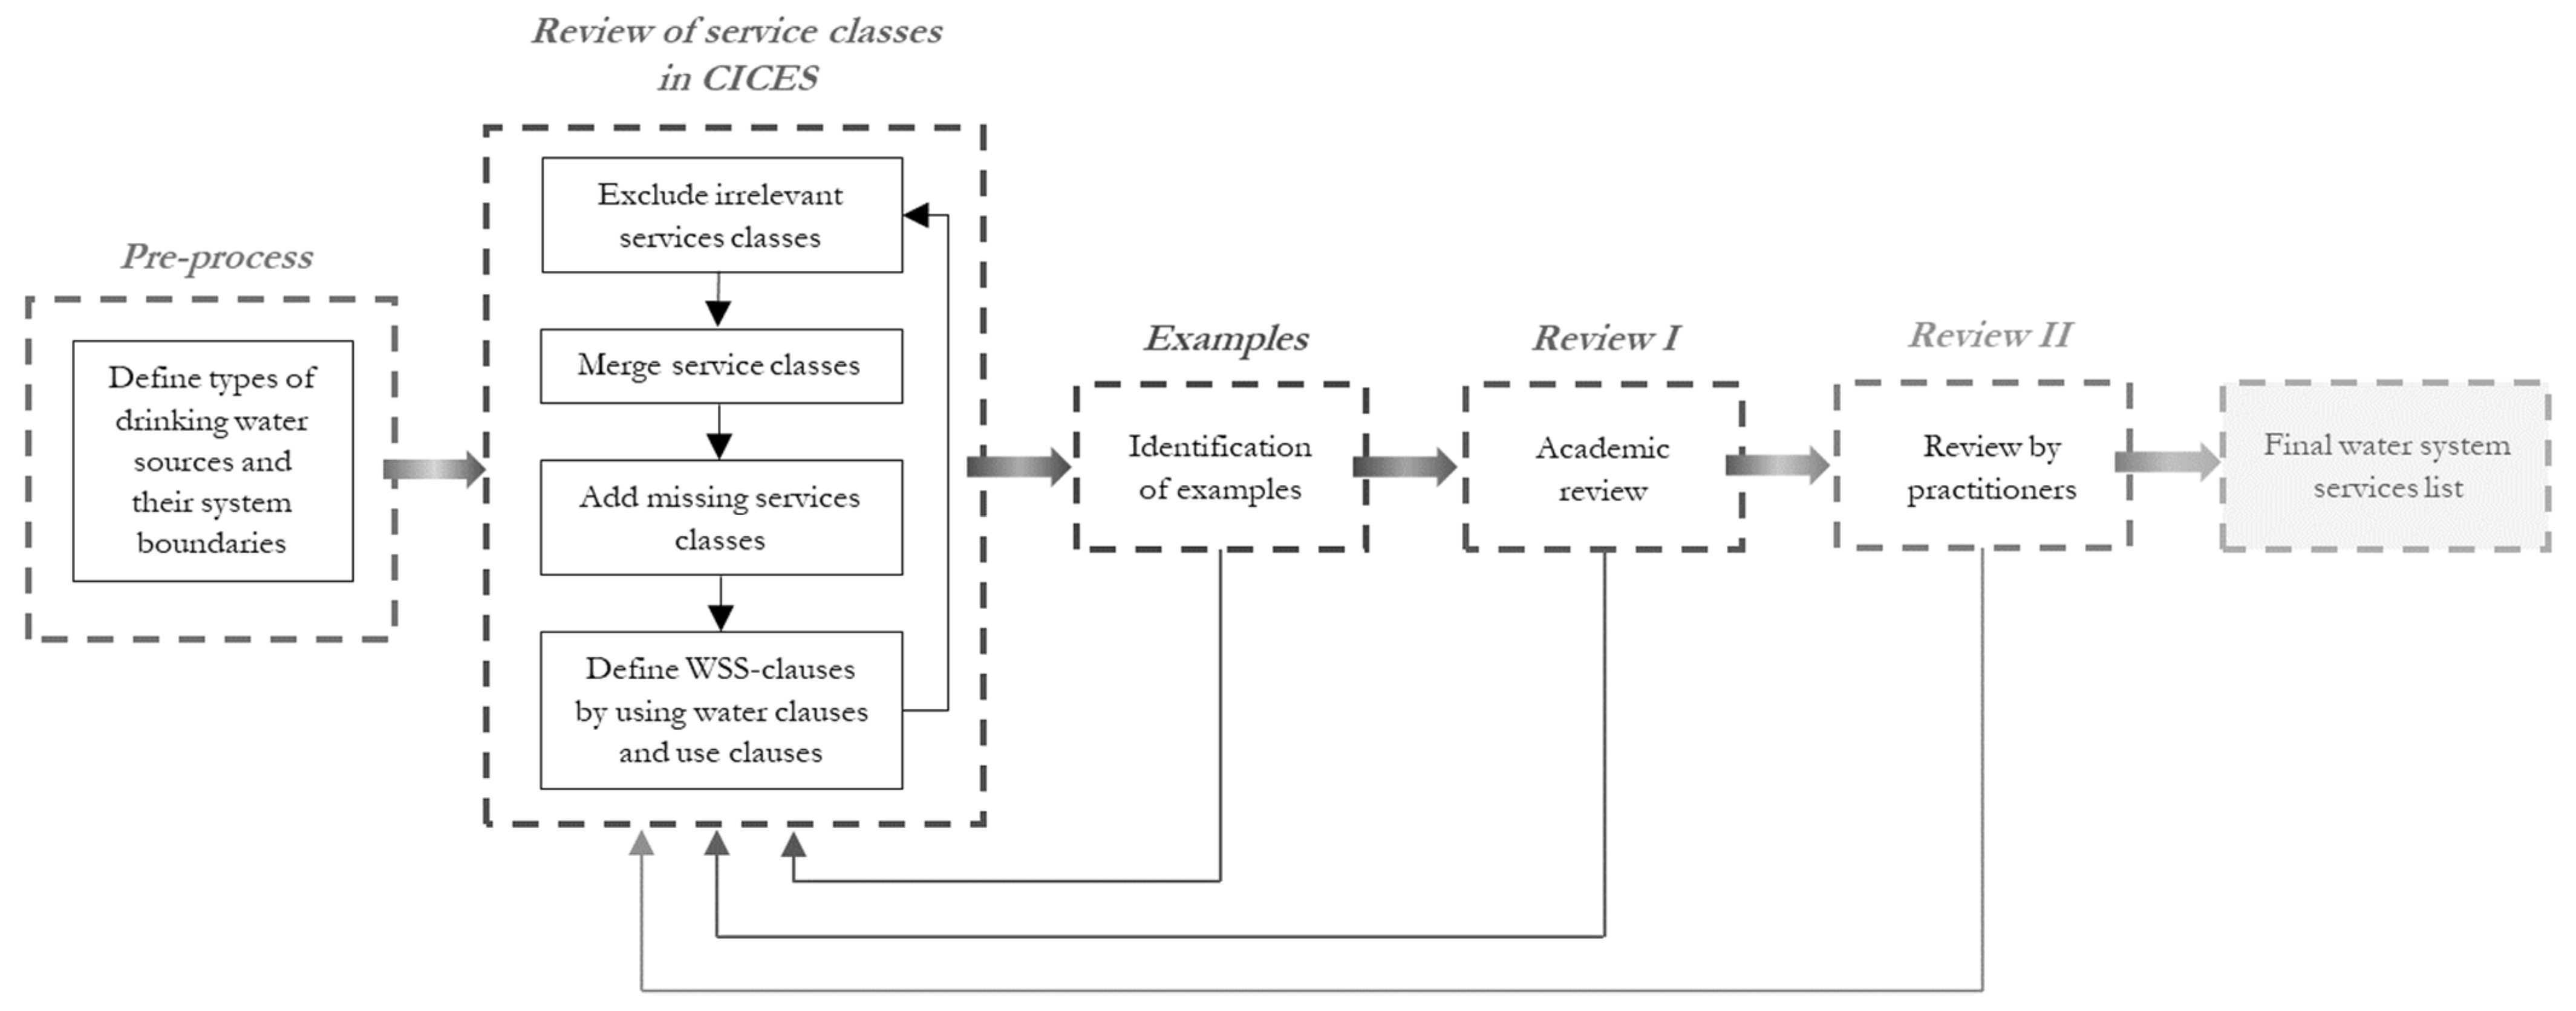
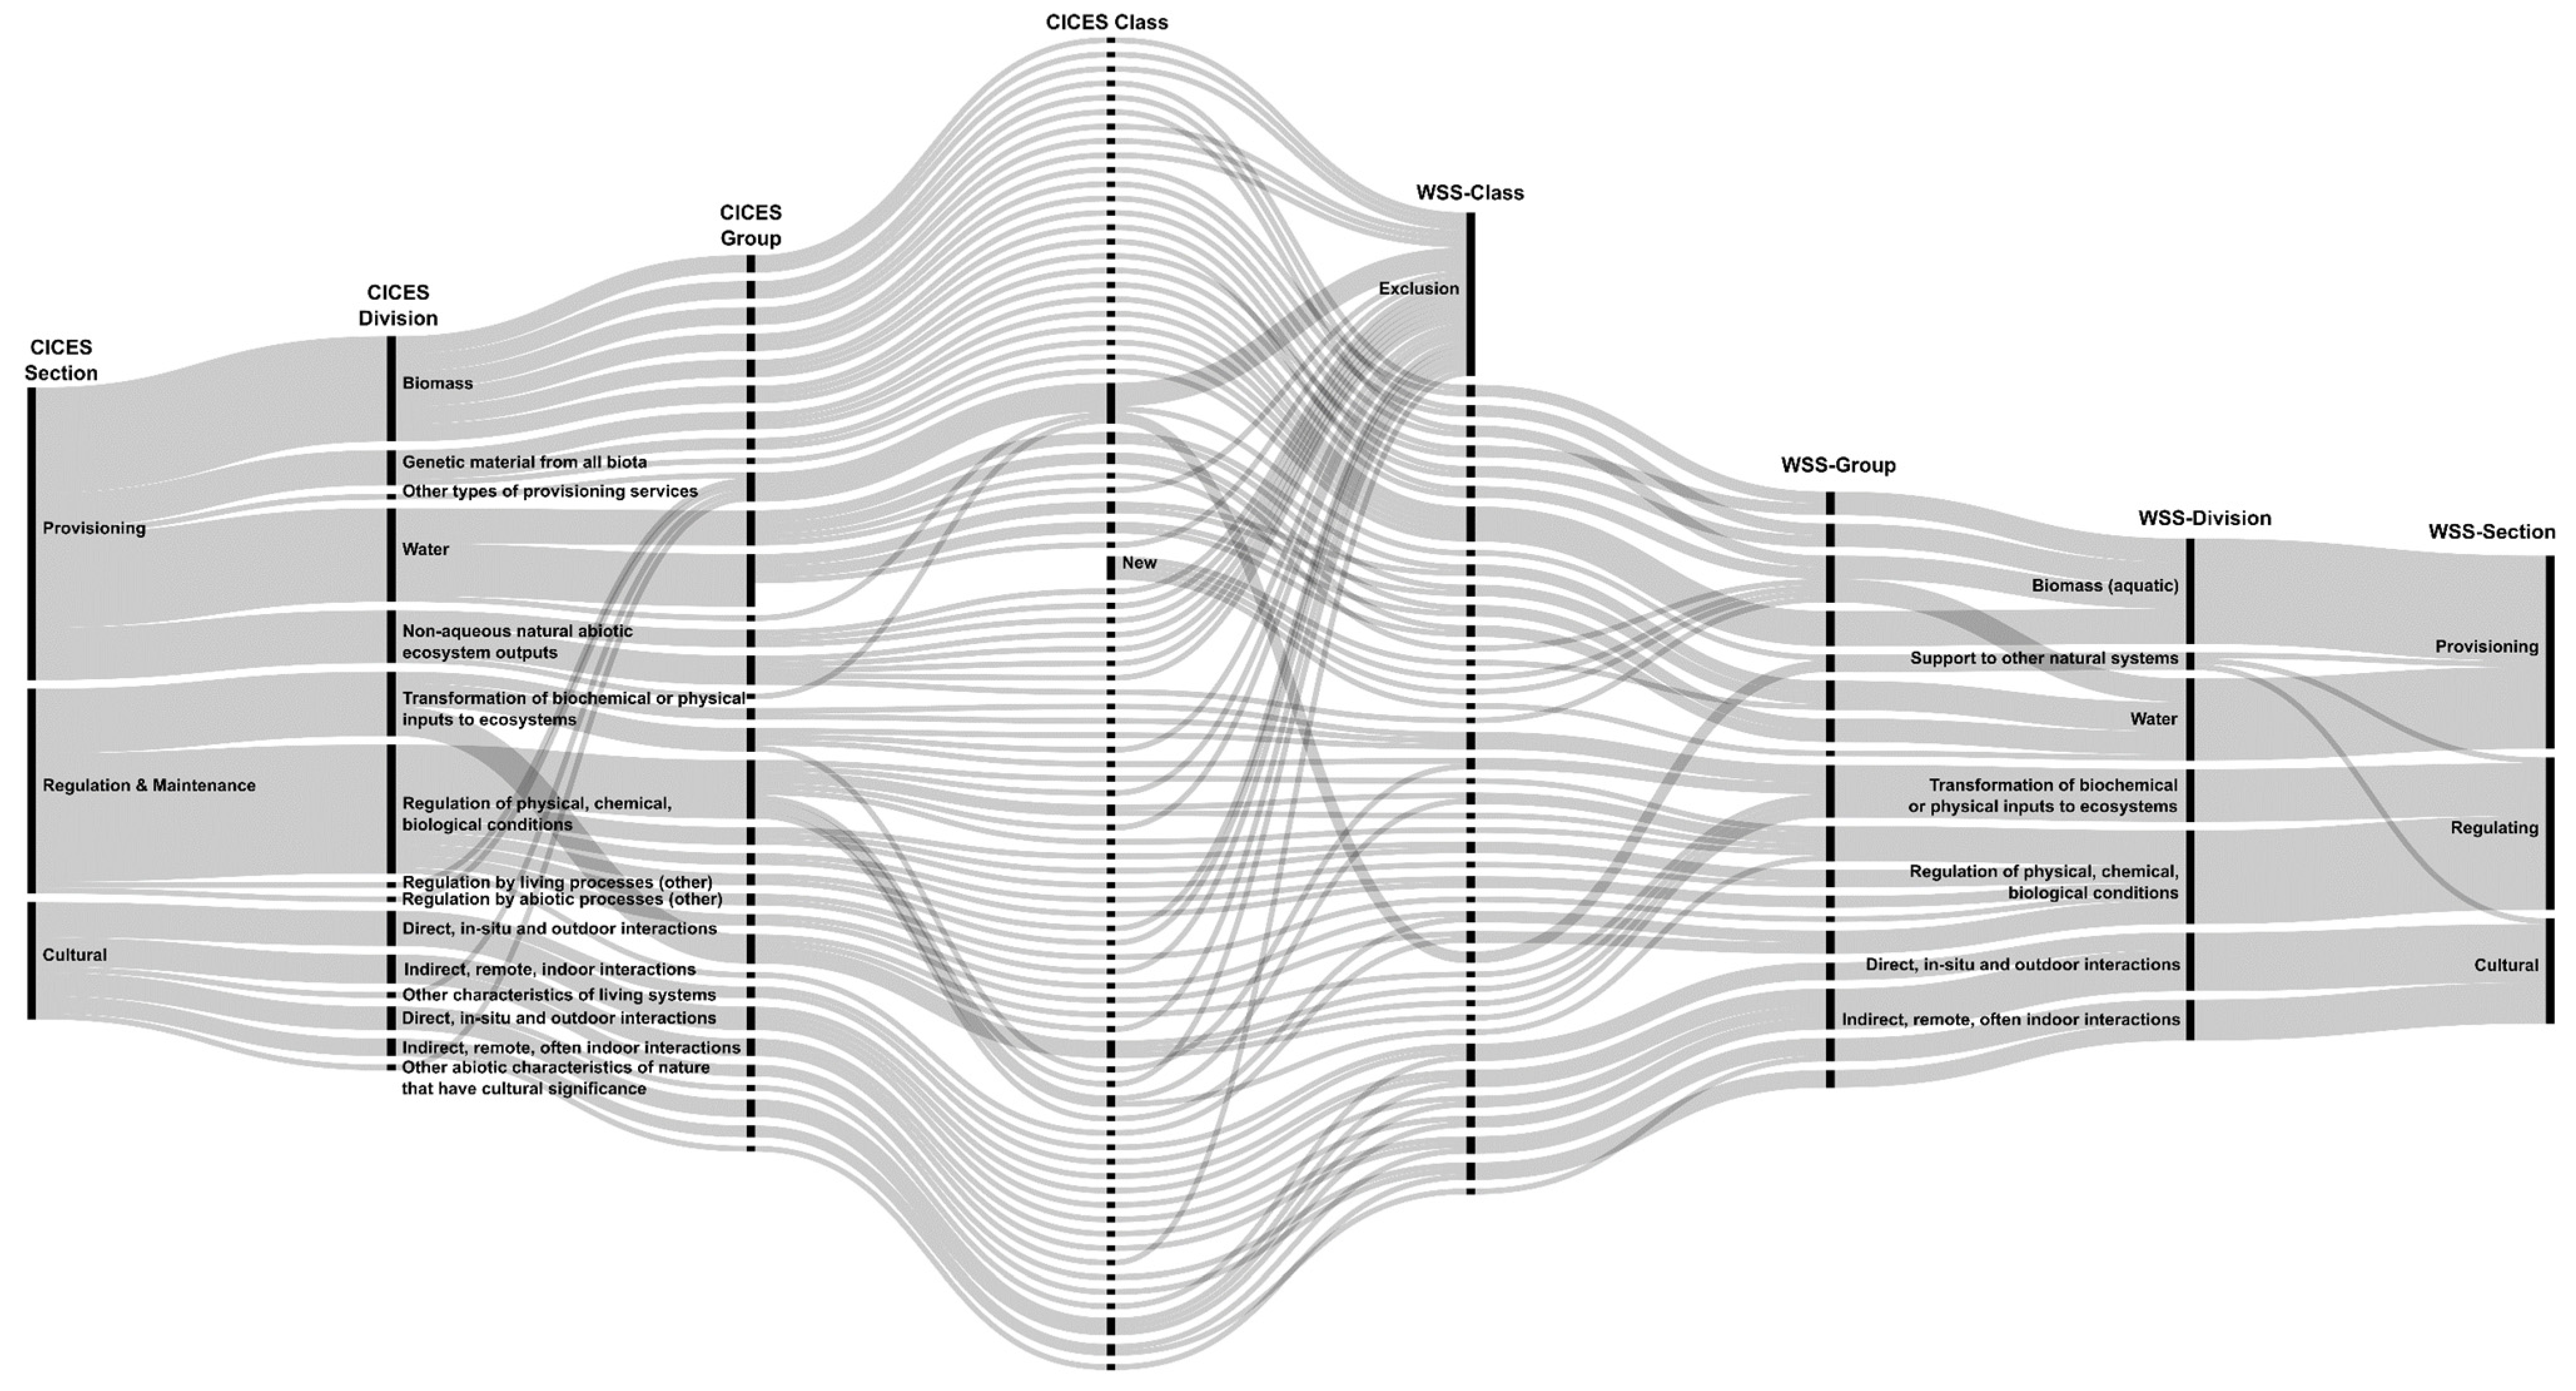
3.1. Development of a Region-Specific List of Water System Services
3.1.1. Pre-Process (Step 1)
3.1.2. Review of Service Classes in CICES (Step 2)
3.1.3. Identification of Examples (Step 3)
3.1.4. Review Process (Steps 4 and 5)
3.2. Identification and Quantification of Water System Services for a Specific Site
3.3. Integration of Water System Services into a Risk Assessment
3.3.1. Hazard Identification
3.3.2. Risk Estimation
3.3.3. Identification and Evaluation of Water Protection Measures
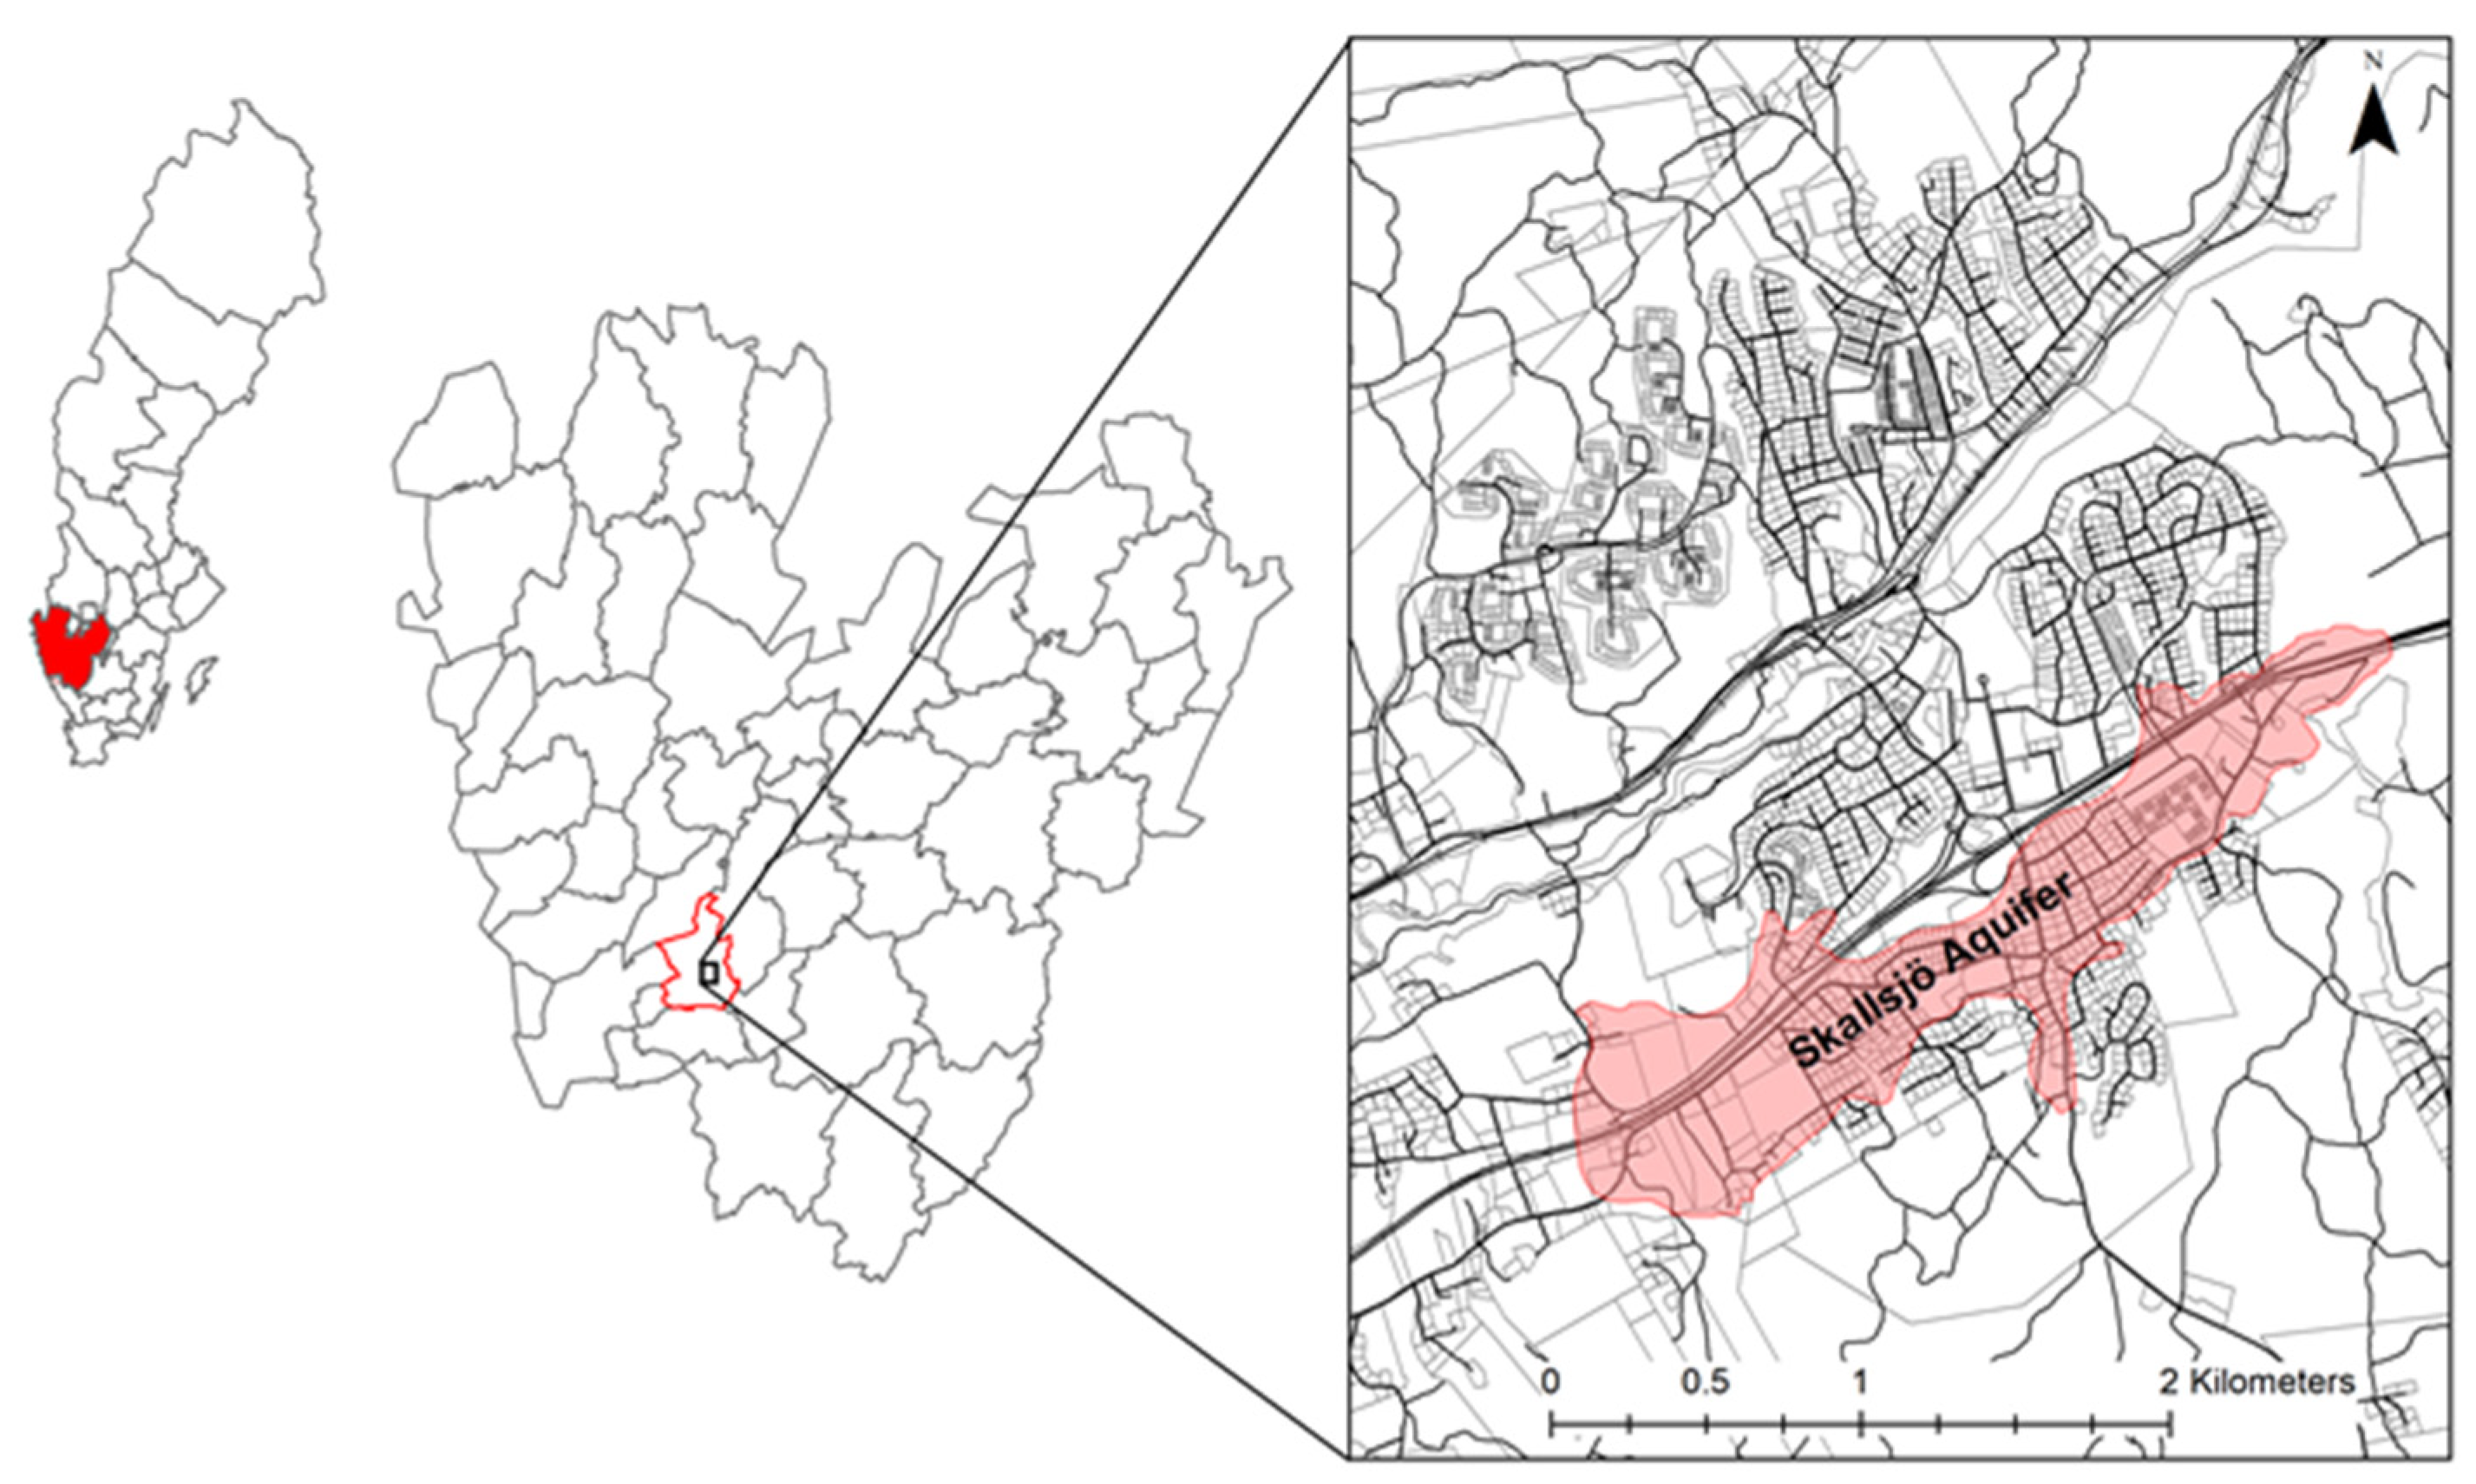
3.4. Case Study Site–Skallsjö
4. Results
4.1. Water System Services List
4.2. Case Study Results
4.2.1. Identified Water System Services
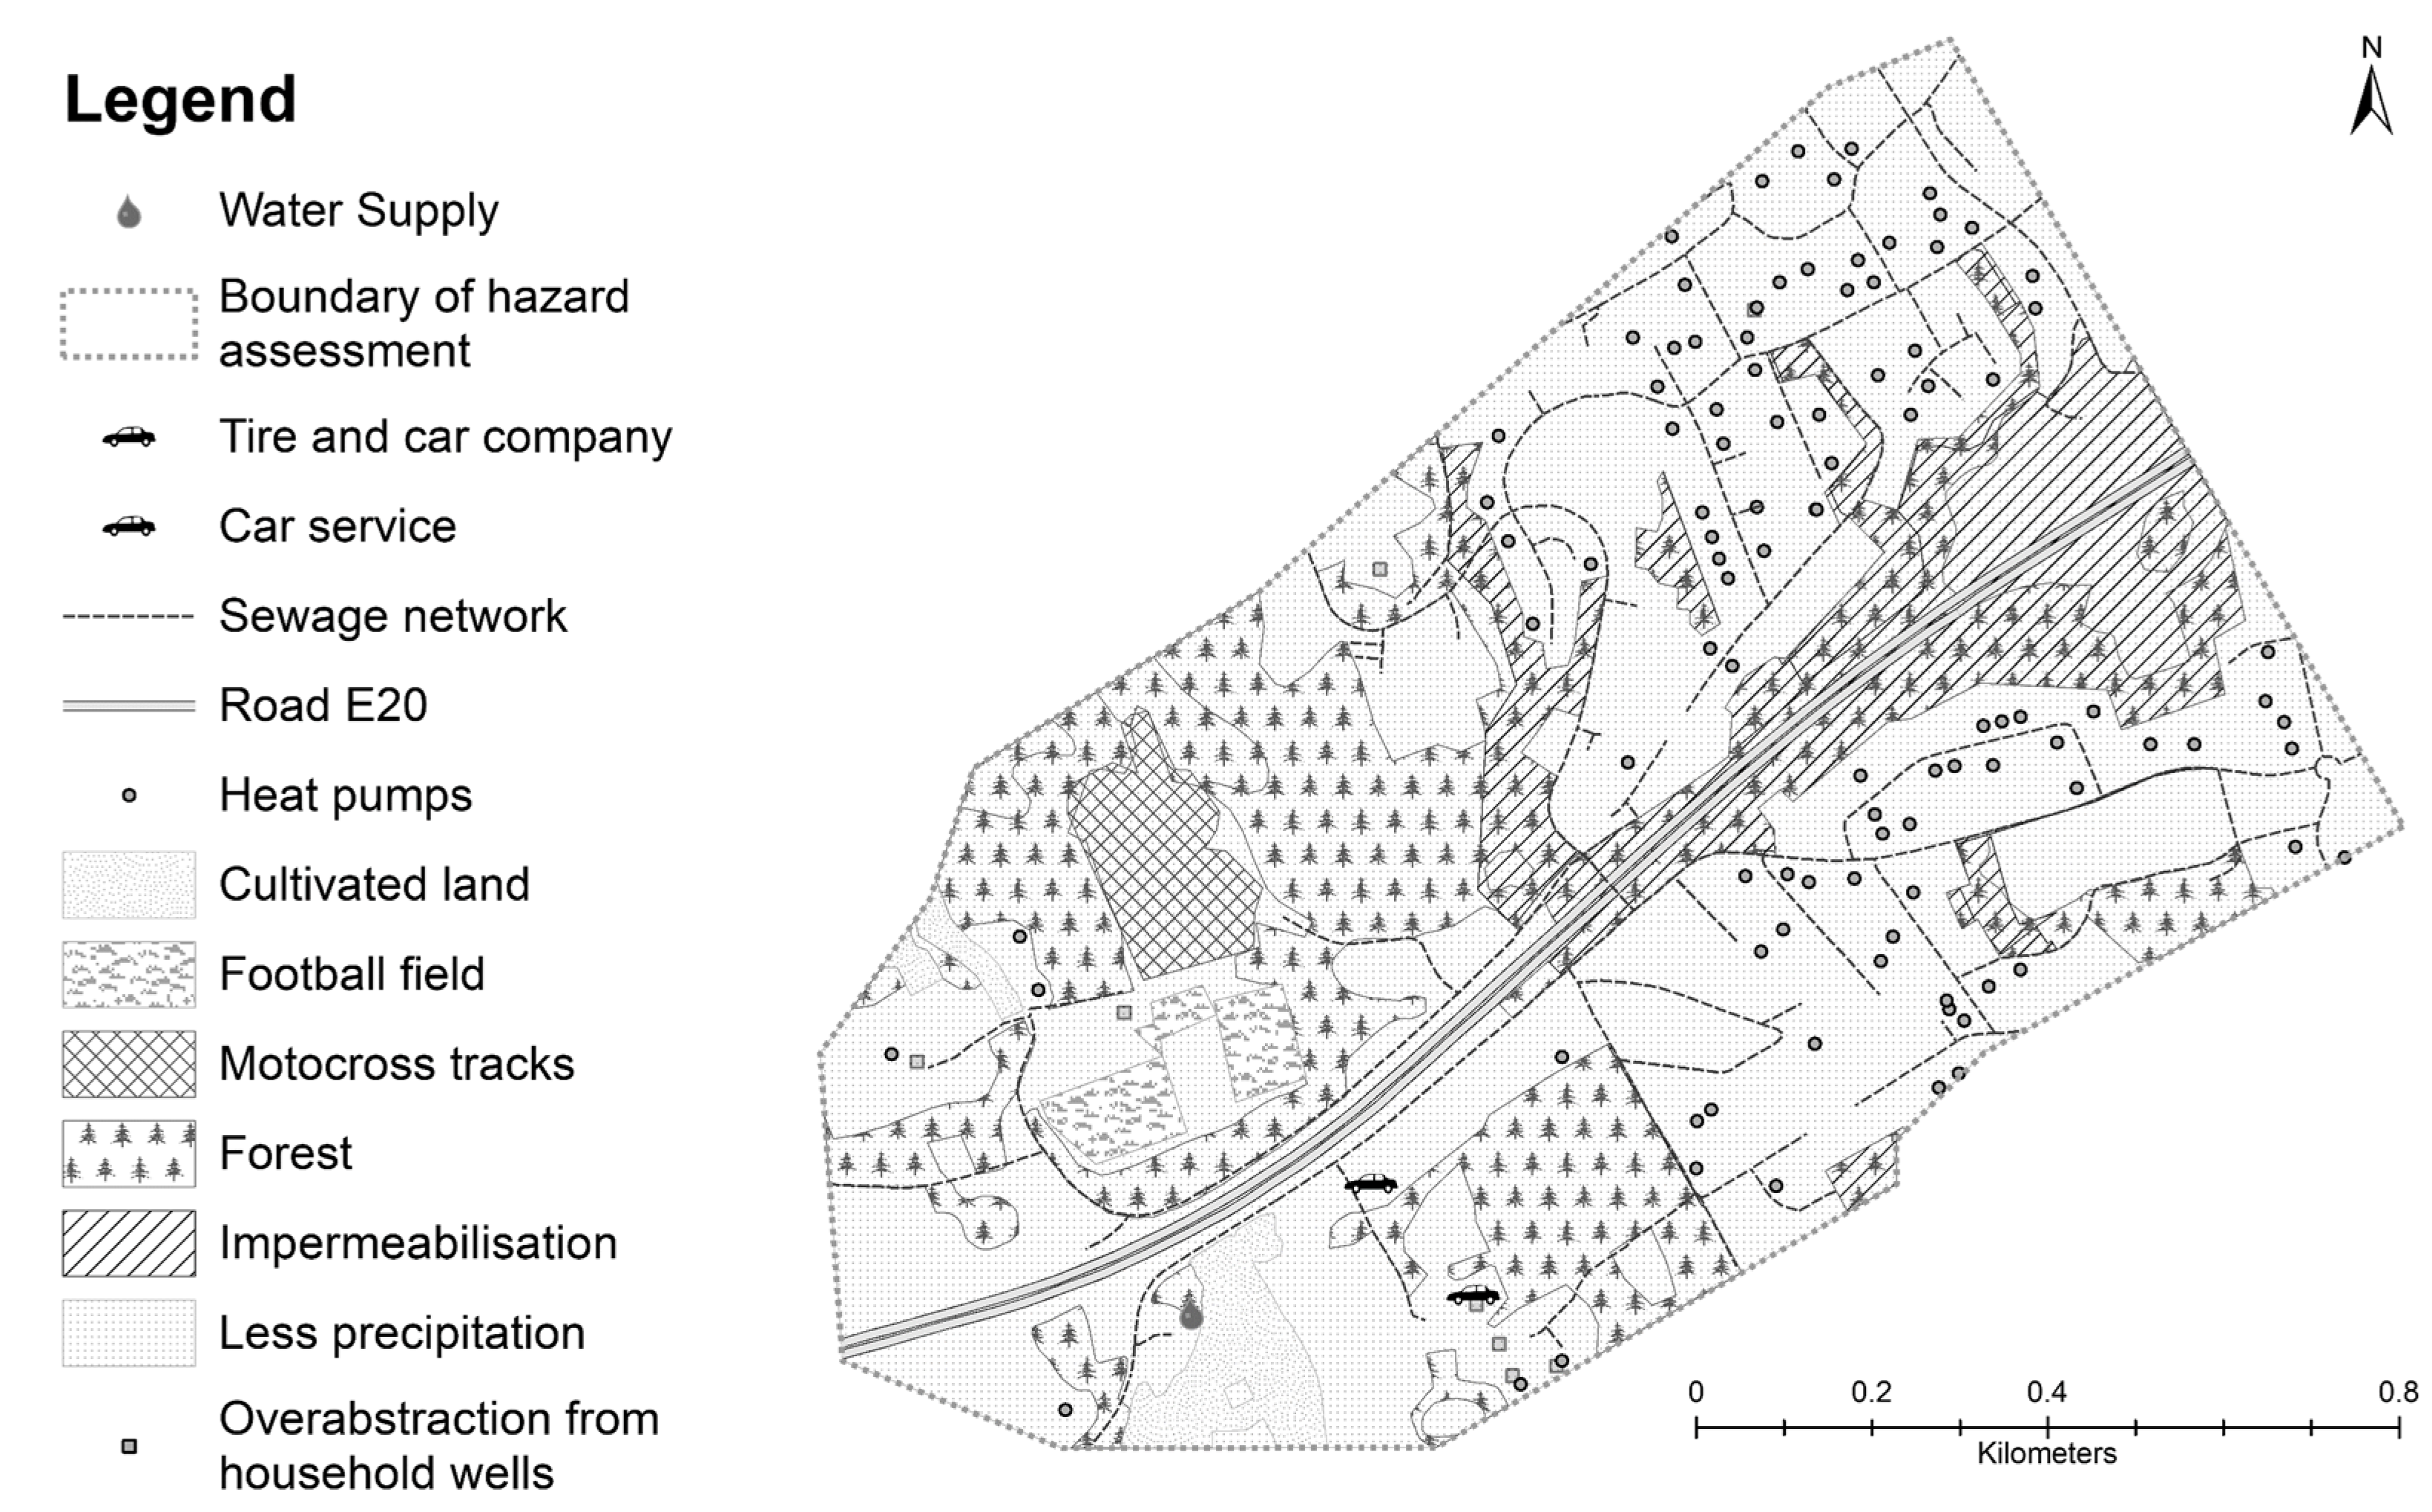
4.2.2. Identified Hazards
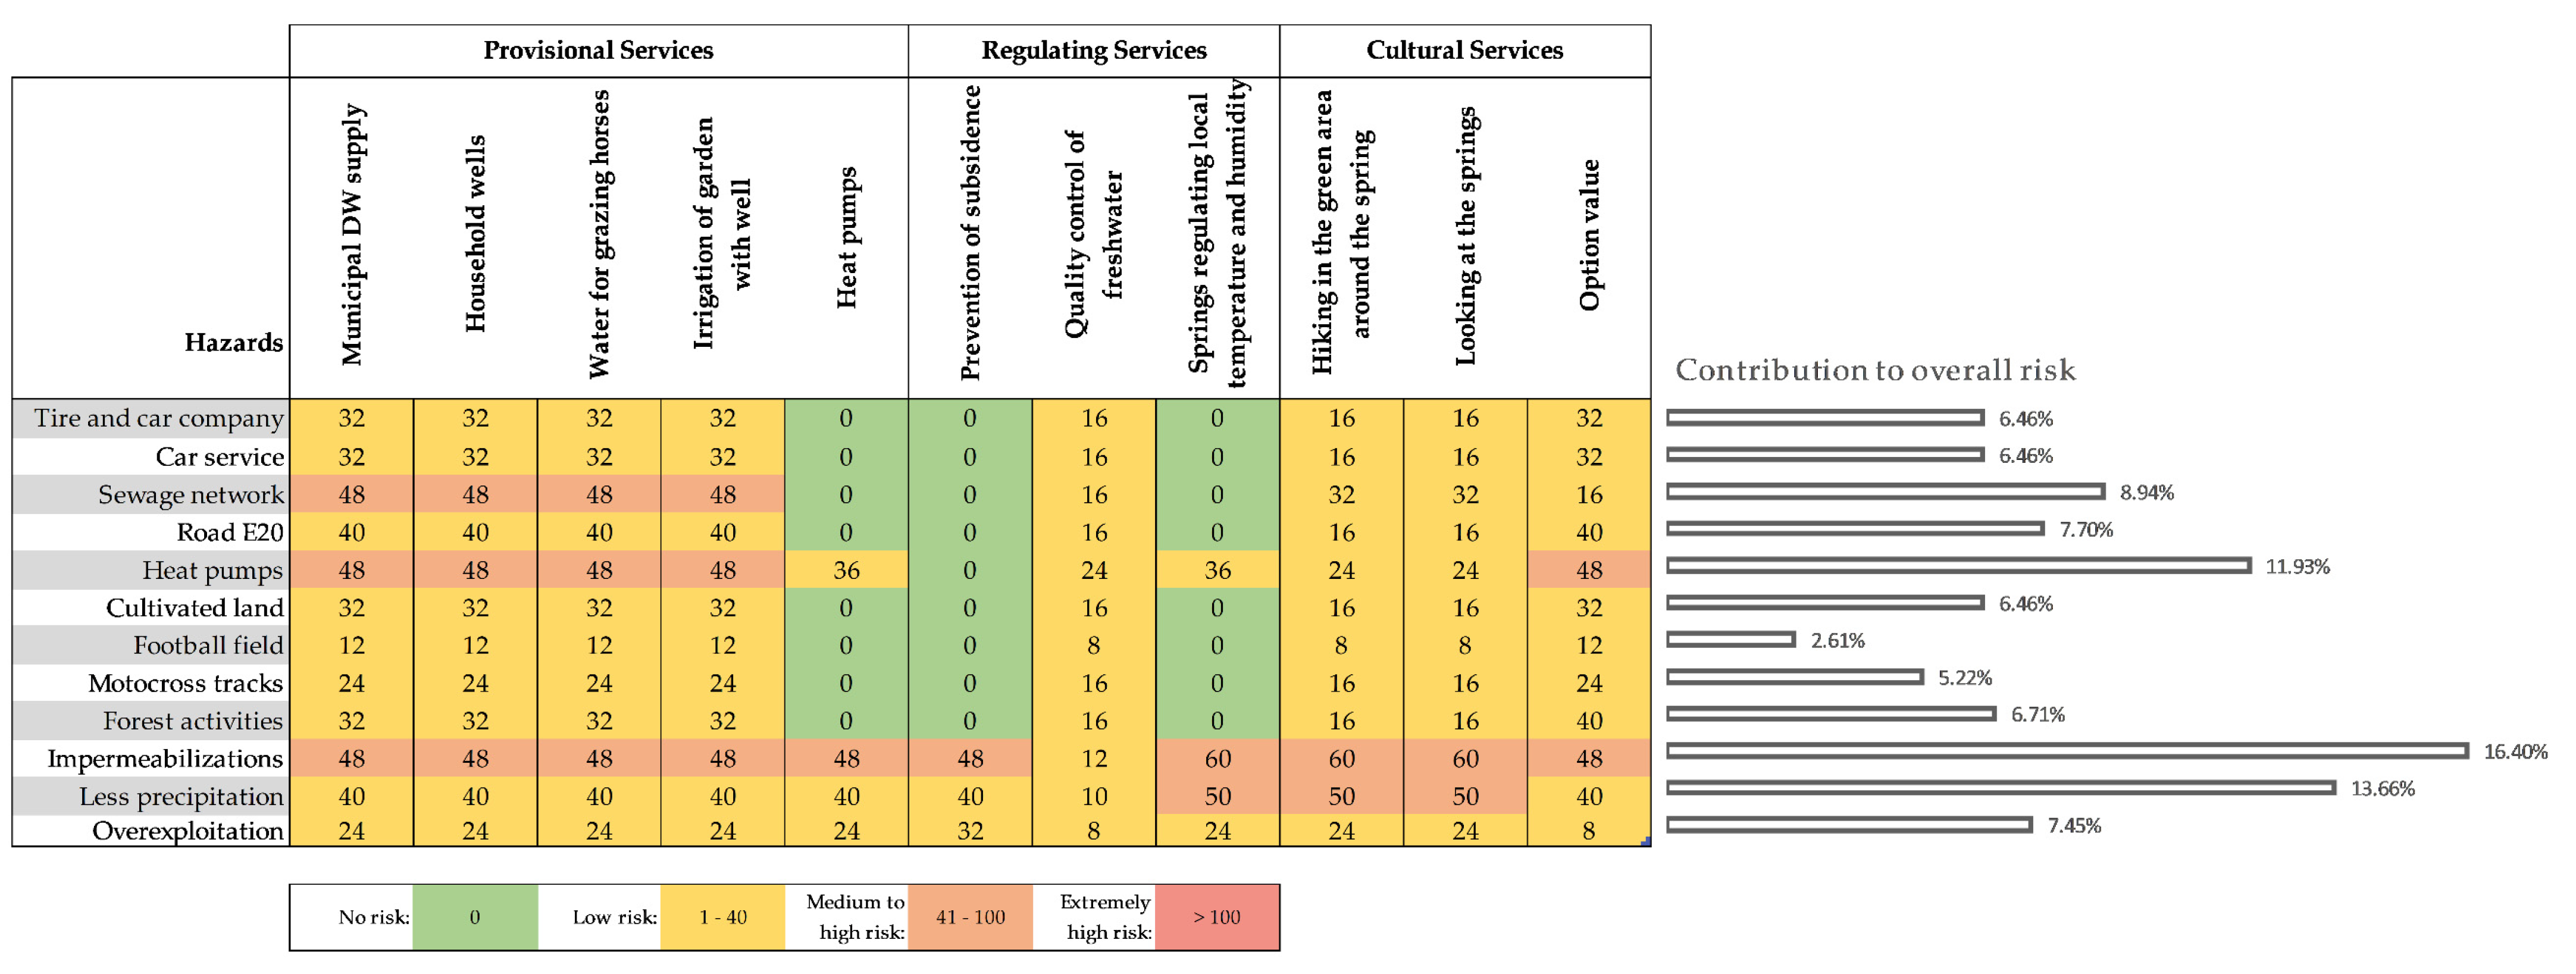
4.2.3. Risk Estimation
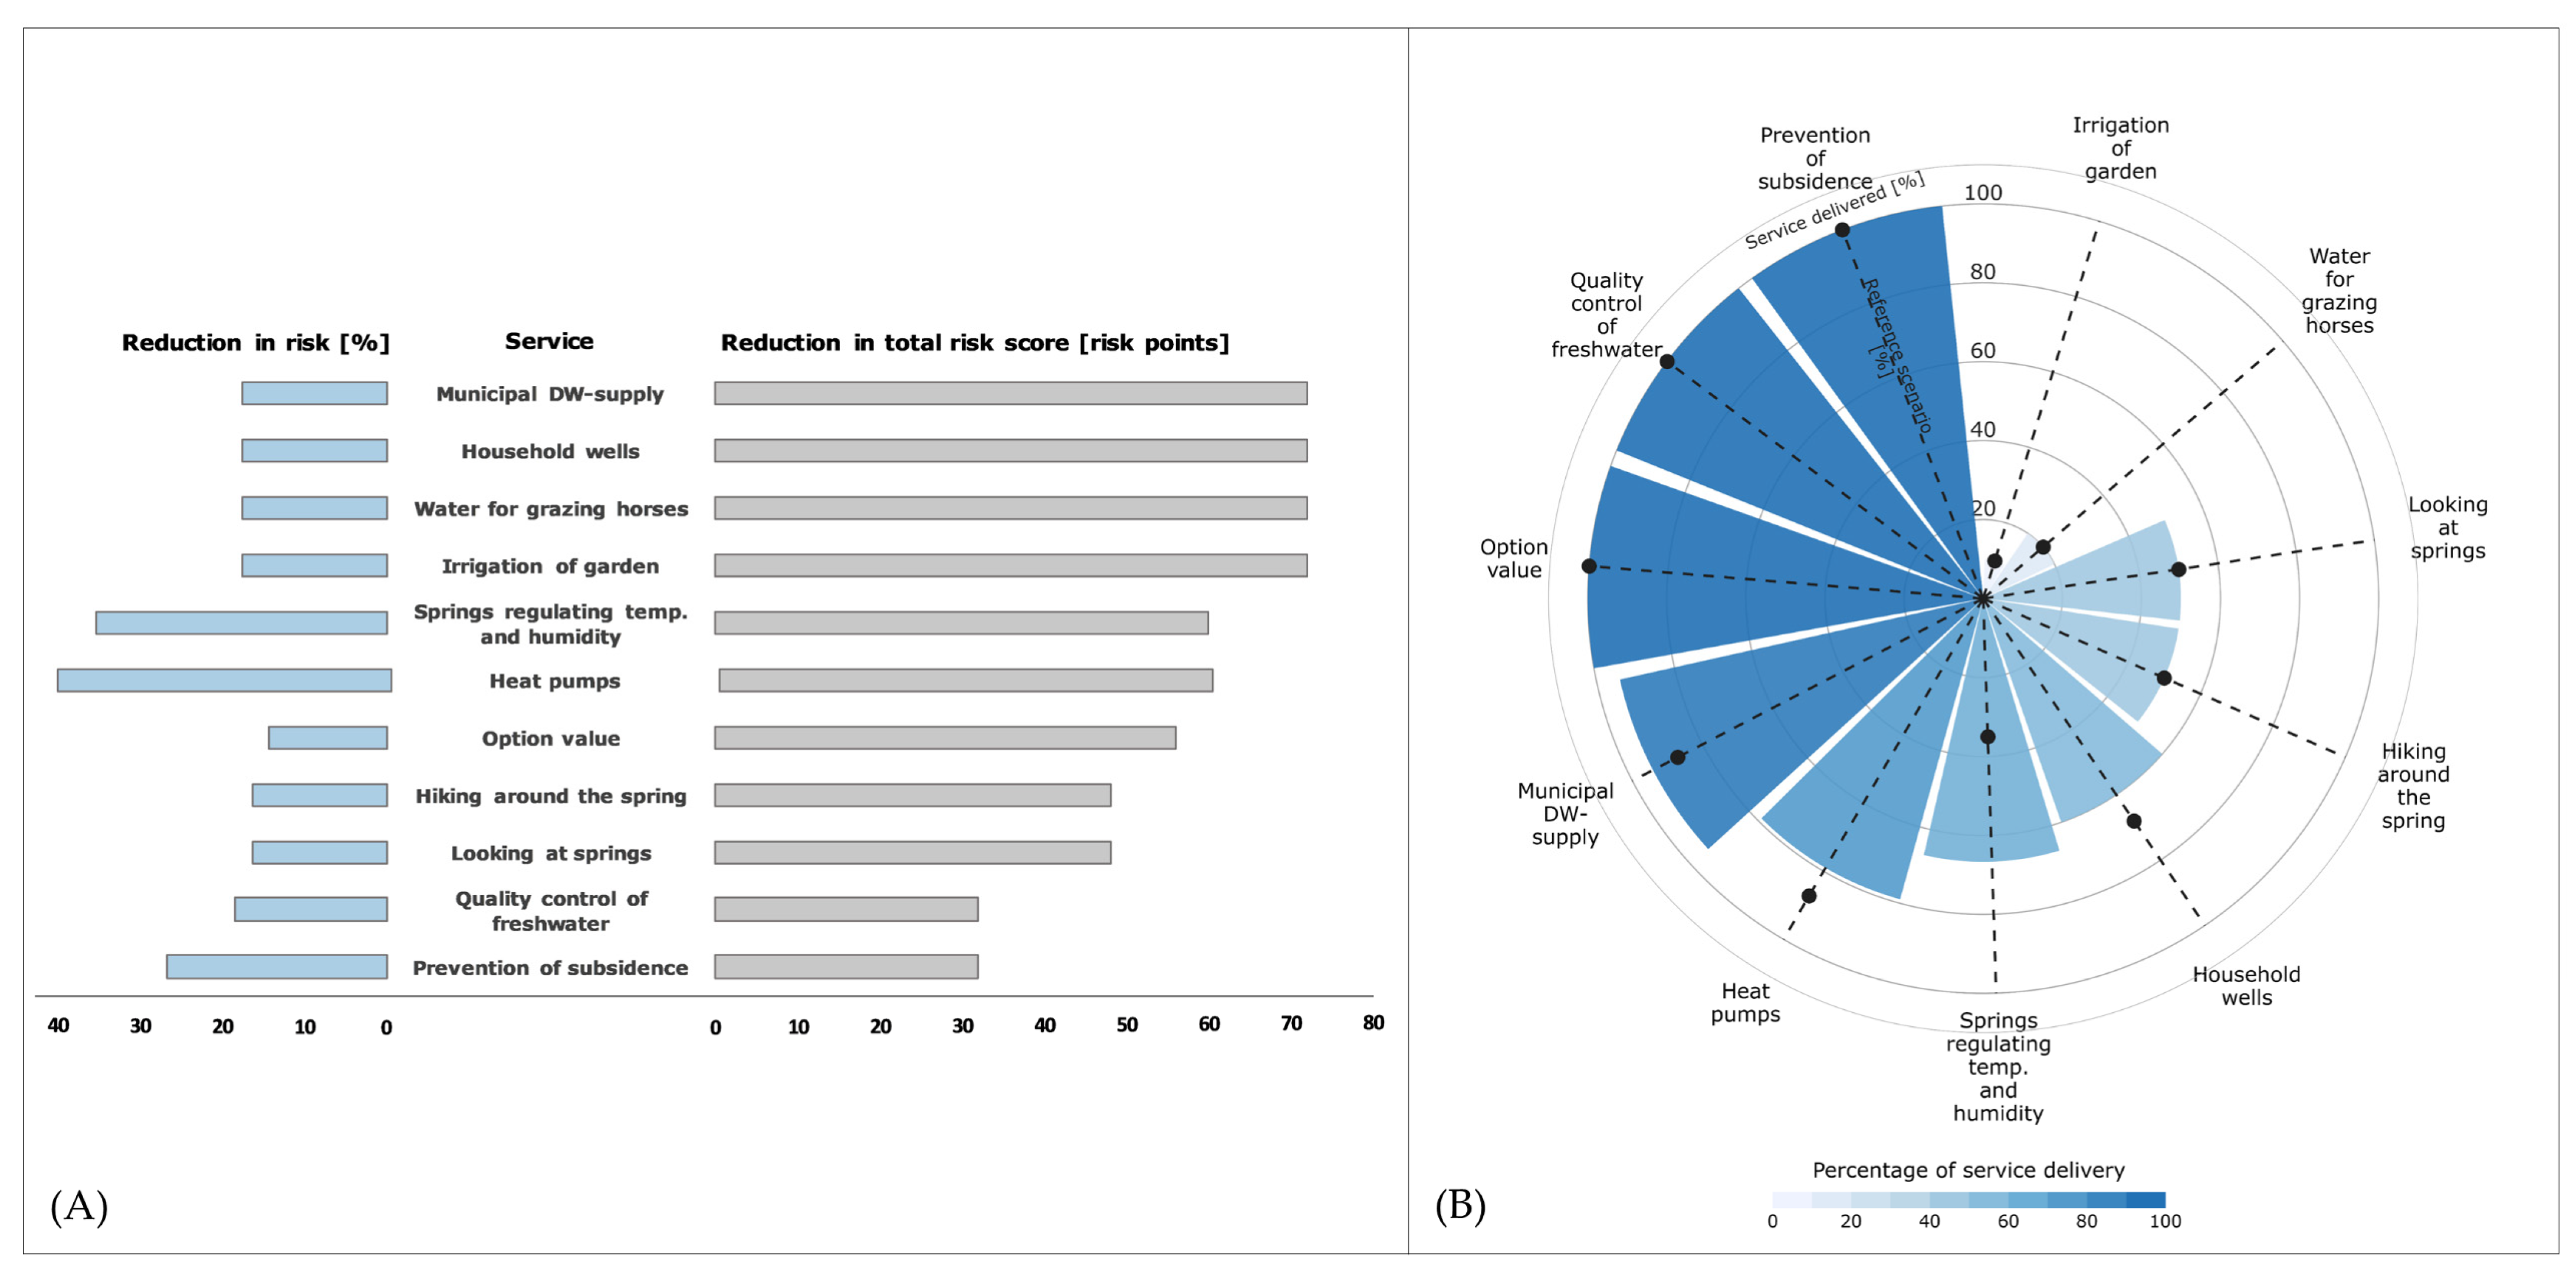
4.2.4. Output for Decision Support
5. Discussion
5.1. Insights from the Case Study Application
5.2. Towards Ecosystem Services-Based Decisions in Drinking Water Protection
5.3. Limitations and Recommendations
6. Conclusions
Supplementary Materials
Author Contributions
Funding
Informed Consent Statement
Acknowledgments
Conflicts of Interest
Appendix A. Water System Services List for Sweden

| Division | Group | Code Used in CICES v 5.1 | Class | Examples of Services | Water Clause | Use Clause |
|---|---|---|---|---|---|---|
| Biomass (aquatic) | Food | 1.1.2.1, 1.1.4.1 | Cultivated plants or animals |
| Nature’s contribution to the growth of organisms in aquaculture… | …that can be harvested and used as raw material for the production of food |
| 1.1.5.1, 1.1.6.1 | Wild plants or animals |
| Parts of the standing biomass of non-cultivated aquatic organisms and their outputs… | …that can be harvested and used as raw material for the production of food | ||
| Material | 1.1.2.2, 1.1.4.2 | Fibers and other materials from cultivated plants or animals |
| Nature’s contribution to the growth of organisms in aquaculture… | …that can be harvested and used as raw material for non-nutritional purposes | |
| 1.1.5.2, 1.1.6.2 | Fibers and other materials from wild plants or animals |
| Parts of the standing biomass of non-cultivated aquatic organisms and their outputs… | …that can be harvested and used as raw material for non-nutritional purposes | ||
| Energy | 1.1.2.3, 1.1.4.3 | Cultivated plants or animals as an energy source |
| Nature’s contribution to the growth of organisms in aquaculture… | …that can be harvested and used as a source of energy | |
| 1.1.5.3, 1.1.6.3 | Wild plants or animals as an energy source |
| Parts of the standing biomass of non-cultivated aquatic organisms and their outputs… | …that can be harvested and used as an energy source | ||
| Genetic Material | 1.2.1.1, 1.2.1.2, 1.2.1.3, 1.2.2.1, 1.2.2.2, 1.2.2.3 | Genetic material from all organisms |
| Genetic material and information from aquatic organisms… | …that can be used to maintain, develop new varieties or establish a new population, or that can be used in gene synthesis | |
| Water | Water for drinking | 4.2.1.1, 4.2.2.1 | Water supply for humans |
| Surface water bodies or aquifers… | … that provide a source of drinking water supply for humans |
| 4.2.1.1, 4.2.2.1 | Drinking water for animals |
| Surface water bodies or aquifers… | … that provide a source of drinking water supply for animals | ||
| own description | Reserve water sources |
| Surface water bodies or aquifers… | … that provide a source of reserve drinking water supply | ||
| Water for non-drinking purpose | 4.2.1.2, 4.2.2.2 | Irrigation |
| Surface water bodies or aquifers… | … that provide water which can be used for irrigation | |
| 4.2.1.2, 4.2.2.2 | Water used as a material or other type of input into production and consumption |
| Surface water bodies or aquifers… | … that provide water which can be used as other types of input into production and consumption | ||
| Energy | 4.2.1.3 | Surface water in hydropower |
| The flow of water on land…. | …that can be converted to electrical or mechanical energy | |
| 4.3.2.5 | Geothermal energy |
| Hot water and steam from the subsurface of the earth… | …that can be used as an energy source | ||
| own description based on 4.2.2.3 | Groundwater and surface water as an energy source |
| Surface water bodies or aquifers… | … that provide water at useful temperatures | ||
| own description | Water as storage of heat and coolness |
| Surface water bodies or aquifers… | … that provide a source for storage of heat or coolness | ||
| Water for transport | own description | Water as a means of transportation |
| Surface water bodies or aquifers… | … that provide water which can be used as a mode of transport | |
| Support to other natural systems | Surface water bodies or aquifers forming input to the functioning of other natural systems… | …that provide provisioning services |
| Division | Group | Code Used in CICES v 5.1 | Class | Examples of Services | Water Clause | Use Clause |
|---|---|---|---|---|---|---|
| Transformation of biochemical or physical inputs to ecosystems | Mediation of waste, toxic substances, and nuisances | 2.1.1.1, 2.1.1.2, 2.1.2.1 | Through living processes |
| Transformation, fixing, and storage of an organic or inorganic substance, and reducing the impact of odors by aquatic organisms… | …that mitigate harmful effects or reduce the costs of disposal by other means |
| 5.1.1.1 | Through dilution |
| The reduction in the concentration of organic or inorganic substances by mixing in freshwater, … | …that mitigates harmful effects or reduce the costs of disposal by other means | ||
| 5.1.1.3 | Through filtration |
| Mediation through filtration of waste, toxins, and other nuisances, by chemical and physical processes of water, … | …that can protect people | ||
| 5.1.1.3 | Through sequestration |
| Mediation through sequestration of waste, toxins, and other nuisances by chemical and physical water processes, … | …that can protect people | ||
| 5.1.1.3 | Through storage or accumulation |
| Mediation through storage or accumulation of waste, toxins, and other nuisances by chemical and physical water processes, … | …that can protect people | ||
| 2.1.2.3, 5.1.2.1 | Through other water-related mediation |
| Other types of water-related mediation of environmental conditions … | …. that can reduce or mitigate nuisance to people | ||
| Regulation of physical, chemical, biological conditions | Regulation of baseline flows and extreme events | 2.2.1.1 | Erosion control |
| The regulation in the loss of material, by virtue of the characteristics of aquatic ecosystems or by abiotic water characteristics, … | …that can protect people from erosion and mitigates or prevents potential erosion damage to human use, health, or safety |
| 2.2.1.3, 5.2.1.2 | Flood protection |
| The regulation of water flows, by virtue of the characteristics of aquatic ecosystems or by abiotic water characteristics, … | …that can protect people from flooding and mitigates or prevents potential flooding damage to human use, health, or safety | ||
| own description based on 5.2.1.2 | Prevention of subsidence |
| The regulation of water flows, by virtue of the characteristics of aquatic ecosystems or by abiotic water characteristics, … | …that can protect people from subsidence and mitigates or prevents potential subsidence damage to human use, health, or safety | ||
| own description based on 2.2.1.3 | Drought attenuation |
| The regulation of water flows, by virtue of the characteristics of aquatic ecosystems or by abiotic water characteristics, … | …that can protect people from drought and mitigates or prevents potential drought damage to human use, health, or safety | ||
| 2.2.1.5 | Fire protection |
| The reduction in the incidence, intensity or speed of fire spread by virtue of the presence of aquatic organisms and the presence of water in the landscape, … | …that can protect people from fire and mitigates or prevents potential fire damage to human use, health, or safety | ||
| Lifecycle maintenance, habitat and gene pool protection | 2.2.2.1, 2.2.2.2 | Pollination and spreading of seeds by water |
| The water-related dispersal of seeds and spores, and the fertilization of crops, by aquatic organisms, … | …that maintains or increases the abundance and/or diversity of organisms that are important to people in use or non-use terms | |
| 2.2.2.3 | Maintaining populations and habitats |
| The presence of ecological conditions (usually habitats) and abiotic conditions necessary for sustaining populations of aquatic organisms… | … that are important to people in use or non-use terms | ||
| Pest and disease control | 2.2.3.1, 2.2.3.2 | Pest and disease control |
| The reduction, carried out by aquatic biological and water interactions or by the presence of water bodies, of the incidence of organisms… | …that prevent or reduce the output of food, material or energy, or their cultural importance | |
| Maintaining water conditions | 2.2.5.1 | Controlling the chemical quality of freshwater |
| Maintenance of the chemical condition of freshwaters, by aquatic organisms or by abiotic water characteristics, … | …that enables human use, health, or safety | |
| Atmospheric composition and conditions | 2.2.6.1, 5.2.1.3 | Regulation of global climate |
| Regulation of the concentrations of gases in the atmosphere and mediation of gaseous flows by aquatic ecosystems or the water itself, … | …that have an impact on global climate or oceans or offer protection to people | |
| 2.2.6.2, 5.2.2.1 | Regulation of local temperature and humidity |
| Mediation of ambient atmospheric conditions (including micro and mesoscale climates) such as local temperature and humidity, by virtue of the presence of aquatic organisms and abiotic water conditions, … | …that affect people’s living conditions, well-being, or comfort | ||
| Support to other natural systems | Surface water bodies or aquifers forming input to the functioning of other natural systems… | …that provide regulating services |
| Division | Group | Code Used in CICES v 5.1 | Class | Examples of Services | Water Clauses | Use Clauses |
|---|---|---|---|---|---|---|
| Direct, in-situ and outdoor interactions that depend on presence in the environmental setting | Physical and experiential interactions with the natural environment | 3.1.1.1, 3.1.1.2, 6.1.1.1 | Activities promoting health, recuperation, or enjoyment through active, immersive, passive, or observational interactions |
| The abiotic or biophysical characteristics of water or the qualities of aquatic organisms or ecosystems… | …that enable active, or passive, physical and experiential interactions such as use, enjoyment, view, or observation |
| Intellectual and representative interactions with natural environment | 3.1.2.1, 3.1.2.2, 6.1.2.1 | Scientific investigation, creation of traditional knowledge, education, training |
| The abiotic or biophysical characteristics of water or the qualities of aquatic organisms or ecosystems… | …that are the subject matter for in-situ research, teaching, or skill development | |
| 3.1.2.3, 6.1.2.1 | Culture or heritage |
| The abiotic or biophysical characteristics of water or the qualities of aquatic organisms or ecosystems… | …that contribute to cultural heritage or historical knowledge | ||
| 3.1.2.4, 6.1.2.1 | Aesthetic experiences |
| The abiotic or biophysical characteristics of water or the qualities of aquatic organisms or ecosystems… | …that are appreciated for their inherent beauty | ||
| Indirect, remote, often indoor interactions that do not require presence in the environmental setting | Spiritual, symbolic, and other interactions with the natural environment | 3.2.1.1, 3.2.1.2, 6.2.1.1 | Religious, sacred, or symbolic meaning |
| The abiotic or biophysical characteristics of water or the qualities of aquatic organisms or ecosystems… | …that have symbolic or spiritual importance such as being recognized by people for their cultural, historical, or iconic character and that are used as emblems or signifiers of some kind, or being deemed to have sacred or religious significance for people |
| 3.2.1.3, 6.2.1.1 | Entertainment or representation |
| The abiotic or biophysical characteristics of water or the qualities of aquatic organisms or ecosystems… | …that provide material or subject matter that can be communicated to others via different media for amusement or enjoyment | ||
| Other biotic or abiotic characteristics that have a non-use value | 3.2.2.1, 3.2.2.2, 6.2.2.1 | Existence, bequest, or option value |
| The abiotic or biophysical characteristics of water or the qualities of aquatic organisms or ecosystems… | …that people seek to preserve because of their non-utilitarian qualities or importance to others and future generations | |
| Support to other natural systems | Surface water bodies or aquifers forming input to the functioning of other natural systems… | …that provide cultural services |
References
- Mekonnen, M.M.; Hoekstra, A.Y. Sustainability: Four billion people facing severe water scarcity. Sci. Adv. 2016, 2, e1500323. [Google Scholar] [CrossRef] [PubMed] [Green Version]
- WHO. Guidelines for Drinking-Water Quality: Incorporating the First Addendum, 4th ed.; World Health Organization: Geneva, Switzerland, 2017; ISBN 9789241549950.
- HaV. Vägledning om Inrättande och Förvaltning av Vattenskyddsområden (Engl. Guidance on the Establishment and Management of Water Protection Areas); Havs Och Vattenmyndigheten—HaV (Engl. Swedish Agency for Marine and Water Management): Göteborg, Sweden, 2021; Volume 2021, p. 4. ISBN 9789189329034. [Google Scholar]
- Postel, S.L.; Thompson, B.H. Watershed protection: Capturing the benefits of nature’s water supply services. Nat. Resour. Forum 2005, 29, 98–108. [Google Scholar] [CrossRef]
- Haines-Young, R.; Potschin-Young, M.B. Revision of the common international classification for ecosystem services (CICES V5.1): A policy brief. One Ecosyst. 2018, 3, e27108. [Google Scholar] [CrossRef]
- Daily, G.C.; Polasky, S.; Goldstein, J.; Kareiva, P.M.; Mooney, H.A.; Pejchar, L.; Ricketts, T.H.; Salzman, J.; Shallenberger, R. Ecosystem services in decision making: Time to deliver. Front. Ecol. Environ. 2009, 7, 21–28. [Google Scholar] [CrossRef] [Green Version]
- Honey-Rosés, J.; Pendleton, L.H. A demand driven research agenda for ecosystem services. Ecosyst. Serv. 2013, 5, 160–162. [Google Scholar] [CrossRef]
- Olander, L.; Polasky, S.; Kagan, J.S.; Johnston, R.J.; Wainger, L.; Saah, D.; Maguire, L.; Boyd, J.; Yoskowitz, D. So you want your research to be relevant? Building the bridge between ecosystem services research and practice. Ecosyst. Serv. 2017, 26, 170–182. [Google Scholar] [CrossRef]
- Haines-Young, R.; Potschin, M. Common International Classification of Ecosystem Services (CICES) V5.1 and Guidance on the Application of the Revised Structure; Fabis Consulting: Nottingham, UK, 2018. [Google Scholar]
- Westman, W.E. How Much Are Nature’s Services Worth? Science 1977, 197, 960–964. [Google Scholar] [CrossRef]
- Daily, G.C. Nature’s Services: Societal Dependence on Natural Ecosystems. In The Future of Nature; Robin, L., Sörlin, S., Warde, P., Eds.; Yale University Press: New Haven, CT, USA, 1997; pp. 454–464. [Google Scholar]
- Costanza, R.; D’Arge, R.; De Groot, R.; Farber, S.; Grasso, M.; Hannon, B.; Limburg, K.; Naeem, S.; O’Neill, R.V.; Paruelo, J.; et al. The value of the world’s ecosystem services and natural capital. Nature 1997, 387, 253–260. [Google Scholar] [CrossRef]
- MA. Ecosystems and Human Well-Being: Wetlands and Water Synthesis; World Resources Institute: Washington, DC, USA, 2005; ISBN 1569735972. [Google Scholar]
- Fisher, B.; Turner, R.K.; Morling, P. Defining and classifying ecosystem services for decision making. Ecol. Econ. 2009, 68, 643–653. [Google Scholar] [CrossRef] [Green Version]
- TEEB. The Economics of Ecosystems and Biodiversity Ecological and Economic Foundations; Kumar, P., Ed.; Earthscan: London, UK; Washington, DC, USA, 2010. [Google Scholar]
- Anzaldua, G.; Gerner, N.V.; Lago, M.; Abhold, K.; Hinzmann, M.; Beyer, S.; Winking, C.; Riegels, N.; Krogsgaard, J.J.; Termes, M.; et al. Getting into the water with the Ecosystem Services Approach: The DESSIN ESS evaluation framework. Ecosyst. Serv. 2018, 30, 318–326. [Google Scholar] [CrossRef]
- Kaval, P. Integrated catchment management and ecosystem services: A twenty-five year overview. Ecosyst. Serv. 2019, 37, 100912. [Google Scholar] [CrossRef]
- De Groot, R.S.; Alkemade, R.; Braat, L.; Hein, L.; Willemen, L. Challenges in integrating the concept of ecosystem services and values in landscape planning, management and decision making. Ecol. Complex. 2010, 7, 260–272. [Google Scholar] [CrossRef]
- Hackbart, V.C.S.; De Lima, G.T.N.P.; Dos Santos, R.F. Theory and practice of water ecosystem services valuation: Where are we going? Ecosyst. Serv. 2017, 23, 218–227. [Google Scholar] [CrossRef]
- Valente, R.A.; De Mello, K.; Metedieri, J.F.; Américo, C. A multicriteria evaluation approach to set forest restoration priorities based on water ecosystem services. J. Environ. Manag. 2021, 285, 112049. [Google Scholar] [CrossRef]
- Ávila-García, D.; Morató, J.; Pérez-Maussán, A.I.; Santillán-Carvantes, P.; Alvarado, J.; Comín, F.A. Impacts of alternative land-use policies on water ecosystem services in the Río Grande de Comitán-Lagos de Montebello watershed, Mexico. Ecosyst. Serv. 2020, 45, 101179. [Google Scholar] [CrossRef]
- Rosini, C.; Revelli, R. A Scoring Matrix Method for Integrated Evaluation of Water-Related Ecosystem Services Provided by Urban Parks. Environ. Manag. 2020, 66, 756–769. [Google Scholar] [CrossRef]
- Maes, J.; Liquete, C.; Teller, A.; Erhard, M.; Paracchini, M.L.; Barredo, J.I.; Grizzetti, B.; Cardoso, A.; Somma, F.; Petersen, J.E.; et al. An indicator framework for assessing ecosystem services in support of the EU Biodiversity Strategy to 2020. Ecosyst. Serv. 2016, 17, 14–23. [Google Scholar] [CrossRef] [Green Version]
- Koundouri, P.; Ker Rault, P.; Pergamalis, V.; Skianis, V.; Souliotis, I. Development of an integrated methodology for the sustainable environmental and socio-economic management of river ecosystems. Sci. Total Environ. 2016, 540, 90–100. [Google Scholar] [CrossRef] [Green Version]
- Jujnovsky, J.; Ramos, A.; Caro-Borrero, Á.; Mazari-Hiriart, M.; Maass, M.; Almeida-Leñero, L. Water assessment in a peri-urban watershed in Mexico City: A focus on an ecosystem services approach. Ecosyst. Serv. 2017, 24, 91–100. [Google Scholar] [CrossRef]
- Griebler, C.; Avramov, M. Groundwater ecosystem services: A review. Freshw. Sci. 2015, 34, 355–367. [Google Scholar] [CrossRef] [Green Version]
- Hérivaux, C.; Grémont, M. Valuing a diversity of ecosystem services: The way forward to protect strategic groundwater resources for the future? Ecosyst. Serv. 2019, 35, 184–193. [Google Scholar] [CrossRef]
- Boyd, J.; Banzhaf, S. What are ecosystem services? The need for standardized environmental accounting units. Ecol. Econ. 2007, 63, 616–626. [Google Scholar] [CrossRef] [Green Version]
- Li, J.; Jiang, H.; Bai, Y.; Alatalo, J.M.; Li, X.; Jiang, H.; Liu, G.; Xu, J. Indicators for spatial-temporal comparisons of ecosystem service status between regions: A case study of the Taihu River Basin, China. Ecol. Indic. 2016, 60, 1008–1016. [Google Scholar] [CrossRef]
- ISO 31000:2018; Risk management: Guidelines. ISO: Geneva, Switzerland, 2018.
- Lång, L.; Persson, T. Beskrivning Till Kartan—Grundvattenförekomster i Lerums Kommun (Engl. Description of Maps—Groundwater in Lerum municipality); Geological Survey of Sweden: Uppsala, Sweden, 2011.
- Beuken, R.; Reinoso, M.; Sturn, S.; Kiefer, J.; Bondelind, M.; Aström, J.; Lindhe, A.; Losén, L.; Petterson, T.; Machenbach, I.; et al. Identification and Description of Hazards for Water Supply Systems, Deliverable D4.1.1/2; TECHNEAU: Gothenburg, Sweden, 2008. [Google Scholar]
- Kaplan, S.; Garrick, J.B. On the quantitative definition of risk. Risk Anal. 1981, 1, 11–27. [Google Scholar] [CrossRef]
- Mudaliar, M.M.; Bergin, C.; MacLeod, K. Drinking Water Safety Planning—A Practical Guide for Pacific Island Countries; World Health Organization and Pacific Islands Applied Geoscience Commission: Suva, Fiji, 2010. [Google Scholar]
- Biswas, A.K. Integrated water resources management: Is it working? Int. J. Water Resour. Dev. 2008, 24, 5–22. [Google Scholar] [CrossRef]
- Grizzetti, B.; Lanzanova, D.; Liquete, C.; Reynaud, A.; Cardoso, A.C. Assessing water ecosystem services for water resource management. Environ. Sci. Policy 2016, 61, 194–203. [Google Scholar] [CrossRef]
- Cook, B.R.; Spray, C.J. Ecosystem services and integrated water resource management: Different paths to the same end ? J. Environ. Manag. 2012, 109, 93–100. [Google Scholar] [CrossRef]
- Snäll, T.; Triviño, M.; Mair, L.; Bengtsson, J.; Moen, J. High rates of short-term dynamics of forest ecosystem services. Nat. Sustain. 2021, 4, 951–957. [Google Scholar] [CrossRef]
- Vári, Á.; Podschun, S.A.; Erős, T.; Hein, T.; Pataki, B.; Iojă, I.C.; Adamescu, C.M.; Gerhardt, A.; Gruber, T.; Dedić, A.; et al. Freshwater systems and ecosystem services: Challenges and chances for cross-fertilization of disciplines. Ambio 2021, 51, 135–151. [Google Scholar] [CrossRef]
- Bergion, V.; Lindhe, A.; Sokolova, E.; Rosén, L. Risk-based cost-benefit analysis for evaluating microbial risk mitigation in a drinking water system. Water Res. 2018, 132, 111–123. [Google Scholar] [CrossRef] [Green Version]
- Marttunen, M.; Mustajoki, J.; Lehtoranta, V.; Saarikoski, H. Complementary use of the Ecosystem Service Concept and Multi-criteria Decision Analysis in Water Management. Environ. Manag. 2021. [Google Scholar] [CrossRef] [PubMed]
- Sjöstrand, K.; Lindhe, A.; Söderqvist, T.; Rosén, L. Sustainability assessments of regional water supply interventions – Combining cost-benefit and multi-criteria decision analyses. J. Environ. Manag. 2018, 225, 313–324. [Google Scholar] [CrossRef] [PubMed]
- WaterPlan-Project Risk-Based Prioritization of Water Protection in Sustainable Spatial Planning. Available online: waterplanproject.org (accessed on 28 March 2022).


| Section | Division | Group | Class | Class Type | Code | Simple Descriptor | Ecological Clause | Use Clause | Example Service | Example Goods and Benefits |
|---|---|---|---|---|---|---|---|---|---|---|
| Provisioning (abiotic) | Water | Groundwater used for nutrition, materials, or energy | Ground and (subsurface) water for drinking | By amount, type, source | 4.2.2.1 | Drinking water from the below ground | Natural, below groundwater bodies or aquifers… | … that provide a source of drinking water | Aquifer volume and characteristics | Potable water in public supply system; mineral water |
| Type of Natural Drinking Water Source | How Drinking Water Is Obtained | Examples of System Boundaries |
|---|---|---|
| Surface water | Pumping from river, reservoir, lake, canal | Freshwater body, recharge area, discharge area |
| Groundwater | Pumping from aquifer | Groundwater body, recharge area, discharge area, unsaturated zone |
| Combination of surface water and groundwater | Managed aquifer recharge | Groundwater body and freshwater body as well as their respective recharge area and discharge area, unsaturated zone |
| Seawater | Desalination | Seabed, water column, beaches, polder |
| Rainwater | Rainwater harvesting | Area for rainwater collection |
| Description of Service Classes | |
|---|---|
| Excluded service class | Coastal and marine water used as an energy source (code: 4.2.1.4) |
| Merged service classes | Pest control incl. invasive species (code: 2.2.3.1) and disease control (code: 2.2.3.2) |
| Added service class | Water as a means for transportation |
| Ecological Clause | Use Clause | |
| in CICES | The reduction in the loss of material by virtue of the stabilizing effects of the presence of plants and animals… | …that mitigates or prevents potential damage to human use of the environment or human health and safety. |
| Water Clause | Use Clause | |
| in WSS | The regulation in the loss of material, by virtue of the characteristics of aquatic ecosystems or by abiotic water characteristics, … | …that can protect people from erosion and mitigates or prevents potential erosion damage to human use, health, or safety. |
| Variable | Score | Description | |
|---|---|---|---|
| Likelihood (l) | Most unlikely | 1 | Very uncommon event—probably will never occur |
| Unlikely | 2 | The event may not occur | |
| Foreseeable | 3 | The event could occur | |
| Likely | 4 | The event has happened before and can probably occur again | |
| Almost certain | 5 | A very common event, occurs regularly | |
| Vulnerability (v) | Insignificant | 1 | The water source is barely vulnerable to a hazardous event |
| Low | 2 | The water source has a very good ability to withstand the effects of the hazardous event | |
| Moderate | 3 | The water source has a good ability to withstand the effects of the hazardous event | |
| High | 4 | The water source has very little ability to withstand the effects of the hazardous event | |
| Extreme | 5 | The water source cannot withstand the effects of the hazardous event | |
| Consequence severity (c) | No consequences | 0 | WSS will not be affected if the hazardous event occurs |
| Insignificant | 1 | Insignificant potential to cause harm to WSS | |
| Minor | 2 | Potential to cause minor discomfort to WSS | |
| Moderate | 3 | Potential to cause a moderate impact on WSS (no long-term consequences) | |
| Major | 4 | Potential to cause a major negative impact on WSS (incl. long-term consequences) | |
| Catastrophic | 5 | Potential to cause a catastrophic negative impact on WSS (incl. long-term consequences) |
| WSS Division and Class | Description (Quantification) | Location | |
|---|---|---|---|
| Provisioning services | Water supply for humans | Municipal drinking water supply (740 m3/day) | 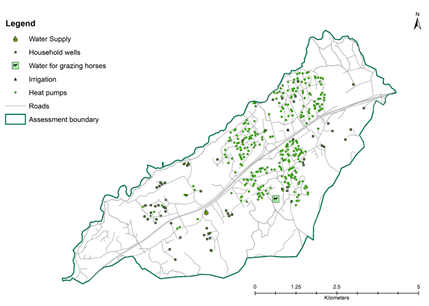 |
| Water for household wells (68 wells) | |||
| Drinking water for animals | Water for grazing horse (1 establishment) | ||
| Irrigation | Irrigation of gardens (1 well) | ||
| Groundwater and surface water as an energy source | Water used for heat pumps (349 wells) | ||
| Regulating services | Prevention of subsidence | Stable groundwater level prevents subsidence of dwellings (95 dwellings on top of clay layer, 573 in total) | 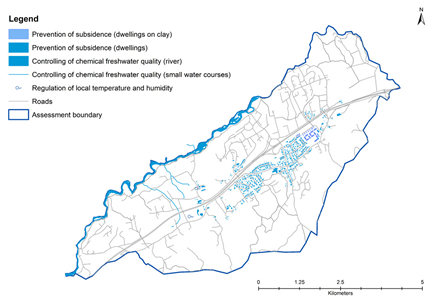 |
| Controlling chemical freshwater quality | Groundwater feeds the nearby river and small watercourses | ||
| Regulation of local temperature and humidity | Springs regulate local temperature and humidity | ||
| Cultural services | Activities promoting health, recuperation, or enjoyment through active, immersive, passive, or observational interactions | Hiking in the area around the spring | 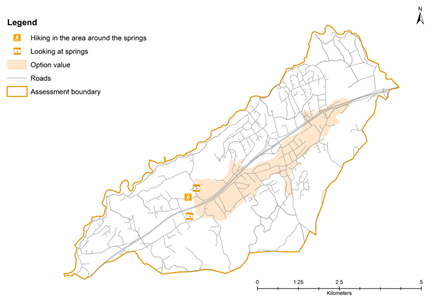 |
| Aesthetic experiences | Looking at springs | ||
| Existence, bequest, or option value | Option value | ||
Publisher’s Note: MDPI stays neutral with regard to jurisdictional claims in published maps and institutional affiliations. |
© 2022 by the authors. Licensee MDPI, Basel, Switzerland. This article is an open access article distributed under the terms and conditions of the Creative Commons Attribution (CC BY) license (https://creativecommons.org/licenses/by/4.0/).
Share and Cite
Gärtner, N.; Lindhe, A.; Wahtra, J.; Söderqvist, T.; Lång, L.-O.; Nordzell, H.; Norrman, J.; Rosén, L. Integrating Ecosystem Services into Risk Assessments for Drinking Water Protection. Water 2022, 14, 1180. https://doi.org/10.3390/w14081180
Gärtner N, Lindhe A, Wahtra J, Söderqvist T, Lång L-O, Nordzell H, Norrman J, Rosén L. Integrating Ecosystem Services into Risk Assessments for Drinking Water Protection. Water. 2022; 14(8):1180. https://doi.org/10.3390/w14081180
Chicago/Turabian StyleGärtner, Nadine, Andreas Lindhe, Julia Wahtra, Tore Söderqvist, Lars-Ove Lång, Henrik Nordzell, Jenny Norrman, and Lars Rosén. 2022. "Integrating Ecosystem Services into Risk Assessments for Drinking Water Protection" Water 14, no. 8: 1180. https://doi.org/10.3390/w14081180
APA StyleGärtner, N., Lindhe, A., Wahtra, J., Söderqvist, T., Lång, L.-O., Nordzell, H., Norrman, J., & Rosén, L. (2022). Integrating Ecosystem Services into Risk Assessments for Drinking Water Protection. Water, 14(8), 1180. https://doi.org/10.3390/w14081180