Comparison of the Engineering Strategies for Low Impact Development in a Densely Populated Old Urban Area
Abstract
:1. Introduction
2. Materials and Methods
2.1. Methodology
2.2. Study Area
2.3. Modeling
2.3.1. Storm Water Management Model
2.3.2. Source of Data and Model Setup
2.3.3. Model Calibration
2.4. Scenario Setting
2.4.1. Rainfall Events
2.4.2. Schemes for Simulation
- (1).
- Bioretention cells
- (2).
- Permeable pavements
- (3).
- Green roofs
- (4).
- Combined schemes
3. Results and Discussion
3.1. Effect of Schemes with Single LID Control
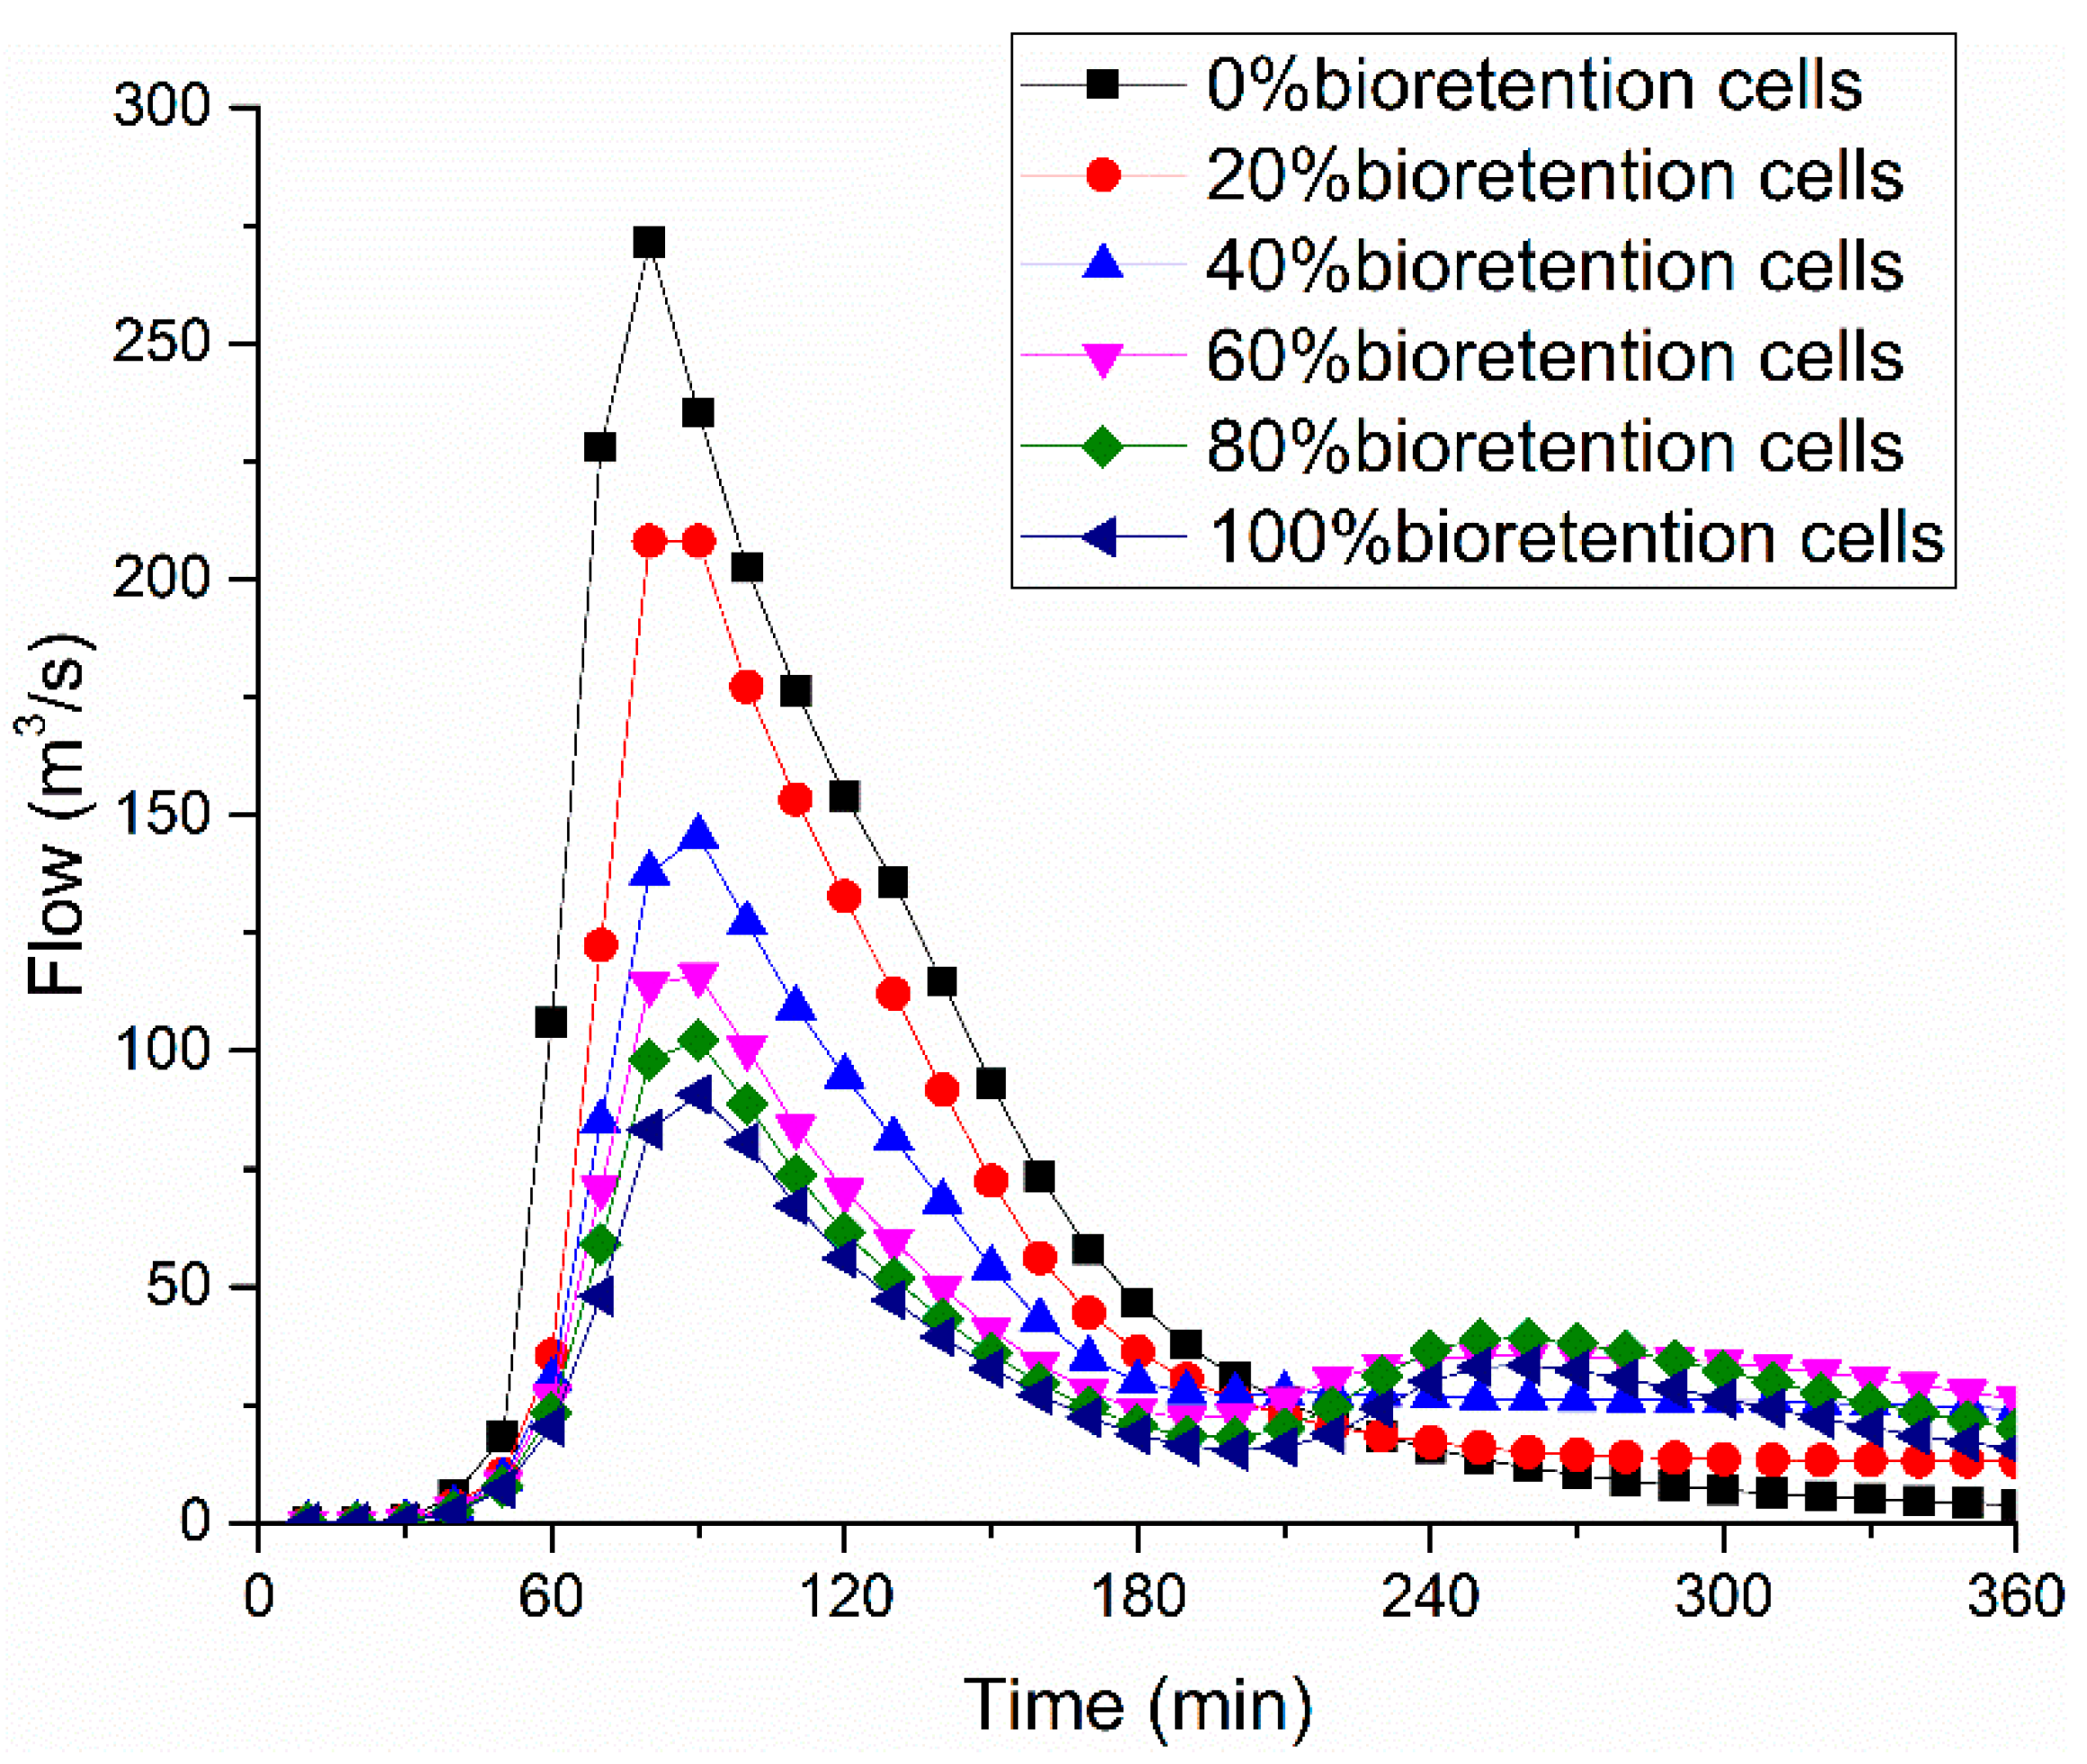
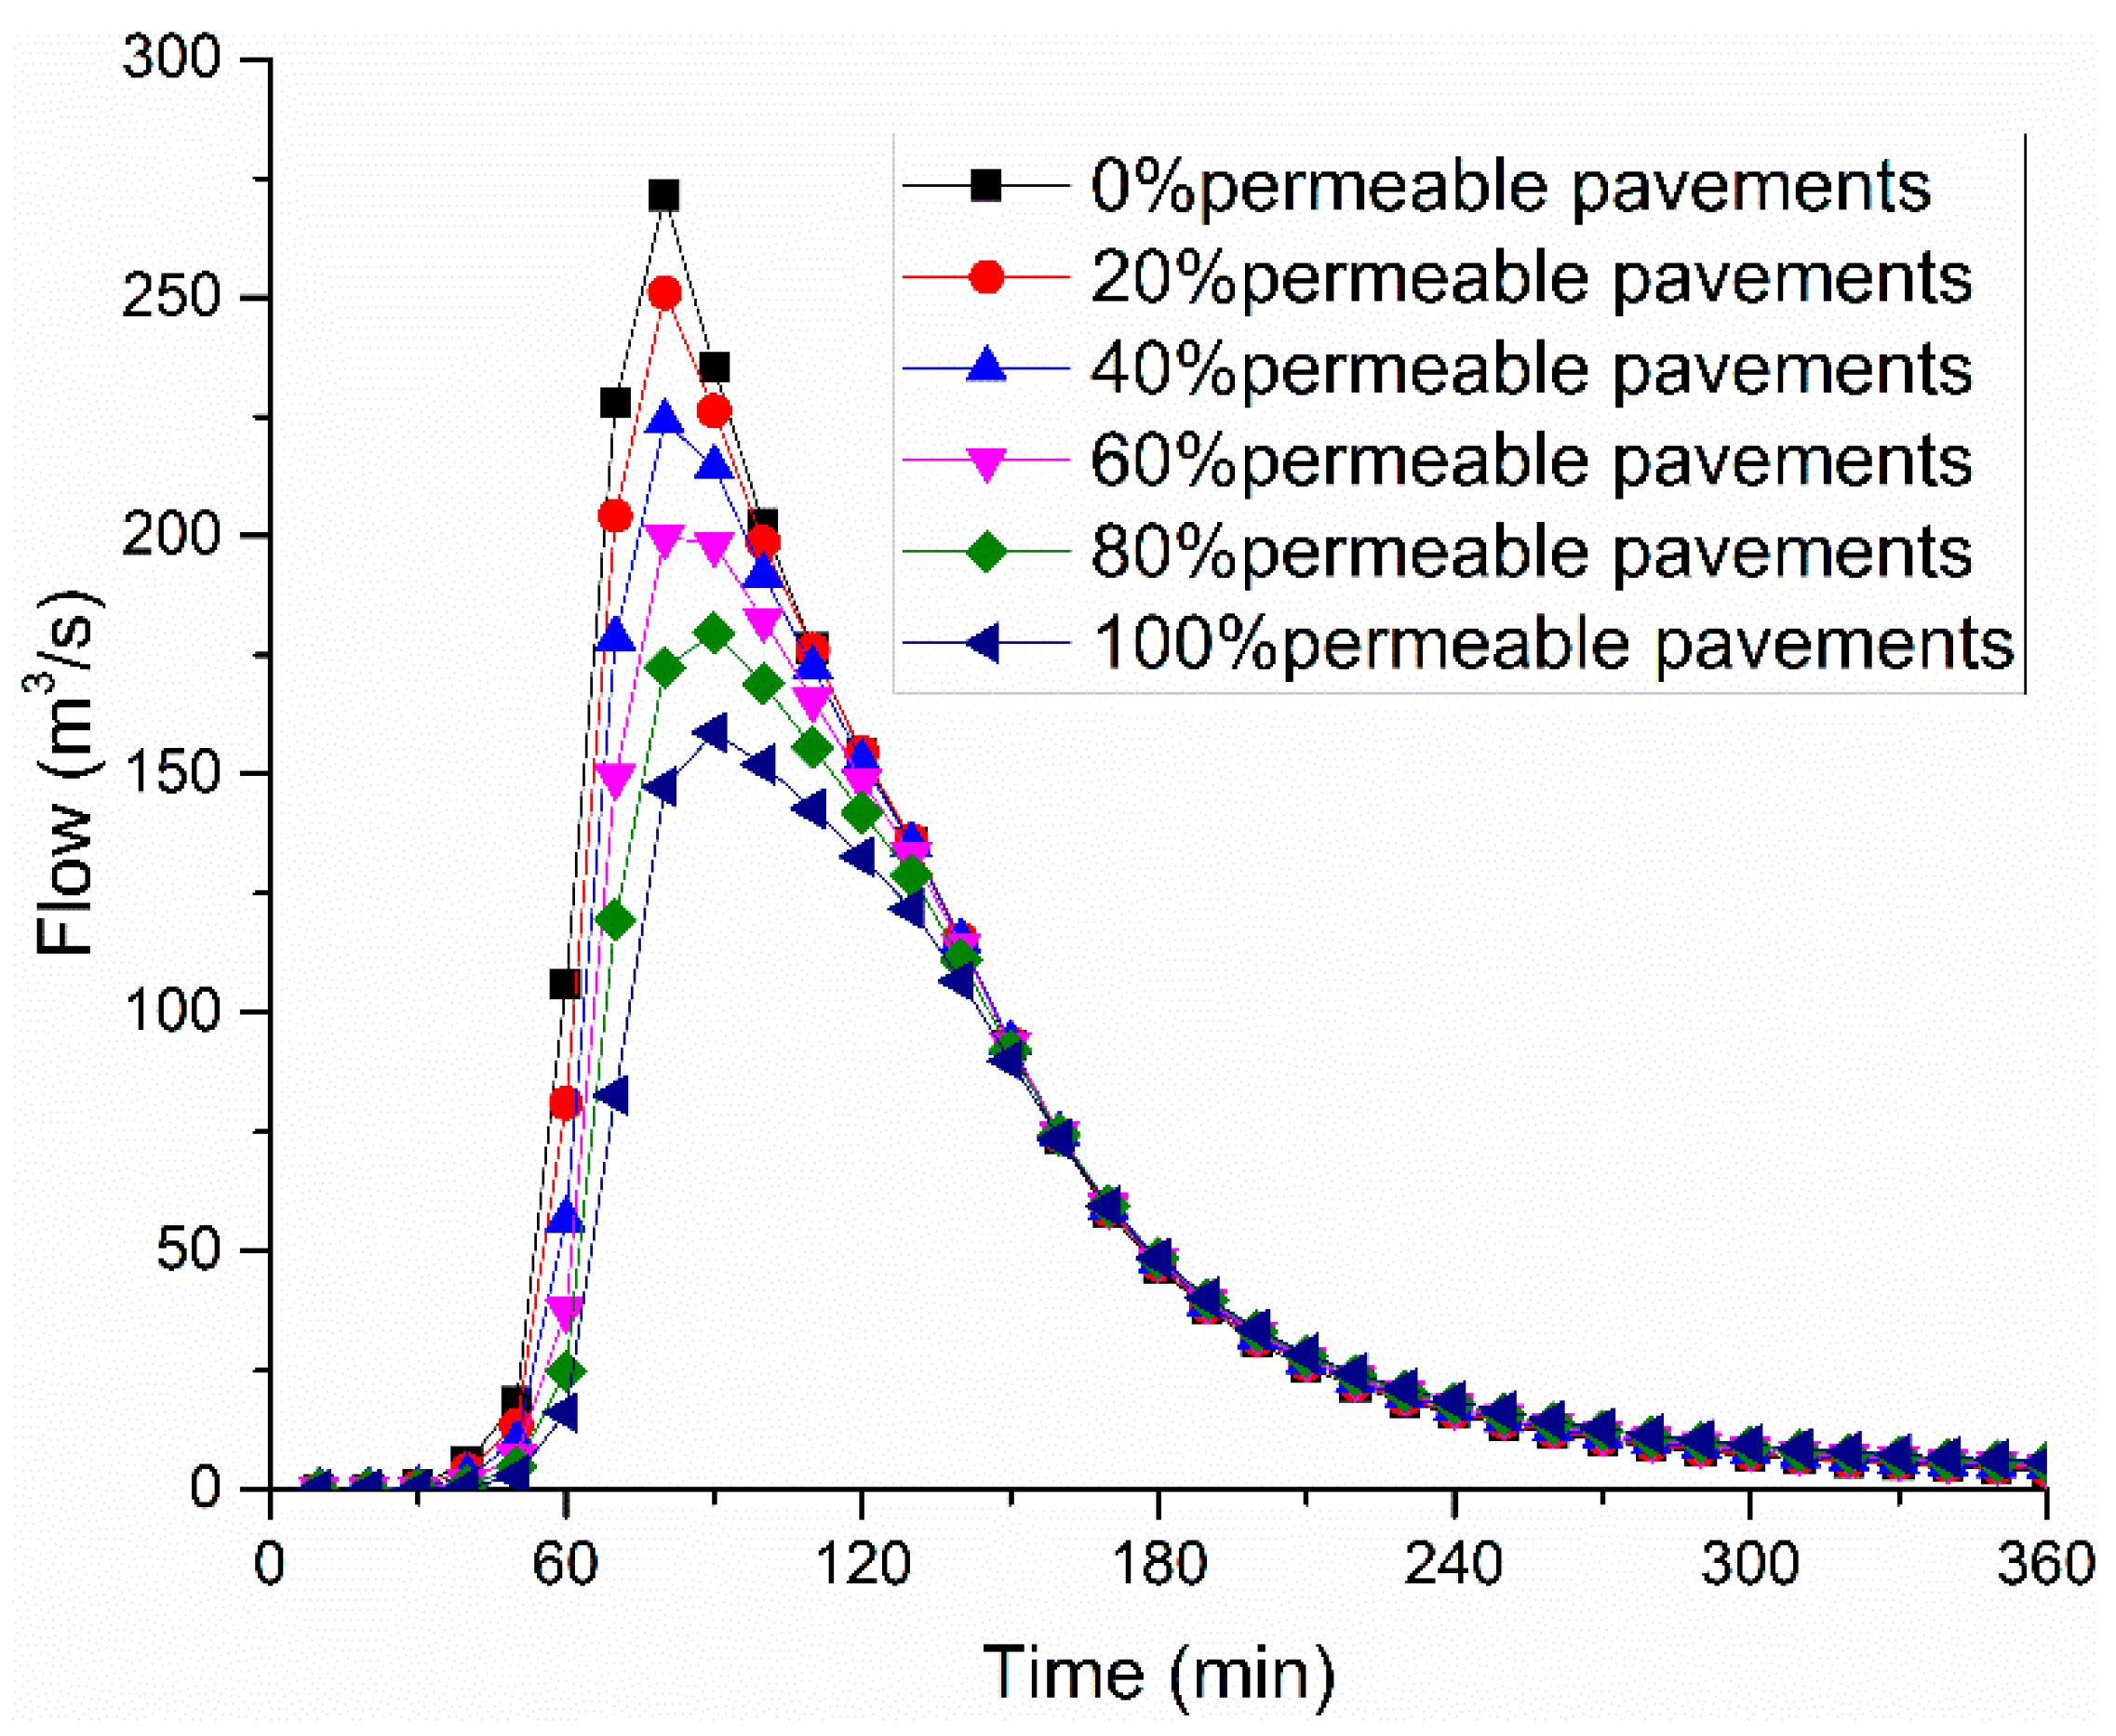
3.1.1. Outlet Flow Process of Schemes with Single LID Control
3.1.2. Waterlogging of Schemes with Single LID Control
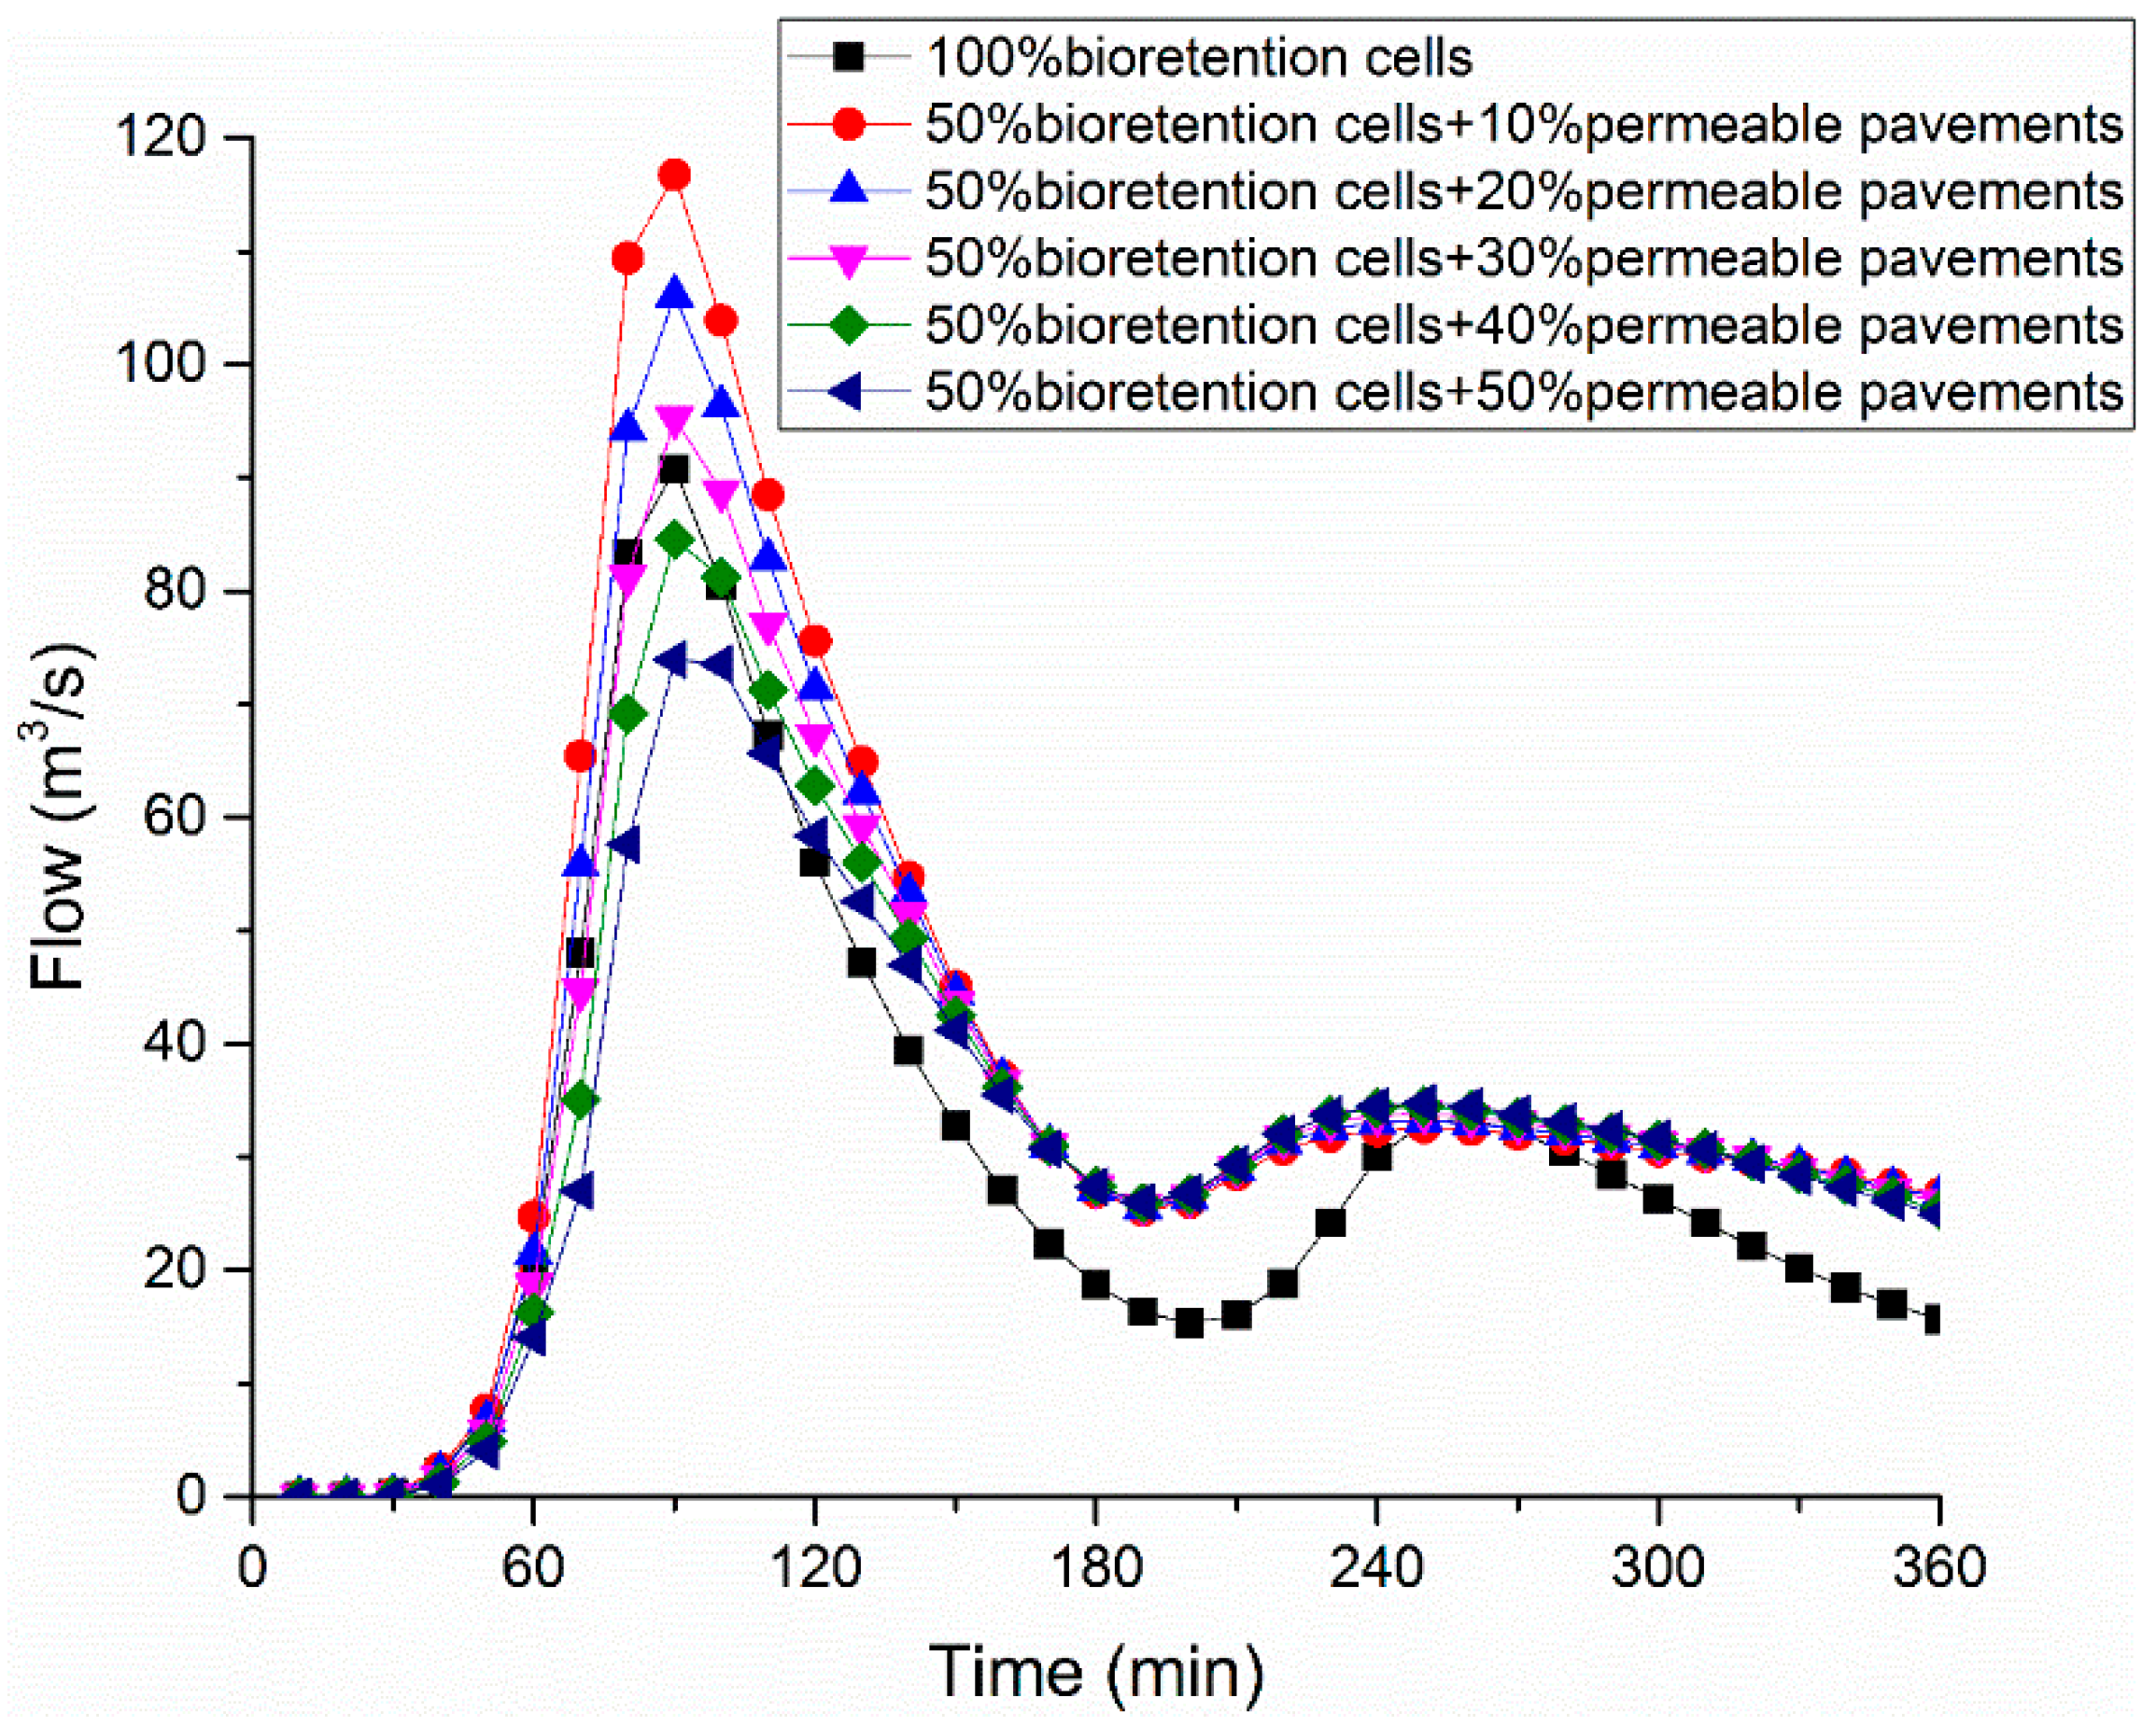
3.2. Effect of Schemes with Combined LID Controls
4. Conclusions
- (1).
- The type of underlying surface in densely populated old urban areas is relatively limited, and the permeable underlying surface is mainly residential green space. Available LID controls mainly include bioretention cells, permeable pavements, and green roofs. Since green roofs have strict restrictions on building roofs and a poor effect on runoff mitigation, the implementation of green roofs in engineering practice may be limited.
- (2).
- Facing rainstorms with a recurrence period of no more than 10 years, bioretention cells and permeable pavements can effectively mitigate runoff caused by rainfall. The effect of bioretention cells is better.
- (3).
- Adjusting the transformation proportion of different LID controls in a combination scheme may reduce the peak value of outlet flow more, lessen more flooding nodes, and occupy less area than schemes with single LID control. Schemes combining different LID controls can achieve better runoff mitigation effects according to local underlying surface conditions.
Author Contributions
Funding
Data Availability Statement
Acknowledgments
Conflicts of Interest
References
- Woltemade, C.J.; Hawkins, T.W.; Jantz, C.; Drzyzga, S. Impact of Changing Climate and Land Cover on Flood Magnitudes in the Delaware River Basin, USA. J. Am. Water Resour. Assoc. 2020, 56, 507–527. [Google Scholar] [CrossRef]
- Nigussie, T.A.; Altunkaynak, A. Modeling the effect of urbanization on flood risk in Ayamama Watershed, Istanbul, Turkey, using the MIKE 21 FM model. Nat. Hazards 2019, 99, 1031–1047. [Google Scholar] [CrossRef]
- Park, K.; Won, J.H. Analysis on distribution characteristics of building use with risk zone classification based on urban flood risk assessment. Int. J. Disaster Risk Reduct. 2019, 38, 10. [Google Scholar] [CrossRef]
- Camilo, M.; Nakahashi, R.T.; Juliani, B.H.T.; Vieira, J.V.; Okawa, C.M.P. Computational modelling of urban drainage network using LID alternatives in a sub-basin in Maringa city, Parana, Brazil. Rev. Electron. Gest. Educ. Technol. Ambient. 2020, 24, 20. [Google Scholar] [CrossRef]
- Lee, J.Y.; Kwon, K.D.; Raza, M. Current water uses, related risks, and management options for Seoul megacity, Korea. Environ. Earth Sci. 2018, 77, 20. [Google Scholar] [CrossRef]
- Prokic, M.; Savic, S.; Pavic, D. Pluvial flooding in Urban Areas across the European Continent. Geogr. Pannonica 2019, 23, 216–232. [Google Scholar] [CrossRef] [Green Version]
- Hamilton, B.; Coops, N.C.; Lokman, K. Time series monitoring of impervious surfaces and runoff impacts in Metro Vancouver. Sci. Total Environ. 2021, 760, 13. [Google Scholar] [CrossRef] [PubMed]
- Deng, S.F.; Ma, S.Y.; Zhang, X.W.; Zhang, S.Q. Integrated Detection of a Complex Underground Water Supply Pipeline System in an Old Urban Community in China. Sustainability 2020, 12, 1670. [Google Scholar] [CrossRef] [Green Version]
- Abbas, A.; Carnacina, I.; Ruddock, F.; Alkhaddar, R.; Rothwell, G.; Andoh, R. An Innovative Method for Installing a Separate Sewer System in Narrow Streets. J. Water Manag. Modelling 2019, 27, 8. [Google Scholar] [CrossRef]
- Karnatz, C.; Thompson, J.R.; Logsdon, S. Capture of stormwater runoff and pollutants by three types of urban best management practices. J. Soil Water Conserv. 2019, 74, 487–499. [Google Scholar] [CrossRef]
- De Macedo, M.B.; do Lago, C.A.F.; Mendiondo, E.M. Stormwater volume reduction and water quality improvement by bioretention: Potentials and challenges for water security in a subtropical catchment. Sci. Total Environ. 2019, 647, 923–931. [Google Scholar] [CrossRef] [PubMed]
- Tiwari, A.; Kumar, P.; Kalaiarasan, G.; Ottosen, T.-B. The impacts of existing and hypothetical green infrastructure scenarios on urban heat island formation. Environ. Pollut. 2021, 274, 115898. [Google Scholar] [CrossRef] [PubMed]
- Morash, J.; Wright, A.; LeBleu, C.; Meder, A.; Kessler, R.; Brantley, E.; Howe, J. Increasing Sustainability of Residential Areas Using Rain Gardens to Improve Pollutant Capture, Biodiversity and Ecosystem Resilience. Sustainability 2019, 11, 3269. [Google Scholar] [CrossRef] [Green Version]
- Ma, Y.C.; Jiang, Y.; Swallow, S. China’s sponge city development for urban water resilience and sus-tainability: A policy discussion. Sci. Total Environ. 2020, 729, 7. [Google Scholar] [CrossRef] [PubMed]
- Huang, W.; Lin, W.; Huang, L.; Weng, H.; Huang, P.; Xia, Q.Y. Discussion of application of low impact development technology in the construction of sponge city in China. Desalin. Water Treat. 2020, 188, 297–302. [Google Scholar] [CrossRef]
- Kumar, P.; Debele, S.E.; Sahani, J.; Rawat, N.; Marti-Cardona, B.; Alfieri, S.M.; Basu, B.; Basu, A.S.; Bowyer, P.; Charizopoulos, N.; et al. Nature-based solutions efficiency evaluation against natural hazards: Modelling methods, advantages and limitations. Sci. Total Environ. 2021, 784, 27. [Google Scholar] [CrossRef] [PubMed]
- Mobilia, M.; Longobardi, A. Impact of rainfall properties on the performance of hydrological models for green roofs simulation. Water Sci. Technol. 2020, 81, 1375–1387. [Google Scholar] [CrossRef]
- Broekhuizen, I.; Sandoval, S.; Gao, H.X.; Mendez-Rios, F.; Leonhardt, G.; Bertrand-Krajewski, J.L.; Viklander, M. Performance comparison of green roof hydrological models for full-scale field sites. J. Hydrol. X 2021, 12, 18. [Google Scholar] [CrossRef]
- Xu, C.; Rahman, M.; Haase, D.; Wu, Y.P.; Su, M.R.; Pauleit, S. Surface runoff in urban areas: The role of residential cover and urban growth form. J. Clean Prod. 2020, 262, 11. [Google Scholar] [CrossRef]
- Cai, J. Local Chronicles of Jiang’an District; Wuhan Publishing House: Wuhan, China, 2009. (In Chinese) [Google Scholar]
- Khaleghi, E.; Sadoddin, A.; Najafinejad, A.; Bahremand, A. Flood hydrograph simulation using the SWMM model: A semiarid zone watershed case study, Shiraz Khoshk River, Iran. Nat. Resour. Model. 2020, 33, 11. [Google Scholar] [CrossRef]
- Dell, T.; Razzaghmanesh, M.; Sharvelle, S.; Arabi, M. Development and Application of a SWMM-Based Simulation Model for Municipal Scale Hydrologic Assessments. Water 2021, 13, 1644. [Google Scholar] [CrossRef]
- Rossman, L.A. Storm Water Management Model User’s Manual Version 5.1—Manual; EPA/600/R-14/413 (NTIS EPA/600/R-14/413b); US EPA Office of Research and Development: Washington, DC, USA, 2015.
- Rosa, D.W.B.; Nascimento, N.O.; Moura, P.M.; Macedo, G.D. Assessment of the hydrological response of an urban watershed to rainfall-runoff events in different land use scenarios—Belo Horizonte, MG, Brazil. Water Sci. Technol. 2020, 81, 679–693. [Google Scholar] [CrossRef]
- Iffland, R.; Forster, K.; Westerholt, D.; Pesci, M.H.; Losken, G. Robust Vegetation Parameterization for Green Roofs in the EPA Stormwater Management Model (SWMM). Hydrology 2021, 8, 12. [Google Scholar] [CrossRef]
- Bae, C.; Lee, D.K. Effects of low-impact development practices for flood events at the catchment scale in a highly developed urban area. Int. J. Disaster Risk Reduct. 2020, 44, 8. [Google Scholar] [CrossRef]
- Goncalves, M.L.R.; Zischg, J.; Rau, S.; Sitzmann, M.; Rauch, W.; Kleidorfer, M. Modeling the Effects of Introducing Low Impact Development in a Tropical City: A Case Study from Joinville, Brazil. Sustainability 2018, 10, 728. [Google Scholar] [CrossRef] [Green Version]
- Ren, J.; Liang, X.; Tao, T.; Xin, K.; Yan, H. Calculation and Parameter Analysis of Time of Concentration Based on Kinematic Wave Equation. China Water Wastewater 2019, 35, 118–122. [Google Scholar]
- Juan, A.; Hughes, C.; Fang, Z.; Bedient, P. Hydrologic Performance of Watershed-Scale Low-Impact Development in a High-Intensity Rainfall Region. J. Irrig. Drainage Eng. 2017, 143, 11. [Google Scholar] [CrossRef]


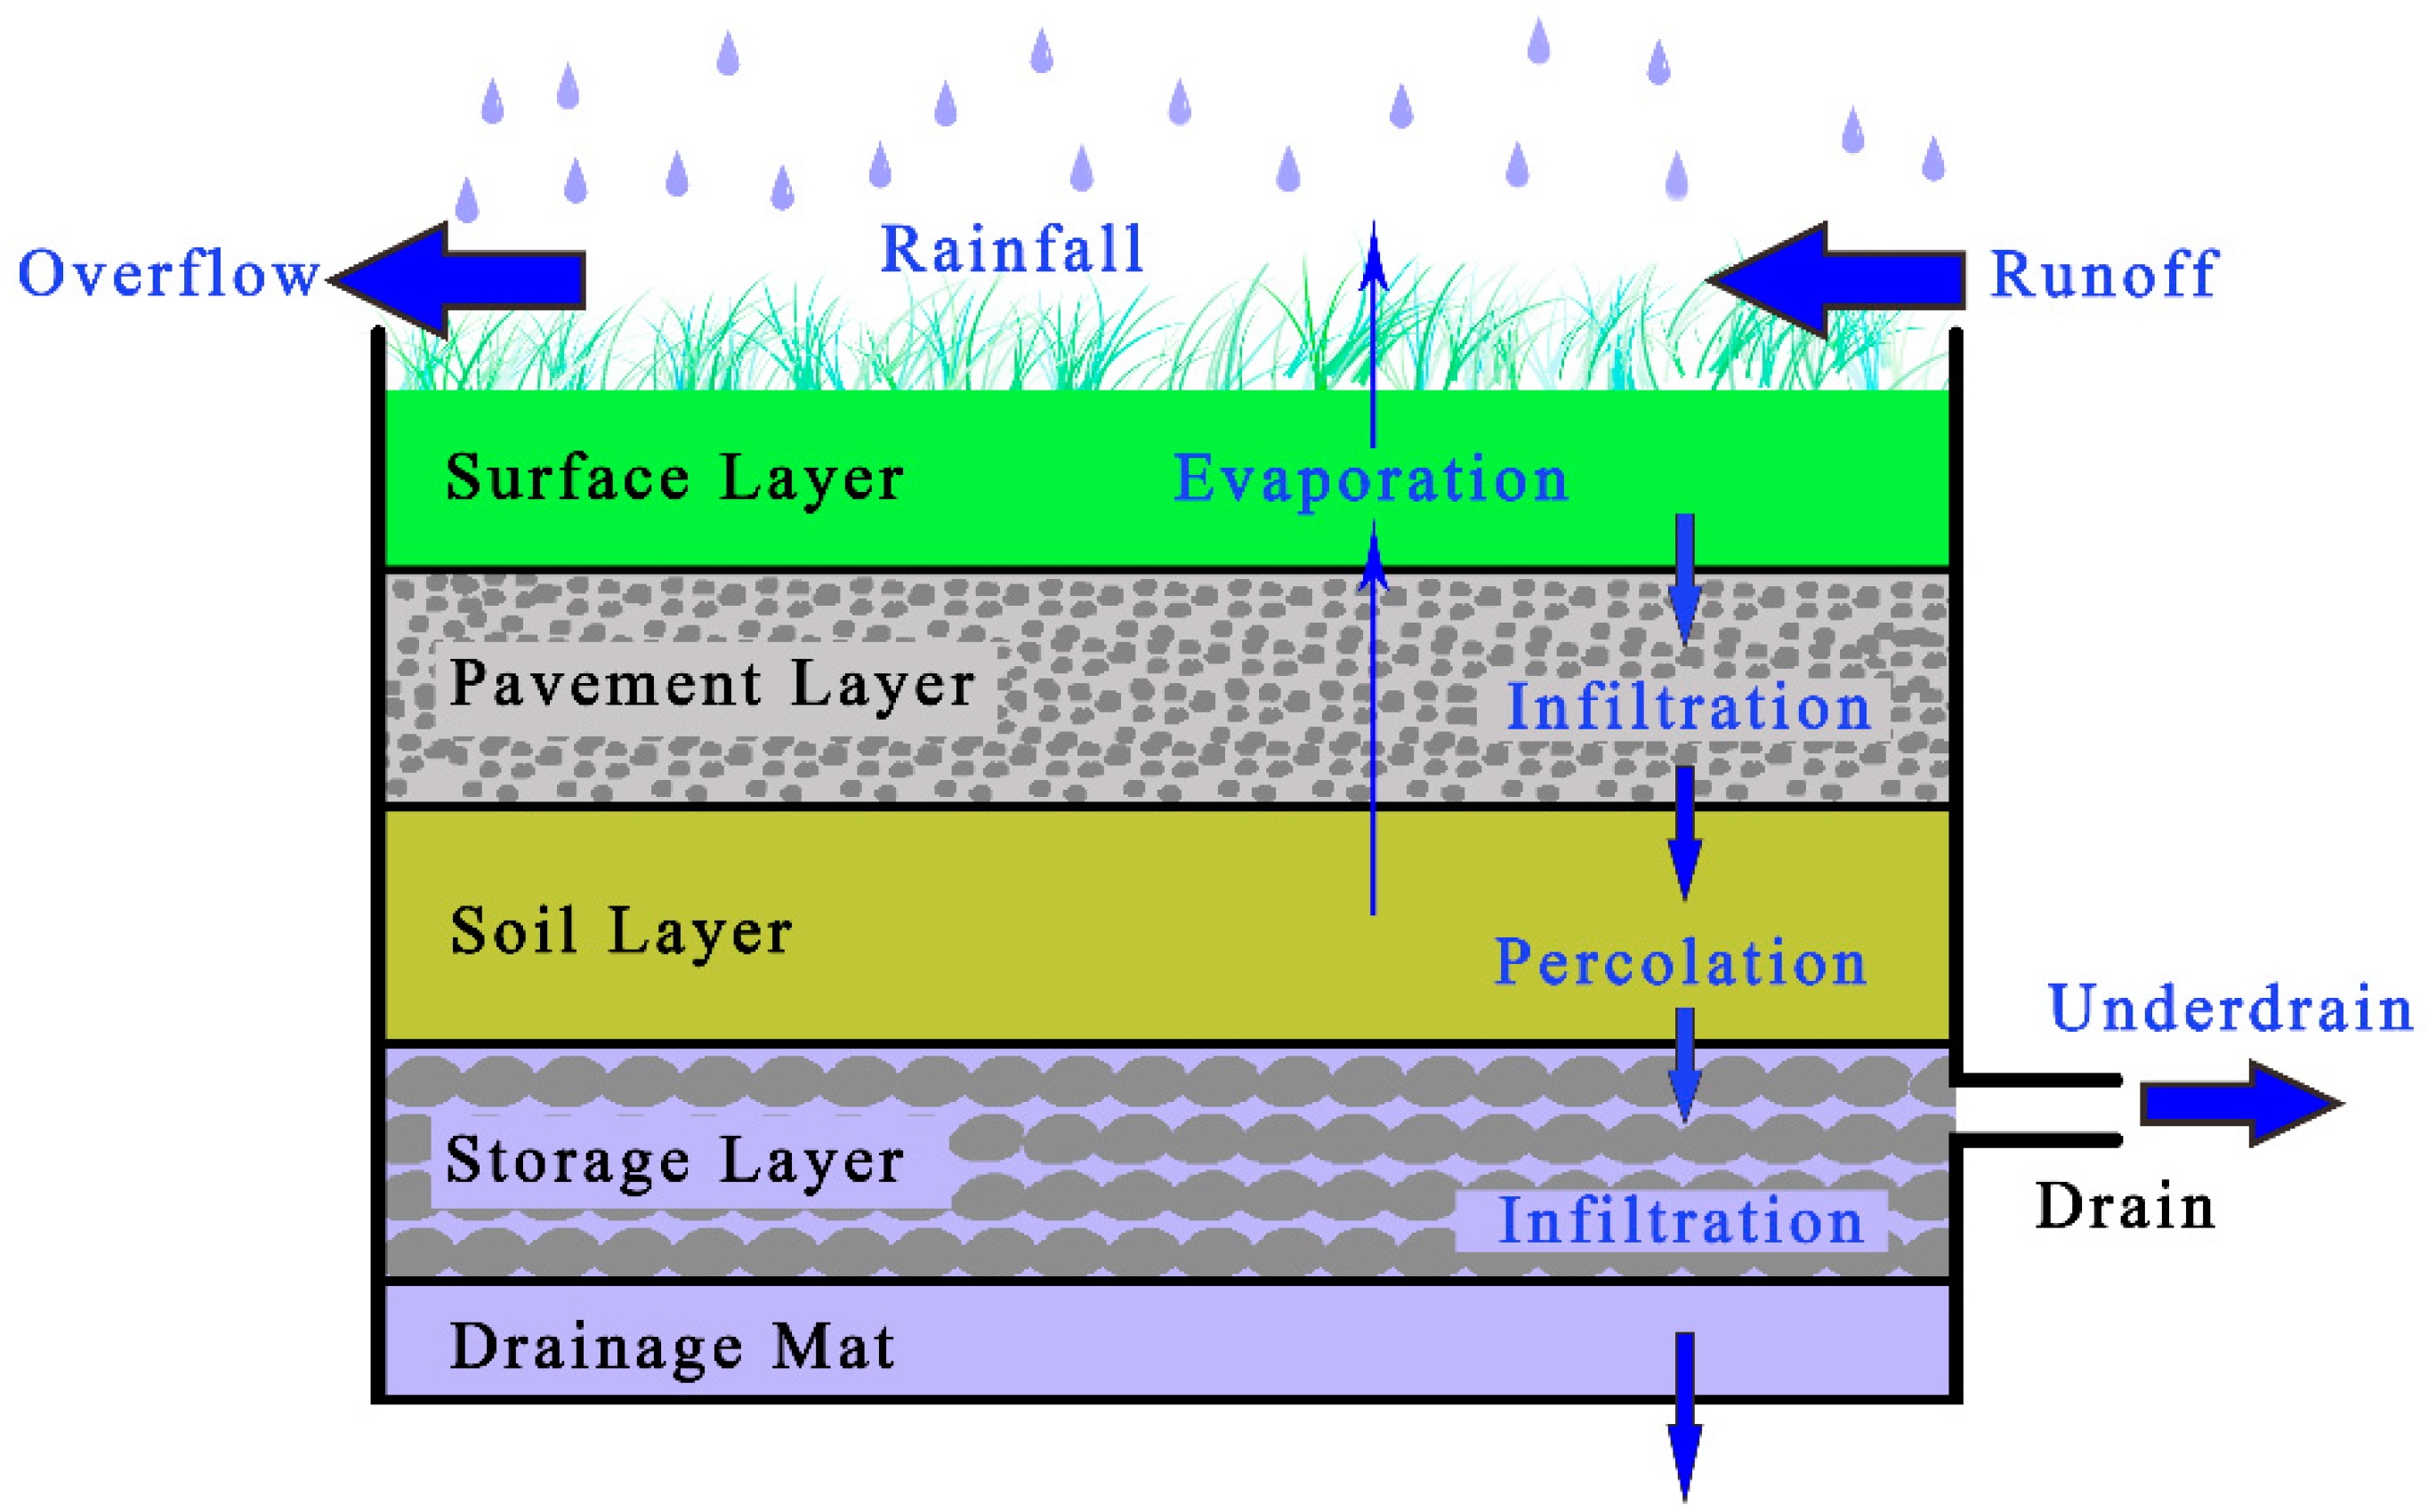
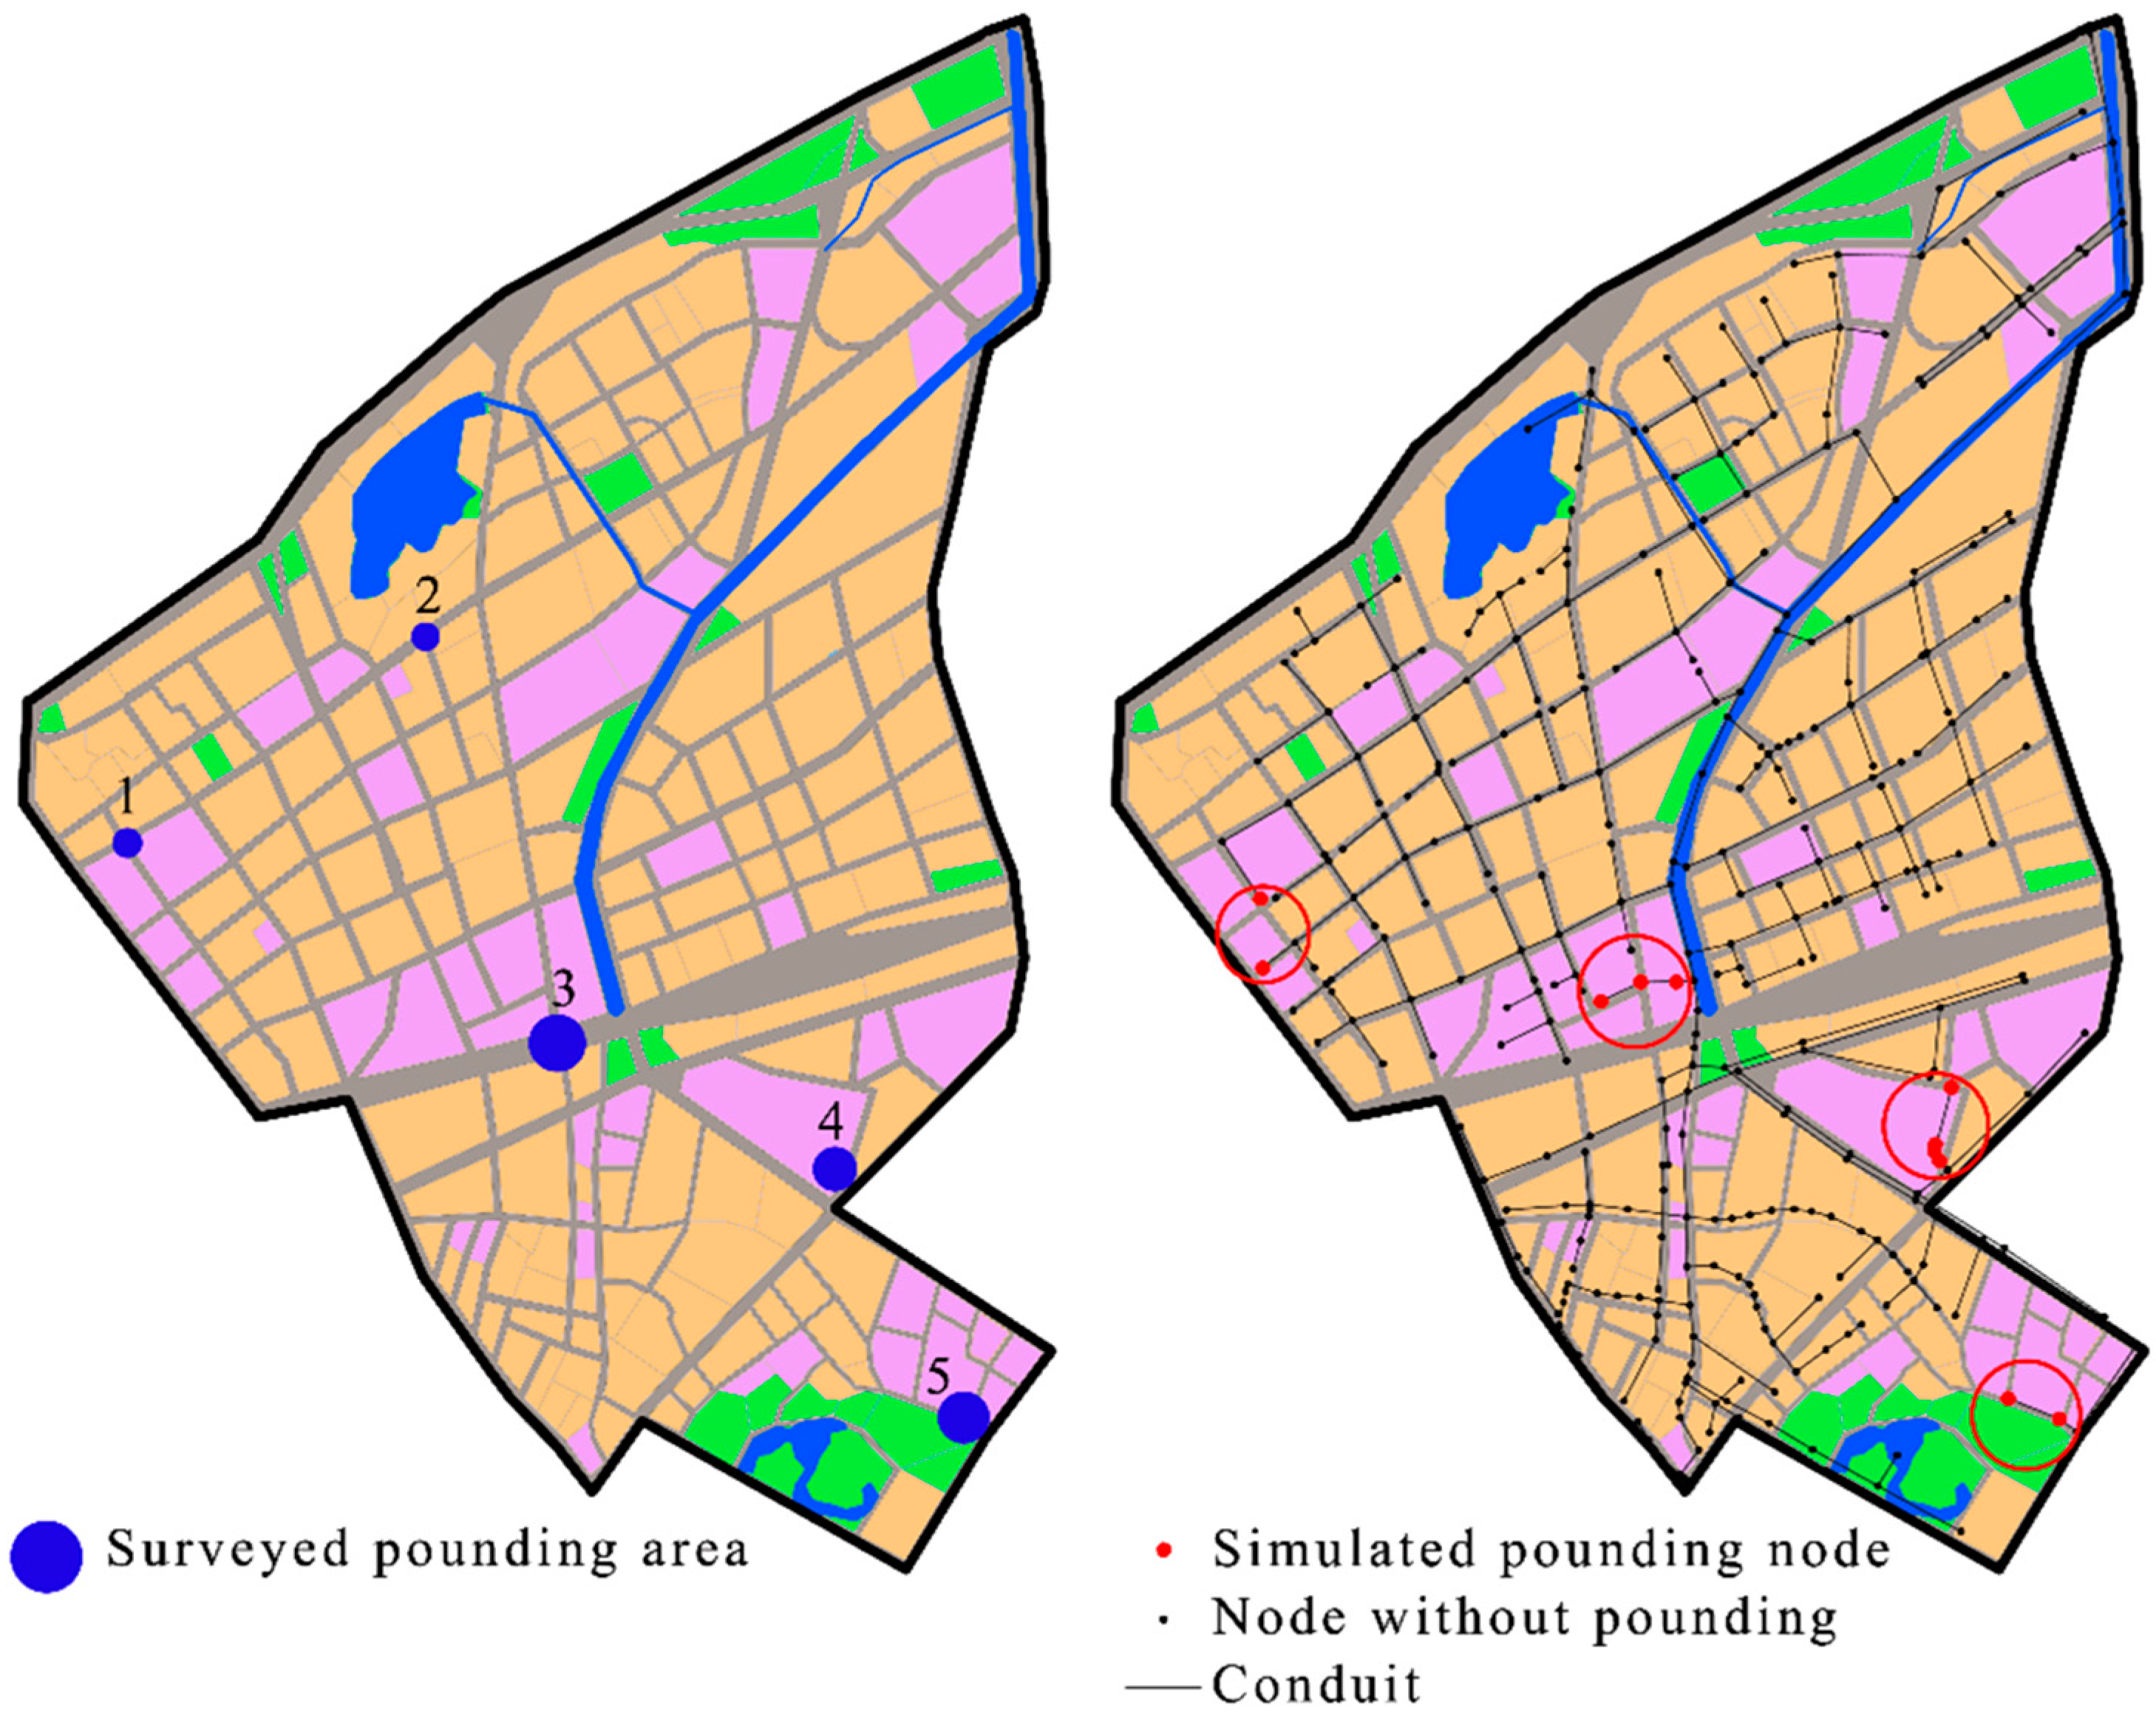
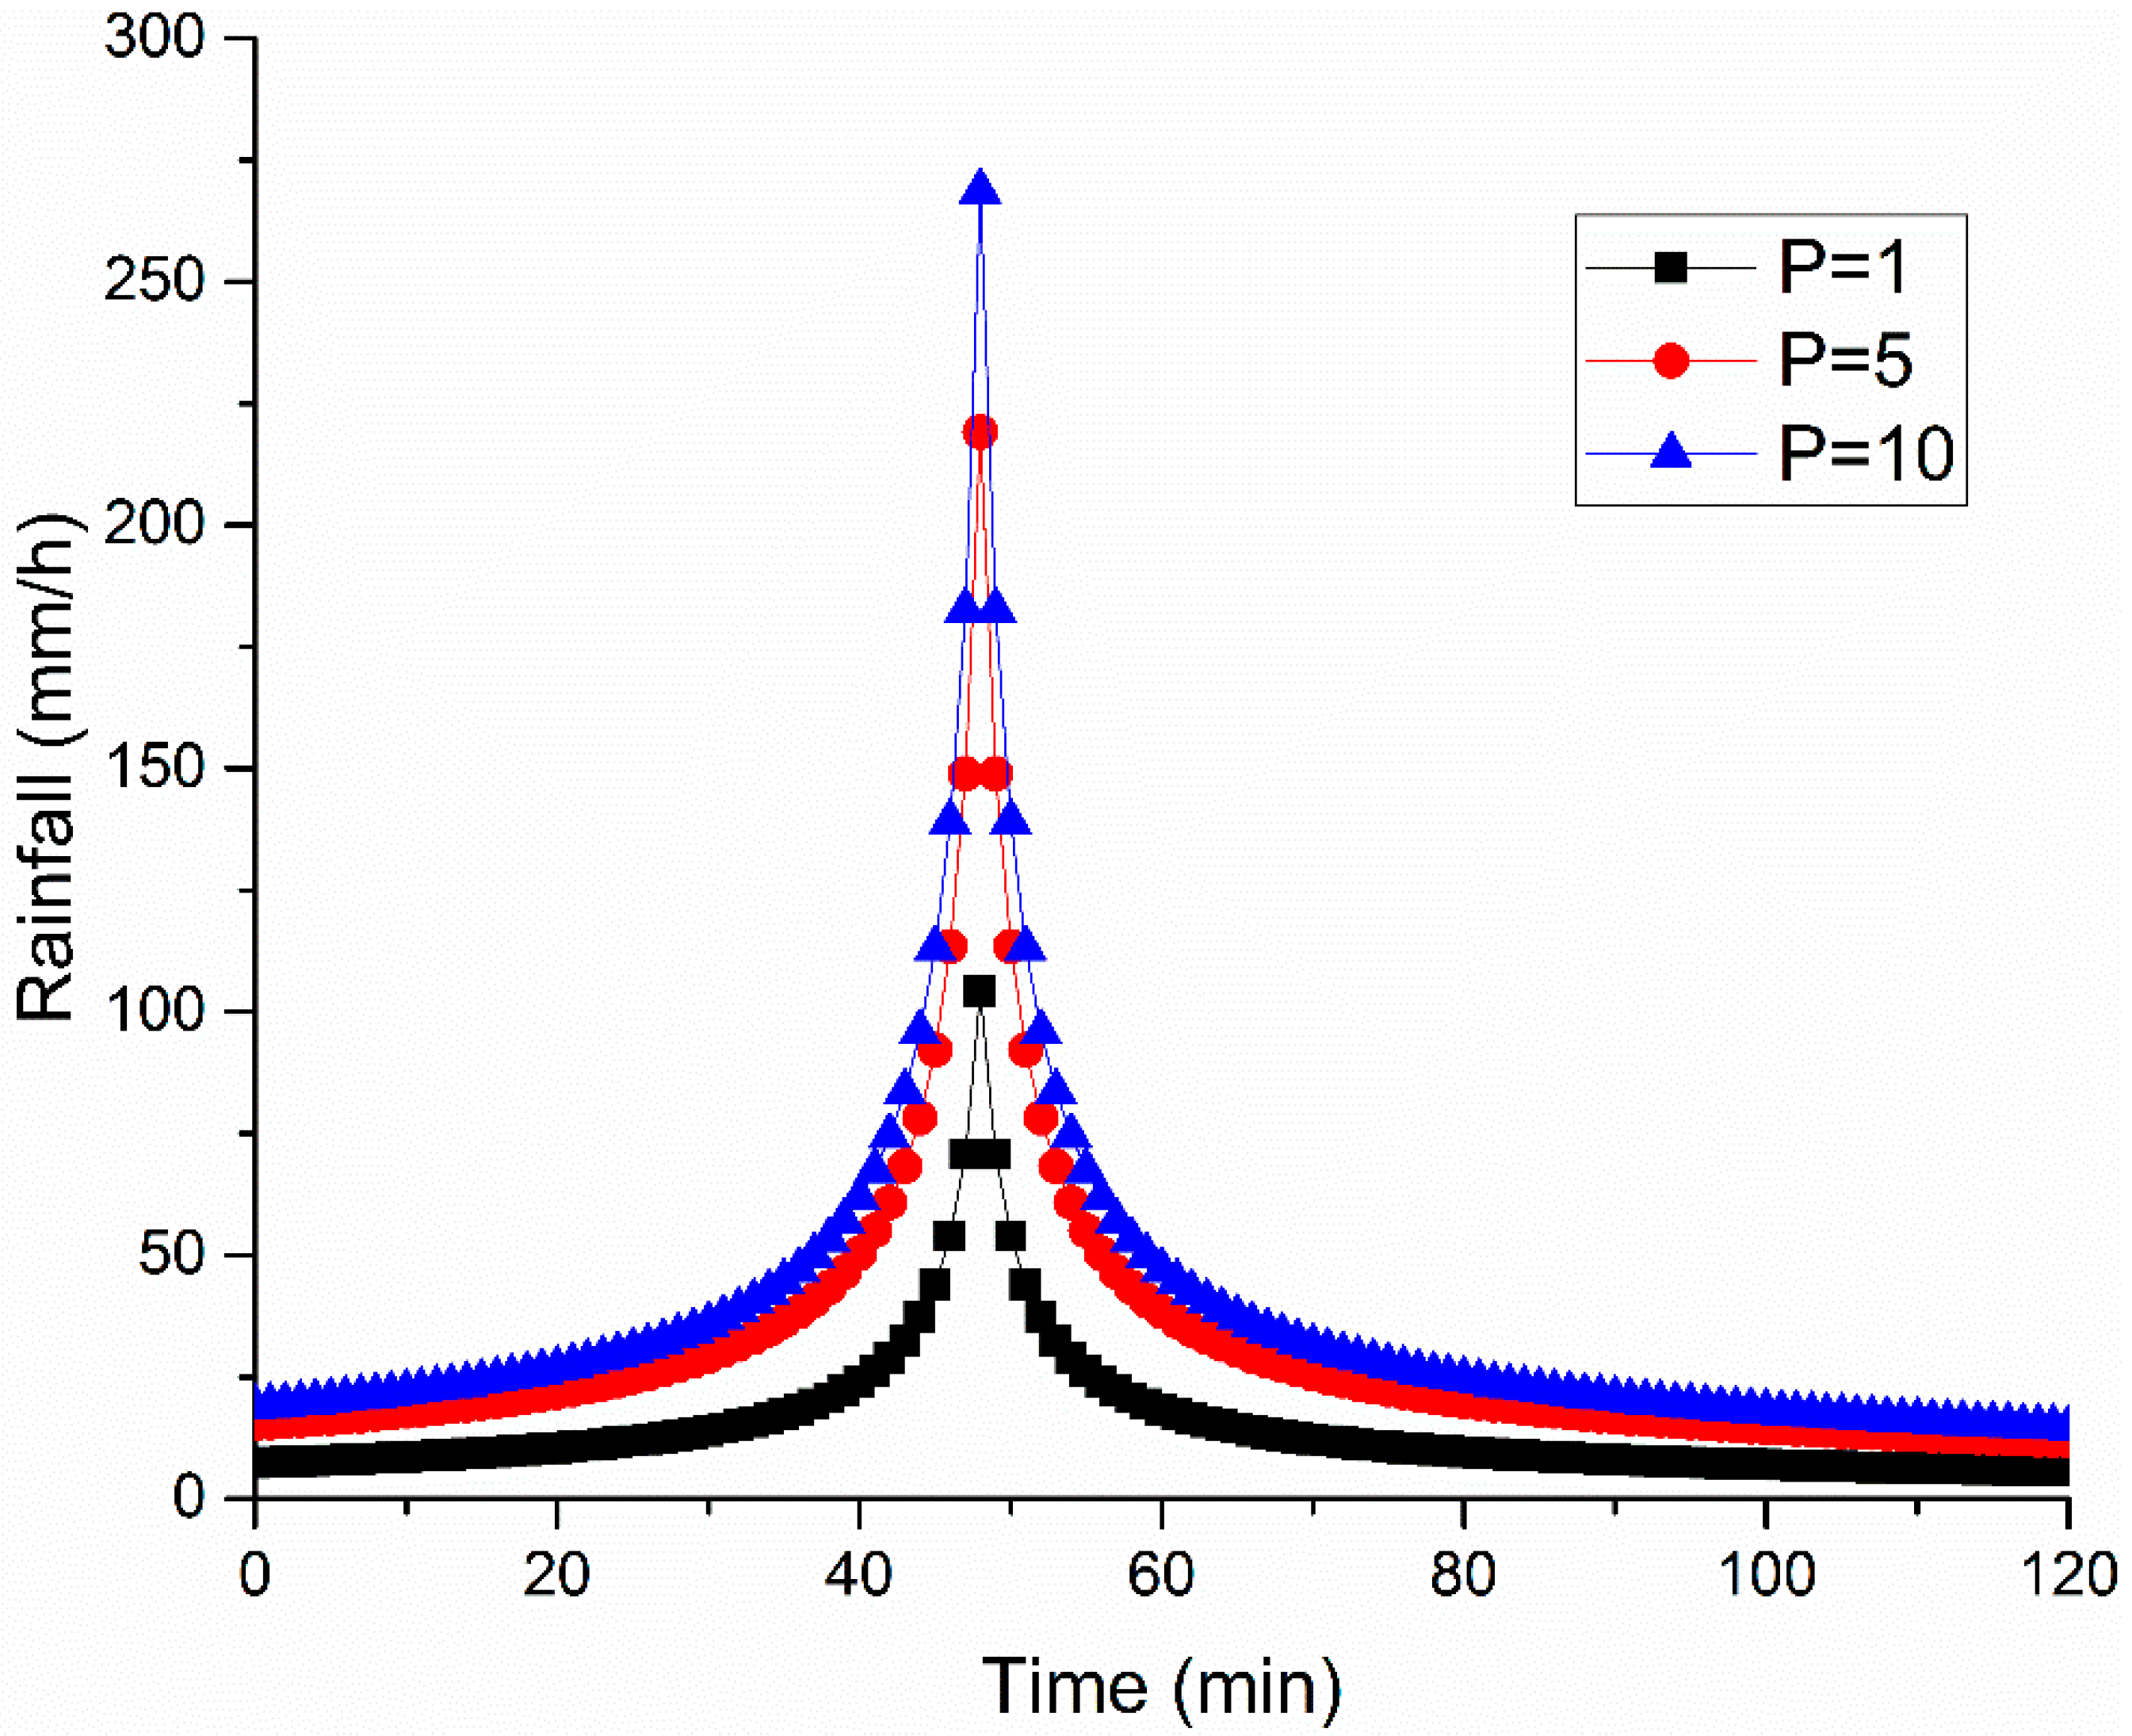

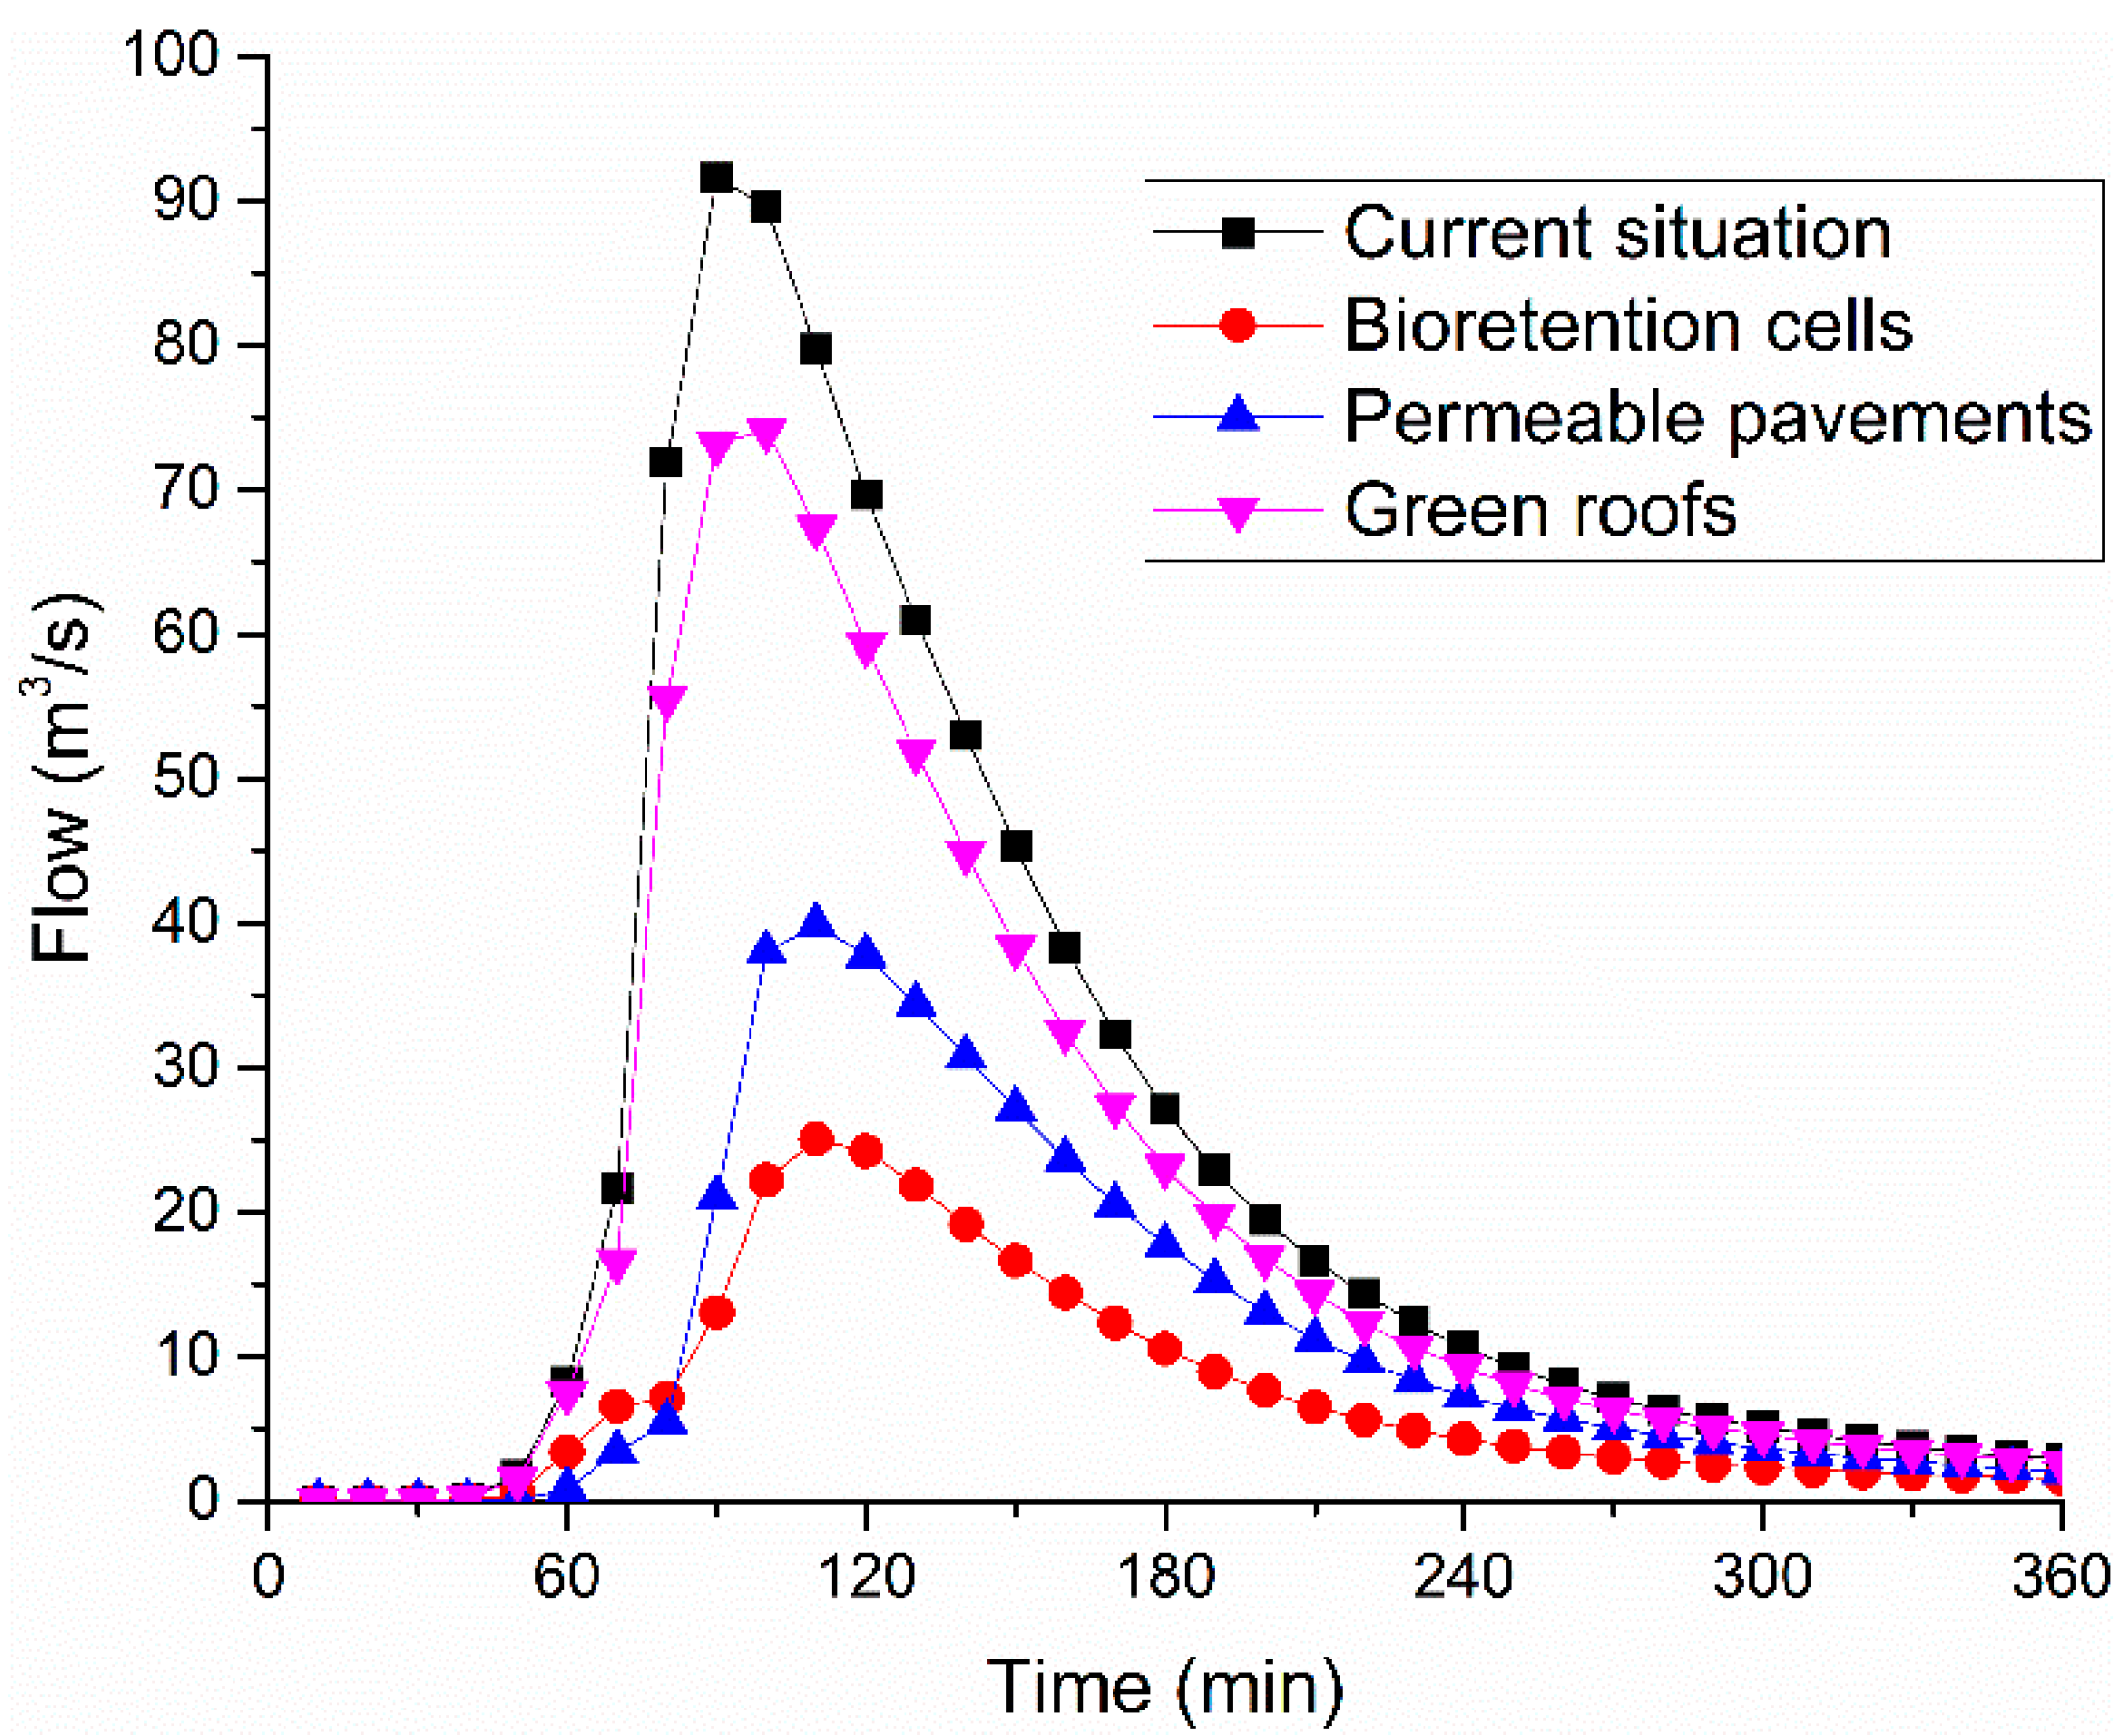



| LID Control | Surface | Pavement | Soil | Storage | Drain | Drainage Mat |
|---|---|---|---|---|---|---|
| Bioretention cell | √ a | √ | ○ b | ○ | ||
| Rain garden | √ | √ | ||||
| Green roof | √ | √ | √ | |||
| Permeable pavement | √ | √ | ○ | √ | ○ | |
| Infiltration trench | √ | √ | ○ | |||
| Rain barrel | √ | √ | ||||
| Roof disconnection | √ | √ | ||||
| Vegetative Swale | √ |
| Objects | Parameter | Description (Units) | Value |
|---|---|---|---|
| Sub-catchment | N-Imperv | Manning’s n for impervious area | 0.01 |
| N-Perv | Manning’s n for pervious area | 0.15 | |
| Dstore-Imperv | Depth of depression storage on impervious area (mm) | 0.05 | |
| Dstore-Perv | Depth of depression storage on pervious area (mm) | 3 | |
| % Zero-Imperv | Percent of the impervious area with no depression storage (%) | 25 | |
| Infiltration | Max. Infil. Rate | Maximum infiltration rate on the Horton curve (mm/h) | 3 |
| Min. Infil. Rate | Minimum infiltration rate on the Horton curve (mm/h) | 0.5 | |
| Decay Const. | Infiltration rate decay constant for the Horton curve (1/h) | 4 | |
| Drying Time | Time in days for a fully saturated soil to dry completely | 7 | |
| Conduit | Roughness | Manning’s roughness coefficient | 0.015 |
| Node | Frequency | Ponded Depth (m) |
Ponded Area (m2) |
Flood Volume (m3) |
Simulated Flood Volume (m3) |
|---|---|---|---|---|---|
| 1 | Every year | 0.1~0.3 | 1200 | 120~360 | - |
| 2 | Every year | 0.1~0.3 | 1500 | 150~450 | 361 |
| 3 | Every year | 0.4~0.6 | 3000 | 1200~1800 | 1562 |
| 4 | Every year | 0.4~0.6 | 2000 | 800~1200 | 920 |
| 5 | Every year | 0.1~0.3 | 3000 | 300~900 | 530 |
| Underlying Surface | Area (ha) | Proportion |
|---|---|---|
| Green spaces | 821.88 | 37.79% |
| Water | 75.88 | 3.49% |
| Roofs | 500.62 | 23.02% |
| Municipal pavements | 370.82 | 17.05% |
| Other impervious surfaces | 405.79 | 18.66% |
| Layers | Parameters (Units) | Bioretention Cells | Permeable Pavement | Green Roof |
|---|---|---|---|---|
| Surface | Berm height (mm) | 150 | 0 | 0 |
| Vegetative volume fraction | 0.1 | 0 | 0 | |
| Surface roughness | 0 | 0.13 | 0.15 | |
| Surface slope (%) | 0 | 0.2 | 5 | |
| Pavement | Thickness (mm) | NA | 150 | NA * |
| Void ratio | NA | 0.16 | NA | |
| Impervious surface fraction | NA | 0 | NA | |
| Permeability (mm/h) | NA | 120 | NA | |
| Clogging factor | NA | 0 | NA | |
| Regeneration interval (days) | NA | 0 | NA | |
| Regeneration fraction | NA | 0 | NA | |
| Soil | Thickness (mm) | 300 | 300 | 150 |
| Porosity | 0.5 | 0.45 | 0.45 | |
| Field capacity | 0.2 | 0.19 | 0.19 | |
| Wilting point | 0.1 | 0.085 | 0.085 | |
| Conductivity (mm/h) | 30 | 120 | 11 | |
| Conductivity slope | 45 | 45 | 45 | |
| Suction head(mm) | 3.5 | 110 | 110 | |
| Storage | Thickness (mm) | 300 | 300 | NA |
| Void ratio | 0.75 | 0.75 | NA | |
| Seepage rate (mm/h) | 0 | 0 | NA | |
| Clogging factor | 0 | 0 | NA | |
| Drain | Flow coefficient | 25 | 30 | NA |
| Flow exponent | 0.5 | 0.5 | NA | |
| Offset (mm) | 0 | 0 | NA | |
| Drainage Mat | Thickness (mm) | NA | NA | 3 |
| Void faction | NA | NA | 0.5 | |
| Roughness | NA | NA | 0.1 |
| Rainfall | Current Situation | Bioretention Cells | Permeable Pavements | Green Roofs | |
|---|---|---|---|---|---|
| Number of nodes | P = 1 | 12 | 6 | 3 | 11 |
| P = 5 | 209 | 17 | 36 | 193 | |
| P = 10 | 232 | 31 | 94 | 225 | |
| Flooding volume (m3) | P = 1 | 4091 | 60 | 42 | 1546 |
| P = 5 | 72,074 | 6522 | 4058 | 56,404 | |
| P = 10 | 156,611 | 13,649 | 14,145 | 138,869 |
| Schemes | Construction Area (ha) |
Number of Flooding Nodes |
Flood Volume (m3) |
|---|---|---|---|
| 100% bioretention cells | 821.88 | 31 | 13,649 |
| 50% bioretention cells + 10% permeable pavements | 451.52 | 54 | 17,480 |
| 50% bioretention cells + 20% permeable pavements | 492.10 | 33 | 14,337 |
| 50% bioretention cells + 30% permeable pavements | 532.68 | 28 | 11,658 |
| 50% bioretention cells + 40% permeable pavements | 573.26 | 21 | 9432 |
| 50% bioretention cells + 50% permeable pavements | 613.84 | 20 | 7595 |
Publisher’s Note: MDPI stays neutral with regard to jurisdictional claims in published maps and institutional affiliations. |
© 2022 by the authors. Licensee MDPI, Basel, Switzerland. This article is an open access article distributed under the terms and conditions of the Creative Commons Attribution (CC BY) license (https://creativecommons.org/licenses/by/4.0/).
Share and Cite
Shang, Y.; Guan, Y.; Tang, Z.; Fang, Z. Comparison of the Engineering Strategies for Low Impact Development in a Densely Populated Old Urban Area. Water 2022, 14, 1149. https://doi.org/10.3390/w14071149
Shang Y, Guan Y, Tang Z, Fang Z. Comparison of the Engineering Strategies for Low Impact Development in a Densely Populated Old Urban Area. Water. 2022; 14(7):1149. https://doi.org/10.3390/w14071149
Chicago/Turabian StyleShang, Yu, Yuxi Guan, Zhi Tang, and Zheng Fang. 2022. "Comparison of the Engineering Strategies for Low Impact Development in a Densely Populated Old Urban Area" Water 14, no. 7: 1149. https://doi.org/10.3390/w14071149
APA StyleShang, Y., Guan, Y., Tang, Z., & Fang, Z. (2022). Comparison of the Engineering Strategies for Low Impact Development in a Densely Populated Old Urban Area. Water, 14(7), 1149. https://doi.org/10.3390/w14071149


