Article

Vulnerability and Risk Assessment to Climate Change in Sagar Island, India

1
Centre for Climate Change and Water Research, Suresh Gyan Vihar University, Jaipur 302017, India
2
Department of Ecology, Environment and Remote Sensing, Government of Jammu and Kashmir, Srinagar 190018, India
3
Centre for Sustainable Development, Suresh Gyan Vihar University, Jaipur 302017, India
4
Department of Geography, Delhi School of Economics, University of Delhi, Delhi 110007, India
5
Institute for Global Environmental Strategies, Hayama 240-0115, Kanagawa, Japan
*
Authors to whom correspondence should be addressed.
Water 2022, 14(5), 823; https://doi.org/10.3390/w14050823
Submission received: 21 January 2022 / Revised: 24 February 2022 / Accepted: 2 March 2022 / Published: 6 March 2022

Abstract

:
Inhabitants of low-lying islands face increased threats due to climate change as a result of their higher exposure and lesser adaptive capacity. Sagar Island, the largest inhabited estuarine island of Sundarbans, is experiencing severe coastal erosion, frequent cyclones, flooding, storm surges, and breaching of embankments, resulting in land, livelihood, and property loss, and the displacement of people at a huge scale. The present study assessed climate change-induced vulnerability and risk for Sagar Island, India, using an integrated geostatistical and geoinformatics-based approach. Based on the IPCC AR5 framework, the proportion of variance of 26 exposure, hazard, sensitivity, and adaptive capacity parameters was measured and analyzed. The results showed that 19.5% of mouzas (administrative units of the island), with 15.33% of the population at the southern part of the island, i.e., Sibpur–Dhablat, Bankimnagar–Sumatinagar, and Beguakhali–Mahismari, are at high risk (0.70–0.80). It has been concluded that the island has undergone tremendous land system transformations and changes in climatic patterns. Therefore, there is a need to formulate comprehensive adaptation strategies at the policy- and decision-making levels to help the communities of this island deal with the adverse impacts of climate change. The findings of this study will help adaptation strategies based on site-specific information and sustainable management for the marginalized populations living in similar islands worldwide.

1. Introduction

Climate change is a major concern that has increased the rapid and slow onset of climate events globally [1,2]. Rising ocean and air temperatures, increasing occurrence and intensity of tidal surges, violent stormy cyclones, severe flooding, and extreme precipitation events are some of the manifestations of climate change [3]. The low-lying coastal regions are witnessing adverse impacts, such as inland flooding, submergence, and coastal erosion, due to rising sea levels [4]. According to an estimation, by 2050, almost a million people living in three significant deltas, namely, the Mekong Delta, Nile delta, Ganges–Brahmaputra–Meghna delta, will be adversely impacted by rising sea levels [5]. For the Indian Bengal Delta, such an increase could be as high as 70% [6]. Climate variability greatly influences the environment and socioeconomic aspects, such as agriculture, livelihood, health, and biodiversity [7]. Biophysical vulnerability manifests in communities’ exposure to climate change; hence, due to the greater social vulnerability, they are more exposed to adverse impacts [8]. Climate change primarily affects the poor, disabled, aged, and marginalized populations, increasing social vulnerabilities [9].
Apart from broad-scale increases, local factors influence household-level vulnerability [10]. Population pressure, changes in land use, and intensive agriculture can exacerbate risks and exposure [11]. These catalyze the displacement of endangered people and increase the number of population traps, which can cause internal and external population movement [12,13]. Sundarbans is a very good instance of the manifestations of climate change, wherein underdevelopment and over-reliance on climate-dependent subsistence have rendered the whole ecosystem vulnerable [14].
Sagar Island has encountered the impacts of climate change in the form of rising sea levels, tidal surges, increased soil salinity, violent cyclones, and severe coastal erosion [15,16]. Part of an archipelago of 102 islands in the Sundarban coastal region, Sagar Island is the most significant. Its inhabitants are losing their land under their feet day by day. The surrounding four islands, named Bedford, Lohachara, Khasimara, and Suparivanga, were diluviated by coastal erosion in the last few decades. Bishalakkhipur mouza of Sagar Island was submerged, and Sagar mouza has become uninhabitable due to the excessive erosion. Ghoramara island will soon be submerged by the rising sea and accelerating erosion [
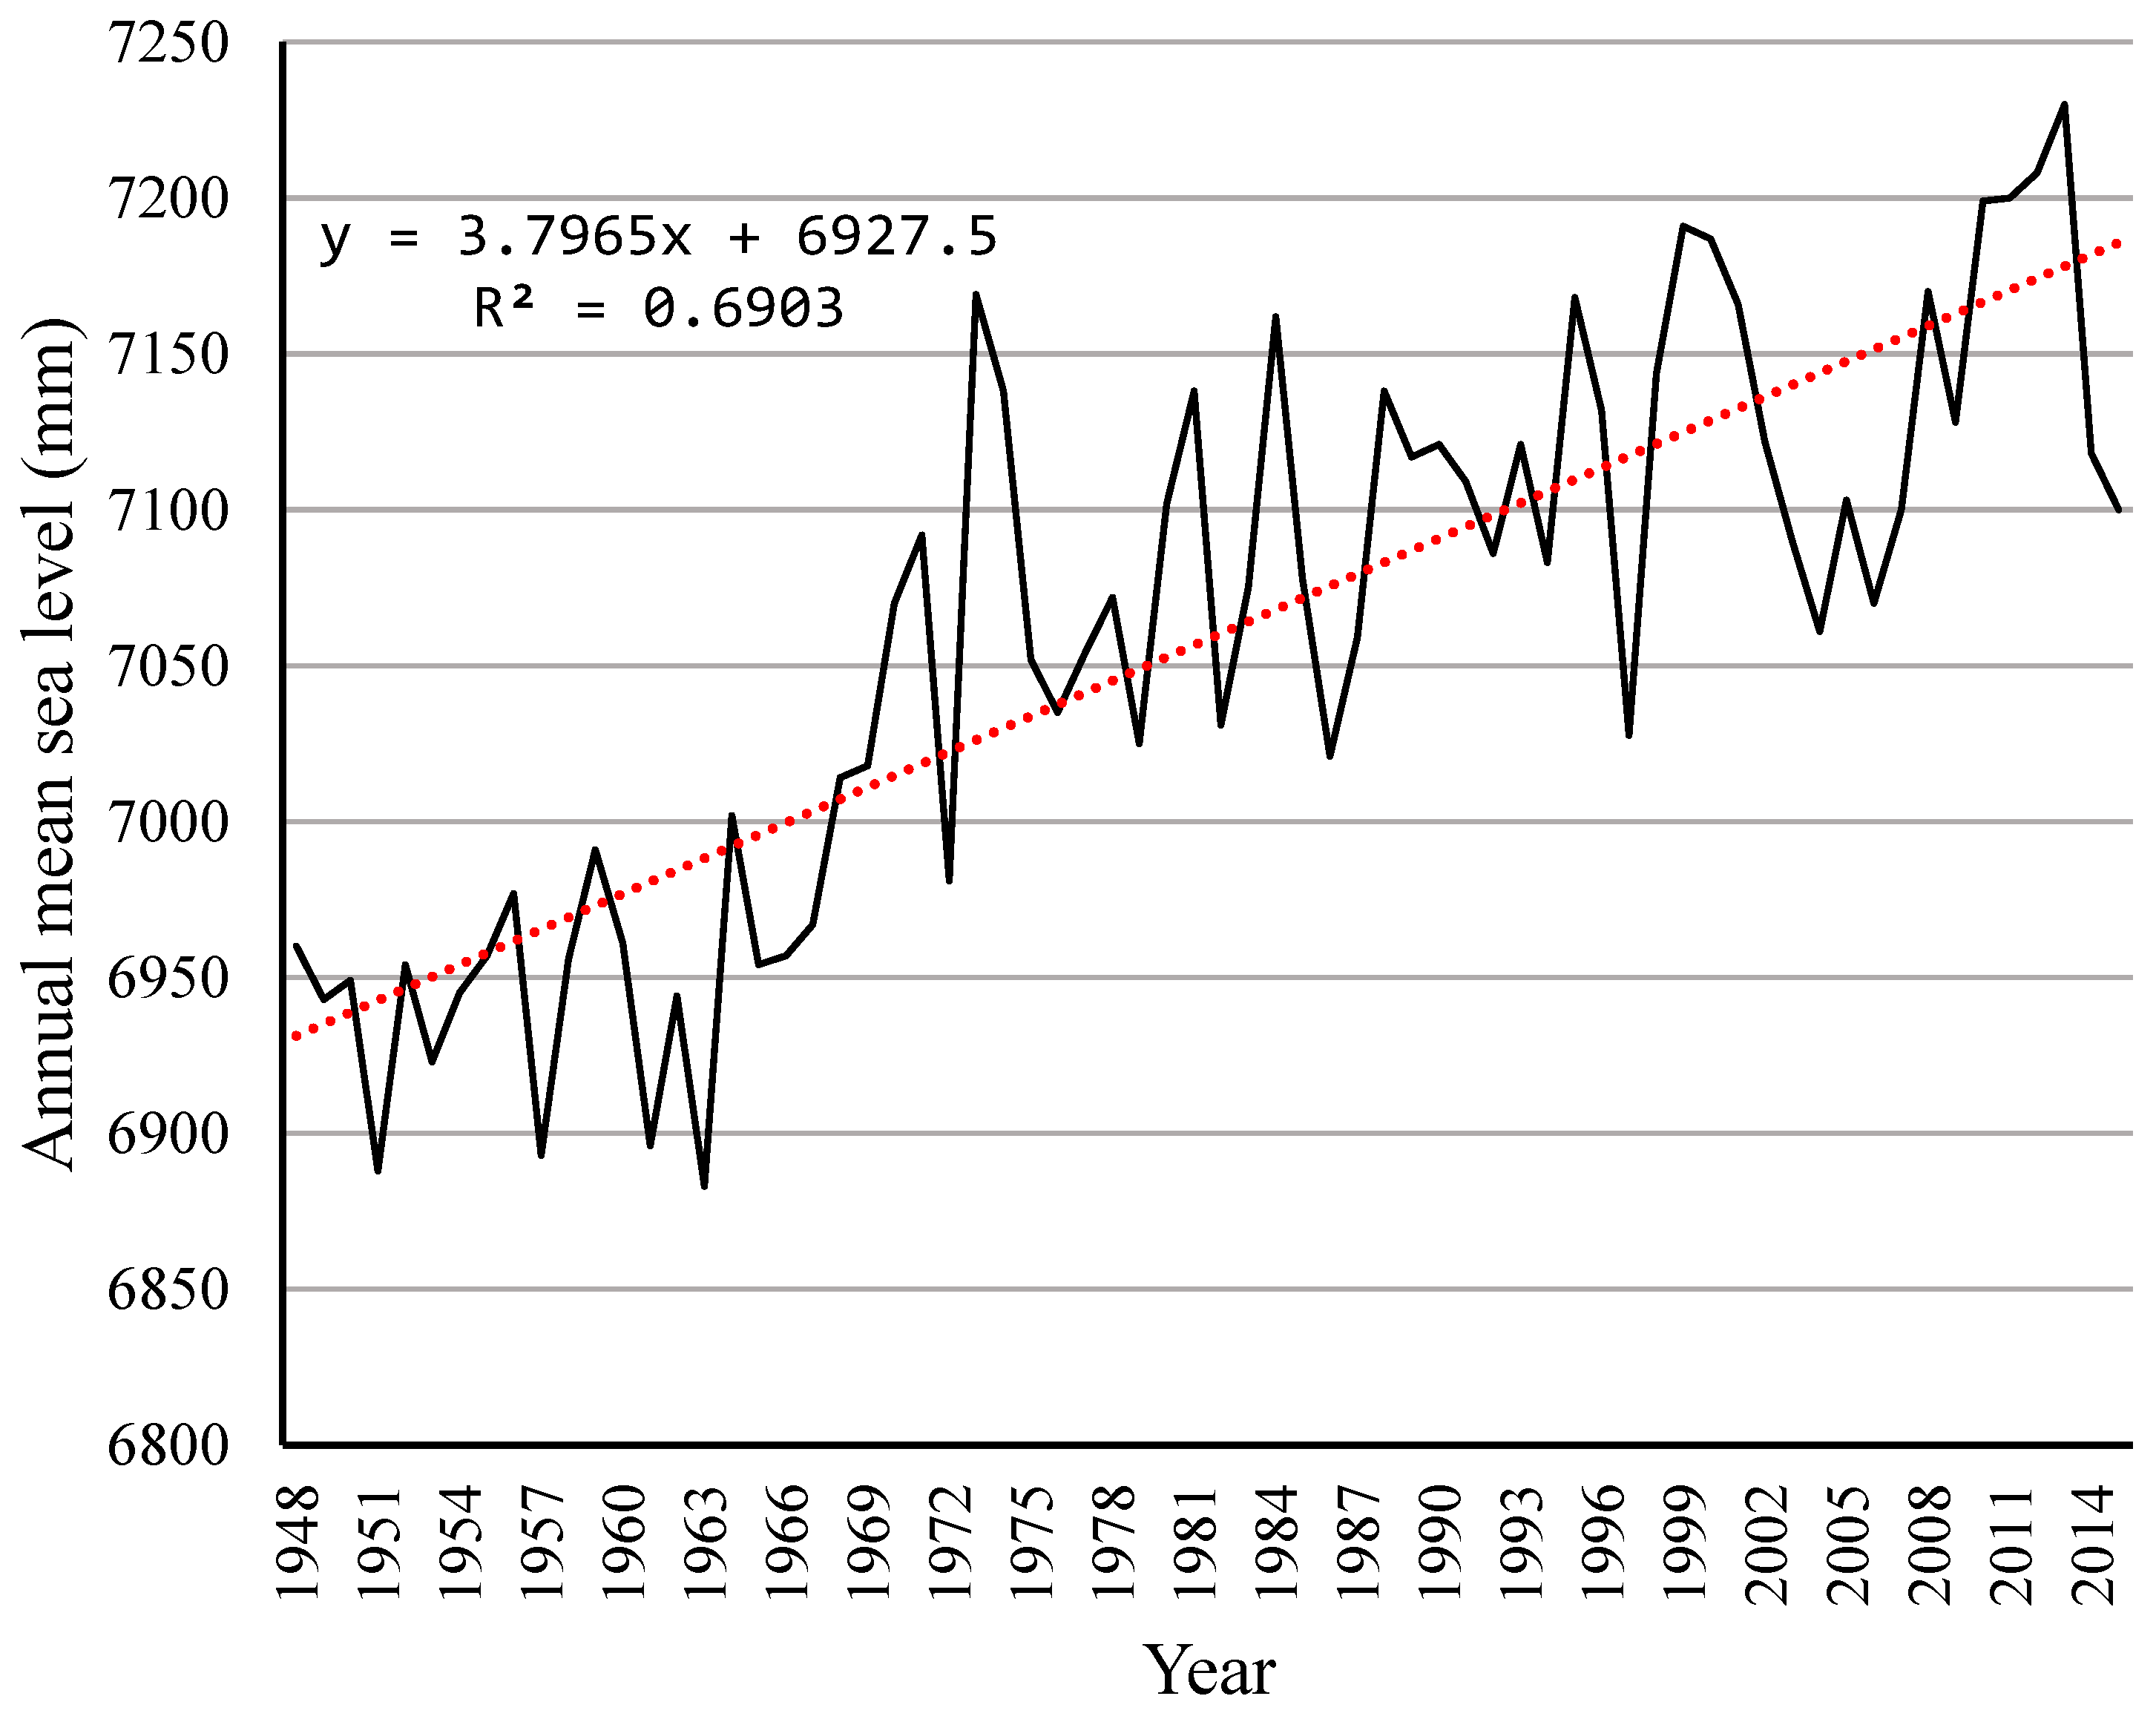
17]. The range of apparent sea level increase varies between 3–8 mm/year in the Sundarbans, beyond the global average of 3 mm/year [18]. This present rate can result in a 20 percent enhanced flooding risk, over 1.520 mm by 2070 [19]. According to [18], the Indian Sundarban has lost approximately 4% of forest cover, a natural buffer against cyclone surges. Increasing sea levels and accelerated wave action caused subsequent changes in the hydrodynamic regime that led to severe land loss. From 2009 to 2019, the island’s area has prominently reduced from 246.76 km2 to 230.98 km2; the average decadal percent change in this area for that period accounted for −11.33% [20]. The Bay of Bengal typically experiences 7% of the significant cyclones worldwide, while in the last 120 years, the frequency and intensity of the cyclones have increased between 20% and 26% [21]. Severe cyclones, i.e., Yash (2021), Amphan (2020), Bulbul (2019), and Aila (2009), accompanied by storm surges and flooding, caused large-scale devastation to the coastal regions [22]. The agricultural community depends solely on nature; extreme weather events, cyclone surges, tidal ingression, embankment breaching, saline water intrusion deplete their habitats and livelihoods, forcing them to become environmental refugees [23].
Researchers worldwide are assessing the impacts of climate change, associated vulnerabilities, and risks due to the frequency, magnitude, and tenacity of climate events [24,25]. Globally, research on the human effects associated with climate change and their scale [26] has been used to guide policymaking, with the demarcation of vulnerable areas and the identification of at-risk populations being made according to environmental assessments, along with the introduction of measures aimed at mitigating the impacts of severe climate events [27,28]. Ways to assess risk and vulnerability to the impacts of climate change have been defined by the Inter-Governmental Panel for Climate Change. As of the time of writing, two methodologies have been proposed, one based on the AR4 report and the most recent based on the AR5. As defined by the IPCC (2007), vulnerability is a function of sensitivity, exposure, and adaptive capacity [29]. However, the terminology of risk, as introduced in the fifth Assessment Report (AR5) of the IPCC 2014, defines it as the interplay of exposure, hazard, and vulnerability [2,30,
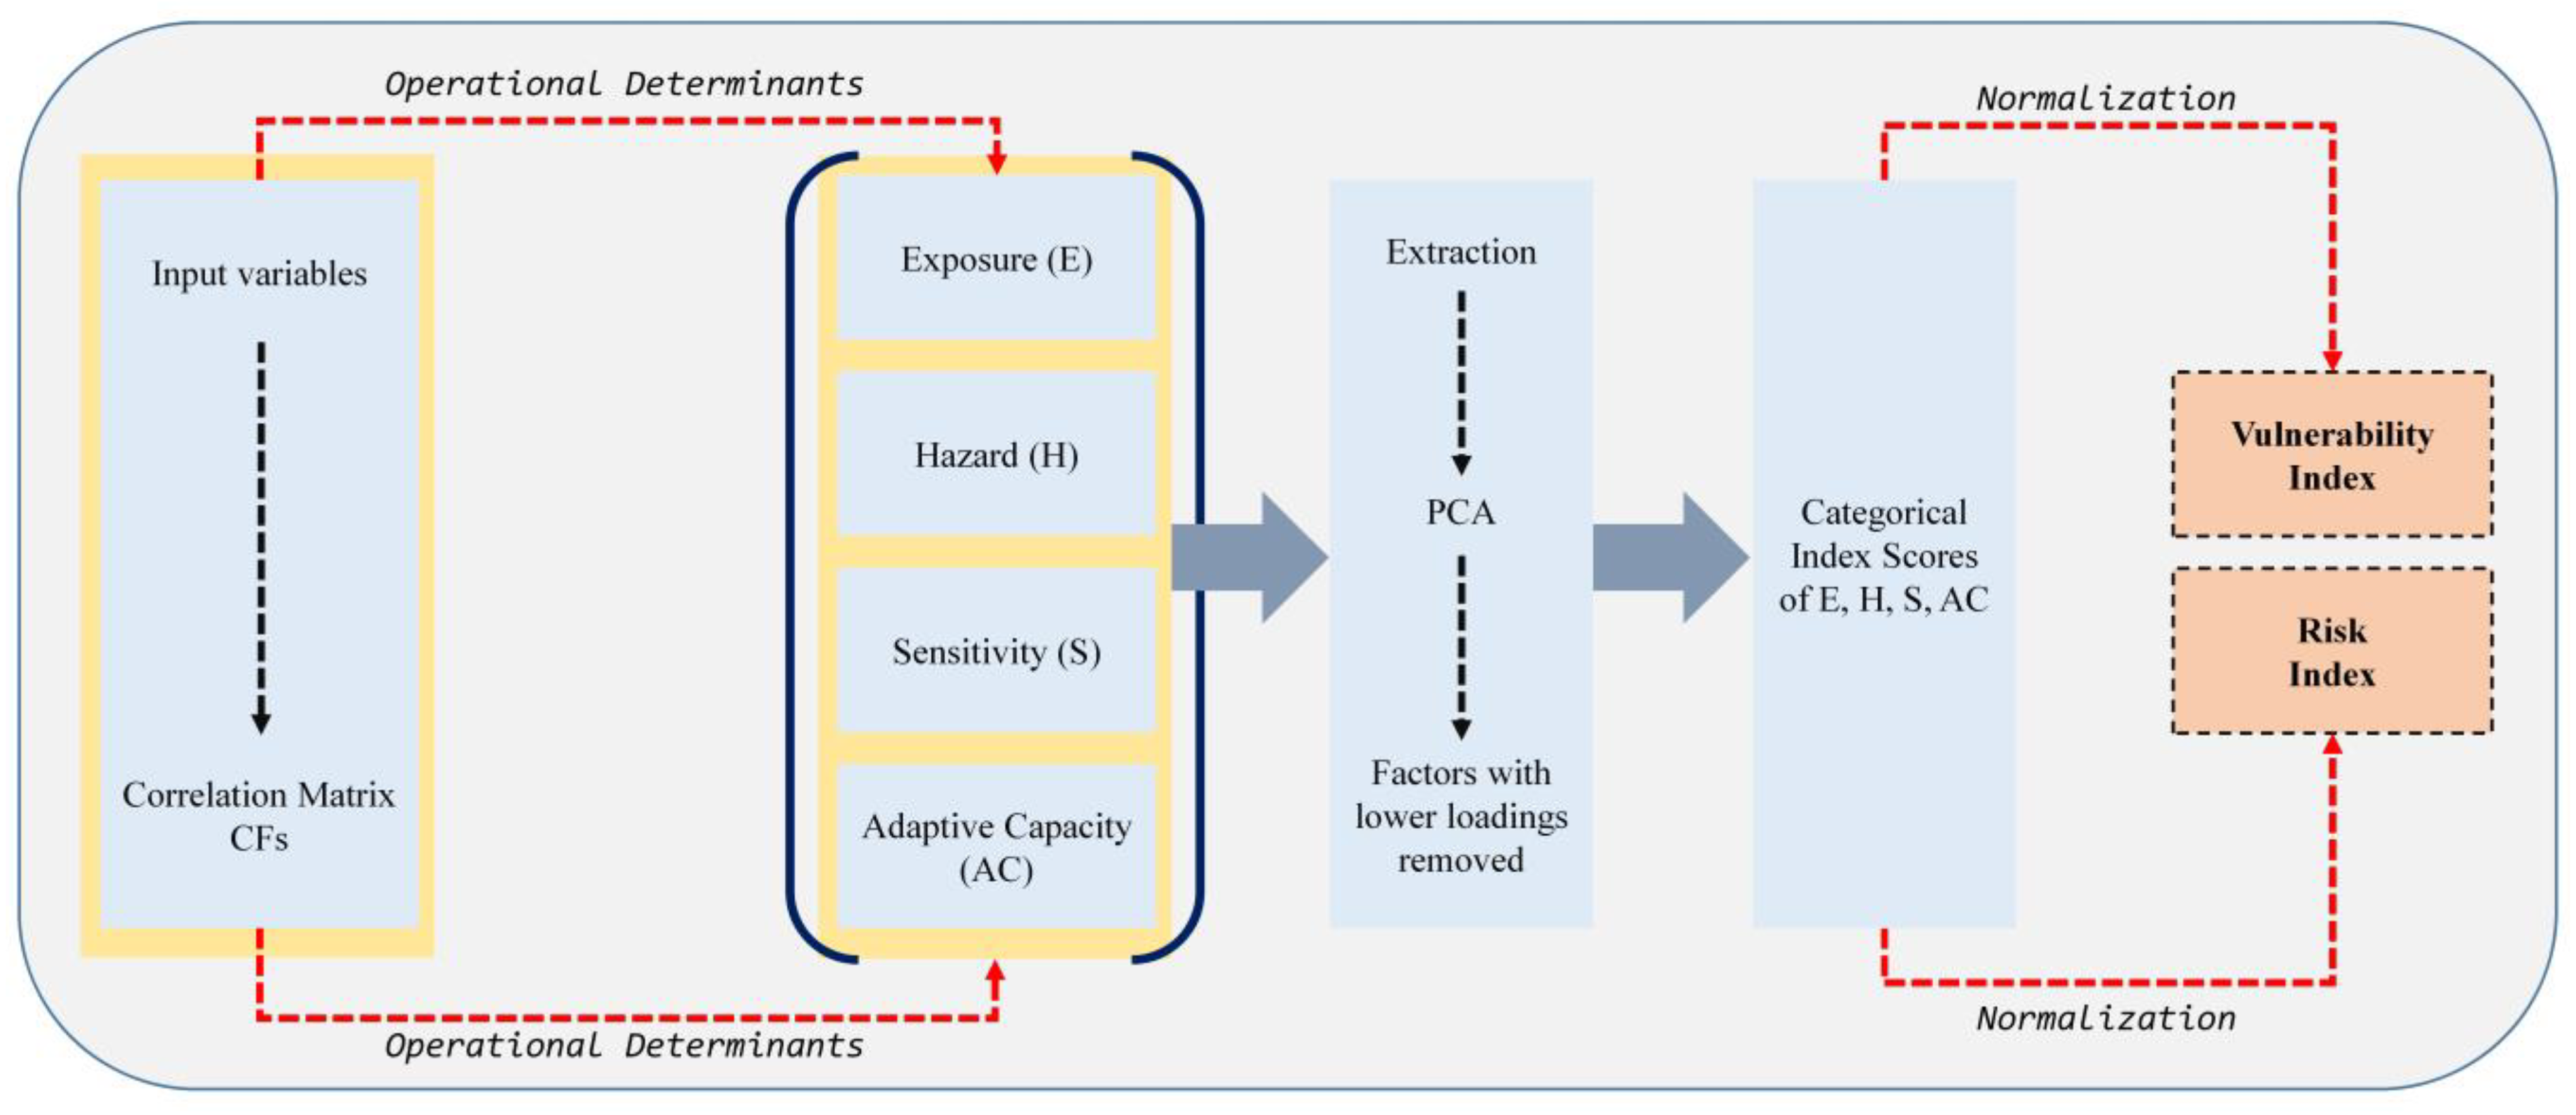
31]. The present work is based on the AR5 methodology, which defines it as the function of exposure, hazard, sensitivity, and adaptive capacity. According to AR5, vulnerability is considered as an internal character and is defined by adaptive capacity and sensitivity. Hence, the effective step of adaptation to the impacts of changing climate is to reduce present exposure and vulnerability. Though the vulnerability indices simplify the intricate aspects of climate change impacts, the merit of this kind of evaluation lies in its instrumentality in the context of policy development and mitigation of climatic risks [32].
Previous studies of Sagar Island have only evaluated climate change vulnerability; hence, there was little effort made to assess risk through the IPCC AR5 framework. The present work is designed to assess how biophysical and socioeconomic variabilities contribute to the risk to the inhabitants of Sagar Island associated with climate change. The principal goal of the present study is to assess socioeconomic and biophysical variability associated with climate change using the vulnerability and risk indices through exploratory factor analysis for the 41 inhabited mouzas of Sagar Island based on the AR5 framework. The primary objectives are: (a) to analyze both the slow and rapid onset climate variabilities and assess related vulnerabilities; (b) to identify the relative contributions of hazard, exposure, sensitivity, and adaptive capacity to the observed risk using statistical analysis; and (c) to enumerate indices to help design strategies for efficient risk management through mapping of hotspot areas. Spatial–temporal changes in weather variables and land-use/land-cover were also analyzed, as these are significant factors in risk management. This context-specific and location-specific geostatistical analysis has been framed on a quantitative scale for policymakers and organizations to determine which areas need specific policy interventions.

2. Study Area and Rationale

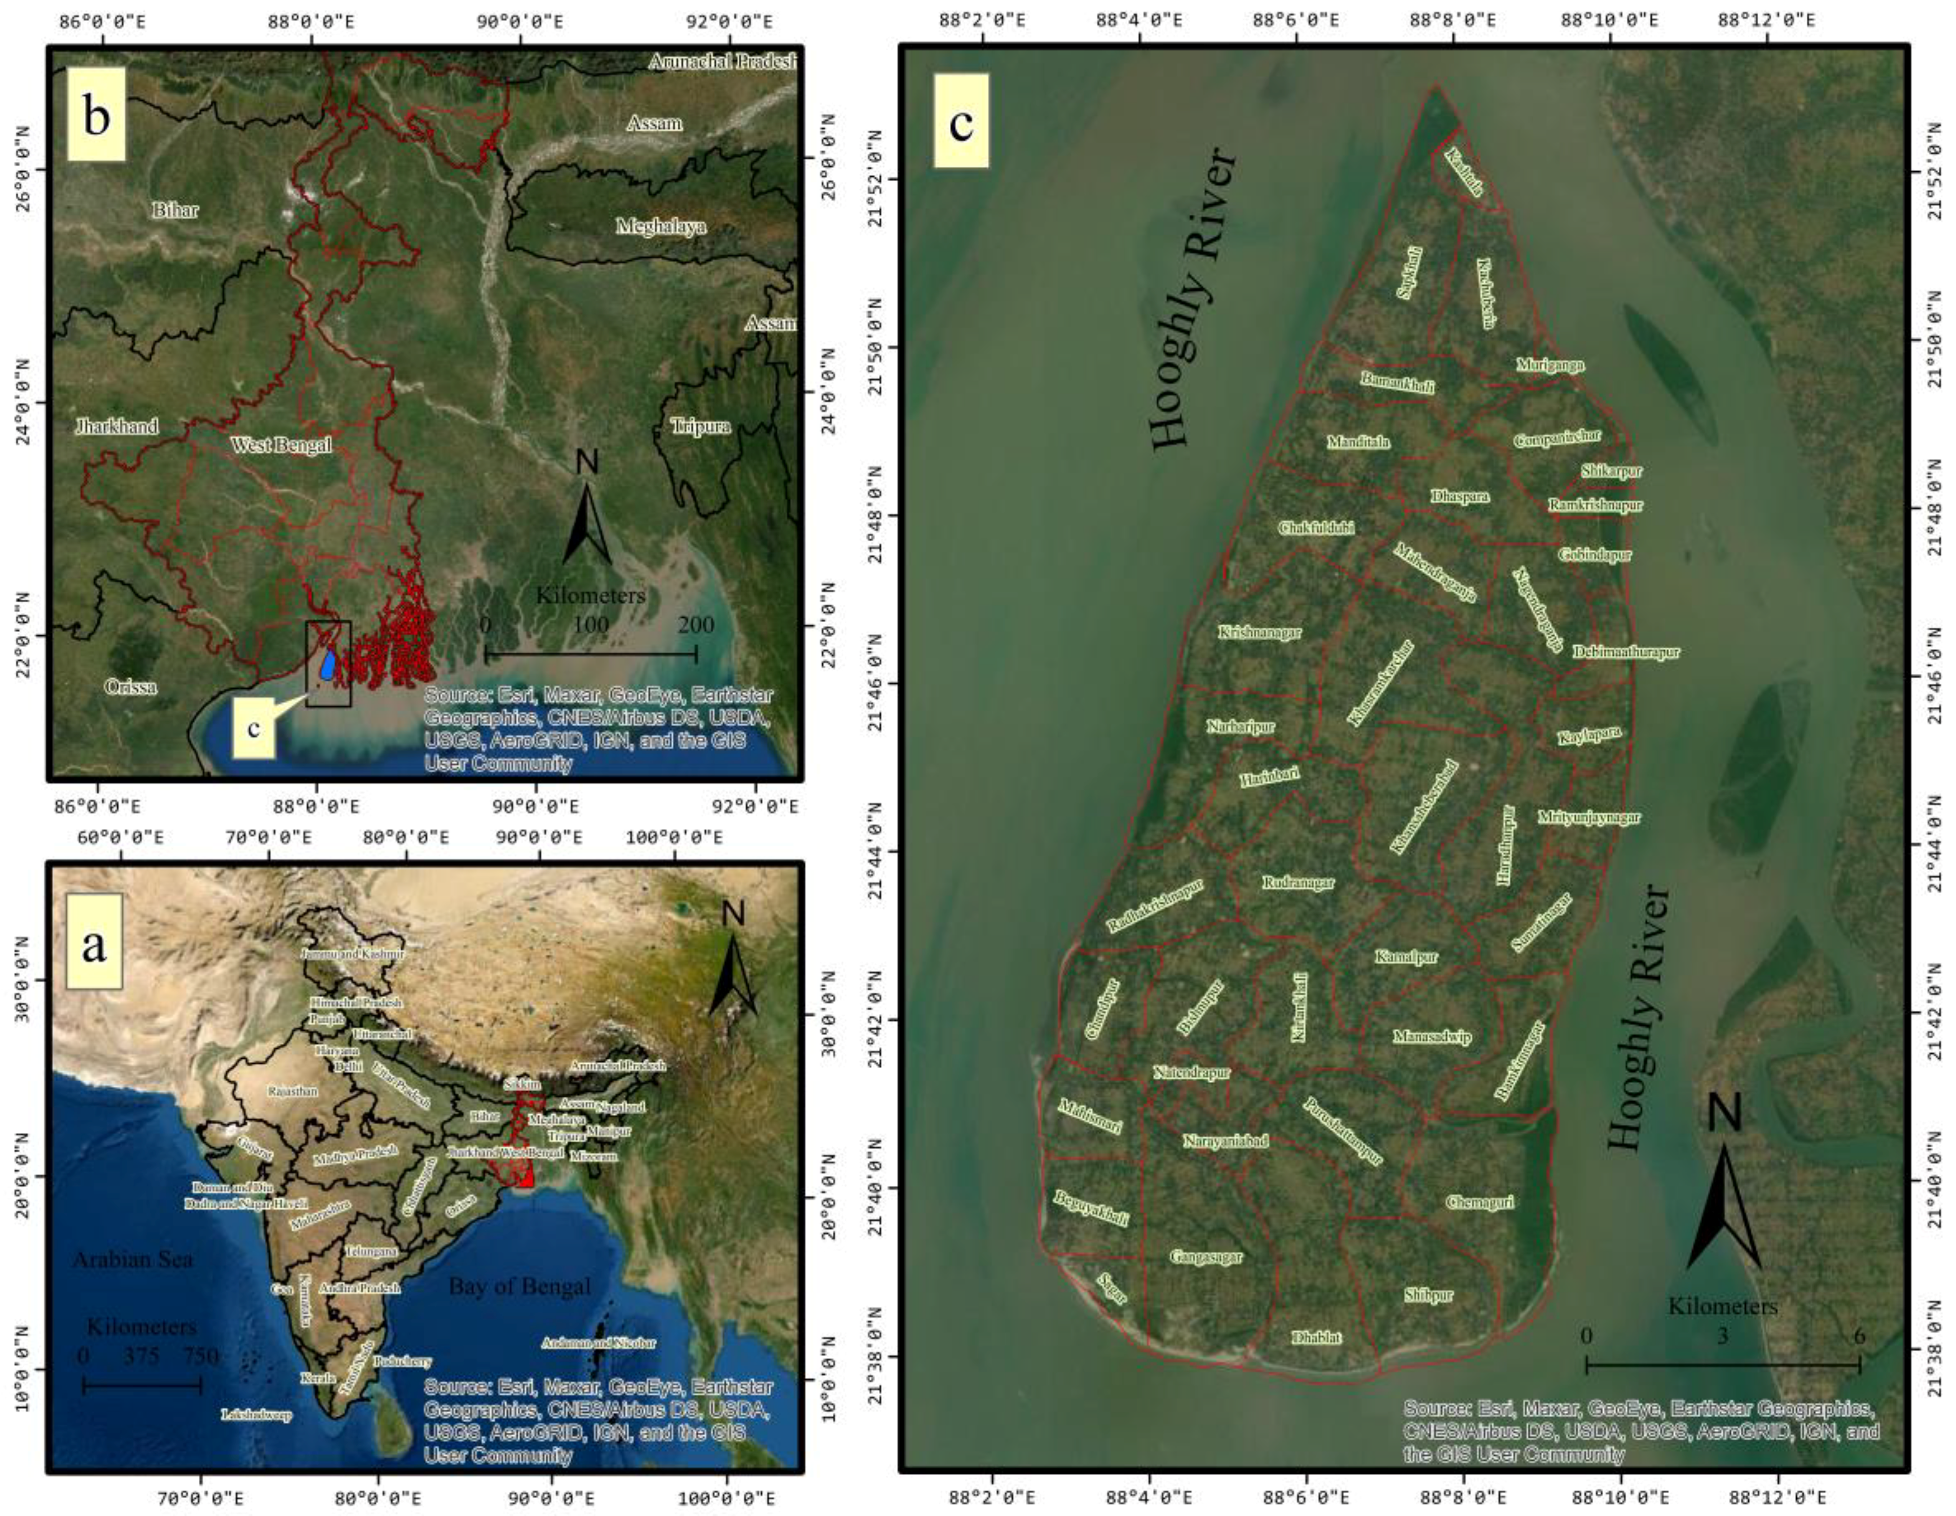
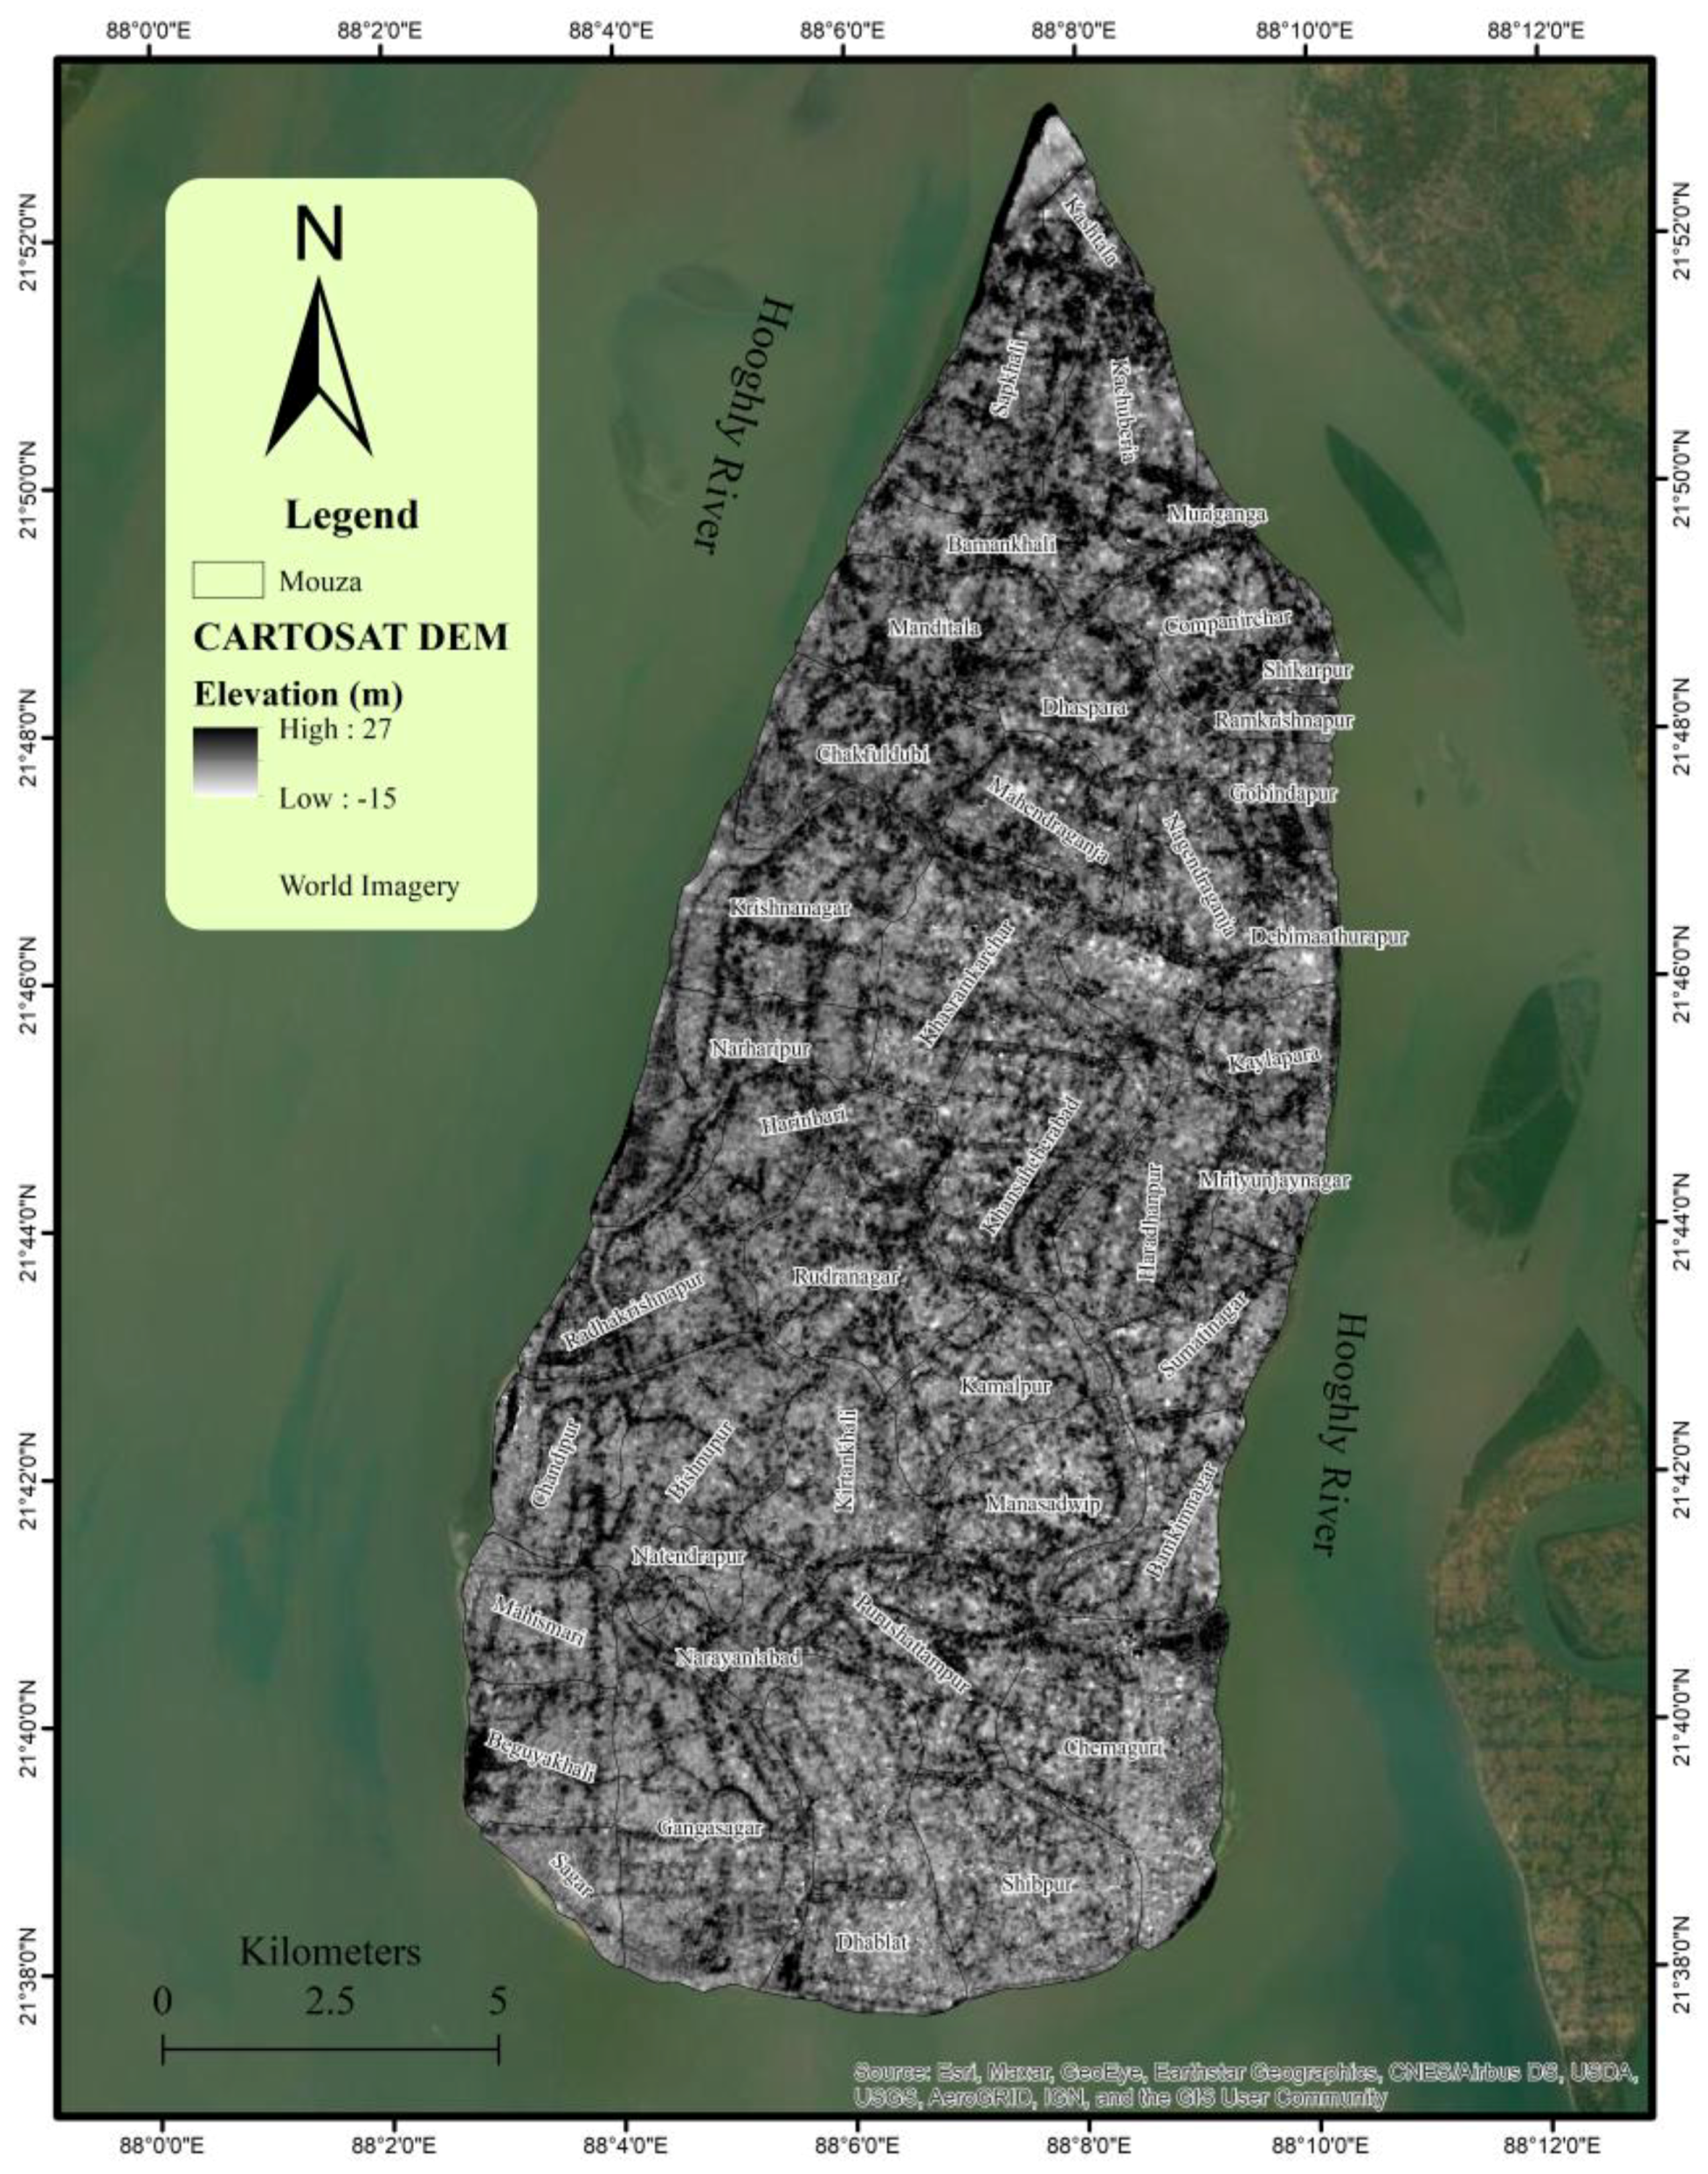
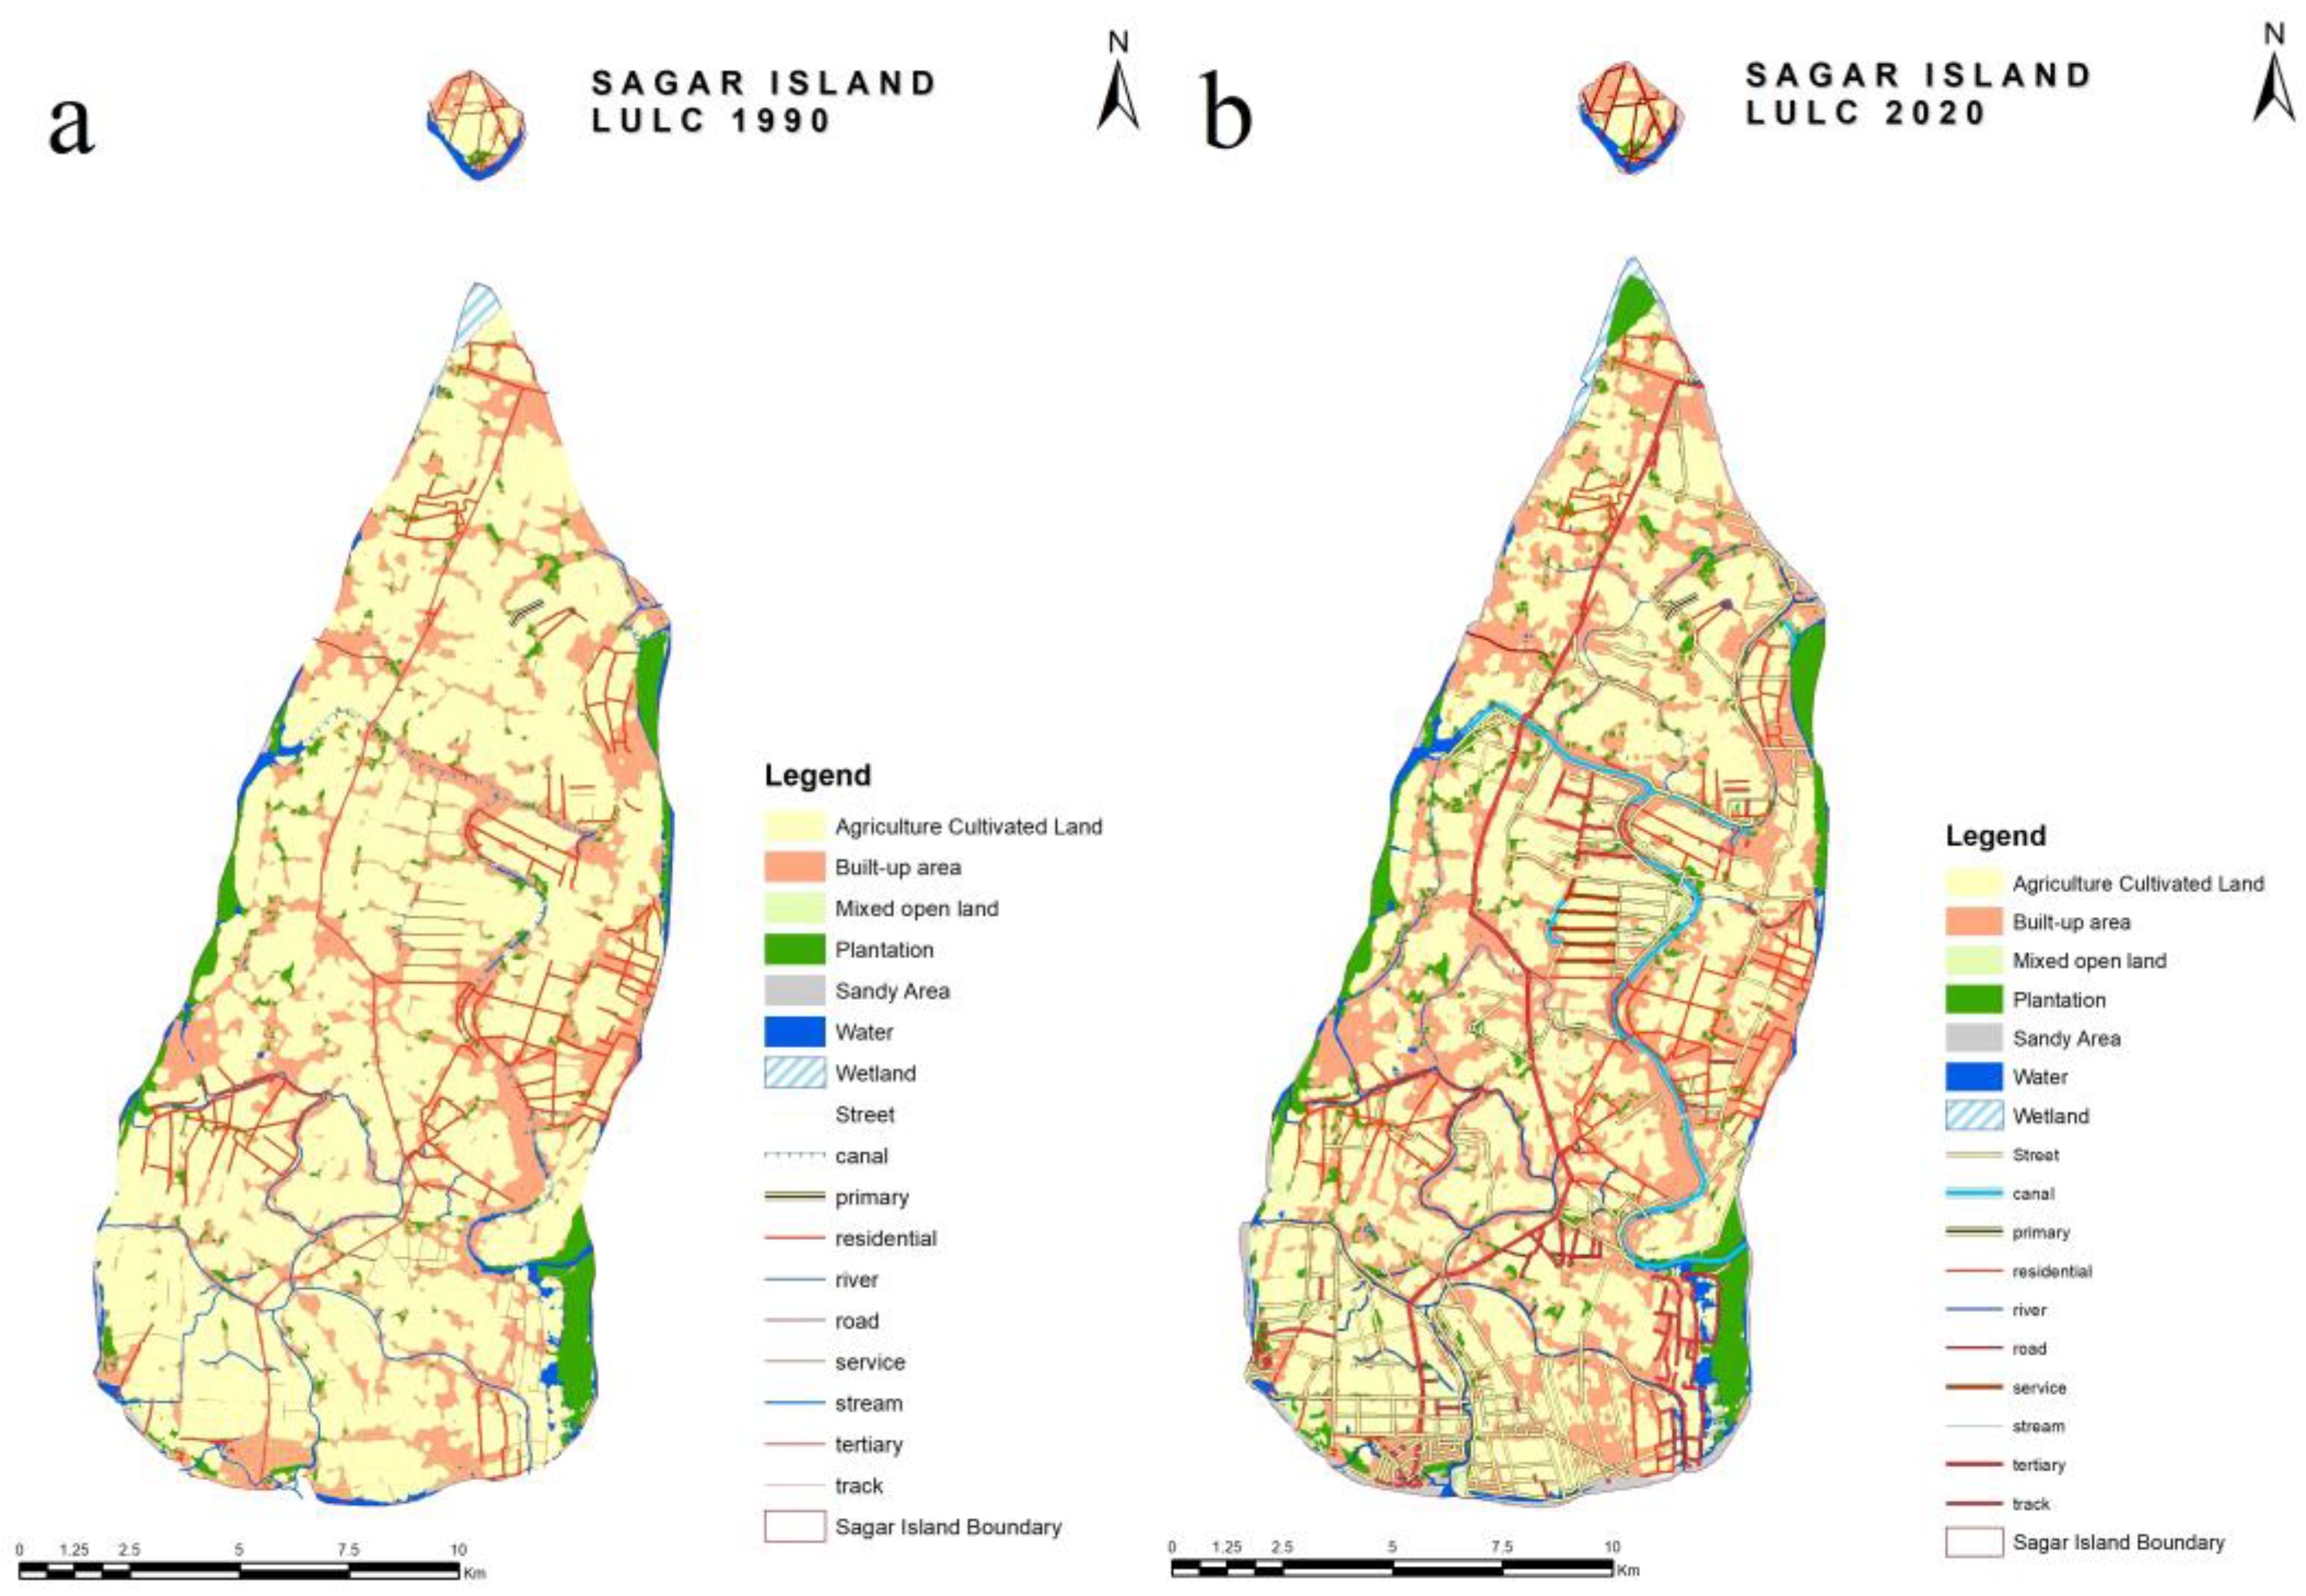
Sagar Island is located at the confluence of Ganga at the Bay of Bengal, 100 km south of Kolkata in the western part of Sundarbans. Administratively, Sagar Island (21°36′ N to 21°56′ N; 88°02′ E to 88°11′ E) is a part of Sagar block of south 24 Parganas district (Figure 1). Home to 212,037 people [33], with 41 inhabited mouzas in 9 panchayats, covering an area of 282.11 km2, this island is composed of the alluvium of the Ganga and Brahmaputra rivers and their tributaries. The low-lying islands of Sundarbans have been considered global climate change hotspots, located as they are in a flood-prone micro-tidal estuary characterized mudflats, creeks, and sandy beaches [34]. The average elevation is 4 m; diurnal tides range between 3.5–5.5 m (
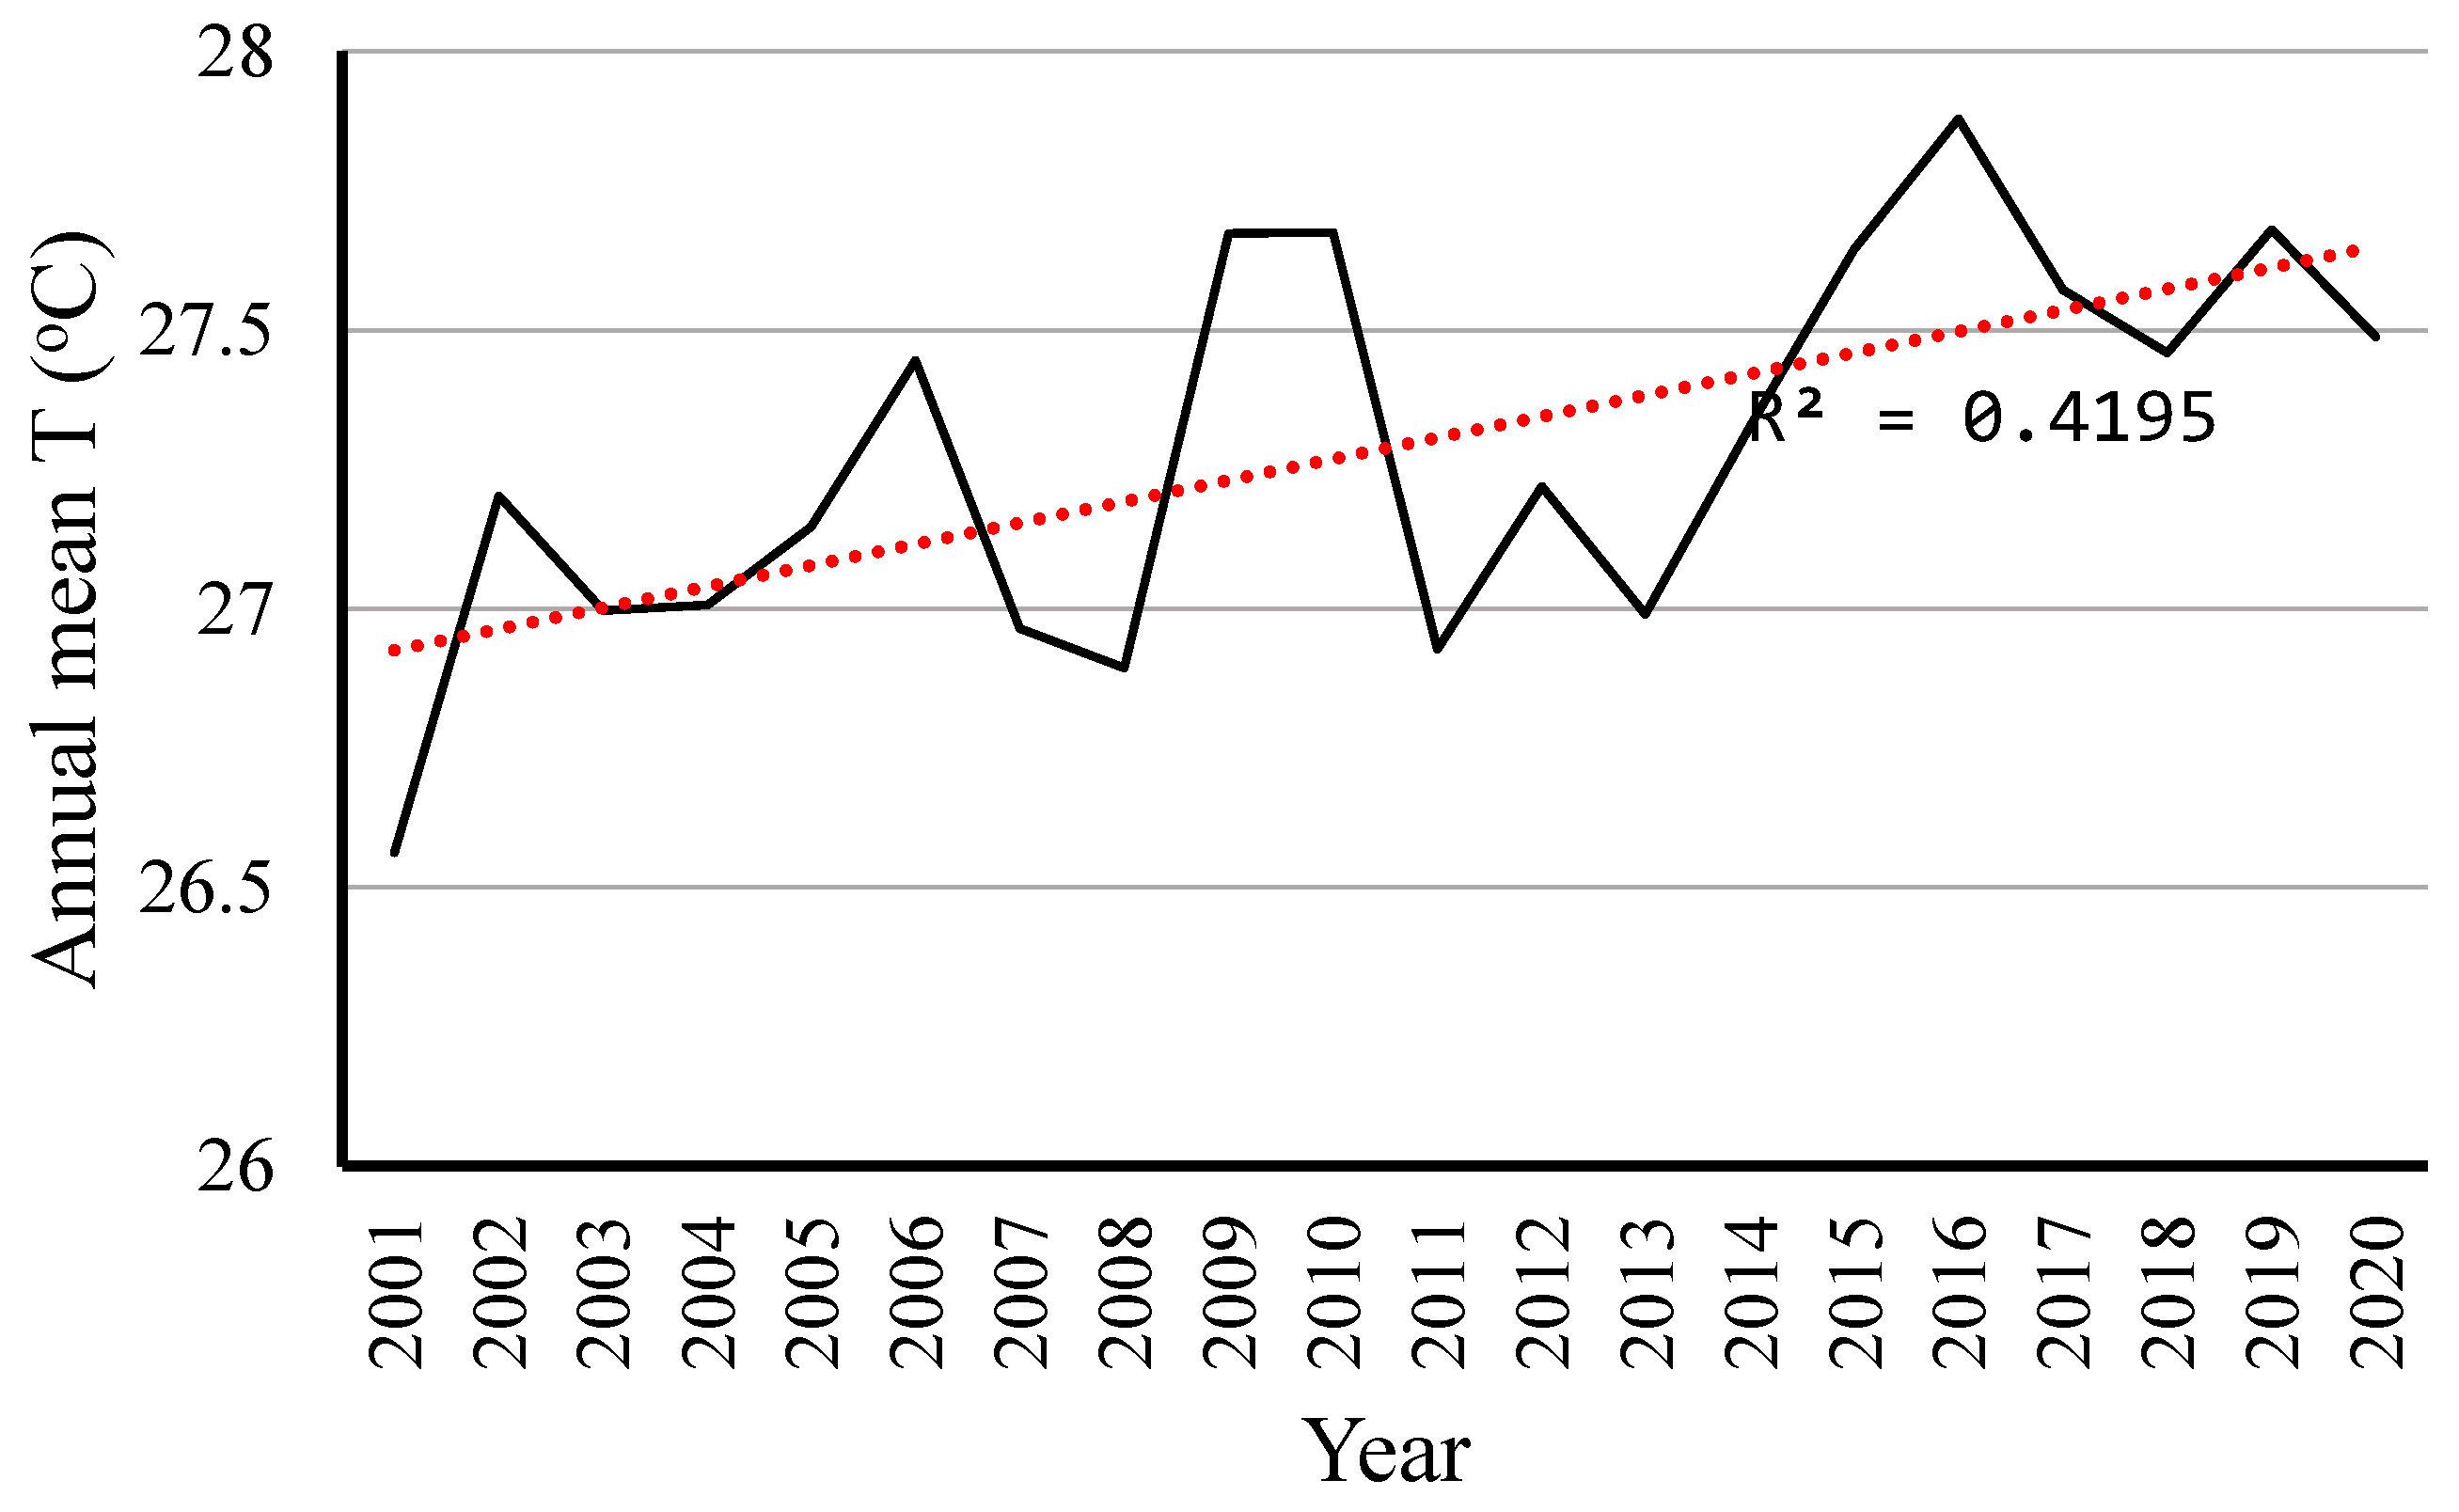
Figure 2). Hence, a maximum portion of the island undergoes inundation with saline water periodically from tides and storm surges. In this humid monsoon climate, the average annual temperature and the total precipitation were 27.57 °C and 154.25 mm, respectively, in 2020. Between 1977 and 2017, the island has faced significant changes to its shoreline. Continuous tidal ingression, waves, longshore currents, cyclones, and rising sea levels have been modifying the island’s shape. With a 14.22% increase rate, this rural population has an average household size of 4.50, of which 44.46% are below the poverty line. According to the 2011 census, 40.03% of the population are total workers; 43.72% and 24.46% are agricultural laborers and cultivators, respectively [
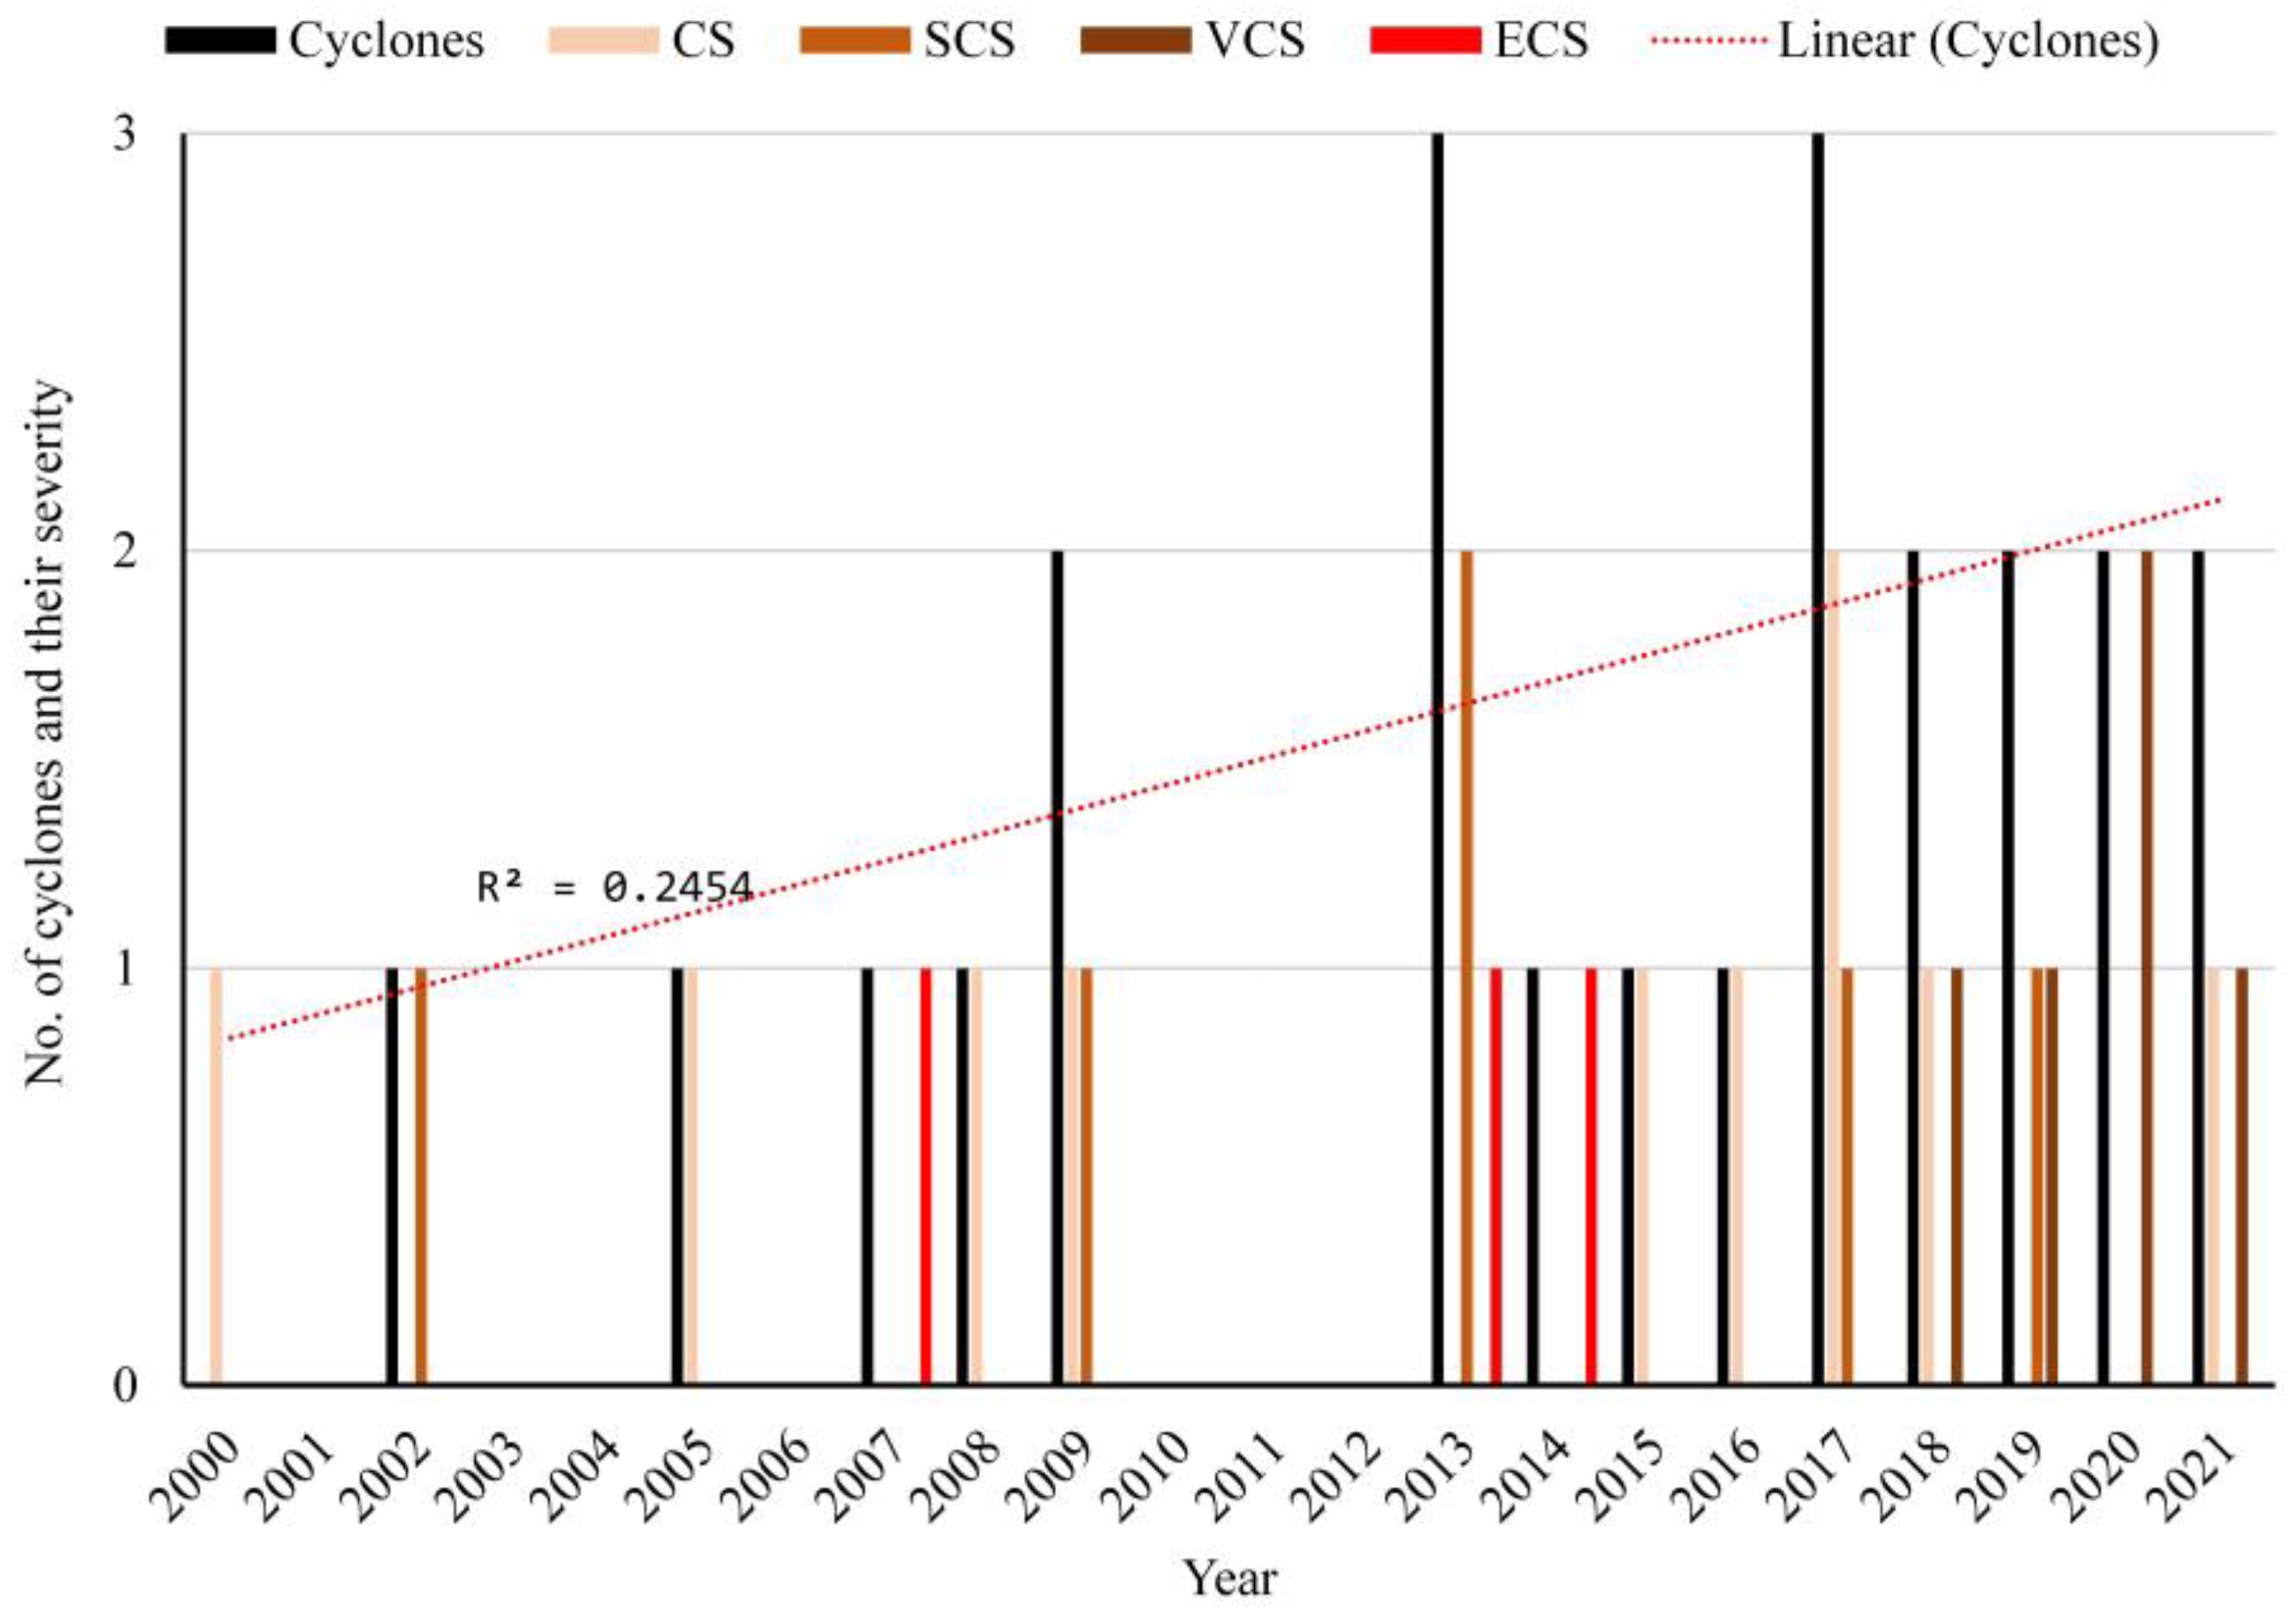
30]. Constant loss of land and expanding salinity reduce opportunities for honey and prawn seed collection. Widespread poverty and lack of development are turning most working populations into daily wage laborers. Agriculture and fishing are the most important economic activities for the local population. The increasing surface temperature of the sea, monsoonal irregularities, and higher sea levels are crucial threats to their livelihoods. Between 1981 and 2020, the frequency and intensity of cyclones striking the Sundarbans increased [35]. During 1891–2016, 232 severe cyclonic storms and 293 cyclonic storms were observed in the Bay of Bengal and surrounding areas [36]. The severe cyclonic storm Aila (27 May 2009) rendered over 5.1 million inhabitants homeless, and thousands of acres of farmland perished from the ingression of saline water. Bulbul (5 November 2019) and Amphan (16 May 2020) caused widespread destruction. This area faced continuous land loss, saline water intrusion, and limited access to resources and livelihoods despite an agricultural economy. Mouzas (administrative units) in the southern part, i.e., Dhablat, Shibpur, Mahismari, Beguakhali, have been heavily eroded. The sediment deficiency, removal of mangroves, sea level increase, unsustainable development, and exploitive mining of clay are the root causes of excessive erosion [37].
Land reclamation started in 1811, long before the accretion–erosion process could reach a stable equilibrium in this newly formed active delta. The construction of the barrage at Farakka, the dying-out of the tributaries, and the subsequent fall in the supply of sediments have changed the accretion rates and altered the vital hydrodynamics of surplus erosion [38]. Higher exposure to climate-related hazards and the over-dependency of inhabitants on the rain-fed agricultural economic system have made the islands, including Sagar, an important example of the climate change-related impacts that are being experienced worldwide [39,40,41,42,43,44].

3. Materials and Methods

3.1. Data

To identify climatic variation and extreme weather situations, the mean monthly temperature and rainfall data for Sagar collected over the past 20 years (2001–2020) along with annual storm data (deep depression, cyclone, and severe cyclones) were obtained from the regional center of IMD. Data for the sea level (1948–2012) of Diamond Harbour (near Sagar) were obtained from the global sea level observing system (GSLO). Data related to the occurrence and intensification of cyclones were also obtained. The Landsat 4-5 TM satellite image (30 m spatial resolution) of MSS for 1990 and OLI for 2020 were acquired from the USGS website.

3.2. Methods

3.2.1. General Framework

Risk is defined as a function of the exposure, hazard, and socioeconomic vulnerability of both resources and communities, according to the IPCC’s Fifth Assessment Report (2014) [45]. While the risks are commonly thought of as natural, they can be exacerbated by human-induced variables that speed up or increase the scale of occurrences or processes, or lessen them through interventions and adaptations, such as coastal barriers, embankments, and polders. Overall, in the present work, we first describe how variables characterizing each component of exposure, hazard, and vulnerability are calculated, followed by estimates of the potential risks [45] (Figure 3).

3.2.2. Component Variables

Based on an extensive field survey, literature reviews, official records, and interviews with experts, 28 prominent policy-oriented biophysical and socioeconomic variables of 9 major components of exposure (people, infrastructure, livelihoods), hazard, sensitivity (livelihood activity, demographic profile, and socioeconomic status), and adaptive capacity (human resource, primary facility, infrastructure, and economic security) were selected (Table 1). Climatic variability was measured by the mean monthly temperature and standard precipitation deviation over the last 30 years. Natural hazards were the occurrence of cyclones, floods, and coastal erosion. There were seven components of the internal element identified as adaptive capacity and sensitivity in AR4 and vulnerability and exposure in AR5. In the context of demographic status, socioeconomic, financial security, human resources, and livelihood activity, variables such as household size, number of females and children, disadvantaged individuals, people without land holdings, poverty, literacy, agricultural dependency, marginal worker and non-worker status, work participation, and number of salaried people were computed. Parameters such as access to sanitation and electricity along with the availability of safe drinking water, basic infrastructure, primary control, vital resilience, and adaptive capacity were also assessed among the impacted communities [46,47]. Marginalized rural people are more susceptible to poverty and overdependence on natural resources [48,49]. The present study was carried out on all 41 inhabited mouzas of Sagar Island. All variables were taken at an interval scale, and outliers have been identified through descriptive statistics. To address singularity (perfectly correlated) and multi co-linearity (highly correlated), the list of variables was reduced to 26 by removing redundant variables (R > 0.8). The Kaiser–Meyer–Olkin (KMO) test was performed to test sample size suitability and diagnose multi-colinearity. Mann–Kendall parametric rank correlation was computed to detect changes in the time series of seasonal and annual variations of temperature and precipitation. Significant trends were identified by comparing Z values with normal distributions at the selected significance level. Cyclones that affected the island in the last 20 years were plotted in R according to their severity. Land use and land cover (LULC) information was prepared using the above data. For 1990 and 2020, Landsat 4-5 TM (30 m spatial resolution) data were used from the USGS website to compare and identify significant changes under seven classes. A maximum likelihood classifier was chosen for classifying LULC. We obtained an overall accuracy for 1990 and 2020 equal to 80% and 81.45%, respectively. We used ArcGIS 10.2.1 to perform the GIS analysis [50,51].

3.2.3. Principal Component Analysis (PCA)

Exploratory factor analysis is a multivariate technique widely used in geography and other social research [52]. Principal component analysis (PCA) is the standard statistical data reduction technique for excerpting a smaller and reasoned set of uncorrelated sets (components) amongst many variables. The first set (component) is the most significant variation possible, and each following set accounts for the possible remaining variability. Hence, the variables have been converted into factors, and the coordinate of each variable is computed to ascertain the factor loadings. Factor loadings are values that explicate how strongly the variables are associated with each factor discovered. The sum of the square loadings of each principal component is the component’s latent root or Eigenvalue [53].

3.2.4. Calculation of Vulnerability and Risk Indices

Vulnerability and risk indices were calculated at the mouza level using the PCA in the R python Prcomp package. The correlation matrix was used to extract the principal components. To construct the values of contributing factors (CFs) stated in the IPCC framework, coefficients of component scores were multiplied by the ratio of the variance of the corresponding components. The formula used for calculating the contributing factors was Equation (1):
C F = F i T V × F S i
where CF is a contributing factor, Fi is the percent variance of component (i), TV is the total variance derived by all the reserved components, FSi is the coefficient of the component score (i).
It became essential to normalize CFs, as the values can be both positive and negative. The standard normalization equation used is Equation (2):
X i j = ( X i M i n   X j ) ( M a x   X j M i n   X j )  
where Xij (for mouza) becomes normalized CF (j), Xi is the actual value and Max Xj and Min Xj are the maximum and minimum CF values for complete mouzas, respectively. Then, all normalized CFs were combined into a single composite index ranging from 0 to 1.
From the Fussel and Klein framework [54], exposure (E) and sensitivity (S) are computed together as the potential impact (PI) (3):
P I = E × S
A system or community with limited adaptive capacity (AC) becomes more vulnerable according to its sensitivity and exposure to climate change impacts. Hence, vulnerability can be calculated using Equation (4):
V = P I ( 1 A C )
This was also applied in risk calculation, where the function of sensitivity (S), exposure (E), and hazard (H) is PI, as in Equation (5):
R = H × E × S × ( 1 A C )
Vulnerability and risk indexes ranging from 0–1 reflect the current vulnerability and risk quotient of the 41 inhabited mouzas of Sagar Island.

4. Results

4.1. Indicators of Climate Change

The present study performed a trend analysis of temperature and precipitation data over 20 years to identify significant changes in the weather patterns of the study area. The analysis shows a significant rising trend (Z = +2.80 to +2.45) with an average annual rise of (+3.98) for the maximum temperature, while for the minimum temperature a decreasing trend (Z = −0.60 to −0.91) is observed (Table 2 and Figure 4). Furthermore, there was an increase in average annual temperature (26.25 ± 0.57 °C) at the rate of (Z = +2.57) 0.028 °C (Table 3).
Significant variation in mean monthly rainfall over the past 20 years was observed, with July having the highest (408.86 ± 181.52 mm) and December the lowest (12.01 ± 21.05 mm) monthly rainfall. The analysis reflects a significant trend of increase (5.44 mm/month) in July and of decrease (8.23 mm/month) in June monthly rainfall. The average annual rainfall received is 1797.4 ± 348.9 mm, with 4.3% variation (Table 4). A non-significant trend of decrease in average annual rainfall (Z = −0.07) at a 1.18 mm/year rate is observed (Figure 5). Despite erratic distributions, a significant increasing trend in rainfall (6.19 mm/ year) is evident in monsoon months, while pre-monsoon months show a significant (−1.70 mm/year) decrease in rainfall (Table 5).
The occurrence of severe cyclonic storms in the Bay of Bengal often plays an essential role in this low-lying island’s climatic vulnerability. A prominent increase in both occurrence and intensity was exhibited in the past ten years. Eight cyclonic storms and seven very severe to highly severe cyclones affected the island from 2010 to 2020 compared with only three severe cyclones from 2000 to 2010 (Figure 6).
A crucial outcome of changing climate is sea-level increase which causes severe damage to the coastal ecosystem, infrastructure, and livelihoods [55]. Due to the partial availability of data for Sagar Island, this study considered the sea level data at the nearest station, Diamond Harbor, where a 5.74 mm/year rate of sea level increase has been observed from 1948 to 2015 (Figure 7).
From 1990 to 2020, considerable changes in land use patterns have been associated with coastal erosion. The analysis of the LULC from 1990 and 2020 (Figure 8a,b) shows that significant changes were observed in the water body’s sandy areas, which increased by >30% from the year 1990 to 2020. Apart from increases, the built-up area has significantly increased and taken its toll on cultivated land, the area of which shows a decrease of 26.16% (Table 6 and Figure 9).

4.2. PCA Results and Construction of Vulnerability and Risk Indices

Spatial assessment of a low-lying deltaic island is crucial as such areas are prone to spatiotemporal variations. The first, second, third, and fourth components accounted for around 53% of the measured variables. For the first component, sensitivity and adaptive capacity variables, i.e., food insecurity, homeownership, and household assets, relatively higher loadings were determined (Table 7).
Two-dimensional plotting (Figure 10) of the first and second components, Dhablat, Shibpur, Beguakhali, and Chemaguri, can be identified as negative outliers due to lower adaptive capacity and higher sensitivity; Rudranagar and Gangasagar are on the positive side.
The second component explains that the numbers of people without landholdings, road density, and sanitation crucially affect adaptive measures. The third component reflects variables related to sensitivity, i.e., poverty, agricultural dependency, which have a higher significance. The fourth component explains variables of exposure, i.e., Tmax and Tmin, and the variable of the pucca house as a vital parameter. Derived from the outcomes of the PCA, vulnerability and risk values for all the mouzas were calculated (Table 8) and mapped.
Figure 11 shows mouza hotspots of climate change impacts in terms of vulnerability and risks. This multi-dimensional relative ranking of 41 mouzas indicates that most of the vulnerable communities survive in the marginal areas along the coastline. Shibpur–Dhablat, Beguakhali–Mahismari, and Bankimnagar–Sumatinagar are at high risk, while Kachuberia, Muriganga, Candipur are highly vulnerable but at lower risk of exposure. These location-specific schematic diagrams can effectively target adaptation and mitigation interventions in these geographically homogeneous villages (Figure 12).

5. Discussion

Variations in essential weather and climate parameters have been interconnected with climate change globally [56]. Coastal communities worldwide are threatened by violent cyclones and rising storm surges that cause enormous loss of life and livelihoods [57,58]. Weather parameters play a vital role in the ascription of risk and vulnerability characteristics to any region [59]. Coastal regions are some of the first areas to experience the impacts of a changing climate and are exposed to climate change-related vagaries of nature [60,61]. The climate component of risk analysis in Sagar Island has a uniform influence throughout the region, as spatially explicit climate data information was not used in the study due to the unavailability of such data. Rising storm surges, violent cyclones, and accelerating tidal ingression escalate excessive erosion. The consequences of the overpowering erosion process on human activity and the economy are perfectly portrayed along the coasts of any island system [34,62,63,64,65]. The exposure indices of Tmax, Tmin, and precipitation in the risk analysis have also been used by various workers with similar results [66,67,
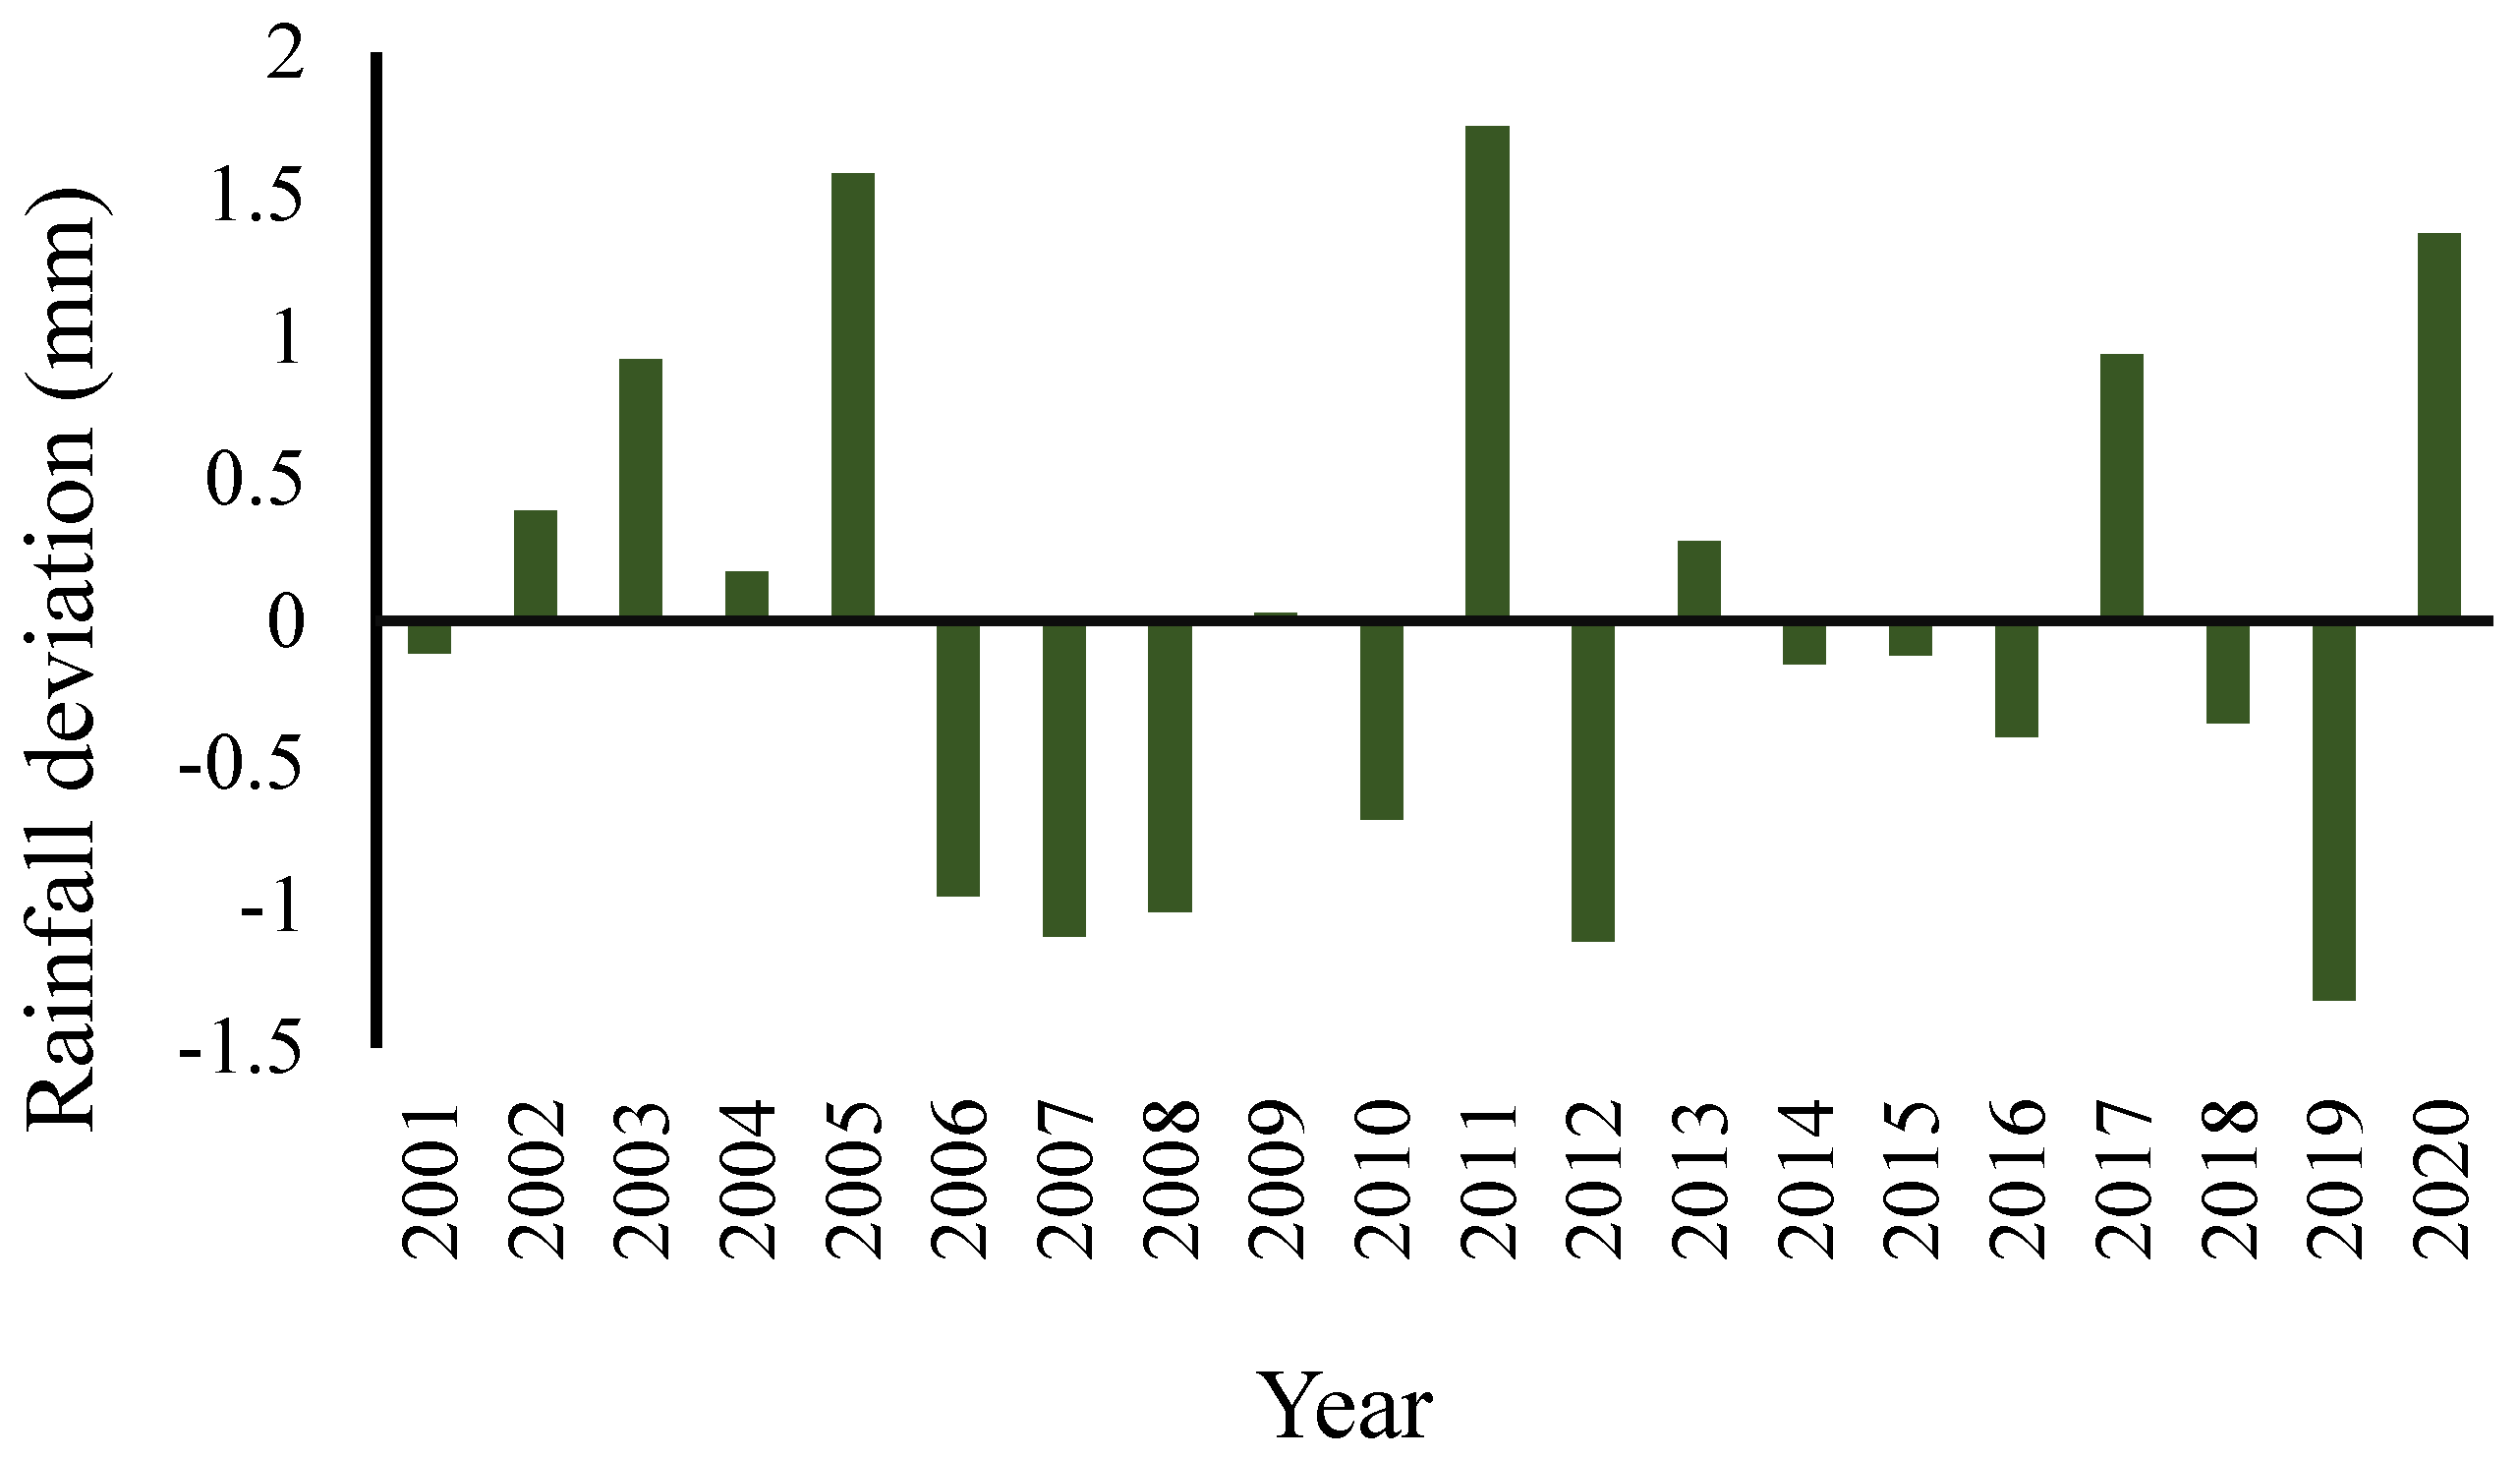
68]. When examining the vulnerability of the state of Georgia in the United States, Binita et al. (2015) discovered that one of the indications of a changing climate is changes in the intensity and frequency of climate extremes. The study recorded temperature and precipitation anomalies that showed overall trends towards dryness and warming climates correlating well with the recent increase in extreme hydroclimatic events [69]. We also observed a similar correlation with the increase in the intensity and severity of the cyclonic events in the Bay of Bengal. Our study shows a decrease in cultivated land and a consequent increase in the land under built-up areas. This has had tremendous implications for the sensitivity and adaptive capacity indices of the risk analysis. The island has become more vulnerable to agriculture-related climate change impacts that will manifest in the loss of livelihoods related to the island’s agricultural sector. A similar finding has also been reported by Kantamaneni et al. (2020). The study suggests that the farmers’ economic resources are being harmed by the climate catastrophe, resulting in significant disruptions to social and cultural activities in these coastal communities. The study concluded that climate change calamities, such as floods, cyclones, and strong winds, contribute to higher agricultural vulnerabilities in the investigated areas [
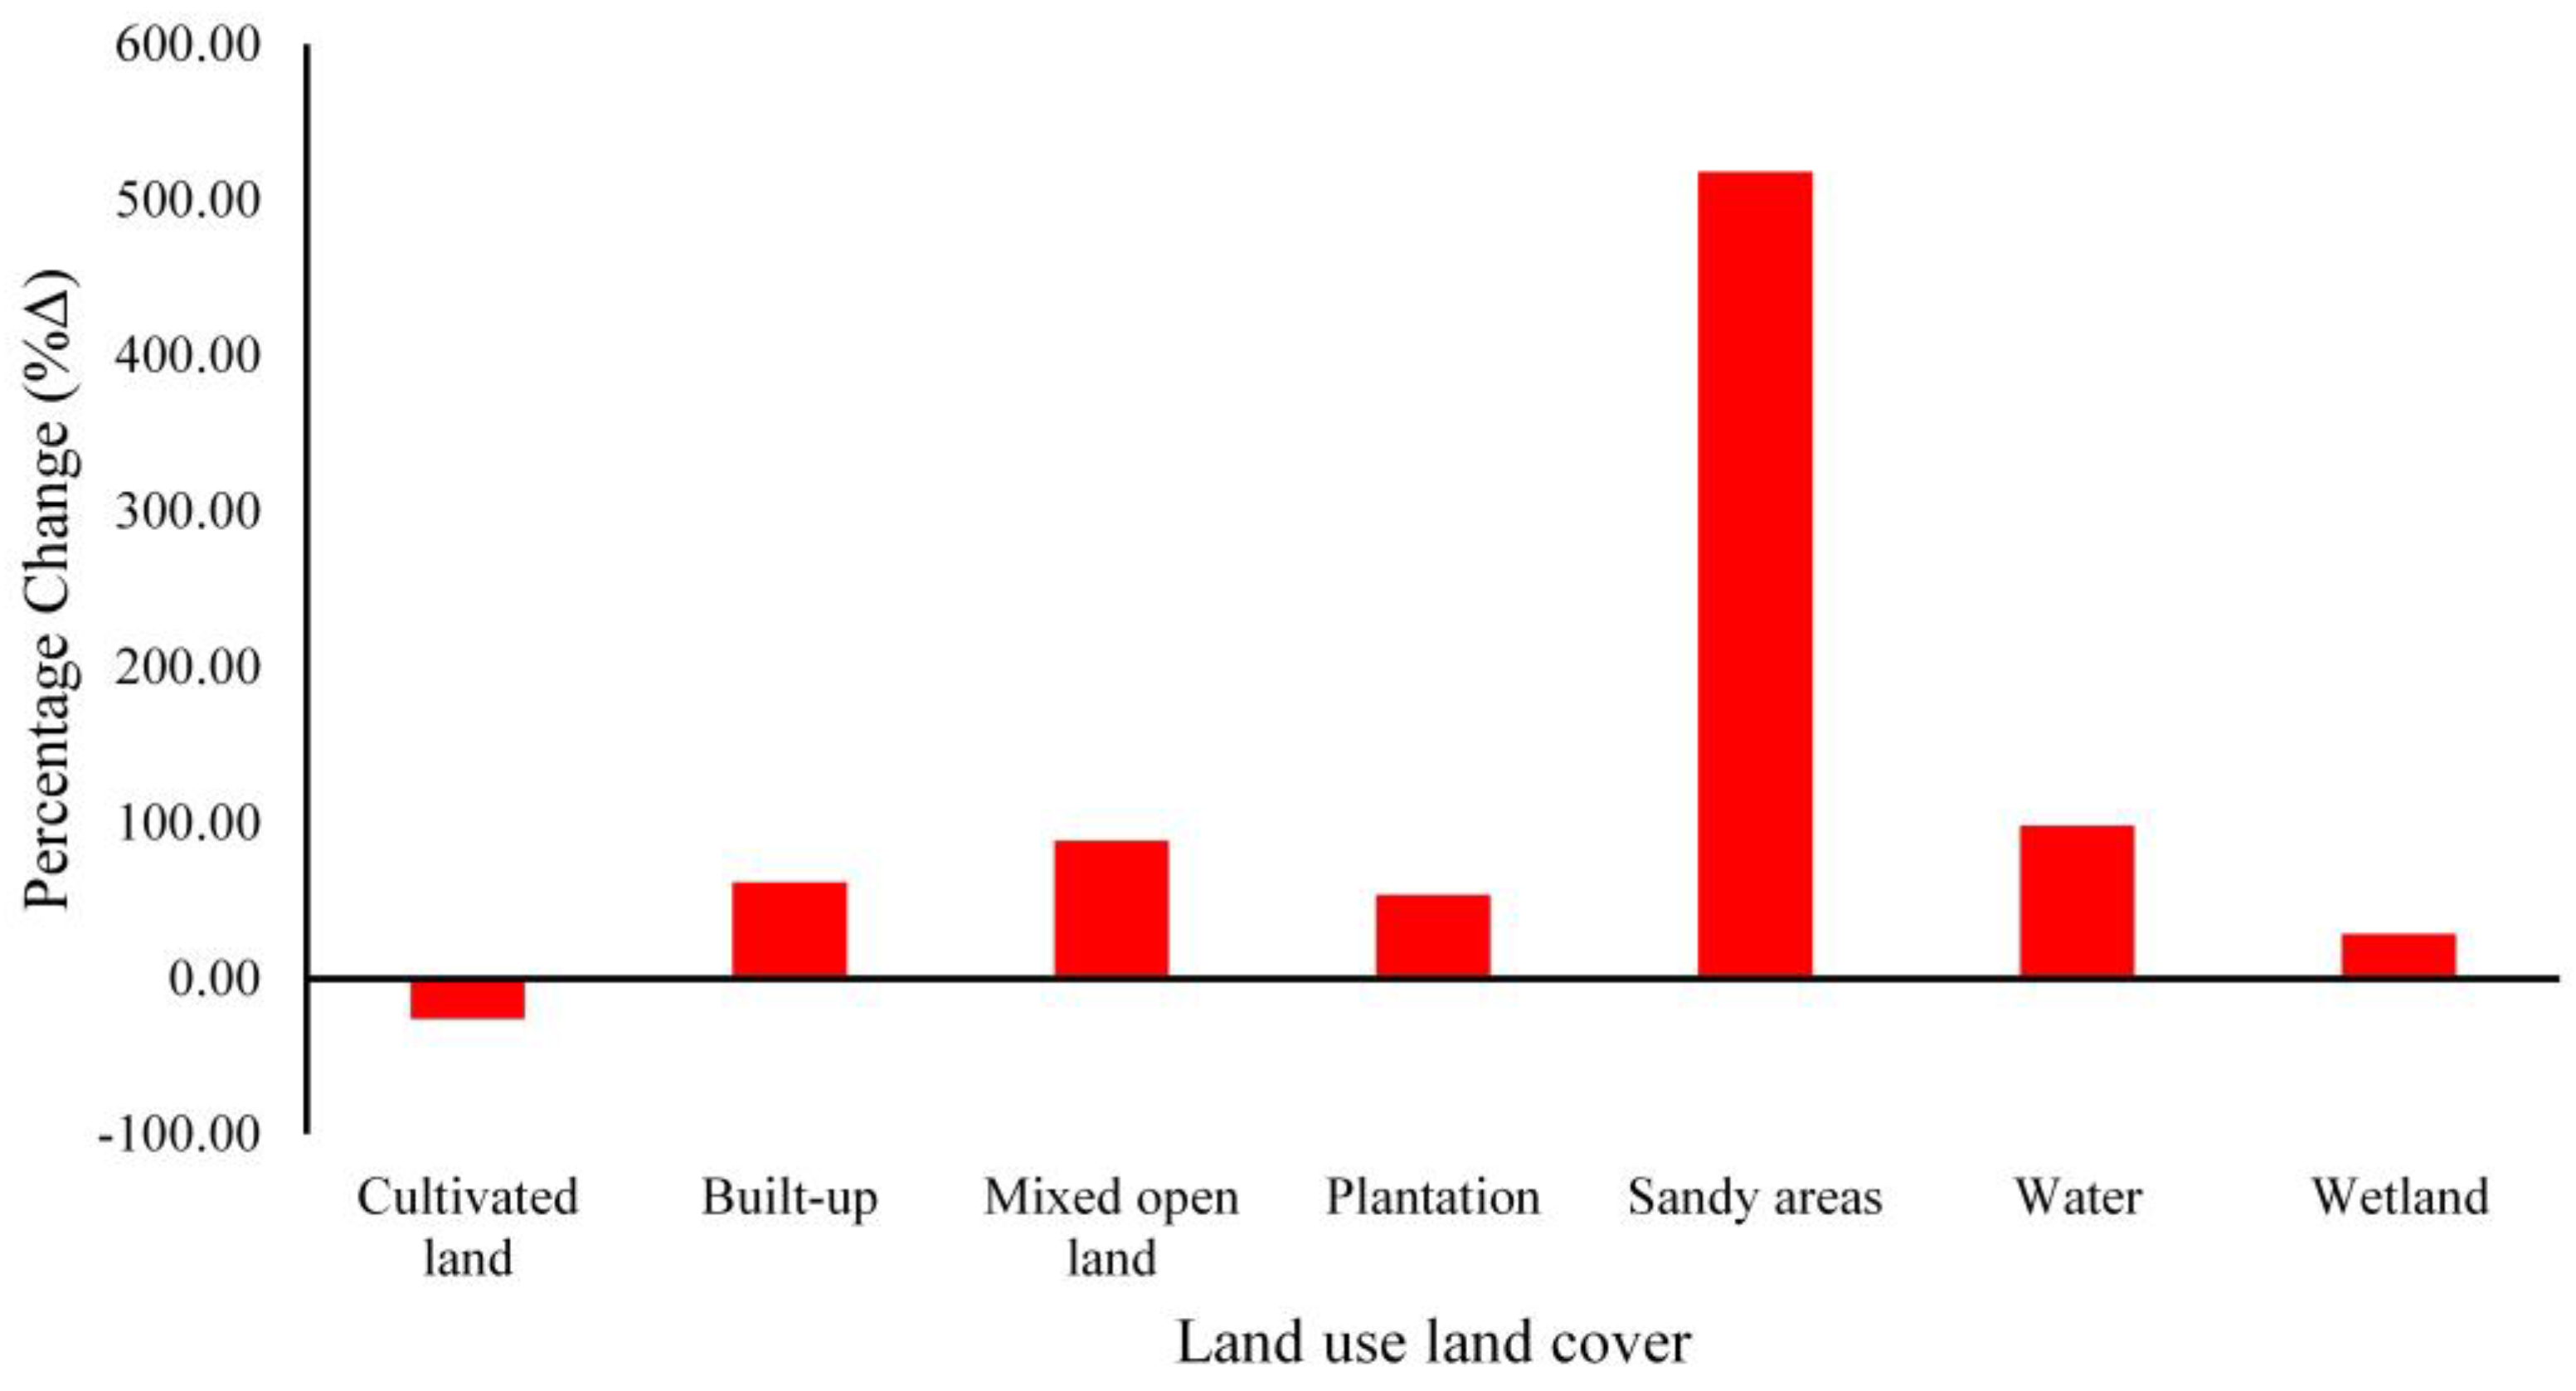
70]. Moreover, our analysis of the LULC information from 1990 and 2020 shows that significant changes were observed in the water body’s sandy areas, which increased by >30% from 1990 to 2020. This increase is attributed to sea level increases due to climate change.
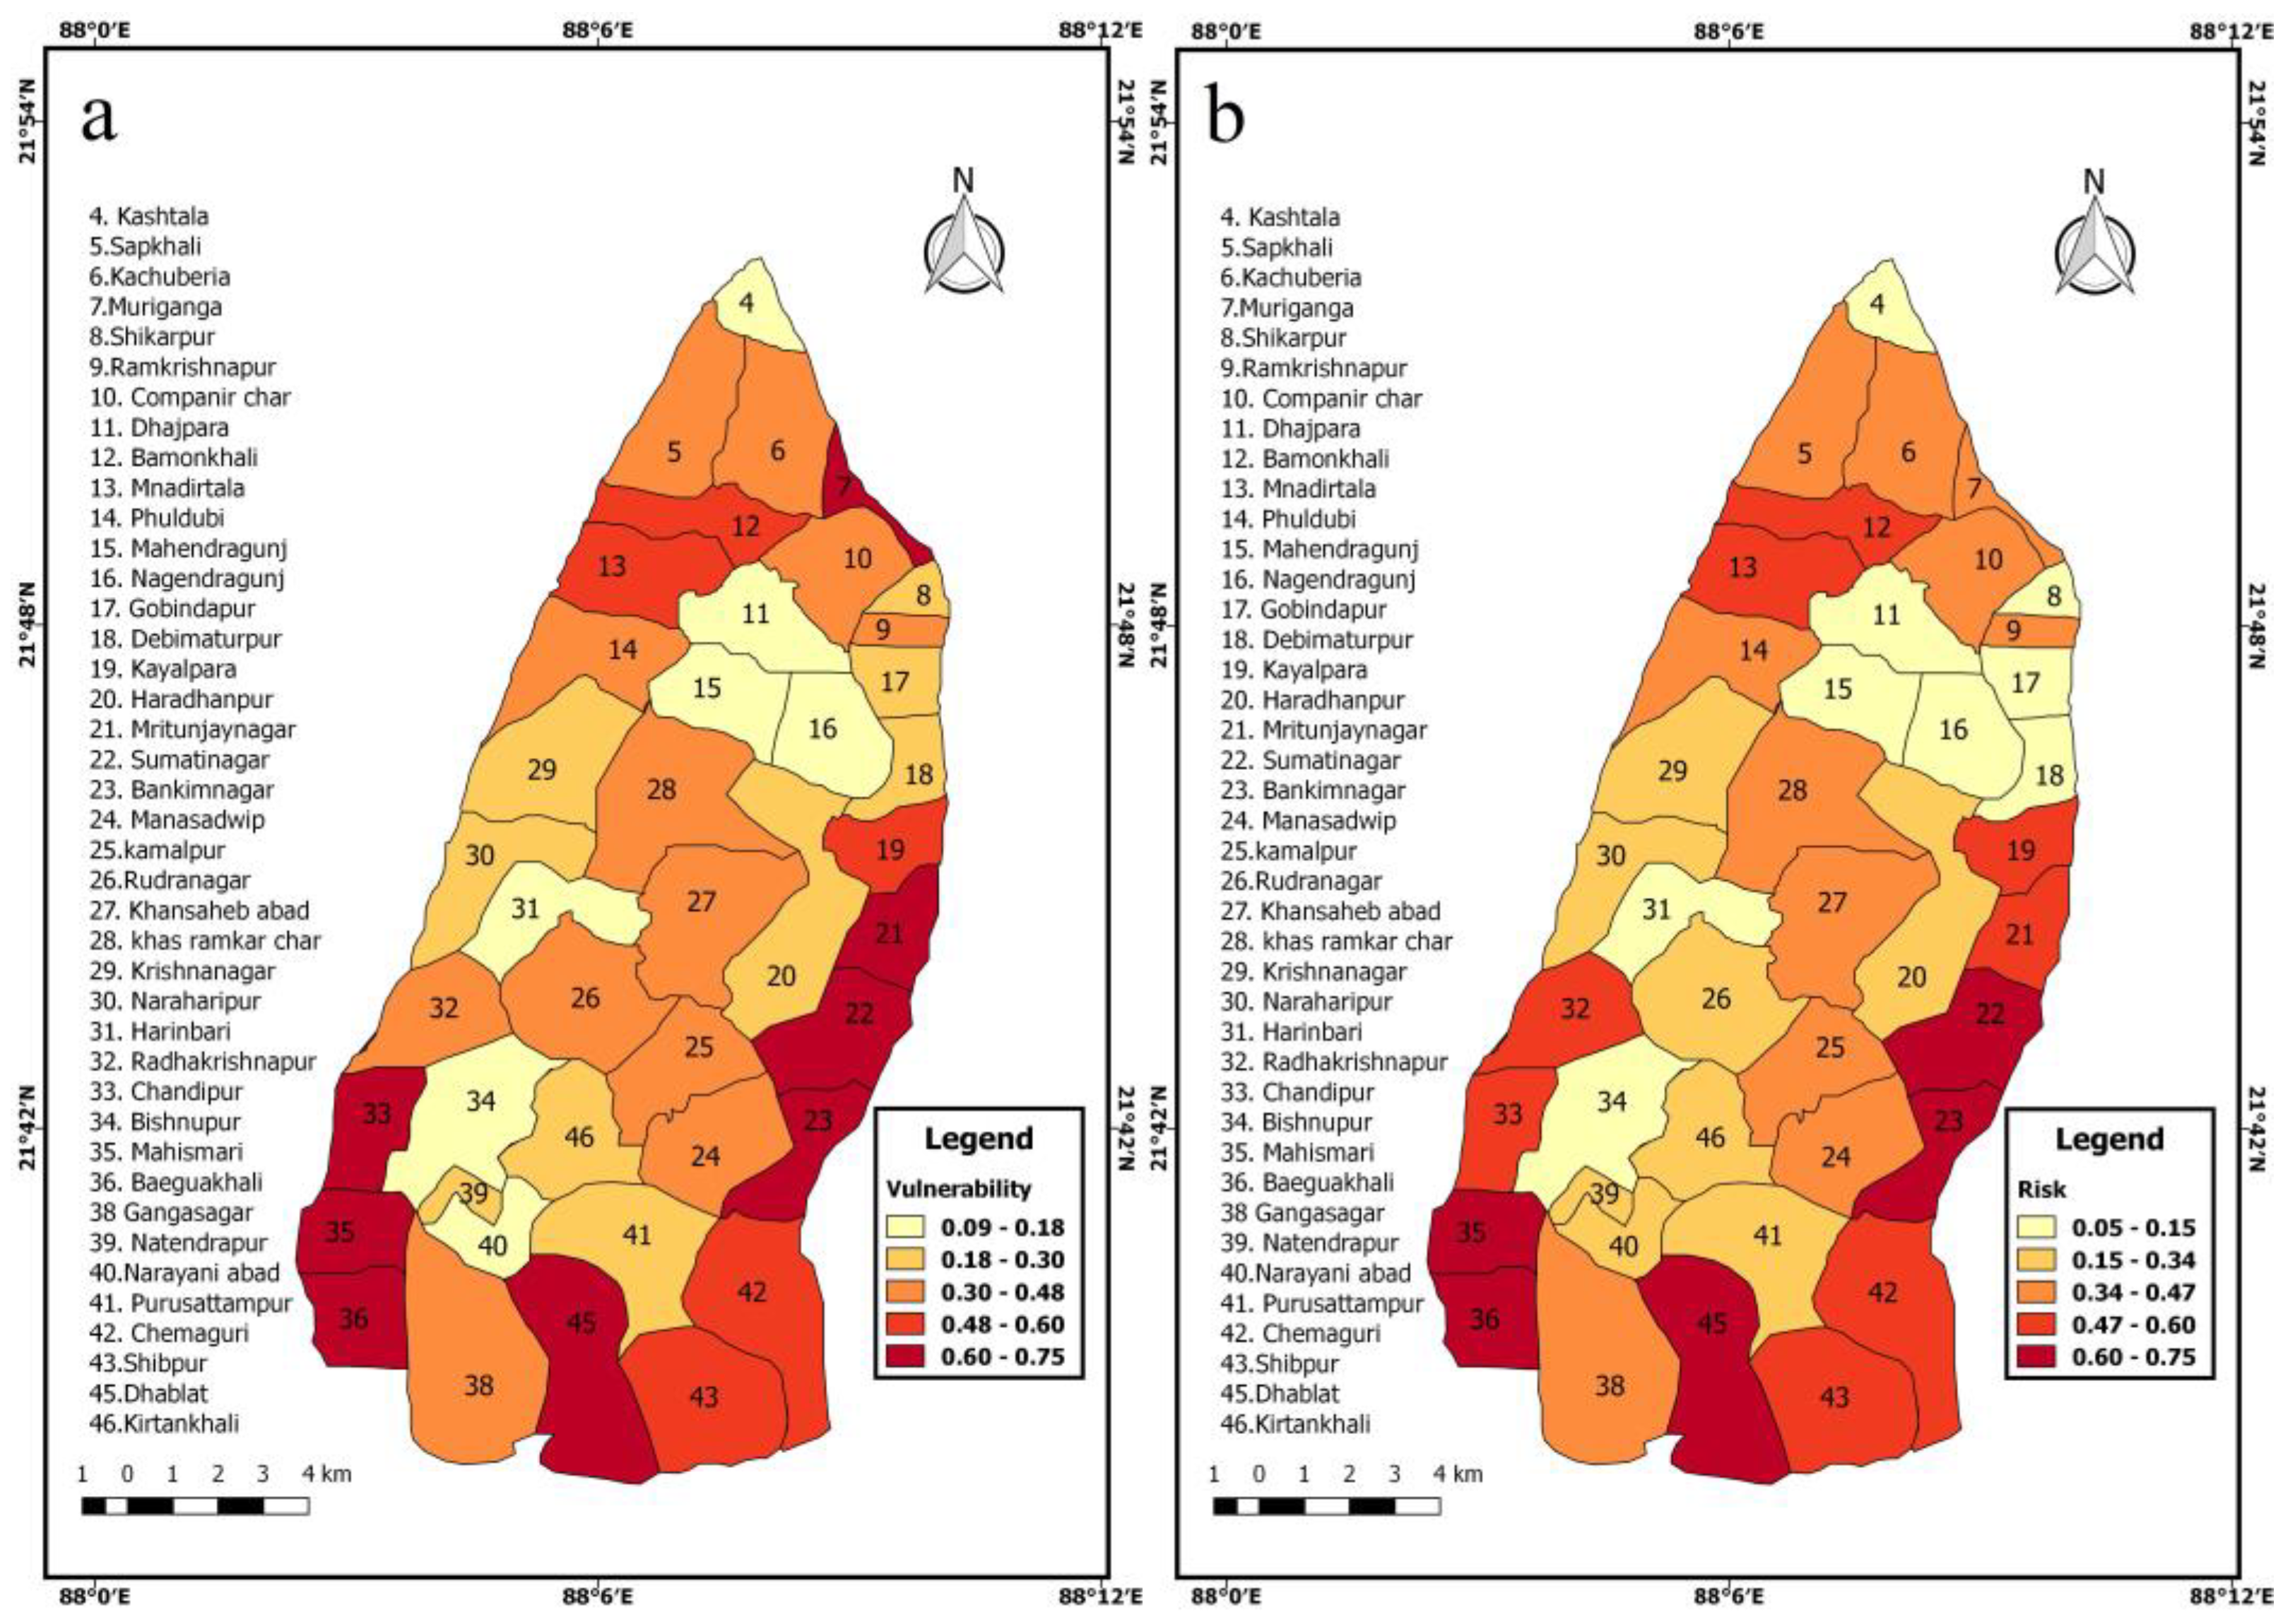
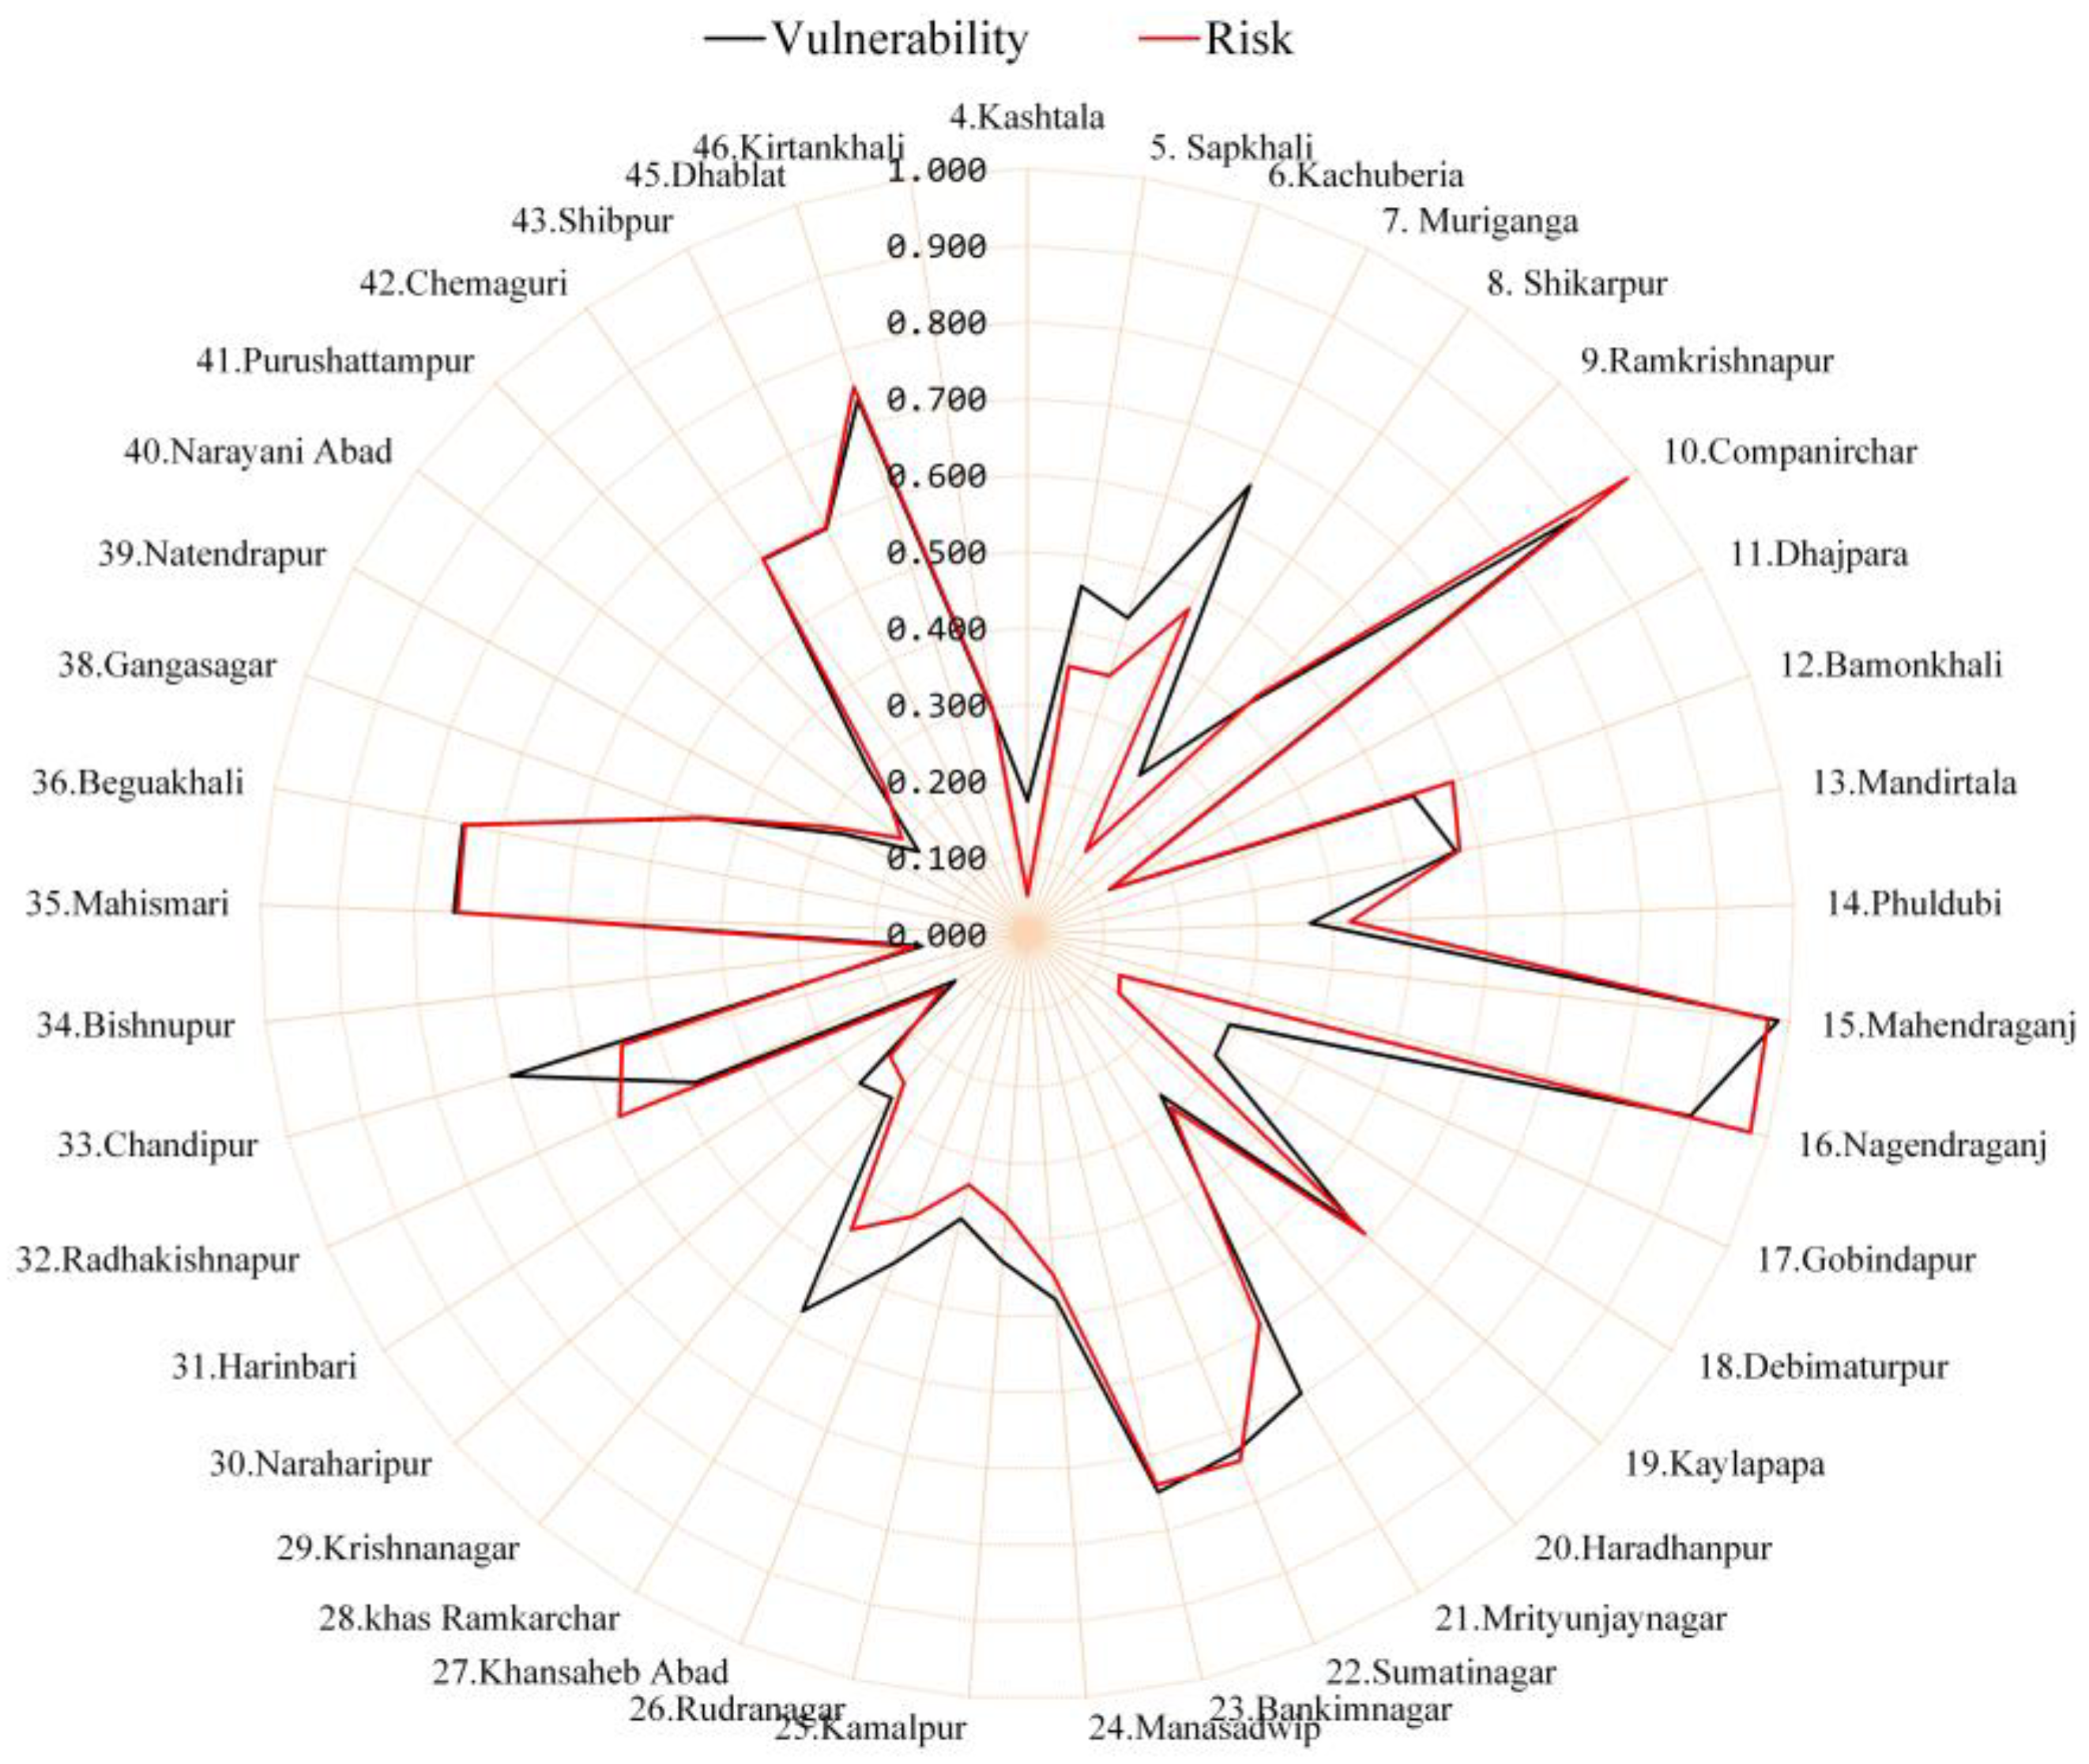
The vulnerability and risk mapping show a minimal significant difference. However, the overall indices nearly reflect the conceptual linkage and slight advantage of the AR5 framework in identifying specific vulnerable communities through more adequate exposure indices [71,72]. Dhablat, Shibpur, and Beguakhaki are the mouzas facing the maximum potential risk of being adversely affected by climate change. These areas require the immediate intervention of the local government and planning authority. IPCC AR4 did not use the elaborate variables or isolate the variables into the four components of risk: exposure, hazard, sensitivity, and adaptive capacity. The revised AR5 methodology is able to capture this intricate relation [73,74,75]. The similar exposure, higher hazard, sensitivity, and lower adaptive capacity render the regions inside the island at high risk. The sensitivity and adaptive capacity parameters have been able to be used to locate the at-risk areas within Sagar Island. Overall, the coastal areas are already under serious threat from climate change impacts, and the areas centrally located on the island are also not safe from the consequences [76,77]. Owing to the diverse variables and different methods used, recognizing the components responsible for heightened vulnerability and comparing them with the indices used turns out to be a complex process. Mouzas in high-risk and vulnerability categories, such as Kirtankhali, Dhablat, Shibpur, Chemaguri, and others, require measures to mitigate the effects of catastrophic events. As a result, it is necessary to provide a beneficial infrastructure that can help the inhabitants cope with disasters, e.g., disaster-resistant shelters, early-warning systems, and coastal protection barricades [78,79].
Furthermore, several IT-based inventions have recently been deployed to prevent disasters in many parts of the world, such as WebGIS-based flood simulation scenarios to help cope with an incoming extreme weather phenomenon [80]. Smartphone-based warning applications can be used to alert residents in an area through the supply of real-time information and can help manage rescue operations [81]. Social media and drone-based surveys can be used to locate the people under threat during an extreme event and are thereby proved to be efficient means of saving lives. These strategies need to be made available through government backing to all the risk-prone areas. The Government of India’s disaster management policies needs to boost and invest in all such innovative technologies. For efficient mitigation at the local scale, robust policies are required in order to allow access to these technologies to the region’s authorities responsible for disaster management. Some of the necessary interventions to assist the mouzas at higher risk and vulnerability are better infrastructural facilities and social benefits, such as health insurance and access to better communication systems [82]. This will ensure that communities live with dignity and a sense of safety that will finally provide them with the required adaptive capacity. For this, administrations have to have a far-sighted approach in devising such policies. This also needs to be collectively handled by various local and international non-governmental organizations involved in adapting and mitigating climate-related hazards.
Programs aimed at improving the socioeconomic health of coastal communities and reducing their overall vulnerability, such as those aimed at providing robust and affordable housing and improving road connectivity, have to be implemented. Modifications to present policies and initiatives to address the particular needs of these coastal areas may further help reduce their risk, as a result of which the communities’ adaptive capacities would be enhanced, minimizing their risk. Adaptive capacity is influenced by poverty, housing quality, and education; therefore, measures aiming at overall socioeconomic betterment are needed in vulnerable areas [83]. The growth of coastal economies and livelihood options, such as fishing, mining, tourism, and sea energy, can assist residents in improving their adaptive capacity. This might significantly impact the region’s socioeconomic demography while also reducing coastal vulnerability. High-risk mouzas are typically densely populated and have a large built-up area. It is necessary to investigate the possibility of transferring critical companies and economic activities to inland areas with reduced hazards. As risk is the function of four components (exposure, hazard, sensitivity, and adaptive capacity), a multi-dimensional methodology for minimizing disasters in vulnerable wards ought to be a requirement for policymakers [84,85,86].

6. Conclusions

Coastal regions worldwide are under increasing threat from risk-associated climate change. To assess the spatial dimensions of risk and planning for its aversion, IPCC AR5 constitutes a methodology that takes into account the hazard, exposure, sensitivity, and adaptive capacity of the inhabitants of vulnerable communities. This study was carried out on Sagar Island, West Bengal, India, which is currently trying to cope with multiple challenges from climate hazards, livelihood vulnerability, and underdevelopment. The present study used an index-based approach to assess the island’s administrative level (mouza) risk and vulnerability for planning management and mitigation strategies. We observed that hazard parameters, such as cyclonic surges, extensive flooding, embankment breaching, and severe erosion, affected the adaptive capacity of the inhabitants. Furthermore, continuous exploitation of natural resources and unsustainable economic activities increase their sensitivity and risk quotients. The results significantly explained various spatially discrete parameters that determined different degrees of exposure, hazard, sensitivity, and adaptive capacity. Dhablat, Shibpur, and Beguakhaki are the mouzas facing the maximum potential risk of being adversely affected by climate change, and these areas need immediate intervention from the local government and planning authority. We propose providing innovative technologies, better healthcare, and communication, along with robust infrastructural facilities, to the most affected mouzas in order for them to increase their adaptive capacities and ultimately reduce their risk quotients.

Author Contributions

Conceptualization, A.B., G.M. and S.K.S.; methodology, A.B., S.K.S., G.M. and M.F.; software, A.B. and G.M.; validation, A.B., G.M., S.K., S.K.S., P.K. and N.S.; formal analysis, A.B., G.M., S.K.S. and M.F.; investigation, A.B., G.M., S.K., S.K.S. and M.F.; resources, P.K. and N.S.; data curation, A.B.; writing—original draft preparation, A.B., G.M. and S.K.S.; writing—review and editing, G.M., S.K.S., and M.F.; visualization, A.B., G.M. and S.K.S.; supervision, S.K. and S.K.S.; project administration, N.S.; funding acquisition, P.K. All authors have read and agreed to the published version of the manuscript.

Funding

This publication is supported by the Asia Pacific Network for Global Change Research (APN) under Collaborative Regional Research Programme (CRRP) with project reference number CRRP2019-01MY-Kumar.

Institutional Review Board Statement

Not applicable.

Informed Consent Statement

Not applicable.

Data Availability Statement

Data available upon request from the authors.

Acknowledgments

The authors express their gratefulness to the three anonymous reviewers for their valuable comments and suggestions on the earlier version of the manuscript that greatly improved its content and structure. The author G.M. is thankful to Department of Science and Technology, Government of India for providing the Fellowship under Scheme for Young Scientists and Technology (SYST-SEED) [Grant no. SP/YO/2019/1362(G) and (C)].

Conflicts of Interest

The authors declare no conflict of interest.

References

  1. Kanga, S.; Meraj, G.; Farooq, M.; Singh, S.K.; Nathawat, M.S. Disasters in the Complex Himalayan Terrains. In Disaster Management in the Complex Himalayan Terrains; Springer: Cham, Switzerland, 2022; pp. 3–10. [Google Scholar]
  2. IPCC. Climate Change 2014: Impacts, Adaptation, and Vulnerability. Part A: Global and Sectoral Aspects. Contribution of Working Group II to the Fifth Assessment Report of the Intergovernmental Panel on Climate Change; Field, C.B., Barros, V.R., Dokken, D.J., Mach, K.J., Mastrandrea, M.D., Bilir, T.E., Chatterjee, M., Ebi, K.L., Estrada, Y.O., Genova, R.C., et al., Eds.; Cambridge University Press: Cambridge, UK; New York, NY, USA, 2014; 1132p. [Google Scholar]
  3. Ericson, J.P.; Vörösmarty, C.J.; Dingman, S.L.; Ward, L.G.; Meybeck, M. Effective sea-level rise and deltas: Causes of change and human dimension implications. Glob. Planet Change 2006, 50, 63–82. [Google Scholar] [CrossRef]
  4. Brown, S.; Nicholls, R.J.; Lázár, A.N.; Hornby, D.D.; Hill, C.; Hazra, S.; Addo, K.A.; Haque, A.; Caesar, J.; Tompkins, E.L. What are the implications of sea-level rise for a 1.5, 2 and 3 °C rise in global mean temperatures in the Ganges-Brahmaputra-Meghna and other vulnerable deltas? Reg. Environ. Chang. 2018, 18, 1829–1842. [Google Scholar] [CrossRef] [Green Version]
  5. Shah, K.U.; Dulal, H.B.; Johnson, C.; Baptiste, A. Understanding livelihood vulnerability to climate change: Applying the livelihood vulnerability index in Trinidad and Tobago. Geoforum 2013, 47, 125–137. [Google Scholar] [CrossRef]
  6. Dasgupta, P.; Morton, J.F.; Dodman, D.; Karapinar, B.; Meza, F.; Rivera-Ferre, M.G.; ToureSarr, A.; Vincent, K.E. Rural areas. In Climate Change 2014: Impacts, Adaptation, and Vulnerability. Part A: Global and Sectoral Aspects. Contribution of Working Group II to the Fifth Assessment Report of the Intergovernmental Panel on Climate Change; Field, C.B., Barros, V.R., Dokken, D.J., Mach, K.J., Mastrandrea, M.D., Bilir, T.E., Chatterjee, M., Ebi, K.L., Estrada, Y.O., Genova, R.C., et al., Eds.; Cambridge University Press: Cambridge, UK; New York, NY, USA, 2014; pp. 613–657. [Google Scholar]
  7. Hahn, M.B.; Riederer, A.M.; Foster, S.O. The livelihood vulnerability index: A pragmatic approach to assessing risks from climate variability and change-a case study in Mozambique. Glob. Environ. Chang. 2009, 19, 74–88. [Google Scholar] [CrossRef]
  8. Szabo, S.; Brondizio, E.; Renaud, F.G.; Hetrick, S.; Nicholls, R.J.; Matthews, Z.; Tessler, Z.; Tejedor, A.; Sebesvari, Z.; Foufoula-Georgiou, E.; et al. Population dynamics, delta vulnerability and environmental change: Comparison of the Mekong, Ganges–Brahmaputra and Amazon delta regions. Sustain. Sci. 2016, 11, 539–554. [Google Scholar] [CrossRef] [Green Version]
  9. Mabogunje, A.L. Poverty and environmental degradation: Challenges within the global economy. Environ. Sci. Policy Sustain. Dev. 2002, 44, 8–19. [Google Scholar] [CrossRef]
  10. Wood, S.A.; Jina, A.S.; Jain, M.; Kristjanson, P.; DeFries, R.S. Smallholder farmer cropping decisions related to climate variability across multiple regions. Glob. Environ. Chang. 2014, 25, 163–172. [Google Scholar] [CrossRef] [Green Version]
  11. Mortreux, C.; de Campos, R.S.; Adger, W.N.; Ghosh, T.; Das, S.; Adams, H.; Hazra, S. Political economy of planned relocation: A model of action and inaction in government responses. Glob. Environ. Chang. 2018, 50, 123–132. [Google Scholar] [CrossRef]
  12. Marcinko, C.L.J.; Nicholls, R.J.; Daw, T.M.; Hazra, S.; Hutton, C.W.; Hill, C.T.; Clarke, D.; Harfoot, A.; Basu, O.; Das, I.; et al. The Development of a Framework for the Integrated Assessment of SDG Trade-Offs in the Sundarban Biosphere Reserve. Water 2021, 13, 528. [Google Scholar] [CrossRef]
  13. Iwasaki, S.; Razafindrabe, B.H.N.; Shaw, R. Fishery livelihoods and adaptation to climate change: A case study of Chilika lagoon, India. Mitig. Adapt. Strateg. Glob. Chang. 2009, 14, 339–355. [Google Scholar] [CrossRef]
  14. Olsson, L.; Opondo, M.; Tschakert, P.; Agrawal, A.; Eriksen, S.H.; Ma, S.; Perch, L.N.; Zakieldeen, S.A. Livelihoods and poverty. In Climate Change 2014: Impacts, Adaptation, and Vulnerability. Part A: Global and Sectoral Aspects. Contribution of Working Group II to the Fifth Assessment Report of the Intergovernmental Panel on Climate Change; Field, C.B., Barros, V.R., Dokken, D.J., Mach, K.J., Mastrandrea, M.D., Bilir, T.E., Chatterjee, M., Ebi, K.L., Estrada, Y.O., Genova, R.C., et al., Eds.; Cambridge University Press: Cambridge, UK; New York, NY, USA, 2014; pp. 793–832. [Google Scholar]
  15. Gopinath, G. Critical coastal issues of Sagar Island, east coast of India. Environ. Monit. Assess. 2010, 160, 555–561. [Google Scholar] [CrossRef] [PubMed]
  16. Mukherjee, N.; Siddique, G.; Basak, A.; Roy, A.; Mandal, M.H. Climate change and livelihood vulnerability of the local population on Sagar Island, India. Chin. Geogr. Sci. 2019, 29, 417–436. [Google Scholar] [CrossRef] [Green Version]
  17. Hazra, S.; Mukhopadhyay, A.; Ghosh, A.R.; Mitra, D.; Dadhwal, V.K. (Eds.) Environment and Earth Observation. Part of the Springer Remote Sensing/Photogrammetry Book Series (SPRINGERREMO); Springer: Berlin/Heidelberg, Germany, 2017; pp. 153–172. [Google Scholar] [CrossRef]
  18. Dieng, H.; Cazenave, A.; Meyssignac, B.; Ablain, M. New estimate of the current rate of sea level rise from a sea level budget approach. Geophys. Res. Lett. 2017, 44, 3744–3751. [Google Scholar] [CrossRef]
  19. WCRP Global Sea Level Budget Group. Global sea level budget 1993-present. Earth Syst. Sci. Data 2018, 10, 1551–1590. [Google Scholar] [CrossRef] [Green Version]
  20. Bera, A.; Taloor, A.K.; Meraj, G.; Kanga, S.; Singh, S.K.; Đurin, B.; Anand, S. Climate vulnerability and economic determinants: Linkages and risk reduction in Sagar Island, India; A geospatial approach. Quat. Sci. Adv. 2021, 4, 100038. [Google Scholar] [CrossRef]
  21. Singh, O.P. Long term trends in the frequency of severe cyclone of Bay of Bengal: Observation and simulations. Mousam 2007, 58, 59–66. [Google Scholar] [CrossRef]
  22. Ghosh, U.; Kjosavik, D.J.; Bose, S. The certainty of uncertainty: Climate change realities of the Indian Sundarbans. In The Politics of Climate Change and Uncertainty in India; Routledge: London, UK, 2021; pp. 107–133. [Google Scholar]
  23. IPCC. Climate Change 2007: Impacts, Adaptation and Vulnerability. Contribution of Working Group II to the Fourth Assessment Report of the Intergovernmental Panel on Climate Change; Parry, M.L., Canziani, O.F., Palutik, J.P., van der Linden, P.J., Hanson, C.E., Eds.; Cambridge University Press: Cambridge, UK, 2007; 976p. [Google Scholar]
  24. IPCC. Climate Change 2001: Impacts, Adaptation, and Vulnerability. Contribution of Working Group II to the Third Assessment Report; Cambridge University Press: Cambridge, UK, 2001. [Google Scholar]
  25. Gbetibouo, G.A.; Ringler, C.; Hassan, R. Vulnerability of the South African farming sector to climate change and variability: An indicator approach. Nat. Resour. Forum 2010, 34, 175–187. [Google Scholar] [CrossRef]
  26. Eriksen, S.H.; Kelly, P.M. Developing credible vulnerability indicators for climate adaptation policy assessment. Mitig. Adapt. Strateg. Glob. Chang. 2007, 12, 495–524. [Google Scholar] [CrossRef]
  27. Mondal, A.; Khare, D.; Kundu, S. Spatial and temporal analysis of precipitation and temperature trend of India. Theor. Appl. Climatol. 2015, 122, 143–158. [Google Scholar] [CrossRef]
  28. Preston, B.L.; Yuen, E.J.; Westaway, R.M. Putting vulnerability to climate change on the map: A review of approaches, benefits, and risks. Sustain. Sci. 2011, 6, 177–202. [Google Scholar] [CrossRef]
  29. Bera, A.; Singh, S.K. Comparative Assessment of Livelihood Vulnerability of Climate Induced Migrants: A Micro Level Study on Sagar Island, India. Sustain. Agri Food Environ. Res. 2021, 9, 216–230. [Google Scholar] [CrossRef]
  30. Census of India. Primary Census Abstract. North 24 Parganasand South 24 Parganas: Office of the Registrar General and Commissioner, Government of India. 2011. Available online: https://censusindia.gov.in/pca/cdb_pca_census/houselisting-housing-wb.html (accessed on 25 December 2021).
  31. Hajra, R.; Ghosh, A.; Ghosh, T. Comparative Assessment of Morphological and Landuse/Landcover Change Pattern of Sagar, Ghoramara, and Mousani Island of Indian Sundarban Delta Through Remote Sensing. In Environment and Earth Observation; Hazra, S., Mukhopadhyay, A., Ghosh, A., Mitra, D., Dadhwal, V., Eds.; Springer: Cham, Switzerland, 2017. [Google Scholar]
  32. Mandal, S.; Choudhury, B.U. Estimation and prediction of maximum daily precipitation at Sagar Island using best fit probability models. Theor. Appl. Climatol. 2015, 121, 87–97. [Google Scholar] [CrossRef]
  33. Gopinath, G.; Seralathan, P. Rapid erosion of the coast of Sagar Island, West Bengal–India. Environ. Geol. 2005, 48, 1058–1067. [Google Scholar] [CrossRef]
  34. Kumar, P.; Avtar, R.; Dasgupta, R.; Johnson, B.A.; Mukherjee, A.; Ahsan, M.N.; Nguyen, D.C.H.; Nguyen, H.Q.; Shaw, R.; Mishra, B.K. Socio-hydrology: A key approach for adaptation to water scarcity and achieving human well-being in large riverine islands. Prog. Disaster Sci. 2020, 8, 100134. [Google Scholar] [CrossRef]
  35. Hazra, S.; Ghosh, T.; Das Gupta, R.; Sen, G. Sea level and associated changes in the Sundarbans. Sci. Cult. 2002, 68, 309–321. [Google Scholar]
  36. Indian Meteorological Department, 1901–2017. Ministry of Earth Sciences, Government of India. Available online: https://mausam.imd.gov.in/imd_latest/contents/satellite.php (accessed on 25 October 2021).
  37. Das, P.; Das, A.; Roy, S. Shrimp fry (meen) farmers of Sundarban Mangrove Forest (India): A tale of ecological damage and economic hardship. Int. J. Agric. Food Res. 2016, 5, 28–41. [Google Scholar] [CrossRef]
  38. Allen, J.R. A review of the origin and characteristics of recent alluvial sediments. Sedimentology 1965, 5, 89–191. [Google Scholar] [CrossRef]
  39. Cannon, T.; Twigg, J.; Rowell, J. Social Vulnerability, Sustainable Livelihoods and Disasters. 2003. Available online: https://d1wqtxts1xzle7.cloudfront.net/37233103/CannonTwiggRowellDfidSocialVulnerabilityLivelihoods-with-cover-page-v2.pdf?Expires=1646380822&Signature=gj4QsSOXqSQT4DhYDVooFDkoS7QAJPwyQolXfxGa0PkXlwQj64rk~milxSkCZgJGrWJv8ziWgw~AWP9lUXDGodmuV0VSuG09BDksmsA1Ra8b9VL1pbUISgqTw03KWIxHhYyDU~uRIjm8J4E-eyxrLcj3Fj5cTykrUetcHoaXFF-DtQBot~iKC-S~l6OpPMKoiPN-UafEOWUYIUqkpJ653iHWdFSlIytbJU-g--tCdCtZLS-iwMBNO2bPb1BBINRgposZuuqRWotOEQPbzyrd0rZ8jy8IUeL1rasTdoa5x83cmwSUtxQXno3YXoe~4ArTgODtBm~AZKxPxmOs~Lczdw__&Key-Pair-Id=APKAJLOHF5GGSLRBV4ZA (accessed on 25 October 2021).
  40. Patt, A.G.; Tadross, M.; Nussbaumer, P.; Asante, K.; Metzger, M.; Rafael, J.; Goujon, A.; Brundrit, G. Estimating least-developed countries’ vulnerability to climate-related extreme events over the next 50 years. Proc. Natl. Acad. Sci. USA 2010, 107, 1333–1337. [Google Scholar] [CrossRef] [Green Version]
  41. Bush, M.J. Climate Change Adaptation in Small Island Developing States; John Wiley & Sons: Hoboken, NJ, USA, 2018. [Google Scholar]
  42. Hobday, A.J.; Chambers, L.E.; Arnould, J.P. Prioritizing climate change adaptation options for iconic marine species. Biodivers. Conserv. 2015, 24, 3449–3468. [Google Scholar] [CrossRef]
  43. Hossain, B.; Sohel, M.S.; Ryakitimbo, C.M. Climate change induced extreme flood disaster in Bangladesh: Implications on people’s livelihoods in the Char Village and their coping mechanisms. Prog. Disaster Sci. 2020, 6, 100079. [Google Scholar] [CrossRef]
  44. Singha, P.; Das, P.; Talukdar, S.; Pal, S. Modeling livelihood vulnerability in erosion and flooding induced river island in Ganges riparian corridor, India. Ecol. Indic. 2020, 119, 106825. [Google Scholar] [CrossRef]
  45. IPCC. Summary for policymakers. In Climate Change 2014: Impacts, Adaptation, and Vulnerability. Part A: Global and Sectoral Aspects. Contribution of Working Group II to the Fifth Assessment Report of the Intergovernmental Panel on Climate Change; Field, C.B., Barros, V.R., Dokken, D.J., Mach, K.J., Mastrandrea, M.D., Bilir, T.E., Chatterjee, M., Ebi, K.L., Estrada, Y.O., Genova, R.C., et al., Eds.; Cambridge University Press: Cambridge, UK; New York, NY, USA, 2014. [Google Scholar]
  46. Vincent, K. Creating an index of social vulnerability to climate change for Africa. Tyndall Cent. Clim. Change Res. 2004, 56, 41. [Google Scholar]
  47. Vijaya, K. Constructing an Area-Based Socioeconomic Index: A Principal Components Analysis Approach; Early Child Development Mapping Project: Edmonton, AB, Canada, 2010. [Google Scholar]
  48. Resio, D.T.; Irish, J.L. Tropical cyclone storm surge risk. Curr. Clim. Change Rep. 2015, 1, 74–84. [Google Scholar] [CrossRef] [Green Version]
  49. Rahman, M.M.; Ghosh, T.; Salehin, M.; Ghosh, A.; Haque, A.; Hossain, M.A.; Das, S.; Hazra, S.; Islam, N.; Sarker, M.H.; et al. Ganges-Brahmaputra-Meghna Delta, Bangladesh and India: A Transnational Mega-Delta. In Deltas in the Anthropocene; Nicholls, R., Adger, W., Hutton, C., Hanson, S., Eds.; Palgrave Macmillan: Cham, Switzerland, 2020. [Google Scholar] [CrossRef] [Green Version]
  50. Kanga, S.; Meraj, G.; Das, B.; Farooq, M.; Chaudhuri, S.; Singh, S.K. Modeling the spatial pattern of sediment flow in lower Hugli estuary, West Bengal, India by quantifying suspended sediment concentration (SSC) and depth conditions using geoinformatics. Appl. Comput. Geosci. 2020, 8, 100043. [Google Scholar] [CrossRef]
  51. Tomar, P.; Singh, S.K.; Kanga, S.; Meraj, G.; Kranjčić, N.; Đurin, B.; Pattanaik, A. GIS-Based Urban Flood Risk Assessment and Management—A Case Study of Delhi National Capital Territory (NCT), India. Sustainability 2021, 13, 12850. [Google Scholar] [CrossRef]
  52. Mondal, I.; Bandyopadhyay, J.; Dhara, S. Detecting shoreline changing trends using principle component analysis in Sagar Island, West Bengal, India. Spat. Inf. Res. 2017, 25, 67–73. [Google Scholar] [CrossRef]
  53. Meraj, G.; Romshoo, S.A.; Ayoub, S.; Altaf, S. Geoinformatics based approach for estimating the sediment yield of the mountainous watersheds in Kashmir Himalaya, India. Geocarto Int. 2018, 33, 1114–1138. [Google Scholar] [CrossRef]
  54. Füssel, H.M.; Klein, R.J. Climate change vulnerability assessments: An evolution of conceptual thinking. Clim. Chang. 2006, 75, 301–329. [Google Scholar] [CrossRef]
  55. Resurrección, B.P. Persistent women and environment linkages in climate change and sustainable development agendas. Women’s Stud. Int. Forum 2013, 40, 33–43. [Google Scholar] [CrossRef]
  56. Sarkar, S.; Bardhan, S.; Sanyal, P. LULC Change Detection Studies and Its Possible Linkages with IncreasedVisitation in the Sagar Island, W.B. Int. J. Eng. Trends Technol. 2021, 69, 49–61. [Google Scholar] [CrossRef]
  57. Jayaram, K.S.; Mitra, D.; Mishra, A.K. Coastal geomorphological and land use Land cover study of Sagar Island, Bay of Bengal, India using remotely sensed data. Int. J. Remote Sens. 2006, 27, 3671–3682. [Google Scholar] [CrossRef]
  58. Saha, C.K. Dynamics of disaster-induced risk in southwestern coastal Bangladesh: An analysis on tropical Cyclone Aila 2009. Nat. Hazards 2015, 75, 727–754. [Google Scholar] [CrossRef]
  59. Ahmad, N.; Hussain, M.; Riaz, N.; Subhani, F.; Haider, S.; Alamgir, K.S.; Shinwari, F. Flood prediction and disaster risk analysis using GIS based wireless sensor networks, a review. J. Basic Appl. Sci. Res. 2013, 8, 632–643. [Google Scholar]
  60. Dhiman, R.; VishnuRadhan, R.; Eldho, T.I.; Inamdar, A. Flood risk and adaptation in Indian coastal cities: Recent scenarios. Appl. Water Sci. 2019, 9, 1–6. [Google Scholar] [CrossRef] [Green Version]
  61. Mukherjee, N.; Siddique, G. Assessment of climatic variability risks with application of livelihood vulnerability indices. Environ. Dev. Sustain. 2020, 22, 5077–5103. [Google Scholar] [CrossRef]
  62. Barua, P.; Rahman, S.H. Community-based rehabilitation attempt for solution of climate displacement crisis in the coastal area of Bangladesh. Int. J. Migr. Resid. Mobil. 2018, 1, 358–378. [Google Scholar] [CrossRef]
  63. Swain, D. Tropical Cyclones and Coastal Vulnerability: Assessment and Mitigation. In Geospatial Technologies for Land and Water Resources Management; Springer: Cham, Switzerland, 2022; pp. 587–621. [Google Scholar]
  64. von Storch, H.; Fennel, K.; Jensen, J.; Lewis, K.A.; Ratter, B.; Schlurmann, T.; Wahl, T.; Zhang, W. Climate and Coast: Overview and Introduction. Oxf. Res. Encycl. Clim. Sci. 2021. [Google Scholar]
  65. Sharma, D.; Rao, K.; Ramanathan, A.L. A Systematic Review on the Impact of Urbanization and Industrialization on Indian Coastal Mangrove Ecosystem. Coast. Ecosyst. 2022, 38, 175–199. [Google Scholar]
  66. Sadeqi, A.; Kahya, E. Spatiotemporal analysis of air temperature indices, aridity conditions, and precipitation in Iran. Theor. Appl. Climatol. 2021, 145, 703–716. [Google Scholar] [CrossRef]
  67. Chen, Y.; Liao, Z.; Shi, Y.; Tian, Y.; Zhai, P. Detectable increases in sequential flood-heatwave events across China during 1961–2018. Geophys. Res. Lett. 2021, 48, e2021GL092549. [Google Scholar] [CrossRef]
  68. Mie Sein, Z.M.; Ullah, I.; Syed, S.; Zhi, X.; Azam, K.; Rasool, G. Interannual variability of air temperature over Myanmar: The influence of ENSO and IOD. Climate 2021, 9, 35. [Google Scholar] [CrossRef]
  69. Binita, K.C.; Shepherd, J.M.; Gaither, C.J. Climate change vulnerability assessment in Georgia. Appl. Geogr. 2015, 62, 62–74. [Google Scholar]
  70. Kantamaneni, K.; Rice, L.; Yenneti, K.; Campos, L.C. Assessing the vulnerability of agriculture systems to climate change in coastal areas: A novel index. Sustainability 2020, 12, 4771. [Google Scholar] [CrossRef]
  71. Nguyen, K.A.; Liou, Y.A.; Terry, J.P. Vulnerability of Vietnam to typhoons: A spatial assessment based on hazards, exposure and adaptive capacity. Sci. Total Environ. 2019, 682, 31–46. [Google Scholar] [CrossRef]
  72. Williams, P.A.; Crespo, O.; Abu, M. Assessing vulnerability of horticultural smallholders’ to climate variability in Ghana: Applying the livelihood vulnerability approach. Environ. Dev. Sustain. 2020, 22, 2321–2342. [Google Scholar] [CrossRef]
  73. Viner, D.; Ekstrom, M.; Hulbert, M.; Warner, N.K.; Wreford, A.; Zommers, Z. Understanding the dynamic nature of risk in climate change assessments—A new starting point for discussion. Atmos. Sci. Lett. 2020, 21, e958. [Google Scholar] [CrossRef] [Green Version]
  74. Akter, M.; Jahan, M.; Kabir, R.; Karim, D.S.; Haque, A.; Rahman, M.; Salehin, M. Risk assessment based on fuzzy synthetic evaluation method. Sci. Total Environ. 2019, 658, 818–829. [Google Scholar] [CrossRef] [PubMed]
  75. Wang, G.; Liu, Y.; Hu, Z.; Lyu, Y.; Zhang, G.; Liu, J.; Liu, Y.; Gu, Y.; Huang, X.; Zheng, H.; et al. Flood risk assessment based on fuzzy synthetic evaluation method in the Beijing-Tianjin-Hebei metropolitan area, China. Sustainability 2020, 12, 1451. [Google Scholar] [CrossRef] [Green Version]
  76. Toimil, A.; Losada, I.J.; Nicholls, R.J.; Dalrymple, R.A.; Stive, M.J. Addressing the challenges of climate change risks and adaptation in coastal areas: A review. Coast. Eng. 2020, 156, 103611. [Google Scholar] [CrossRef]
  77. Abedin, M.; Collins, A.E.; Habiba, U.; Shaw, R. Climate change, water scarcity, and health adaptation in southwestern coastal Bangladesh. Int. J. Disaster Risk Sci. 2019, 10, 28–42. [Google Scholar] [CrossRef] [Green Version]
  78. Farooq, M.; Singh, S.K.; Kanga, S. Mainstreaming adaptation strategies in relevant flagship schemes to overcome vulnerabilities of climate change to agriculture sector. Res. J. Agri. Sci. Int. J. 2021, 12, 637–646. [Google Scholar]
  79. Bowen, T.; Del Ninno, C.; Andrews, C.; Coll-Black, S.; Johnson, K.; Kawasoe, Y.; Kryeziu, A.; Maher, B.; Williams, A. Adaptive Social Protection: Building Resilience to Shocks; World Bank Publications: Herndon, VA, USA, 2020. [Google Scholar]
  80. Sudipta, C.; Kambekar, A.R.; Arnab, S. Impact of Climate Change on Sea Level Rise along the Coastline of Mumbai City, India. Int. J. Mar. Environ. Sci. 2021, 15, 164–170. [Google Scholar]
  81. Sun, W.; Bocchini, P.; Davison, B.D. Applications of artificial intelligence for disaster management. Nat. Hazards 2020, 103, 2631–2689. [Google Scholar] [CrossRef]
  82. Jongman, B. Effective adaptation to rising flood risk. Nat. Commun. 2018, 9, 1–3. [Google Scholar] [CrossRef] [PubMed] [Green Version]
  83. Devkota, N.; Phuyal, R.K.; Shrestha, D.L. Perception, determinants and barriers for the adoption of climate change adaptation options among Nepalese rice farmers. Agric. Sci. 2018, 9, 272–298. [Google Scholar] [CrossRef] [Green Version]
  84. Zhang, M.; Liu, Z.; van Dijk, M.P. Measuring urban vulnerability to climate change using an integrated approach, assessing climate risks in Beijing. PeerJ 2019, 7, e7018. [Google Scholar] [CrossRef] [Green Version]
  85. Mysiak, J.; Torresan, S.; Bosello, F.; Mistry, M.; Amadio, M.; Marzi, S.; Furlan, E.; Sperotto, A. Climate risk index for Italy. Philosophical Transactions of the Royal Society A: Mathematical. Phys. Eng. Sci. 2018, 376, 20170305. [Google Scholar]
  86. Aznar-Crespo, P.; Aledo, A.; Melgarejo-Moreno, J.; Vallejos-Romero, A. Adapting social impact assessment to flood risk management. Sustainability 2021, 13, 3410. [Google Scholar] [CrossRef]
Figure 1. Map showing (a) the location of the West Bengal (WB) in relation to India, (b) Sagar Island in the southwestern corner of the WB, and (c) Sagar Island with mouza boundaries.
Water 14 00823 g001
Figure 2. Study area: Sagar Island, administrative setting; Cartosat: 1 DEM; Spatial Resolution: 30 mts; Date stamp: 29 April 2015; Geographic datum: WGS-84.
Water 14 00823 g002
Figure 3. Graphical representation of the overall methodology.
Water 14 00823 g003
Figure 4. The trend in average annual temperature.
Water 14 00823 g004
Figure 5. Annual rainfall distribution for Sagar Island.
Water 14 00823 g005
Figure 6. Occurrence and intensity of cyclonic storms. Severity scale: 1, Cyclonic Storm (CS); 2, Severe Cyclonic Storm (SCS); 3, Very Severe Cyclonic Storm (VSCS); 4, Extremely Severe Cyclonic Storm (SSCS).
Water 14 00823 g006
Figure 7. Sea levels at Diamond Harbor Station (near Sagar Island) (1950–2015).
Water 14 00823 g007
Figure 8. Land use and land cover analysis: (a) 1990; (b) 2020.
Water 14 00823 g008
Figure 9. Changes in land use and land cover of Sagar Island (1990 and 2020).
Water 14 00823 g009
Figure 10. Two-dimensional PCA plot.
Water 14 00823 g010
Figure 11. (a) Vulnerability and (b) risk maps of Sagar Island.
Water 14 00823 g011
Figure 12. Mouza-level relative ranking of risk and vulnerability for Sagar Island.
Water 14 00823 g012
Table 1. Selected parameters of exposure, hazard, sensitivity and adaptive capacity.
Sl. No.ComponentsVariables
1ExposureMax. temperature (SD of avg. monthly temperature for the past 30 years)
2Min. temperature (SD of monthly avg. of past 30 years)
3Avg. rainfall (SD of monthly avg. of past 30 years
4HazardFlood (percentage of area inundated in past 10 years)
5Cyclone wind speed (m/s) (interpolated) over past 30 years
6SensitivityDemographyDensity of population (no. of persons/sq. km)
7Avg. size of household
8Percentage of females relative to total population
9Percentage of children (0–6 age group) relative to total population
10Socio-economyPercentage of SC and ST populations relative to total population
11Food security (percentage of households with 1 meal/day)
12Land holding (percentage of households without land)
13Poverty (percentage of persons under poverty line)
14LivelihoodDependency on agriculture (percentage of labourers relative to total population)
15Percentage of marginal workers
16Percentage of non-workers
17Adaptive CapacityHuman resourceLiteracy rate
18Work participation (Percentage workers relative to total population)
19Economic securityPercentage of salaried persons
20Home ownership (percentage of households owning a home)
21Household assets (percentage of households with home assets)
22InfrastructurePercentage of pucca houses
23Road density (km/sq. Km)
24Basic facilitiesSanitation (percentage of households with sanitation)
25Electricity (percentage of household with connections)
26Safe drinking water (percentage of household with access)
Table 2. Mann–Kendall analysis of the temperature of Sagar Island (2001–2020).
MonthTmaxTminTmean
ZQZQZQ
Jan1.583.18−0.60−0.932.241.81 *
Feb1.332.09−0.91−1.010.770.58
Mar1.683.080.700.961.541.04
Apr2.732.80 *1.191.381.231.14
May0.460.632.001.39 *−0.98−0.57
June1.751.821.611.450.420.15
July1.160.882.100.94 *0.770.52
August2.802.06 *1.960.911.020.23
Sep2.803.01 *1.591.041.400.67
Oct2.453.46 *1.721.731.681.15
Nov1.891.84−0.07−0.060.740.54
Dec−0.49−0.430.280.41−0.84−0.48
* Significant at 95%; Z, Rate; Q, Sen’s slope.
Table 3. Intra- and inter-annual trend analysis of the temperature of Sagar Island (2001–2020).
TmaxTMinTMeanSummerWinter
Minimum27.4016.8025.10--
Maximum33.0031.9027.40--
mean31.8424.3526.25--
SD1.440.310.57--
CV4.3%3.7%3.8%--
Z3.98−2.962.573.050.84
Q21.6613.283.341.1381.1
SD, Standard deviation; CV, Coefficient of variation; Z, Rate; Q, Sen’s slope.
Table 4. Mann–Kendall trend analysis of average monthly rainfall for Sagar Island (2001–2019).
MonthAverage Monthly Rainfall (mm) (2001–2019)
MaxMinMeanSDCVZQ
Jan87.6012.7724.37191%−0.590.00
Feb195025.4949.09193%1.70.52
Mar127.31.629.1533.90116%−1.75−1.00
Apr133.7043.2834.1979%−0.53−0.62
May245.429.7112.9459.1352%−0.42−1.02
June533.677.5264.29133.8551%−1.68−8.23
July868.9212.1408.86181.5244%0.845.44
August905.2177.3389.63186.3948%0.635.23
Sep567.6154.2303.47112.0137%−0.39−1.42
Oct631.327.6173.25165.8196%−0.98−3.65
Nov114.8022.3231.46141%0.890.26
Dec75.9012.0121.05175%1.560.00
Table 5. Mann–Kendall trend analysis of rainfall distribution for Sagar Island (2001–2019).
Rainfall (mm)Total8358
(Annual)
Pre-MonsoonMonsoonPost-Monsoon
Maximum2427.10299.202018.70631.90
Minimum1289.4061.60952.3081.20
Mean1797.45185.361366.26249.70
SD348.9261.69303.82159.76
CV19%33%22%64%
Z−0.07−0.700.350.00
Q−1.18−1.706.19−0.02
Table 6. Estimates of the land use and land cover for Sagar Island at two points in time (1990 and 2020).
S No.ClassesLULC 1990LULC 2020Change % Change
1Cultivated land164.36121.46−42.90−26.10
2Built-up51.9784.1632.1961.95
3Mixed open land0.551.040.4988.81
4Plantation11.5117.686.1753.59
5Sandy areas0.744.553.82518.06
6Water4.488.874.4098.26
7Wetland0.801.040.2328.80
Table 7. The loading of the principal component analysis (PCA).
VariablesPC 1PC 2PC 3PC 4
Avg. maximum temperature −0.1960.019−0.070.377
Avg. minimum temperature −0.1740.091−0.2730.238
Avg. rainfall −0.039−0.0630.0780.371
Area under flood0.2880.217−0.095−0.16
Cyclone wind speed0.0850.3190.180.306
Population density 0.0460.0750.1680.173
Avg. household size 0.0320.2350.081−.314
No. of females −0.1070.2160.041−0.16
No. of children (0–6 years)−0.083−0.083−0.3890.029
No. of socially backward people 0.2480.059−0.099−0.197
Food insecurity 0.3310.09−0.164−0.06
Without landholding 0.1440.352−0.1140.049
People below poverty line0.034−0.234−0.3270.012
Agricultural dependency −0.0150.0460.409−0.132
Marginal worker0.2480.2070.170.004
Non-worker0.240.119−0.1090.093
Rate of literacy 0.020.2290.319−0.208
Work participation −0.2560.050.2410.166
No. of salaried persons−0.2190.306−0.188−0.176
No. of homeowners −0.317−0.0280.146−0.144
Having household assets −0.353−0.0140.059−0.206
No. of pucca houses−0.2730.003−0.2−0.318
Road density −0.0810.326−0.118−0.104
Sanitation −0.1840.342−0.067−0.077
Electricity −0.1150.230.0390.173
Safe drinking water 0.1880.216−0.1940.056
Standard deviation 2.33521.6141.384
Proportion of variance (Eigenvalues)0.2090.1540.10.073
Cumulative proportion0.2090.3630.4640.537
Statistical test: Kaiser–Meyar–Olkin measures of sampling adequacy ≥ 0.516; determinant of correlation matrix ≥ 0.00001.
Table 8. Specification of severity classes of vulnerability and risk.
ClassesNo of Villages (%)Area (%)Population in Thousands (%)
VRVRVR
Very Low (<0.15)7 (17.07)9 (21.95)23.225.134.81 (16.42)34.07 (16.07)
Low (>0.15)9 (21.95)8 (19.31)28.627.438.42 (18.12)42.84 (20.21)
Moderate (<0.5)12 (29.26)11 (26.83)29.428.374.81 (32.28)65.23 (30.82)
High (>0.5)5 (12.19)8 (19.51)10.312.929.69 (14.0)40.62 (19.17)
Very High (>0.6)8 (19.51)5 (12.19)8.56.332.50 (15.33)23.93 (11.28)
Publisher’s Note: MDPI stays neutral with regard to jurisdictional claims in published maps and institutional affiliations.

