Article

Design and Investigation of an Effective Solar Still Applicable to Remote Islands

1
International Program on Energy Engineering, National Cheng Kung University, Tainan 70101, Taiwan
2
Department of Aeronautics and Astronautics, National Cheng Kung University, Tainan 70101, Taiwan
3
Energy Research Center, National Cheng Kung University, Tainan 70101, Taiwan
*
Author to whom correspondence should be addressed.
Water 2022, 14(5), 703; https://doi.org/10.3390/w14050703
Submission received: 22 December 2021 / Revised: 20 February 2022 / Accepted: 21 February 2022 / Published: 23 February 2022
(This article belongs to the Special Issue Water Systems Using Affordable and Clean Energy)

Abstract

:
Most remote islands are characterized by small populations, many of whom live under the poverty line, poor geographical accessibility and lack of electricity. As such, the solar still, which has a low capital cost, easy operation and less need of maintenance, is recommended to be used in remote islands possessing rich solar irradiance. Against this backdrop, the present study aimed to design and fabricate an effective solar still suitable for application in the remote islands with low freshwater sources but easy access to sea water and rich solar irradiance. Integrating a conventional passive double-slope solar still with an evacuated solar water heater, fins and wick material improves the heat transfer rate through the brine in the basin and increases effective evaporative surface area. Experiments were conducted using batch mode operation during the periods September to October 2021 for the passive solar stills and November 2021 for the active solar still. Experimental results reveal that the augmentation of fins, wicks and a solar water heater influences the overall distillate output of the solar still. The combined use of fins, wicks and a solar water heater increases the average daily productivity by 147% and the average daytime hourly productivity by 245% compared to the conventional passive solar still under similar average solar radiation levels. Using the present design, the active solar still under the solar environment of the testing location can provide 4.4 L of potable water per day. However, to achieve the minimum requirement of 7.5 L/day per person set by WHO, the present design should be modified by increasing the absorber area of the active solar still by 63% and adding eight more evacuated tubes to the solar water heater. The estimated cost per liter of potable water generated by the active (modified) solar still showed that bottled water sold in a typical remote county (Penghu) in Taiwan was 117–283% more expensive than the water generated by the still.

Graphical Abstract

1. Introduction

The availability of potable water is a key ingredient for the sustainability of life around the world. The total water resource in the Earth’s hydrosphere is estimated at 1386 million cubic kilometers [1]. Just 2.5% of this value is fresh water, whereas the other 97.5% is saline water. However, only 0.26% of the Earth’s freshwater resources are easily accessible [1].
Remote isolated countries, such as islands of the South Pacific and some small island states of the Caribbean, generally suffer from insufficient freshwater sources due to land topography, climatic conditions and poor geographic location. Small island states are defined as islands having land areas less than 10,000 km2 and occupied by a population below 500,000 inhabitants [2]. Potable water for these remote islands is usually obtained from vulnerable conventional and nonconventional sources. Conventional sources include surface water, ground water and rainwater, whereas nonconventional sources include desalination, importation from neighboring countries and recycling of wastewater [3]. However, the conventional freshwater sources are under threat of contamination from improper sanitation facilities, poor sewage management, and industrial and agricultural activities, which may lead to water borne health problems [3]. In addition to pollution, the freshwater sources in these remote areas are also under threat from climate change, which results in increasing droughts and coastal flooding, which leads to saline water intrusion [4].
Given that these remote island states are surrounded by ocean, converting the easily available seawater to freshwater by desalination is one viable option to build their resilience. Desalination is the process of removing dissolved solids, such as salts and minerals, from water [5]. On average, seawater has a total dissolved solids (TDS) concentration of 36,000 mg/L [6]. However, for the water to be potable, the World Health Organization (WHO) suggests a TDS value of less than 900 mg/L [7].
Although solar desalination in remote areas can be carried out using different methods, solar stills are advantageous as they are simpler, easier to maintain, cheaper and have a smaller environmental footprint compared to other methods. In addition, the level of solar irradiation of most remote islands is generally good due to their sunny weather and close proximity to the equator. For instance, Vanuatu and Kiribati have annual mean daily insolation of 17 and 24 MJ/m2·day respectively [8]. Moreover, sunshine hours average between 5 and 7 h per day. As the population of these remote islands is small, the freshwater requirement will also be sufficiently low that it can be satisfied by small water treatment systems such as a solar still.
Wibowo and Chang [9] used Indonesia as a case study and performed a techno-economic study for producing potable water. Most of the population in remote villages live under the poverty line and lack access to electricity [9]. However, Indonesia receives a large amount of sunshine since it is located around the equator. Remote islands are characterhood by a low population, large population share living under the poverty line, poor geographical accessibility and lack of electricity. Thus, a small-scale desalination system associated with solar thermal application, such as a solar still, which has a low capital cost, easy operation and less need of maintenance, was recommended to be used in these remote islands [9].
A solar still uses the principles of evaporation and condensation to separate salt and minerals from brine using the energy harvested from the sun. The solar irradiation absorbed is used to drive the evaporation of freshwater from brine. As the water evaporates, the rising vapor condenses on a cooler transparent surface as the latent heat of condensation is released to ambient air. The condensate formed on the cooler transparent surface rolls down the surface under the effect of gravity, along with adhesive and cohesive forces, and is then collected. In addition to salts and minerals, this process also eliminates microbial organisms that may cause water-related illnesses. Solar stills are generally divided into two groups: passive and active. Passive solar stills use solar thermal energy to directly heat the water, whereas active solar stills use extra thermal energy collected from other devices or sources [10]. Active solar stills can further be divided into high temperature distillation, pre-heated water application and nocturnal production [11]. To achieve high basin water temperatures (70–80 °C), the solar still is coupled with devices such as flat plate collectors, parabolic concentrators, evacuated tube collectors, heat pipes, solar ponds and hybrid PV/T systems. Passive solar stills can also be subdivided into groups based on complexity and may include various types such as single-effect, multi-effect, wicked, finned, triangular, tubular, hemispherical, concave, pyramid, multi-slopes, vertical stills, inclined, stepped, cascade and heat storage, and those having external devices such as reflectors and condensers [12]. Despite the advantages of using solar stills on remote islands, their low productivity is a deterrent for commercial use. Therefore, many studies have been conducted to improve their productivities. Researchers have identified three groups of factors that affect the productivity of solar stills, namely environmental, design and fabrication, and operational factors [13,14,15,16].
Given that environmental conditions are uncontrollable, the design of solar stills can be optimized to improve their performance. The productivity of solar stills can be improved by increasing the rate of condensation and evaporation, and creating a larger temperature difference between the basin brine and the glass cover [17,18]. Increasing the rate of condensation can be achieved by reducing the temperature of the glass cover (using intermittent flow of wind or cooling water), minimizing the gap between the glass cover and the water level (i.e., low glass cover tilt angle), creating forced convection inside the basin [15] and increasing the condensation area [19]. Modifications to increase the rate of evaporation include: increasing the temperature of the water in the basin by using solar collectors, sensible heat storage materials and reflectors; increasing the evaporation area; increasing the absorption of radiation and the rate of conduction; and using low basin water depths.
The objective of the present study was to design a solar still with combined modifications in order to enhance its productivity, so that it can be used on remote islands. The present study used a conventional passive double-slope solar still as the reference against which the performance of later modifications was measured. Various features were then added in three phases in an effort to reach optimum productivity within the constraints of the base design. The methods used to improve the performance of the solar still focused on increasing the rate of evaporation through increased surface area by installing wicks, improving the heat transfer process by integrating fins in the basin, and by increasing the basin water temperature through the use of a solar water heater in addition to increasing the condensation rate through a low glass cover tilt angle of 15°. Using an effective basin water depth, appropriate recovery rate, low glass cover tilt angle, effective wicking, augmented contact surfaces for heat conduction with fins, and additional exterior heat using an evacuated solar water heater were the main techniques used to enhance distillate yield. The choice of materials used was not based solely on performance but also on a compromise between availability locally, cost and durability. This paper also presents an experimental analysis of performance in the southern Taiwan climate. Additionally, the relationship between improvement modifications, solar irradiation and productivity was used to determine the efficacy of the still’s use on remote islands with easy access to seawater but limited freshwater sources. The paper also presents an estimate of the cost per liter of potable water generated by the solar still equipped with all improvement modifications.

2. Solar Still Set-Up

A conventional double-slope, single-basin solar still was designed and fabricated. The solar still was later modified to give four additional configurations and the performance of each was studied and investigated. The first configuration was the conventional double-slope passive solar still with a single basin, which served as the baseline for comparing with the performances of the other configurations. Increasing the surface of brine in contact with the air can enhance the rate of evaporation. Therefore, wicks were hung above the brine surface with the free ends inserted into the brine. The brine was conveyed to the exposed surfaces of the wicks by a capillary-driven process. This approach has been frequently used in single-basin solar stills [13,20]. To keep the wicks above the brine surface, rectangular stainless steel metal fins were installed breadthwise in the basin. These fins also functioned to facilitate improved heat transfer rate, in particular, in the active solar still (the third and fourth configurations). Thus, the second solar still configuration was a modified version of the first and labelled as a modified passive solar still. The third modified solar still was the second configuration integrated with a solar water heater and was, thus, a modified active solar still. Finally, in the fourth configuration, the wicks and fins were removed while leaving the solar water heater attached and this configuration was labelled as the unmodified active solar still.

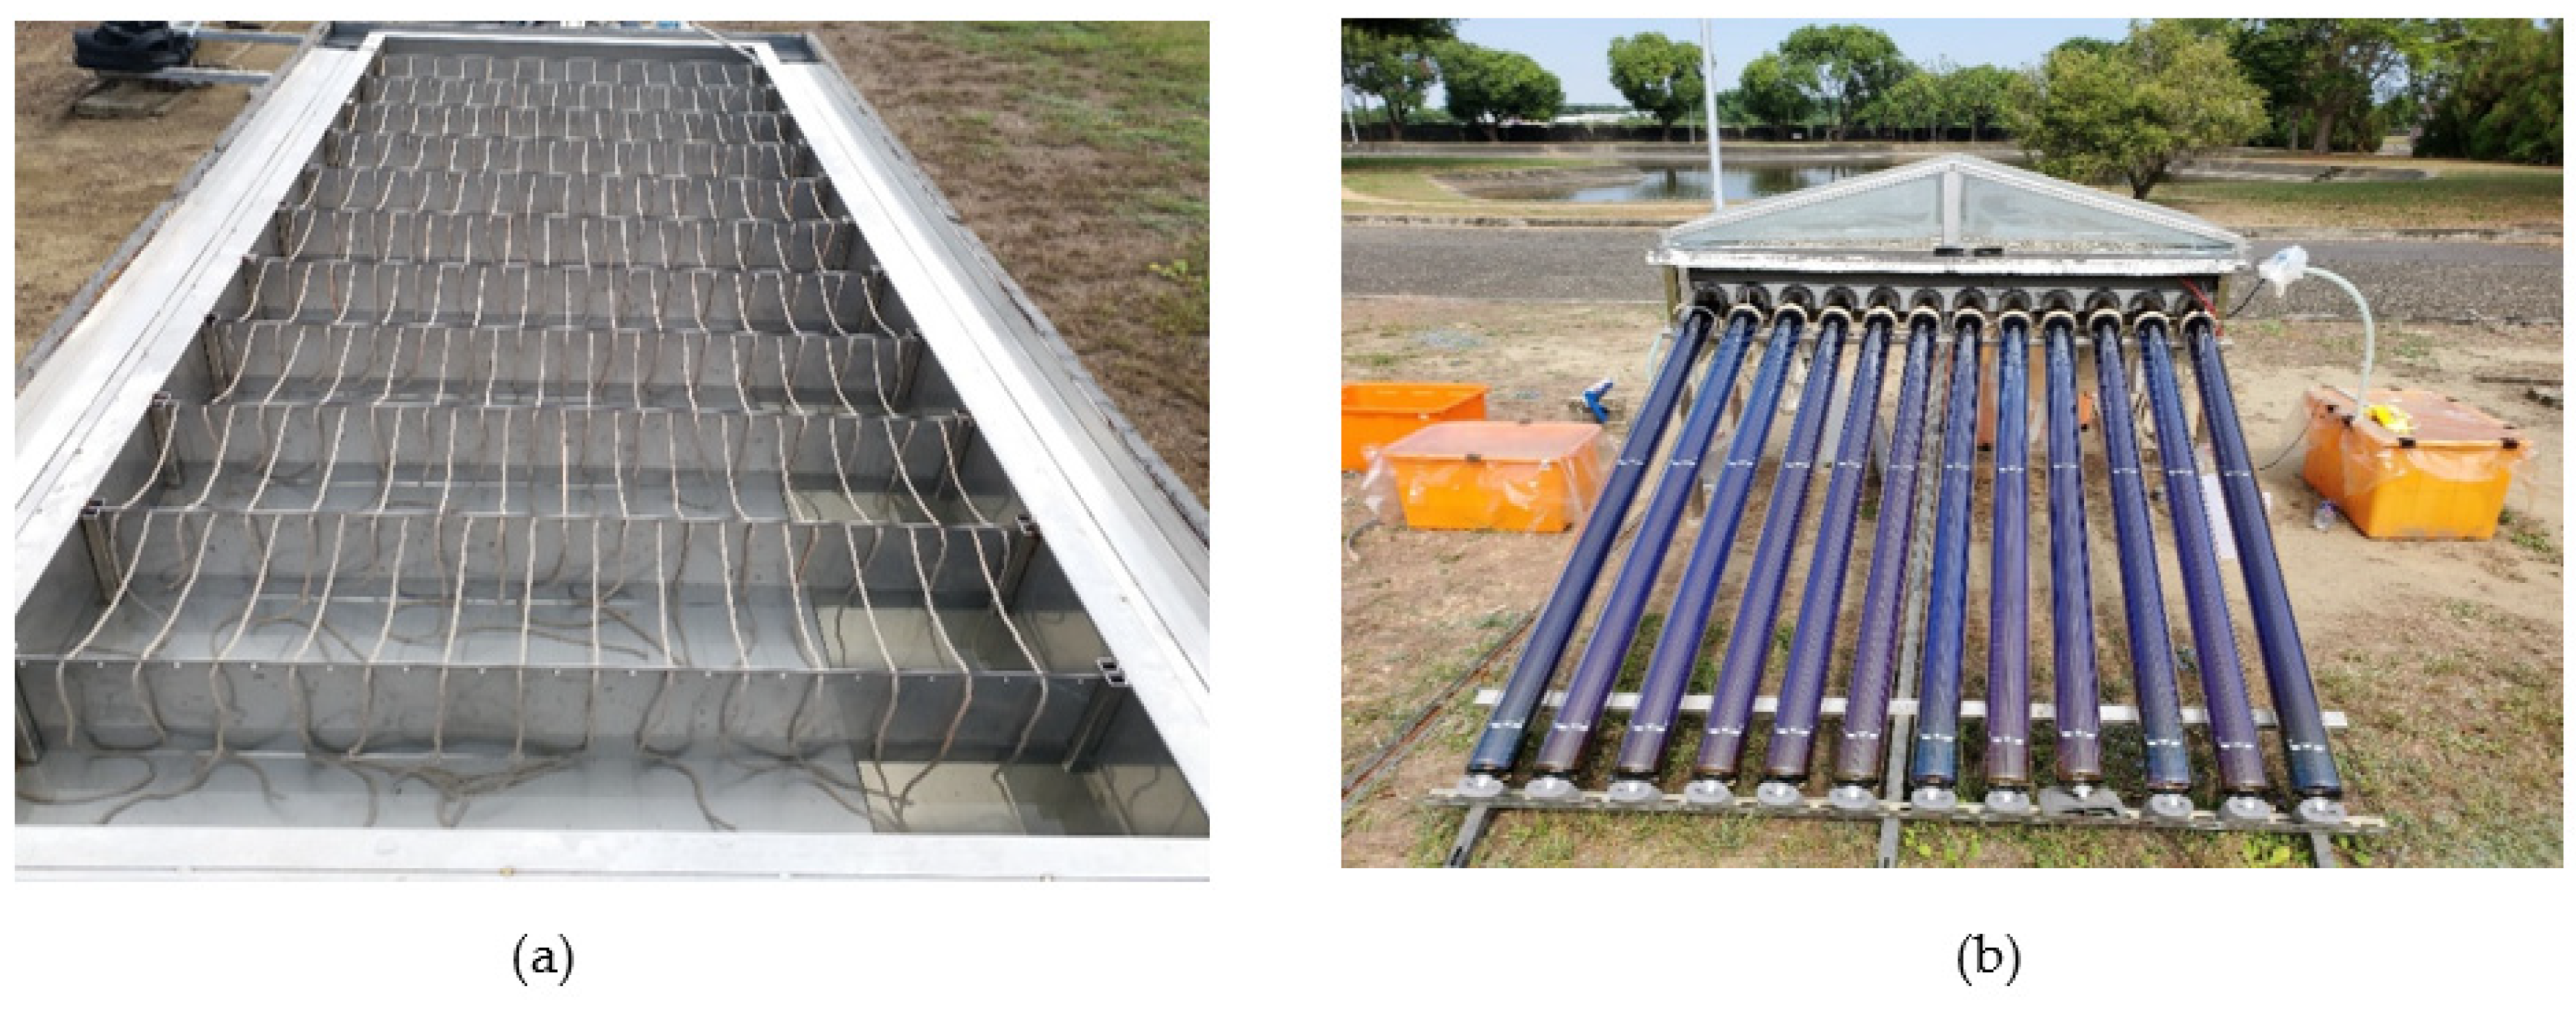
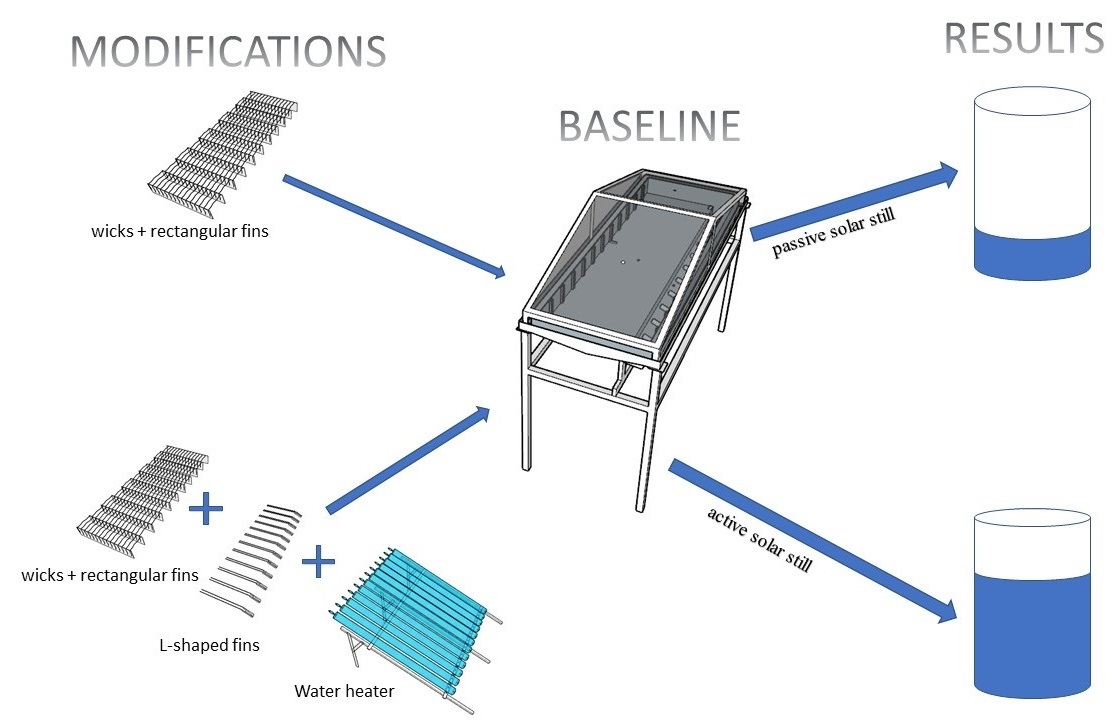
2.1. Design and Fabrication Materials

The solar still was fabricated using plain glass (4 mm thick), stainless steel (4 mm and 1 mm thick), silicone (A 555) glazing sealant, foam material and galvanized piping (12.7 mm and 6.35 mm in diameter). The main body of the solar still consisted of three parts: the glass cover support, basin and support structure. The glass cover support was made using 4 mm thick stainless steel. It measured 1.91 m long and 0.76 m wide. The overall height to the apex of the glass support was 0.35 m and the lowest sides measured 0.068 m. The inclination angle of the glass cover affects the performance of the solar still [13,21]. Different inclination angles ranging from 10° to 50° were employed in different studies [13,14,22,23,24,25,26,27,28,29,30,31,32,33,34]. The optimum inclination angle results from two opposite effects of inclination angle variation. For large inclination angles, the volume of the cavity between the water surface and glass cover is large; thus, the air takes much longer to become saturated, delaying the start of productivity. Moreover, an increase of the inclination angle results in increased solar radiation losses by reflection from the glass cover when the sun altitude angle is high, such as around noon. From this point of view, the inclination angle should be closer to the latitude angle as much as possible. The only advantage that the large inclination angle offers is that, once condensation starts, the condensate on the inner side of the glass cover is drained faster into the collecting channel. Alternatively, for the case of very low inclination angles (less than 10°), although the cavity volume becomes less, the gravity-driven force is unable to overcome the surface tension and frictional forces between the small, condensed water droplets and the inner glass surface. Thus, the droplet could grow until its mass inertia overcomes the surface tension and drops into the basin. In consideration of the latitude angle of the test site (22.9° N) and the recommendation of an optimum angle of 15° by other studies [13,14,22,24,27,30], the roof of the structure was sloped at 15° to the horizontal, as shown in Figure 1. Each of the topside glass panes had an area of 0.652 m2 and that for each of the side panes was 0.123 m2.
Water collecting channels were also placed along the bottom of the side panes. The gaps between the glass panes and the metal frame were sealed with the sealant to prevent vapor loss. The basin was made using 1 mm thick stainless steel with water collecting channels at the eastern and western sides. The channels were made with an angle of depression of approximately 6°. The rectangular section of the basin measured 1.75 m × 0.592 m with side walls of 0.118 m height. The northern and southern side walls of the basin were also equipped with rectangular separation grooves running perpendicular to the absorber plate at intervals of 0.15 m. These grooves were made to secure eleven rectangular fins made from 1 mm thick stainless steel, each with dimensions of 0.591 m × 0.115 m × 0.001 m. A total of twenty-nine holes were drilled along one of the longest sides of each of the rectangular fins 0.002 m from the edge at intervals of 0.02 m apart to accommodate 145 strands of cotton yarn wicks. Each strand of wick measured 0.5 m long and 0.002 m in diameter. The absorber plate of the basin was also constructed from 1 mm thick stainless steel and had dimensions of 1.75 m × 0.47 m. A trough of width 0.123 m and depth 0.057 m from the shallowest point was made at the south facing side of the basin to facilitate connecting a solar water heater equipped with twelve evacuated tubes made with the heat pipes (Figure 2b), which are the main components that convert the passive solar still to an active solar still.
The total exposure area of the evacuated tubes for collecting solar irradiation amounted to 2.18 m2. The thermal performance of the solar water heater was tested with the Chinese National Standards CNS 15165-1 [35], which is in compliance with an international standard of ISO 9806-1 [36]. The slope (FRUL) and intercept (FR(ζα), i.e., the maximum thermal efficiency) of the water efficiency curve corresponding to useful energy collected from the solar water heater and its heat loss are 2.23 and 0.73, respectively. More information on the thermal performance evaluation method for solar water heaters in Taiwan is provided in [37]. The trough was also fitted with twelve closed-ended heat pipe ports for the bulbs of the heat pipes in the evacuated tubes. Twelve L-shaped fins with double prongs were installed on the heat pipe ports. Figure 3 shows the configuration of the basin.
A total of four drainage holes were placed at each corner of the basin. The drainage hole located at the south-eastern corner was fitted with a mechanical valve whereas that at the south-western corner was fitted with an electronic valve. The operation of this electronic valve was controlled by the positions of two water-leveling sensors installed at the eastern end of the south-facing basin sidewall. A 12.7 mm feed water hole was made above the trough in the basin on the eastern side wall, which was connected to a pump. The flow of raw seawater from the pump into the basin was controlled by an electronic valve that was connected to the feed water hole. The amount of water present in the basin was predetermined and also controlled by the two water-leveling sensors. One of the sensors was used to control the upper water level, while the other was used to control the lower water level. The solar still was supported by a stainless-steel structure with four legs, each of which was 1.05 m high, 1.86 m apart on the longest side, and 0.71 m apart on the shortest side.

2.2. Instrumentation

The operational parameters within the basin were measured using a set of thermocouples and a humidity–temperature transmitter. Two thermocouples (TG1 and TG2) were placed on the glass cover, one on the east cover and the other on the west cover, while four thermocouples (TB1, TB2, TB3 and TB4) were installed in the basin of the solar still to measure the temperature of the inner glass surface and basin water temperatures, respectively. The location of the thermocouples installed in the basin is shown in Figure 2. The humidity and vapor temperature were measured using a Dwyer humidity–temperature transmitter with a humidity range of 0–100% and a rated temperature range of 0–100 °C. The data acquisition was performed using the LabVIEW program along with three Modbus and DCON data acquisition modules. The measurement of the global radiation was performed using a pyranometer (Model PSP of Eppley Laboratory, Inc., Newport, RI, USA).

2.3. Experimental Procedure

Experiments were conducted during the period from September to December 2021 in batch mode. The solar still was aligned in the north–south orientation with one glass cover facing east and the other facing west. It is agreed that the performance of the solar still is affected by the depth of the water in the basin [14,15,16,17,18,19]. When the level of water in the basin is low, it has a low thermal capacity and this increases the rate of evaporation and, as a result, enhances the production of distilled water by the solar still. According to the study conducted by Ithape et al. [38], an optimal depth of 4 cm was found to give an optimal output from a passive solar still; raw sea water was thus pumped to a height of 4 cm above the absorber plate in each experiment. Four sets of experiments were conducted over the testing period. The first experiment, conducted from September to October, consisted of the unmodified conventional passive solar still, i.e., with a plain basin. The second experiment was conducted from October to November and consisted of the passive solar still modified with rectangular fins and yarn wicks hung in the basin, as shown in Figure 2a. The third experiment was conducted in November and consisted of an active solar still coupled with a solar water heater and modified with fins and wicks in the basin. The set-up for the active solar still is shown in Figure 2b. The fourth experiment was conducted between November and December.
Each experiment started at 8:00 a.m. on the first day and continued until the water level dropped to a height of 1 cm above the absorber plate, equivalent to a 69–70% recovery rate of the raw seawater. A minimum water depth of 1 cm was maintained to prevent the formation of dry spots and to protect the heat pipes. One batch of raw seawater was collected and lasted the duration of the testing period. Throughout the testing period, measurements of distilled water output, and average values of operational parameters such as basin water temperatures (TB1, TB2, TB3 and TB4), glass cover temperatures (TG1 and TG2), and relative humidity were recorded twice daily together with weather parameters such as global radiation and ambient temperature. The first set of measurements was taken at 8:00 a.m., and the second set was taken at 5:00 p.m. The measurements taken at 5:00 p.m. represented the daytime data, whereas those taken at 8:00 a.m. represented the overnight data starting from 5:00 p.m. of the previous day. An initial chemical analysis was undertaken on a sample of the raw seawater and on a sample of the distilled water that was collected from the solar still.

2.4. Test Location and Solar Environment

The experiments were conducted at the Guiren campus of National Cheng Kung University, Tainan, Taiwan (22.9° N and 120.3° E). The average daily global radiation was 16.4 MJ/m2. In order to collect the maximum solar radiation, the solar water heater coupled to the active solar still was installed with a slope of 23° to the horizontal, which is very close to the latitude of the testing site. The climate in Taiwan is described as subtropical in the north and tropical in the south [39]. The climatic variation results from the mountainous terrain and the East Asian monsoon [40]. Taiwan’s climate is also affected by the Kuroshio Current, which in combination with the East Asian monsoon produces an overall warm climate with hot wet summers and cold dry winters [41].

3. Results and Discussion

3.1. Water Quality Analysis

Different parameters were selected to assess the quality of the distilled water produced by the solar stills. Table 1 represents the chemical analysis results of the raw seawater and the distillate produced based on the chloride concentration and the Total Dissolved Solids (TDS) concentration. The solar stills performed excellently in improving the quality of the seawater by removing most of the impurities and dissolved salts. The health-related quality of the distilled water for drinking purposes falls within WHO standards based on the selected parameters, as shown in Table 1. However, for aesthetic purposes, WHO recommends that drinking water has some dissolved solids. The taste of the water is graded as excellent if the TDS concentration is less than 300 mg/L, whereas it is graded as poor or unacceptable if its value is higher than 900 or 1200 mg/L, respectively [42].

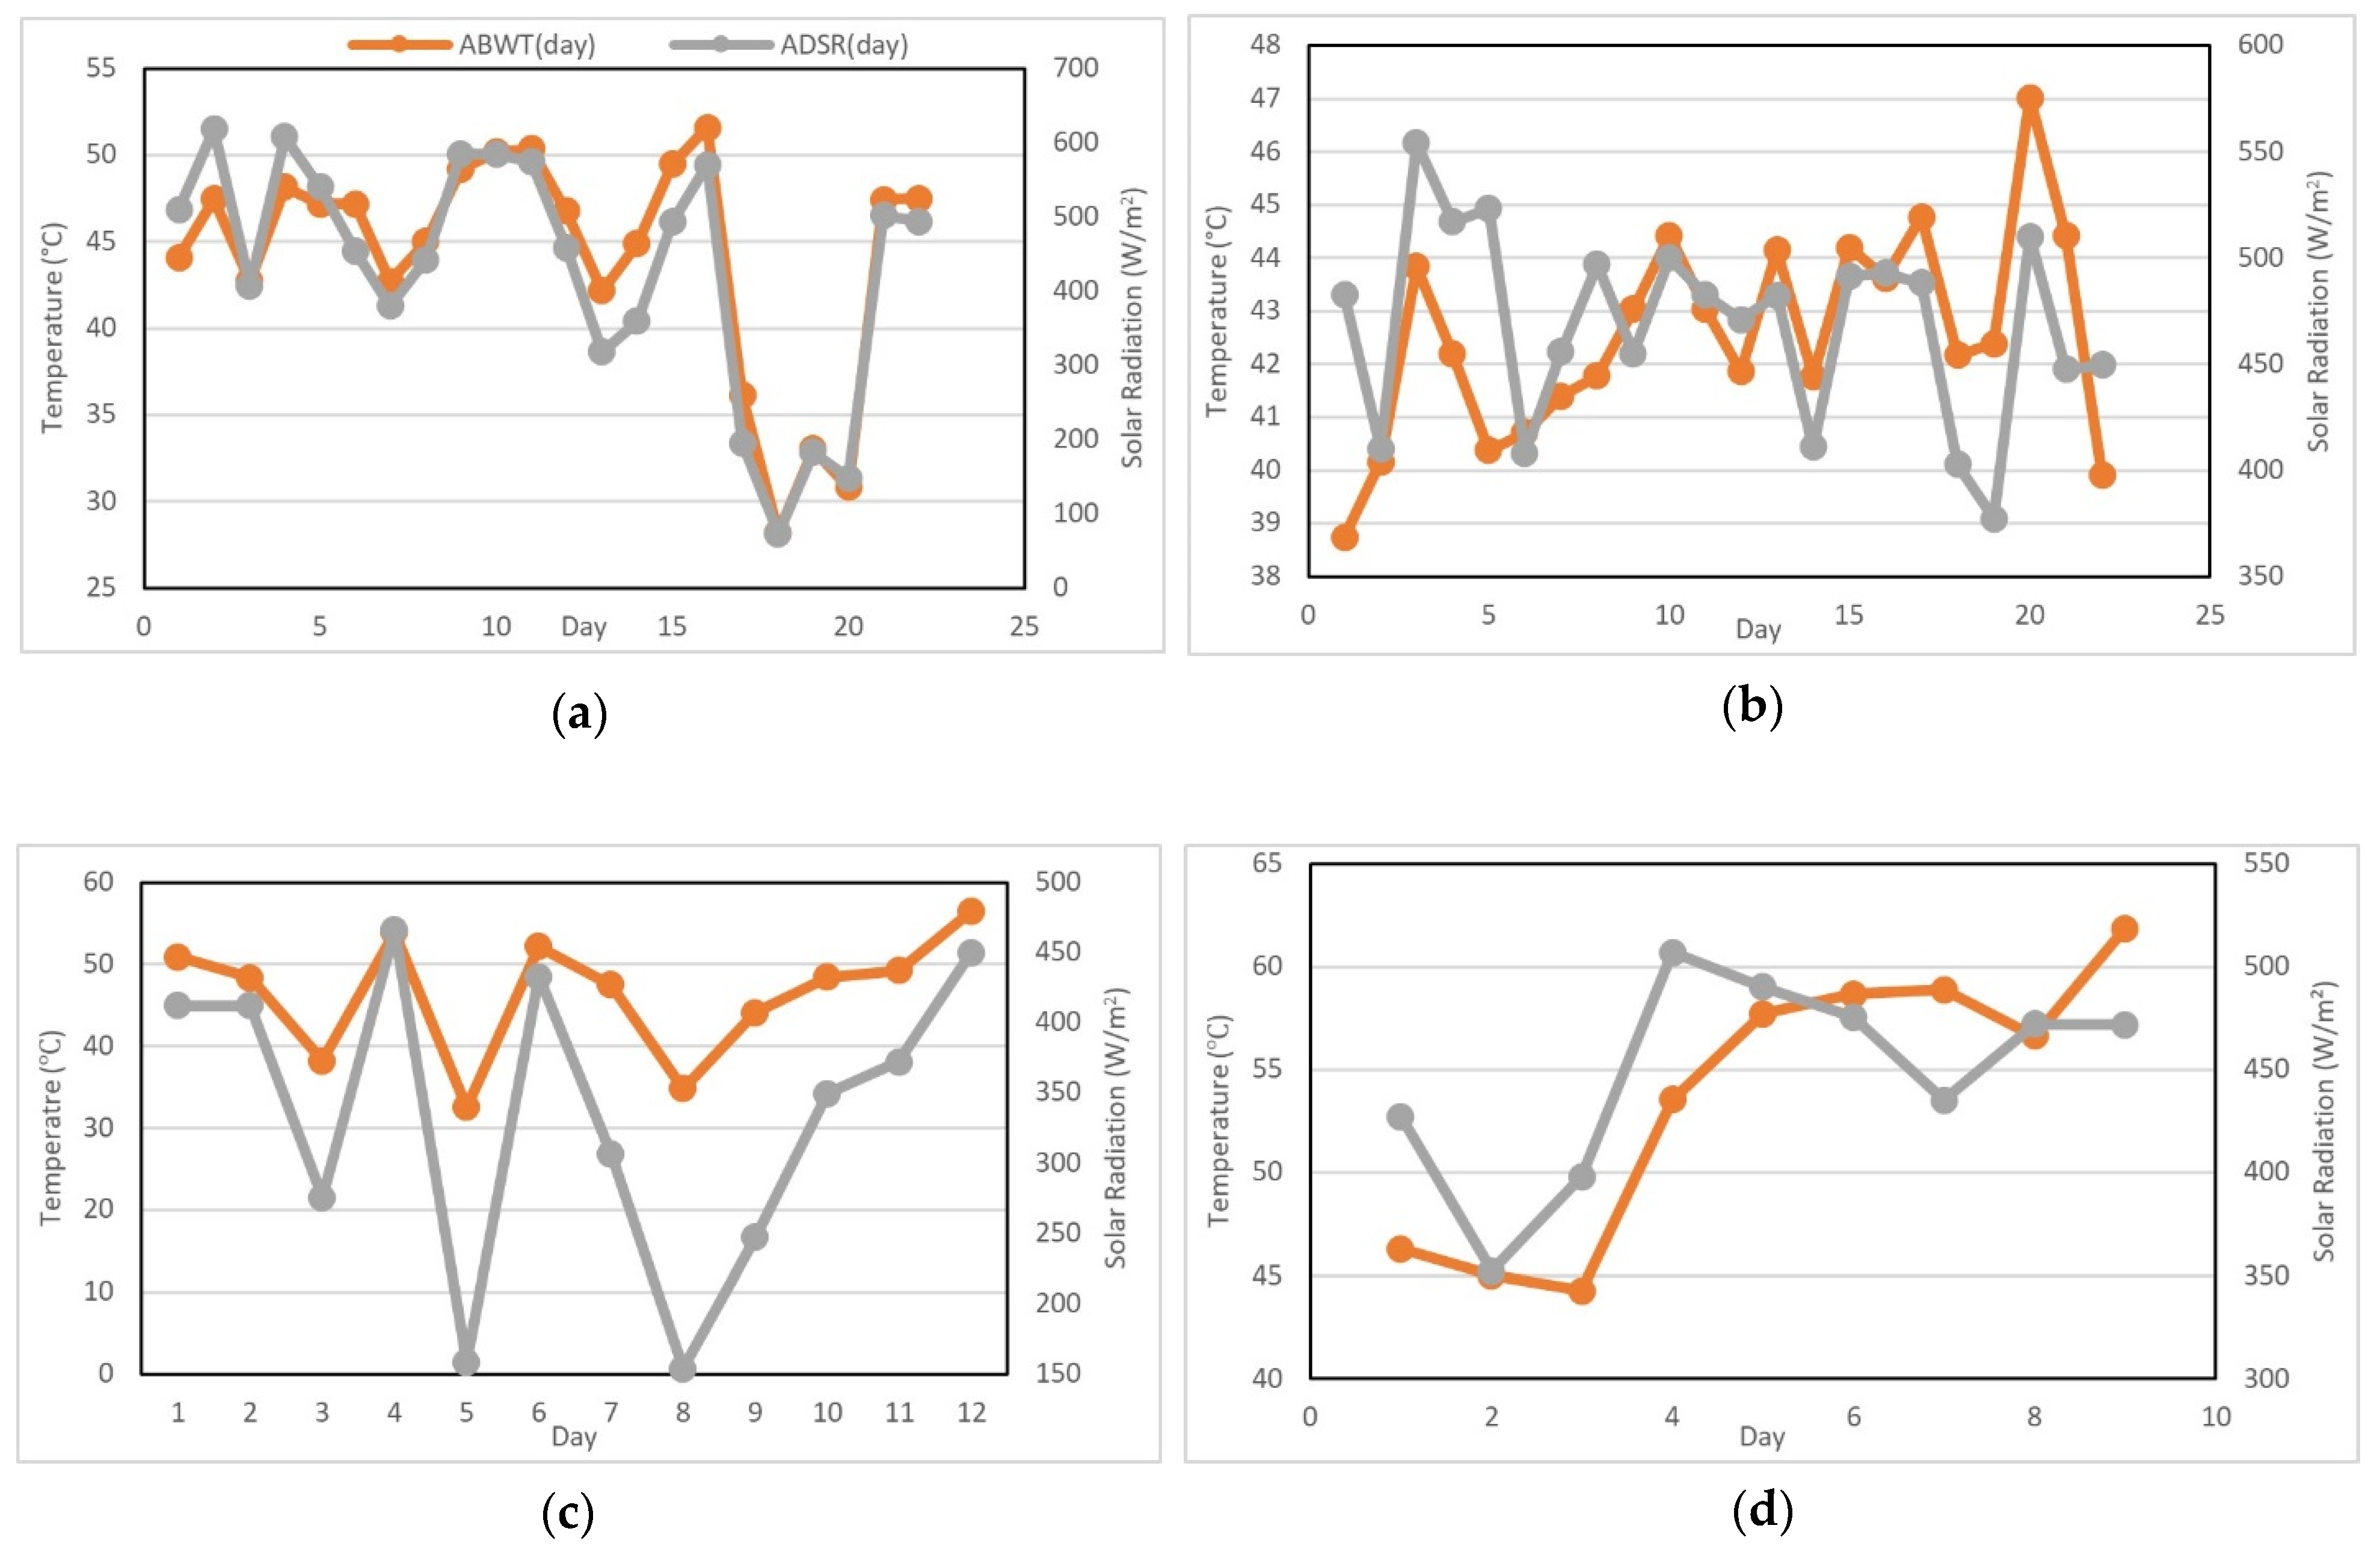
3.2. Variation in Averge Daytime Basin Water Temperature with Average Solar Irradiation

Figure 4 shows the variation in the average daytime basin water temperature (ABWT) with the average amount of solar irradiation received for the entire testing period of all four stages of testing. Note that the average solar irradiations differ in the four stages of testing. The four different configurations show the same trend for the variation in ABWT during sunshine hours with the average solar irradiation received. The ABWT during sunshine hours follows the variation in solar irradiation very closely, i.e., as the amount of irradiation increases, the ABWT also increases and vice versa. However, the relationship between the ABWT and the average daily solar radiation (ADSR) received is more pronounced for the conventional solar still (unmodified configuration) compared to the other solar still configurations. This is because the unmodified (Figure 4a) conventional solar still is not assisted in any way; therefore, its basin water temperature is solely dependent on the amount of solar radiation that it receives directly. The active solar stills (modified and unmodified configurations) recorded the highest average ABWT compared to the passive solar stills (modified and unmodified configurations), since the basin water was heated by incoming solar radiation, heat absorbed from the absorber plate, and heat transferred from the solar water heater. The active solar still with the modified configuration (Figure 4d) also achieved the highest average ABWT of 61.9 °C under an ADSR of 472 W/m2, followed by the unmodified active solar still at 53.9 °C under ADSR of 466.2 W/m2, the unmodified conventional solar still at 51.7 °C under 570.5 W/m2 ADSR, and the modified conventional solar still at 47 °C under 510.2 W/m2 ADSR. This represents an increase of 20% in ABWT after integration with the solar water heater in comparison with the unmodified passive (conventional) solar still, and an increase of 14.8% after adding fins and wicks in the case of the active solar stills. It can be reasoned that the ABWT of the active solar stills was highest on the last day of testing due to the reduced water volume (in other words, thermal inertia) having better thermal properties. This was not observed in the case of the passive solar stills due to the accumulation of salt deposits on the basin liner, which reduced the amount of solar radiation that can be absorbed. The unmodified conventional solar still maintained higher daytime BWT compared to the modified conventional solar still as the levels of ADSR were higher during the testing period for the unmodified conventional solar still.

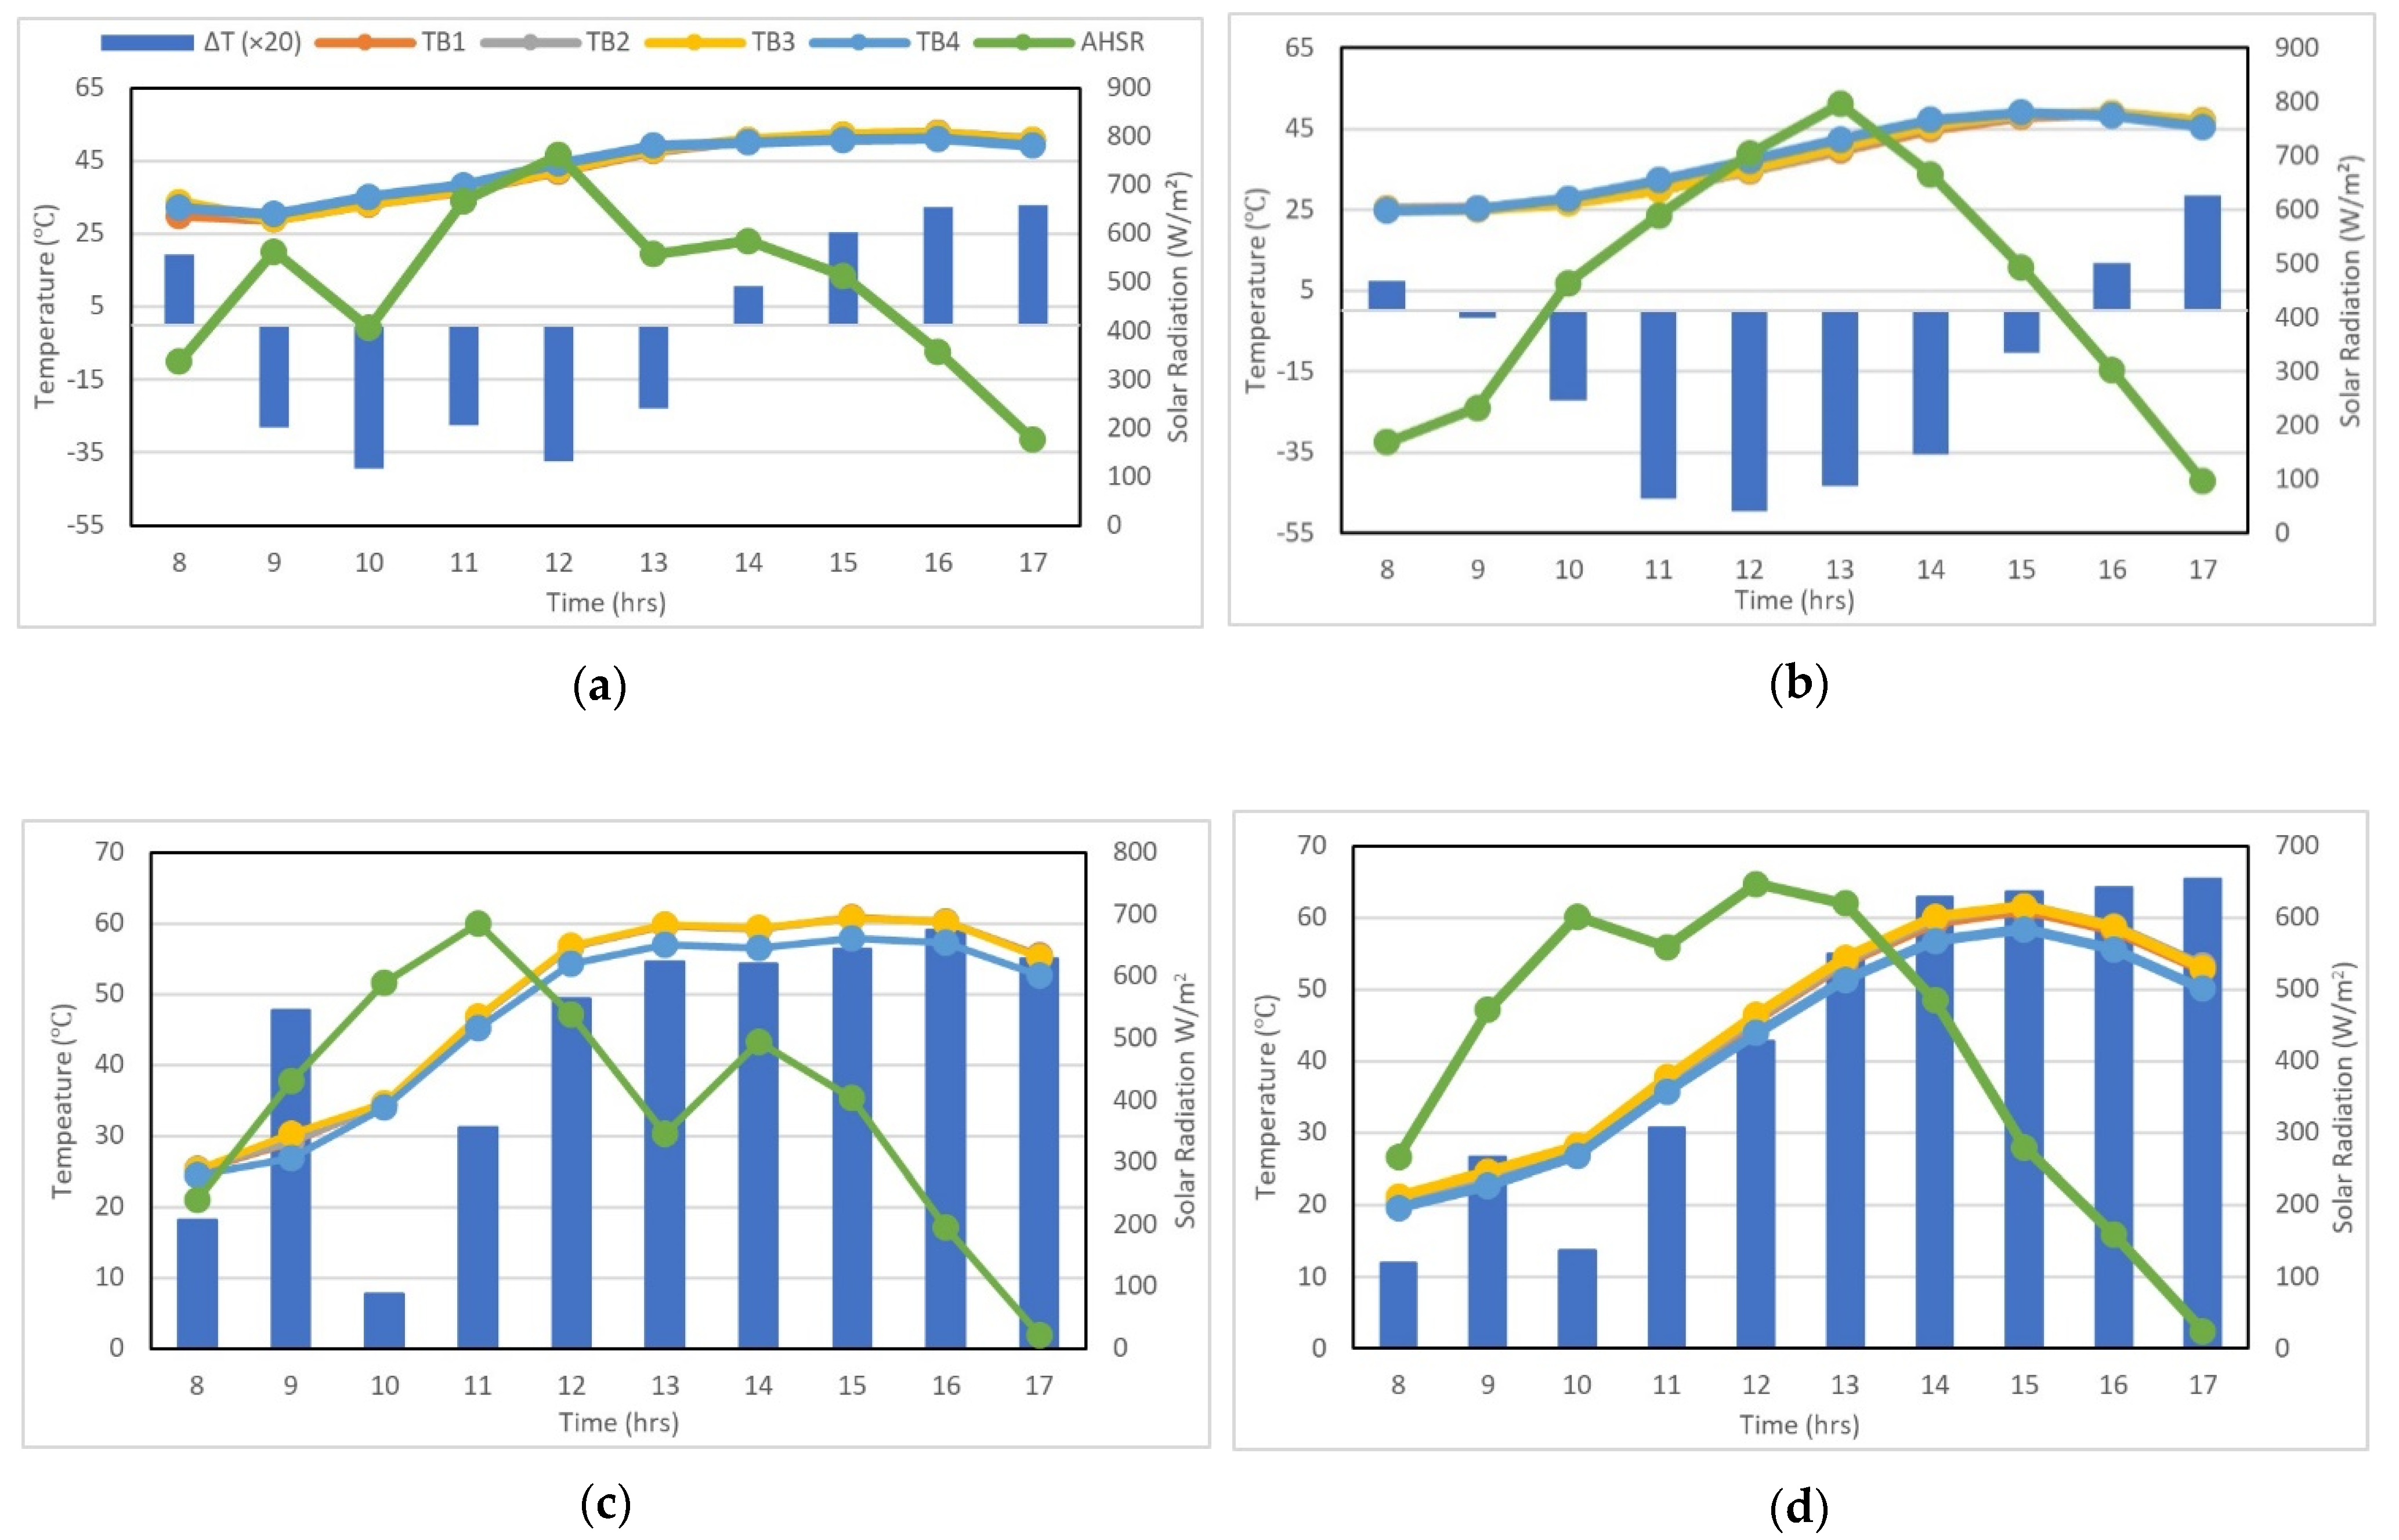
3.3. Effect of Adding Fins and Solar Water Heater on the Temperature Distribution within the Solar Stills

Figure 5 illustrates the hourly variation in the temperature within the basin of the solar stills on the first day of testing for each configuration. The first day was selected because the solar stills contained approximately the same volume of water; therefore, the effect of volume on the heat transfer within the basin can be ignored. ∆T represents the temperature difference between the temperature measurements at the TB2 and TB4 positions (see Figure 2), i.e., TB2–TB4. This temperature difference is used to measure the effectiveness of the fins in transferring heat through the brine. In addition, ∆T is scaled up by a factor of 20 so that the variation can be distinctively seen on the graphs. The water in the trough of the basin has relatively uniform heating as TB1, TB2 and TB3 are approximately the same, as shown by the overlapping lines. The temperature of the section of water above the absorber plate (TB4), however, differs slightly from that in the trough due to the design of the trough and the low thermal conductivity of water. Figure 5a,b both show that the temperature of the water above the absorber plate remains higher than the portion of water in the trough during the morning. Additionally, Figure 5a shows that the portion of water above the absorber plate begins to lose heat sooner than that shown in Figure 5b as ∆T changes sign sooner. This implies that the heat dissipates from the basin water more readily without the presence of fins. Therefore, the fins effectively help maintain the temperature of the section of water above the absorber plate. Figure 5c,d demonstrate that the temperature of the basin water is less sensitive to changes in the amount of solar irradiation received when the solar water heater was integrated with the system.
This is indicated by the pronounced bell-shaped temperature curves and bars observed in Figure 5d even with a drop in solar irradiation compared to the less pronounced bell-shaped temperature curves observed in Figure 5c. Furthermore, the highest value of ∆T in Figure 5d occurred when the amount of solar irradiation received was at its lowest, which is not the case in Figure 5c. This can be attributed to the fact that the fins not only act as heat transfer media but also as heat storage media. It can also be observed from Figure 5 that there is a time lag in the heating of the water due in part to the high specific heat capacity of brine and the increased thermal inertia contributed by the sealed and insulated system.

3.4. Variations in Daytime and Night-Time Yields with Avaerage Daily Solar Radiation

Figure 6 represents the daily variations in total daytime and night-time yields for each solar still configuration versus the average daily solar radiation (ADSR). As demonstrated from the figures, the total daytime yield of each solar still is highly dependent on the quantity of solar irradiation received. High levels of solar irradiation result in high distillate yield and low levels of solar irradiation cause low distillate yield. This is due to the rise in basin water temperature when it receives more solar irradiation, which will increase the rate of evaporation and thus the distillate output. The highest single daytime yield of 5.5 L was obtained by the modified active solar still under an ADSR level of 475.8 W/m2, followed by the unmodified active solar still with 4.702 L under ADSR of 466.2 W/m2, the unmodified conventional solar still with 2.5 L under 570.5 W/m2 ADSR, and the modified conventional solar still with 1.9 L under 488.3 W/m2 ADSR. It can also be observed that the night-time yield has less dependence on the ADSR compared to the daytime yield. The unmodified conventional solar still produced the highest night-time yield of 1.244 L on the second day of testing, followed by the unmodified active solar still with 0.927 L on the fifth day of testing, the modified active solar still with 0.899 L on the fourth day, and the modified conventional still with 0.829 L, also on the fourth day. However, the night-time yield is expected to be higher for larger volumes of water in the basin. As the volume of water decreases, the night-time yield also decreases. This is shown in the graphs as the night-time yield is highest for the first few days of testing with the largest volumes of water and it also varies closely with the ADSR during those days. This trend occurs because of the high heat capacity of brine and its ability to retain heat absorbed during sunshine hours and release it slowly during off-sunshine hours. The smaller the volume of water, the less heat can be stored and vice versa. Hence, as the volume of water in the basin of the solar still decreases so does the night-time yield. With the combined daytime and night-time productivities, the modified active solar still recorded the highest overall yield of 6.3 L on day 6, followed by the unmodified active solar still with 5.221 L on day 4, the unmodified conventional solar still with 3.0 L on day 11, and the modified conventional solar still with 2.2 L on day 4. It can be reasoned that in the event the water heater installed on the active solar still becomes inoperable, the system will still be able to operate using the passive mode (i.e., modified passive solar still). Table 2 summarizes the percentage contributions of daytime and night-time yield for the four tested cases. It is evident that the daytime yield of the active solar still configurations (modified and unmodified) account for a larger percentage of its total distillate yield compared to the passive configurations (modified and unmodified).

3.5. Productivity of the Solar Still

In this section, the productivities of the solar stills are compared to assess the effect of the modifications made. The overall daily productivities of the solar stills were calculated and are displayed. However, as the testing was performed under different weather conditions, a normalized productivity was calculated and a day with similar solar insolation was chosen for comparison on the basis of absorbed solar radiation.
The performance of the solar stills was measured by the concept of production rate performance (PRP) defined by Aybar [43] as:
P R P = t o t a l   d i s t i l l e d   w a t e r   w i t h i n   a   t i m e   i n t e r v a l t o t a l   s o l a r   e n e r g y   a b s o r b e d   w i t h i n   a   t i m e   i n t e r v a l
P R P = m ˙ i · t I ( t ) · t
where t represents the time interval in s, I(t) represents the solar radiation intensity in W/m2 and m ˙ i represents the condensation rate (production rate) in kg/s. This concept was adopted and used to calculate the values shown in Table 3. The daily productivity (production rate), m ˙ i , was determined practically as [44]:
m ˙ i = v o l u m e   o f   d i s t i l l e d   w a t e r   p e r   d a y a r e a   o f   s o l a r   s t i l l   a b s o r b e r
Assuming all the surfaces of the wicks were available for effective evaporation, the additional evaporative surface area (Ae) due to the wicks was determined by:
A e = π d l
where d represents the diameter of the wick and l represents the length.
Table 3 shows that the addition of wicks and fins caused an increment of 5.61% in the evaporative surface area but a marginal decline of 1.36 %in the overall daily productivity of the modified conventional passive solar still because the solar irradiations in the testing period for this configuration were lower than those for the unmodified conventional passive configuration for most of time, as revealed in Figure 4a,b. Nevertheless, there was an improvement of 28.04% in the single day average hourly productivity based on the condition of similar insolation. This can be attributed to the small increase in the evaporative surface area caused by adding the wicks and the enhanced heat transfer rate for the brine in the basin by adding the fins. Adding wicks, fins and a solar water heater to the solar still had a greater effect on the productivity compared to only adding wicks and fins. There was a 146.82% and 245.35% increase in the overall average daily productivity and the single day average hourly productivity, respectively, when the wicks, fins and the solar water heater were all added to the solar still. This is as a result of the greater increase in the basin water temperature (cf. Figure 4b,d) and evaporative surface area, which both facilitate an increased water evaporation rate. It is also evident from Table 3 that the modified active solar still recorded higher average daily, average hourly and daytime productivities than the unmodified active solar still due to the addition of the wicks and fins. By comparison, although the unmodified conventional solar still used in this study has a relatively low productivity, it has comparable performance compared to other passive solar stills of a similar nature used in previous studies, as shown in Table 4.
WHO recommends a minimum personal daily water requirement of 7.5 L/day, of which 5.5 L is for drinking purposes and 2 L for food preparation [49]. In consideration of this, the present active solar still with an average daytime daily output of 34.02 × 10⁻⁵ L/kJ·day, as shown in Table 3, under an average solar intensity of 16.4 MJ/m2 (the daily average of the testing site) would need at least 20 units of the evacuated tubes for the employed solar water heater and an increased absorber area of 1.34 m2 in order to meet the WHO minimum daily requirement of 7.5 L/day for one person. This represents an increase of 67% in the number of evacuated tubes and an increase of 63% in the size of the absorber area.

3.6. Estimated Cost per Liter of Distllate Peoduced by the Active (Modified) Solar Still

To determine the production cost per liter of distillate, a cost analysis was undertaken by considering the active (modified) solar still. Table 5 shows the breakdown of the fabrication cost associated with the active (modified) solar still.
To evaluate the annual cost per liter (ACper liter) of distillate produced by the active (modified) solar still, the following economic parameters were considered: amortization factor (a), capital cost (Ccapital), annual capital cost (ACcapital), fabrication cost or cost of equipment (Cequipment), installation cost (Cinstallation), annual maintenance and operation cost (ACO&M) and total annual cost (ACtotal).
The capital cost (Ccapital) was calculated as:
C c a p i t a l = C e q u i p m e n t + C i n s t a l l a t i o n
where Cinstallation was estimated to be 10% of Cequipment based on the simplicity of the design of the active (modified) solar still. In addition, land acquisition for the installation of the solar still is considered to be free of charge as it can be acquired by the resident for personal use and thus does not contribute to the capital cost.
The total annual cost (ACtotal) was calculated as:
A C t o t a l = A C c a p i t a l + A C O & M
where ACO&M is considered to be negligible based on the easy operation (done by the user themselves) and the durability of the materials used, and this term thus does not contribute to the total annual cost.
The amortization factor (a) was calculated as:
a = i ( 1 + i ) n ( 1 + i ) n 1
where the lifetime (n) of the active (modified) solar still is taken as n = 15 years based on the lifetime of a solar water heater and the interest rate (i) is taken as i = 3% based on the financial environment in Taiwan.
The annual capital cost (ACcapital) was calculated as:
A C c a p i t a l = a × C c a p i t a l
The annual productivity (M) and the annual cost per liter (Cper liter) of the distillate produced were calculated as:
M = m b × N b
A C p e r   l i t e r = A C t o t a l M
where m b represents the estimated yield per batch of solar distillate produced, where a recovery rate of 70% constitutes one batch, and Nb represents the number of batches that can be completed within a year. Based on the cumulative yield for the active (modified) solar still shown in Figure 6d, m b is estimated to be 40 L for one batch, which can be produced by the active (modified) solar still over a period of approximately 10 days. This duration also includes downtime for maintenance and preparation for a new batch. Given that one batch of distillate requires approximately 10 days to be completed, a total of 36 batches can be completed within a year. Therefore, N b is taken as 36.
Table 6 shows that the estimated cost per liter of distillate produced is NTD 6 (USD 0.21). This cost can be compared to the present price of NTD 13–23 (USD 0.47–0.83) per liter of bottled water obtained from a grocery store in the remote county of Penghu Island, Taiwan. This represents a price difference of 117–283% for the cost of potable water produced by the active (modified) solar still compared to the current market price on Penghu Island. In addition, in consideration of the remoteness of the installation location of the solar still, the estimated cost per liter of potable water generated by the active (modified) solar still can be more competitive if there is an increase in the retail price of bottled water due to the increased remoteness of the installation location. Furthermore, given that the parameters A C t o t a l and M are proportional to water demand, then the cost per liter as determined by Equation (10) is independent of water demand. This implies that the modifications necessary to enable the active (modified) solar still to meet the WHO minimum daily requirement as outlined in Section 3.5 would not affect the estimated cost per liter of distillate generated by the active (modified) solar still in this study.

4. Conclusions

Remote islands are characterized by low population, a large population share living under the poverty line, poor geographical accessibility and lack of electricity. Thus, the solar still, which has a low capital cost, easy operation and less need of maintenance, was selected to be used in remote islands with rich solar irradiance. The present study investigated the performance of a conventional solar still and two alternatives that were modified in two ways: by integrating its basin with fins and wicks, and with and without having its feed water preheated by an evacuated solar water heater. Then, a performance evaluation was carried out for each configuration. The obtained results are summarized as follows.
  • The treatment of highly concentrated raw seawater using the solar still can be carried out with a large reduction in TDS and chloride concentrations, which met the WHO standard for potable water.
  • The average daily productivity of the modified conventional passive solar still was reduced by 1.4% with the use of fins and wicks due to the bad solar condition in the testing period, whereas the average daytime hourly productivity increased by 28% compared to the unmodified conventional passive solar still under near equal solar radiation levels.
  • The use of wicks and fins is more effective for increasing the distillate output when added to the active solar still compared to the passive solar still.
  • The combined use of fins, wicks and a solar water heater increased the average daily productivity by 147% and the average daytime hourly productivity by 245% compared to the conventional passive solar still under near equal solar radiation levels.
  • Using the present design, the active solar still under the solar environment of the testing site can provide 4.5 L of potable water per day. However, to achieve the minimum daily requirement of 7.5 L/day per person set by WHO, the present design should be modified by increasing the absorber area of the active solar still by 63%, to 1.34 m2, and increasing the number of evacuated tubes used in the solar water heater to 20 units. To apply this system in a different location, the required absorber area of the solar still and the number of evacuated tubes of the employed solar water heater can be recalculated in terms of the weather conditions, in particular, solar irradiance, in order to meet the minimum personal daily requirement set by WHO.
  • The estimated unit cost of desalination of raw seawater from the active (modified) solar still used in this study was NTD 6 (USD 0.21) per liter.

Author Contributions

Conceptualization and supervision, K.-C.C.; methodology, A.S. and C.-T.L.; validation, A.S. and C.-T.L.; formal analysis, A.S. and J.B.; investigation, A.S. and J.B.; data curation, A.S. and J.B.; writing—original draft preparation, A.S.; writing—review and editing, K.-C.C. All authors have read and agreed to the published version of the manuscript.

Funding

This research received no external funding.

Institutional Review Board Statement

Not applicable.

Informed Consent Statement

Not applicable.

Data Availability Statement

Not applicable.

Conflicts of Interest

The authors declare no conflict of interest.

Nomenclature

SymbolDescription
aAmortization factor
ABWTAverage basin water temperature
ACcapitalAnnual capital cost
ACO&MAnnual maintenance and operation cost
ACper literAnnual cost per liter
ACtotalTotal annual cost
ADSRAverage daily solar radiation
A e Evaporative surface area
AHSRAverage hourly solar radiation
CcapitalCapital cost
CequipmentCost of equipment
CinstallationInstallation cost
dDiameter
iInterest rate
I (t)Solar radiation intensity
LLength
m b Productivity per batch
m ˙ i Condensation rate (production rate)
MAnnual productivity
nLifetime
N b Number of batches
NTDNew Taiwanese dollar
PRPProduction rate performance
T B Basin temperature
TDSTotal dissolved solids
T G Glass temperature
USDUnited States dollar
ΔtTime interval
∆TTemperature difference

References

  1. Shiklomanov, I. Assessment of Water Resources and Water Availability in the World: Scientific and Technical Report; State Hydrological Institute: St. Petersburg, Russia, 1996. [Google Scholar]
  2. Burns, W. Pacific Island Developing Country Water Resources and Climate Change. In The World’s Water 2002–2003; Island Press: Washington, DC, USA, 2002; pp. 113–131. [Google Scholar]
  3. Mirti, A.; Davies, S. Drinking Water Quality in the Pacific Island Countries: Situation Analysis and Needs Assessment; SOPAC Joint Contribution Report 181; Applied Geoscience and Technology Division, Secretariat of the Pacific Community: Suva, Fiji, 2005; Available online: http://www.pacificwater.org/userfiles/file/jc0181.pdf (accessed on 3 December 2021).
  4. Mcleod, E.; Bruton-Adams, M.; Förster, J.; Franco, C.; Gaines, G.; Gorong, B.; James, R.; Posing-Kulwaum, G.; Tara, M.; Terk, E. Lessons from the Pacific Islands—Adapting to Climate Change by Supporting Social and Ecological Resilience. Front. Mar. Sci. 2019, 6, 289. [Google Scholar] [CrossRef]
  5. Kucera, J. Desalination: Water from Water, 2nd ed.; John Wiley and Sons: Hoboken, NJ, USA, 2019. [Google Scholar]
  6. El-Dessouky, H.T.; Ettouney, H.M. Fundamentals of Saltwater Desalination, 1st ed.; Elsevier: Amsterdam, The Netherlands, 2002. [Google Scholar]
  7. Guidelines for Drinking-Water Quality, 4th ed.; Incorporating the 1st Addendum; World Health Organization; Available online: https://www.who.int/publications/i/item/9789241549950 (accessed on 3 December 2021).
  8. Prasad, S. An Overview of Renewable Energy Resources in the South Pacific Island Countries. RERIC Int. Energy J. 1991, 13, 131–138. [Google Scholar]
  9. Wibowo, A.I.; Chang, K.C. Solar Energy-Based Water Treatment System Applicable to the Remote Areas: Case of Indonesia. J. Water Sanit. Hyg. Dev. 2020, 10, 347–356. [Google Scholar] [CrossRef]
  10. Khadim, M.; Al-Awahid, W.; Hachim, D. Review on the Types of Solar Stills. IOP Conf. Ser. Mater. Sci. Eng. 2020, 928, 022046. [Google Scholar] [CrossRef]
  11. Sampathkumar, K.; Arjunan, T.V.; Pitchandi, P. Active Solar Distillation—A Detailed Review. Renew. Sustain. Energy Rev. 2010, 14, 1503–1526. [Google Scholar] [CrossRef]
  12. Manchanda, H.; Kumar, M. A Comprehensive Decade Review and Analysis on Designs and Performance Parameters of Passive Solar Still. Renew. Wind. Water Sol. 2015, 2, 17. [Google Scholar] [CrossRef]
  13. Dsilva Winfred Rufuss, D.; Iniyan, S.; Suganthi, L.; Davies, P.A. Solar Stills: A Comprehensive Review of Designs, Performance and Material Advances. Renew. Sustain. Energy Rev. 2016, 63, 464–496. [Google Scholar] [CrossRef] [Green Version]
  14. Muftah, F.; Alghoul, M.A.; Fudholi, A.; Abdul-Majeed, M.M.; Sopian, K. Factors Affecting Basin Type Solar Still Productivity: A Detailed Review. Renew. Sustain. Energy Rev. 2014, 32, 430–447. [Google Scholar] [CrossRef]
  15. Nguyen, B.T. Factors Affecting the Yield of Solar Distillation Systems and Measures to Improve Productivities. In Desalination and Water Treatment; Eyvaz, M., Yüksel, E., Eds.; Intechopen: London, UK, 2018; pp. 151–176. [Google Scholar]
  16. Chamsa-ard, W.; Fawcett, D.; Fung, C.C.; Poinern, G. Solar Thermal Energy Stills for Desalination: A Review of Designs, Operational Parameters and Material Advances. J. Energy Power Technol. 2020, 2, 48. [Google Scholar] [CrossRef]
  17. Tarawneh, M.S.K. Effect of Water Depth on the Performance Evaluation of Solar Still. Jordan J. Mech. Ind. Eng. 2007, 1, 23–29. [Google Scholar]
  18. Belessiotis, V.; Kalogirou, S.; Delyannis, E. Thermal Solar Desalination: Methods and Systems; Elsevier: London, UK, 2016; pp. 103–190. [Google Scholar]
  19. Sharma, M.; Tiwari, A.; Mishra, D. A Review on Desalination of Water Using Single Slope Passive Solar Still. Int. J. Dev. Res. 2016, 6, 10002–10012. [Google Scholar]
  20. El-Sebaii, A.A.; Ramadan, M.R.I.; Aboul-Enein, S.; El-Naggar, M. Effect of Fin Configuration Parameters on Single Basin Solar Still Performance. Desalination 2015, 365, 15–24. [Google Scholar] [CrossRef]
  21. Jain, P.; Kumar, H.; Anand, K.B. Performance Enhancement in Working of Double Slope Solar Still with Modifications. Int. J. Eng. Res. Gen. Sci. 2020, 8, 72–88. [Google Scholar]
  22. Dwivedi, V.K.; Tiwari, G.N. Annual Energy and Exergy Analysis of Single and Double Slope Passive Solar Stills. Trends Appl. Sci. Res. 2008, 3, 225–241. [Google Scholar]
  23. Al-Molhem, Y.A.; Eltawil, M.A. Enhancing the Double-Slope Solar Still Performance Using Simple Solar Collector and Floatable Black Wicks. Environ. Sci. Pollut. Res. 2020, 27, 35078–35098. [Google Scholar] [CrossRef]
  24. Patel, S.K.; Kumar, B.; Pal, P.; Dev, R.; Singh, D. Production of Potable Water from Gomti River by Using Modified Double Slope Solar Still with External Mounted Reflectors. Sol. Energy 2020, 209, 576–589. [Google Scholar] [CrossRef]
  25. Kamal, W. A Theoretical and Experimental Study of the Basin-Type Solar Still under the Arabian Gulf Climatic Conditions. Sol. Wind Technol. 1988, 5, 147–157. [Google Scholar] [CrossRef]
  26. Kandasamy, S.; Vellingiri, M.; Sengottain, S.; Balasundaram, J. Performance Correlation for Single-Basin Double-Slope Solar Still. Int. J. Energy Environ. Eng. 2013, 4, 4. [Google Scholar] [CrossRef] [Green Version]
  27. Tiwari, G.N.; Dimri, V.; Chel, A. Parametric Study of an Active and Passive Solar Distillation System: Energy and Exergy Analysis. Desalination 2009, 242, 1–18. [Google Scholar] [CrossRef]
  28. Kariuki, B.K. Solar Distillation; Design, Fabrication and Characterization of a Double Sloped Solar Still for Household Use along the Kenya Coast. Int. J. Recent Eng. Res. Dev. (IJRERD) 2018, 2, 87–97. [Google Scholar]
  29. Pal, P.; Dev, R.; Singh, D.; Ahsan, A. Energy Matrices, Exergoeconomic and Enviroeconomic Analysis of Modified Multi–Wick Basin Type Double Slope Solar Still. Desalination 2018, 447, 55–73. [Google Scholar] [CrossRef]
  30. Modi, K.; Jani, H. Experimental and Theoretical Assessment of Dual-Slope Single-Basin Solar Still with the Circular Cross-Sectional Hollow-Fins. Clean. Eng. Technol. 2021, 4, 100231. [Google Scholar] [CrossRef]
  31. Tuly, S.S.; Rahman, M.S.; Sarker, M.R.I.; Beg, R.A. Combined Influence of Fin, Phase Change Material, Wick, and External Condenser on the Thermal Performance of a Double Slope Solar Still. J. Clean. Prod. 2021, 287, 125458. [Google Scholar] [CrossRef]
  32. Al-Garni, A.Z.; Kassem, A.H.; Saeed, F.; Ahmed, F. Effect of Glass Slope Angle and Water Depth on Productivity of Double Slope Solar Still. J. Sci. Ind. Res. (JSIR) 2011, 70, 884–890. [Google Scholar]
  33. Babalola, T.A.; Boyo, A.O.; Kesinro, R.O. Effect of Water Depth and Temperature on the Productivity of a Double Slope Solar Still. J. Energy Nat. Resour. 2015, 4, 1–4. [Google Scholar] [CrossRef] [Green Version]
  34. Zarzoum, K.; Zhani, K.; Bacha, H.B. Improving the Design, Modeling and Simulation in Dynamic Mode of a Solar Still. Desalination Water Treat. 2014, 52, 6304–6314. [Google Scholar] [CrossRef]
  35. CNS 15165-1; Test Methods for Solar Collectors—Part 1: Thermal Performance of Glazed Liquid Heating Collectors Including Pressure Drop. Central Bureau of Standard: Taibei, Taiwan, 2008.
  36. ISO 9806-1; Test Methods for Solar Collectors—Part 1: Thermal Performance of Glazed Liquid Heating Collectors Including Pressure Drop. International Standards Organization: Geneva, Switzerland, 1995.
  37. Halawa, E.; Chang, K.C.; Yoshinaga, M. Thermal Performance Evaluation of Solar Water Heating Systems in Australia, Taiwan and Japan—A Comparative Review. Renew. Energy 2015, 83, 1279–1286. [Google Scholar] [CrossRef]
  38. Ithape, P.K.; Barve, S.B.; Nadgire, A.R. Climatic and Design Parameters Effects on the Productivity of Solar Stills: A Review. Int. J. Curr. Eng. Sci. Res. 2017, 4, 17–23. [Google Scholar]
  39. Copper, J.C. Taiwan. Encyclopedia Britannica. Available online: https://www.britannica.com/place/Taiwan (accessed on 6 December 2021).
  40. Hsu, H.H.; Chen, C.T. Observed and Projected Climate Change in Taiwan. Meteorol. Atmos. Phys. 2002, 79, 87–104. [Google Scholar] [CrossRef]
  41. Salter, C.L.; Gritzner, C.F. Taiwan, 1st ed.; Infobase Publishing: Philadelphia, PA, USA, 2009; pp. 19–23. [Google Scholar]
  42. World Health Organization. Total Dissolved Solids in Drinking-Water. Available online: https://www.who.int/water_sanitation_health/dwq/chemicals/tds.pdf (accessed on 16 December 2021).
  43. Aybar, H.S. A Review of Desalination by Solar Still. In Solar Desalination for the 21st Century; Springer: Berlin/Heidelberg, Germany, 2007; pp. 207–214. [Google Scholar] [CrossRef]
  44. Nomor, E.; Islam, R.; Alim, M.A.; Rahman, A. Production of Fresh Water by a Solar Still: An Experimental Case Study in Australia. Water 2021, 13, 3373. [Google Scholar] [CrossRef]
  45. Gnanaraj, S.J.P.; Velmurugan, V. An Experimental Study on the Efficacy of Modifications in Enhancing the Performance of Single Basin Double Slope Solar Still. Desalination 2019, 467, 12–28. [Google Scholar] [CrossRef]
  46. Tiwari, G.N.; Dwivedi, V. K Experimental Validation of Thermal Model of a Double Slope Active Solar Still under Natural Circulation Mode. Desalination 2010, 250, 49–55. [Google Scholar]
  47. Kariuki, B.K.; Kamau, J.N.; Kinyua, R. Quality and Economic Analysis of a Double Sloped Solar Still for Household Use in Kilifi County, Kenya. Int. J. Adv. Res. Eng. Manag. 2017, 3, 70–78. [Google Scholar]
  48. Prajapati, U.K.; Gupta, B.; Bhalavi, J. Performance Improvement of Double Slope Solar Still Using Aluminum Fins and Phase Change Material. J. Emerg. Technol. Innov. Res. 2019, 6, 295–302. [Google Scholar]
  49. Howard, G.; Bartram, J. Domestic Water Quality, Service Level and Health; Technical Document, WHO/SDE/WSH/03.02; World Health Organization: Geneva, Switzerland, 2003. [Google Scholar]
Figure 1. Sketch of the dimensions of the glass cover support.
Water 14 00703 g001
Figure 2. Experimental set-up: (a) basin with wicks and fins; (b) set-up of the active solar still.
Water 14 00703 g002
Figure 3. Pictorial view of the basin and location of the thermocouples.
Water 14 00703 g003
Figure 4. Variation in average basin water temperature (ABWT) with average daily solar radiation (ADSR): (a) conventional solar still (unmodified); (b) conventional solar still (modified); (c) active solar still (unmodified); and (d) active solar still (modified).
Water 14 00703 g004
Figure 5. Hourly distribution of basin water temperature within the basin of the solar stills on the first day of testing: (a) conventional solar still (unmodified); (b) conventional solar still (modified); (c) active solar still (unmodified); and (d) active solar still (modified).
Water 14 00703 g005
Figure 6. Variations in daytime and night-time yields with average daily solar radiation: (a) conventional solar still (unmodified); (b) conventional solar still (modified); (c) active solar still (unmodified); and (d) active solar still (modified).
Water 14 00703 g006aWater 14 00703 g006b
Table 1. Water quality parameters used for comparison.
Species ConcentrationRaw SeawaterDistilled WaterWHO Standard
Chloride (mg/L)20,1000.20<250 [7]
TDS (mg/L)34,269Trace amount (<50)<900 [42]
Table 2. Percentage contribution of daytime and night-time yield.
Solar Still ConfigurationPercentage Contribution of Total Yield (%)
Day-TimeNight-Time
Conventional (unmodified)73.626.4
Conventional (modified)78.721.3
Active (unmodified)87.912.1
Active (modified) 86.713.3
Table 3. Effect of solar still modifications on productivity.
ConfigurationEvaporative Surface AreaAverage Daily Productivity 1Average Hourly Productivity
(under Sunshine)
Daytime Productivity 6
Area (m2)% ChangeL/m2·day% ChangeL/m2·h% ChangeL/kJ·day × 10−5% Change
Conventional (unmodified)0.820-2.20
(1.80 L/day)
-0.114 2 -11.59-
Conventional
(modified)
0.8665.612.17
(1.78 L/day)
−1.360.145 3 28.0411.23−3.1
Active
(unmodified)
0.820-4.07
3.34 L/day
850.489 5328.9532.86183.5
Active
(modified)
0.8665.615.43
(4.45 L/day)
146.820.392 4245.3534.02193.5
1 Values include both daytime and night-time production per absorber area; 2 407.75 W/m2; 3 408.23 W/m2; 4 398.02W/m2; 5 412.16 W/m2; 6 Based on average values of solar radiation for 9 h per day.
Table 4. Comparison of productivity for previously studied passive solar stills of similar design with the present unmodified passive solar still.
ReferencesClimatic RegionLatitude of SiteTesting PeriodProductivity (L/m2·day)
Gnanaraj et al. [45]India11.9° NMarch–May1.880
Tiwari et al. [46]India28.6° NJanuary1.838
Karanja et al. [47]Kenya3.5° SSeptember–October1.652
Prajapati et al. [48]India22.7° NNovember1.400
PresentTaiwan22.9° NSeptember–October2.200
Table 5. Fabrication cost of the active (modified) solar still.
ItemsQuantityUnit Cost (NTD)Cost (NTD)Cost (USD) 1
Glass + glass frame118,00018,000640
Basin + support structure + fins133,45033,4501189
Evacuated tubes12300036,0001279
Total cost--87,4503108
1 USD 1 = NTD 28.14.
Table 6. Calculated values of the parameters used in the cost estimation per liter of distillate produced.
ParametersValues
a (Amortization)0.0837
Ccapital (Present capital cost)NTD 96,195 (USD 3418)
ACcapital (Annual capital cost)NTD 8052 (USD 286)
ACO&M (Annual operation and maintenance cost)NTD 0
ACtotal (Total annual cost)NTD 8052 (USD 286)
M (Annual productivity)1440 L
ACper liter (Annual cost per liter of distillate output)NTD 6 (USD 0.21)
Publisher’s Note: MDPI stays neutral with regard to jurisdictional claims in published maps and institutional affiliations.

