Technical Note

Surface Drainage Systems Operating during Heavy Rainfall—A Comparative Analysis between Two Small Flysch Catchments Located in Different Physiographic Regions of the Western Carpathians (Poland)

Institute of Geography, Pedagogical University of Krakow, Podchorążych 2 St., 30-084 Krakow, Poland
*
Author to whom correspondence should be addressed.
Water 2022, 14(3), 482; https://doi.org/10.3390/w14030482
Submission received: 5 December 2021 / Revised: 26 January 2022 / Accepted: 2 February 2022 / Published: 6 February 2022
(This article belongs to the Section Hydrology)

Abstract

:
In this study, the river system and the surface drainage system (SDS) operating during heavy rainfall in two Carpathian catchments located in foothills and medium-high mountain areas were compared. The results revealed that regardless of the differences in the river systems and physiographical parameters of the catchments, the SDS operating during heavy rainfall becomes similar. This similarity is reflected in the density of the SDS (11.5–12.2 km·km−2) and the structure of the SDS, confirmed by Hortonian-type analysis. This similarity in the SDS was discussed in the context of the geomorphological transformation of the hillslopes and the hydrological response of a catchment to heavy rainfall.

1. Introduction

A surface drainage system (SDS) is one of the most important components in a catchment. The system influences runoff [1,2], type and intensity of geomorphological processes as well as sediment and nutrients transport [3,4,5,6,7,8]. Therefore, drainage system development and functioning have brought the attention of scientists since the 1950s [9,10,11,12,13,14,15,16]. Works by R.E. Horton [10], A.N. Strahler [11] and S.A. Schumm [12] were pioneering in this area. These works, among others, have revealed that the drainage network is a dynamic component of the catchment and changes with different types of hydro-meteorological conditions, catchment relief and geology [17]—review [18,19,20,21,22]. The papers also showed that the structure of the natural-origin drainage system reflects geo-morpho-climatological conditions of the region, where this system was developed [13,16]. Those relationships were the base for integrating hydrologic, ecologic and geomorphologic dynamics of river basins [9]—review. In the Carpathians, the density of a river drainage system is usually up to 3.5 km·km−2 [23,24,25]. However, during hydro-meteorological events, such as rainfall or thaws, the surface drainage system changes. The changes result from the incorporation of the river system, including (1) natural-origin elements (such as smaller lateral valleys or incisions conditioned by micro-relief) and (2) man-origin incisions (e.g., paved and unpaved roads, ditches and plough furrows). The density of the man-origin elements exceeds the density of the natural-origin valley system at least two times [26,27,28,29,30] and some of them (roads) are preserved in the environment for centuries [29]. During extreme hydro-meteorological events such as heavy rainfalls, when the most preferable conditions for the overland flow formation occur [1], the natural- and man-origin incisions operate as one ‘real’ SDS. So far, knowledge about the parameters of these systems is limited, mainly due to the difficulties in the reconstruction of the ‘real’ SDS, which had been made in the post-event investigation and covered small areas [17,18,21,22]. The ALS-LIDAR data released in recent years gave a new opportunity in the ‘real’ SDS reconstruction and characterization [27,28].
In the West Carpathians there are two large sub-regions: foothills and medium–high-mountain terrains (known as Beskidy) which differ in terms of natural (climate, relief and structure of land cover) and man-made settings (land use and settlement conditions) influencing the development of a river drainage system, and man-origin elements which may be incorporated to the SDS. The literature lacks studies focusing on changes in the SDS in flysch catchments located in the Carpathians and operating under different hydro-meteorological conditions. Therefore, the goals of this study are (1) to compare the SDS in catchments located in two different physiographical regions of the West Carpathians, with respect to two phases of a catchment functioning: ‘normal conditions’ (when the groundwater aquifer is drained) and ‘extreme conditions’ (when catchment is affected by heavy rainfall) and (2) to discuss how the modified SDS may influence geomorphological transformation and hydrological response of a catchment.

2. Materials and Methods

In order to reach the goals of this study, the operation of the SDS during extreme hydro-meteorological conditions was reconstructed according to the methodology described by Bryndal and Kroczak [27].
The main steps of this methodology were related to:
(1) The development of high resolution (1.0 × 1.0 m) Digital Elevation Model (DEM), enabling detection of the natural- and man-origin incisions which differed in terms of the types and size (e.g., concaves/incisions resulted from relief, paved/unpaved roads and ditches etc.). The DEM was developed on the base of a ground layer consisting of point data from ALS-LiDAR (data from ISOK project database were used). The density of points was 4–6 pct·m−2 and vertical errors were up to 0.15 m.
(2) Pre-processing of the DEM and its adaptations for hydrological analyses. The DEM created from LiDAR data reflects ‘real’ terrain surface. This denotes that the bridges, culverts, footbridges, etc. (which normally allow water to flow through them) are reflected as ‘artificial dams’ which disturb the natural gravity flow. In order to create the SDS, which is similar to this functioning in real conditions, the DEM must be hydrologically corrected. The bridges, culverts and footbridges were ‘burned’, using a typical algorithm implemented in GIS software.
(3) Delineation of the stream. The streams were generated using typical procedures implemented in GIS software. The D8 algorithm was selected for a flow accumulation procedure. The streams were identified using the head channel areas [27,28] (Table 1), which were calculated for models of catchments contributing to the development of 1st-order streams.
The reconstructed SDS has been characterized quantitatively by several measures. These were: (1) the number (n), (2) total length (km) and (3) mean stream length (km), (4) the density of streams (km·km−2), (5) mean catchment area drained by i-order streams (km2) as well as (6) the bifurcation (RB), (7) the length (RL) and (8) the area (RA) ratios [10,11]. In the authors’ opinion, these measures enable comprehensive characterization of the surface drainage system and evaluation of the internal structural changes in the SDS.
The SDS operating during heavy rainfall has been compared to the river drainage system, which operates in ‘normal’ conditions when the groundwater aquifer is drained. The river drainage system was obtained from the MPHP 10 database (Hydrographic Map of Poland at a scale 1:10,000)—the most detailed source of information related to hydrological units in Poland.
The comparison allowed us to assess the changes in the SDS occurring during extreme hydro-meteorological events and gave the background for discussion about the changes in the SDS in the context of the hydrological response of a catchment.

3. The Study Area

Two flysch catchments located in the Carpathian foothills (Zalasówka) and Beskidy-medium-high mountain areas (Bystrzanka) have been selected for this study (Figure 1). The catchment areas are 9.2 km2 (Zalasówka) and 12.9 km2 (Bystrzanka). There are small differences in the shape of the catchments. The Zalasówka catchment is more elongated (circularity ratio Ck = 0.52) than the Bystrzanka catchment (Ck = 0.64). The bedrocks of the Zalasówka catchment are composed of loess-like deposits covering the sandstones and shales of the Sillesian Napppe [31]. The bedrocks of Bystrzanka are composed of weathered sandstones and shales of Magura Nappe [32]. The mantle is composed of clay with a large content of stone fraction, which covers hillslopes (up to several meters in thickness). The Luvisoils prevails in the Zalasówka catchment, whereas the Dysrtic Cambisols, classified as medium and heavy clays [33], dominate in the soil cover of the Bystrzanka catchment. In spite of differences in geology and the soil cover, the catchments are characterized by a relatively low water infiltration rate—up to 36 mm·h−1 (based on soil permeability classification [34]. The catchments differ in terms of relief characteristics. The average slope gradient is higher in Bystrzanka (9°) than in the Zalasówka (7°) catchment. Significant differences are observed in each range of the slope gradient (Figure 1b), which indicates that the relief energy in the Bystrzanka catchment is higher. The pattern (the dendritic type with a little asymmetry of right-site tributaries) of the river system is comparable in both catchments (Figure 1); however, the densities are different (1.5 km·km−2 Zalasówka vs. 2.3 km·km−2 Bystrzanka).
The catchments differ in terms of land cover. In the Zalasówka catchment, the land cover is composed of arable lands (33%), grasslands (33%) and forest (20%). The category ‘others’, which represents 14% of the catchment area, refers to built-up areas, orchards, gardens and roads (Figure 1). The settlement development resulted in fragmentation of rural areas and, consequently, a dense road network (7.4 km·km−2) was developed. The Zalasówka may be considered a representative type of agricultural catchment for the Carpathian Foothills.
In the Bystrzanka catchment, the southern part of the catchment is covered by forest (46%). The remaining part is covered by grasslands (36%) and, to a lesser extent arable lands (9%). The ‘other’ category represents 9% of the catchment area (orchards and gardens—5%, roads and build up areas—4%). Agricultural fields (arable land, grassland) are divided similarly to the fields in the Zalasówka catchment; however, forests create one compact complex (Figure 1c). The Bystrzanka may be considered an agricultural-forested type of the catchment located in medium-high mountain areas—Figure 1.

4. Results

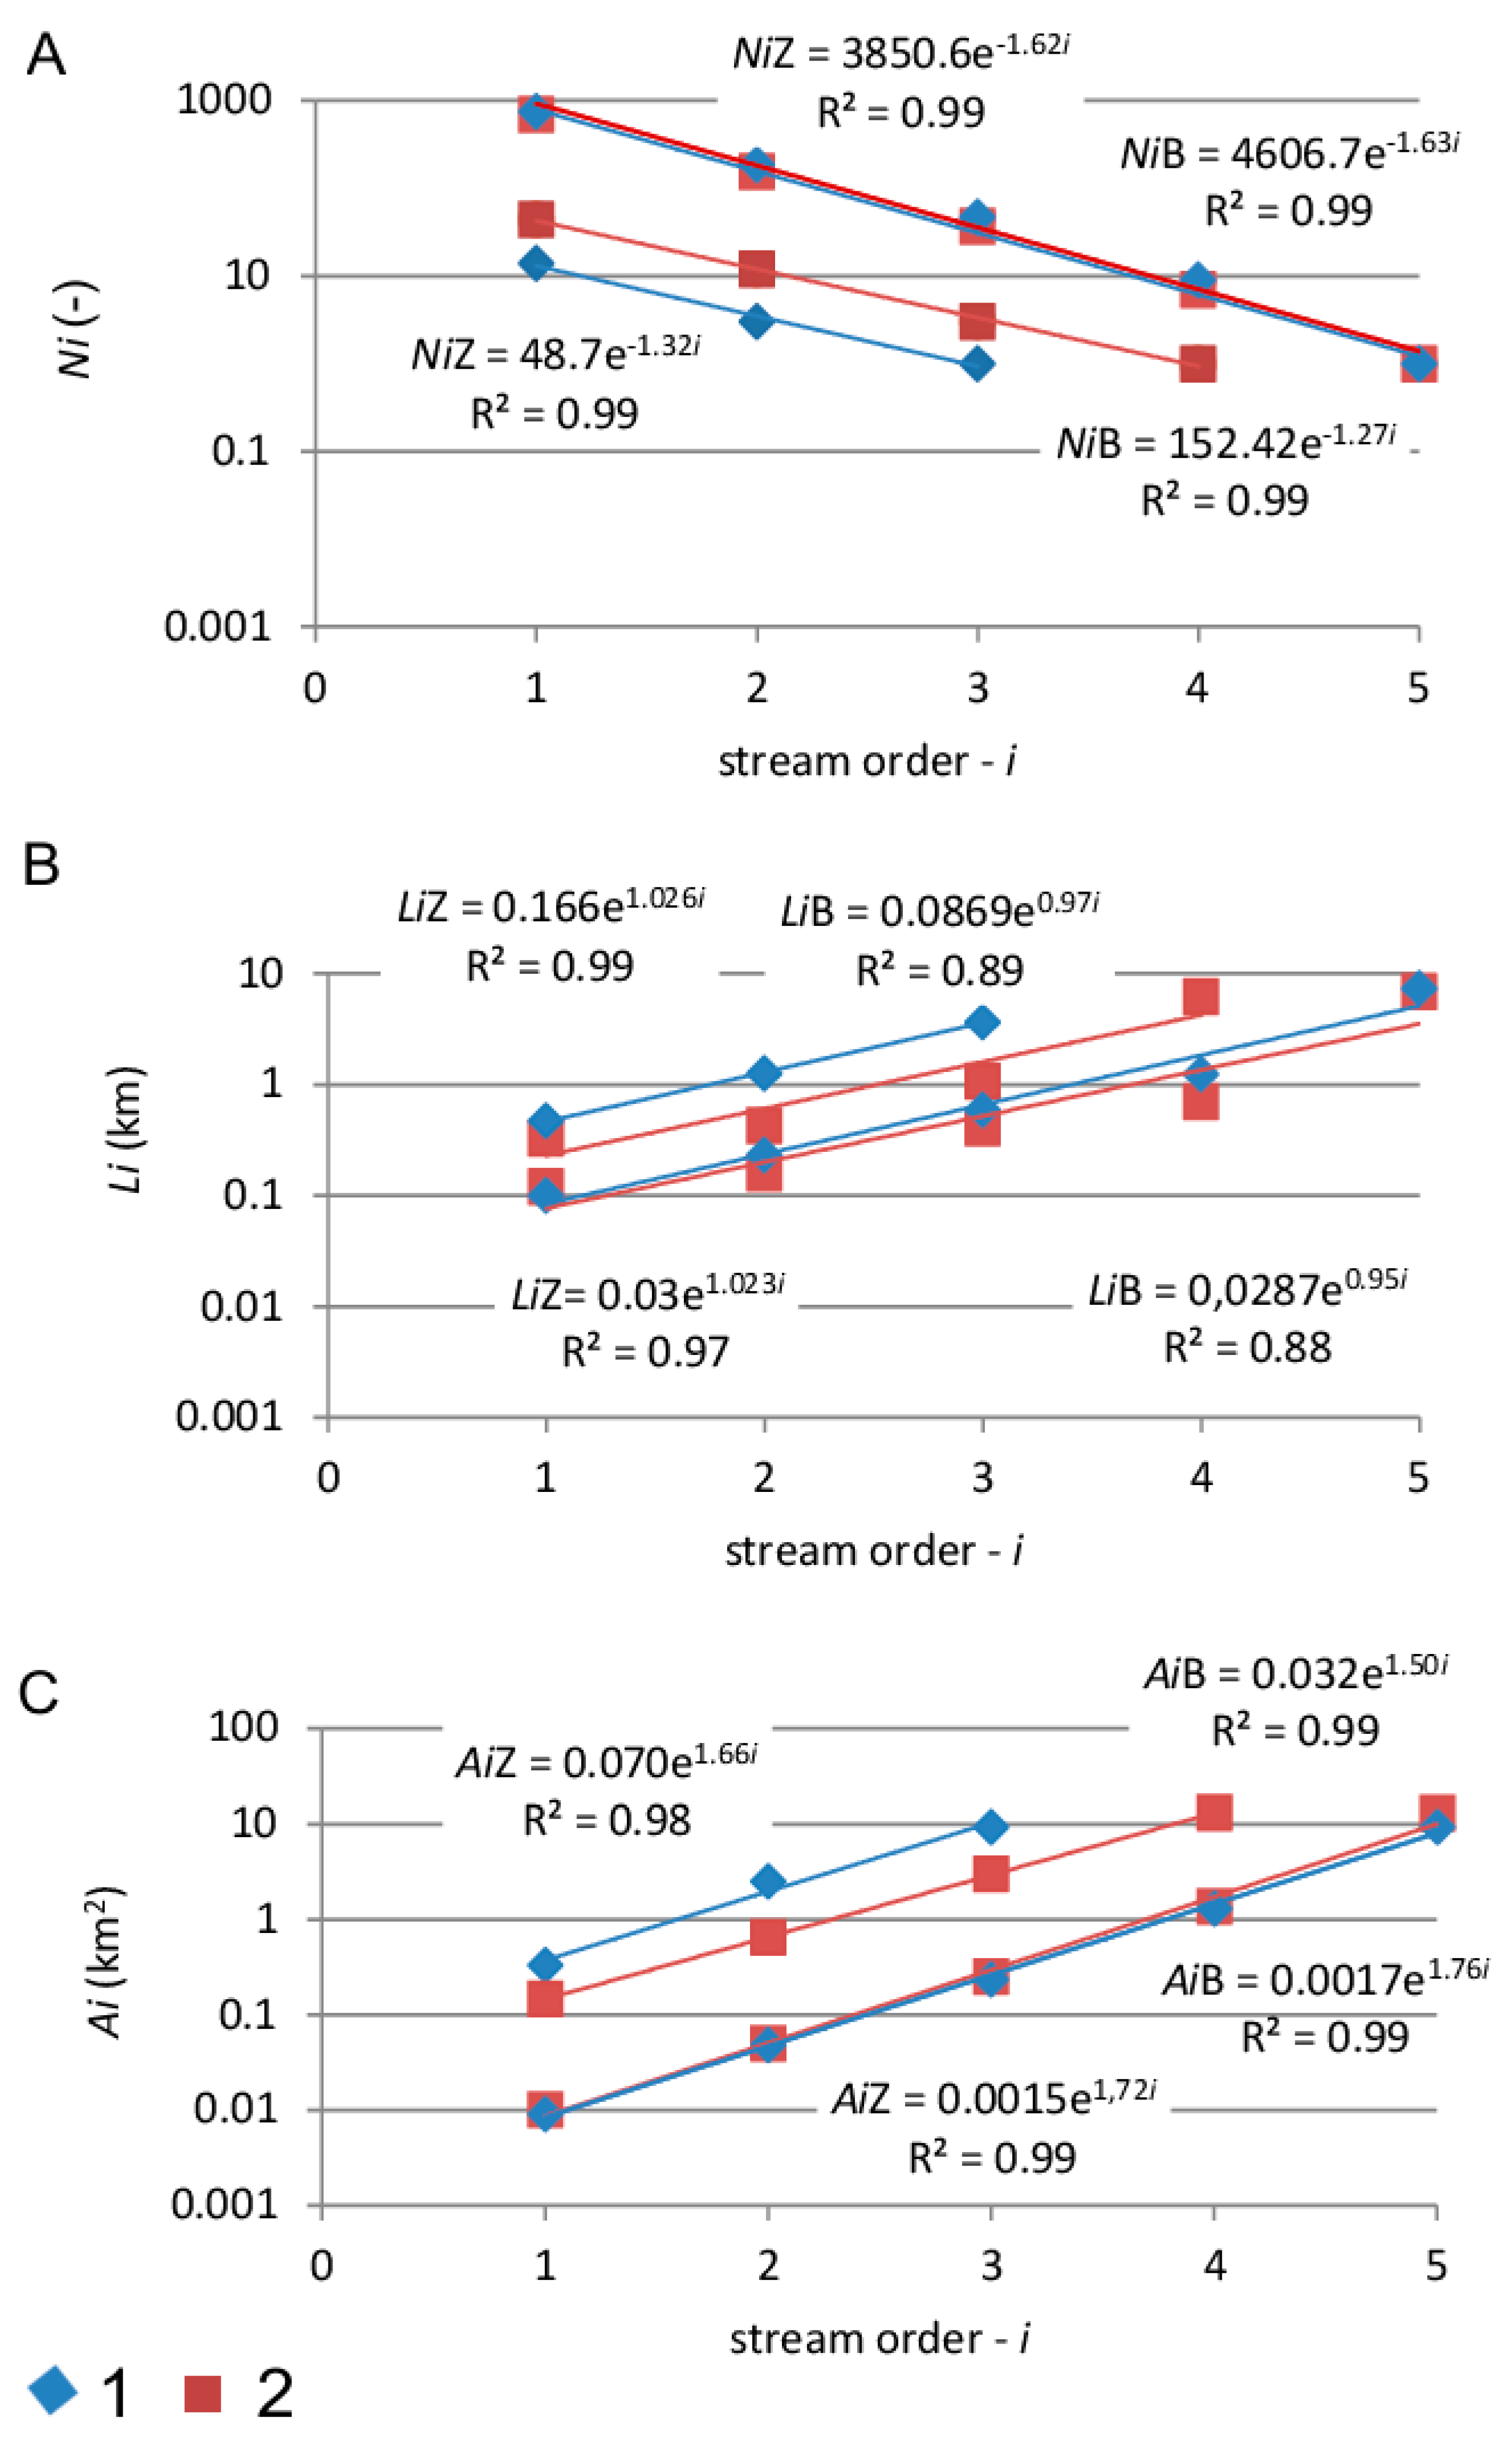
4.1. Characterization of the River Drainage System

The parameters of the river drainage system are presented in Table 2 and Figure 2a and Figure 3. In light of so-called Hortonian analysis, the river drainage systems in both catchments are slightly different. In the Zalasówka catchment, the river drainage system is developed to a 3rd-order stream and the system is composed of 18 stream segments (according to Strahler topology [11]). In the Bystrzanka catchment, the maximum stream order is 4 and the system is composed of 60 stream segments. Generally, the number of stream segments in each i-order stream is 3–4 times higher in the Bystrzanka catchment than in the Zalasówka catchment. It denotes that the system is better developed in the catchment located in medium-high mountain areas (Beskidy). In both catchments a mean rate of the river system development is comparable. The bifurcation ratio is in the range of 3.6–3.8 and the exponent in the regression line ranges from −1.27 (Bystrzanka) to −1.32 (Zalasówka)—Table 2 and Figure 3a.
In the Zalasówka catchment, the mean density of a river system related to the catchment area as all has reached 1.5 km·km−2 and the mean densities related to the catchments drained by i-order streams are enclosed between 1.33 km·km−2 and 2.13 km·km−2 (Table 2). In the Bystrzanka catchment those parameters are a little higher, meaning that the river system is better developed. The mean density of the river system reached 2.3 km·km−2 and the internal differences related to catchments drained by i-order catchments are enclosed in the range 1.5–3.8 km·km−2 (Table 2).
In the Zalasówka catchment, the mean length of the 1st-order stream is 0.47 km and the mean stream lengths of consecutive i-order streams are on average 2.8 times longer (RL ratio). The internal differences, characterized by the quotients of consecutive i-order streams, are relatively low (Li2/Li1 = 2.7, Li3/Li2 = 2.9). In the Bystrzanka catchment, the mean length of the 1st-order stream is 0.33 km and the mean stream lengths of consecutive i-order streams are, on average, 3.2 times longer (RL ratio). In the Bystrznka catchment, the internal rates of the river system development are more diversified (Li2/Li1 = 1.3, Li3/Li2 = 2.5) than in the Zalasówka catchment. These differences are the most noticeable for the highest stream order (Li4/Li3 = 5.7) and may be explained by the morphology of the catchments, which forces the development of the highest order stream in the upper part of the catchment (Figure 2a).
In the Zalasówka catchment, the mean catchment area drained by the 1st-order stream reaches 0.33 km2 and the mean areas of the catchments drained by consecutive i-order streams are, on average, 5.6 times larger (RA). In the Bystrzanka catchment, where the river drainage system is better developed, those parameters amount to 0.15 km2 and 4.5, respectively (Table 2). The internal differences in the river system development in the Zalasówka catchment (Ai2/Ai1 = 7.5; Ai3/Ai2 = 3.7) are higher compared to the Bystrzanka catchment (Ai2/Ai1 = 4.5; Ai3/Ai2 = 4.6 and Ai4/Ai3 = 4.4). The differences in the river system development may be explained by the morphology of the catchments where a 1st-order catchment drains a significant part of the catchment (Figure 1 and Figure 2).
The comparison of the river systems in both catchments indicates that the systems slightly differ in terms of the stream density and parameters arising from Hortonian-type analysis such as: the maximum steam order, the number of streams and, consequently, the mean length of the i-order stream and mean area drained by the i-order stream. The results indicate that the river drainage system is better developed in the Bystrzanka catchment, located in the medium-high mountain area. Taking into account the differences in the river systems, the question is: how does the surface drainage system change during extreme hydro-meteorological conditions in those catchments?

4.2. Surface Drainage System Operating during Heavy Rainfall and Its Changes in Relation to the River Drainage System

The parameters of the river drainage system are presented in Table 2 and Figure 2b and Figure 3. During heavy rainfall, the SDS-s differ from the river system significantly. These differences are reflected in the density and the internal structure of the systems. In the Zalasówka catchment, the density of the SDS has increased 8 times (from 1.5 km·km−2—river SDS to 12.2 km·km−2—heavy rainfall SDS). In the Bystrzanka catchment (where the river system was better developed), this increase has been fivefold (from 2.3 km·km−2 to 11.5 km·km−2—respectively). Moreover, there are internal alterations of the SDS, which are reflected in parameters resulting from so-called Hortonian-type analysis. The maximum stream has risen to 5th-order in both catchments. The number of streams in the SDS has increased 50 times in the Zalasówka (from 18 stream segments for the river system to 893 stream segments for the SDS operating during heavy rainfall) and 16 times in the Bystrzanka (from 60 to 989, respectively). The increases related to i-order streams have ranged from 37 to 52 in the Zalasówka catchment and from 9 to 17 in Bystrzanka catchment (lower increases may be explained by the fact that the river system is better developed). The mean rates of the surface drainage system development characterized by the bifurcation ratios are comparable in both catchments 5.2 (Zalasówka) and 5.6 (Bystrzanka). The comparable rate of the SDS development is confirmed by similar values of the exponents in the regression line (−1.62 Zalasówka; −1.63 Bystrzanka).
Similar internal alterations of the SDS are reflected in mean stream length and mean stream area. For the SDS operating during heavy rainfall, the mean stream length of 1st-order streams reaches c.a. 0.1 km in both catchments and it is up to 4 times smaller compared to this value for the river system (0.47 km—Zalasówka and 0.33 km—Bystrzanka). Generally, up to 4th-order streams, the rates of the SDS development do not change and they are comparable in both catchments (the quotient range is around 2—Table 2). Higher differences occur for the highest stream order (Li5/Li4≈6), what may be explained by the morphology of the catchments, which (similar to river SDS) forces development of the highest order stream in the upper part of the catchment (Figure 2). The log-plot (Figure 2b) has indicated that the system may be considered monogenetic and the exponents in the regression line show that the mean rates of the SDS development are comparable (1.03—Zalasówka vs. 0.97 Bystrzanka)—Figure 2b.
For the SDS operating during heavy rainfall, the mean catchment area drained by the 1st-order stream has reached c.a. 0.01 km2 in both catchments and it is up to several times smaller compared to the river system (0.33 km2—Zalasówka and 0.15 km2—Bystrzanka). Up to the 4th-order stream, the development of the SDS operating during heavy rainfall has been comparable in both catchments, with a lower diversity (quotients range from 4.8 to 5.5) in the Zalasówka than in the Bystrzanka catchment (quotients range from 5 to 5.5)—Table 2. Higher differences have occurred for the highest order stream, especially in the Bystrzanka catchment (Ai5/Ai4 = 9.4). The log-plot (Figure 2c) has shown that the system may be considered monogenetic and the exponents in the regression line has shown that the rates of the SDS development are similar (1.72—Zalasówka vs. 1.76 Bystrzanka)—Figure 2b.

5. Discussion

The surface drainage system determines environment functioning including landscape transformation, water-, bio- and geochemical cycles [3,4,6,8,9,35,36,37,38,39]. Taking into account the role of the surface drainage system for catchment functioning, the core is the knowledge about their parameters.
The literature review indicates that the natural-origin drainage system usually brings the attention of the scientist. The works focus on the characterization of the surface drainage system and its functioning [10,11,12,13,14,15,16,17,18,19,20,21,22,24,27,28,38,39,40]. However, the SDS changes during different hydro-meteorological events, especially during extreme events. So far, investigations focusing on the changes of the SDS operating during extreme rainfall are usually carried out in small (A < 0.1 km2) experimental catchments and had been generally the background for hydrological studies [41,42,43]. In the studies, the lack of focus on SDS alteration in larger catchments resulted from difficulties in SDS reconstruction (the source data were mainly post-event field mapping which is restricted in terms of the area [25]. In the authors’ opinion, investigations of the SDS are important in larger catchments, especially those where flash floods occurred. In the Carpathians the catchments have an area of less than 40 km2 [44,45]. They may contribute to the explanation of the hydrological response of a catchment and support a flood risk management process [44,45,46,47,48]. The ALS-LIDAR data released in recent years have given a new opportunity in this research field. The proposed methodology [27] allows the reconstruction of the SDS operating during heavy rainfall in a small flysch catchment. This, in turn, enables the complex analysis of the SDS. This study is one of the first works where the river drainage systems and the SDS operating during heavy rainfall were compared in two catchments located in two different geographical regions of the West Carpathians. The catchments are comparable in terms of area, shape, geology and soil cover permeability but differ in terms of relief, river drainage system and land cover. The river drainage system is better developed in the Bystrzanka catchment, located in medium-high mountain terrain. This is confirmed by higher drainage density (2.3 Bystrzanka vs. 1.5 km·km−2 Zalasówka) and Hortons’ and Schumms’ [10,12] parameters e.g., maximum stream order (4 in Bystrzanka vs. 3 in Zalasówka) and the number of stream segments in the system (60 vs. 18, respectively). More stream segments in the river system denote that the mean stream length and the mean catchment area drained by i-order streams are lower (those parameters are up to 4 times lower in the Bystrzanka compared to Zalasówka) and the catchment is better drained. In spite of the internal differences (quantified by quotients of i-order streams) in the river drainage system development, the log-plots indicate that the systems are nearly homogeneous, and the exponents in the regression equation indicate that mean rates of the river system development are comparable in both catchments (with a little lower values in the Bystrzanka: NiZ = −1.32 vs. NiB = −1.27; LiZ = 1.02 vs. LiB = 0.97; AiZ = 1.66 vs. AiB = 1.50)—Figure 3.
During extreme hydro-meteorological events, the surface drainage system changes significantly. The changes have been observed in each parameter used in the SDS description. The density of the SDS operating during heavy rainfall increases several times (5–8) and this parameter is comparable in both catchments (12.2 km·km−2 Zalasówka and 11.5 km·km−2 Bystrzanka). Slightly higher values in Zalasówka, which represent an agriculture type of foothills catchment, may arise from land usage (plough furrows reach up to 16% of the SDS structure [27]).
Comparison of the SDS operating during heavy rainfall in both catchments, in light of so-called Hortonian-type analysis, has revealed that the systems seem to be similar in terms of the internal structure, especially up to 4th-order streams, which drain the hillslopes (Figure 2b). This similarity is especially noticeable in the number of streams the mean stream length and mean catchments area drained by i-order streams (Figure 2). For example, the differences in the number of streams (related to i-order) in the river system have been in the range from 3 to 4. During heavy rainfall, the differences have been significantly lower (1.0–1.3). For the mean stream length, these values reached 1.4–3.4 (river system) and 0.8–0.9 (heavy rainfall), whereas for the mean catchment area, they reached 2.3–3.1 (river system) and 0.9–1.0 (heavy rainfall). The similarity in the system operating during heavy rainfall is also confirmed by similar values of the exponents in the equation characterizing the regression line (−1.62 Zalasówka vs. −1.63 Bystrzanka for the stream number; 1.02 Zalasówka vs. 0.95 Bystrzanka for the mean stream length and 1.72 Zalasówka vs. 1.76 Bystrzanka for the mean catchments area)—Figure 3a.
The river density and the rate of the system development (both mean rates characterized by RB, RL and RA ratios and internal differences characterized by quotients between consecutive i-order streams) in the Zalasówka and Bystrzanka catchment are comparable with the river systems developed in other Carpathians catchments [39,40]. At this stage of the investigation, it is difficult to compare the SDS operating during heavy rainfall to other flysch catchments in West Carpathians, due to the lack of this type of analysis. Reconstruction of the SDS is a time-consuming process and requires both field and cameral work, especially at the stage related to DEM optimization [27]. However, these preliminary results are promising and the authors are going to expand the investigations.
Modification in the drainage system operating during heavy rainfall influences geomorphological transformation of the hillslopes and valley bottoms through erosion, transport and deposition processes. This is confirmed by many studies: [4]—review; [6,25]—review; [46,49]. More developed SDS is the cause of intensified linear erosion on the slope; this, in turn, causes fragmentation of the flysch slopes. It was observed i.a. in the Bystrzanka and neighboring catchments after rainfalls in 2010 [37]. In these episodes, many places, where linear erosion occurred and which were associated with episodic streams, developed on natural and man-origin incisions. Rainfall parameters, catchments physiographic parameters and pre-event conditions are the factors which determine the amount of surface runoff and consequently the type and the intensity of geomorphological processes. Those facts are emphasized in the literature many times [44,50,51,52,53,54] and our observations in these two catchments support all those statements.
The geomorphological importance of the streams is predominantly related to their order, land use and land cover—to all the factors that also determine surface resistance to erosion [28]. In the 1st-order streams, where runoff begins and the head channel areas are the smallest, the geomorphological transformation by linear erosion and soil wash of the hill slopes are higher. Those elements of the SDS tend to have a higher influence on the transformation of the flysch catchments, contrary to streams draining grasslands or forests [27]. This observation is confirmed by the research conducted in Bystrzanka. It was revealed that during 30 years of collecting data, the soil wash on arable lands was almost 340 times higher than in grassland and above 95% higher at the potato plots in relation to other crops [53,55].
The most intense geomorphological transformations are associated with those parts of the SDS which use the roads and ditches as channels. The literature states that more developed SDS supplements the delivery of the sediment material to the river channel increases [3,56,57]. Considering the fact that the West Carpathians region is relatively densely populated (The Polish part of Carpathians includes 139 people·km−2 and in rural areas 100 people·km−2) [58] and the agriculture area is strongly fragmented, roads are one of the most important sources of sediment transported in the channel [3,7,56]. According to Froehlich and Walling [3], in the Carpathians, in high-medium mountains (Beskid Sądecki), unpaved roads provide 70%–80% of suspended sediment transported in the stream channel and this may cause road deepening around 6.6 mm per year. The roads also play an important role in the transformation of the hill slopes in the afforested catchment [25,46,57,59].
In the authors’ opinion the changes in the SDS may partially explain higher susceptibility of the catchment to flash flood occurrence [44,45,46], because incorporation of man-origin incisions to the SDS are important factors influencing the hydrological response of the catchment [9,22,36]. Better development of the SDS results in better drained hillslopes because the stormwater moves directly to the 1st-order streams, where the water flow velocity is higher. It is worth noticing that changes in the SDS have caused the mean catchment area drained by 1st-order streams to decrease (from 0.33 km2 Zalasówka and 0.15 km2 Bystrzanka to 0.01 km2—both catchments) but the percentage of catchment area drained by those segments has increased (from 50% to 65% in Zalasówka and from 49% to 61% in Bystrzanka catchment). Taking into account the fact that (1) the water flow velocity in the Carpathian flysch slope ranging from 10° to 17° may exceed 100 cm·s−1 in unpaved roads (but only 8–9 cm·s−1 on grassland fields and 13 cm·s−1 on ploughed fields [49]) and (2) the similar flow velocity that has been recorded on the unpaved roads may be expected within other man-made incisions (e.g., ditches, plough and furrows) which are incorporated into the SDS and contribute up to 35% of the SDS [27,28], the consequence in the hydrological response of a catchment may be significant. These aspects related to the influence of ‘real’ SDS operating during heavy rainfall on flood wave parameters are investigated rarely. The examples are a reconstruction of the flood wave parameters after the rainfall 26/27 June 2009 in the Zalasówka [47] and after two rainfalls events (16/17 May and 7/8 August 2014) in the Bystrzanka catchment [28]. Both use the GIUH hydrological model, where information about changes in the SDS was incorporated by Horton’s and Schumm’s parameters. The results revealed that the hydrological model fits better the hydrograph when the RB, RL and RA parameters are calculated for the ‘real’ SDS, which operated during heavy rainfall [28,36,47]. Changes in the SDS were reflected in Qmax and the modified SDS affects the peak flow predominantly, causing the increase of up to 10.79% in a medium-high mountain (Bystrzanka) catchment and 20% (denser the SDS) for the foothills catchment (Zalasówka).

6. Conclusions

This note presents preliminary results of the research where parameters of the surface drainage system (river and SDS operating during heavy rainfall) in two catchments located in different geographical regions of the flysch Carpathians are compared. The main conclusions may be formed as follow:
(1) In the Bystrzanka catchment located in medium-high mountain areas, the river drainage system is better developed compared to the Zalasówka catchment located in a foothills areas catchment.
(2) During heavy rainfall, the river drainage system changes significantly. Their density increases from 5 (Bystrzanka) to 8 (Zalasówka) times, reaching 11.5 and 12.2 km·km−2, respectively. Moreover, the internal structure of the SDS changes what is reflected in Hortonians’ and Schumms’ parameters. The most significant changes occur in the 1st- and 2nd-order streams which drain the hillslopes. These changes cause the hillslopes and all catchments to be better drained.
(3) The SDS which operate during heavy rainfall seems to be similar in terms of density and Hortons’ and Schumms’ parameters. Results of this study require further evaluation in order to justify regularity; however, this conclusion is especially important for practice because changes in the drainage system influence the type and intensity of hydrological and geomorphological processes determining catchments functioning. Those aspects are going to be investigated by the authors in the future.

Author Contributions

R.K.: conceptualization, writing—original draft preparation, investigation, methodology (GIS analysis), visualization; T.B.: conceptualization, writing—original draft preparation, formal analysis, investigation, methodology (statistical analysis), visualization; J.Ż.: review and editing, formal analysis, supervision. All authors have read and agreed to the published version of the manuscript.

Funding

This paper is the outcome of research project WPBU/2020/05/00031 of the Pedagogical University of Krakow (Poland).

Institutional Review Board Statement

Not applicable.

Informed Consent Statement

Not applicable.

Data Availability Statement

All analysed data in this study has been included in the manuscript.

Conflicts of Interest

The authors declare no conflict of interest. The funders had no role in the design of the study; in the collection, analyses, or interpretation of data; in the writing of the manuscript, or in the decision to publish the results.

References

  1. Hrnčiř, M.; Šanda, M.; Kulasová, A.; Císlerová, M. Runoff formation in a small catchment at hillslope and catchment scales. Hydrol. Processes 2010, 24, 2248–2256. [Google Scholar] [CrossRef]
  2. Biswal, B.; Singh, R. Incorporating channel network information in hydrologic response modelling: Development of a model and inter-model comparison. Adv. Water Resour. 2017, 100, 168–182. [Google Scholar] [CrossRef] [Green Version]
  3. Froehlich, W.; Walling, D.E. The role of unmetalled roads as a sediment source in the fluvial systems of the Polish flysch carpathians, human impacts on erosion and sedimentation. IASH Publ. 1997, 245, 159–169. [Google Scholar]
  4. Łajczak, A.; Margielewski, W.; Rączkowska, Z.; Święchowicz, J. Contemporary geomorphic processes in the Polish Carpathians under changing human impact. Episodes 2014, 37, 21–32. [Google Scholar] [CrossRef] [Green Version]
  5. Zoccatelli, D.; Borga, M.; Chirico, G.B.; Nikolopoulos, E.I. The relative role of hillslope and river network routing in the hydrologic response to spatially variable rainfall fields. J. Hydrol. 2015, 531, 349–359. [Google Scholar] [CrossRef]
  6. Galia, T.; Šilhán, K.; Škarpich, V. The geomorphic impacts of culverts at paved forest roads: Examples from Carpathian headwater channels, Czech Republic. Catena 2017, 157, 424–435. [Google Scholar] [CrossRef]
  7. Kijowska-Strugała, M. Sediment variability in a small catchment of the Polish Western Carpathians during transition from centrally planned to freemarket economics. Geomorphlogy 2019, 325, 119–129. [Google Scholar] [CrossRef]
  8. Siwek, J.P.; Żelazny, M.; Siwek, J.; Szymański, W. Effect of land use, seasonality, and hydrometeorological conditions on the K{+} concentration-discharge relationship during different types of floods in Carpathian Foothills catchments (Poland). Water Air Soil Pollut. 2017, 228, 1–20. [Google Scholar] [CrossRef] [Green Version]
  9. Rodríguez-Iturbe, I.; Muneepeerakul, R.; Bertuzzo, E.; Levin, S.A.; Rinaldo, A. River networks as ecological corridors: A complex systems perspective for integrating hydrologic, geomorphologic, and ecologic dynamics. Water Resour. Res. 2009, 45, 1944–7973. [Google Scholar] [CrossRef]
  10. Horton, R.E. Erosional development of streams and their drainage basins: Hydrophysical approach to the quantitative morphology. Geol. Soc. Am. Bull. 1945, 56, 275–370. [Google Scholar] [CrossRef] [Green Version]
  11. Strahler, A.N. Quantitative analysis of watershed geomorphology. Trans. Am. Geophys. Union. 1957, 63, 913–920. [Google Scholar] [CrossRef] [Green Version]
  12. Schumm, S.A. Evolution of drainage systems and slopes in badlands and Perth Amboy, NJ. Geol. Soc. Am. Bull. 1956, 67, 597–646. [Google Scholar] [CrossRef]
  13. Rodríguez-Iturbe, I.; Escobar, L.A. The dependence of drainage density on climate and geomorphology. Hydrol. Sci. J. 1982, 27, 129–137. [Google Scholar] [CrossRef] [Green Version]
  14. Dietrich, W.E.; Reneau, S.L.; Wilson, C.J. Overview: Zero-order basins and problems of drainage density, sediment transport and hillslope morphology. IASH Publ. 1987, 165, 49–59. [Google Scholar]
  15. Montgomery, D.R.; Dietrich, W.E. Where do channels begin? Nature 1988, 336, 232–234. [Google Scholar] [CrossRef]
  16. Daniel, J.R.K. Drainage density as an index of climatic geomorphology. J. Hydrol. 1981, 50, 147–154. [Google Scholar] [CrossRef]
  17. Wigington, P.J.; Moser, T.J.; Lindeman, D.R. Stream network expansion: A riparian water quality factor. Hydrol. Process. 2005, 19, 1715–1721. [Google Scholar] [CrossRef]
  18. Jensen, C.K.; McGuire, K.J.; McLaughlin, D.L.; Scott, D.T. Quantifying spatiotemporal variation in headwater stream length using flow intermittency sensors. Environ. Monit. Assess. 2019, 191, 4. [Google Scholar] [CrossRef] [PubMed]
  19. Jensen, C.K.; McGuire, K.J.; Prince, P.S. Headwater stream length dynamics across four physiographic provinces of the Appalachian highlands. Hydrol. Process. 2017, 31, 3350–3363. [Google Scholar] [CrossRef] [Green Version]
  20. Ward, J.V.; Tockner, K.; Uehlinger, U.; Malard, F. Understanding natural patterns and processes in river corridors as the basis for effective river restoration. Regul. Rivers-Res. Manag. 2001, 17, 311–323. [Google Scholar] [CrossRef]
  21. Ward, A.; Schmadel, N.M.; Wondzell, S.M. Simulation of dynamic expansion, contraction, and connectivity in a mountain stream network. Adv. Water Res. 2018, 114, 64–82. [Google Scholar] [CrossRef]
  22. Prancevic, J.P.; Kirchner, J.W. Topographic controls on the extension and retraction of flowing streams. Geophys. Res. Lett. 2019, 46, 2084–2092. [Google Scholar] [CrossRef] [Green Version]
  23. Bryndal, T. Parameters of basins where small-scale flooding occurred. Annales UMCS Sec. B 2008, 63, 176–200. [Google Scholar] [CrossRef]
  24. Fac-Beneda, J. Struktura sieci hydrograficznej. In Hydrologia Polski; Jokiel, P., Marszelewski, W., Pociask-Karteczka, J., Eds.; Wydawnictwo Naukowe PWN: Warsaw, Poland, 2016; pp. 116–121. [Google Scholar]
  25. Kroczak, R.; Bryndal, T.; Bucała, A.; Fidelus, J. The development, temporal evolution and environmental influence of an unpaved road network on mountain terrain: An example from the Carpathian Mts. (Poland). Environ. Earth Sci. 2016, 75, 1–14. [Google Scholar] [CrossRef]
  26. Słupik, J. Zastosowanie zdjęć lotniczych o określaniu wpływu bruzd i dróg polnych na strukturę bilansu wodnego stoków górskich [Aerial photography used to assess the influence of ditches and field paths on the structure of the water balance of mountain slopes]. Fotointerpret. W Geogr. 1976, 11, 31–38, (In Polish with English summary). [Google Scholar]
  27. Bryndal, T.; Kroczak, R. Reconstruction and characterization of the surface drainage system functioning during extreme rainfall: The analysis with use of the ALS-LIDAR data-the case study in two small flysch catchments (Outer Carpathian, Poland). Environ. Earth Sci. 2019, 78, 1–16. [Google Scholar] [CrossRef] [Green Version]
  28. Bryndal, T.; Kroczak, R.; Kijowska-Strugała, M.; Bochenek, W. How human interference changes the drainage network operating during heavy rainfalls in a medium-high relief flysch mountain catchment? The case study of the Bystrzanka catchment (Outer Carpathians, Poland). Catena 2020, 194, 104662. [Google Scholar] [CrossRef]
  29. Kroczak, R.; Fidelus-Orzechowska, J.; Bucała-Hrabia, A.; Bryndal, T. Land use and land cover changes in small Carpathian catchments between the mid-19th and early 21st centuries and their record on the land surface. J. Mt. Sci. 2018, 15, 2561–2578. [Google Scholar] [CrossRef]
  30. Kroczak, R.; Bryndal, T. Use of the digital terrain models for generation of surface drainage network, functioning during heavy rainfall. Methodological aspects, based on the Zalasówka catchment (Ciężkowickie Foothills). Przegląd Geogr. 2017, 89, 5–24. (In Polish) [Google Scholar]
  31. Marciniec, P.; Zimnal, Z. Szczegółowa Mapa Geologiczna Polski [Detailed Geological Map of Poland]. Arkusz/Sheet Tuchów, 1:50,000; Państwowy Instytut Geologiczny–Państwowy Instytut Badawcz: Warsaw, Poland, 2016. [Google Scholar]
  32. Kopcikowski, R.; Zimnal, Z.; Chrząstkowski, J.; Jankowski, L.; Szymakowska, F. Szczegółowa Mapa Geologiczna Polski [Detailed Geological Map of Poland]. Arkusz/Sheet Gorlice, 1:50,000; Państwowy Instytut Geologiczny-Państwowy Instytut Badawczy: Warszawa, Poland, 1997. [Google Scholar]
  33. Adamczyk, B.; Maciaszek, W.; Januszek, K. Gleby gromady Szymbark i jej wartość użytkowa. In Gleby i Zbiorowiska Leśne Okolic Szymbarku [The Soils of Village Group Szymbark and Their Utility Value]; Starkel, L., Ed.; Dokumentacja Geograficzna, no. 1; Instytut Geografii i Przestrzennego Zagospodarowania PAN: Warsaw, Poland, 1973; pp. 16–66, (In Polish with English summary). [Google Scholar]
  34. Pazdro, Z.; Kozerski, B. Hydrogeologia ogólna; Wydawnictwa Geologiczne: Warsaw, Poland, 1990; 623p. (In Polish) [Google Scholar]
  35. Kroczak, R. Geomorfologiczne i Hydrologiczne Skutki Funkcjonowania Dróg Polnych na Pogórzu Ciężkowickim [Geomorphological and Hydrological Effects of Unmetalled Road Network Functioning on the Example of Ciężkowickie Foothills]; Prace Geograficzne, Instytut Geografii i Przestrzennego Zagospodarowania PAN: Warsaw, Poland, 2010; Volume 225, p. 138, (In Polish with English summary). [Google Scholar]
  36. Nowicka, B. Adaptacja praw Hortona i Schumma do potrzeb modelowania odpływu powierzchniowego metodą geomorfologicznego chwilowego hydrogramu jednostkowego [Adaptation of the Horton and Schumm laws for modeling the overland flow by the geomorphologic instantaneous unit hydrograph method]. Pr. I Studia Geogr. 1992, 12, 157–175, (In Polish with English summary). [Google Scholar]
  37. Kijowska-Strugała, M.; Wiejaczka, Ł.; Gil, E.; Bochenek, W.; Kiszka, K. The impact of extreme hydro-meteorological events on the transformation of mountain river channels (Polish Flysch Carpathians). Z. Geomorphol. 2017, 61, 75–89. [Google Scholar] [CrossRef]
  38. Morisawa, M.E. Quantitative geomorphology of some watersheds in the Appalachian Plateau. Geol. Soc. Am. Bull. 1962, 73, 1025–1046. [Google Scholar] [CrossRef]
  39. Bajkiewicz-Grabowska, E. Systemy rzeczne i stopień ich uporządkowania. Przegląd Geofiz. 1987, 32, 303–318. (In Polish) [Google Scholar]
  40. Bryndal, T. The river systems in small catchments in the context of the Horton’s and Schumm’s laws—Implication for hydrological modelling. The case study of the Polish Carpathians. Quaest. Geogr. 2015, 34, 85–98. [Google Scholar] [CrossRef] [Green Version]
  41. Loaugue, K.; Vanderkwaak, J.E. Simulating hydrologic response for the R-5 catchment: Comparison of two models and the impact of the roads. Hydrol. Process. 2002, 16, 1015–1032. [Google Scholar] [CrossRef]
  42. Hallema, D.W.; Moussa, R. A model for distributed GIUH-based flow routing on natural and anthropogenic hillslopes. Hydrol. Process. 2014, 28, 4877–4895. [Google Scholar] [CrossRef]
  43. Wemple, B.C.; Clark, G.E.; Ross, D.S.; Rizzo, D.M. Identifying the spatial pattern and importance of hydro-geomorphic drainage impairments on unpaved roads in the northeastern USA. Earth Surf. Processes Landf. 2017, 42, 1652–1665. [Google Scholar] [CrossRef]
  44. Bryndal, T. A method for identification of small Carpathian catchments more prone to flash flood generation. Based on the example of south-eastern part of the Polish Carpathians. Carpathian. J. Earth Environ. Sci. 2014, 9, 109–122. [Google Scholar]
  45. Bryndal, T. Identyfikacja Małych Zlewni Podatnych na Formowanie Gwałtownych Wezbrań w Karpatach Polskich [Identification of small catchments prone to flash flood generation in the Polish Carpathians]; Prace Monograficzne Uniwersytetu Pedagogicznego, Wydawnictwo Naukowe UP: Kraków, Poland, 2014; Volume 690, p. 180, (In Polish with English summary). [Google Scholar]
  46. Bryndal, T.; Franczak, P.; Kroczak, R.; Cabaj, W.; Kołodziej, A. The impact of extreme rainfall and flash floods on the flood risk management process and geomorphological changes in small Carpathian catchments: A case study of the Kasiniczanka river (Outer Carpathians, Poland). Nat. Hazards 2017, 88, 95–120. [Google Scholar] [CrossRef]
  47. Kroczak, R.; Bryndal, T. An attempt to assess the influence of road network on flash flood wave parameters. The case study of the Carpathian Foothills. In Geomorphometry for Geosciences; Jasiewicz, Z., Zwoliński, Z., Mitasova, H., Hengl, T., Eds.; Adam Mickiewicz University in Poznań—Institute of Geoecology and Geoinformation, International Society for Geomorphometry: Poznań, Poland, 2015; pp. 197–200. [Google Scholar]
  48. Ostrowski, J.; Czarnecka, H.; Głowacka, B.; Krupa-Marchlewska, J.; Zaniewska, M.; Sasim, M.; Moskwiński, T.; Dobrowolski, A. Nagłe powodzie lokalne (flash flood) w Polsce i skala ich zagrożeń. In Wpływ Zmian Klimatu na Środowisko, Gospodarkę i Społeczeństwo, Tom 3; Lorenc, H., Ed.; Klęski Żywiołowe a Bezpieczeństwo Wewnętrzne Kraju; IMGW-PIB: Warszawa, Poland, 2012; pp. 7–32. (In Polish) [Google Scholar]
  49. Figuła, K. Wstępna charakterystyka zjawisk erozji na terenie kilku powiatów województwa krakowskiego [Preliminary assessment of erosion on the several districts of the Krakowskie province]. Rocz. Nauk. Rol. 1955, 1, 111–148. (In Polish) [Google Scholar]
  50. Słupik, J. Zróżnicowanie spływu powierzchniowego na fliszowych stokach górskich [Differentiation of the surface run-off on flysch mountain slopes]. Dok. Geogr. 1973, 2, 1–118, (In Polish with English summary). [Google Scholar]
  51. Starkel, L. Geomorphic role of extreme rainfalls in the Polish Carpathians. Studia Geomorphol. Carpatho-Balc. 1996, 30, 21–38. [Google Scholar]
  52. Gil, E. Spływ wody i procesy geomorfologiczne w zlewniach fliszowych podczas gwałtownej ulewy w Szymbarku w dniu 7 czerwca 1985 roku [Runoff and geomorphic processes in the flysch catchments during heavy downpours in Szymbark on 7 june 1985]. Dok. Geogr. 1998, 11, 85–107, (In Polish with English summary). [Google Scholar]
  53. Gil, E. Ekstremalne wartości spłukiwania gleby na stokach użytkowanych rolniczo w Karpatach Fliszowych. In Zintegrowany Monitoring Środowiska Przyrodniczego, Funkcjonowanie środowiska przyrodniczego w okresie przemian gospodarczych w Polsce; Bochenek, W., Kijowska, M., Eds.; Biblioteka Monitoringu Środowiska: Szymbark, Poland, 2009; pp. 191–218. (In Polish) [Google Scholar]
  54. Bochenek, W.; Gil, E. Zróżnicowanie spływu powierzchniowego i spłukiwania gleby na poletkach doświadczalnych o różnej długości (Szymbark, Beskid Niski) [The diversity of overland flow and soil wash on experimental plots of different lengths (Szymbark, Low Beskidy Mts.)]. Pr. I Studia Geogr. 2010, 45, 265–278, (In Polish with English summary). [Google Scholar]
  55. Gil, E.; Kijowska-Strugała, M.; Demczuk, P. Soil erosion dynamics on a cultivated slope in the Western Polish Carpathians based on over 30 years of plot studies. Catena 2021, 207, 105682. [Google Scholar] [CrossRef]
  56. Froehlich, W.; Słupik, J. Rola dróg w kształtowaniu spływu i erozji w karpackich zlewniach fliszowych [The role of road in flow and erosion formation in the flysch Carpathian basins]. Przegląd Geogr. 1986, 58, 67–85, (In Polish with English summary). [Google Scholar]
  57. Luce, C.H.; Wemple, B.C. Introduction to special issue on hydrologic and geomorphic effects of forest roads. Earth Surf. Process. Landf. 2001, 26, 111–113. [Google Scholar] [CrossRef]
  58. Bucała-Hrabia, A.; Kijowska-Strugała, M.; Śleszyński, P.; Rączkowska, Z.; Izdebski, W.; Malinowski, Z. Evaluating the use of the landslide database in spatial planning in mountain communes (the Polish Carpathians). Land Use Policy 2022, 112, 105842. [Google Scholar] [CrossRef]
  59. Elliot, W.J.; Page-Dumroese, D.; Robichaud, P.R. The effects of forest management on erosion and soil productivity. In Proceedings of the Symposium on Soil Quality and Erosion Interaction, Keystone, CO, USA, 7 July 1996; Soil and Water Conservation Society: Ankeney, IA, USA, 1996. [Google Scholar]
Figure 1. Localization and hypsography of Zalasówka and Bystrzanka catchments—(a), slope gradient—(b), and land cover—(c). Source: Authors’ elaboration based on DEM, Hydrographic Map of Poland (MPHP10) and ortophoto maps.
Water 14 00482 g001
Figure 2. River drainage system (a) and the surface drainage system operating during heavy rainfall (b) in the catchment located on the foothills (Zalasówka) and medium-high mountain areas (Bystrzanka) in context of Hortonian-type analysis. Topology according to Strahler [11]. Source: Authors’ elaboration based on [27,28].
Water 14 00482 g002
Figure 3. Surface drainage system development in the Zalasówka (1) and Bystrzanka (2) catchments. Ni—number of streams—(A), Li—mean stream length—(B), Ai—mean catchments area drained by i-order stream—(C). Source: Authors’ elaboration based on [27,28].
Water 14 00482 g003
Table 1. The head channel areas contributing to the streams development.
ModelType of the Land CoverThe Head Channel Area (ha)
IArable lands0.29
IIForests0.88
IIIGrasslands, orchards and gardens0.45
IVPaved roads and build-up areas0.11
Source: Authors’ elaboration based on [27,28].
Table 2. Statistics of the river drainage systems (RDS) and surface drainage system operating during heavy rainfall (HRDS).
Stream
Order
Number of Streams
(n)
Total Stream
Length
(km)
Mean Stream Length
(km)
Stream Density
(km·km−2) *
Mean Catchment
Area
(km2)
RDSHRDSRDSHRDSRDSHRDSRDSHRDSRDSHRDS
Zalasówka catchment
1146936.5867.150.470.11.4211.130.330.01
231553.7822.171.260.231.3315.572.490.05
31373.6613.123.660.592.1311.509.200.23
4-7-4.57-1.24-12.53-1.28
5-1-6.09-7.33-18.98-9.20
AverageRB = 3.8RB = 5.2--RL = 2.8RL = 3.21.5 **12.2 **RA = 5.6RA = 5.7
Sum--14.0113.1------
Bystrzanka catchment
14474714.7287.20.330,122.3110.150.01
2121855.1029.140.430,163.814.70.650.05
33473.2519.181.080,412.810.82.980.25
4196.206.316.200,71.59.513.001.37
5 1 6.9 6,9 11.2 12.94
AverageRB = 3.6RB = 5.6--RL = 3.2RL = 3.92.3 **11.5 **RA = 4.5RA = 6.2
Sum--29.27148.7 --
RB, RL, RA—the bifurcation ratio, the mean length ratio, the mean area ratio, *—calculated in relation to sub-catchment area drained exclusively by i-order stream, **—calculated for all catchment area. Source: Authors’ elaboration based on [27,28].
Publisher’s Note: MDPI stays neutral with regard to jurisdictional claims in published maps and institutional affiliations.

