Abstract
Analysis of spatiotemporal heterogeneity and evolutionary characteristics of agricultural land eco-efficiency is of great significance for achieving a rational use of natural resources and coordinated development of the agricultural economy as well as the ecological environment. In this study, we construct the “ecological space–agricultural production–carbon emission” framework, incorporate carbon emission intensity as an undesired output into the evaluation index system of agricultural land eco-efficiency, calculate the eco-efficiency of agricultural land in 128 cities in the Yangtze River basin from 2009 to 2018 by adopting the super-efficiency SBM model, and discuss the spatial and temporal changes using methodology such as hotspot analysis and kernel density estimation by ArcGIS. The results show the following. The overall trend of agricultural land eco-efficiency in the Yangtze River basin is increasing year by year and still has potential for improvement. However, there are significant discrepancies among cities, with the eco-efficiency of the downstream being much higher than that of the midstream and upstream regions, and demonstrating the pattern of “big dispersion–small agglomeration”. Some cities are still facing pressure to improve the eco-efficiency of agricultural land. Correspondingly, this paper puts forward optimization recommendations: Firstly, the downstream cities should give full play to their geographical advantages, actively introduce advanced production technologies, and reasonably allocate agricultural resources. Secondly, the upstream and midstream regions should formulate reasonable regional strategies in accordance with their natural resource endowments to improve the ecological benefits of agricultural land and narrow the regional disparities. This paper gives targeted policy recommendations at the levels of paying attention to education of farmers, providing incentives for ecological planting, strengthening agricultural infrastructure construction, reasonably controlling the use of agricultural materials, and increasing investment in agricultural pollutant emission management.
1. Introduction
The rational use of land resources relying solely on agricultural land efficiency indicators that characterize the output capacity per unit area of land can no longer meet the requirements of environmental sustainability, which is a matter of public concern today [1,2]. In agricultural production activities, people harvest agricultural resource outputs. However, agriculture is an unignorable and important source of greenhouse gas emissions, which means that they are also suffering from ecological pressures, such as global warming, caused by agricultural land use [3]. Following this logic, agricultural land is the major input element of China’s agricultural production activities [4], and its eco-efficiency is not only related to China’s agricultural economy and food security, but also closely related to national ecological security.
Eco-efficiency promotes the ecological development paradigm of sustainable utilization, which is an essential indicator for evaluating high-quality development. Scholars have also discussed this key topic from various research scales, such as enterprises or industries, yet research on the eco-efficiency of agricultural land needs to be enriched and improved, especially in the Yangtze River basin, where agricultural ecological conservation and high-quality development have been elevated to the level of national strategy. According to the extant literature, research on agricultural land eco-efficiency has focused on the following aspects. (1) In terms of efficiency measurement, decision units that analyze multiple inputs and outputs are widely employed by data envelopment analysis (DEA) and slacks-based measurement (SBM) [5], but traditional DEA does not consider the influence of slack variables, resulting in errors in the measurement results, and traditional SBM has the defect of not being able to calculate the efficiency values of all decision units. (2) In terms of influential factors, scholars have focused on the influence of external factors on the agricultural land eco-efficiency, such as urbanization [6], while few studies have conducted an in-depth analysis of agricultural land eco-efficiency from the perspective of agricultural land input and output factors. (3) In terms of research scales, studies have mostly evaluated and analyzed from the perspectives of national scale or individual provinces, etc., resulting in insufficient research on policy implications related to regional development strategies [7,8].
The contribution of this study can be divided into the following four aspects. Firstly, we attach importance to the role of regional ecological resource background in agricultural production and construct the system of “ecological space–agricultural production–carbon emission”. Secondly, this paper emphasizes the role of government management as an input indicator in agricultural production, and incorporates agricultural carbon sources caused by the massive application of agricultural machinery and equipment, fertilizers, pesticides, agricultural films, and other agricultural materials into the eco-efficiency measurement system as an indicator of negative environmental effects to scientifically and accurately evaluate eco-efficiency. Thirdly, this paper tightly grasps the essential characteristics of agricultural land eco-efficiency, and proposes targeted improvement measures for improving basin agricultural land eco-efficiency from the evaluation and measurement system; Fourthly, we used data from prefecture-level cities instead of provincial-level data from previous studies, to explore regional agricultural production conditions in more detail and depth.
Based on a spatiotemporal perspective, this study constructs a super-efficient SBM model with an undesired output to comprehensively and intuitively explore the inner mechanism of “ecological space–agricultural production–carbon emission”, with 128 prefecture-level cities in the Yangtze River basin as evaluation objects from 2009–2018. On the one hand, this paper can enrich the quantitative study of agricultural land eco-efficiency and contribute to the construction of regional ecological civilization, and on the other hand, it also provides evidence for the study of eco-efficiency of other industries from the perspective of index selection and overall conceptualization. The remainder of this paper is organized as follows. Section 2 describes our study area and data sources. The research framework and methods are provided in Section 3. Section 4 gives a detailed analysis of our results. We summarize the findings and provide some practical guidelines in Section 5. Furthermore, Section 6 discusses the limitations of the article and proposes future research proposals. To achieve a win–win situation for both agricultural economy and ecological environment, the high-quality development of agriculture should receive more attention. This paper incorporates agricultural carbon emissions as an indicator affecting the agricultural production environment in the study of agricultural land resource efficiency to help measure the eco-efficiency of agricultural land in a rational way, which is of great practical significance in promoting the low-carbon transformation of basin agriculture and achieving China’s carbon-reduction commitment.
2. Regional and Research Data
2.1. Study Area
The Yangtze River basin is the main production area for agricultural products in China, with an agricultural output that accounts for about 40% of the national output, and occupies a significant position in the spatial pattern of agricultural development in China [9]. The Yangtze River basin spans the central part of China from west to east. The upstream region contains Chongqing, Sichuan, Guizhou, and Yunnan; the midstream region includes Hubei, Jiangxi, and Hunan; and the downstream region contains Shanghai, Jiangsu, Zhejiang, and Anhui [10]. There are six plains sites in the region, including Chengdu, Jianghan, Dongting Lake, Poyang Lake, Jianghuai, and Taihu Lake, which are rich in agricultural resources such as water resources and cultivated land. In recent years, the agricultural production model of the Yangtze River basin has had difficulty meeting the need for regional high-quality agricultural development, and the increasing deterioration of the agricultural production environment is constantly eroding the comprehensive benefits of agriculture [11,12]. In light of this, this paper takes 128 cities in the Yangtze River basin as examples to quantitatively measure the eco-efficiency of agricultural land and reveal its spatial and temporal differences, so as to provide a theoretical basis and decision reference for policy formulation related to agricultural land use in the Yangtze River basin. The spatial distribution of the Yangtze River basin, based on DEM, is shown in Figure 1.
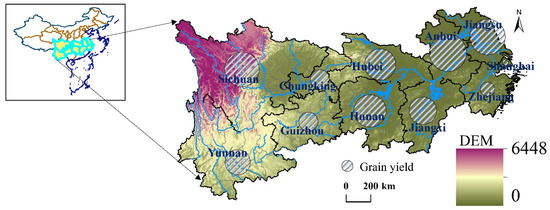
Figure 1.
Spatial distribution characteristics of DEM in the Yangtze River basin. Notes: Grain yield refers to the total amount of grain produced in the calendar year of agricultural producers and operators. Grain yield is categorized by harvest season, including summer harvest, early rice, and autumn harvest; and by crop variety, including cereals, potatoes, and legumes.
2.2. Data and Preprocessing
The basic geographic data of this study, including administrative boundaries, administrative units, etc., is obtained from the National Geomatics Center of China (http://www.ngcc.cn/ngcc/, accessed on 5 July 2021). The social and economic data, i.e., grain acreage, grain yield, primary industry population, fiscal expenditure on agriculture, forestry and water, farmers’ disposable income, road network density, agricultural machinery power, chemical fertilizer application, and agricultural electricity, comes from the Annual Statistical Yearbook of the Yangtze River basin during 2009 to 2018, the Statistical Bulletin of National Economic and Social Development, and the policy documents issued by the regional government. The remote-sensing data, including the ecological soil conservation values, normalized difference vegetation index (NDVI) and DEM raster data, is derived from the Resource and Environmental Science and Data Center of the Chinese Academy of Sciences (https://www.resdc.cn/, accessed on 10 October 2021). To reduce statistical errors caused by inconsistent size of raster pixels, the spatial resolution of the above raster data is resampled to 1 km. We then partition the resampled raster data and calculate the average value of each prefecture-level city.
3. Theoretical Framework
3.1. Theoretical Framework of “Ecological Space–Agricultural Production–Carbon Emission”
Against the background of the greenhouse effect, how to quantify the impact of the resource base of agricultural land on agricultural production? Referring to the human-activity–geographical–environmental regional system [13], this paper extends that the factors that affect the agricultural land eco-efficiency are rooted in the interrelated and feedback processes of the various factors that constitute the system, and that the interaction of various factors in different dimensions and levels forms the hierarchical structure of the key factors of agricultural land efficiency. Among all the links, agricultural land eco-efficiency plays a central role, accompanying agricultural development, agricultural land use, and low-carbon agricultural development, and can directly interact with ecological space, agricultural production, and carbon emission. Moreover, the relationships among ecological space, agricultural production, and agricultural carbon emission are interconnected and influence each other in both directions, i.e., ecological space–agricultural production, ecological space–carbon emission, and agricultural production–carbon emission. The positive interaction of resource–economy–environment development presents the process of “strengthening–restriction–promotion”, and its reverse interaction shows the process of “weakening–promoting–consuming”. As can be seen, there is also an interaction level and a dual relationship between each factor and every other factor in an internal city. The interaction of different factors and the dual relationship between them are the main factors that affect the agricultural land eco-efficiency.
It is a meaningful breakthrough in this paper to measure the ecological efficiency of farmland by linking the relationship among ecological space, agricultural production, and carbon emission. Therefore, this study attempts to construct a conceptual framework diagram as shown in Figure 2 based on “ecological space–agricultural production–carbon emission”, and explore a more beneficial way to achieve the sustainable and balanced development of regional agriculture.
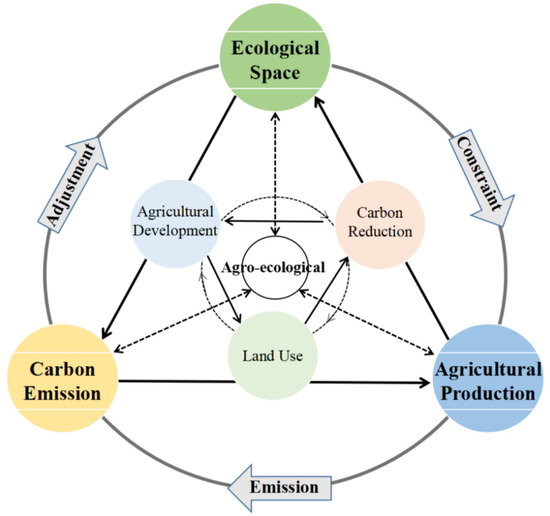
Figure 2.
Theoretical framework of “ecological space–agricultural production–carbon emission”.
3.2. Establishment of Evaluation System
Based on the basic implication of sustainable development, the construction of agricultural ecological resource efficiency index system should comprehensively consider the coordinated development of land resources, ecological environment, and economic growth [14]. In this paper, with reference to the findings of existing research and the availability of data [15,16,17], we select the following input, desired output, and undesired output variables and explain them in detail—please refer to Figure 3.
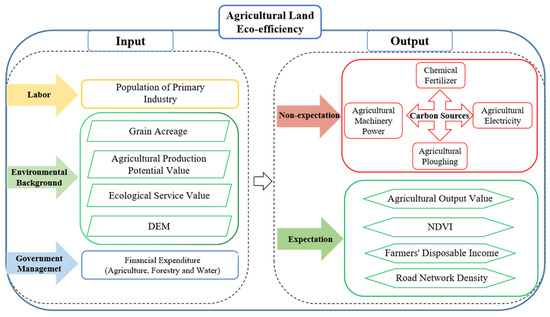
Figure 3.
Calculation scheme of agricultural land eco-efficiency.
(1) The selection of input indicators is mainly based on three dimensions: direct input in agricultural production, natural background, and government management in the 128 prefecture-level cities of the Yangtze River basin. Among them, direct agricultural inputs are denoted by the number of employees in the primary sector. The natural background includes agricultural land inputs characterized by: total crop sown area; agricultural land production potential of the region estimated by the Global Agro-Ecological Zone (GAEZ) model [18]; soil ecological conservation values obtained by mask extraction; projection and zoning statistics based on spatial distribution data of national net primary productivity (NPP), precipitation, and soil conservation; and DEM that reflects the slope, slope surface, and intercell relationships of regional grid cells. Government management indicators refer to the fiscal expenditures invested by local governments in agriculture, forestry, and water conservation for the purpose of supporting local agricultural development.
(2) The output indicators in this paper are selected from four dimensions: economy, ecological environment, population well-being, and social development, which are more associated with equilibrium and rationality than in previous studies, to explore the impact of farmland use on the region [19,20]. Concretely, the agricultural economy in each region is characterized by the added value of the primary industry. The ecological environment of the region is represented by NDVI as a proxy, which reflects the degree of plant coverage in the region. The disposable income of farmers can be used to represent the well-being of the regional farming households brought by agricultural production. The density of road networks, which reflects the supporting capacity of regional development as well as traffic supply capacity, is the embodiment of social development [21].
(3) Undesired output, in our paper, refers to agricultural carbon emission. Based on the methods in relevant research, combined with the availability of data, we take chemical fertilizer, agricultural electricity, agricultural machinery, and agricultural ploughing as the main carbon sources of agricultural carbon emission in the Yangtze River basin, and use the estimated data of those carbon sources multiplied by the corresponding carbon emission coefficient. The agricultural carbon emission is obtained by summing up [22].
3.3. Research Methods
3.3.1. Calculation of Agricultural Carbon Emission
Carbon emission from agricultural sources selected in this paper include chemical fertilizers, agricultural electricity, agricultural machinery, and agricultural ploughing, with reference to the existing research results at home and abroad, and their carbon emission coefficients are 0.8956 kg·kg−1 [23], 0.785 kg·kwh−1 [24], 0.18 kg·kw−1 [25], and 312.6 kg·hm−2 [26], respectively. Agricultural carbon emission intensity is the ratio of total agricultural carbon emission to the total area of cultivated land. In view of the fact that agricultural carbon emission intensity can more intuitively and truly reflect the regional situation, this study takes agricultural carbon emission intensity as an undesired output. In this paper, the result is added up using the multiplication of various types of carbon sources and their corresponding carbon emission coefficients to measure agricultural carbon emissions, which is calculated by [27]:
where CE is the total agricultural carbon emission, Cit is the agricultural carbon emission of category I carbon source in year t, Tit is the amount of category i carbon source in year t, and i represent the carbon emission coefficients for category i carbon source (i.e., chemical fertilizer, agricultural electricity, agricultural machinery power, and agricultural ploughing) [28].
As the progress of agricultural technology is accompanied by the growth of the agricultural economy, it is of more practical significance to consider the intensity of agricultural carbon emission per unit of agricultural output [29]. Therefore, the formula for calculating the agricultural carbon emission intensity is as follows:
where ACEIit is the agricultural carbon emission intensity of the i city in year t, CEit is the total agricultural carbon emission, and GDPit is the total output value of the primary industry with the same price as in year t.
3.3.2. Super-Efficiency SBM Model
This paper measures the spatiotemporal heterogeneity of agricultural land eco-efficiency in the Yangtze River basin by the SBM directed distance function that includes undesired outputs, which is given by:
where N, M, and I represent the number of factors influencing inputs, desired outputs and undesired outputs, respectively. Also, , and correspondingly represent the slack variables [30,31,32], denotes the decision unit, and is the weight vector. The symbol ρ* represents the eco-efficiency value of the agricultural land and takes values from 0 to 1. When ρ* = 1 (i.e., = = = 0), it indicates that the decision unit is fully efficient, while ρ* < 1 indicates losses in eco-efficiency, which implies that there is room for optimizing the structure of inputs and outputs on the agricultural land [33,34].
Based on the above research we use the Malmquist–Luenberger index (ML), which contains undesired outputs, as an in-depth analysis of the spatial and temporal heterogeneity of the agricultural land eco-efficiency. ML is composed by technical progress (TC) and technical efficiency (EC), where EC can be further decomposed into pure technical efficiency (PE) and scale efficiency (SE) with the following equation [35]:
where ML is the index of change in eco-efficiency; Dt(xt, yt, bt) shows the distance function from the production point to the production frontier surface in the corresponding period. The TC index depends on autonomous innovation or the introduction of advanced technology. The EC index is influenced by the efficiency of resource allocation, such as policy reforms [36,37]. For a municipality, ML, TC, and EC respectively larger than 1 signify an improvement in the eco-efficiency of agricultural land, technological progress, and efficiency; otherwise, a decrease.
3.3.3. Kernel-Density Estimation Analysis
This paper adopts the kernel-density estimation method to estimate and fit the kernel-density curve for the agricultural land eco-efficiency in the Yangtze River basin, and reveals the dynamic evolution characteristics of the agricultural land eco-efficiency in the Yangtze River basin by analyzing the changes in the distribution pattern, kurtosis, and location of the curve [38]. The kernel-density estimation equation is as follows.
where n represents the number of observed samples, and the magnitude of the bandwidth h value affects the smoothness of the kernel-density curve distribution. The kernel function K(x) has various types, including Gaussian kernel, linear kernel, polynomial kernel and sigmoid kernel. In this paper, the Gaussian kernel function is used because it has good resistance to data noise and is widely used. According to the bandwidth method set by Silverman, the bandwidth was set to 1 h, which is expressed in the form of h = 0.9SeN−1/5, where Se is the standard deviation of the observed values of random variables [39].
3.3.4. Hotspot Analysis
Hotspot analysis uses the z-value of the Getis-Ord Gi statistic (the higher the z-value, the redder the color, indicating that the attribute is a spatial hotspot; the lower the z-value, the bluer the color, indicating that the attribute is a spatial coldspot) to identify the aggregation effect of high and low values of spatial location, i.e., to explore the spatial distribution characteristics of hotspot and coldspot areas of agricultural land eco-efficiency in the Yangtze River basin [40,41,42]. Compared to the global Moran’I statistic, the hotspot analysis method can correctly reveal spatial independence.
4. Research Results
4.1. Carbon Emission from Agricultural Production
As shown in Figure 4a, the total agricultural carbon emissions in the Yangtze River basin increased from 245 million tons of CO2 in 2009 to 321 million tons of CO2 in 2018, with an increase of 31.17%. Specifically, the annual growth rates from 2009 to 2013 and from 2013 to 2018 were 20.42% and 8.93%, respectively. This indicates that though the total agricultural carbon emissions in the Yangtze River basin are generally increasing, their growth rate is slowing down. As shown in Figure 4b, from 2009 to 2018, the agricultural carbon emission intensity in the Yangtze River basin decreased from 167 t CO2/million to 124 t CO2/million, with a decrease of 25.89%. The decrease in agricultural carbon emission intensity can be seen as an increase in agricultural carbon emission efficiency. Among them, the annual decline rates from 2009 to 2013 and from 2013 to 2018 were 30.73% and 4.03%, respectively.
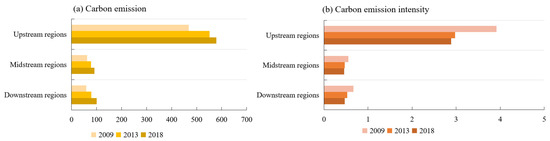
Figure 4.
Agricultural carbon emission and carbon emission intensity in different regions.
In addition, the total carbon emissions and the carbon emission intensity in the Yangtze River basin vary greatly. The river basin with the largest carbon emission is near the upstream cities (Figure 4a); simultaneously, the cities in this basin have the largest decrease in carbon emission intensity of 26.35% (Figure 4b). This could be attributed to the rapid development of the agricultural economy but backward agricultural production technology in these provinces, which failed to realize the effective development of low-carbon agriculture [43,44,45,46].
4.2. Spatiotemporal Deductive Characteristics of Agricultural Land Eco-Efficiency
The super-efficiency SBM model was selected, the input–output data including undesired output were analyzed by using MaxDEA, and the eco-efficiency of agricultural land of the Yangtze River basin from 2009 to 2018 was calculated as shown in Figure 5, Figure 6 and Figure 7.
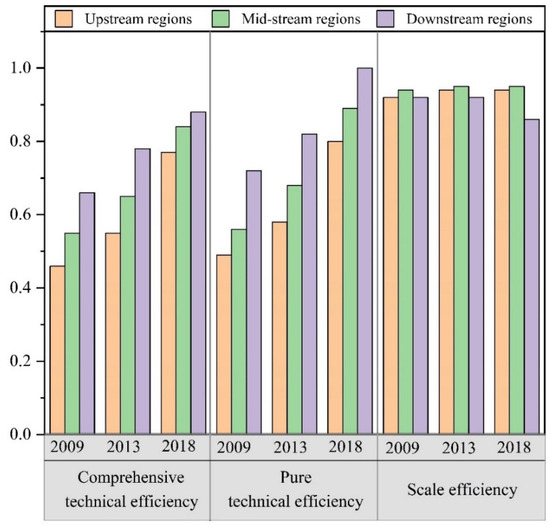
Figure 5.
Eco-efficiency of agricultural land in different regions.
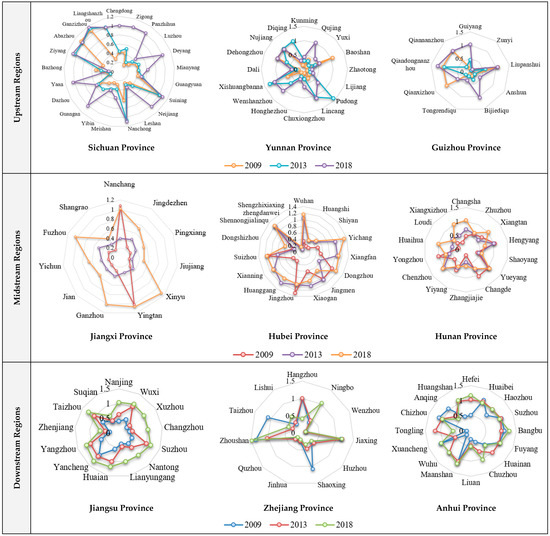
Figure 6.
Eco-efficiency of agricultural land in each province.
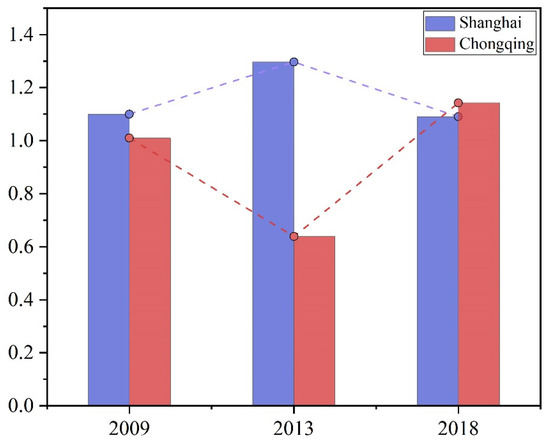
Figure 7.
Comparison of agricultural land eco-efficiency between Shanghai and Chongqing.
Figure 5 illustrates the temporal trends of comprehensive technical efficiency, pure technical efficiency, and scale efficiency of agricultural production in each region of the Yangtze River basin. Overall, the agricultural land eco-efficiency of the 11 provinces (cities) in the Yangtze River basin showed a fluctuating upward trend from 2009 to 2018, and the average carbon emission performance in each year is basically more than 0.5, which shows that great achievements have been made in the development of economic and agricultural production in the Yangtze River basin. However, there is still much room for improvement. From the perspective of timescale, the improvement of agricultural land efficiency in the Yangtze River basin is most obvious from 2013 to 2018, reaching a peak of 0.83 in 2018. This could indicate that the governments of the prefecture-level cities in the Yangtze River basin attach importance to modern agricultural production and are determined to save energy and reduce emissions, through a series of measures to significantly improve the eco-efficiency of agricultural land. From the spatial scale, the downstream cities are in the leading position with higher agricultural land eco-efficiency. This may be attributed to the superior geographical location, higher level of economic development, and stronger environmental awareness of the downstream basin cities, which have improved the efficiency of agricultural resource use through the introduction of advanced technologies. However, the cities in the midstream and upstream basins are under great pressure to maintain the coordinated regional development of low-carbon agriculture, despite the abundant natural resources [47,48].
By further decomposing the comprehensive efficiency of the system, the results show that the average pure technical efficiency and scale efficiency of agricultural production in the Yangtze River basin are 0.89 and 0.91, respectively. The pure technical efficiency still has greater potential for improvement compared to the scale efficiency, which implies that the continuous promotion of agricultural technological progress is an overwhelmingly significant pathway to improve the eco-efficiency of agricultural production [49].
Figure 6 illustrates the agricultural land eco-efficiency of cities in nine provinces located in the upstream, midstream, and downstream of the Yangtze River. On the temporal scale, the eco-efficiency of agricultural land in most cities in the Yangtze River basin is increasing, but in some cities it still has a decreasing trend, mainly concentrated in the midstream and upstream regions, which may be due to the fact that these regions still rely on the crude agricultural production model in exchange for agricultural economic development, and in addition, the large number of laborers moving to cities for employment also directly leads to the decrease of agricultural land utilization efficiency. On the spatial scale, the urban areas with the highest eco-efficiency of agricultural land are mainly distributed in Zhejiang and Jiangsu, while the low eco-efficiency of agricultural land is mainly distributed in Guizhou, Yunnan, and other cities. In each city area of the Yangtze River basin, the highest value of agricultural land efficiency is Zhoushan City, which reaches 1.48; the lowest value of agricultural land efficiency is Zunyi City, which is only 0.176. The difference of agricultural land efficiency between the two cities is 1.3. The imbalance of agricultural production development between cities is prominent. Combined with the evaluation system in this paper, such a phenomenon may be attributed to upstream cities’ transportation limits, ecological fragility, and backward agricultural technology, while downstream cities have sufficient capital and technology capacity as support.
In view of the fact that Shanghai and Chongqing are municipalities directly under the Central Government of China, Shanghai has a special status compared with other cities (Figure 7). From 2009 to 2018, the utilization of agricultural land ecological resources in Shanghai and Chongqing are very different. The efficiency of agricultural land resources in Shanghai is higher than that in Chongqing, but the evolution law of these two cities shows an obviously opposite trend. The efficiency of agricultural land resources in Shanghai shows an “inverted U” trend, while Chongqing shows a “U” shape. In addition, the eco-efficiency of agricultural land in Shanghai is always higher than the highest value in Chongqing.
The Getis-Ord Gi* index was applied to evaluate each element in the context of adjacent elements and then compare the local situation with the global situation. We used the index to identify the hot and cold regions of agricultural land eco-efficiency in the Yangtze River basin. It can be seen from Figure 8 that the spatial distribution of agricultural land eco-efficiency is uneven, consistent with our previous findings, showing the pattern of “big dispersion and small agglomeration”. On the whole, the hotspot distribution law of agricultural land efficiency in the Yangtze River basin is low in the west and high in the east. The local characteristics are obvious, mainly reflected in hotspots distributed in the northern areas of the lower reaches, followed by Jiangsu, Anhui, Hubei, and other urban areas. The distribution of coldspot cities is concentrated in the upper reaches of Yunnan Province, Guizhou Province, and other urban areas. The temporal and spatial distribution of agricultural land efficiency changed significantly from 2009 to 2018: the hot cities and cold cities in the Yangtze River basin showed an obvious decreasing trend. By 2018, the hotspots were mainly concentrated in the Nanjing sub-group and Suzhou-Xi Chang subgroup of the Yangtze River Delta urban agglomeration. There were only 9 coldspots left, mainly distributed in the southeast of Zhejiang and Ganzi Tibetan Autonomous Prefecture, Panzhihua City, Chuxiong Yi Autonomous Prefecture, and other places in Sichuan Province.
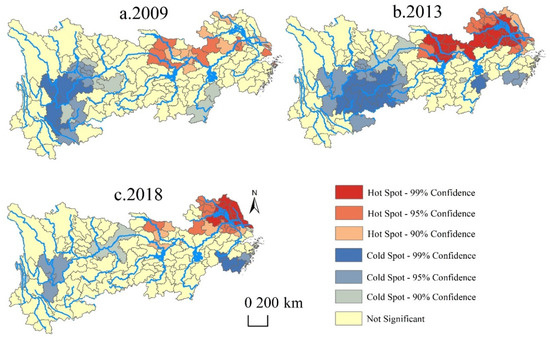
Figure 8.
Hotspot analysis of agricultural land eco-efficiency in the Yangtze River basin.
4.3. Kernel-Density Estimation of Agricultural Land Efficiency
STATA was used to estimate the kernel density of agricultural land eco-efficiency for the cities in the Yangtze River basin in 2009, 2013, and 2018, with the aim of revealing the evolutionary characteristics of the distribution of agricultural land eco-efficiency. The results are shown in Figure 9.
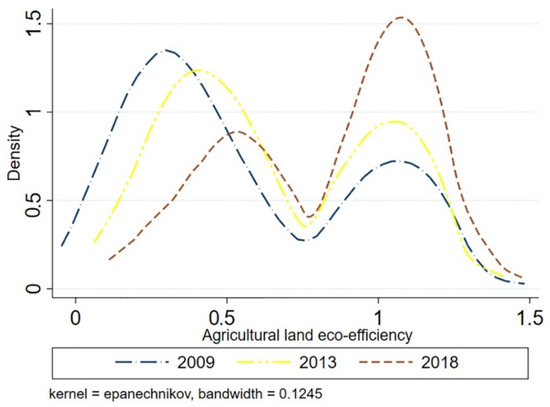
Figure 9.
Kernel-density estimation of agricultural land eco-efficiency in the Yangtze River basin.
Overall, the evolution of the agricultural land eco-efficiency in the Yangtze River basin during the study period is characterized as follows. (1) In terms of shape, the kernel-density curve shows an obvious skewed “M”-shaped bimodal distribution with steep crests overall, which indicates that the agricultural land eco-efficiency in the Yangtze River basin is polarized and the regional disparity is intensified; (2) in terms of position, there is a slightly slowing trend in the extension of the double tail of the kernel-density curve from 2009 to 2018, which indicates that the agricultural eco-efficiency in the Yangtze River basin has shifted from a small decline to a large increase; (3) in terms of kurtosis, the kernel-density curve shows the trend of change from a broad peak to a sharp peak, which indicates that the gaps between the eco-efficiency of agricultural land in different cities are gradually narrowing.
5. Conclusions
5.1. Conclusions
Based on analyzing the carbon emission of 128 prefecture-level cities in the Yangtze River basin from 2009–2018, this study measures the regional variation in the eco-efficiency of agricultural land under the undesired output based on the super-efficient SBM model, explores the spatial relationships between regions by utilizing hotspot analysis and kernel-density estimation, and finally proposes targeted policy recommendations. The results show that: from 2009 to 2018, the agricultural land eco-efficiency of 11 provinces (cities) in the Yangtze River basin fluctuated and grew slowly, and there was still much room for improvement. The results of the hotspot analysis show a pattern characteristic of “big dispersion–small agglomeration”. Moreover, the cities with higher eco-efficiency are concentrated in the economically developed downstream cities, while the ecological efficiency of agricultural land in the midstream to upstream areas is not satisfactory. Additionally, according to the kernel-density curve, the distribution curve of agricultural land eco-efficiency in the Yangtze River basin shows obvious double-peaked and right-tailed characteristics, indicating that agricultural land eco-efficiency is featured by spatial polarization. This research highlights the role of land resources in agricultural production, and studies the difference between the carbon emission intensity of municipal administrative units and the eco-efficiency of agricultural land, which expands the research horizon in the field of agricultural production and enriches the research results.
5.2. Policy Recommendations
As shown in Figure 10. According to the previous calculation results, we have put forward reasonable suggestions for the agricultural development of the Yangtze River economic belt in the future. First of all, we have defined the orientation of agricultural development; that is, we have established the two major goals of agricultural development. One is to ensure the sustainable development of agriculture, and the other is to help China’s dual-carbon target (reaching a carbon peak in 2030 and carbon-neutral in 2060) [50,51]. To achieve the goal of coordinated development of agricultural economy and eco-environment, decision makers in each prefecture-level city in the Yangtze River basin should adopt a “site-specific” rather than a “one-size-fits-all” strategy for agricultural development [52]. Within the United Nations 2030 Sustainable Development Goals, a long-term strategy of agricultural production supported by “ecological space–agricultural production–carbon emission” should be explored and promoted to achieve high-quality development of regional agriculture [53].
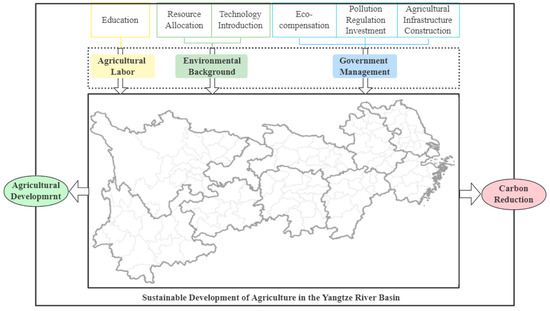
Figure 10.
Paths to improve eco-efficiency of agricultural land.
On the one hand, downstream cities with higher agricultural land eco-efficiency should take advantage of their geographical location and actively introduce advanced production technologies to drive the transformation of agricultural production methods in the upstream and midstream regions and achieve the improvement of overall agricultural land eco-efficiency in the basin; moreover, the downstream cities should appropriately allocate agricultural resources to make up for the scarcity of agricultural land resources.
On the other hand, the midstream and upstream regions with lower eco-efficiency should narrow the gap between regions by formulating agricultural development plans that are in line with their own natural endowments. Specifically, this can be implemented in the following ways. First, local governments should pay attention to the quality education of agricultural labor, improve their environmental awareness, and advocate for the use of advanced agricultural production technologies. Second, local governments should not only improve agricultural infrastructure construction, but should also provide material incentives and other measures, such as ecological compensation according to the sown area, to farmers who insist on implementing low-carbon and efficient ecological cultivation of agricultural land. Third, in order to mitigate the intensity of agricultural carbon emissions, environmental regulators should both reasonably control the use of agricultural chemical materials and mechanical power, promote agroecological approaches, such as the substitution of organic fertilizers, advocate the use of agroecological technologies such as organic fertilizer substitution, as well as increase investment in the management of agricultural pollutant emissions.
6. Futures
Although this paper measures the eco-efficiency of agricultural land in the Yangtze River basin at the municipal level, capturing the differences in agricultural development and the unevenness of regional development among cities, it did not take the convergence of agricultural land eco-efficiency into account in each city. Meanwhile, due to the limitation of data, the scale of our analysis stopped at the prefecture city level and more detailed data (e.g., county-level units) were not collected, so we cannot explore the relationships in depth. In addition, agricultural cropping patterns and plantations were not considered in the construction of the index system, and the unavailability of data limits the collection of pollution-type data such as pesticides and agricultural films in the construction of the carbon source system in the Yangtze River basin. All these will be the focus of our next research in the future.
Author Contributions
Conceptualization, Y.H. and X.L.; data curation, Y.H. and Z.Z.; methodology, S.W. and X.L.; software, Z.Z. and S.W.; validation, Y.H., X.L. and H.Z.; writing—original draft preparation, Y.H. and X.L.; writing—review and editing, Y.H. and X.L. All authors have read and agreed to the published version of the manuscript.
Funding
This research was funded by the National Natural Science Foundation of China, grant number 71974070.
Institutional Review Board Statement
Not applicable.
Informed Consent Statement
Not applicable.
Data Availability Statement
Not applicable.
Acknowledgments
The authors appreciate the anonymous reviewers for their constructive comments and suggestions that significantly improved the quality of this manuscript.
Conflicts of Interest
The authors declare no conflict of interest.
References
- Liu, Y.S. Introduction to land use and rural sustainability in China. Land Use Policy 2018, 74, 1–4. [Google Scholar] [CrossRef]
- Liu, Y.; Fang, F.; Li, Y. Key issues of land use in China and implications for policy making. Land Use Policy 2014, 40, 6–12. [Google Scholar] [CrossRef]
- IPCC. Good Practice Guidance for Land Use, Land-Use Change and Forestry; Institute for Global Environmental Strategies (IGES): Kanagawa, Japan, 2003. [Google Scholar] [CrossRef]
- Liu, Y.; Zhang, Z.; Wang, J. Regional differentiation and comprehensive regionalization scheme of modern agriculture in China. Acta Geogr. Sin. 2018, 73, 203–218. [Google Scholar] [CrossRef]
- Vlontzos, G.; Niavis, S.; Manos, B. A DEA approach for estimating the agricultural energy and environmental efficiency of EU countries. Renew. Sustain. Energy Rev. 2014, 40, 91–96. [Google Scholar] [CrossRef]
- Hou, X.; Liu, J.; Zhang, D.; Zhao, M.; Xia, C. Impact of urbanization on the eco-efficiency of cultivated land utilization: A case study on the Yangtze River Economic Belt, China. J. Clean. Prod. 2019, 238, 117916. [Google Scholar] [CrossRef]
- Deng, X.; Gibson, J. Improving eco-efficiency for the sustainable agricultural production: A case study in Shandong, China. Technol. Forecast. Soc. Chang. 2019, 144, 394–400. [Google Scholar] [CrossRef]
- Kuang, B.; Lu, X.; Zhou, M.; Chen, D. Provincial cultivated land use efficiency in China: Empirical analysis based on the SBM-DEA model with carbon emissions considered. Technol. Forecast. Soc. Chang. 2020, 151, 119874. [Google Scholar] [CrossRef]
- He, D.; Gao, P.; Sun, Z.; Lau, Y.-Y. Measuring Water Transport Efficiency in the Yangtze River Economic Zone, China. Sustainability 2017, 9, 2278. [Google Scholar] [CrossRef]
- Jin, G.; Deng, X.; Zhao, X.; Guo, B.; Yang, J. Spatiotemporal patterns in urbanization efficiency within the Yangtze River Economic Belt between 2005 and 2014. J. Geogr. Sci. 2018, 28, 1113–1126. [Google Scholar] [CrossRef] [Green Version]
- Qi, X.; Huang, X.; Song, Y.; Chuai, X.; Wu, C.; Wang, D. The transformation and driving factors of multi-linkage embodied carbon emission in the Yangtze River Economic Belt. Ecol. Indic. 2021, 126, 107622. [Google Scholar] [CrossRef]
- Xu, X.; Yang, G.; Tan, Y. Identifying ecological red lines in China’s Yangtze River Economic Belt: A regional approach. Ecol. Indic. 2019, 96, 635–646. [Google Scholar] [CrossRef]
- Yang, Q. The conceptual recognition for the coordinat-developing mechanism of Human-activity-Geographical-Environment regional system. Econ. Geogr. 2002, 03, 289–292. (In Chinese) [Google Scholar]
- Coluccia, B.; Valente, D.; Fusco, G.; De Leo, F.; Porrini, D. Assessing agricultural eco-efficiency in Italian Regions. Ecol. Indic. 2020, 116, 106483. [Google Scholar] [CrossRef]
- Hou, M.; Yao, S. Convergence and differentiation characteristics on agro-ecological efficiency in China from a spatial perspective. China Popul. Resour. Environ. 2019, 29, 116–126. (In Chinese) [Google Scholar]
- Feng, Y.; Peng, J.; Deng, Z.; Wang, J. Spatial-temporal variation of cultivated land utilization efficiency in China based on the dual perspective of non-point source pollution and carbon emission. China Popul. Resour. Environ. 2015, 25, 18–25. [Google Scholar] [CrossRef]
- Lu, X.; Kuang, B.; Li, J. Regional differences and its influencing factors of cultivated land use efficiency under carbon emission constraint. J. Nat. Resour. 2018, 33, 657–668. (In Chinese) [Google Scholar]
- Cui, Y.; Khan, S.U.; Deng, Y.; Zhao, M.; Hou, M. Environmental improvement value of agricultural carbon reduction and its spatiotemporal dynamic evolution: Evidence from China. Sci. Total Environ. 2021, 754, 142170. [Google Scholar] [CrossRef]
- Koondhar, M.A.; Tan, Z.; Alam, G.M.; Khan, Z.A.; Wang, L.; Kong, R. Bioenergy consumption, carbon emissions, and agricultural bioeconomic growth: A systematic approach to carbon neutrality in China. J. Environ. Manag. 2021, 296, 113242. [Google Scholar] [CrossRef]
- Sun, B.; Zhou, Q.M. Expressing the spatio-temporal pattern of farmland change in arid lands using landscape metrics. J. Arid Environ. 2016, 124, 118–127. [Google Scholar] [CrossRef]
- Du, W.; Yan, H.; Feng, Z.; Yang, Y.; Liu, F. The supply-consumption relationship of ecological resources under ecological civilization construction in China. Resour. Conserv. Recycl. 2021, 172, 105679. [Google Scholar] [CrossRef]
- Chengjun, S.; Renhua, S.; Zuliang, S.; Yinghao, X.; Jiuchen, W.; Zhiyu, X.; Shangbin, G. Construction process and development trend of ecological agriculture in China. Acta Ecol. Sin. 2021. [Google Scholar] [CrossRef]
- West, T.; Marland, G. A synthesis of carbon sequestration, carbon emissions, and net carbon flux in agriculture: Comparing tillage practices in the United States. Agric. Ecosyst. Environ. 2002, 91, 217–232. [Google Scholar] [CrossRef]
- Smith, P.; Martino, D.; Cai, Z.; Gwary, D.; Smith, J. Greenhouse gas mitigation in agriculture. Philos. Trans. R. Soc. B Biol. Sci. 2008, 363, 789–813. [Google Scholar] [CrossRef] [PubMed] [Green Version]
- West, T.O.; Six, J. Considering the influence of sequestration duration and carbon saturation on estimates of soil carbon capacity. Clim. Chang. 2006, 80, 25–41. [Google Scholar] [CrossRef]
- Wu, F.L.; Li, L.; Zhang, H.L. Effect of conservation tillage on net carbon emission from farmland ecosystem. J. Ecol. 2007, 26, 2035–2039. (In Chinese) [Google Scholar]
- Bardsley, D.K.; Knierim, A. Hegel, Beck and the reconceptualization of ecological risk: The example of Australian agriculture. J. Rural Stud. 2020, 80, 503–512. [Google Scholar] [CrossRef]
- Zou, L.; Liu, Y.; Wang, Y.; Hu, X. Assessment and analysis of agricultural non-point source pollution loads in China: 1978–2017. J. Environ. Manag. 2020, 263, 110400. [Google Scholar] [CrossRef]
- Zhu, E.; Deng, J.; Zhou, M.; Gan, M.; Jiang, R.; Wang, K.; Shahtahmassebi, A. Carbon emissions induced by land-use and land-cover change from 1970 to 2010 in Zhejiang, China. Sci. Total Environ. 2019, 646, 930–939. [Google Scholar] [CrossRef]
- Xu, L.; Fan, M.; Yang, L.; Shao, S. Heterogeneous green innovations and carbon emission performance: Evidence at China’s city level. Energy Econ. 2021, 99, 105269. [Google Scholar] [CrossRef]
- Tone, K. A slacks-based measure of efficiency in data envelopment analysis. Eur. J. Oper. Res. 2001, 130, 498–509. [Google Scholar] [CrossRef] [Green Version]
- Luo, X.; Ao, X.; Zhang, Z.; Wan, Q.; Liu, X. Spatiotemporal variations of cultivated land use efficiency in the Yangtze River Economic Belt based on carbon emission constraints. J. Geogr. Sci. 2020, 30, 535–552. [Google Scholar] [CrossRef]
- Yi, L.; Zhang, W.; Liu, Y.; Zhang, W. An Analysis of the Impact of Market Segmentation on Energy Efficiency: A Spatial Econometric Model Applied in China. Sustainability 2021, 13, 7659. [Google Scholar] [CrossRef]
- Li, Y.; Abdel-Aty, M.; Yuan, J.; Cheng, Z.; Lu, J. Analyzing traffic violation behavior at urban intersections: A spatio-temporal kernel density estimation approach using automated enforcement system data. Accid. Anal. Prev. 2020, 141, 105509. [Google Scholar] [CrossRef] [PubMed]
- Lee, H.-S. An integrated model for SBM and Super-SBM DEA models. J. Oper. Res. Soc. 2021, 72, 1174–1182. [Google Scholar] [CrossRef]
- Tran, T.H.; Mao, Y.; Nathanail, P.; Siebers, P.-O.; Robinson, D. Integrating slacks-based measure of efficiency and super-efficiency in data envelopment analysis. Omega 2019, 85, 156–165. [Google Scholar] [CrossRef] [Green Version]
- Wang, C.N.; Anh, P.L. Application in International Market Selection for the Export of Goods: A Case Study in Vietnam. Sustainability 2018, 10, 4621. [Google Scholar] [CrossRef] [Green Version]
- Zhang, J.; Lin, B.; Zhou, Y. Kernel density estimation for partial linear multivariate responses models. J. Multivar. Anal. 2021, 185, 104768. [Google Scholar] [CrossRef]
- Yao, J.; Xu, P.; Huang, Z. Impact of urbanization on ecological efficiency in China: An empirical analysis based on provincial panel data. Ecol. Indic. 2021, 129, 107827. [Google Scholar] [CrossRef]
- Ma, W.; Meng, L.; Wei, F.; Opp, C.; Yang, D. Spatiotemporal variations of agricultural water footprint and socioeconomic matching evaluation from the perspective of ecological function zone. Agric. Water Manag. 2021, 249, 106803. [Google Scholar] [CrossRef]
- Kamalov, F. Kernel density estimation based sampling for imbalanced class distribution. Inf. Sci. 2020, 512, 1192–1201. [Google Scholar] [CrossRef] [Green Version]
- Wang, D.; Zhou, Q.-B.; Yang, P.; Chen, Z.-X. Design of a spatial sampling scheme considering the spatial autocorrelation of crop acreage included in the sampling units. J. Integr. Agric. 2018, 17, 2096–2106. [Google Scholar] [CrossRef]
- Jouan, J.; Ridier, A.; Carof, M. SYNERGY: A regional bio-economic model analyzing farm-to-farm exchanges and legume production to enhance agricultural sustainability. Ecol. Econ. 2020, 175, 106688. [Google Scholar] [CrossRef]
- Heerman, K.E. Technology, ecology and agricultural trade. J. Int. Econ. 2020, 123, 103280. [Google Scholar] [CrossRef] [Green Version]
- Dong, Y.; Jin, G.; Deng, X. Dynamic interactive effects of urban land-use efficiency, industrial transformation, and carbon emissions. J. Clean. Prod. 2020, 270, 122547. [Google Scholar] [CrossRef]
- Guo, B.; He, D.; Zhao, X.; Zhang, Z.; Dong, Y. Analysis on the spatiotemporal patterns and driving mechanisms of China’s agricultural production efficiency from 2000 to 2015. Phys. Chem. Earth Parts A/B/C 2020, 120, 102909. [Google Scholar] [CrossRef]
- Zhang, H.; Jin, G.; Zhang, Z. Coupling system of carbon emission and social economy: A review. Technol. Forecast. Soc. Chang. 2021, 167, 120730. [Google Scholar] [CrossRef]
- Li, M.; Wang, J.; Zhao, P.; Chen, K.; Wu, L. Factors affecting the willingness of agricultural green production from the perspective of farmers’ perceptions. Sci. Total Environ. 2020, 738, 140289. [Google Scholar] [CrossRef]
- Jin, G.; Chen, K.; Wang, P.; Guo, B.; Dong, Y.; Yang, J. Trade-offs in land-use competition and sustainable land development in the North China Plain. Technol. Forecast. Soc. Chang. 2019, 141, 36–46. [Google Scholar] [CrossRef]
- Dong, Y.; Jin, G.; Deng, X.; Wu, F. Multidimensional measurement of poverty and its spatio-temporal dynamics in China from the perspective of development geography. J. Geogr. Sci. 2021, 31, 130–148. [Google Scholar] [CrossRef]
- Song, M.; Wu, J.; Song, M.; Zhang, L.; Zhu, Y. Spatiotemporal regularity and spillover effects of carbon emission intensity in China’s Bohai Economic Rim. Sci. Total Environ. 2020, 740, 140184. [Google Scholar] [CrossRef]
- Eales, J.; Bethel, A.; Fullam, J.; Olmesdahl, S.; Wulandari, P.; Garside, R. What is the evidence documenting the effects of marine or coastal nature conservation or natural resource management activities on human well-being in South East Asia? A systematic map. Environ. Int. 2021, 151, 106397. [Google Scholar] [CrossRef] [PubMed]
- Uchida, K.; Koyama, A.; Ozeki, M.; Iwasaki, T.; Nakahama, N.; Suka, T. Does the local conservation practice of cultural ecosystem services maintain plant diversity in semi-natural grasslands in Kirigamine Plateau, Japan? Biol. Conserv. 2020, 250, 108737. [Google Scholar] [CrossRef]
Publisher’s Note: MDPI stays neutral with regard to jurisdictional claims in published maps and institutional affiliations. |
© 2022 by the authors. Licensee MDPI, Basel, Switzerland. This article is an open access article distributed under the terms and conditions of the Creative Commons Attribution (CC BY) license (https://creativecommons.org/licenses/by/4.0/).