Abstract
As urban development requires groundwater table isolation of various historically polluted sources, the necessity of building effective, strong, flexible, and low-permeability cutoff walls raises the question of choosing optimum construction materials. Various authors have proposed water–cement–bentonite mixtures, which are often chosen by experience or a trial-and-error approach, using classical methods for testing (Marsh funnel) and representation of results (water–cement ratio, water–bentonite ratio). The paper proposes a more precise approach for assessing the viscosity and global representation of the three components. Moreover, this approached is exemplified with a better documented recipe for the choice of materials based on laboratory results. The representation of the mixtures was undertaken on a limited domain of a ternary diagram, where the components are given in terms of mass percentage. The derived properties (viscosity, permeability, and compressive strength) are presented on a grid corresponding to the physically possible mixtures. Based on this representation, the most efficient recipes are chosen. Because the mixture contains only fine aggregates, the viscosity was determined using a laboratory viscosimeter.
1. Introduction
Since the expansion and development of urban areas, there has been an increasing preoccupation with the quality of the groundwater table. In order to preserve the cleanliness of groundwater, polluting sites must be isolated by containing them via the use of perimetral impervious barriers. In addition to the main, water-retaining function, this type of structure may also have a structural influence on the protected buildings or sites.
This technology is being broadly used in hydrotechnical structures for seepage control, and official guidelines already exist in certain countries, without being mandatory. The issue is still far from being solved or regulated, and the behavior of cutoff walls depends on the design requirements. Cutoff walls made of plastic concrete have a lesser impact on the hydro-geological urban environment because, unlike reinforced concrete trench walls, this type of structure may be broken in-place at the end of construction work, thus resetting the groundwater flow.
The plastic concrete differentiation is mainly described by the water–cement–bentonite content, because the aggregates’ role is well established. The approach of this paper is similar to the characterization of binders in regular concrete, namely, the use for testing of a standardized sand according to EN 196-1 in a ratio of 1:1 with the cement–bentonite mixture.
Depending on the design requirements, there are a range of materials or mixtures that are used for building the barriers: soil–bentonite mixtures, soil–cement–bentonite mixtures, or plastic concrete. Various authors have proposed a wide range of variation for the amount of water, cement, and bentonite. In this study, we attempted to cover the proposed range as much as possible, in correlation with our own studies, which showed that a large amount of bentonite tends to reduce the compressive strength and increases the shrinkage-swelling capacity during soil moisture variation. Hence, in this study we limited the amount of bentonite to about 30%.
The ratios used in this paper are given in Table 1, with a number of case histories documented in previous papers.

Table 1.
Reference values from previous contributions.
Because the ratio between the main components—water, cement, and bentonite—needs to be represented on a scale with three dimensions, with one linear dependency (percentage of cement + percentage of bentonite + percentage of water = 1), to place them into context, the three elements were represented on a ternary diagram using their mass percentages.
To highlight the area of interest, the proposed ternary diagram was limited to a subdomain in which the percentual ratios characterize mixtures that are feasible for all applications. A uniform mesh of percentage combinations was chosen because it provides a smooth representation of each component effect (Figure 1).

Figure 1.
Mesh of cement–bentonite–water combinations.
The ternary subdomain is used as a planimetric representation of mixtures for which various parameters (such as viscosity and the coefficient of permeability) are represented. To provide a proper representation, the areas outside of the represented domain were cropped (Figure 2). The limit lines were set based on the values of the contributions listed in Table 1. Because the out-of-plane values may have exponential variations, where required for the readability of the plot, a logarithmic scale was employed.
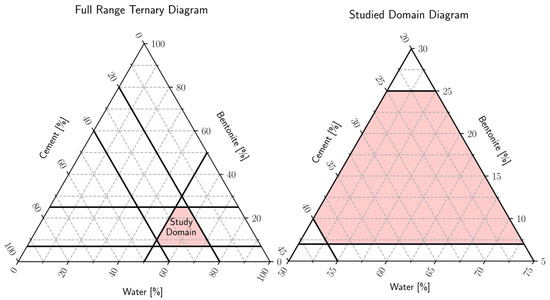
Figure 2.
Ternary subdomain cropping.
2. Preparation of Samples
For the preparation of the samples, standard sand was used because it is recommended by norms that describe the method for determination of the compressive strength of cement mortar (EN 196-1:2016—Particle size distribution is given in Table 2). No other aggregate grading distribution was used to ensure the repeatability of tests and to keep the focus on the water active components. For each sample, the ratio of sand to hydraulic binder (cement and bentonite) was 1:1. The usage of sand was employed to prevent the cracking of the samples that may occur due to the lack of resistance. Even if the content of sand itself influences the behavior of the overall mixture, the relationship between the mass of sand and the sum of masses of bentonite and cement is bijective. Moreover, the amount of sand determines in a 4D-barycentric representation a plane due to the linearity of the variation (Figure 3). For tidiness of the representation, the axis of sand was disregarded.

Table 2.
Particle size distribution of the CEN Standard sand.
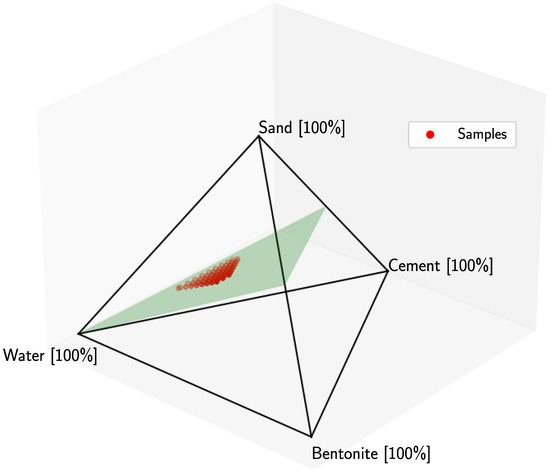
Figure 3.
Ternary diagram in a 4D-barycentric representation in the plane defined by the equation MassSand = MassBentonite + MassCement.
The 1:1 ratio used herein is not generally challenged in the industry, and therefore was not among the objectives of this study.
The sand is not an active factor in the development of water–cement and water–bentonite gels. This contribution aimed at showcasing the reciprocal influence of hydration when the solids are simultaneously added in the mixture as normally happens in situ.
The cement chosen for sample preparation was Portland cement with high initial strength, having the minimum standard compressive strength of 42.5 MPa (CEM IIA 42.5R). Sodium bentonite was used as additive in the plastic concrete mix. The water introduced in the mixtures was regular tap water.
In previous studies, the mixing sequence implied the hydration of bentonite up to 24 h before adding the other components [5,6,7], although similar testing results were obtained by dry mixing all the parts of the mix [2]. Considering the actual site conditions, dry mixing is closer to the technological reality and more effective in terms of time and cost. Detailing the application of the method mentioned before, in this study the bentonite and the cement were added together with the aggregates, followed by the addition of water. The mixture was poured in 50 × 100 mm cylindrical plastic molds matching the triaxial test sample. The laboratory testing program started 28 days after the mixtures were poured. The time interval was selected in order to ensure that the plastic concrete reached its strength.
The determination of the permeability coefficient was undertaken using the constant head permeameter method, whereas the determination of the axial compressive strength was performed following the norm EN ISO 17892-7:2018.
The chosen range for different components proved to be sufficient because unfavorable effects could be noticed at the extremes. The high content of water, despite ensuring a good workability, led to contraction cracking of the samples (Figure 4) and sedimentation of sand; all the sedimented samples were tested and are marked as such in the Figure 5.
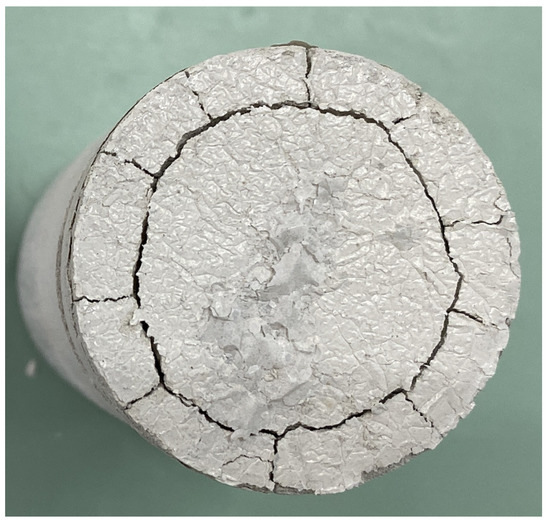
Figure 4.
Contraction cracking caused by high water content.
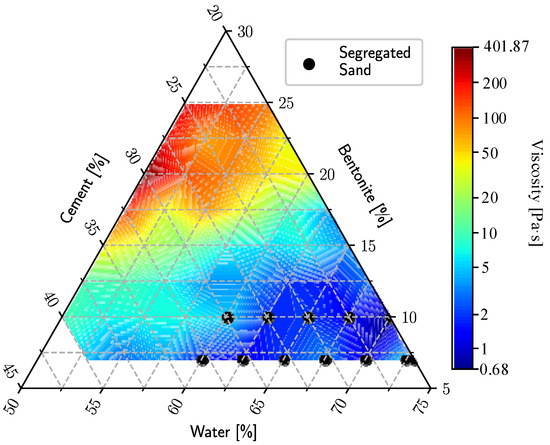
Figure 5.
Viscosity variation of the fresh mixtures and marks of segregated sand samples.
An excessive amount of bentonite led to a crumbling behavior of the material, whereas large amounts of cement reduced the workability of fresh mixtures.
3. Test Results
The viscosity was measured using a rotational viscometer to measure the torque on rods of various geometries depending on the liquid. The slope of τ-γ’ is the dynamic viscosity considering the fresh mix as being quasi-Newtonian. As expected, the variation in viscosity is quite important (between 0.68–401.87 Pa·s); thus, in order to provide a balanced representation of colors, a [0, 1] normalized logarithmic scale was employed as described in Equation (1) [8].
For graph plotting, Python 3.9.9 and numpy, matplotlib, mpltern, and ternary libraries were used.
As expected, the larger the ratio of water–solids, the smaller the viscosity. It should be noted that the Marsh funnel method refers to reference values for bentonite slurry of 32 to 60 s [8], corresponding to viscosities too low to be considered for workable plastic concrete, whereas the concrete viscosity is reported to be between 2–27 Pa·s [9,10], so that the measured values presented herein cover the latter reported range.
The variation is progressive and smooth, so Figure 5 may be used for assessing expected workability when preparing cement–bentonite–water mixtures with sand. It may be noted that limiting the lower viscosity to 5 Pa·s prevents the segregation. The advantage of the proposed plot consists also in setting the mixture without limiting the water content, and in choosing a proper ratio among components, and an increase in bentonite solves the sedimentation issue.
We consider the workability acceptable up to 100 Pa·s, but ideal under 50 Pa·s. For higher values, additives such as superplasticizers are required to attain proper flow for casting.
For choosing the best suited mixture, it is important to correlate workability with the targeted failure behaviors and permeabilities.
The quantity of bentonite negatively impacts the compressive strength when portions larger than 17% are used. In this case, the strength is decreased by factors of 2 and more with respect to lower bentonite amounts (Figure 6). This highlights a boundary of material behavior at values of bentonite content around 17%, from which the hardened mixtures shift from having predominant compressive strength to shearing strength; that is, switching from weak concrete to hard soil (Figure 7).
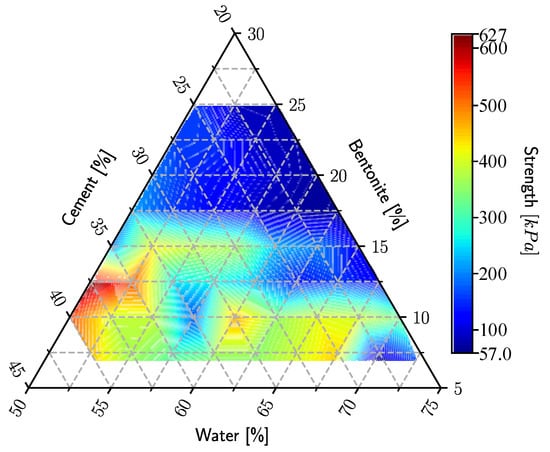
Figure 6.
Axial compressive strength.
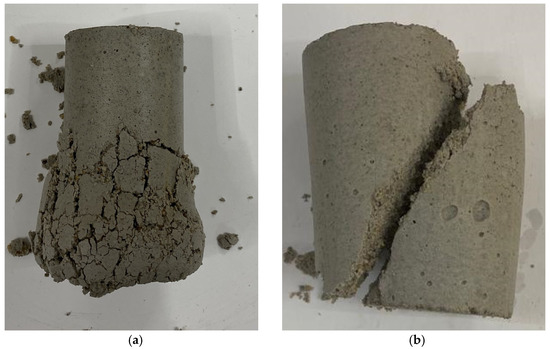
Figure 7.
Failure patterns of plastic concrete samples. (a) “weak concrete”—compressive failure. (b) “strong soil”—shearing failure.
Conversely, the material permeability is also decreased by a factor of 5 or more (Figure 8) along the same boundary of about 17%, confirming the model of switching between the mechanical behavior of the hardened mixture.
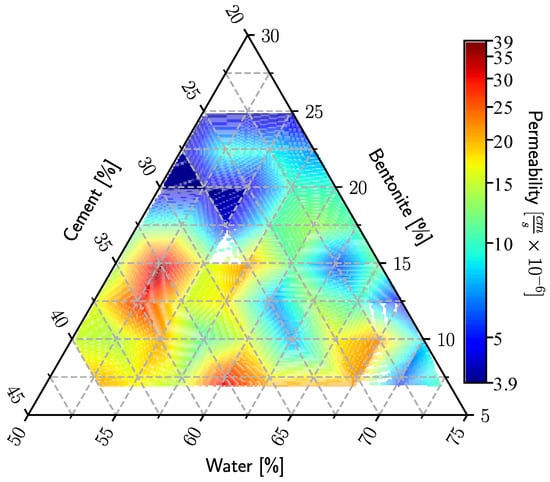
Figure 8.
Permeability.
All data resulting from laboratory tests are given in Table 3. The mixtures are given both in terms of percentage of each component and as classical ratios.

Table 3.
Test data table.
4. Discussion
This research focused mainly on covering all the possible mixture contents as described by various contributions. This led to a wide distribution of results in terms of the diverse mechanical behavior. In order to aid the visual identification of the mixtures, a colormap based on red–yellow–blue coding was derived, as shown in Figure 9.
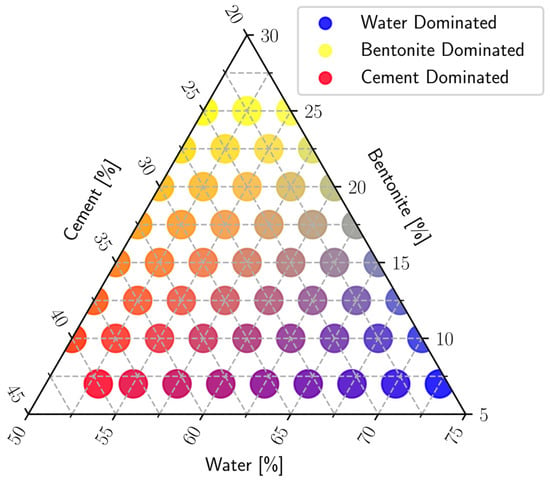
Figure 9.
Component distribution colormap.
The three properties studied for each mixture were viscosity, strength, and permeability. A distinctive clustering of results induced by the feature tradeoff governed by the components may be noted in Figure 10.
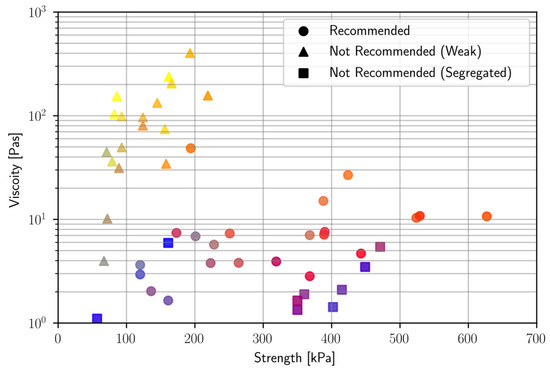
Figure 10.
Viscosity vs. strength.
The increase in bentonite amount (yellower dots in the graphs) leads to the foreseeable loss of strength of about 1–5 times with respect to the cement-governed mixtures; however the viscosity increases by about 1–1.5 orders of magnitude. The large variation in strength for plastic concrete is documented in the literature, and the range found herein was confirmed by contributions such as [5,11,12]. Other authors, such as [6], obtained slightly overlapping results but with most of the strengths being an order of magnitude higher.
Studying the variation in the strength with respect to the commonly used ratios employed in engineering practice, namely water/cement and water/bentonite, the influence of the third component in the mixture may be noted.
The effect of strength reduction due to the bentonite may be readily noted in Figure 11, in the mixtures containing over 17.5% active clay (yellow shaded), or in Figure 12 with a water/bentonite ratio lower than 4. In Figure 11, the plastic concrete with high content of sodium bentonite is less prone to develop hydrated clinker bridges, so the strength drops under 200 kPa for this composition of samples. These results are also noticeable in the grouping of yellow-shaded markers in Figure 12.
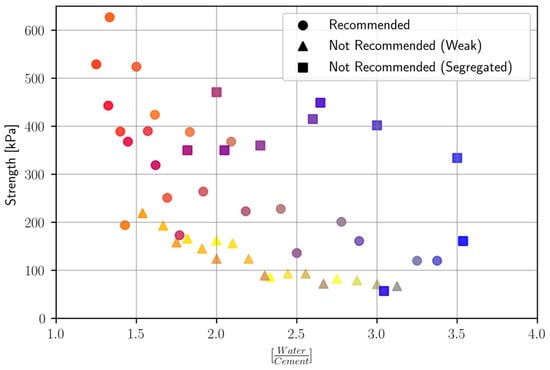
Figure 11.
Strength vs. water/cement ratio.
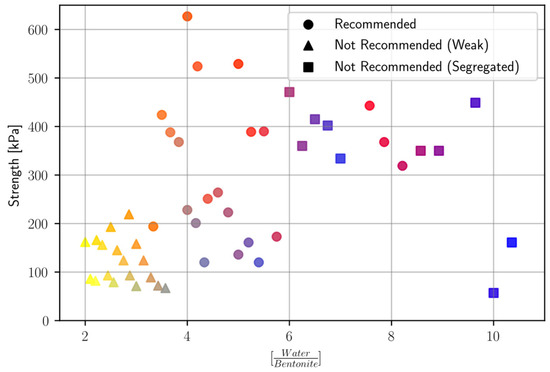
Figure 12.
Strength vs. water/bentonite ratio.
We consider viscosity to be a very important feature of the fresh plastic concrete, because this property prevents the contamination of the cast material with water or soil from the trench walls when replacing the slurry used for excavation. The values obtained in our tests did not exceed the limit of proper workability.
In addition to the role of thickener for the fresh mixture, bentonite prevents the proper development of cement gel and is twice as expensive as the binder; however, the decrease in permeability of the wall for low amounts of bentonite is canceled or even worsened if this component is used in excess. This effect is also observed in the case of strength.
In Figure 13, the low scattering of test data in the graph indicates the fact that the viscosity of the mix is almost entirely governed by the bentonite and water content, with little to no influence from the cement (Figure 14).
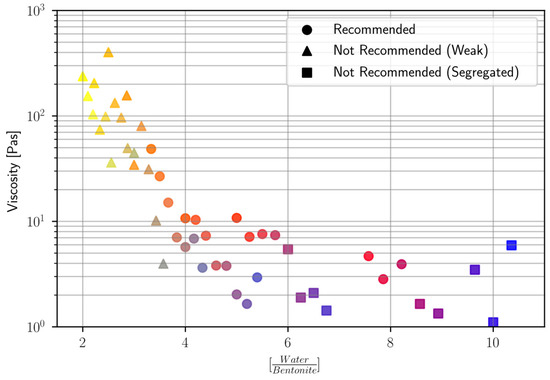
Figure 13.
Viscosity vs. water/bentonite ratio.
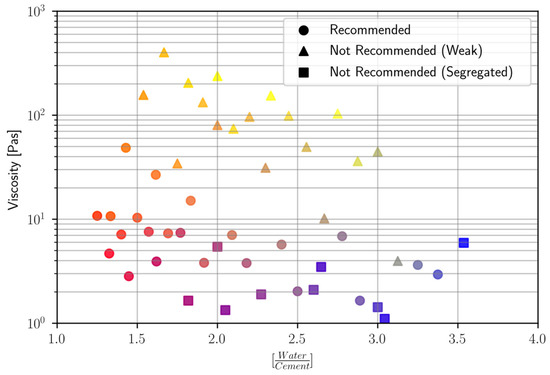
Figure 14.
Viscosity vs. water/cement ratio.
Due to the large number of samples and long testing time required (employing triaxial test equipment), and the hardening time limitation on batching, only one sample was tested for each combination, resulting in some lack of accuracy, especially for permeability tests. However, a trend in the data emerged that helps to narrow the mixture variation range to a domain closer to the targeted purposes. A future stage in this research will be to employ three to five samples of each combination in order to be able to process the data on a statistical basis, yet for a narrower subdomain, as proposed in Figure 15.

Figure 15.
Boundaries of recommended water–bentonite–cement mixes based on the test results.
5. Conclusions
The plastic concrete used in urban hydrogeological barriers requires a set of properties that sometimes yields to contradictory requirements. The best example is the tradeoff between permeability and strength that involves using bentonite as a control component. As shown in this study, a large amount of bentonite decreases permeability and thus efficiency of the cutoff wall but, at the same time, also reduces compressive strength with consequences for the cracking control of the structure. The best approach should be to choose bentonite content within limits that provide satisfactory behavior in terms of both parameters. The recommended dosage is less than 17%, as shown herein.
Even if various authors proposed wide ranges of ratios of the mixture components, extreme values definitely lead to unfavorable effects, such as sand segregation, low workability, or long setting time. Because sodium bentonite and cements are well standardized, we consider it possible to predefine mixture recipes that are optimal for certain purposes.
This paper does not aim to set pre-determined mixture ratios but rather to guide the choice of plastic concrete recipe towards the targeted design purpose. As is readily noticeable, slight variations in components may induce an important improvement or decay in certain mechanical characteristics.
Author Contributions
Investigation, C.-Ș.B.; Data curation, A.-D.S., Methodology, D.-M.M.; Software, A.-D.S.; Supervision, M.-S.Ș. All authors have read and agreed to the published version of the manuscript.
Funding
This research received no external funding.
Institutional Review Board Statement
Not applicable.
Informed Consent Statement
Not applicable.
Data Availability Statement
Data is contained within the article in Table 3.
Conflicts of Interest
The authors declare no conflict of interest.
References
- Shepherd, D.A.; Kotan, E.; Dehn, F. Plastic concrete for cut-off walls: A review. Constr. Build. Mater. 2020, 255, 119248. [Google Scholar] [CrossRef]
- Fadaie, M.A.; Nekooei, M.; Javadi, P. Effect of Dry and Saturated Bentonite on Plastic Concrete. KSCE J. Civ. Eng. 2019, 23, 3431–3442. [Google Scholar] [CrossRef]
- Pashang Pisheh, Y.; Mir Mohammad Hosseini, M. Experimental Investigation of Mechanical Behavior of Plastic Concrete in Cutoff Walls. J. Mater. Civ. Eng. 2018, 31, 04018355. [Google Scholar] [CrossRef]
- U.S. Bureau of Reclamation. Design Standards No.13: Embankment Dam, Chapter 16: Cutoff Walls; U.S. Department of the Interior: Washington, DC, USA, 2014; Volume 7.
- Hinchberger, S.; Weck, J.; Newson, T. Mechanical and hydraulic characterization of plastic concrete for seepage cut-off walls. Can. Geotech. J. 2010, 47, 461–471. [Google Scholar] [CrossRef]
- Bagheri, A.; Alibabaie, M.; Babaie, M. Reduction in the permeability of plastic concrete for cut-off walls through utilization of silica fume. Constr. Build. Mater. 2008, 22, 1247–1252. [Google Scholar] [CrossRef]
- EZavadkas, K.; Turskis, Z. A new logarithmic normalization method in games theory. Informatica 2008, 19, 303–314. [Google Scholar]
- CEN, EN 1538+A1:2015Execution of Special Geotechnical Work—Diaphragm Walls, European Committee for Standardization: Brussels, Belgium, 2015.
- Banfill, P.F. Rheology of Fresh Cement and Concrete. Mater. Sci. 1991, 61–130. [Google Scholar] [CrossRef]
- Mahboubi, A.; Ali, A. Experimental study of the mechanical behavior of plastic concrete in triaxial compression. Cem. Concr. Res. 2005, 35, 412–419. [Google Scholar] [CrossRef]
- Zhang, P.; Guan, Q.; Li, Q. Mechanical Properties of Plastic Concrete Containing Bentonite. Res. J. Appl. Sci. Eng. Technol. 2013, 5, 1317–1322. [Google Scholar] [CrossRef]
- Kazemian, S.; Ghareh, S.; Torkanloo, L. To Investigation of Plastic Concrete Bentonite Changes on it’s Physical Properties. Procedia Eng. 2016, 145, 1080–1087. [Google Scholar] [CrossRef]
Publisher’s Note: MDPI stays neutral with regard to jurisdictional claims in published maps and institutional affiliations. |
© 2022 by the authors. Licensee MDPI, Basel, Switzerland. This article is an open access article distributed under the terms and conditions of the Creative Commons Attribution (CC BY) license (https://creativecommons.org/licenses/by/4.0/).