Article

Strawberry Growth under Current and Future Rainfall Scenarios

1
School of Food and Agriculture Agroecology Lab, George J. Mitchell Center for Sustainability Solutions, University of Maine, Orono, ME 04469, USA
2
Maine Food and Agriculture Center, University of Maine Cooperative Extension, Orono, ME 04469, USA
3
Climate Change Institute, University of Maine Extension, Orono, ME 04469, USA
4
School of Food and Agriculture Agroecology Lab, University of Maine, Orono, ME 04469, USA
5
School of Biology and Ecology, University of Maine, Orono, ME 04469, USA
*
Author to whom correspondence should be addressed.
Water 2022, 14(3), 313; https://doi.org/10.3390/w14030313
Submission received: 22 December 2021 / Revised: 11 January 2022 / Accepted: 14 January 2022 / Published: 21 January 2022

Abstract

:
Globally, the changing and interacting effects of temperature and precipitation are anticipated to influence the fitness of specialty crops. Strawberry (Fragaria x ananassa) is an important crop in the Northeastern United States. In this study, four plausible precipitation scenarios were developed to be representative of current and future growing season precipitation patterns. Using a precipitation simulator, we tested these scenarios on potted-day-neutral strawberries. This study generated four primary results. (1) Though some treatments received different amounts of precipitation, little difference was observed in soil volumetric water content or temperature. Treatments designed to simulate future conditions were more likely to have higher nitrate-in-leachate (N-leachate) concentrations than those designed to simulate current conditions. (2) Neither total precipitation nor seasonable distribution were associated with foliar or root disease pressure. (3) While there was a slightly higher chance that photosynthesis would be higher in drier conditions, little difference was observed in the effects on chlorophyll concentration and no water stress was detected in any treatment. (4) Leaf biomass was likely more affected by total rather than seasonal distribution of precipitation, but the interaction between changing rainfall distribution and seasonal totals is likely to be an important driver of root biomass development in the future.

1. Introduction

Internationally, the United States is ranked second in strawberry (Fragaria x ananassa) production, producing 20% of the global market and generating ≈USD 2.3 B gross sales annually. In the Northeast, strawberries are produced on ≈1538 hectares (3800 acres) for wholesale and direct markets. In this region, strawberry production is most commonly integrated with diversified farming operations, with an average production per farm of 0.61 hectares (1.5 acres). Production areas are commonly located around high-population centers, suggesting the important role that strawberries play in meeting a fresh and regional market demand. While nearly all of the strawberries produced in the Northeast are consumed within the region, only 95% of strawberries purchased in Northeast states are grown there [1]. This means there are significant opportunities for growers and the agricultural advisors who support them to address current production challenges and increase production to better meet local consumer demand.
Temperature and solar radiation have been shown to be important limiting factors in strawberry yield efficiency [2]; however, crop-water use is also important [3]. It is estimated that strawberries require 2.54 cm (1 inch) of water every 12–14 days during the growing season (April–October, in the Northeastern United States), increasing to 3.81 cm (1.5 inches) of water every 7 days during the fruiting period [4]. Increasingly, growers in the Northeast are using protected cultivation to produce strawberries (i.e., low tunnels, high tunnels and greenhouses) in order to protect and enhance fruit marketability, reduce disease pressure, increase both total yield and the size of individual fruits, extend fruit production and control phenological development [5]. However, it is still common for strawberry growers to produce their crops in unprotected environments, in which case strawberries remain vulnerable to precipitation and temperature extremes and the associated challenges these extremes present.
Shifting precipitation patterns is widely accepted as one of the most consequential effects of anthropogenic climate change [6]. Globally, it is expected that these shifting precipitation patterns will influence both ground and surface water resources and, by extension, agroecological systems. Surface water reliability in particular is expected to change due to increased variability in precipitation patterns [7]. Groundwater sources are less prone to changing due to variable precipitation than surface waters; however, they are still vulnerable. Groundwater reservoirs are often more spatially dispersed and serve as important reserves during periods when surface water bodies are unavailable or unreliable. They are also difficult to monitor and can be expensive to access through drilling and pumping [8]. Groundwater use is considered sustainable when the rate of withdrawal does not exceed the rate of recharge. However, climate change is anticipated to affect recharge mechanisms (i.e., precipitation, temperature and sea level), thereby drawing into question the reliability of some regionally important groundwater reservoirs [9]. This is of considerable concern in regions where there is a high reliance on groundwater for municipal, industrial and agricultural purposes.
The Northeast region of the United States is one such region. The Northeast comprises 12 states (Connecticut, Delaware, Maine, Maryland, Massachusetts, New Hampshire, New Jersey, New York, Pennsylvania, Rhode Island and Vermont), as well as the District of Columbia. Since 2001, this region has experienced a notable increase in both total annual precipitation and extreme precipitation [10,11], outpacing changes observed in other parts of the United States [12]. Extreme precipitation has been increasing, both in terms of number of extreme events and intensity, associated with the intensification of the hydrologic cycle [13]. Along with an increase in seasonal extreme rainfall events, it is anticipated that increasingly common dry periods and drought will affect water resources across the region [14] and that water use efficiency and access will become an increasingly important consideration for agricultural sectors [15], including small fruit production systems.
It is well established that both water availability (i.e., soil–water potential) and the relationship between water absorption and transpiration rates have direct effects on crop physiological performance [16]. Precipitation is an important driver of soil water potential that influences water availability for agriculture and provides necessary moisture for primary crop physiological development. In addition, precipitation during the non-cropping season in the form of rain or snowfall contributes to ground- and surface-water reservoirs, which can later be utilized for irrigation, fertigation, or frost protection. Small fruit specialty crops are particularly vulnerable to changes in precipitation (frequency and intensity) during critical growth periods. For example, strawberries are sensitive to yield loss and quality degradation as a result of disease (related to excess water) and poor fruit development (related to both limited and excess water) [17]. Even for fruit crops with high resilience to drought, such as wild blueberries in Northeast USA, water deficits greatly impact the crop vigor and yield [18].
To meaningfully assess the effects of changing precipitation patterns on specialty crops in general and strawberries in particular, we must look at both crop yield and a broader range of plant quality and agroecological outcomes [19]. Assessing environmental conditions (e.g., soil water potential) and plant physiological functions (e.g., photosynthesis indicated by chlorophyll fluorescence and chlorophyll concentration) generates important insights into crops’ resistance to a changing climate. For example, high strawberry root mass density has been shown to increase nutrient uptake, with root mass density being associated with soil water potential [20]. Sub-seasonal root biomass shrinkage in this crop is associated with fruiting periods, a time when nutrient needs are also likely at their highest [21]. It is likely that changes in biomass are influenced by soil water potential and have subsequent effects on strawberries’ ability to metabolize nutrients and perform core physiological functions. In another example, the chlorophyll concentration of leaves is considered to be a reliable indicator of photosynthetic capacity and has been found to be positively correlated with photosynthetic CO2 fixation [22], as well as yield [23]. The estimation of leaf chlorophyll concentration allows researchers to estimate not only plants’ photosynthetic capacity, but also the effects of disease, nutritional, or environmental stress [24,25]. Though chlorophyll content has been positively associated with yield in some crops [26], it is estimated that, under periods of water stress, photosynthetic activity decreases [27], likely leading to decreased yield and crop quality.
Soil water potential also influences other important agroecological dynamics. For example, it has been shown that nitrogen (N) leaching is influenced by precipitation, though much research on this topic has focused on arid or semi-arid regions. In these environments, N accumulates in soils during extended dry periods and is released during rewetting events [28,29]. Recent studies suggest that similar dynamics exist in temperate climates [28,30], though, in temperate contexts, the shorter periods between precipitation events likely lead to lower concentrations of N in leachate. The relationship between the rewetting of dry soils and N flushing in leachate is partially explained by the activation of microbial biomass [31]. Additionally, disease pressure has been shown to vary with changes in soil water potential in small fruit crops, for example, in cultivated grapes [32]. Specifically relevant to strawberries, water deficits have been found to reduce the severity of biotrophic pathogens [33], including those that affect plant foliage [34].
Considering the complexity of these dynamics and the likely sensitivity of strawberries to changes in precipitation and water applications, the objectives of this research study are to determine the influence of four precipitation scenarios on the production of strawberries. Specifically, we aim to understand how strawberries perform under different precipitation scenarios in terms of (a) total leachate amounts and loss of nitrate through leaching, (b) incidence of disease and insect damage and (c) plant physiological performance, including chlorophyll concentration and photosynthesis.

2. Methods

2.1. Experimental Design

A small-scale, portable rainfall simulator was constructed, using a design adapted from Humphry et al. [28]. A single, stationary nozzle was mounted on the steel frame at a height of 3.048 m (10″). The base area of the simulator was 1.5 × 2 m (4.9′ × 6.7′). Simulated precipitation was calibrated by assessing the length of time the simulator needed to run to fill empty pots to 4921 mL (1″) at a PSI between 5 and 8. The selected setting precipitated a rate of 289 mL/min (17 min to fill to 1″). Deionized water was used for the experiment, pumped through the simulator using a small Shurflo pump at 3.5 gallons per miniature and a maximum of 310.26 kPa (45 PSI).
The treatment schedules in this study followed four plausible future rainfall scenarios (Table 1) that encompass aspects of a wetter future climate with an intensified hydrologic cycle [10,11,12,14], as well as an unexpected drier future climate. In order to maximize the realistic nature of these scenarios, we utilized historical station observations local to the study domain rather than from a downscaled general circulation model. To do this, we used daily precipitation values during the warm season (1 April–30 September) for the years 2001 and 2019 observed at the Bangor International Airport (44.8° N−68.82° W; elevation, 58 meters (190′)), a site located within the southern interior climate division. Precipitation data were sourced from the Global Historical Climatology Network (GHCN) [29], station USW00014606 (Figure 1). The first two scenarios represent plausible future precipitation regimes following the historically dry (RECDry) and wet (RECWet) conditions observed in 2001 and 2019, respectively (Figure S1). In 2001, modest intervals of rainfall were interspersed between dry intervals ranging from two to four weeks in duration. Only a single rainfall event, 4.70 cm (1.85 inches) on 25 September, exceeded a 2.54 cm (1 inches) threshold that season. This is in contrast to 2019, which saw frequent rainfall throughout the warm season and eight instances of daily rainfall >6.38 cm (2.51 inches). The third and fourth plausible future scenarios are based on 2001 precipitation, but with daily values being increased by the factors 1.43 (AMPDry1.43) and 1.89 (AMPDry1.89) to align with a season total equivalent to that observed for the historically wet year 2019. Thus, these latter two scenarios represent plausible future climates where most of the season precipitation is accumulated during heavy rainfall events that are separated by extended intervals of dryness. In AMPDry1.89, the 25 September rainfall event noted above was removed such that all other daily rainfall values were increased to bring the season total to precipitation to the same amount in AMPDry1.43 (i.e., equivalent to the total observed in 2019).
Day-neutral strawberries (Jewel variety) were purchased bare root and planted into containers measuring 12.7 cm (5 inches) × 12.7 cm (5 inches) square, 30.48 cm (12 inches) in depth. The soil medium used for potting was Pro-Mix BX Original. Between precipitation simulations, plants were stored inside a greenhouse made of 8 mm clear twin-wall polycarbonate paneling (roof, sidewalls and end walls) measuring 14.78 m (48.5 feet) × 5.79 m (19 feet). The greenhouse was ventilated with horizontal air flow fans. Data collection occurred between 19 May and 30 September, 2021. A variety of variables were measured in order to assess strawberry plant physiological responses to the four precipitation treatments.

2.2. Volumetric Water Content, Soil Temperature, Leachate and Nitrate-Leachate Concentration

Soil volumetric water content and soil temperature in each pot were measured on a weekly basis using a TDR soil moisture meter (TDR 150; Spectrum Technologies In., Aurora, IL, USA). Average values were calculated for each treatment across all pots. Free draining lysimeters were constructed under each treatment block (8 plants each), with 2 replications per treatment (16 plants per treatment). Leachate was collected after every simulated rainfall event. The total volume of leachate was recorded (mL) for each replicate and subsamples were stored at 4.44 °C (40 °F). Subsamples collected within a one-week period were combined and tested for nitrate concentration (colorimetric analyses) by the University of Maine Soil Testing and Analytical Lab. Not all strawberry plants survived the season, but pots containing dead plants were included in volumetric water content, soil temperature, leachate and N-leachate concentration measurements until the conclusion of the experiment.

2.3. Disease

Plants were inspected for visual evidence of symptoms at the end of the experiment. Specifically, the percentage of leaf area with leaf spots on each plant were recorded and averaged across all plants within a treatment. At the conclusion of the experiment, crown and root diseases were assessed through destructive sampling of the remaining living plants. During this process, two pieces of roots and two pieces of crown from each plant were cut and sterilized with a 10% bleach solution for one min and then rinsed in sterile, deionized water. The plant material was then plated in water agar fungal media and incubated at 25 °C for one week. Agar plates were viewed under a compound microscope (Olympus BX5) and assessed for fungal diseases, which were morphologically identified if present. When a pathogen was identified from a plant piece, a percentage was generated with 100% representing all four of the plated plant pieces having fungal growth. Foliage showing symptomatic leaf spots were selected and placed in a moist chamber that was also incubated at 25 °C for one week. After incubation, foliage was viewed under a dissecting microscope (Olympus SZX16) to determine the presence and absence of pathogenic fungal growth.

2.4. Leaf Chlorophyll Fluorescence and Chlorophyll Concentration

Leaf photosynthetic performance was assessed through leaf chlorophyll fluorescence measurements. The variables measured included the quantum yield of photosystem II (Y(II)), which equals Fv/Fm and is sensitive to stress. We also assessed the electron transport rate (ETR), which indicates actual photosynthetic performance under specific light conditions and is related to photosynthetic CO2 assimilation [35]. Both Y(II) and ETR were measured weekly from 12:00 to 4:00 p.m. using a FluorPen portable leaf fluorescence meter (Photon Systems Instruments, Drásov, Czech Republic). Additionally, we assessed leaf chlorophyll concentration, which has been shown to be strongly related to N concentration of mature leaves. It was expected that there was a strong correlation between chlorophyll concentration and photosynthetic rate. Leaf chlorophyll concentration soil–plant analysis development (SPAD) measurements were made weekly using a hand-held chlorophyll meter (SPAD 502; Minolta Corp., Osaka, Japan), an evidence-based approach to assess plant N status [36]. All measurements related to photosynthetic potential and performance and chlorophyll concentration were made on a weekly basis from individual plants (one leaf per plant).

2.5. Biomass

Above- and below-ground biomass samples were collected as the strawberry plants died over the course of the experiment and at the end of the experiment. Above-ground biomass assessment methods established by the United States Department of Agriculture (USDA) Natural Resources Conservation Service [36,37] were used in this assessment. Specifically, all vegetation was clipped at the soil surface and stored prior to processing. Samples were weighed prior to being oven-dried at 60 °C and subsequently reweighed. To assess below-ground biomass, all soil was removed from the plant roots and processed using the same approach used for above-ground biomass samples.

2.6. Analyses

To assess the overall seasonal effects of the precipitation treatments on our various, normally distributed dependent variables, we performed a series of one-way analysis of variance (ANOVA) tests with Tukey’s HSD post hoc tests. For those variables that did not meet assumptions of normality, non-parametric Kruskal–Wallis rank sum tests, followed by pairwise Wilcoxon rank-sum comparisons, were employed. To better assess the effects of seasonal precipitation distribution of precipitation on relevant dependent variables, a series of generalized linear regression models (GLMs) with gamma distributions and inverse link functions was used. This approach was chosen because we assumed a fixed relationship between the mean values of each model and the variance, as all readings were always greater than zero with non-normal, skewed distributions [38,39]. Gamma distributions are often utilized in description of precipitation data [40] and can be interpreted using both transformed and original scales [41]. All analyses included in this manuscript were performed using R Version 4.1.0 [42] and the plots were created using ggplot2 [43].

3. Results

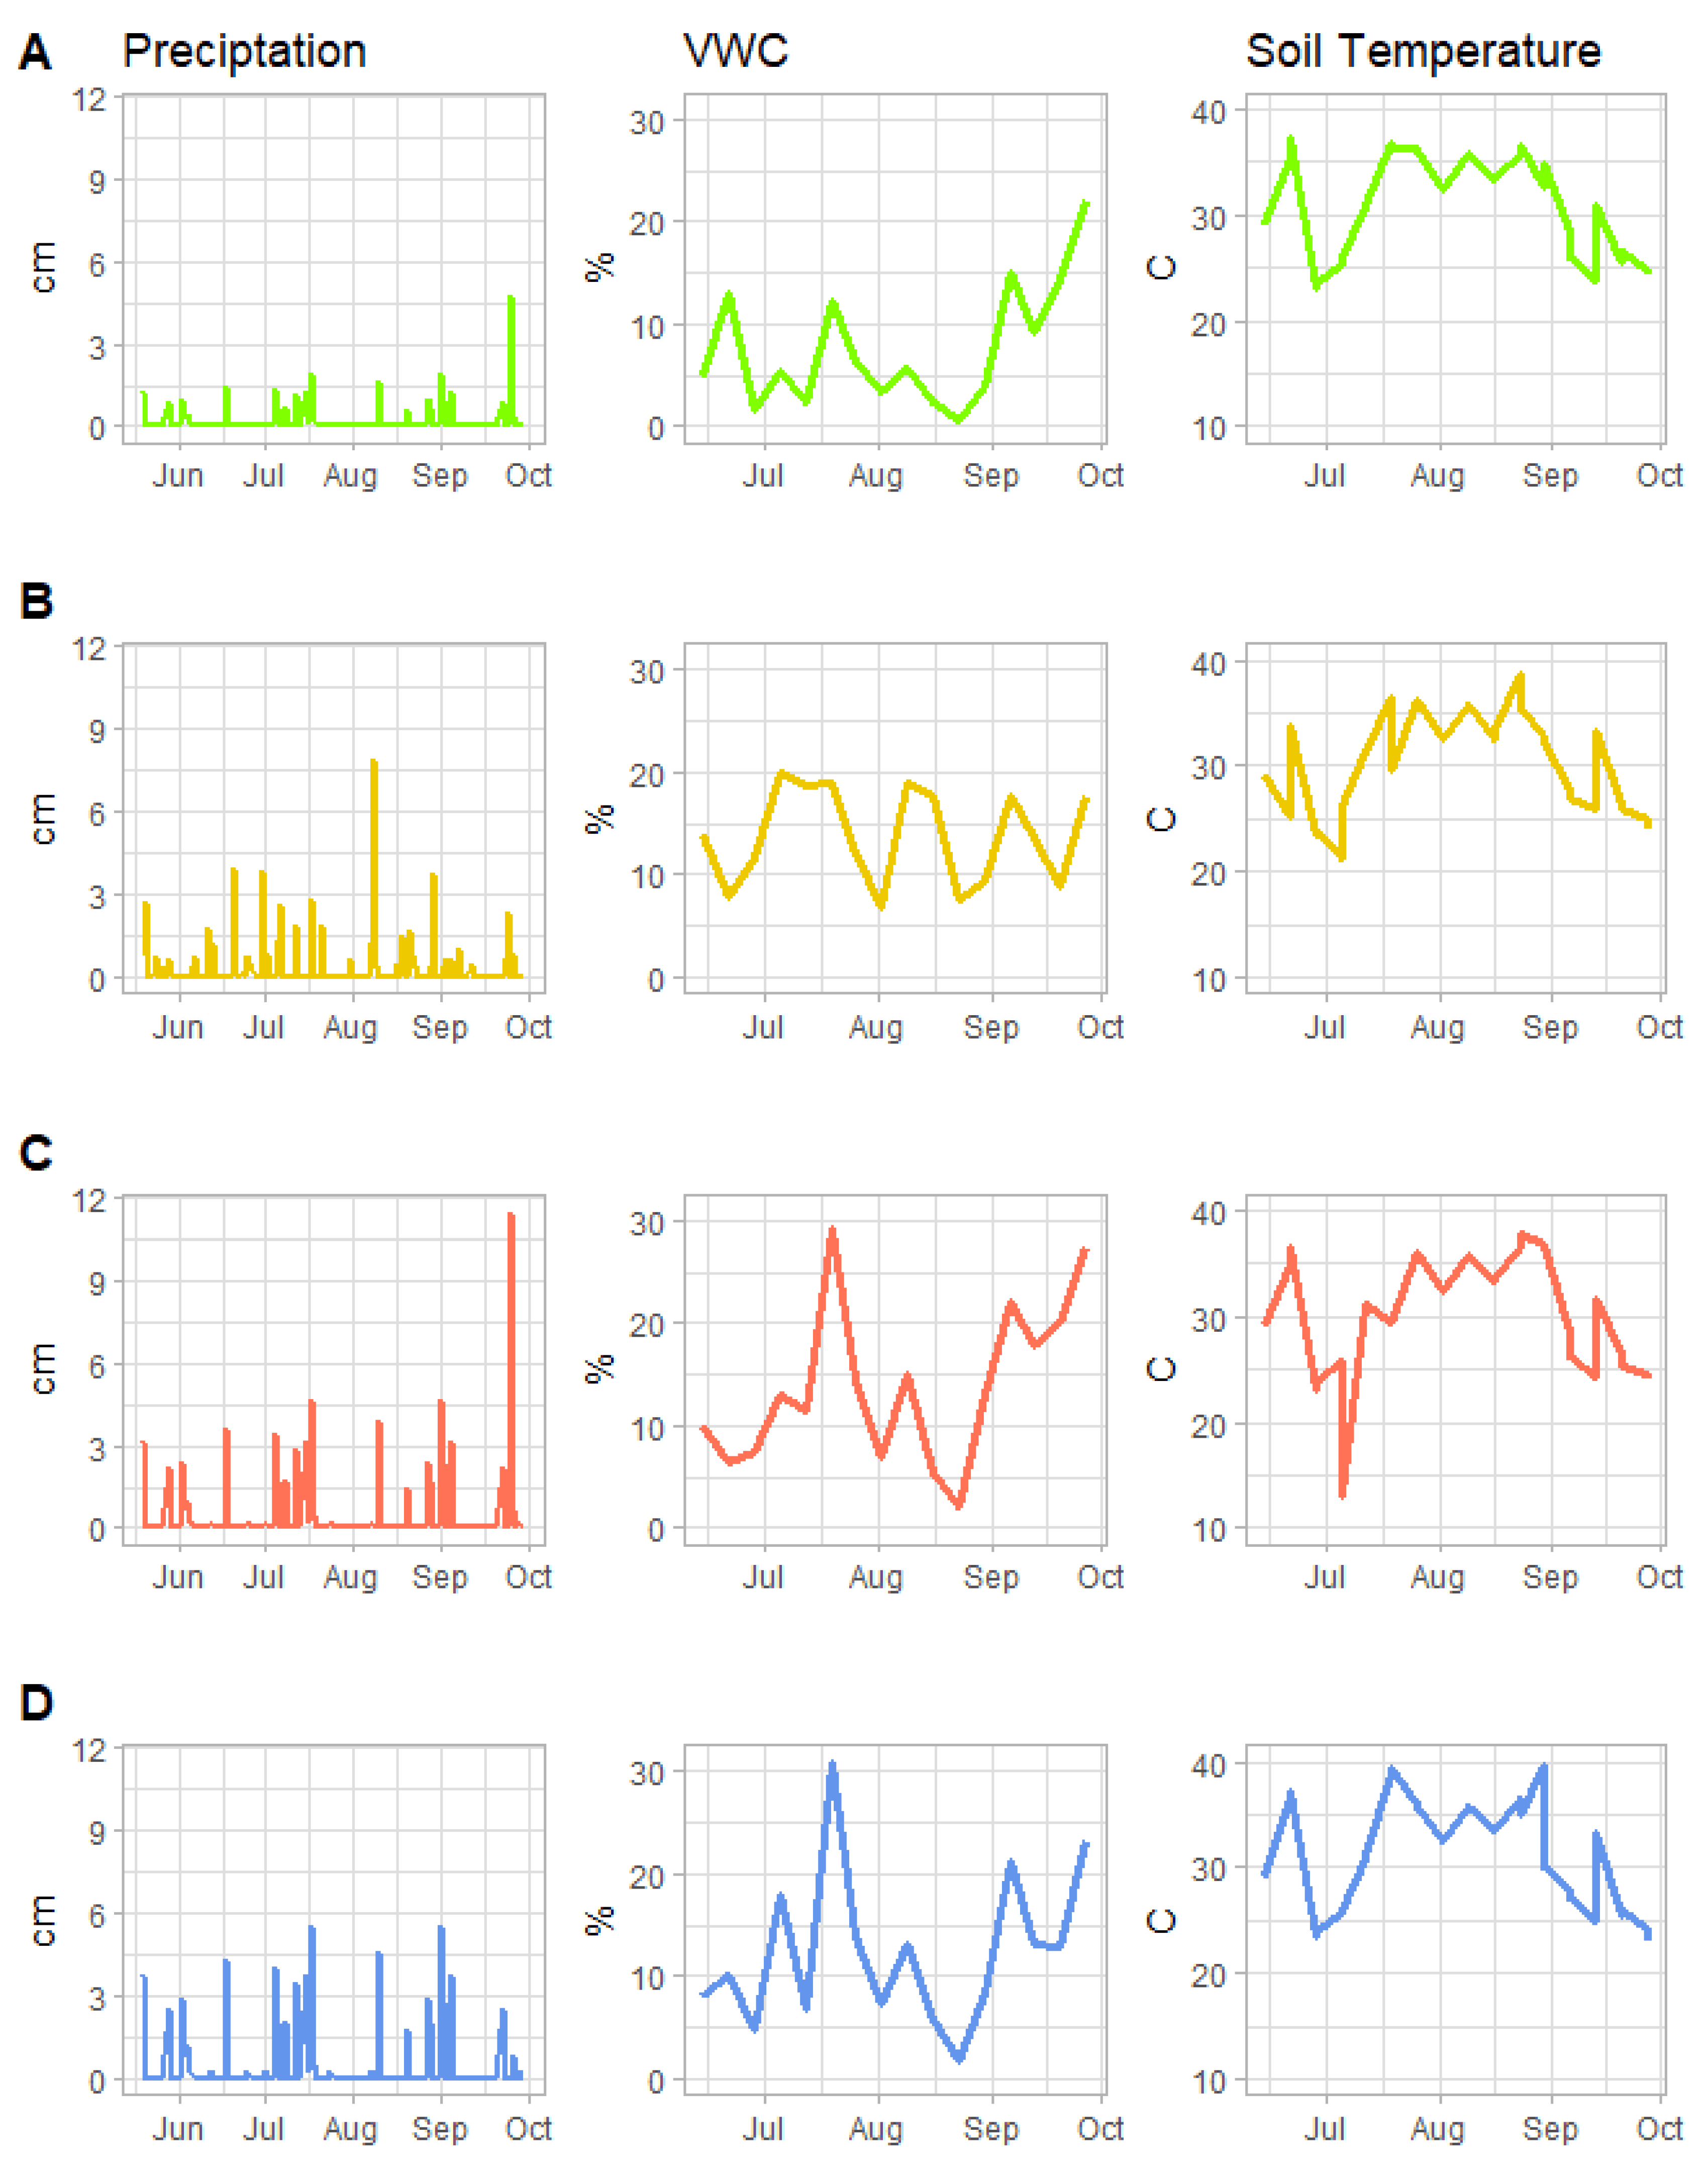
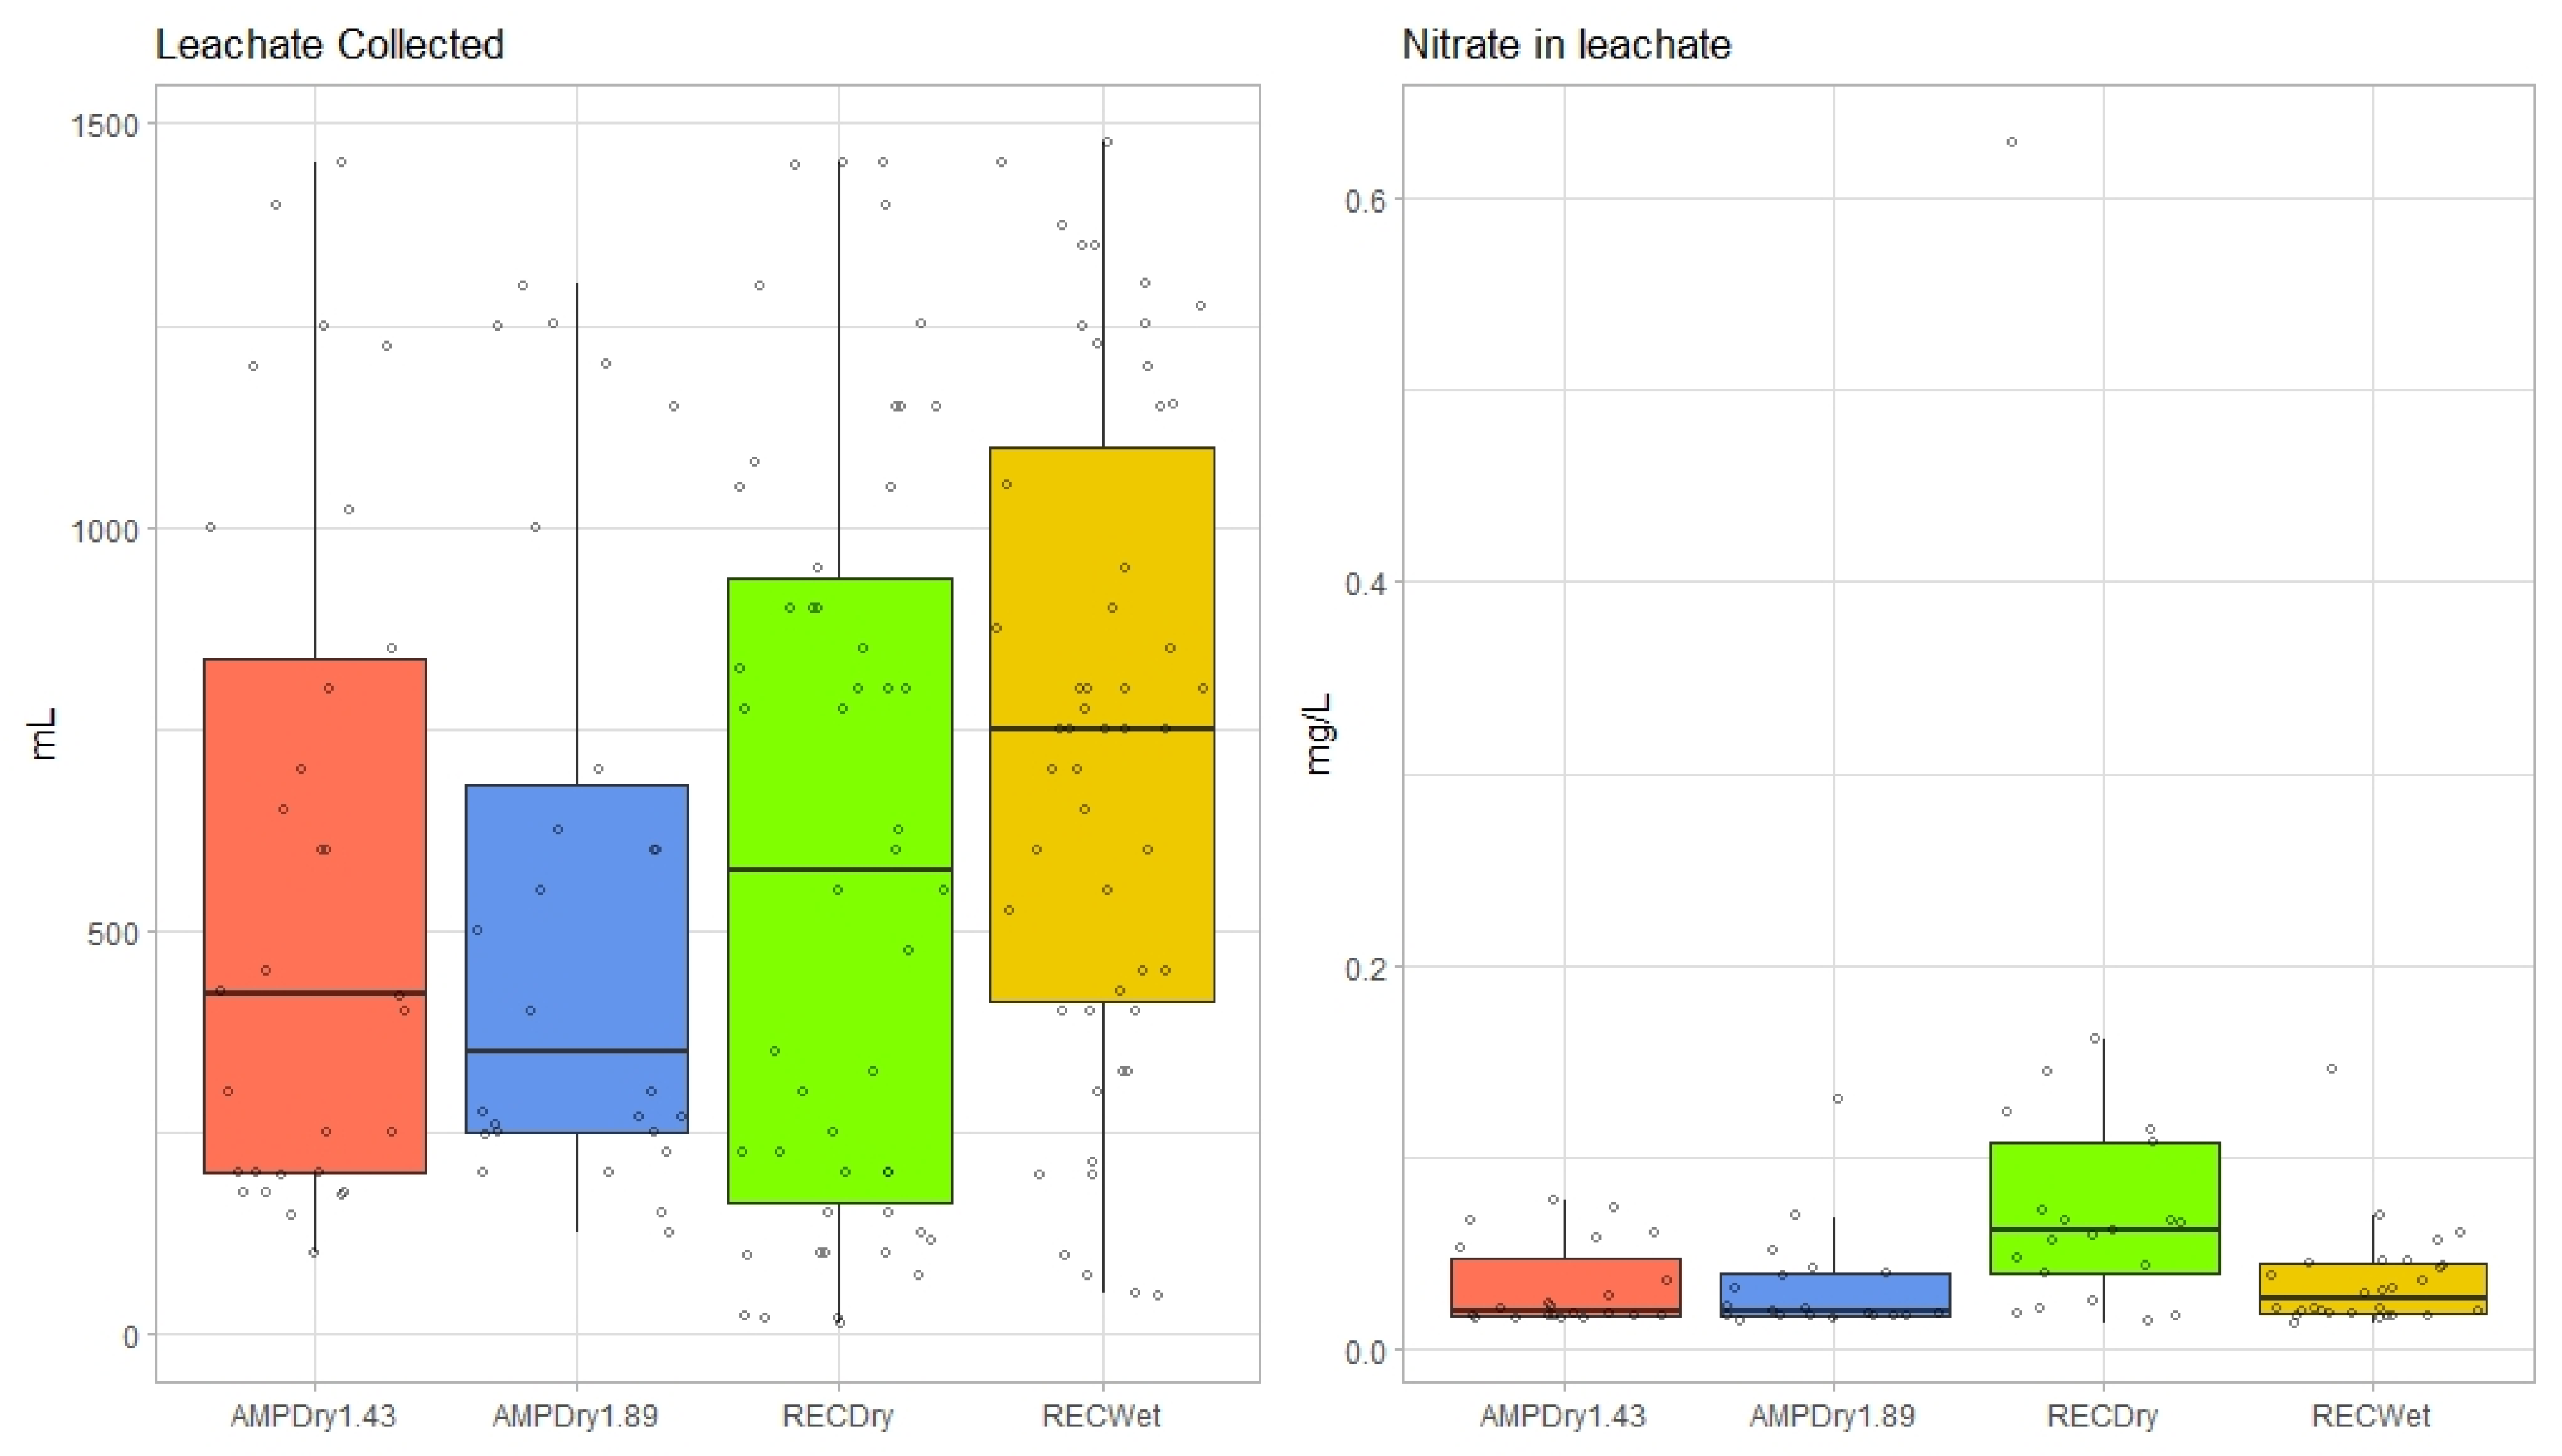
3.1. Volumetric Water Content, Soil Temperature, Leachate and Nitrate-Leachate Concentration

Simulated precipitation amounts (cm) per week, soil volumetric water content (%) and soil temperature (degree Celsius) of different treatments throughout the experiment are depicted in Figure 2. As expected, the precipitation amounts applied through the rainfall simulator were associated with differences in volumetric water content, though the difference among treatments was not as great as expected (see Table 2 for model results). Likewise, there was little difference between treatments and their effect on soil temperature. The use of commercial potting media with excellent drainage may have influenced these results. This suggests that, unless extreme rainfall events occur, well-drained soils are unlikely to demonstrate highly variable responses in kPa or degree C.
It should be noted that not all plants survived the experiment. In RECDry, nine plants died between weeks 5 and 9 (56% of plants in this treatment); in RECWet, one plant died by week 10 (6%); in AMPDry1.43, one plant died by week 1 (6%); and, in AMPDry1.89, two plants died by week 10 (13%). However, not all plant death was attributable to the experimental design. Planting stock failure was the cause of early plant mortality.
To assess total water loss through leaching, we recorded the total volume of water collected in modified pan lysimeters from each treatment. An ANOVA showed statistically significant differences overall (F = 6.846, df = 3, p < 0.000) and post hoc (Tukey’s HSD) tests suggested differences between all treatments except AMPDry1.43 and RecWet, which reflects the similar total precipitation amounts applied in these two scenarios. Nitrate-in-leachate (N-leachate) concentrations were low in all samples, between 0.014 mg/L and 0.628 mg/L (Figure 3). Differences in the actual rate of N-leachate between treatments were determined using a Kruskal–Wallis rank-sum test (H = 13.73, df = 3, p = 0.003). While there were statistical differences observed between RECDry and all other treatments, there was no statistical difference observed among other treatments.
Model results (Table 3) show that the precipitation treatments influenced the N-leachate (mg/L) on a weekly basis. Notably, treatments designed to simulate future conditions had higher seasonal and, often, weekly precipitation totals with uneven seasonal distribution (AMPDry1.43 and AMPDry1.89). These treatments were more likely to have higher N-leachate concentrations than treatments designed to simulate current conditions, including the lowest precipitation treatment (RECDry) and the only treatment with even seasonal distribution (RECWet). The difference between the Kruskal–Wallis and GLM results suggests that more N was lost from soil media when precipitation increased on a weekly basis and was unevenly distributed across the growing season. It should also be noted that no additional N was provided to the plants beyond what was included in the soil media and additional applications may have led to more noticeable differences between treatments. This should be further explored in future research.
In regards to leachate amounts, our models diverged from the findings of the ANOVA and Tukey’s HSD tests described above. Specifically, the leachate model suggested minimal difference between treatments and the amount of weekly leachate collected, and a poor model fit overall. This suggests that collecting weekly leachate amounts is a less useful measure than assessing total leachate over the course of a growing season. Our results were likely influenced by the practice of collecting leachate data after plants had died (in weeks 5–9), which may have led to superficially high rates of leachate drainage in plots without living tissue.

3.2. Disease

Visual inspections of leaf tissue were conducted in the last week of the experiment (on 28 September 2021). Leaf spots were typical of late season strawberry plantings, meaning that all treatments had some evidence of leaf spot; RECwet averaged 3% leaf coverage, RECdry averaged 3%, AMPdry1.43 averaged 2% and AMPdry1.89 averaged 1%. Symptomatic foliage was incubated for one week, after which two pathogens were observed, Neopestalotiopsis sp. and Alternaria sp., in the RECDry and AMPDry1.89 treatments. Notably, neither pathogen was observed on foliage in the RECWet and AMPDry1.43 treatments.
Roots and the crown of each plant were sampled and tested for the presents of fungal pathogens by plating in water agar plates. The pathogens Pythium sp., Rhizoctonia sp. and Fusarium sp. were found in each treatment in similar amounts (no differences among treatments). When processing plants for disease assessment, crown discoloration was noted on the majority of the plants under the RECWet (11 out of 15 plants) and AMPDry1.89 (5 out of 14 plants) treatments, but not on those under the RECDry or AMPDry1.43 treatments.

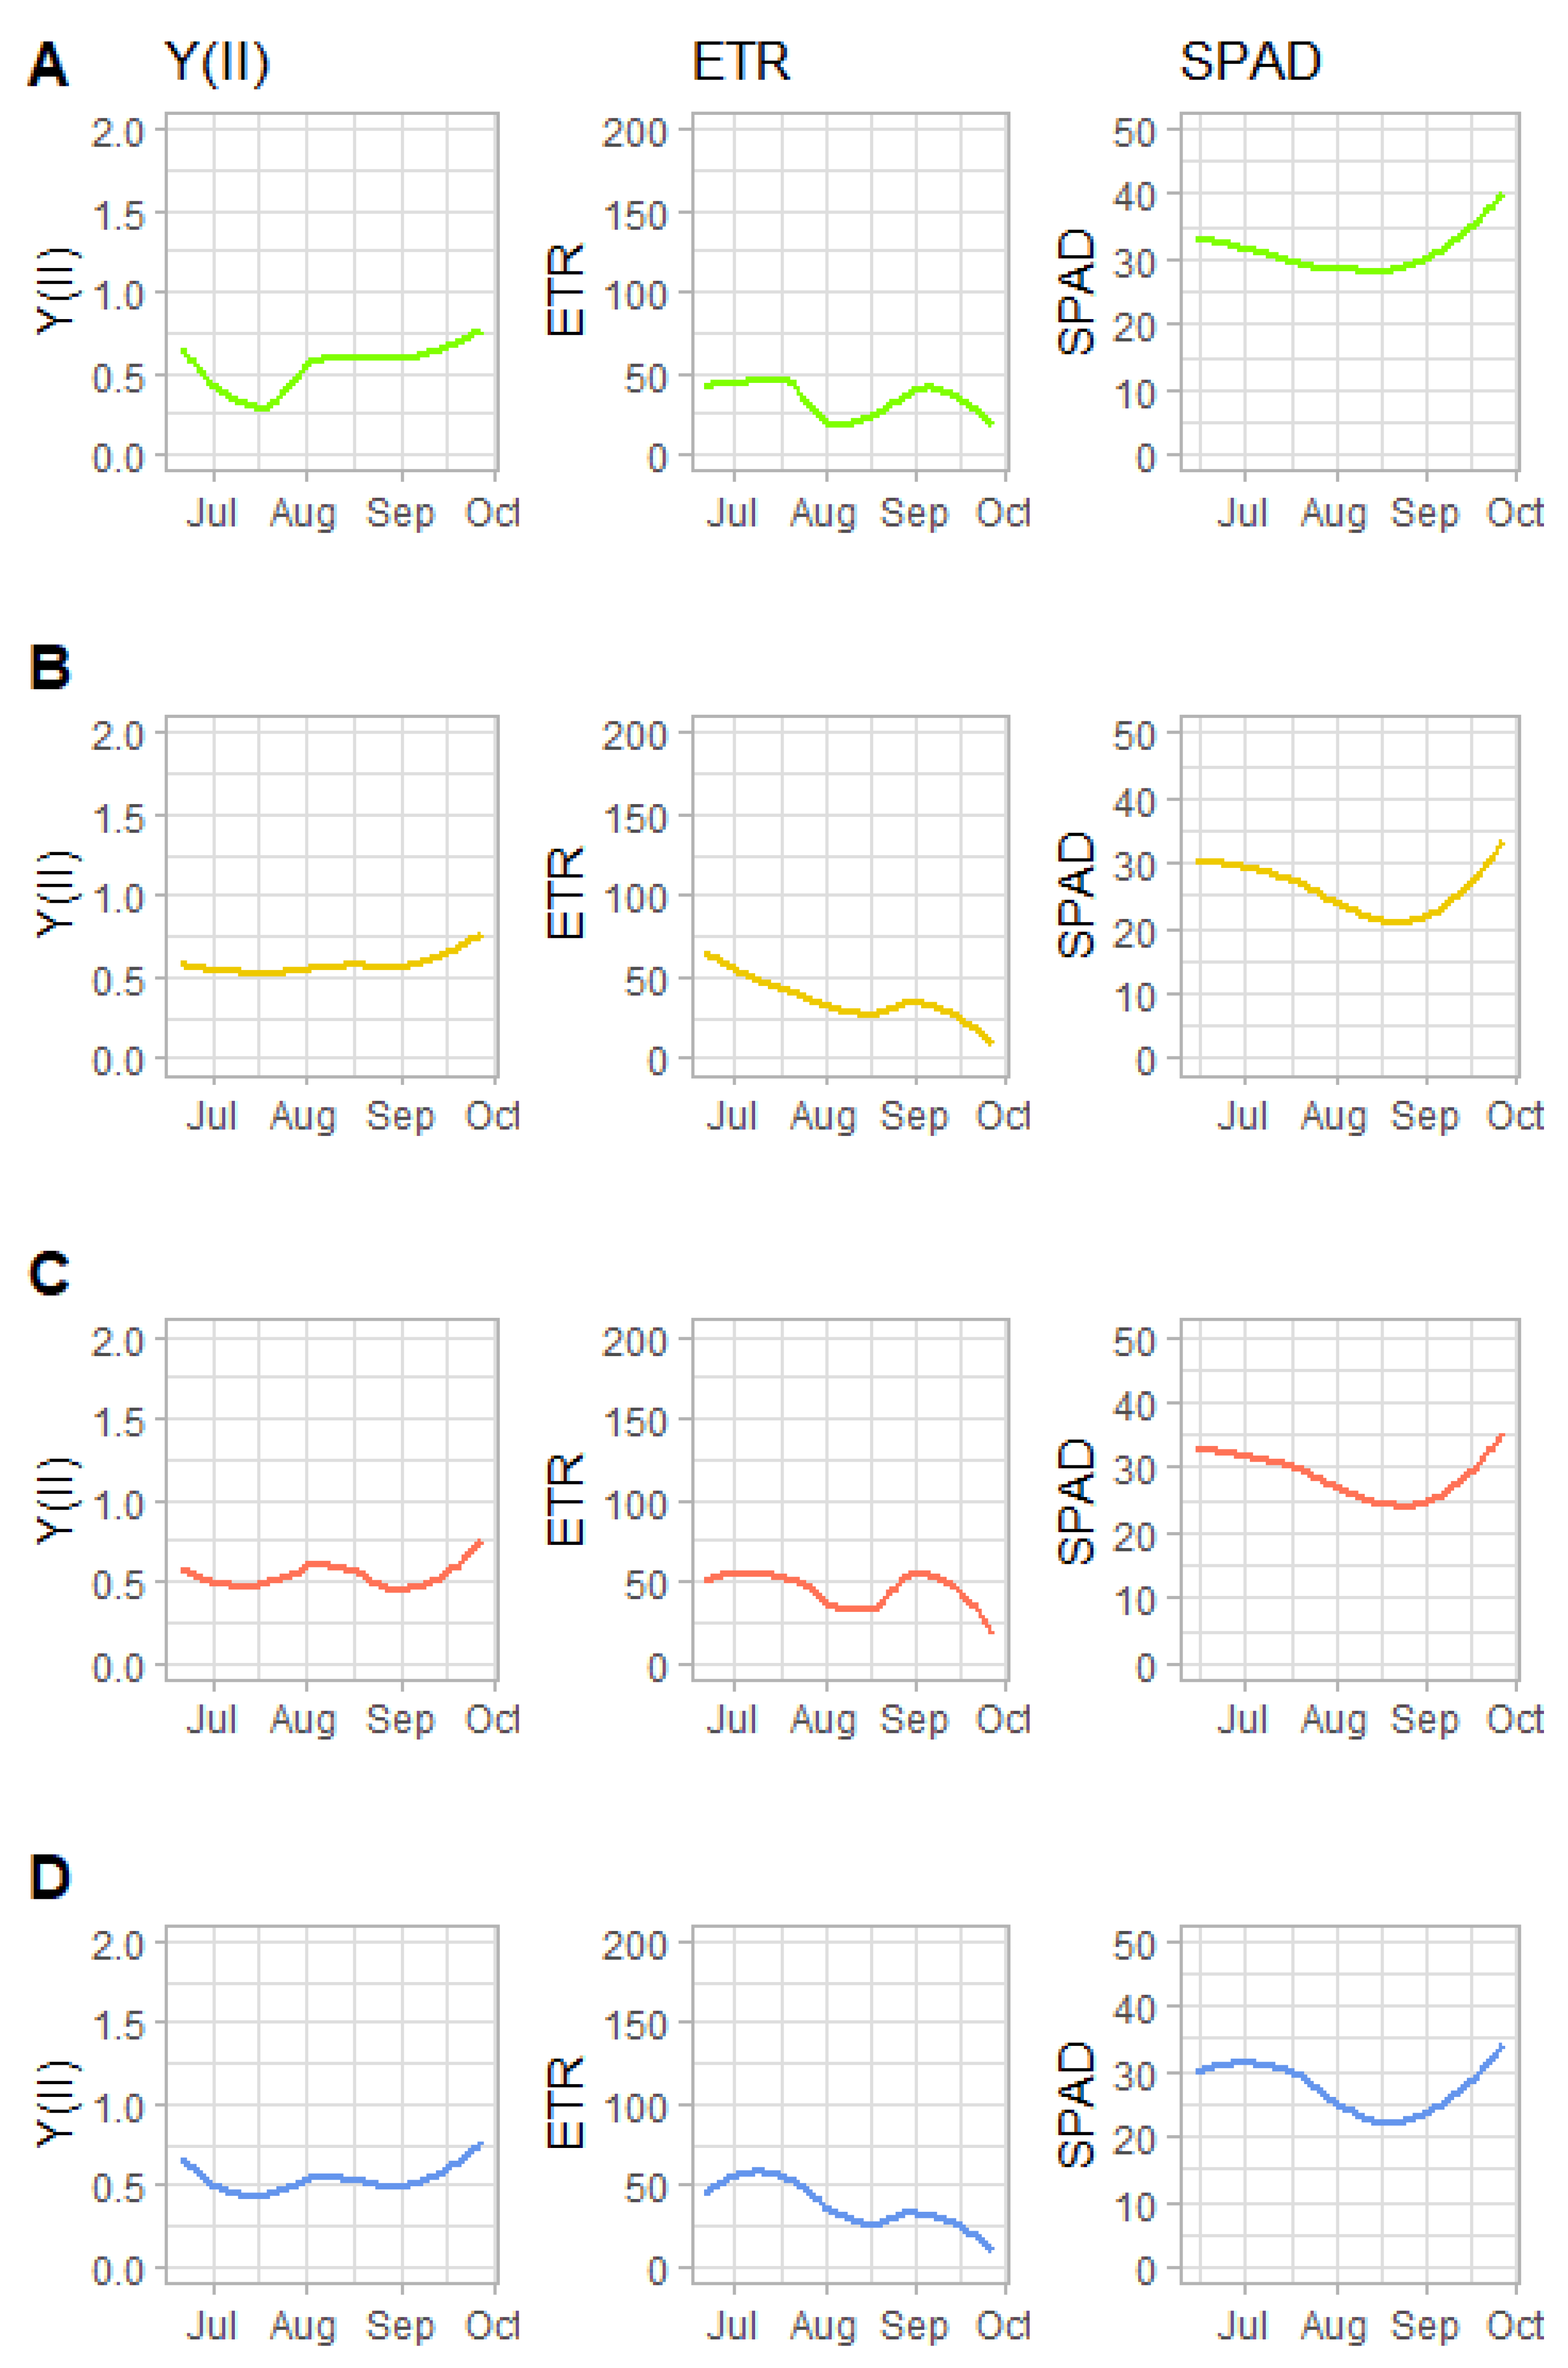
3.3. Leaf Chlorophyll Fluorescence and Chlorophyll Concentration

Photosynthetic potential and performance were assessed through leaf chlorophyll fluorescence. A Kruskal–Wallis rank-sum test indicated no significant difference in Y(II) among treatments (H = 3.582, df = 3, p = 0.3103). A Kruskal–Wallis rank-sum test was also used to assess difference in the electron transport rate (ETR), or photosynthetic performance, across treatments (H = 14.163, df = 3, p = 0.002). Pairwise Wilcoxon rank-sum comparisons showed significant differences between AMPDry1.43 and all other treatments, but, otherwise, no differences among treatments (Figure 4). Chlorophyll concentration was assessed using SPAD readings, or the difference between the transmittance of red light and infrared light (both measured in nanometers). An ANOVA showed statistically significant differences across treatments (F = 23.16 df = 3, p < 0.000) and post hoc (Tukey’s HSD) tests suggested differences among all treatments (p < 0.01) with the exception of between AMPDry1.43 and AMPdry1.89.
This suggests that the amount of rainfall in any given precipitation event was less important than the distribution of precipitation across time, when examining the effects of rainfall on photosynthetic potential, performance and chlorophyll content. However, three GLM model results (Table 4) showed little difference in Y(II) or ETR, with a slightly higher chance that Y(II) and ETR rates would have been higher in drier conditions. It should be noted that Y(II) remained fairly constant throughout the season across treatments, while ETR trended slightly down (Figure 5). Additionally, little difference was observed between treatments in terms of their effects on chlorophyll concentration (SPAD), which is related to N-accumulation in leaves. Chlorophyll concentration trended slightly higher towards the end of the experimental period.

3.4. Biomass

Differences in biomass among treatments were assessed at the conclusion of the experiment, with analyses having been conducted on plant leaves, plant roots and total biomass. An ANOVA test demonstrated that significant differences in leaf biomasses were evident (F = 3.006, df = 3, p = 0.04), though post hoc (Tukey’s HSD) tests suggested that the only statistically significant differences were found between the RECDry and AMPDry1.43 treatments. This suggests that the total amount of water received throughout the growing season was a more important driver of leaf biomass than the seasonal distribution of water. Similarly, we performed an ANOVA test on root biomass, finding, again, that significant differences were evident among treatments (F = 11.35, df = 3, p < 0.000). Post hoc (Tukey’s HSD) tests revealed significant differences (adjusted p < 0.01) among several treatments (Figure 6). Differences existed primarily between the precipitation treatments designed to represent current conditions (the REC treatments) and those designed to represent future conditions (the AMP treatments), with root biomass being lower in the current condition scenarios. This suggests that the interaction between changing distribution and seasonal total amounts of precipitation is likely to be an important driver of increased root biomass development in the future.

4. Discussion

In this study, we identified four important findings. First, we found that leachate amounts did not differ significantly regardless of precipitation amount and distribution across the season. The soil water capacity of the potting media used in this experiment likely buffered the effects of the precipitation simulation treatments to some degree. Potting media typically have a standardized total porosity of ≥50% (target air-filled porosity ≥10% and target water-holding capacity ≥40%) [44]. It is possible that the treatments received simulated precipitation in amounts that did not exceed the field capacity of the potting mix, meaning that the drainable porosity of the soil was not notably different.
Of greater importance is the relationship between N-leachate and total leachate. Our results show that this relationship was not straightforward, but in alignment with the few field-based trials that address this topic. One such study assessed the effects of rainfall intensification on N-cycling in temperate, agricultural soils. This work showed that, while percolation may change depending on rainfall intensity, N-transformations differ depending on moderating factors, such as tillage practices [30]. In our study, higher precipitation amounts unevenly distributed across the growing season (in the AMPDry treatments) were more likely to be associated with elevated N-leachate, despite the higher survival rate of experimental plants in AMPDry treatment (and assumed higher N use by those plants). This finding is notably evident from our GLM results, though the relationship is obscured when data are analyzed using Kruskal–Wallis rank-sum and post hoc tests. This supports past findings from experiments in arid and semi-arid environments, where N accumulated during extended dry periods and was then rapidly released during the microbial processes that followed subsequent precipitation events [28]. For example, large pulses of precipitation have been shown to be associated with higher rates of N losses through denitrification in Argentina [45]. While the degree to which these dynamics affect N release in temperate climates was previously uncertain, our study suggests similar dynamics are at play in temperate and arid climates, albeit to different degrees. Our findings are also corroborated by studies pointing towards altered soil moisture following intense precipitation events in temperate cropping systems (in the Midwest United States), specifically suggesting changes in N mobilization following heavy rainfall events [30,46], especially if those rainfall events follow significant droughts [47].
Second, neither the total precipitation amount or seasonable distribution was associated with foliar or root disease pressure. Similar degrees of damage from disease were observed across all treatments at the end of the experimental period. Most studies looking at water stress have been focused on water deficit due to the effect of climate change in the region of study rather than an overabundance of water. Even with water deficits, a pathogen’s effect on a plant is specific to the pathogen being studied. This was observed in inoculated grapes undergoing water stress that showed no significant difference between well-watered vines compared to those undergoing water deficit, while a different pathogen in the same study showed a significant increase in colonization of the under well-watered treatment [32]. Biotrophic pathogens have been shown to be less severe in strawberries that have gone through a water deficit [33]. Since we evaluated all diseases present, it is possible the diseases we did observe were not affected favorably or negatively by the treatments we carried out. It is also possible there was no difference between our treatments because the plants were not inoculated and were potted (no movement of soilborne diseases to move from one plant to the next) and protected in a greenhouse (limiting exposure to wind-dispersed spores). Additionally, we expected to observe endemic examples of red stele (Phytophthora fragariae), a common fungal disease that affects strawberry roots. However, this relied on the plants already being diseased at the time of planting, which was not the case.
Third, this study demonstrated that the changing precipitation amounts and distribution across the growing season may have had a small effect on leaf photosynthesis, with drier conditions being associated with slightly higher Y(II) and ETR rates. This finding is supported by prior studies, which showed that, while drought affected strawberry plants’ leaf water potential, fresh and dry mass, leaf area and leaf number, it did not appear to affect Y(II) significantly; therefore, it may not be the best indicator of drought resistance [48]. However, another research study has demonstrated that drought stress in fruit crops led to down-regulation of photosynthesis, with severe drought conditions decreasing the degree of correlation between fluorescence and photosynthetic performance [49]. Recovery from drought conditions can occur within 24 h, depending on the crop and the severity of the drought conditions [50]. Our findings support this and we suggest that the distribution of precipitation across time (which captures extended dry periods and drought conditions) has more influence on photosynthetic capacity and performance than the intensity of any one precipitation event. Additionally, while our study does not support the assumption that chlorophyll content in strawberries is affected by different precipitation treatments, prior research has suggested that severe drought leads to reduced chlorophyll concentration and that chlorophyll concentration recovers more slowly from drought than photosynthetic capacity [51]. It is likely that our study does not align with this prior work due to the limited degree of drought introduced through our treatments, and that more severe drying would yield different results. Indeed, no long-term stress was detected in strawberry plants under any of the treatments, demonstrated by the fact that Y(II) remained fairly constant throughout the period of treatments (i.e., there was no reduction in quantum yield of photosystem II due to treatments).
Lastly, our results suggest that the total amount of water received throughout the growing season was a more important driver of leaf biomass than the seasonal distribution of water. The interaction between changing distribution and seasonal total amounts of precipitation is likely to be an important driver of increased root biomass development in the future. It has long been known that root development in strawberries follows periods of carbohydrate accumulation [52], which is facilitated by sufficient levels of crop-available water. More robust roots are associated with better crop water-use efficiency and uptake of soil-immobile nutrients [53]. However, it is noted that strawberry cultivars can vary significantly when it comes to their tolerance to water deficits [3,54]. Cultivars exhibiting high rates of water use efficiency are more likely to have greater leaf biomass [54]. Additionally, prior research suggests that the canopy structure of strawberries is influenced by sustained drought conditions over time and that total aerial biomass may be less important for drought resistance than canopy structure, leaf orientation and osmotic adjustments [55].
Two notable limitations of the current study should be considered when conducting future investigations of this type. The first limitation pertains to the inclusion of dead plants in the study sample. As stated above, our team made the decision to include pots containing dead plant materials in our data. Doing so was deemed to simulate realistic conditions in the field, specifically related to leachate and nitrate in leachate. However, it is possible that excluding pots with dead plant materials (i.e., replacing them with living plant materials as they died) would have generated different results. This possibility should be explored in future iterations of this type of experiment. The second limitation pertains to the characterization of future precipitation scenarios. Specifically, in AMPDry1.89, a large precipitation event on September 25th was removed and all other daily rainfall values were subsequently increased to bring the season total to that of AMPDry1.43 (and also to that observed in 2019). The observed rainfall for that day in 2001 was 4.7 cm (1.85 inches) and, in AMPDry1.43, that value was 6.7 cm (2.65 inches). Our expectation was that a measurable strawberry response would be produced from the AMPDry1.89 signal—wherein the September 25th rainfall was removed and the signal amplification factor was set to 1.89 (to match the season total precipitation observed in the wet year 2019). However, AMPDry1.89 produced only a small difference in strawberry growth. This experiment could have instead used a larger amplification factor and for a scenario with seasonal rainfall totaling more than that observed in 2019.

5. Conclusions

Understanding crop responses to current and future precipitation scenarios requires an agroecological systems approach. Through a simulated precipitation experiment in potted strawberries, we observed that, probable future precipitation conditions in the Northeastern United States may lead to increased N-leachate concentrations, implying that producers may need to invest in new approaches that both increase the efficiency of fertilizer applications and minimize leaching of nitrate into ground and surface water. It is likely that precipitation variability across the growing season will stress unirrigated crops in future decades and that, without attentive irrigation applications, these crops will suffer reduced photosynthetic performance and, by extension, yield and quality. Further, projected climate warming in the future will also increase the risk of drought stress due to increased crop and soil water loss (evapotranspiration) [56]. Lastly, we found that leaf biomass is likely more affected by total precipitation than seasonal distribution, but the interaction between changing distribution and seasonal total amounts of precipitation is likely to be an important driver of increased root biomass development. As strawberries and other small fruits require increased water during specific growth periods (i.e., fruit set), distribution of precipitation has implications for yield and fruit quality especially in agroecological systems without supplemental irrigation. The interactions between water availability, changing precipitation patterns and plant physiology has implications for strawberry production specifically, but also points towards the need to better understand how changing precipitation will alter agroecosystems in temperate climates. Climate adaptive management will likely require commercial producers to alter water, soil, crop health and fertility management if sustainable production is to be a priority in the future.

Supplementary Materials

The following supporting information can be downloaded at: https://www.mdpi.com/article/10.3390/w14030313/s1. Figure S1. Accumulation graph for daily precipitation observations at Bangor International Airport.

Author Contributions

Conceptualization, R.E.S., Y.-J.Z., S.B. and A.S.; methodology, R.E.S., H.J., Y.-J.Z., S.B. and A.S.; data collection: H.J., K.B. and A.S.; formal analysis, H.J. and R.E.S.; visualization (except for Figure 1), H.J. and R.E.S.; writing—original draft preparation, R.E.S.; writing—review and editing, R.E.S., A.S., S.B. and Y.-J.Z.; supervision and project administration, R.E.S.; funding acquisition, R.E.S., Y.-J.Z. and A.S. All authors have read and agreed to the published version of the manuscript.

Funding

This work was supported by the University of Maine Extension, Maine Food and Agriculture Center Integrated Research and Extension Grant program and the USDA National Institute of Food and Agriculture, Hatch Project numbers ME0-1022424 (RES) and ME0-22021 (YJZ), through the Maine Agricultural and Forest Experiment Station. Y.-J.Z. was also supported by the UMaine Faculty Summer Research Award. Maine Agricultural and Forest Experiment Publication Number 3870.

Data Availability Statement

The data presented in this study are available from the authors.

Acknowledgments

The authors of this manuscript wish to thank Brandon Lieberthal, Scott C. Merrill and Meredith T. Niles for their statistical support. Harry Schomberg and Chi-Hua Huang of the USDA Agricultural Research Service provided important guidance to our team in the development of the rainfall simulator. Sara Kelemen created Figure 1. Sarah Dorey provided onsite research support.

Conflicts of Interest

The authors declare no conflict of interest. The funders had no role in the design of the study; in the collection, analyses, or interpretation of data; in the writing of the manuscript, or in the decision to publish the results.

References

  1. Samtani, J.B.; Rom, C.R.; Friedrich, H.; Fennimore, S.A.; Finn, C.E.; Petran, A.; Wallace, R.W.; Pritts, M.P.; Fernandez, G.; Chase, C.A.; et al. The status and future of the strawberry industry in the United States. HortTechnology 2019, 29, 11–24. [Google Scholar] [CrossRef] [Green Version]
  2. Palencia, P.; Martínez, F.; Medina, J.J.; López-Medina, J. Strawberry yield efficiency and its correlation with temperature and solar radiation. Hortic. Bras. 2013, 31, 93–99. [Google Scholar] [CrossRef] [Green Version]
  3. Ariza, M.T.; Miranda, L.; Gómez-Mora, J.A.; Medina, J.J.; Lozano, D.; Gavilán, P.; Soria, C.; Martínez-Ferri, E. Yield and Fruit Quality of strawberry cultivars under different irrigation regimes. Agronomy 2021, 11, 261. [Google Scholar] [CrossRef]
  4. Sidemane, B. (Ed.) New England Small Fruit Management Guide, 2019–2020th ed.; University of Massachusetts Extension: Amherst, MA, USA, 2019. [Google Scholar]
  5. Orde, K.; Sideman, B.; Pritts, M.; Demchak, K. Low Tunnel Strawberry Production Guide; University of New Hampshire Cooperative Extension: Durham, NH, USA, 2018. [Google Scholar]
  6. IPCC. Climate Change 2021: The Physical Science Basis; United Nations Intergovernmental Panel on Climate Change: Geneva, Switzerland, 2021.
  7. Kundzewicz, Z.W.; Mata, L.J.; Arnell, N.W.; Döll, P.; Jimenez, B.; Miller, K.; Oki, T.; Şen, Z.; Shiklomanov, I. The implications of projected climate change for freshwater resources and their management. Hydrol. Sci. J. 2008, 53, 3–10. [Google Scholar] [CrossRef]
  8. Döll, P. Vulnerability to the impact of climate change on renewable groundwater resources: A global-scale assessment. Environ. Res. Lett. 2009, 4, 035006. [Google Scholar] [CrossRef]
  9. Kundzewicz, Z.W.; Döll, P. Will groundwater ease freshwater stress under climate change? Hydrol. Sci. J. 2009, 54, 665–675. [Google Scholar] [CrossRef] [Green Version]
  10. Kunkel, K.E.; Stevens, L.E.; Stevens, S.E.; Sun, L.; Janssen, E.; Wuebbles, D.; Rennells, J.; DeGaetano, A.; Dobson, J.G. Regional Climate Trends and Scenarios for the U.S. National Climate Assessment. Part 1. Climate of the Northeast U.S.; U.S. Department of Commerce: Washington, DC, USA, 2013; pp. 1–87. [Google Scholar]
  11. Huang, H.; Winter, J.M.; Osterberg, E.C.; Horton, R.M.; Beckage, B. Total and extreme precipitation changes over the Northeastern United States. J. Hydrometeorol. 2017, 18, 1783–1798. [Google Scholar] [CrossRef] [PubMed]
  12. Easterling, D.R.; Arnold, J.R.; Knutson, T.; Kunkel, K.E.; LeGrande, A.N.; Leung, L.R.; Vose, R.S.; Waliser, D.E.; Wehner, M.F. Chapter 7: Precipitation Change in the United States. Climate Science Special Report: Fourth National Climate Assessment, Volume I; U.S. Global Change Research Program: Washington, DC, USA, 2017. [Google Scholar]
  13. Walsh, J.; Wuebbles, D.; Hayhoe, K. Our Changing Climate; Melillo, J., Richmont, T., Yohe, G., Eds.; U.S. Global Change Research Program: Washington, DC, USA, 2014; p. 67. [Google Scholar]
  14. Wolfe, D.W.; DeGaetano, A.T.; Peck, G.M.; Carey, M.; Ziska, L.H.; Lea-Cox, J.; Kemanian, A.R.; Hoffmann, M.P.; Hollinger, D.Y. Unique challenges and opportunities for Northeastern US crop production in a changing climate. Clim. Chang. 2018, 146, 231–245. [Google Scholar] [CrossRef] [Green Version]
  15. Schattman, R.E.; Niles, M.T.; Aitken, H.M. Water use governance in a temperate region: Implications for agricultural climate change adaptation in the Northeastern United States. Ambio 2021, 50, 942–955. [Google Scholar] [CrossRef] [PubMed]
  16. Slatyer, R.O. Physiological significance of internal water relations to crop yield. In Physiological Aspects of Crop Yield; Eastin, J.D., Haskins, F.A., Sullivan, C.Y., van Bavel, C.H.M., Eds.; American Society of Agronomy, Crop Science Society of America: Madison, WI, USA, 1969; pp. 53–83. ISBN 978-0-89118-571-0. [Google Scholar]
  17. Palencia, P.; Martínez, F.; Medina-M’inguez, J.; Vázquez, E.; Flores, F.; López-Medina, J. Effects of climate change on strawberry production. Acta Hortic. 2009, 838, 51–53. [Google Scholar] [CrossRef]
  18. Barai, K.; Tasnim, R.; Hall, B.; Rahimzadeh-Bajgiran, P.; Zhang, Y.-J. Is drought increasing in maine and hurting wild blueberry production? Climate 2021, 9, 178. [Google Scholar] [CrossRef]
  19. Ahmed, S.; Stepp, J.R. Beyond yields: Climate change effects on specialty crop quality and agroecological management. Elem. Sci. Anthropocene 2016, 4, 000092. [Google Scholar] [CrossRef] [Green Version]
  20. Kumar, S.; Dey, P. Effects of different mulches and irrigation methods on root growth, nutrient uptake, water-use efficiency and yield of strawberry. Sci. Hortic. 2011, 127, 318–324. [Google Scholar] [CrossRef]
  21. May, G.M.; Pritts, M.P.; Kelly, M.J. Seasonal patterns of growth and tissue nutrient content in strawberries. J. Plant Nutr. 1994, 17, 1149–1162. [Google Scholar] [CrossRef]
  22. Silva-Pérez, V.; De Faveri, J.; Molero, G.; Deery, D.M.; Condon, A.G.; Raynolds, M.P.; Evans, J.R.; Furbank, R.T. Genetic variation for photosynthetic capacity and efficiency in spring wheat. J. Exp. Bot. 2020, 71, 2299–2311. [Google Scholar] [CrossRef]
  23. Ghimire, B.; Timsina, D.; Nepal, J. Analysis of chlorophyll content and its correlation with yield attributing traits on early varieties of maize (Zea mays L.). J. Maize Res. Dev. 2015, 1, 134–145. [Google Scholar] [CrossRef]
  24. Datt, B. A new reflectance index for remote sensing of chlorophyll content in higher plants: Tests using eucalyptus leaves. J. Plant Physiol. 1999, 154, 30–36. [Google Scholar] [CrossRef]
  25. Gitelson, A.A.; Gritz, Y.; Merzlyak, M.N. Relationships between leaf chlorophyll content and spectral reflectance and algorithms for non-destructive chlorophyll assessment in higher plant leaves. J. Plant Physiol. 2003, 160, 271–282. [Google Scholar] [CrossRef] [PubMed]
  26. Yıldırım, M.; Kılıç, H.; Kendal, E.; Karahan, T. Applicability of chlorophyll meter readings as yield predictor in durum wheat. J. Plant Nutr. 2010, 34, 151–164. [Google Scholar] [CrossRef]
  27. Lichtenthaler, H.K.; Babani, F. Detection of photosynthetic activity and water stress by imaging the red chlorophyll fluorescence. Plant Physiol. Biochem. 2000, 38, 889–895. [Google Scholar] [CrossRef]
  28. Fierer, N.; Schimel, J.P. Effects of drying–rewetting frequency on soil carbon and nitrogen transformations. Soil Biol. Biochem. 2002, 34, 777–787. [Google Scholar] [CrossRef]
  29. Cabrera, M.L. Modeling the flush of nitrogen mineralization caused by drying and rewetting soils. Soil Sci. Soc. Am. J. 1993, 57, 63–66. [Google Scholar] [CrossRef]
  30. Hess, L.J.T.; Hinckley, E.-L.S.; Robertson, G.P.; Matson, P.A. Rainfall intensification increases nitrate leaching from tilled but not no-till cropping systems in the U.S. Midwest. Agric. Ecosyst. Environ. 2020, 290, 106747. [Google Scholar] [CrossRef]
  31. Van Gestel, M.; Merckx, R.; Vlassak, K. Microbial biomass responses to soil drying and rewetting: The fate of fast-and slow-growing microorganisms in soils from different climates. Soil Biol. Biochem. 1993, 25, 109–123. [Google Scholar] [CrossRef]
  32. Sosnowski, M.R.; Ayres, M.R.; Scott, E.S. The Influence of water deficit stress on the grapevine trunk disease pathogens eutypa lata and diplodia seriata. Plant Dis. 2021, 105, 2217–2221. [Google Scholar] [CrossRef]
  33. Rossi, F.G.; Asalf, B.; Grieu, C.; Onofre, R.B.; Peres, N.A.; Gadoury, D.M.; Stensvand, A. Effect of water stress on reproduction and colonization of podosphaera aphanis of strawberry. Plant Dis. 2020, 104, 2973–2978. [Google Scholar] [CrossRef]
  34. Freeman, S.; Gnayem, N. Use of plasticulture for strawberry plant production. Small Fruits Rev. 2005, 4, 21–32. [Google Scholar] [CrossRef]
  35. Tasnim, R.; Zhang, Y.J. Are wild blueberries a crop with low photosynthetic capacity? Chamber-size effects in measuring photosynthesis. Agronomy 2021, 11, 1572. [Google Scholar] [CrossRef]
  36. Hirte, J.; Leifeld, J.; Abiven, S.; Oberholzer, H.-R.; Hammelehle, A.; Mayer, J. Overestimation of crop root biomass in field experiments due to extraneous organic matter. Front. Plant Sci. 2017, 8, 284. [Google Scholar] [CrossRef] [PubMed] [Green Version]
  37. USDA-NRCS. Above-Ground Biomass (Plant) Determinations; United States Department of Agriculture Natural Resources Conservation Service, National Soil Survey Center: Lincoln, NE, USA, 1997; pp. 1–2.
  38. McCullagh, P.; Nelder, J.A. Generalized Linear Models, 2nd ed.; Chapman and Hall/CRC: Boca Raton, FL, USA, 1989. [Google Scholar]
  39. Venables, W.N.; Ripley, B.D. Modern applied statistics with S. In Statistics and Computing, 4th ed.; Springer: New York, NY, USA, 2002; ISBN 978-0-387-95457-8. [Google Scholar]
  40. Mekis, E.; Hogg, W.D. Rehabilitation and analysis of Canadian daily precipitation time series. Atmos.-Ocean 1999, 37, 53–85. [Google Scholar] [CrossRef]
  41. Ng, V.K.Y.; Cribbie, R.A. Using the gamma generalized linear model for modeling continuous, skewed and heteroscedastic outcomes in psychology. Curr. Psychol. 2017, 36, 225–235. [Google Scholar] [CrossRef] [Green Version]
  42. R Core Team. R: A Language and Environment for Statistical Computing; R Foundation for Statistical Computing: Vienna, Austria, 2021. [Google Scholar]
  43. Wickham, H. Ggplot2: Elegant Graphics for Data Analysis; Springer: New York, NY, USA, 2016. [Google Scholar]
  44. Tjosvold, S.A. Soil Mixes Part 3: How Much Air and Water? University of California, Agriculture and Natural Resources: Berkeley, CA, USA, 2019. [Google Scholar]
  45. Yahdjian, L.; Sala, O.E. Size of precipitation pulses controls nitrogen transformation and losses in an arid patagonian ecosystem. Ecosystems 2010, 13, 575–585. [Google Scholar] [CrossRef]
  46. Hess, L.J.T.; Hinckley, E.-L.S.; Robertson, G.P.; Hamilton, S.K.; Matson, P.A. Rainfall intensification enhances deep percolation and soil water content in tilled and no-till cropping systems of the US Midwest. Vadose Zone J. 2018, 17, 180128. [Google Scholar] [CrossRef] [Green Version]
  47. Van Metre, P.C.; Frey, J.W.; Musgrove, M.; Nakagaki, N.; Qi, S.; Mahler, B.J.; Wieczorek, M.E.; Button, D.T. High nitrate concentrations in some Midwest United States streams in 2013 after the 2012 drought. J. Environ. Qual. 2016, 45, 1696–1704. [Google Scholar] [CrossRef] [Green Version]
  48. Razavi, F.; Pollet, B.; Steppe, K.; van Labeke, M.C. Chlorophyll fluorescence as a tool for evaluation of drought stress in strawberry. Photosynthetica 2008, 46, 631–633. [Google Scholar] [CrossRef]
  49. Flexas, J.; Escalona, J.M.; Medrano, H. Water stress induces different levels of photosynthesis and electron transport rate regulation in grapevines. Plant Cell Environ. 1999, 22, 39–48. [Google Scholar] [CrossRef]
  50. Flexas, J.; Bota, J.; Escalona, J.M.; Sampol, B.; Medrano, H. Effects of drought on photosynthesis in grapevines under field conditions: An evaluation of stomatal and mesophyll limitations. Funct. Plant Biol. 2002, 29, 461–471. [Google Scholar] [CrossRef] [PubMed] [Green Version]
  51. Ghaderi, N.; Siosemardeh, A. Response to drought stress of two strawberry cultivars (cv. Kurdistan and Selva). Hortic. Environ. Biotechnol. 2011, 52, 6–12. [Google Scholar] [CrossRef]
  52. Mann, C.E.T. Studies in the root and shoot growth of the strawberry. V. The origin, development, and function of the roots of the cultivated strawberry (Fragaria Virginiana × Chiloensis). Ann. Bot. 1930, 44, 55–86. [Google Scholar] [CrossRef]
  53. Brouder, S.M.; Volenec, J.J. Impact of climate change on crop nutrient and water use efficiencies. Physiol. Plant. 2008, 133, 705–724. [Google Scholar] [CrossRef] [PubMed]
  54. Martínez-Ferri, E.; Soria, C.; Ariza, M.T.; Medina, J.J.; Miranda, L.; Domíguez, P.; Muriel, J.L. Water relations, growth and physiological response of seven strawberry cultivars (Fragaria × ananassa Duch.) to different water availability. Agric. Water Manag. 2016, 164, 73–82. [Google Scholar] [CrossRef]
  55. Savé, R.; Peñuelas, J.; Marfà, O.; Serrano, L. Changes in leaf osmotic and elastic properties and canopy structure of strawberries under mild water stress. HortScience 1993, 28, 925–927. [Google Scholar] [CrossRef] [Green Version]
  56. Tasnim, R.; Drummond, F.; Zhang, Y.J. Climate change patterns of wild blueberry fields in Downeast, maine over the past 40 years. Water 2021, 13, 594. [Google Scholar] [CrossRef]
Figure 1. A map showing the location of the study site, Bangor, Maine, USA. Site of Global Historical Climatology Network station USW00014606 is indicated with the blue box.
Water 14 00313 g001
Figure 2. Recorded simulated precipitation (cm), soil volumetric water content (VWC, %) and soil temperature (degree Celsius) in each treatment: (A) = RECDry, (B) = RECWet, (C) = AMPDry1.43, (D) = AMPDry1.89. Note that VWC and soil temperature measurements did not commence until July 2021.
Water 14 00313 g002
Figure 3. Seasonal differences in total leachate (mL) collected and concentration of N-leachate (mg/L) by treatment across the experimental period.
Water 14 00313 g003
Figure 4. Differences in the quantum yield of photosystem II (Y(II)), photosynthetic electron transport rate (ETR) and chlorophyll concentration of leaves (SPAD unit), assessed by treatment across the experimental period.
Water 14 00313 g004
Figure 5. Recorded temporal dynamics in quantum yield of photosystem II (YII), electron transport rate (ETR) and chlorophyll concentration (SPAD) in each treatment: (A) = RECDry, (B) = RECWet, (C) = AMPDry1.43, (D) = AMPDry1.89. Lines are averages of 16 plants.
Water 14 00313 g005
Figure 6. Differences in above- and below-ground biomass (g) assessed by treatment at the end of the experimental period.
Water 14 00313 g006
Table 1. Precipitation scenarios used as independent variables.
TreatmentDescription of Treatment Development
RECDryBased on 2001 observations—infrequent rainfall separated by prolonged periods (2–5 weeks) of dryness. Daily rainfall above 2.54 cm (1 inch) occurred only once in an event of 4.70 cm (1.85 inches) on 25 September. Total rainfall April–September rainfall = 29.95 cm (11.79 inches).
RECWetBased on 2019 observations—frequent, moderate-intensity rainfall events distributed throughout the growing season without any prolonged dryness. Rainfall exceeding 2.54 cm (1 inch) occurred on eight separate days. Total April–September rainfall = 72.85 cm (28.68 inches).
AMPDry1.43Modified from observed 2001 precipitation—daily values multiplied by 1.43 to increase total growing season rainfall to match that observed in 2019 (72.85 cm; 28.68 inches), while preserving the seasonal distribution observed in 2001.
AMPDry1.89Modified from observed 2001 precipitation—similar to AMPDry1.43, except that the large magnitude rainfall event 25 September was removed and the daily precipitation values were subsequential multiplied by 1.89 to attain the same season total in AMPDry1.43 and observed in 2019.
Table 2. Estimated regression parameters, standard errors, coefficients and p-values for 2 gamma GLMs.
Model 1: Soil Moisture (kPa; Measured Weekly)
Estimate (β)Standard Errort-Valuep-ValueCI (2.5%; 97.5%)
RECDry0.1110.00714.95<0.0010.098; 0.127
RECWet0.0730.00515.81<0.0010.063; 0.080
AMPDry1.430.0650.00415.65<0.0010.058; 0.074
AMPDry1.890.0730.00515.81<0.0010.064; 0.083
Dispersion parameter = 0.416; null deviance = NaN, on 398 degrees of freedom; residual deviance = 191.47, on 394 degrees of freedom; AIC = 2718.9; number of Fisher scoring iterations = 6; R2 = 0.047. Note that kPa = 0 indicates soil water saturation and dryness increases as kPa increases.
Model 2: Soil Temperature (Measured Weekly)
Estimate (β)Standard Errort-Valuep-ValueCI (2.5%; 97.5%)
RECDry0.0320.00134.16<0.0010.031; 0.034
RECWet0.0330.00134.16<0.0010.031; 0.035
AMPDry1.430.0330.00134.16<0.0010.031; 0.035
AMPDry1.890.0320.00134.16<0.0010.030; 0.034
Dispersion parameter = 0.027; null deviance = NaN, on 128 degrees of freedom; residual deviance = 3.712, on 124 degrees of freedom; AIC = 793.79; number of Fisher scoring iterations = 4; R2 = −0.026.
Table 3. Estimated regression parameters, standard errors, coefficients and p-values for 2 gamma GLMs.
Model 3: N-Leachate (Collected Weekly; mg/L)
Estimate (β)Standard Errort-Valuep-ValueCI (2.5%; 97.5%)
RECDry10.72022.20844.855<0.0015.628; 15.838
RECWet28.5435.0925.608<0.00117.657; 39.554
AMPDry1.4331.0306.9704.970<0.00117.366; 44.992
AMPDry1.8931.3976.6274.738<0.00116.803; 46.230
Dispersion parameter = 0.866; null deviance = NaN, on 91 degrees of freedom; residual deviance = 44.913, on 87 degrees of freedom; AIC = −409.81; number of Fisher scoring iterations = 7; adjusted R2 = 0.075.
Model 4: Leachate (Collected at Each Precipitation Event; mL)
Estimate (β)Standard Errort-Valuep-ValueCI (2.5%; 97.5%)
RECDry0.0010.0015.415<0.0010.001; 0.001
RECWet< 0.000< 0.0005.982<0.0010.001; 0.001
AMPDry1.43< 0.000< 0.0005.552<0.0010.001; 0.001
AMPDry1.89< 0.000< 0.0005.322<0.001<0.000; 0.001
Dispersion parameter = 1.436; null deviance = NaN, on 250 degrees of freedom; residual deviance = 379.51, on 246 degrees of freedom; AIC = 4342.5; number of Fisher scoring iterations = 7; adjusted R2 = < −0.000.
Table 4. Estimated regression parameters, standard errors, coefficients and p-values for 3 gamma GLMs.
Model 5: Y(II) Measured Weekly
Estimate (β)Standard Errort-Valuep-ValueCI (2.5%; 97.5%)
RECDry1.9370.05734.33<0.0011.829; 2.050
RECWet1.7340.04340.44<0.0011.652; 1.820
AMPDry1.431.8930.04839.19<0.0011.800; 2.000
AMPDry1.891.8630.04640.17<0.0011.774; 1.955
Dispersion parameter = 0.140; null deviance = NaN, on 835 degrees of freedom; residual deviance = 170.48 on 831 degrees of freedom; AIC = −115.11; number of Fisher scoring iterations = 5; adjusted R2 = 0.004.
Model 6: ETR Measured Weekly
Estimate (β)Standard Errort-Valuep-ValueCI (2.5%; 97.5%)
RECDry0.0300.00215.69<0.0010.024; 0.030
RECWet0.0270.00118.48<0.0010.025; 0.030
AMPDry1.430.0220.00117.91<0.0010.019; 0.024
AMPDry1.890.0260.00118.48<0.0010.023; 0.029
Dispersion parameter = 0.671; null deviance = NaN, on 835 degrees of freedom; residual deviance = 656.95, on 831 degrees of freedom; AIC = 7758.5; number of Fisher scoring iterations = 6; adjusted R2 = 0.006.
Model 7: Chlorophyll Concentration (SPAD) Measured Weekly
Estimate (β)Standard Errort-Valuep-ValueCI (2.5%; 97.5%)
RECDry0.0320.00160.73<0.0010.032; 0.034
RECWet0.0380.00170.80<0.0010.038; 0.040
AMPDry1.430.0350.00168.61<0.0010.035; 0.037
AMPDry1.890.0360.00170.80<0.0010.038; 0.040
Dispersion parameter = 0.671; null deviance = NaN, on 899 degrees of freedom; residual deviance = 5757.425, on 895 degrees of freedom; AIC = 66,049; number of Fisher scoring iterations = 44; adjusted R2 = 0.070070.
Publisher’s Note: MDPI stays neutral with regard to jurisdictional claims in published maps and institutional affiliations.

