Article

Hydrology and Nutrient Dynamics in Managed Restored Wetlands of California’s Central Valley, USA

by
Sharon N. Kahara
1,*,
Buddhika D. Madurapperuma
2,
Breana K. Hernandez
3,
Luke Scaroni
2 and
Eric Hopson
4
1
Department of Biology and Environmental Science, University of New Haven, West Haven, CT 06516, USA
2
Department of Forestry, Fire, and Rangeland Management, California Polytechnic Humboldt, Arcata, CA 95521, USA
3
Department of Wildlife, California Polytechnic Humboldt, Arcata, CA 95521, USA
4
San Joaquin River National Wildlife Refuge, U.S. Fish and Wildlife Service, Vernalis, CA 95385, USA
*
Author to whom correspondence should be addressed.
Water 2022, 14(21), 3574; https://doi.org/10.3390/w14213574
Submission received: 30 August 2022 / Revised: 25 October 2022 / Accepted: 2 November 2022 / Published: 7 November 2022
(This article belongs to the Special Issue Wetland Response to Climate Change)

Abstract

:
Extensive wetland losses in California’s Central Valley have led to significant reductions in their natural functions, such as nutrient removal. Past studies suggest that individual wetland restoration efforts in the region yield mixed results mainly due to differences in management practices and degree of access to limited water resources, yet few studies have examined their hydrology or nutrient dynamics with any detail. Our objective was to explore nutrient reduction across a range of hydrological regimes. We recorded hydroperiods and nutrient concentrations of the received and discharged applied water at 21 managed wetlands on national wildlife refuges and private lands over 6 years from 2015 to 2020. Water depths at 18 of these wetlands were monitored continuously for over 400 days. Climatic variation over the observation period included exceptional drought, above-average flooding and relatively stable water conditions. Privately managed wetlands retained water for longer durations of time, but at shallower depths than seasonal wetlands in wildlife refuges. An assessment of nutrient concentrations at inflows relative to outflows was inconclusive and varied among years. However, assessment of nutrient loads indicated consistent retention of ammonium and nitrates across all management types, locations and time periods. Multivariate analysis indicated that climate and location played a role in influencing nutrient concentrations among wetlands. In conclusion, restored wetlands in the central valley provide ecosystem service functions such as removing nutrients from ambient water and provide unique habitats for waterfowls with the presence of seasonal flood and drain management practices.

1. Introduction

Agricultural runoff is a major contributor of nutrient pollution to natural waterways and groundwater worldwide. The San Joaquin River (SJR) in the southern Central Valley is the primary recipient of discharges and runoff from irrigated agriculture and animal husbandry throughout its watershed [1,2,3]. High levels of nitrogen and phosphorus in water bodies of California’s Central Valley (CCV) have been linked to inorganic fertilizer applications and manure, resulting in toxic algal blooms and fish kills in the Sacramento-San Joaquin Delta [4,5,6]. Over a quarter of a million people in the Tulare Basin and Salinas Valley of California are at risk of thyroid disease and methemoglobinemia due to elevated concentrations of nitrate-nitrogen in drinking water [7,8,9]. Wetlands, including those receiving water from irrigated cropland, can retain and transform sediments and nutrients, resulting in improved water quality at their discharge points. However, their capacity to reduce or limit nutrient loads is dependent on a number of factors, including their size, hydrology, vegetation, chemical loading, sediment oxygen levels and season [10,11,12,13]. Replacement of wetlands by agriculture in the CCV is likely the primary cause of ecosystem service declines in the region, making their restoration a major priority [14,15,16]; however, few studies have examined restored wetland function beyond a limited set of objectives. By applying adaptive management techniques, including strategic wetland restoration, it is possible to leverage multiple ecosystem benefits [17], but it is unclear whether restored wetlands under their current management regimes extend their value towards water quality improvement. In this study, we sought to answer these questions by examining nutrient concentrations and loads received and discharged from a number of different wetlands under various hydrological regimes and climate conditions.
Freshwater wetlands once covered about 1.6 million hectares in the CCV but have declined to less than 8% of the original acreage [18,19]. Wetlands restored under federal programs such as the U.S. Fish and Wildlife Service’s National Wildlife Refuge System and the U.S. Department of Agriculture’s Wetland Reserve Program, as well as through state, non-profit and private landowners, have reinstated many key functions but are often managed for a few specific objectives rather than a broad suite. Many restored wetlands in the CCV are managed for wildlife and managed under a moist soil regime whose primary goal is to provide food and cover for wintering waterfowl [1,20]. Previous studies based on surveys conducted on wetlands managed for waterfowl suggest an inverse relationship between moist soil management and nutrient removal due to annual vegetation removal, substrate exposure during drawdowns and fertilization by waterfowl manure, all of which result in additional nutrient loading or reduced removal capacity [20,21].
Hydrology is another strong determinant of nutrient dynamics as it affects sediment oxygen levels and redox potential [2,22,23] and drives vegetation growth, composition and density, thereby affecting nutrient uptake in the growing season and release during senescence [24,25]. Despite its relevance to a host of ecosystem services, restored wetland hydrology in the CCV has received relatively little attention. Prior to the 1800s, the majority of the region’s wetlands lay within riparian floodplains and received overland flows driven by spring snowmelt. Over several decades in the early 1900s, dams and levees were constructed to protect agriculture and urban centers and to provide irrigation and municipal water to much of the Central Valley, which effectively eliminated natural wetland hydrology by disconnecting them from fluvial flooding [26,27]. The current drivers of managed wetland hydrology in the Central Valley are complex and vary greatly by location, time of year and legal water rights. The majority of today’s wetlands receive water from the same network of irrigation and drainage canals that service croplands and are manually flooded and drained. The highly managed nature of modern wetland hydrology offers a unique opportunity to assess nutrients as flows are restricted to water control structures, and we can assume that most nutrients entering and leaving the wetlands occur at these points.
This study monitored nutrient and sediment load inputs and outputs in restored wetlands of the CCV over a period of months, representing a broad range of climatic, hydrological and ecological conditions, as well as nutrient management practices. Over the course of this study, the CCV experienced exceptional drought (2011–2015) and extreme flooding (2016–2017) as well as relatively normal water conditions thereafter. Our objectives were to first describe the principal drivers of hydrology in restored managed wetlands of the CCV and to quantify nutrient concentrations and loads received and discharged in order to determine whether current management practices provide water quality benefits.

2. Materials and Methods

2.1. Study Area and Sites

Water depth and nutrient data were recorded at 21 restored wetland sites in CCV, an elongated sedimentary basin about 640 km long, 88 km wide and covering an area of 5.4 million ha (Figure 1). Topography is relatively flat throughout the CCV, with elevation ranging from 120 m in the north and south to below sea level near San Francisco Bay. Climate of the valley is Mediterranean with warm, dry summers and mild, wet winters. Air temperature varies little throughout the CVC with the average in July highs being 37.1 °C in both Bakersfield and Red Bluff, while average December lows in Bakersfield (2.9 °C) are only slightly warmer than in Red Bluff (2.3 °C). Annual precipitation, however, exhibits a distinct gradient and ranges from 92 cm in Red Bluff in the north to 16 cm in Bakersfield in the south. Over 90% of annual precipitation falls as rain during November–May.

2.2. Restored Wetland Hydrology

Prior to this study, we had no hydrological records for privately managed wetlands, save for those with access to regular water supplies typically managed for wintering waterfowl [20,28]. Based on our communications with wildlife refuge managers, private landowners and USDA—NRCS staff, as well as the literature review, we arrived at a general description of the principal hydrological drivers of restored wetlands and compared them to conditions prior to the major wetland losses of the previous century.
We collected empirical data from restored wetlands during two time periods. We explored relationships between wetland water quality and local climate from 2015 to 2018 at 4 wetlands in the San Joaquin River National Wildlife Refuge (SJRNWR), 13 at the Colusa NWR (CNWR) and 4 on private land (PR). Wetlands in the SJRNWR and CNWR included serially connected units in which wetlands received water one after another sequentially (Figure 1). Since wetland inflows and outflows are manually controlled, we communicated closely with wetland managers to ensure surveys coincided with active flows. Water depths and water control structure dimensions were measured manually to calculate flow volume. Water quality was recorded using a YSI ® multi-parameter probe to measure water salinity, dissolved oxygen, pH, temperature and electrical conductivity at the point of flow. We deployed 1.5 m Odyssey® pressure transducers (Dataflow Systems Limited, Christchurch, New Zealand) at the outflow structure of each wetland. Sensors were housed in a 37.5 mm width 40 PVC tube with perforations every 100 mm along its height and secured in the ground by a t-post. Sensors were calibrated before deployment and periodically thereafter. Water depths were logged in millimeters every 4 h and then averaged by day for analysis.

3. Results

3.1. Historic Versus Current Wetland Hydrology

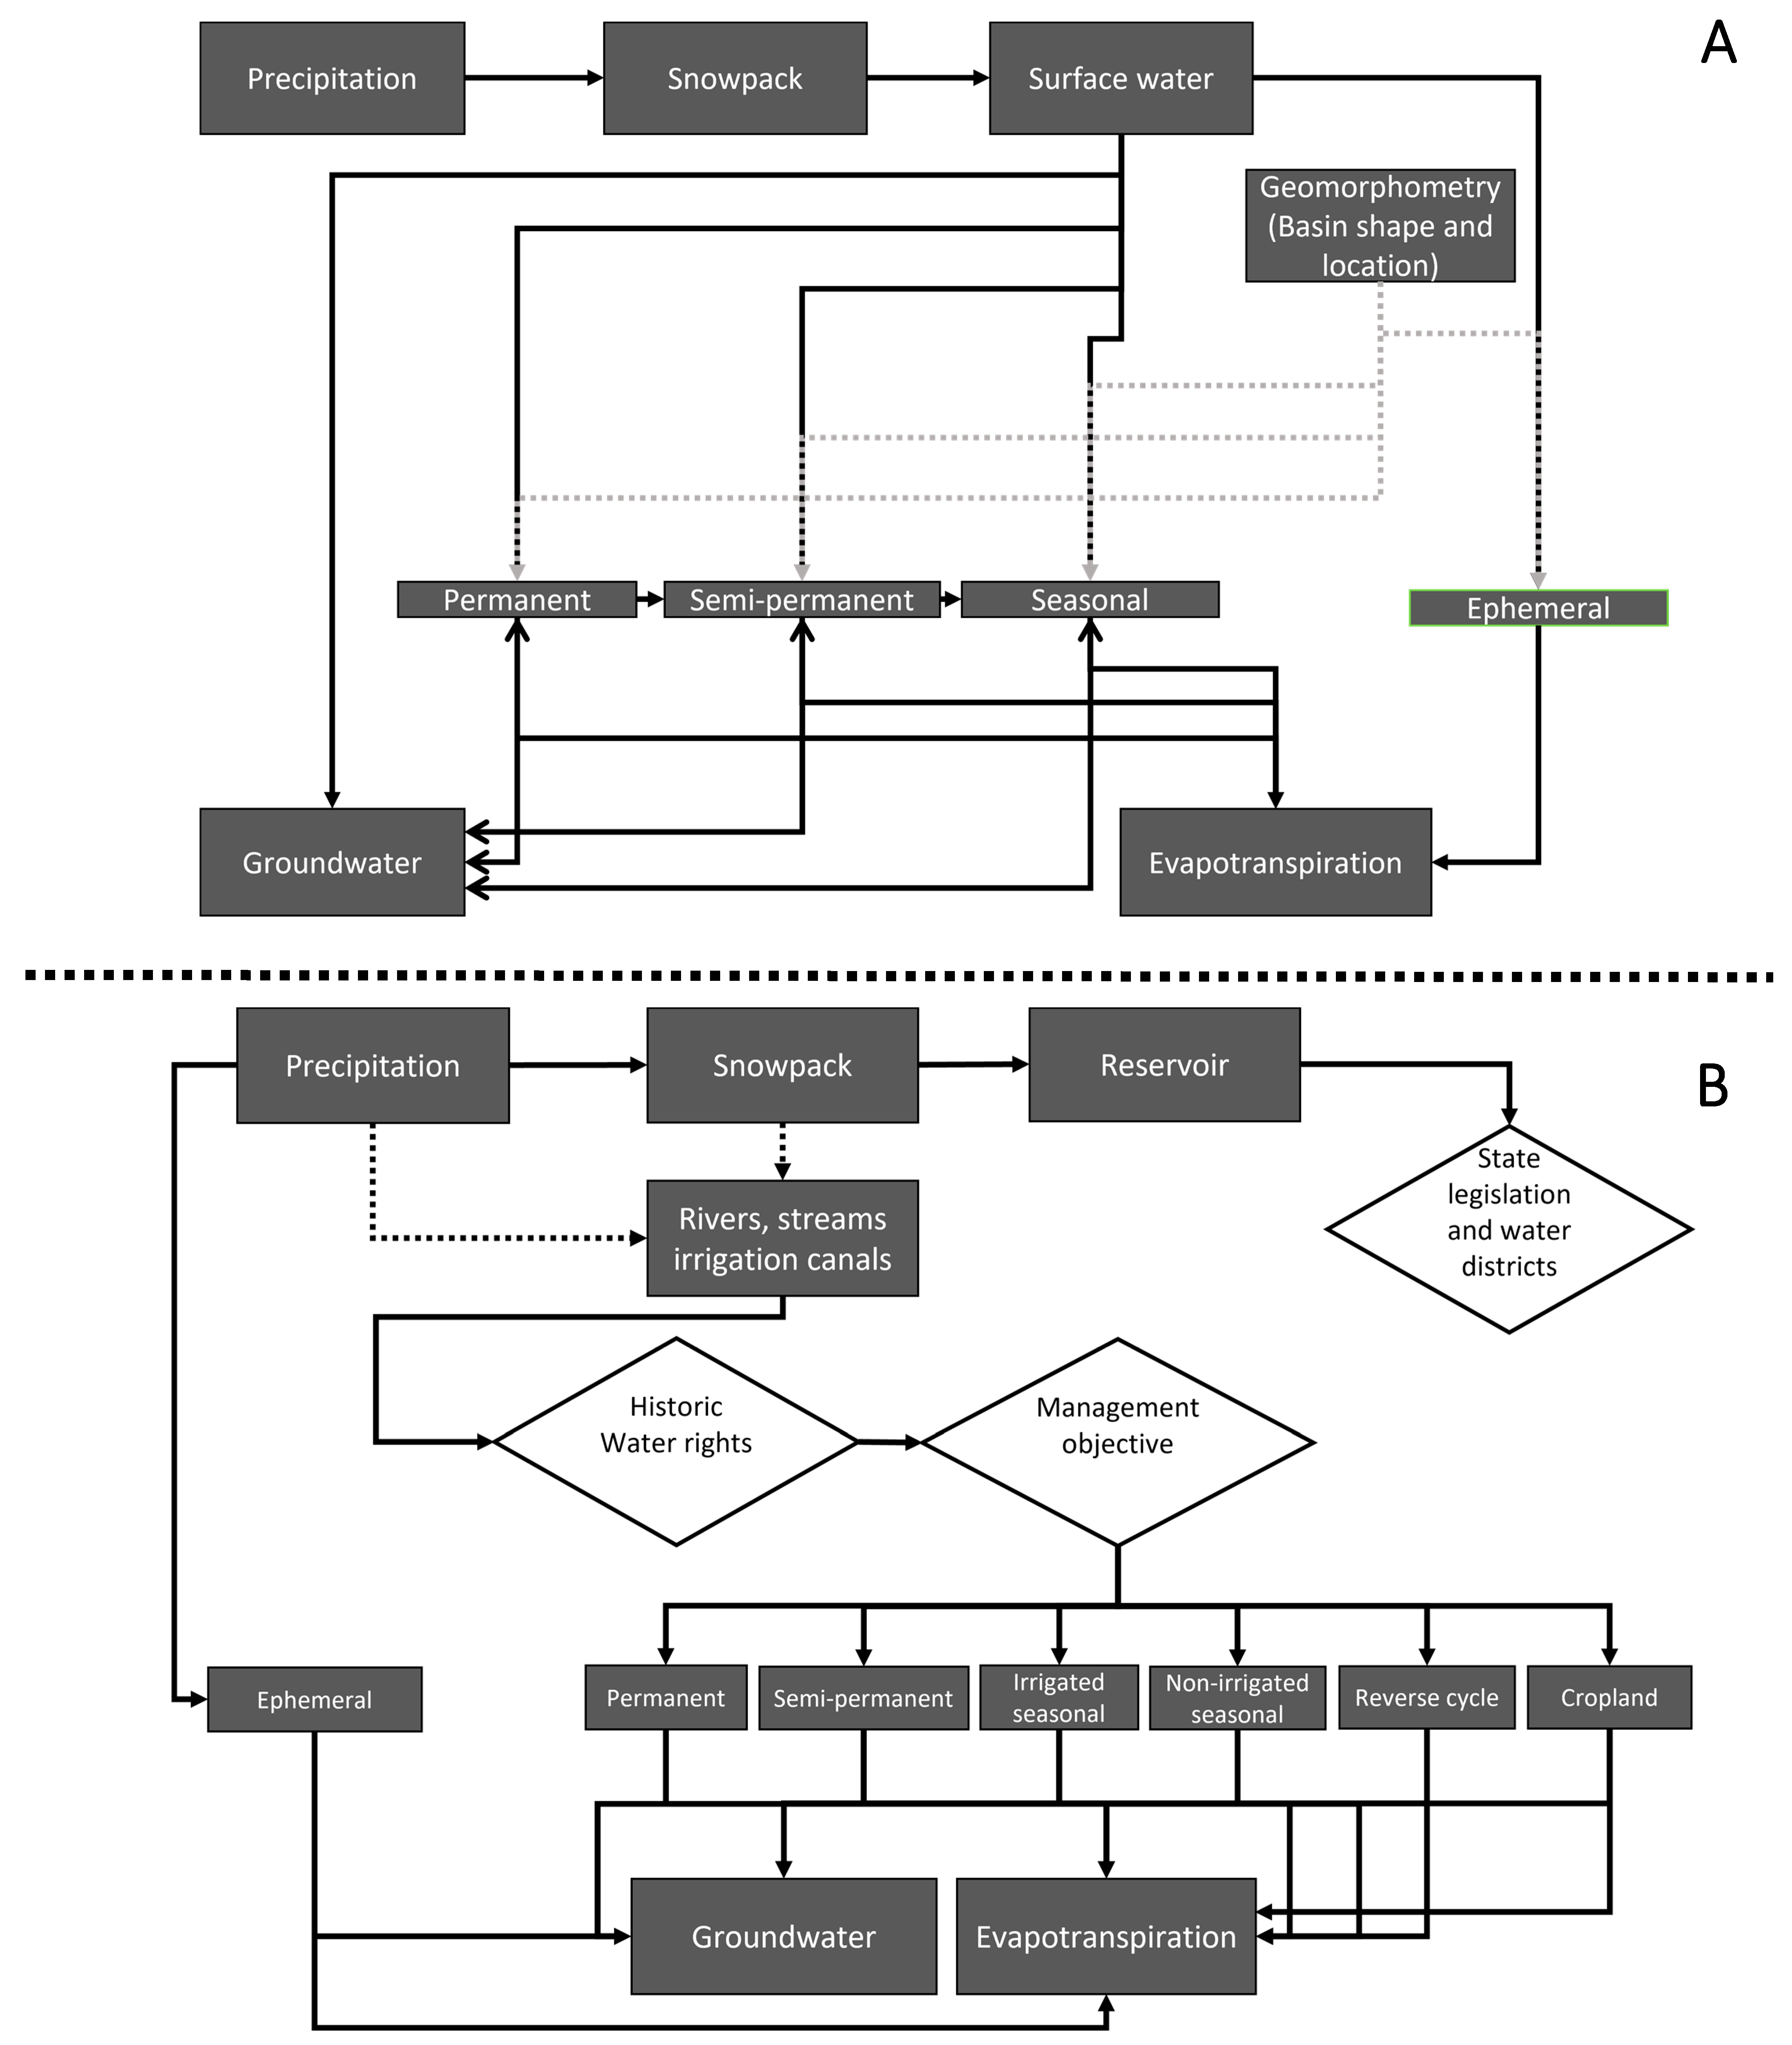
Due to extensive alterations to the Central Valley’s hydrological landscape and subsequent dependence on irrigation canals as a primary source of hydrology, the quantity of water received by individual wetlands is dictated by state legislation governing water rights and the management objective. Water deliveries are determined by a complex combination of state legislation governing water rights and management objectives (Figure 2). Water rights are legal entitlements that authorize landowners to divert water onto their property for beneficial uses. Permits issued for water use under this system stipulate the timing and volume of water that may be used and may vary with changes in water availability. According to California state law, senior water rights holders (pre-1914 appropriative rights) have more immediate access to water than junior water rights holders (post-1914 appropriative rights) particularly when water levels are subject to increased regulation as in a drought. Wetlands that fall within a parcel with riparian water rights may appropriate those waters under certain conditions [6]. State legislated water curtailments are more likely to occur during drought years. For instance, in 2014, following 4 years of below average precipitation, a Drought State of Emergency was declared in California that saw reduced water allocations for agriculture and wetland management. Conditions worsened in 2015, resulting in a significant drop in wetland irrigation over summer. That year, National Wildlife Refuges received only 75% of their typical water allocations and private land managers fared far worse, receiving between 50 and 0% of their typical allocations. Management goals also play an important role in determining flood frequency, depth and duration. Studies have found that wetlands managed intensively for wintering waterfowl are more frequently flooded and for longer periods of time than unmanaged wetlands [20].

3.2. Restored Wetland Hydrology and Management

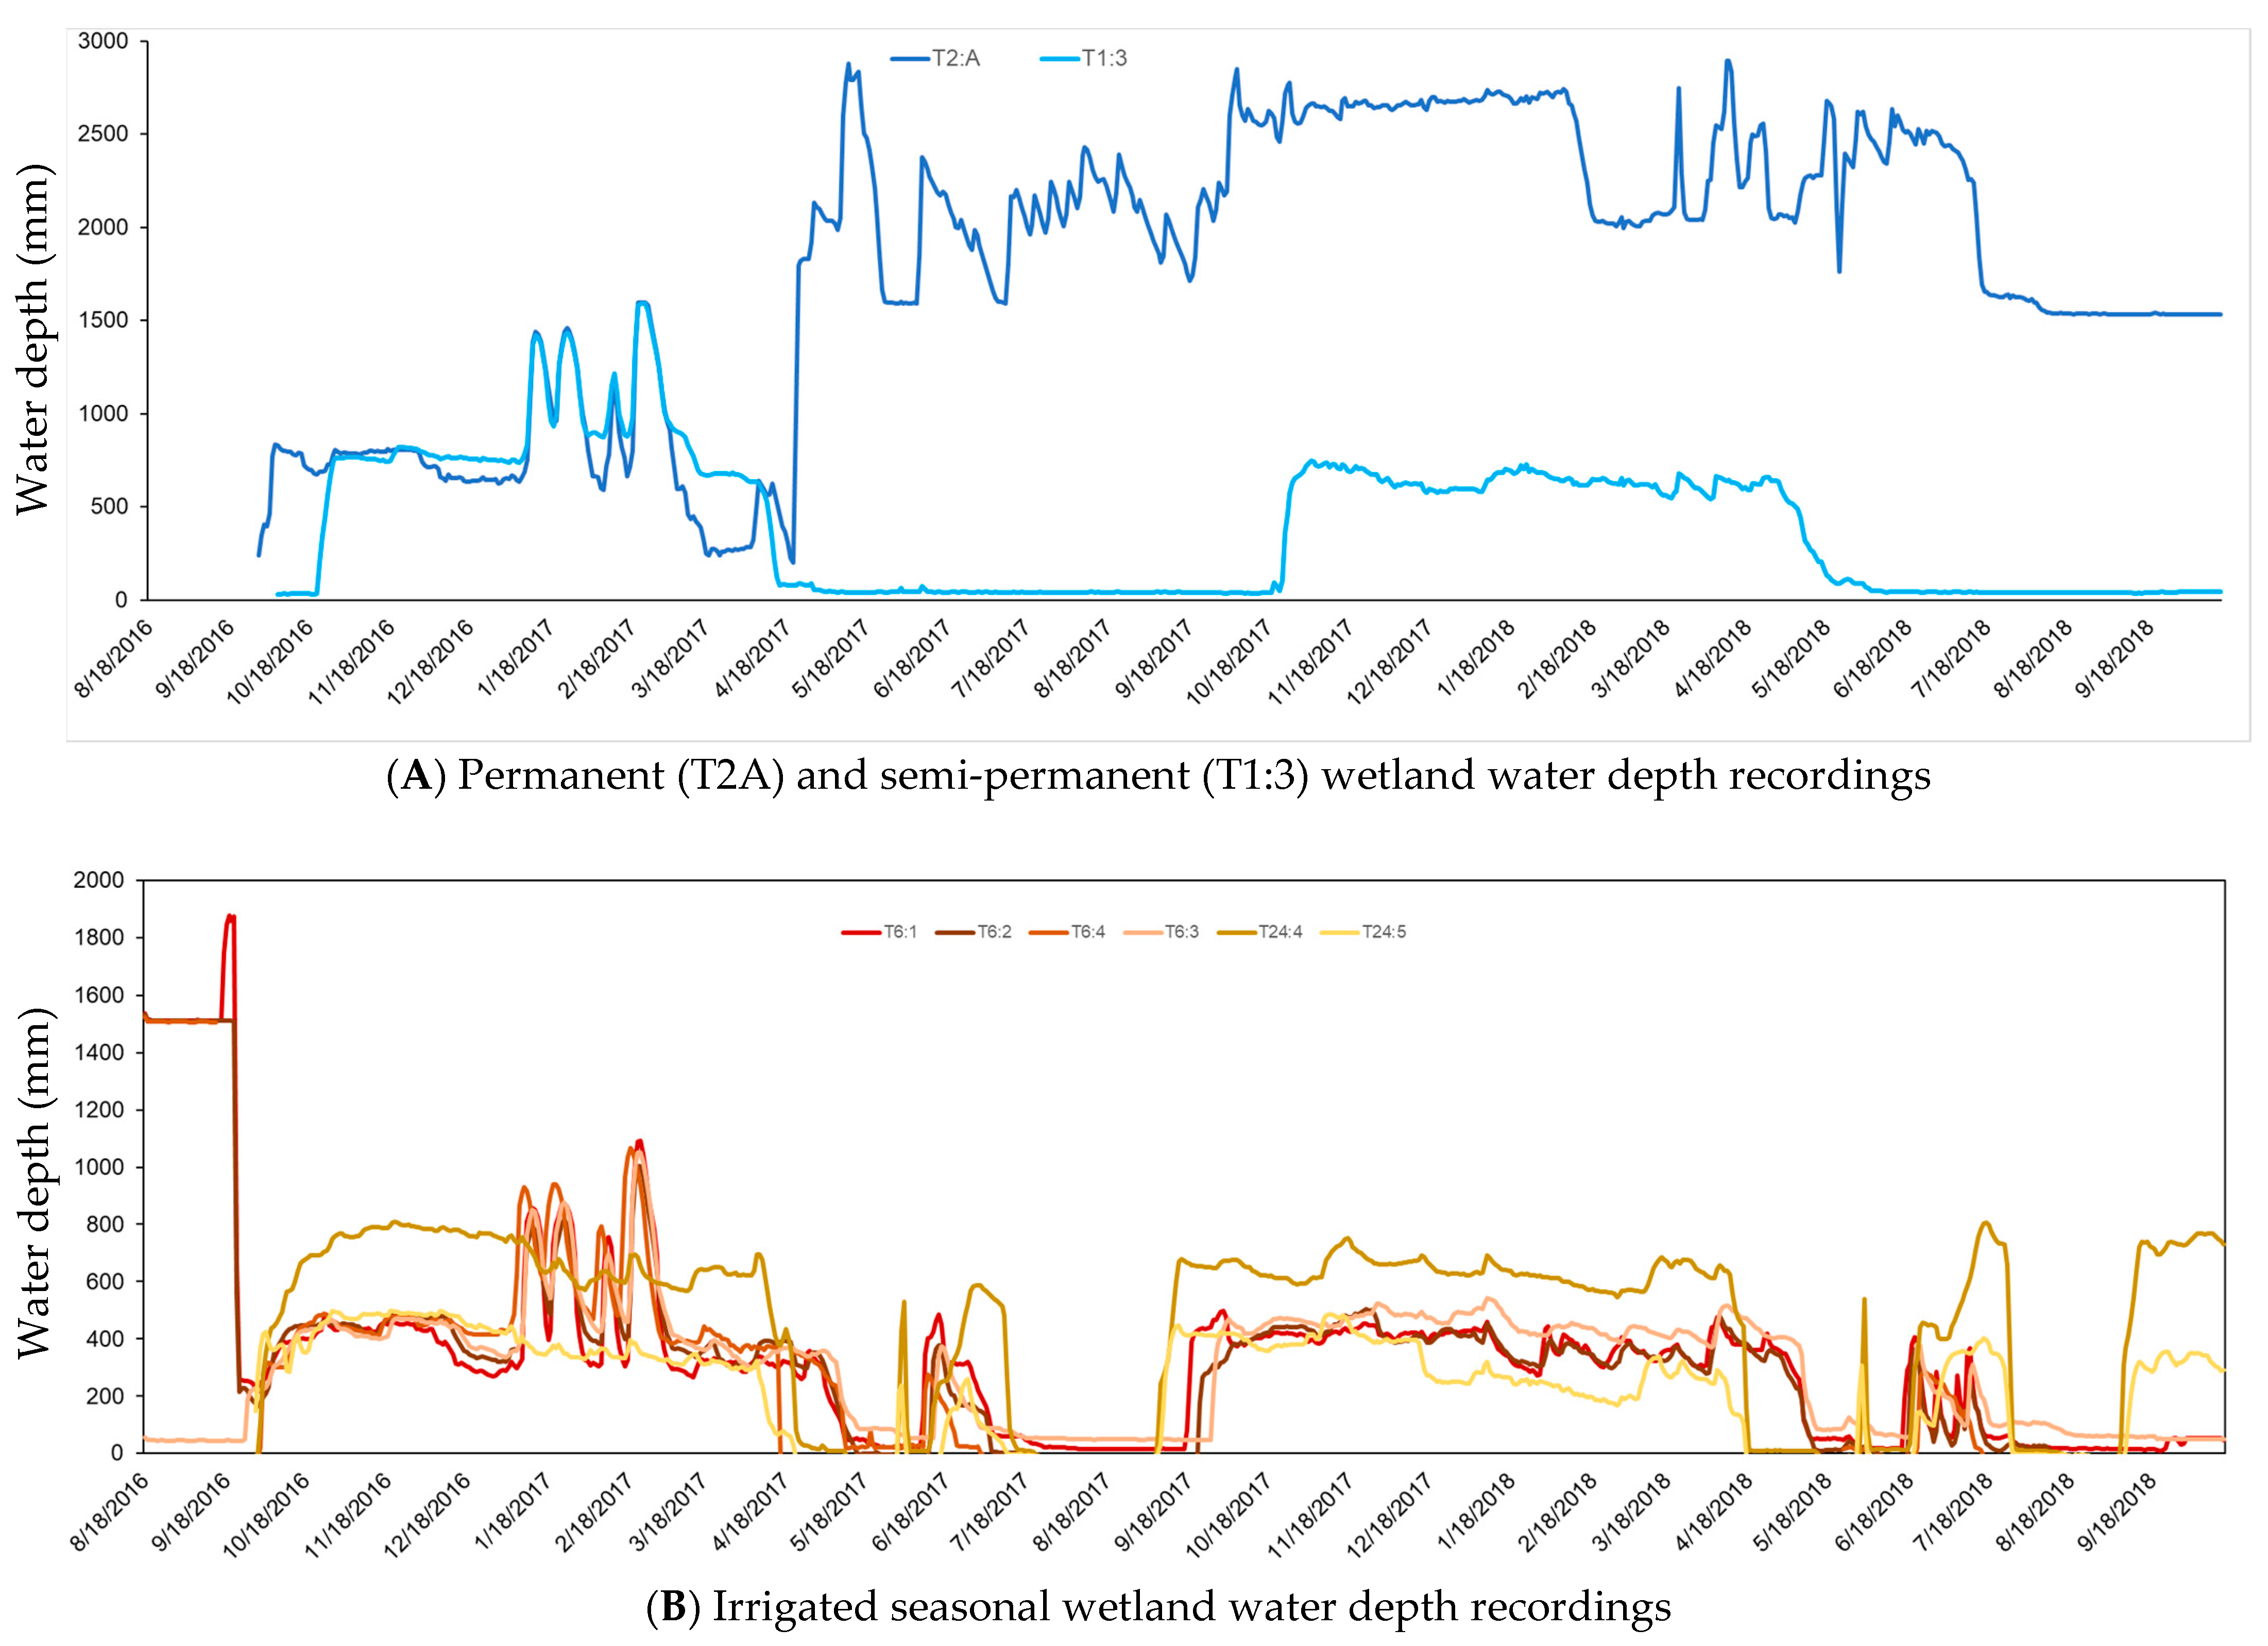
Our knowledge of managed wetland hydrology is largely drawn from long term records obtained from National Wildlife Refuges, which fell into one of five categories: (1) permanent, (2) semi-permanent, (3) irrigated seasonal, (4) unirrigated seasonal and (5) reverse cycle. Hydrological categories differed mainly in their flood frequency, depth, duration and timing. In this survey, reverse cycle wetlands, where wetlands are flooded over the summer months and drawn down in the fall and winter, only occurred in the San Joaquin Basin. Permanent wetlands were inundated year-round, and semi-permanent wetlands were inundated from fall through summer, with a short drawdown period from August through September to facilitate vegetation management. Seasonal wetlands were flooded in the fall and drawn down in the spring to germinate seed-producing wetland plants, while irrigated seasonal wetlands received a brief pulse of shallow water in the mid-summer months to bring seed-producing plants to maturity. Some seasonal wetlands may be unirrigated for a variety of reasons, including lack of adequate water, vegetation management and historical wildlife use (J. Isola pers. comm. 2015). Vegetation composition also differed among wetland types, with permanent and semi-permanent wetlands exhibiting larger proportions of tall emergent perennial plants such as hardstem bulrush (Scheonoplectus acutus) and cattails (Typha spp.), while irrigated and unirrigated seasonal wetlands were dominated by a mix of shorter annual such as watergrass (Echinochloa crus-galli), smartweeds (Polygonum spp.) and grasses (Crypsis spp.), along with perennials such as alkali bulrush (Bolboschoenus maritimus) and joint grass (Paspalum distichum). Vegetation control treatments such as mowing, disking, herbicide application or burning are often applied annually in irrigated and unirrigated seasonal wetlands and are applied periodically in semi-permanent and permanent wetlands. Vegetation management may have consequences for evapotranspiration, nutrient uptake and soil characteristics such as organic matter content, water holding capacity and porosity.

3.3. Water Depth Assessment

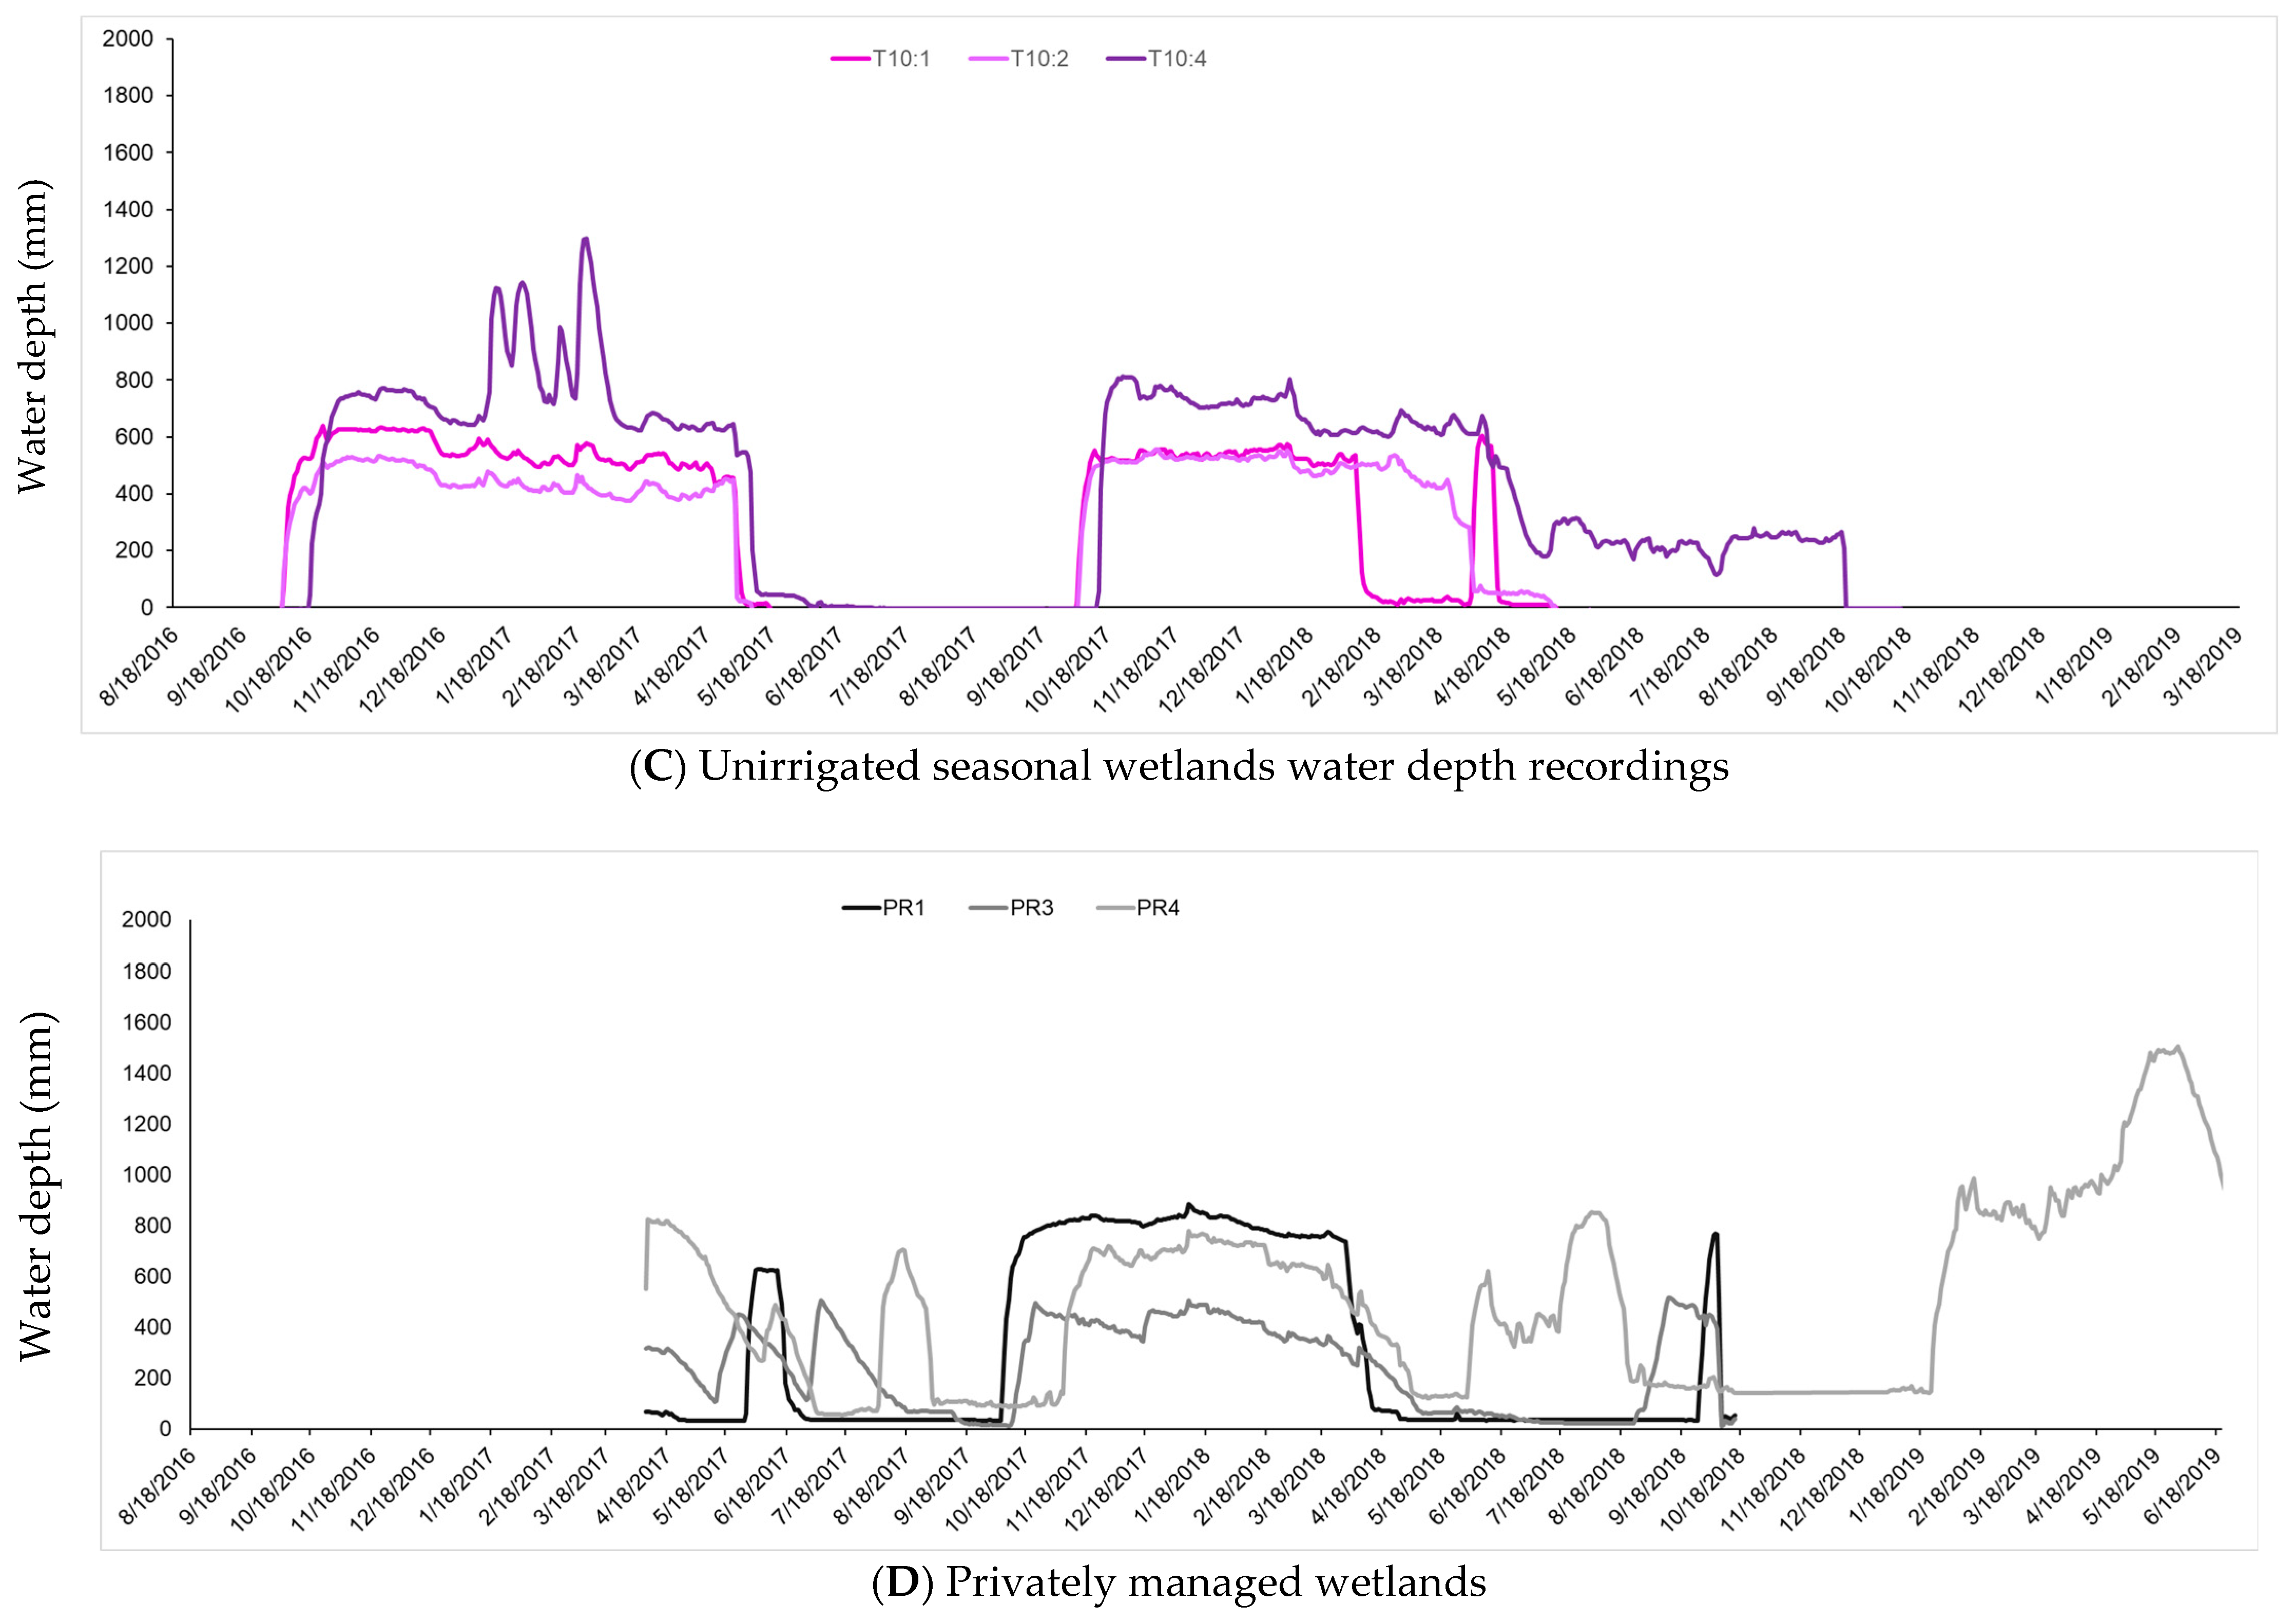
Water depths were measured manually at water control structures from May 2015 to September 2016. In September 2016, water depths were recorded automatically by depth loggers. Water depth loggers at the CNWR recorded data between September 2016 and October 2018 and aligned well with their stated management objectives with little variation among similarly managed wetlands. Water depths at the SJNWR were measured for less than a full year (May 2019–October 2020), and it was therefore difficult to draw conclusions regarding their flooding and drawdown schedules. With the exception of the fall/winter flooding period, temporal trends in water depth at privately managed wetlands exhibited greater variability in depth, duration and timing than those at the refuges (Figure 3 A–D). Average depths on privately managed wetlands were similar to seasonal wetlands on NWRs (Table 1), but they were drawn down less frequently than the seasonal wetlands on CNWR, where sediments were often exposed in the spring and early summer (Figure 3).
Wetland hydrology varied by management objective and was more consistent within the NWR than among privately managed sites. Hydrology on the privately managed wetlands we surveyed appeared to align best with seasonal irrigated wetlands of NWRs with a fall and winter flooding followed by spring drawdown and possible summer irrigation at two sites. Previous studies found high variability in flood management among privately managed wetlands with some failing to flood their wetlands in drier years [20].

3.4. Water Quality

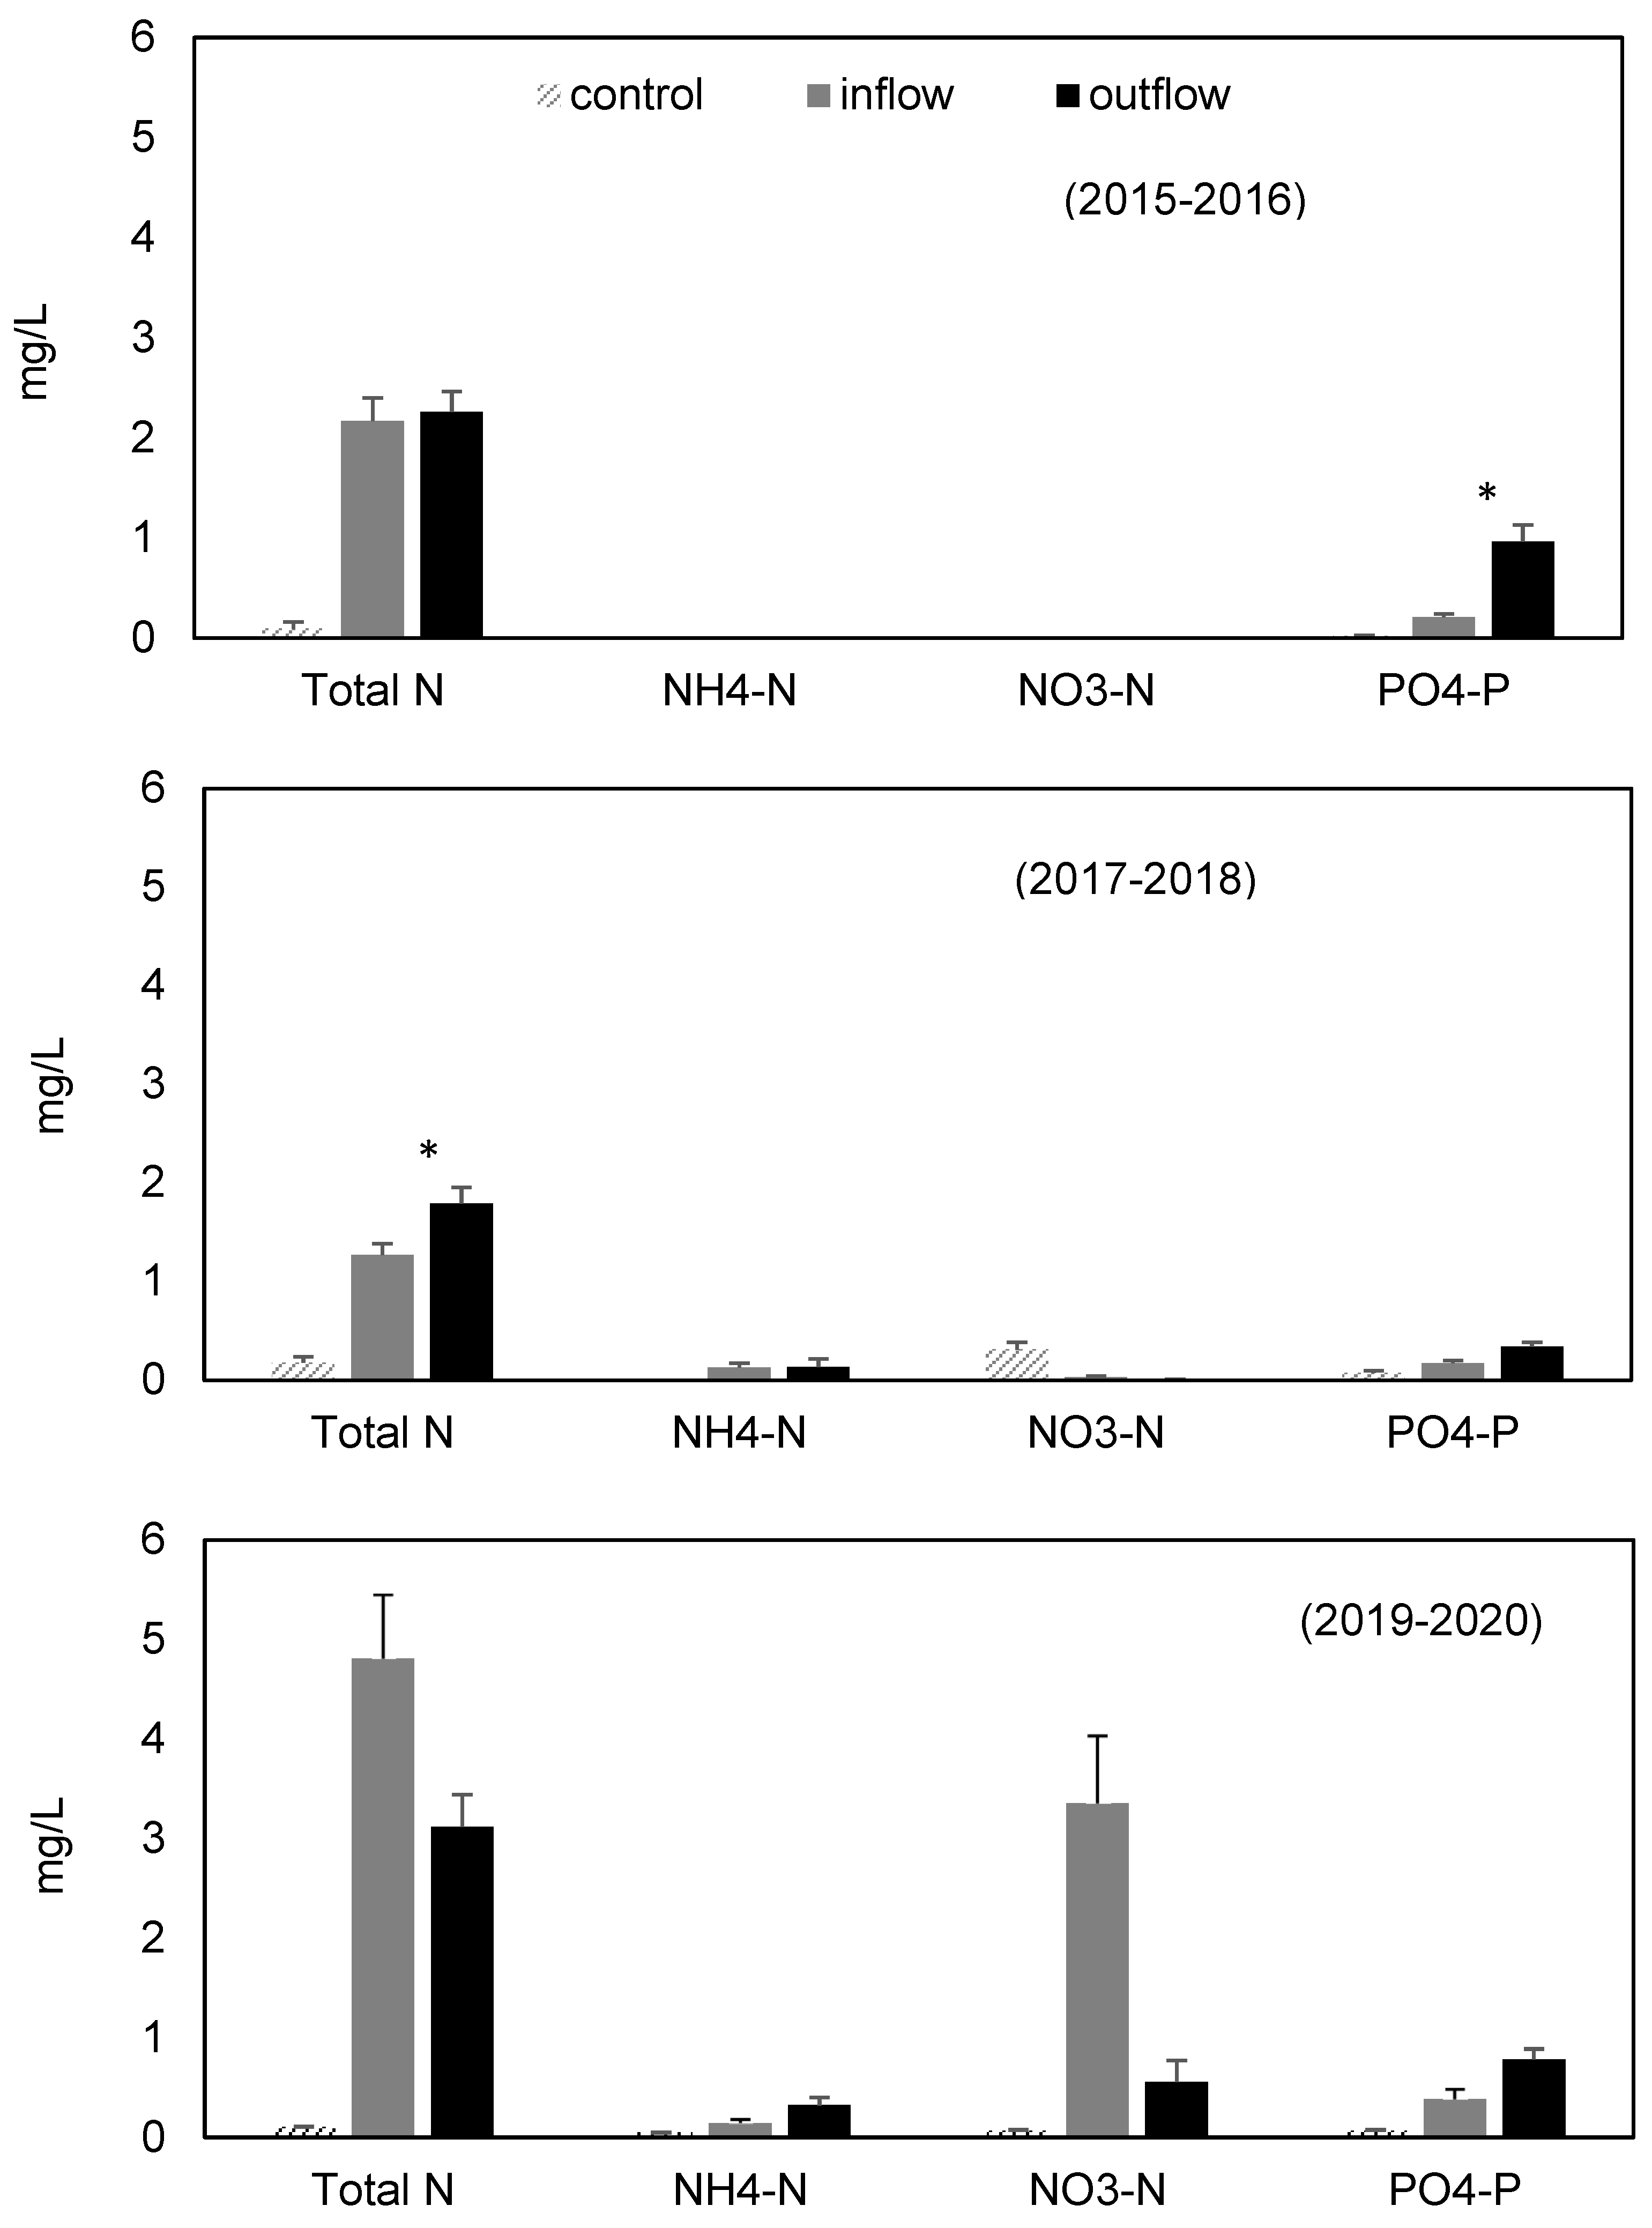
We collected water from 28 managed wetlands during active inflow or outflow events from May 2015 to June 2018, resulting in 288 samples. In the period from June 2019 to August 2020, 11 sites were surveyed, resulting in 140 water samples. It is important to note that wetlands from the CNWR were only sampled in the first period whereas additional wetlands in the SJRNWR were included in the second sampling period. The same 4 private wetlands were sampled in both time periods. In the first sampling period, California experienced exceptional drought (2015–2016) followed by widespread flooding (2017–2018), and so these time periods were plotted separately. Precipitation conditions in the 2019–2020 period were considered normal. Concentrations of nutrients received and discharged varied considerably among time periods and watershed basins (Figure 4); however, wetlands in the SJRNWR generally received higher concentrations of total nitrogen (Table 2).
We also estimated the mean instantaneous loading rates received and discharged from managed wetlands. Load was estimated as a flux or instantaneous movement of a mass of total nitrogen through the water control structure using the following equation:
M e a n   L o a d = k i = 1 n ( c i q i Δ t / A i ) n
where c = concentration as a function of time, q = flow as a function of time, k = unit conversion factor, A = site area in hectares and n = number of samples
Δ t = change   in   time
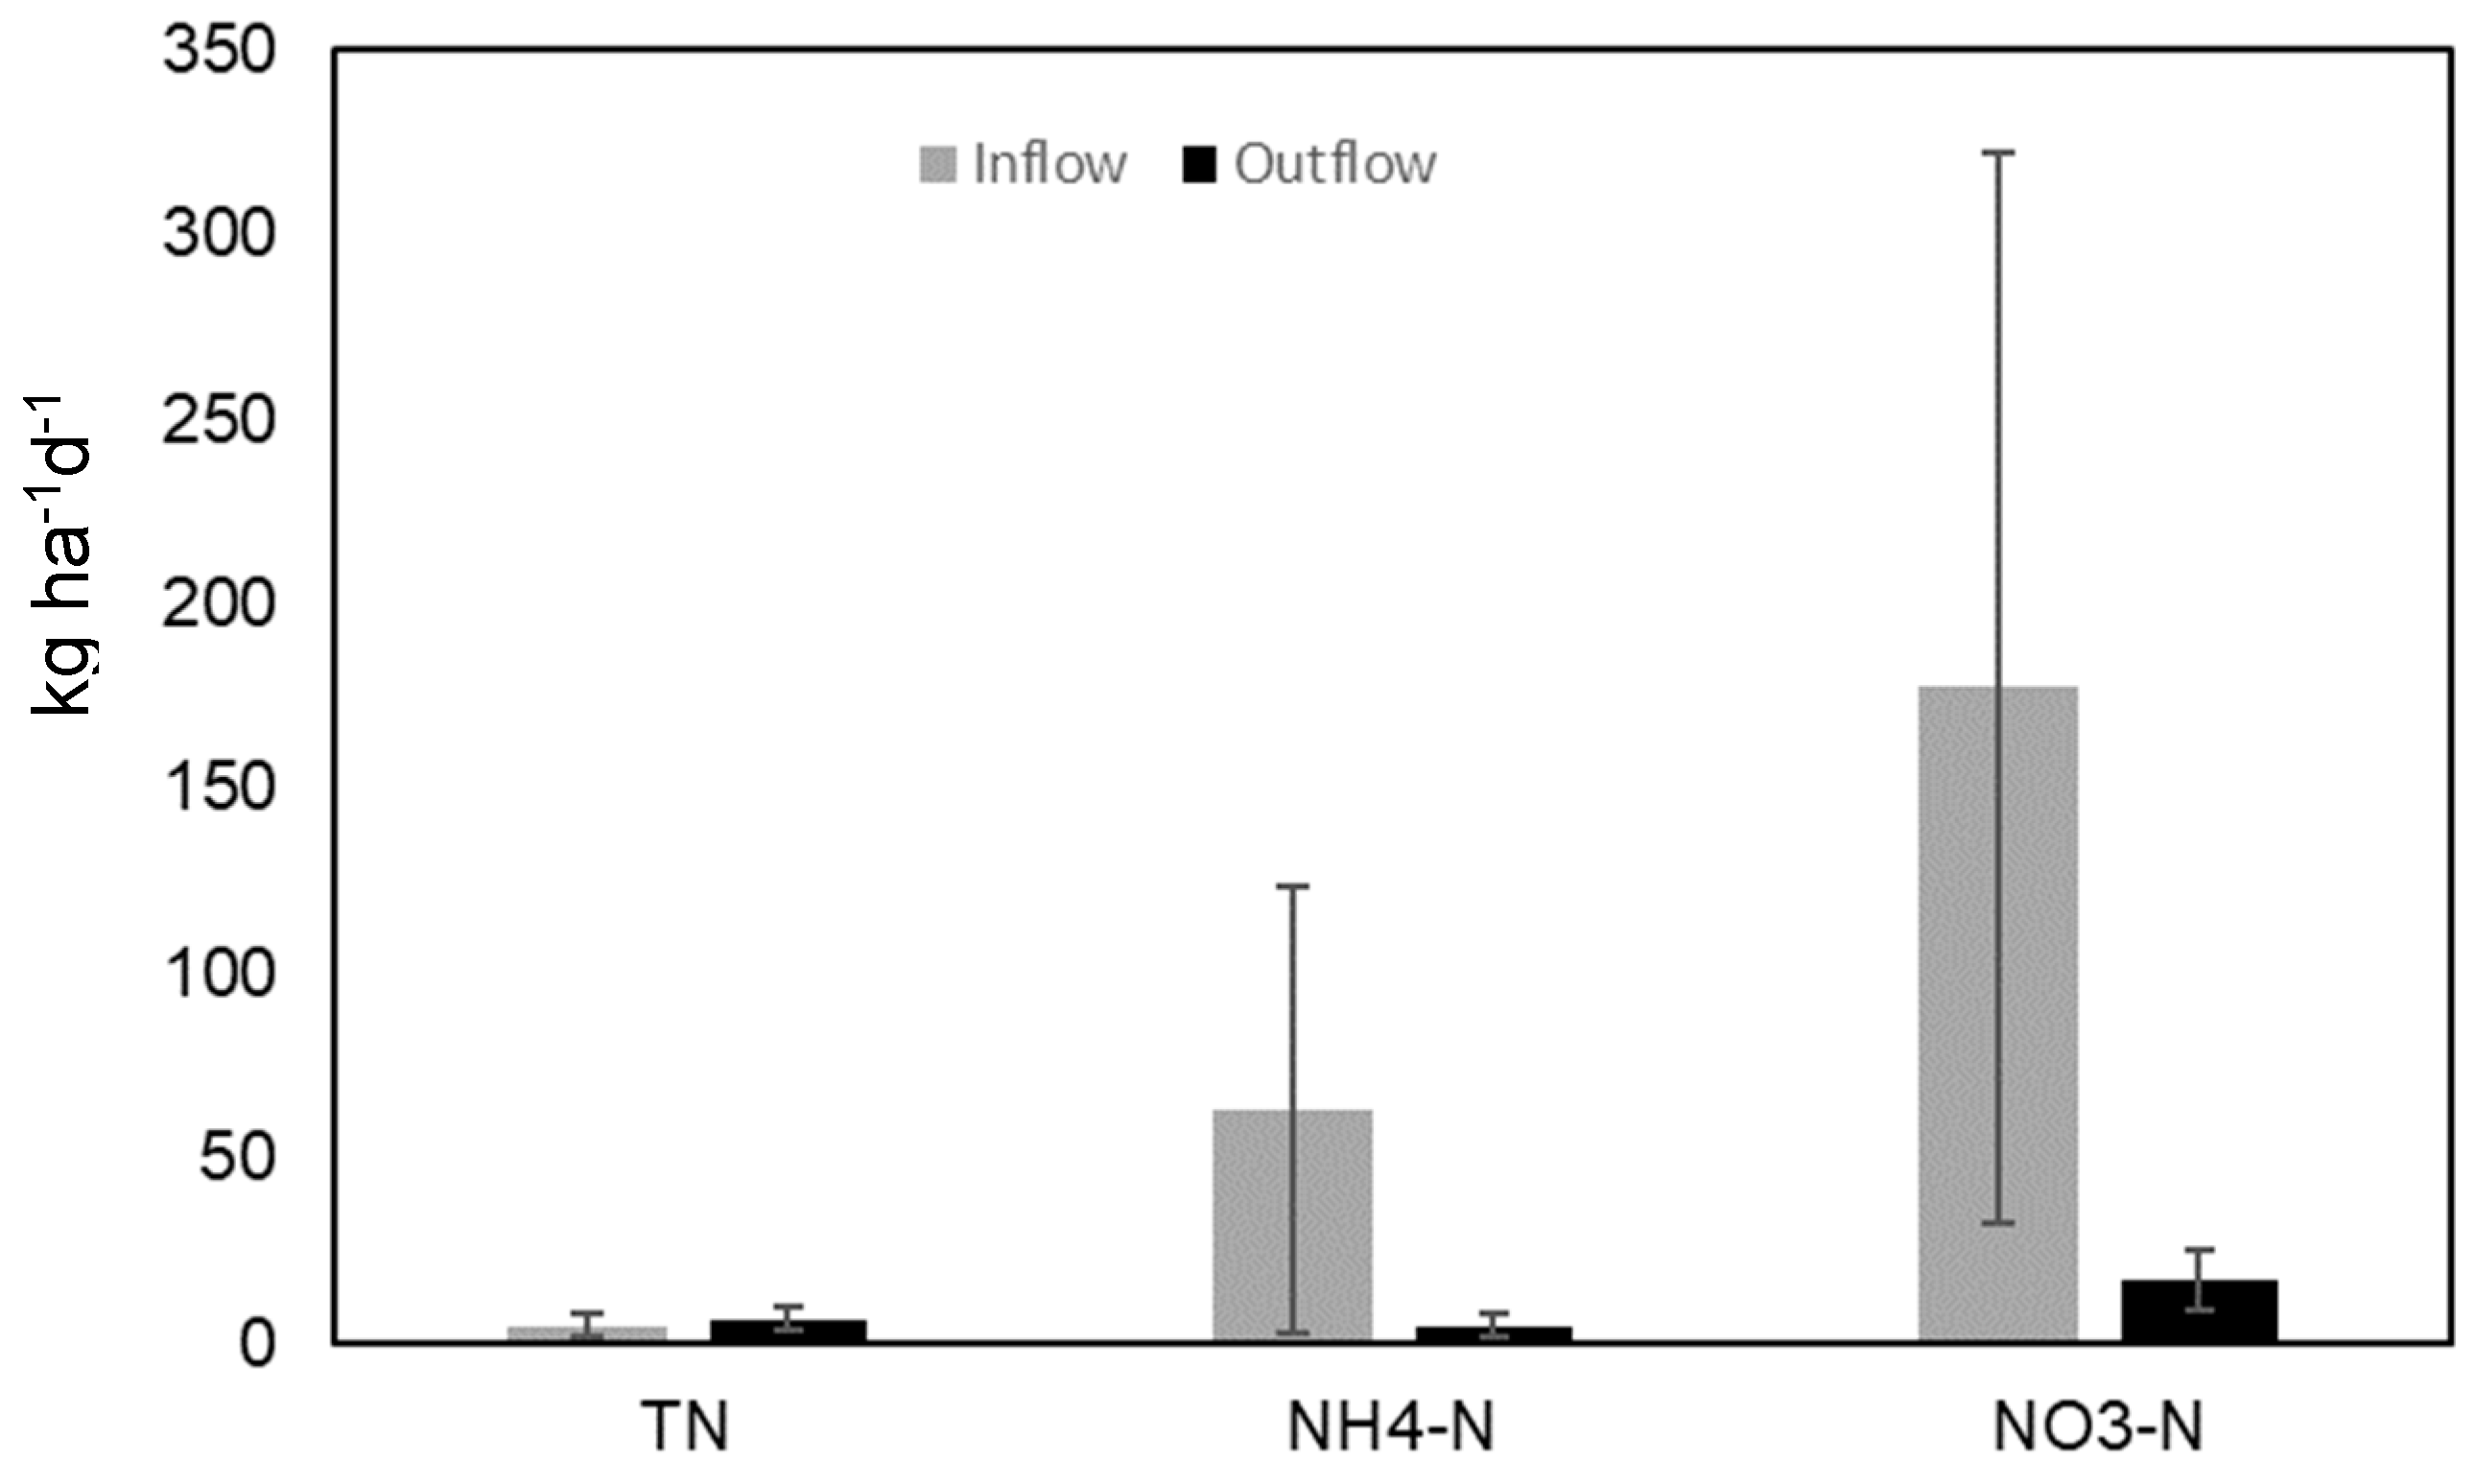
Our results indicate that differences in nutrient concentration (Figure 5) and loads (Figure 6, Table 2) among wetland management types are related to location and source water. Total nitrogen, nitrate-nitrogen, ammonium-nitrogen and soluble organic phosphorus concentrations measured over the course of this study fell well within the limits observed by other studies in the region. With the exception of outliers, wetlands in the San Joaquin Basin generally received higher concentrations of nutrients than the Sacramento Basin, which is in line with previous assessments [29]. Seasonal effects were also observed in previous studies [10] and may be related to a number of factors, including loading rates, substrate exposure to oxygen in the spring or vegetation mowing in the late summer. Our results indicate that, while seasonal irrigated and unirrigated wetlands serve as phosphorous sources, they reduce nitrogen loads fourfold over the fall–winter flooding period despite receiving additional nutrient inputs from migrating waterfowl [21].
Managed wetlands reduced ammonium-nitrogen and nitrate-nitrogen loads but increased total nitrogen and phosphate loads at their outflows (Figure 6). All differences were significant (p < 0.001).
Assessment by hydrological management found differences in nutrient loads retained and discharged among wetland types and locations. The permanent wetlands consistently reduced loads in all nutrients in the Sacramento Basin, but the opposite was true in the San Joaquin.

3.5. Trend Analysis

The ordination diagram of the canonical correspondence analysis (CCA) displayed sites, nutrients and environmental variables (Figure 7). First, we identified wetlands in the Sacramento Basin and the San Joaquin Basin that were sampled on the same dates between 2019 and 2020. The Paolo site stood apart from the other privately managed sites in the far upper left-hand quadrant. The upper right quadrant included a single cluster of PR1 and PR3 and water depth. The lower left quadrant had a small cluster of SJ14, SJ16 and SJ19 sites, nutrients (Total N, NO3-N, and PO4-P), precipitation (mm), minimum vapor pressure deficit and dew point. The lower right quadrant consisted of the PR4 and SJ15. Axis 1 may be described by NH4-N and most San Joaquin Basin sites are located at higher concentrations of NH4-N than Sacramento Basin sites. A Monte Carlo permutation test showed that the climatic data had a highly significant effect on water quality parameters such as NH4-N and Total Nitrogen, with 82% of the variation explained by ordination axis 1 (p < 0.05).
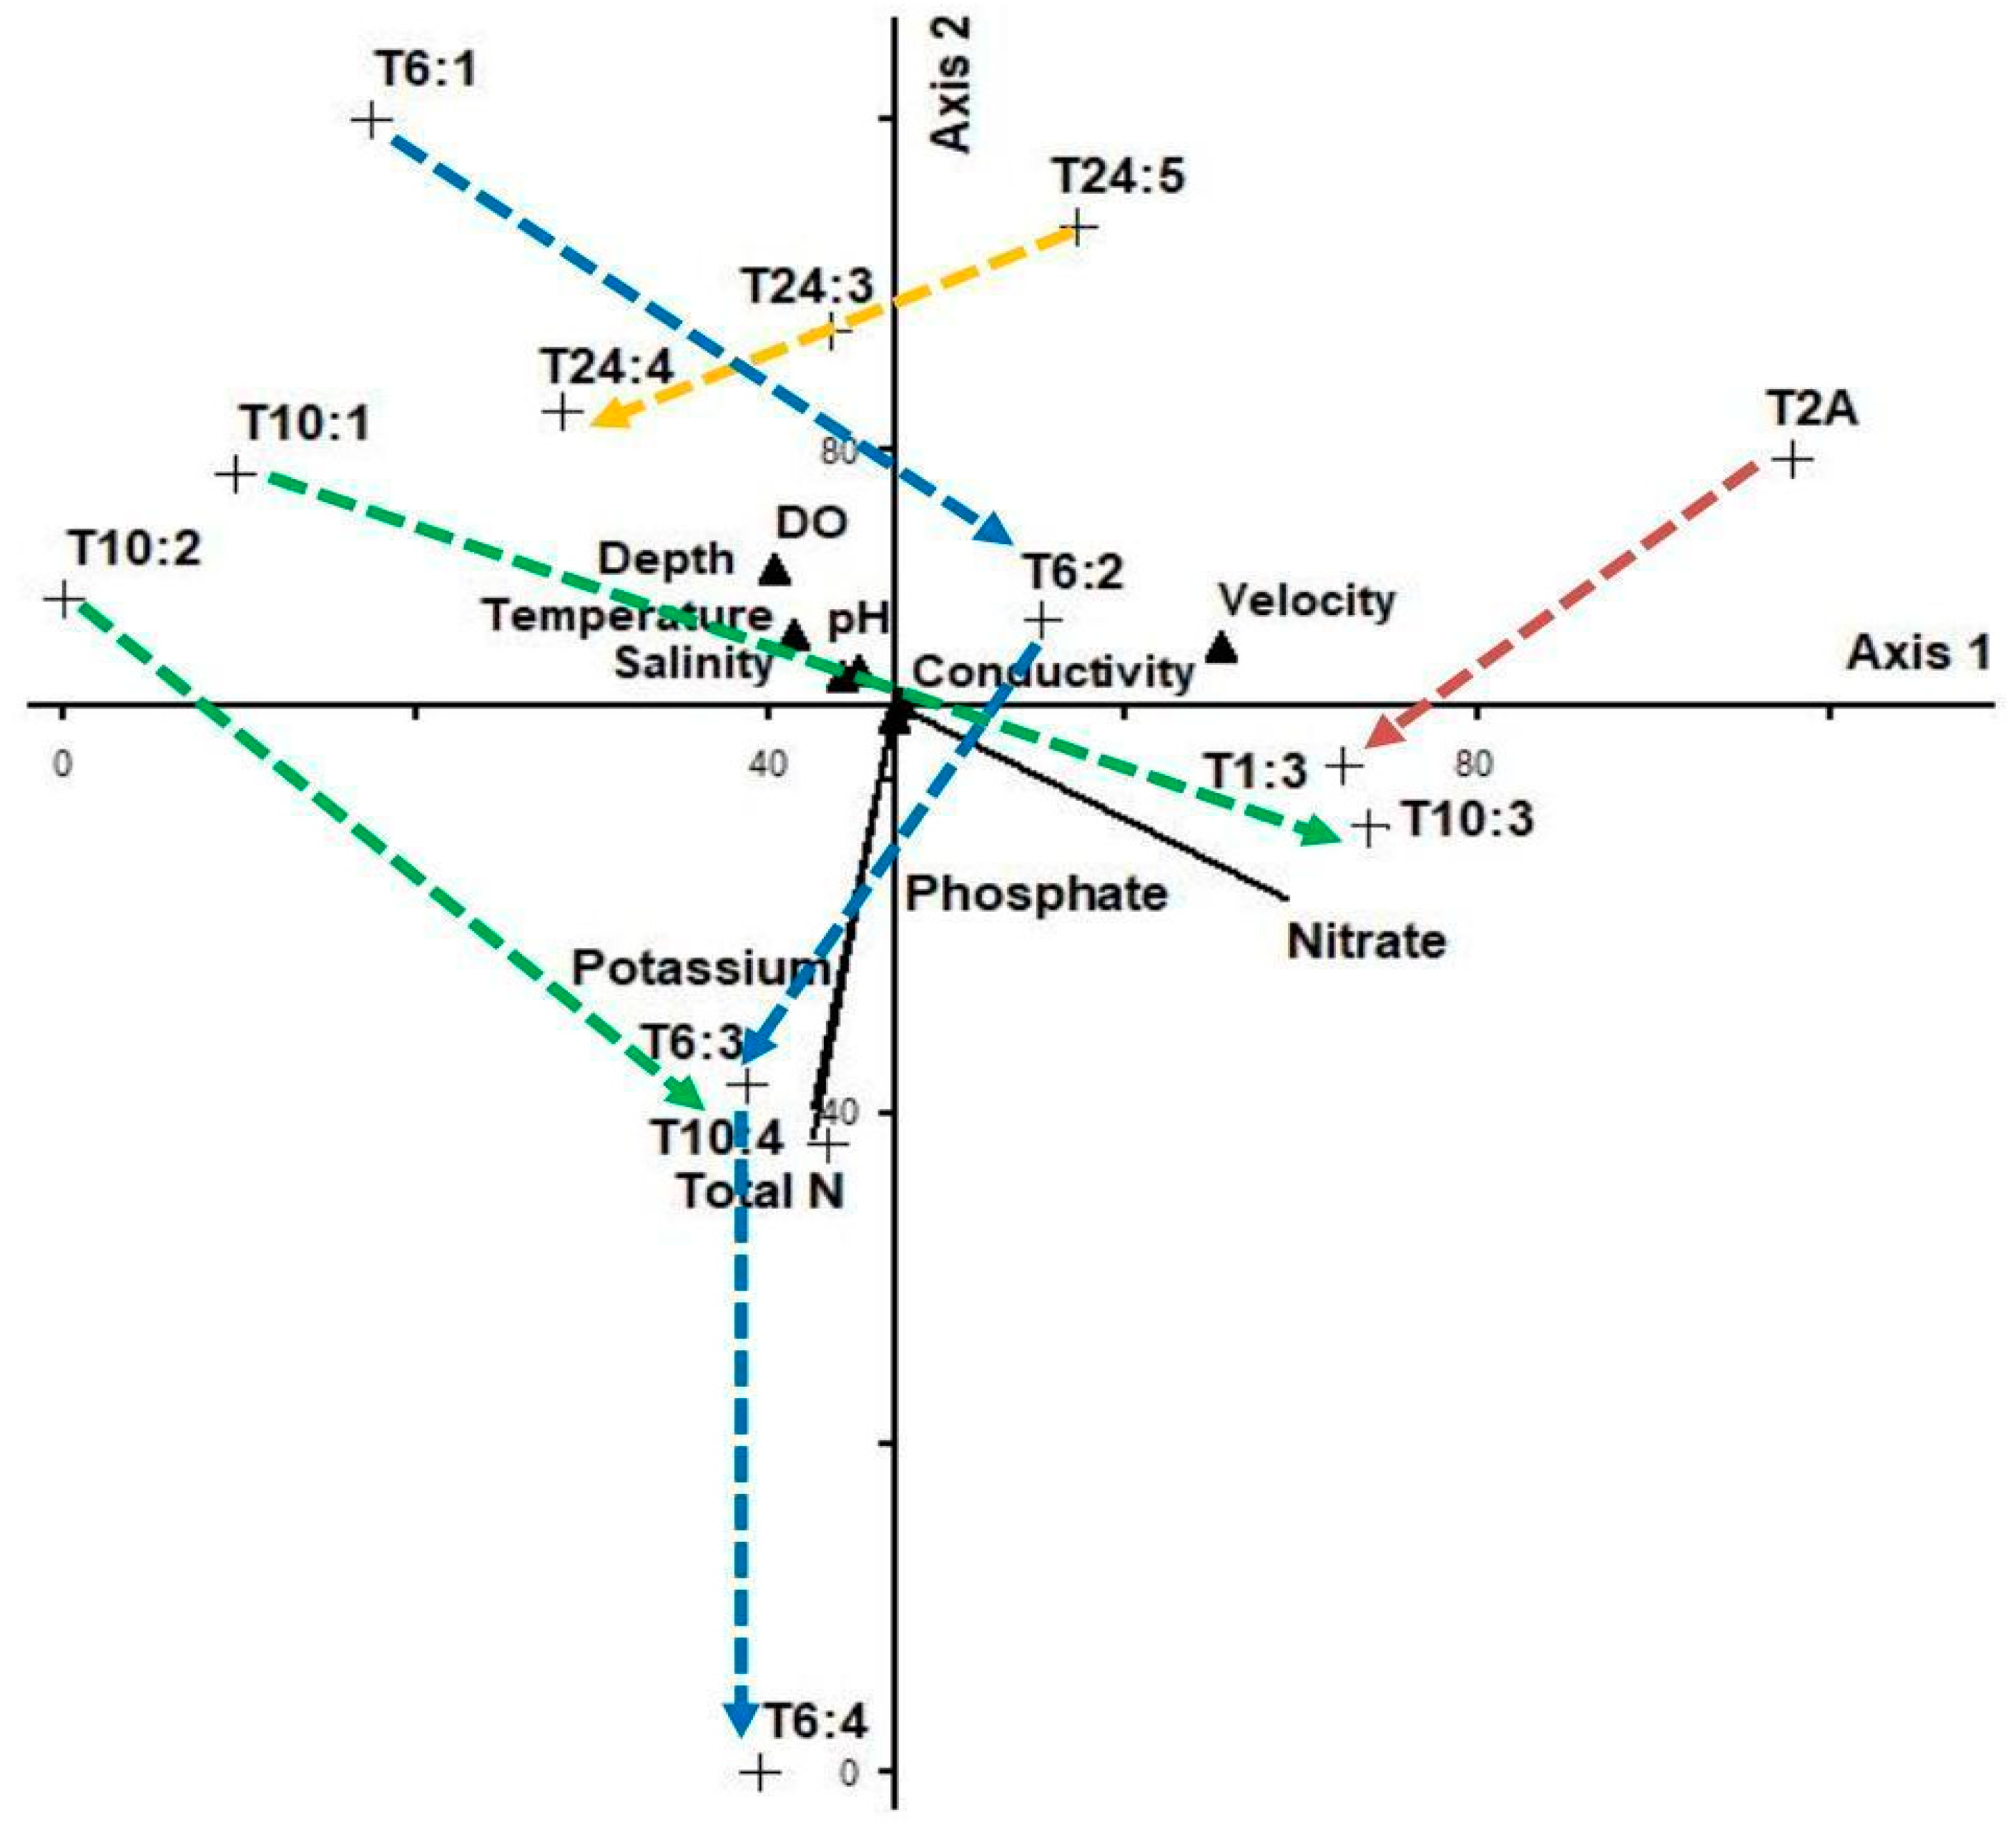
A CCA plot of serially connected wetlands found that wetlands receiving relatively fresher water formed a cluster in the upper left quadrant, associated with lower nutrient concentrations (Figure 8). Wetlands T6:1, T24:5, T10: 1 and T10:2 all received water from the West Lateral Canal, whose source is the Sacramento River. At the time of sampling, wetland unit T2:A received water pumped from the Colusa Basin Drain, which is agricultural drain water. Regardless of source, subsequent wetlands receiving water from each of the initial wetlands had increasingly higher nutrient concentrations, likely a consequence of evaporation or evapotranspiration as water flowed through each wetland. A Monte Carlo permutation test showed that the climatic data explained 41% of the variation in ordination axis 1 and influenced water quality (p < 0.05). The Dissolved oxygen continent is higher in inflows than outflows. For example, when water flows from T24:3 to T 24:4, the DO decreases from 8.32 mgl−1 to 6.74 mgl−1, respectively. Similarly, DO decreases when water flows from T6:1 to T6:2, from T10:1 to T10:3, and T10:2 to T10:4. The nitrate, phosphate and potassium show a positive correlation with Axis 1 of the ordination and a negative correlation with axis 2, while total N shows a negative and positive correlation for Axes 1 and 2, respectively.

4. Discussion

The economic benefits of improved water quality include increased crop yields, reduced costs of drinking water replacement, improved public health and gains in recreation dollars. However, since the passage of the Clean Water Act, the costs of water quality abatement in the United States have outstripped those spent on other environmental initiatives while yielding relatively little by way of cleaner water [30]. The U.S. Department of Agriculture alone has spent over US$4 billion restoring wetlands nationwide, with upfront restoration costs ranging from a few dollars to more than $3000/acre depending on location [31]. In theory, increasing functionality of restored wetlands through optimal design and management to encompass a broader suite of functions could constitute a sound strategy to make the most out of existing investments in the environment. However, our preliminary research corroborates previous assessments of the potential for restored wetlands to perform water quality improvement functions in that their performance varies substantially due to a variety of factors. Unlike constructed wetlands that are specifically designed to receive a consistent flow of nutrient rich water, restored wetlands experience hydrological interruptions that are both intentional and unintentional, but which may have implications for their performance. The unintended consequences of extended droughts limiting water deliveries and high concentrations in nutrient loads may be bottlenecks to effective functioning. Between 2011 and 2015, the Central Valley sustained extreme drought conditions, leading to the declaration of a Drought State of Emergency that saw reduced water allocations for agriculture and wetland management. To compensate for dwindling surface water supplies, groundwater extraction increased substantially [32,33]. Drought conditions eased in the winter of 2015–2016 and precipitation and snowpack levels in northern California were well above average by early 2017, leading to widespread flooding, but these conditions were ephemeral as the state descended into another severe drought. As the frequency of drought and heatwaves in the region increase [34], so we can expect a corresponding decline in the number of flooding and irrigation days.
In terms of the projected impacts on nutrient removal, one must consider the role that hydrology plays in mediating their dynamics. Plant uptake may be a significant avenue depending on inflow loads, species, growth rate and plant age. However, wetlands managed for wintering waterfowl include a few practices that may not align strongly with traditional water treatment goals. An example is the practice of vegetation removal from seasonal wetlands, typically in the late summer, to create open water areas for waterfowl. Plants removed prior to plant senescence may limit nutrient removal capacity. Furthermore, it is unlikely that harvested plant material is removed from the wetland prior to fall flooding, thereby recycling nutrients back into the system rather than eliminating them. Sedimentation of particulate phosphorus may cause eutrophication in downstream waters [35]. Emergent plants of the genus Typha, Cyperus, Scirpus, Juncus and Sagittaria with relatively fast growth rates and large below-ground biomass are used in constructed wetlands to extract nutrients from pore water and increase nutrient retention [36,37]. These species comprised only about 33% of the area of seasonal wetlands in this study and even less in permanent wetlands. Previous studies found that wetland plants can remove upwards of 4% of nitrogen and phosphorous but may release phosphorous after long periods of inundation. Delayed mowing and removal of harvested biomass could progressively reduce nutrient loads in restored wetlands. Establishment of fast-growing emergent species at key locations in the wetland, such as outflows and along sloughs, could improve uptake.
A review of empirical evidence for effective nutrient removal by constructed and restored wetlands in agricultural settings in the CCV and elsewhere in the world has demonstrated effectiveness [38,39]. Under low loading rates (0.4–2.0 g N m−2 d−1), plants have been reported to remove up to 30% of nitrogen; however, uptake declined significantly under higher loads (3.2–15.6 g N m−2 d−1) [40]. The wetlands surveyed in this study received higher loads of total nitrogen (average 11.16 g TN m−2 d−1) in 2015 than in 2018 (1.62 g TN m−2 d−1), and removal efficiencies varied by year rather than by wetland type or loading. Wetlands in this study also received higher nutrient loads than is typically recorded in natural waterways in the region. Long-term records collected from multiple stream gauges in the CCV estimate median total nitrogen concentrations of 0.31 mg L−1 and median total phosphorous at 77 µg L−1 [41]. Our mean TN concentrations at the inflow ranged from 1.5–2.6 mg L−1, while inflowing phosphates ranged between 100 and 270 µg L−1. Interestingly, median concentrations were greater in 2019 than 2020, and further analysis is needed to compare nutrient concentrations in streams to that in irrigation and drainage canals in periods of low flow such as droughts and higher flow.
One restored wetland design feature that yielded a surprising result was serial arrangement of wetlands, a fairly common practice in wastewater treatment systems that typically improves nutrient removal. In this study, nutrient concentrations increased in wetlands along the series. Further research must be conducted to evaluate the impacts on outflowing nutrient loads; however, it should be noted that concentrations themselves can have deleterious effects on sensitive species. Lethal and sub-lethal effects of nitrates were detected in North American amphibians at concentrations ranging between 2.5–100 mg L−1 [42]. In the period between 2019 and 2020, we detected concentrations in excess of 14 mg L−1 mainly at inflows indicating degraded conditions in agricultural canals.

5. Conclusions

  • This was the first study examining nutrient dynamics in a broad range of restored managed wetlands over drought and flooding periods in California.
  • The study highlighted the complex nature of hydrological and nutrient dynamics in managed wetlands in California’s Central Valley but indicated some potential for lowering nutrient loads.
  • Hydrology has changed substantially in the last 170 years with shifting emphasis on artificial or manual water application driven by site-specific specific management objectives.
  • Differences in source water quality may be the result of agricultural runoff from adjacent croplands flowing into the shared network of irrigation and drainage canals. Implementation of vegetation buffers at inflows should be explored as ways to limit inflowing nutrients.
  • Wetlands in this region experience frequent water shortages due to drought as well as legislative and management decisions limiting water deliveries when snowpack and reservoir volumes are low.
  • If ambient temperatures rise, coupled with reduced water availability due to recurring drought, we may expect evapotranspiration to increase nutrient concentrations in serially connected wetlands where water is held for some period of time.
  • Despite increasing concentrations in some wetlands, overall reduction in ammonium and nitrate loads to natural waterways and canals may have more long-term biological benefits for species sensitive to water chemistry such as fish and amphibians.
  • Opportunistic wetland restoration opportunities and collaborations with private landowners may still yield multiple benefits if they have adequate access to water supplies and technical guidance for hydrological management.

Author Contributions

Conceptualization, S.N.K.; methodology, S.N.K. and B.D.M.; formal analysis, S.N.K. and B.D.M.; investigation, B.K.H.; resources, E.H.; writing—original draft preparation, S.N.K.; writing—review and editing, S.N.K. and B.D.M.; visualization, L.S. All authors have read and agreed to the published version of the manuscript.

Funding

This research was funded under a U.S. Department of Agriculture-Natural Resource Conservation Service grant number 68-7482-14-509.

Data Availability Statement

Not applicable.

Acknowledgments

We thank J. Isola and J. Prenger for helpful comments in the preparation of this manuscript.

Conflicts of Interest

The authors declare no conflict of interest.

References

  1. Harter, T.; Lund, J.R.; Darby, J.; Fogg, G.; Howitt, R.; Jessoe, K.; Pettygrove, S.G.; Quinn, J.F.; Viers, J.H.; Boyle, D.B.; et al. Addressing Nitrate in California’s Drinking Water with a Focus on Tulare Lake Basin and Salinas Valley Groundwater. Report for the State Water Resources Control Board Report to the Legislature; Center for Watershed Sciences, University of California: Davis, CA, USA, 2012. [Google Scholar]
  2. Jassby, A.D. Phytoplankton regulation in a eutrophic tidal river (San Joaquin River, California). In San Francisco Estuary and Watershed Science; John Muir Institute of the Environment, UC: Davis, CA, USA, 2005. [Google Scholar]
  3. Matiasek, S.J.; Pellerin, B.A.; Spencer, R.G.M.; Bergamaschi, B.A.; Hernes, P.J. Irrigation as a fuel pump to freshwater ecosystems. Biogeochemistry 2017, 136, 71–90. [Google Scholar] [CrossRef]
  4. Aldous, A.; McCormick, P.; Ferguson, C.; Graham, S.; Craft, C. Hydrologic regime controls soil phosphorus fluxes in restoration and undisturbed wetlands. Restor. Ecol. 2005, 13, 341–347. [Google Scholar] [CrossRef]
  5. California Natural Resources Agency. State of the State’s Wetlands: 10 Years of Challenges and Progress; Natural Resources Agency: Sacramento, CA, USA, 2010.
  6. California State Water Resources Control Board. Water Rights. 2022. Available online: https://www.waterboards.ca.gov/waterrights/board_info/faqs.html (accessed on 25 July 2022).
  7. Carpenter, K.D.; Snyder, D.T.; Duff, J.D.; Triska, F.J.; Lee, K.K.; Avanzino, R.J.; Sobieszczyk., S. Hydrologic and Water-Quality Conditions During Restoration of the Wood River Wetland Upper Klamath River Basin, Oregon, 2003–2005 Scientific Investigations Report 2009-5004; U.S. Geological Survey: Reston, VA, USA, 2009.
  8. Carpenter, S.R.; Caraco, N.F.; Correll, D.L.; Howarth, R.W.; Sharpley, A.N.; Smith, V.H. Nonpoint pollution of surface waters with phosphorus and nitrogen. Ecol. Appl. 1998, 8, 559–568. [Google Scholar] [CrossRef]
  9. Central Valley Joint Venture (CVJV). Central Valley Joint Venture Implementation Plan-Conserving Bird Habitat; U.S. Fish and Wildlife Service: Sacramento, CA, USA, 2020.
  10. California Department of Water Resources (CDWR). 2015. Available online: http://www.water.ca.gov/ (accessed on 5 August 2015).
  11. Cronk, J.K.; Fennessy, S. Wetland Plants: Biology and Ecology; CRC Press: Boca Raton, FL, USA, 2001. [Google Scholar]
  12. Dahl, T.E. Wetland Losses in the United States 1780’s to 1980’s; U.S. Fish and Wildlife Service: Washington, DC, USA, 1990.
  13. Day, W., Jr.; Arancibia, A.Y.; Mitsch, W.J.; Lara-Dominguez, A.L.; Day, J.N.; Ko, J.Y.; Lane, R.; Lindsey, J.; Lomeli, D.Z. Using ecotechnology to address water quality and wetland habitat loss problems in the Mississippi basin: A hierarchical approach. Biotechnol. Adv. 2003, 22, 135–159. [Google Scholar] [CrossRef]
  14. Duffy, W.G.; Kahara, S.N.; Records, R.M. (Eds.) Conservation Effects Assessment Project—Wetlands Assessment in California’s Central Valley and Upper Klamath River Basin; U.S. Geological Survey Open-File Report 2011–1290; U.S. Geological Survey: Reston, VA, USA, 2011.
  15. Farr, T.G.; Jones, C.; Liu, Z. Progress Report: Subsidence in the Central Valley, California; NASA’s Jet Propulsion Laboratory: Pasadena, CA, USA, 2015. [Google Scholar]
  16. Faunt, C.C.; Sneed, M.; Traum, J.; Brandt, J.T. Water availability and land subsidence in the Central Valley, California, USA. Hydrol. J. 2015, 24, 675–684. [Google Scholar]
  17. Fisher, J.; Acreman, M.C. Wetland nutrient removal: A review of the evidence. Hydrol. Earth Syst. Sc. 2004, 8, 673–685. [Google Scholar] [CrossRef] [Green Version]
  18. Fredrickson, L.H.; Taylor, T.S. Management of Seasonally Flooded Impoundments for Wildlife; U.S. Fish and Wildlife Service Resource Publication 148: Washington DC, USA, 1982.
  19. Garone, P. The Fall and Rise of Wetlands of California’s Great Central Valley; University of California Press: Berkeley, CA, USA, 2011. [Google Scholar]
  20. Goslee, S.C.; Brooks, R.P.; Cole, C.A. Plants as indicators of wetland water source. Plant Ecol. 1997, 131, 199–206. [Google Scholar] [CrossRef]
  21. Heidel, K.; Roy, S.; Creager, C.; Chung, C.; Grieb, T.; Region IX Central Valley Drinking Water Policy Working Group. Nutrients in The Central Valley and Sacramento–San Joaquin Delta; U.S. Environmental Protection Agency: Washington, DC, USA, 2006.
  22. Johannesson, K. Phosphorus Retention in a Constructed Wetland—The Role of Sediment Accretion. Ph.D. Thesis, Avdelning Institution, Gothenburg, Sweden, 2008. [Google Scholar]
  23. Kadlec, R.H.; Knight, R.K. Treatment Wetlands; Lewis Publisher: Boca Raton, FL, USA, 1996. [Google Scholar]
  24. Kahara, S.N.; Duffy, W.G.; DiGaudio, R.; Records, R. Climate, management and habitat associations of avian fauna in restored wetlands of California’s Central Valley, USA. Diversity 2012, 4, 396–418. [Google Scholar] [CrossRef] [Green Version]
  25. Knobeloch, L.; Salna, B.; Hogan, A.; Postle, J.; Anderson, H. Blue babies and nitrate-contaminated well water. Environ. Health Perspect. 2000, 108, 675–678. [Google Scholar] [CrossRef]
  26. Kim, S.; Jeong, J.; Kahara, S.N.; Kiniry, J.R. APEX simulation: Water quality of Sacramento Valley wetlands impacted by waterfowl droppings. J Soil Water Conserv. 2020, 75, 713–726. [Google Scholar] [CrossRef]
  27. Liu, Q.; Liu, J.; Liu, H.; Liang, L.; Cai, Y.; Wang, X.; Li, C. Vegetation dynamics under water-level fluctuations: Implications for wetland restoration. J. Hydrol. 2020, 581, 124418. [Google Scholar] [CrossRef]
  28. Madani, K.; Rowan, D.; Lund, J. The Next Step in Central Valley Flood Management: Connecting Costs and Benefits. Paper 17; Southern Illinois University Carbondale: Chicago, IL, USA, 2007; Available online: http://opensiuc.lib.siu.edu/ucowrconfs_2007/17 (accessed on 25 July 2022).
  29. Mitsch, W.J.; Gosselink, J.G. Wetlands, 5th ed.; John Wiley & Sons, Inc.: New York, NY, USA, 2015. [Google Scholar]
  30. Keiser, D.A.; Shapiro, J.S. Consequences of the Clean Water Act and the Demand for Water Quality. Q. J. Econ. 2019, 134, 349–396. [Google Scholar] [CrossRef]
  31. Hansen, L.; Hellerstein, D.; Ribaudo, M.; Williamson, J.; Nulph, D.; Loesch, C.; Crumpton, W. Targeting Investments to Cost Effectively Restore and Protect Wetland Ecosystems: Some Economic Insights; Economic Research Service ERR-183: Washington, DC, USA, 2015.
  32. Tomscha, S.A.; Bentley, S.; Platzer, E.; Jackson, B.; de Roiste, M.; Hartley, S.; Norton, K.; Deslippe, J.R. Multiple methods confirm wetland restoration improves ecosystem services. Ecosyst. People 2021, 17, 25–40. [Google Scholar] [CrossRef]
  33. Vymazal, J. Removal of nutrients in various types of constructed wetlands. Sci. Total Environ. 2007, 380, 48–65. [Google Scholar] [CrossRef] [PubMed]
  34. Shi, H.; García-Reyes, M.; Jacox, M.G.; Rykaczewski, R.R.; Black, B.A.; Bograd, S.J.; Sydeman, W.J. Co-occurrence of California drought and Northeast Pacific marine heatwaves under climate change. Geophys. Res. Lett. 2021, 48, e2021GL092765. [Google Scholar] [CrossRef]
  35. Spieles, D.J.; Mitsch, W.J. The effects of season and hydrologic and chemical loading on nitrate retention in constructed wetlands: A comparison of low and high nutrient riverine systems. Ecol. Eng. 2000, 14, 77–91. [Google Scholar] [CrossRef]
  36. Niswander, S.F.; Mitsch, W.J. Functional analysis of a two-year-old created in-stream wetland: Hydrology, phosphorus retention, and vegetation survival and growth. Wetlands 1995, 15, 212–225. [Google Scholar] [CrossRef]
  37. Vymazal, J. Plants used in constructed wetlands with horizontal subsurface flow: A review. Hydrobiologia 2011, 674, 133–156. [Google Scholar] [CrossRef]
  38. O’geen, A.T.; Budd, R.; Gan, J.; Maynard, J.J.; Parikh, S.J.; Dahlgren, R.A. Mitigating nonpoint source pollution in agriculture with constructed and restored wetlands. Adv. Agron. 2010, 108, 1–76. [Google Scholar]
  39. Madurapperuma, B.D.; Amarasinghe, M.D.; Oduor, P.G. Salient ecological functions of a tropical freshwater wetland. Lake Reserv. Manag. 2013, 18, 45–51. [Google Scholar] [CrossRef]
  40. Reddy, K.R.; Kadlec, R.H.; Flaig, E.; Gale, P.M. Phosphorus retention in streams and wetlands: A review. Crit. Rev. Environ. Sci. Technol. 1999, 29, 83–146. [Google Scholar] [CrossRef]
  41. Shanafield, M.; Rigosi, A.; Liu, Y.; Brookes, J. The interaction of flow regimes and nutrient fluxes on the water quality and ecosystem health of a clear, freshwater wetland. Ecol. Soc. 2020, 25, 6. [Google Scholar] [CrossRef]
  42. Rouse, J.D.; Bishop, C.A.; Struger, J. Nitrogen pollution: An assessment of its threat to amphibian survival. Environ. Health Perspect. 1999, 107, 799–803. [Google Scholar] [CrossRef] [PubMed]
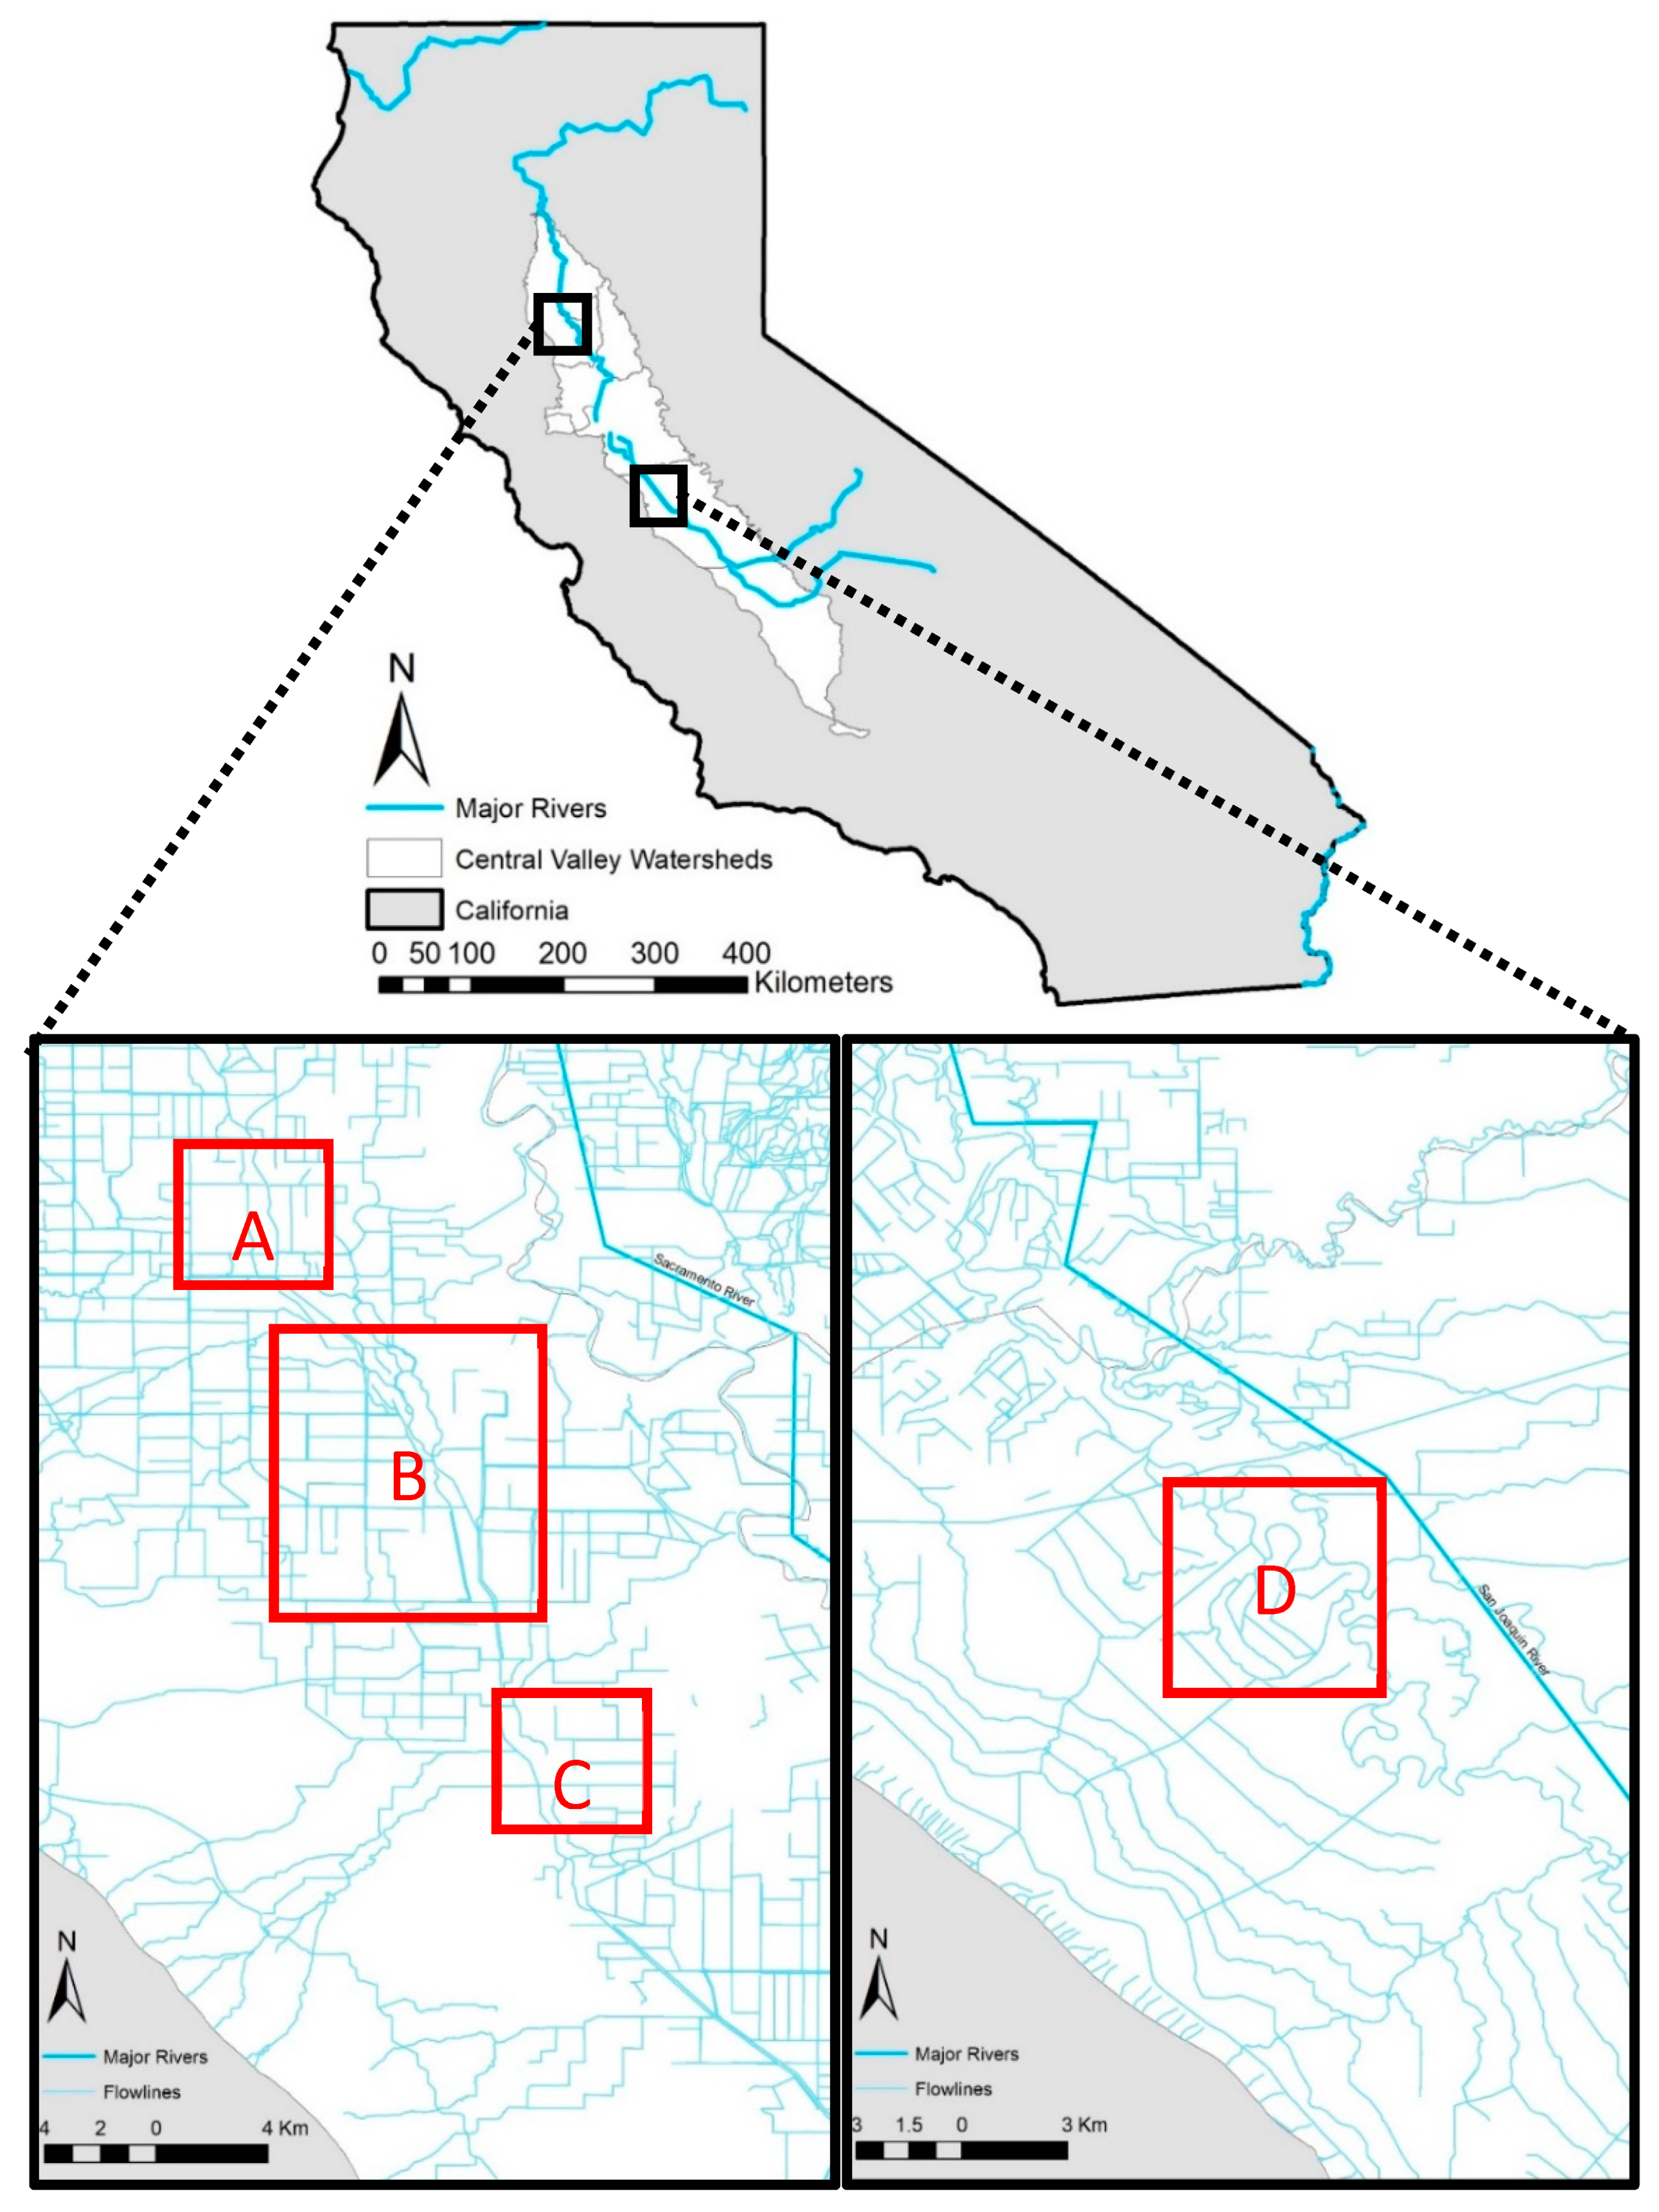
Figure 1. Locations of major rivers, water channels and surveyed restored managed wetland sites in California’s Central Valley. Lower left is the location of the Colusa NWR (B) and Private sites (A,C). Lower right is the location of the San Joaquin River NWR (D) sites surveyed between 2015 and 2020.
Water 14 03574 g001
Figure 2. Wetland hydrology in (A) the periods prior to widespread wetland losses (pre-1850) and (B) following landscape and hydrological conversions (current era) in California’s Central Valley. Solid lines represent hydrological flows, rectangles represent hydrological stocks and diamonds represent decisions driving hydrological flows to stocks. Dashed lines represent effects of factors other than hydrology.
Water 14 03574 g002
Figure 3. Managed wetland hydrographs representing two principal hydrological management categories—(A) permanent, semi-permanent; (B) irrigated seasonal; (C) unirrigated seasonal and (D) privately managed wetlands. Wetlands that were monitored for less than one year are not shown.
Water 14 03574 g003aWater 14 03574 g003b
Figure 4. Mean (±S.E.) nitrogen (total nitrogen, ammonium-nitrogen, and nitrate-nitrogen) and phosphorus (soluble phosphates) measured at managed wetland inflows and outflows in California’s Central Valley during exceptional drought (2015–2016), above average water conditions (2017–2018) and during average water conditions (2019–2020). Controls were unopened 500 mL bottles of drinking water. Significant differences (p < 0.05) are denoted with an asterisk.
Water 14 03574 g004
Figure 5. Mean, first and third quartile, range and outliers of nutrients concentrations measured at managed wetland inflows and outflows in the Sacramento (SAC) and San Joaquin (SAN) Basins of California’s Central Valley from 2015–2019.
Water 14 03574 g005
Figure 6. Estimated nutrient yields (mean kg/ha/day+-SE) at the inflows and outflows of managed wetlands in the Sacramento basin in California’s Central Valley from 2015–2018.
Water 14 03574 g006aWater 14 03574 g006b
Figure 7. Canonical Correspondence Analysis (CCA) ordination diagram of mean nutrient concentration data (NO3-N, Total N, NH4-N and PO4-P), and environmental variables for 8 managed restored wetlands in California Central Valley surveyed from 2019 to 2020. Cross hairs indicate the sites and triangular symbols denote environmental variables. A joint plot of nutrients is displayed in the ordination with direction.
Water 14 03574 g007
Figure 8. Canonical Correspondence Analysis (CCA) ordination diagram of nutrient and physicochemical water quality data for 13 wetlands in the Sacramento Basin that were serially connected. Cross hairs indicate the sites and triangular symbols denote water quality parameters. A joint plot of nutrients is displayed in the ordination with a direction. Arrows indicate the direction of water flow among serially connected wetlands linked by water control structures. Arrow colors signify hydrological connection via serial flow originating from a single source.
Water 14 03574 g008
Table 1. Mean logged depth and proportion of recordings at <120mm deep, which was considered a state of draw-down. Values are empirically measured continuously logged water depths in managed wetlands in Colusa and Stanislaus counties, California USA.
SiteManagementContinuous Water Depth Measurements (Days)Average Logged Depth (mm)Proportion of Recordings <120 mm (%)
T2APermanent7471791.80%
T1:3Semi-permanent7351749.840%
T6:1Irrigated seasonal789330.80.3%
T6:2Irrigated seasonal782310.025%
T6:3Irrigated seasonal778793.817%
T6:4Irrigated seasonal482312.732%
T10:1Unirrigated seasonal639277.535%
T10:2Unirrigated seasonal651268.534%
T10:3Unirrigated seasonal602313.640%
T10:4Unirrigated seasonal740423.023%
T24:3Irrigated seasonaln/an/an/a
T24:4Irrigated seasonal739443.4822%
T24:5Irrigated seasonal749221.0429%
PR2Unirrigated seasonal10715.22
PR1Unirrigated seasonal557312.230%
PR4Unirrigated seasonal904465.760%
PR3Unirrigated seasonal577334.970%
SJ14 (Upper White Lake)Reverse cycle108601.10%
SJ15 (Lower White Lake)Reverse cyclen/an/an/a
SJ16 (White Lake)Permanent108952.560%
SJ19 (North Vierra)Seasonal108187.350%
Table 2. Mean daily yield of each nutrient measured at managed wetlands under different hydrological management regimes in the Sacramento and San Joaquin Basins of California’s Central Valley from 2015–2018.
Mean Daily Yield (kg ha−1 d−1)
TNNH4-NNO3-N PO4-P
InflowOutflowInflowOutflowInflowOutflowInflowOutflow
Sacramento
Permanent89.412.21394.127.92448.40.737.210.1
Seasonal Irrigated1.67.42.83.832.321.00.21.1
Seasonal Unirrigated1.42.64.20.257.03.40.20.5
Semi-permanent0.19.40.00.10.72.10.16.4
San Joaquin
Permanent3.45.71.02.553.560.60.10.0
Publisher’s Note: MDPI stays neutral with regard to jurisdictional claims in published maps and institutional affiliations.