Article

Characteristics of Dissolved Organic Matter and Its Relationship with Water Quality along the Downstream of the Kaidu River in China

1
College of Geography and Remote Sensing Sciences, Xinjiang University, Urumqi 830046, China
2
Key Laboratory of Oasis Ecology, Urumqi 830046, China
3
Geography Section, School of Humanities, Universiti Sains Malaysia, Penang 11800, Malaysia
4
Departments of Earth Sciences, The University of Memphis, Memphis, TN 38152, USA
5
Xinjiang Bayingolin Mongolian Autonomous Prefecture Environmental Monitoring Station, Korla 841000, China
*
Author to whom correspondence should be addressed.
Water 2022, 14(21), 3544; https://doi.org/10.3390/w14213544
Submission received: 10 October 2022 / Revised: 31 October 2022 / Accepted: 1 November 2022 / Published: 4 November 2022
(This article belongs to the Special Issue Remote Sensing-Based Study on Surface Water Environment)

Abstract

:
The variability in the quality of water that runs along the course of a river, flowing out of a mountain pass, through an agricultural oasis and into a lake, has been a key topic of research in recent years. In this study, the characteristics of dissolved organic matter (DOM) along the river flow, and its relationship with water quality, were analyzed using the Canadian water quality index (CWQI), parallel factor (PARAFAC) and self-organizing map (SOM). The study results include: (1) The conclusion of field sampling along the lower reaches of the Kaidu River and laboratory measurements of water quality parameters, using CWQI to determine the water quality index of the lower Kaidu River, ranging between 59.58 and 93.47. The water quality of the lower reaches of the Kaidu River generally ranges between moderate and good, and can meet the water use requirements of Class II water function standards. (2) The DOM composition of the river predominantly contained three fluorescence components, while the three fluorescence indices of the water body varied less in different river sections. Based on the SOM training model, the fluorescence intensity of the C1 component was larger among the three fluorescence components, followed by the C2 component, and the smallest fluorescence intensity of the C3, which was dominated by humic-like substances, with a high authigenic origin and humification degree. (3) The fluorescence index and fluorescence components were correlated with water quality parameters, and it was found that C1, C2 and C3 were negative and correlated significantly with SO42- and Total-dissolved solids (TDS) concentrations; FI, HIX and BIX showed strong positive correlations with SAL and Cu and negative correlations with dissolved oxygen (DO). This study provides a scientific basis for surface water quality monitoring and water quality pollution management in the Kaidu River.

1. Introduction

Rivers play a major role in regulating climate, developing irrigated agriculture [1], providing water for industry and domestic use, and improving regional ecosystem health [2,3]. Dissolved organic matter (DOM), as an important carrier of pollutants, influences the transport and transformation of pollutants [4,5], with the main sources being exogenous inputs from soils and plankton, as well as endogenous inputs from microbial activities [6].
In recent years, the excitation-emission matrix spectra, combined with the parallel factor (EEM-PARAFAC) method, has been widely used to delve the sources of DOM in water bodies, as well as for surface water environmental quality evaluation and management [7,8,9]. Parallel factor (PARAFAC) can identify the independent spectra of different types of fluorophores, divide the overlapping fluorescence peaks into several independent components, computationally process the 3D fluorescence data [10], and then analyze the EEM matrix, as well as more minute changes, in order to calculate the relative content of each component [11]. Many scholars have successively used the EEM-PARAFAC technique to study the properties of DOM in water bodies, such as the different source characteristics of DOM in the ocean and the mechanism of DOM component changes in nearshore waters, surface sediments, permafrost, etc. [12,13,14,15,16,17].
Recently, the study of EEMs map resolution, based on artificial neural networks, has gradually become popular. The self-organizing map (SOM) proposed by Kohonen [18], from Finland, was effectively applied in the pattern classification of EEMs [2], feature recognition and data dimensionality reduction analysis [19,20]. SOM can compute complex three-dimensional spectral data and extract fluorescence components and deduce correlations with organic matter components [21]. In a similar way to the parallel factor analysis, it can cluster the amount of 3D fluorescence emission (Em) and excitation (Ex) wavelength data [22], characterize the components with self-organizing network weights, and then semi-quantitatively characterize the content of the corresponding organic matter components, as well as qualitatively identify protein-like, microbial metabolites, fulvic acid and huminic acid on the 3D fluorescence spectrum of organic matter [23]. SOM is widely used in clustering analysis of 3D fluorescence data, using “unsupervised learning” models and data mining methods to further analyze data and to overcome the shortcomings of traditional methods [24,25,26].
Conventional water quality parameter monitoring has certain limitations, especially in the process of water quality measurement for long continuous and rapid measurements. Therefore, it is difficult to obtain continuous water quality data. At present, the current situation analysis and evaluation of water bodies is gradually evolving from conventional water quality parameter indicators to the use of comprehensive water quality index (WQI) evaluation [27,28], in order to reflect multiple water quality indicators as a whole for rivers and lakes. The Canadian water quality index (CWQI) has achieved better results in the comprehensive evaluation [29,30,31], which analyzes water quality monitoring data through three main indicators, including range, frequency and amplitude aspects. Then, the WQI and the corresponding water quality level can flexibly evaluate the water quality condition under different water body types (rivers, reservoirs, lakes, etc.), water body scale and evaluation period [28,32]. At present, most of the studies on river water quality analysis using EEM-PARAFAC and SOM technologies focus on the spatial and temporal variation and analysis of organic matter in watershed waters. To the best of our knowledge, these studies have not effectively combined the fluorescence characteristics of rivers with water quality evaluation applied to the spatial variation analysis along the DOM of river water bodies.
The Kaidu River passes through the most important grain-producing base and aquatic base in Bazhou, and finally injects into Bosten Lake, which is the largest inland freshwater throughput lake in China [33]. The lower oasis of the Kaidu River is dominated by agricultural production, and the main stream receives agricultural wastewater and industrial water [34]. Problems with water resources and water environment caused by human activities are a serious threat to the sustainable development of the Kaidu River basin. Therefore, quantitative analysis of the influence of human activities on water environment is critical to water resource utilization and water environment protection, as well as to maintain the sustainable development of the local economy [35].
At present, studies on the DOM transport patterns along some particular aquatic ecosystems, e.g., mountain-river-lake in arid regions, are still relatively rare [36,37]. Therefore, this study is motivated by the fact that water quality in a lake-inlet river, that flows through an agricultural oasis in an arid and semi-arid region of China, has not been jointly monitored by the fluorescence techniques. However, the aquatic ecology of the region requires more attention. At the same time, our innovation lies in our selection of the downstream of Kaidu River, a grazing basin in the northwest arid alpine region, that drains into Bosten Lake, as the study area. Hence, we used multiple techniques, such as CWQI, EEM-PARAFAC and SOM methods to understand the spatial variability of DOM to achieve an analytical study for rapid and effective stable monitoring of river water quality, linking the water quality of the Kaidu River with the fluorescence properties of the DOM, and then discussing them together. This paper aims to answer the following questions: (1) What is the current water quality status of the lower reaches of the Kaidu River? (2) How does the DOM change along the river direction? (3) What is the relationship of fluorescence characteristics between DOM and water quality?

2. Materials and Methodology
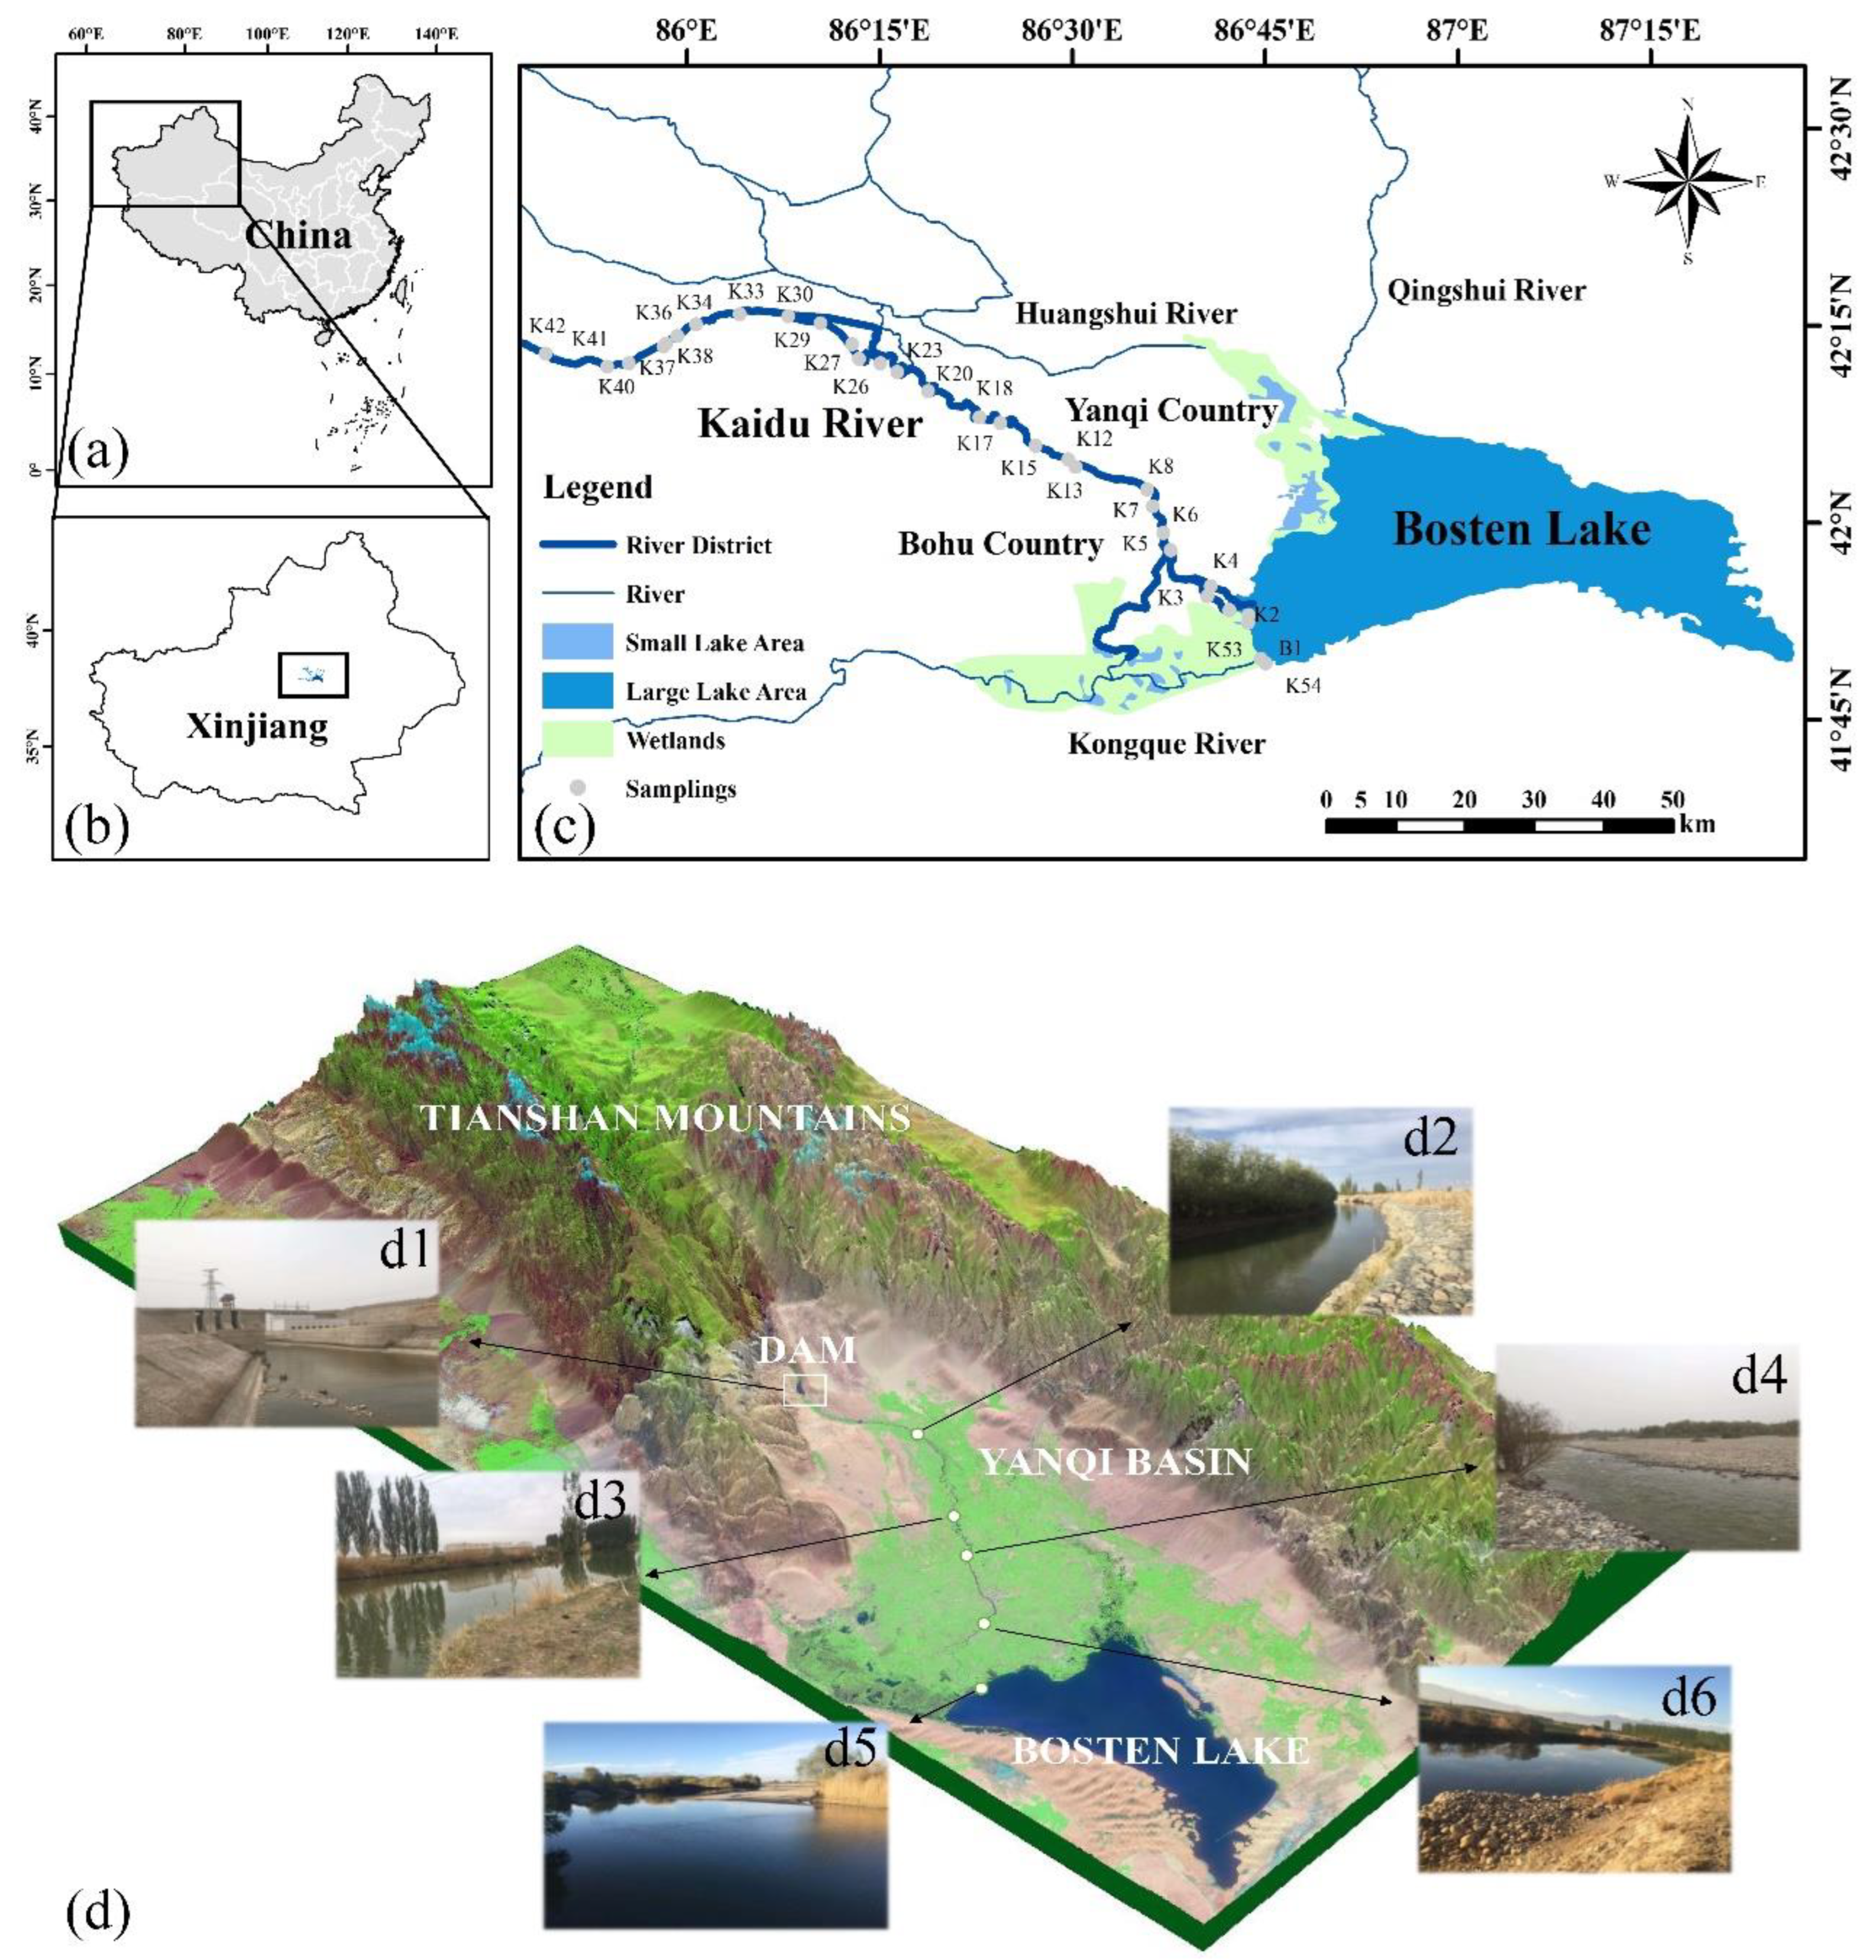
2.1. Study Area

The Kaidu River is located in the southern part of the Tianshan Mountains and the northern part of the Yanqi Basin in the Xinjiang, within the Bayingoleng Mongol Autonomous Prefecture. The geographical coordinates of the Kaidu River Basin are between 82°58′–86°55′ E and 41°47′–43°21′ N, with a basin area of about 4.79 × 10⁴ km2 [34]. The basin sits in a temperate continental arid climate, with an average annual precipitation of 276.7 mm/year. The total length of the Kaidu River is about 560 km, recharged by a mixture of snow, ice melt water and precipitation, flowing through the Yanqi Basin and then injecting into the largest inland freshwater lake in China, Bosten Lake [38]. The watershed elevation is approximately 1031–1200 m, with a high northwest and low southeast trend, surrounded by high mountains. It can be divided into the Tianshan Mountains and intermountain plains in the northern headwaters, the alpine valley areas in the middle reaches, and the alluvial fans and oasis plains in the lower reaches [39]. As shown in Figure 1, the selected downstream oasis area is in the Yanqi Basin, Xinjiang, located between 85°42′–88°00′ E, 41°35′–42°30′ N. The downstream plain area is flat and well vegetated, and is a densely populated agricultural and pastoral area [40]. Yanqi County is located in the middle downstream section of the river and predominantly produces food and cash crops, such as cotton, sugar beets, industrial tomatoes and pigmented peppers. On the other side, Bohu County is located at the downstream end and primarily produces food and cash crops, such as rice, wheat, maize and cotton. Throughout the downstream oasis, animals, such as sheep, cattle, horses and chickens, are raised [41].

2.2. Sample Collection
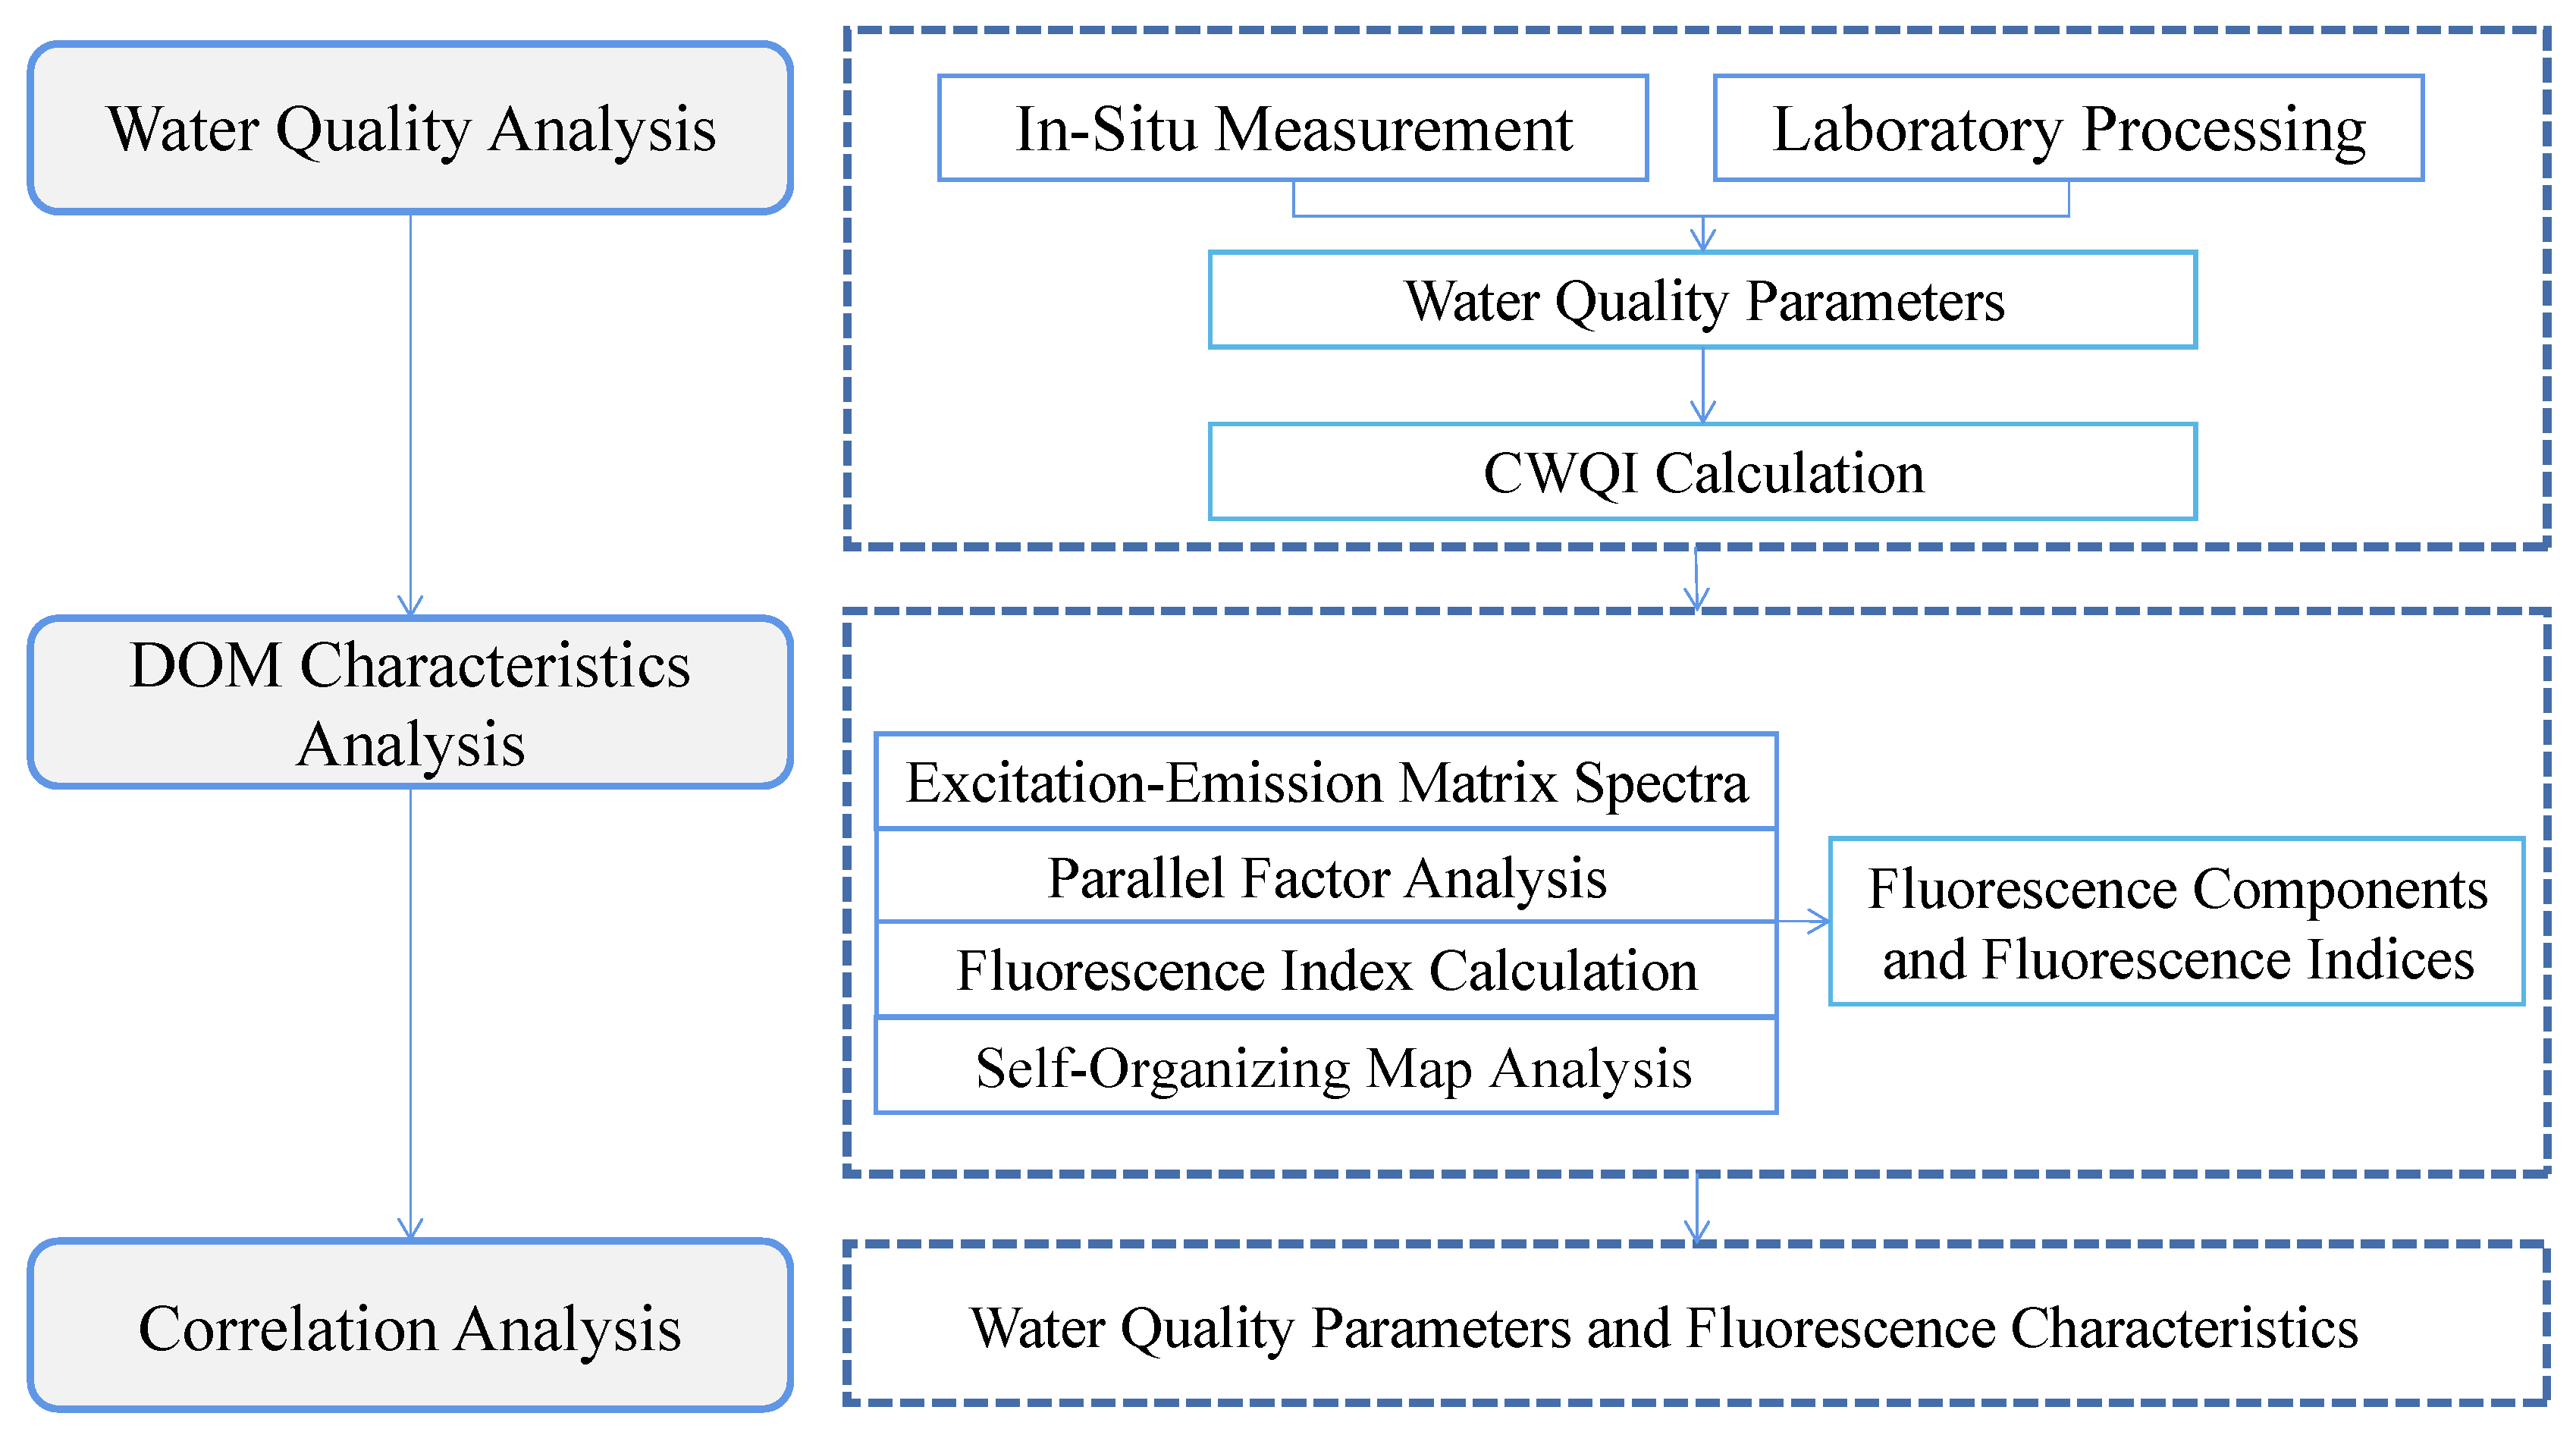
The water quality data were collected in May 2021, and the location of the sampling points were recorded simultaneously with a handheld GPS (Figure 1c). In addition, the landscape distribution around each sampling point was also recorded. The areas located along the Kaidu River, including the urban area of Yanqi County; the agricultural land of Bohu County; the oasis of Yanqi Basin; the dry canal of Yanqi Dam; the periphery of the lake of Bosten Lake; the lake island of Bosten small lake area; the inlet of Bosten Lake Nature Reserve; and the regiment and village along the route, were considered during the samples collection. A total of 31 sampling points were selected for analysis and discussion of the three-dimensional fluorescence changes of water bodies. Table 1 lists the water quality index and the experimental methods used in this study; for instance, a water quality detector (YSI600, YSI, Yellow Springs, OH, USA) was used to detect and collect the pH and dissolved oxygen (DO) parameters in the field. Once this was completed, the samples were stored in a refrigerated box below 4 °C and brought back to the laboratory. As shown in Table 1, this paper selected physical, chemical and biological water quality parameters, such as total phosphorus (TP); chemical oxygen demand (COD); ammonium nitrogen (NH4+-N); etc., to indicate the quality of the water environment (water body), the degree of excellence, and trends in the characteristics of various substances in the water indicators at the same time. Whatman GF/F Glass fiber filters (after sintering for 5 h in a 450 °C muffle furnace) were used to filter the samples, with 0.45 μm filter membranes to determine the three-dimensional fluorescence spectra using a Cary Eclipse fluorescence spectrophotometer (F-7000, Hitachi High-Technology Corp., Tokyo, Japan).

2.3. Data Analysis

The fluorescence data were processed based on the trilinear decomposition theory, and then the 3D fluorescence spectra of DOM were de-spectroscoped. The pre-processed data were then modeled using the DOM Fluor toolbox, available in the Matlab 2016a software, for parallel factor model analysis, and for residual analysis to test the validity of the PARAFAC model and determine the optimal number of DOM components. The obtained spectra were corrected by subtracting deionized water to ensure the comparability of the fluorescence spectral properties. The method mainly includes the following key steps:
  • Data acquisition and pre-processing: determination of fluorescence data, spectra, internal filtering, dilution of sample concentration, and treatment of Raman and Rayleigh scattering effects;
  • Analysis and processing of outliers: identifying and removing the outliers (outliers can be found when calculating the leverage of the sample), and determining the number of components by repeated iterations;
  • Confirmation of the model: combining with the actual situation, repeatedly.
  • Interpretation of model results: qualitative and quantitative analysis by the variation of fluorescence properties and the ratio of components between samples, as well as the visual representation of the 3D fluorescence spectra by SOM using the Matlab2016a software. The distribution of the sampling points and study area were mapped using the ArcGIS 10.2 software. The mean, standard deviation and correlation analysis were performed in the Origin 9.1 software and SPSS 20 software; p < 0.05 was considered to reach a significant detection level and p < 0.01 was considered a highly significant level. Through the above process, we have obtained the copyright license of the above software through legal means.

2.4. Methodology

The research in this study is divided into three main parts, and the technical flow chart is shown in Figure 2.

2.4.1. Water Quality Evaluation

CWQI is based on the water quality index published by Columbia University, and the method is now widely used in Canada and other countries, which calculates whether the water quality monitoring data exceed the water quality standard limits from three aspects: range, frequency and amplitude [32]. In this study, the water quality was evaluated using eight water quality indicators, including NH4+-N, TDS, BOD5, Cr6+, TN, TP, COD and DO. Its formula is:
C W Q I = 100 - F 1 2 + F 2 2 + F 3 2 1.732
F 1 = P N × 100
F 2 = q M × 100
F 3 = Q 0.01 Q + 0.01
Q = 1 M S
where F1 for more than the standard limit of water quality parameters accounted for the percentage of the total number of monitoring parameters; F2 for more than the standard limit of the number of monitoring data; F3 for the amplitude; P for the number of exceeded standards; N for the total number of water quality monitoring; q for all monitoring data in the number of exceeded standards; M for the total number of water quality monitoring data; S for the measured value of substandard water quality indicators deviated from the standard value of the times. For the upper limit of the general water quality indicators, the calculation formula is [42]:
S = c i c s 1
For water quality indicators that cannot be lower than a certain limit value, the calculation formula is:
S = c s c i 1
where, Ci is the measured value and Cs is the standard limit value of the corresponding index.

2.4.2. Excitation-Emission Matrix Spectra

A 150 W xenon lamp was used as the excitation light source, and the voltage was set to 700 V. Then, a Hitachi F- 7000 high-sensitivity fluorescence spectrometer was used for analysis; the Ex wavelength was scanned from 200 to 450 nm, the Em wavelength was scanned from 250 to 600 nm, the increments of both Ex and Em wavelengths were set to 5 nm, the slit width was 5 nm, and the scanning speed was 2400 nm/min. The scanned samples were diluted to reduce the effect of fluorescence quenching, until their UV absorbance at 254 nm was less than 0.1 [43]. The scanned spectra were deducted using deionized water in the region of Em < Ex + 20 nm to reduce the effect of Raman scattering, as well as primary Rayleigh scattering on the spectra, and the effect of secondary Rayleigh scattering on the EEM was eliminated by deducting the region of Em > 2Ex − 20 nm.

2.4.3. Parallel Factor Analysis

The PARAFAC is a method to resolve the 3D fluorescence spectra by decomposing the 3D array of EEM data into loading matrices, using the alternating least squares principle [44]. The pre-processed data were entered into the Matlab2016a software for PARAFAC, and the validity of the PARAFAC was ensured by residual analysis and split-half analysis in order to finally determine the optimal number of DOM components for model data uploading to the Open Fluor (https://openfluor.lablicate.com (accessed on 16 January 2022) The model data were uploaded to the Open Fluor database for matching (TCC, Tucker correlation coefficient > 0.95) to obtain the information of the corresponding components. Among them, the PARAFAC model is calculated as shown below:
x i j k = f = 1 F a i f b i f c i f + e i j k
where x i j k is the intensity of the data array for the ith sample at the Em wavelength jth and Ex wavelength k; a i f is the factor score, and denotes the percentage of the concentration of the fth component in the concentration of the ith sample; b i f , c i f are the loadings, which are the relative values of the jth Em spectrum and the kth Ex spectrum to the fth component, respectively; e i j k is the residual element.

2.4.4. Fluorescence Index

In order to further explore the characteristics of DOM in water bodies, three fluorescence indices were selected in this study, namely, the fluorescence index (FI); the biological index (BIX); and the humification index (HIX). FI is the ratio of fluorescence intensity when the Ex wavelength is 370 nm and the Em wavelength is 450 and 500 nm, respectively [45]; HIX is the ratio of the average fluorescence intensity in the range of 435 to 480 nm and 300 to 345 nm Em wavelengths at an Ex wavelength of 245 nm [46]; BIX is the ratio of fluorescence intensity at Ex wavelength of 310 nm to Em wavelength of 380 and 430 nm, respectively [11].
F I = F E x = 370 nm , E m = 450 nm F E x = 370 nm , E m = 500 nm
B I X = F E x = 310 nm , E m = 380 nm F E x = 310 nm , E m = 430 nm
H I X = F E x = 254 nm , E m = 435 480 nm F E x = 254 nm , E m = 300 345 nm

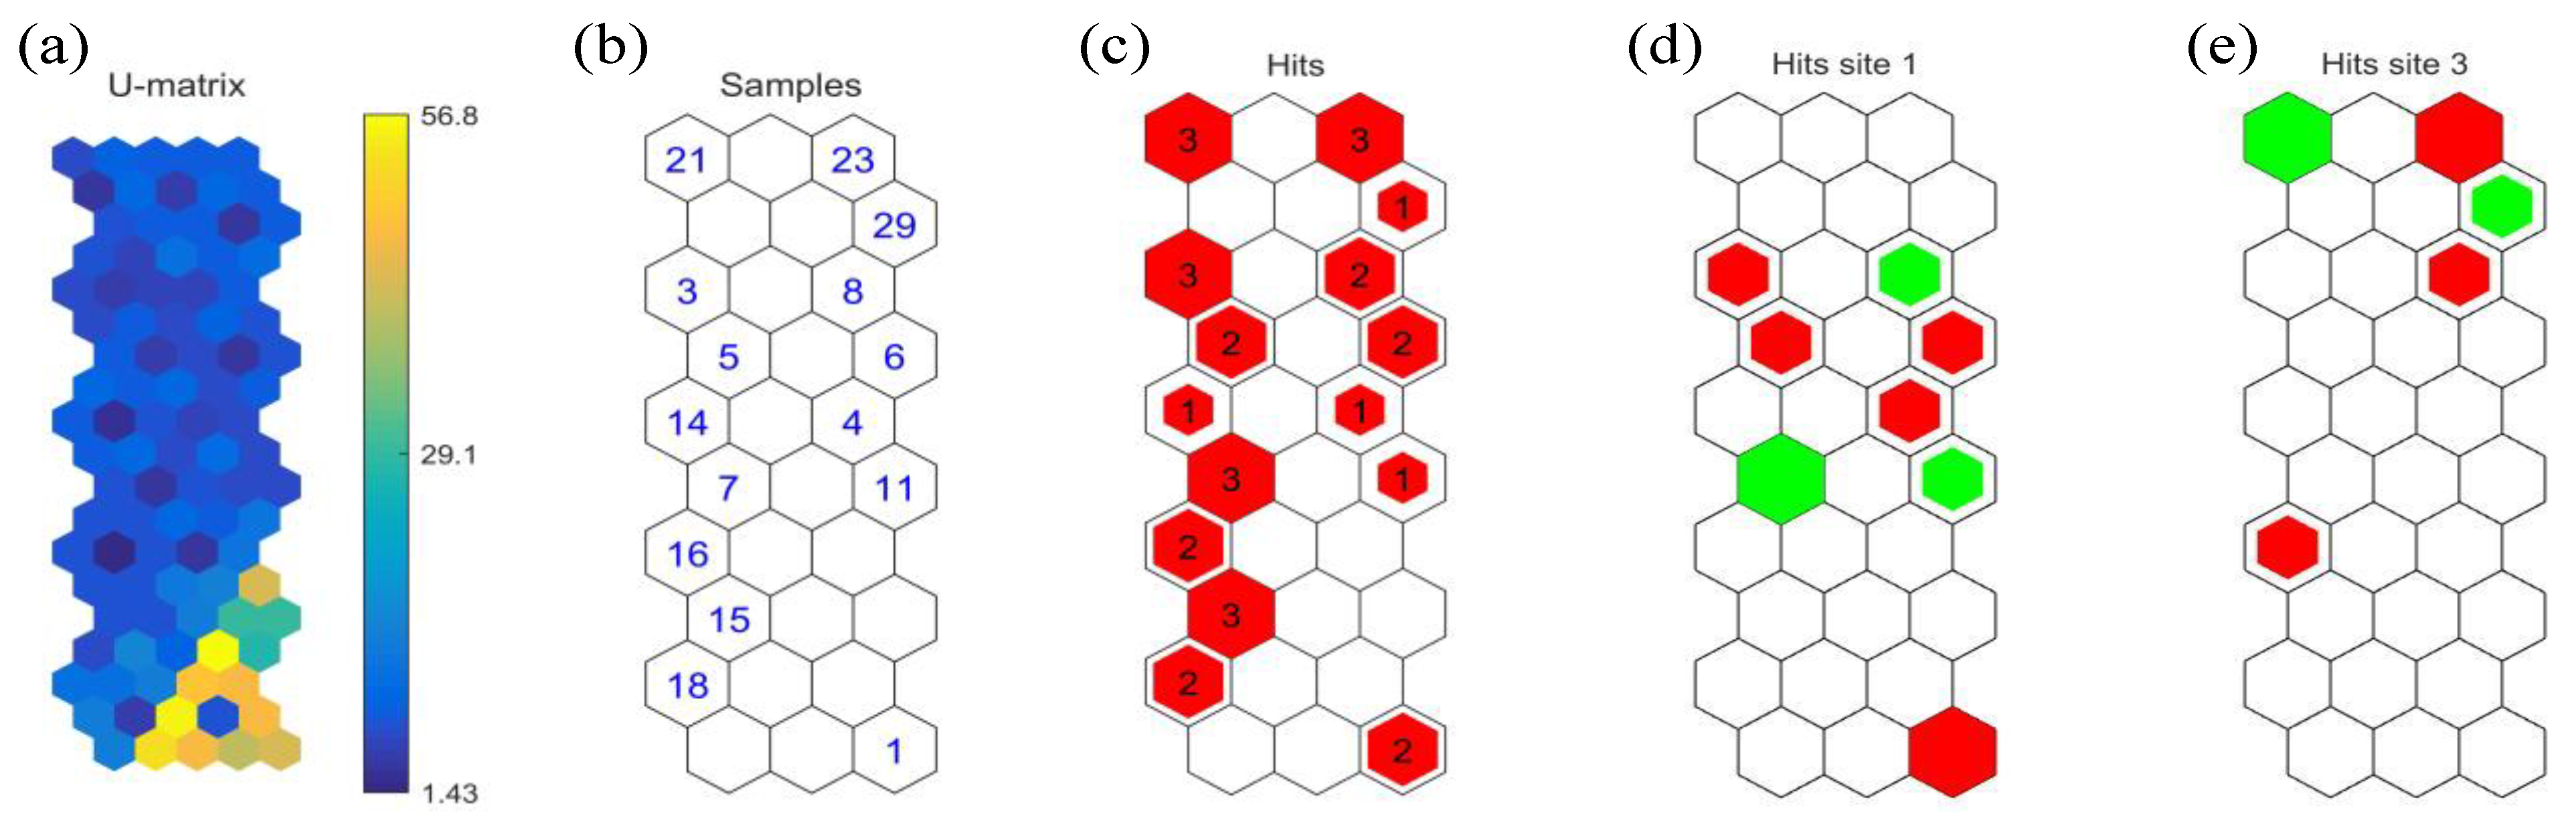
2.4.5. Self-Organizing Map

SOM does not require data to conform to a certain distribution. It has a simple structure and is not affected by local over-smallness. SOM has a better ability to handle detailed information, and its results keep the distribution characteristics and topology of the input patterns unchanged [47]. The K-means algorithm divides data objects into different clusters based on the iterative principle [23], and the SOM method based on unstratified K-Means was selected for the study of 3D fluorescence components in the study area, which is divided into the following steps:
  • The PARAFAC components to be clustered are input to the SOM network, and the number of neurons is selected using topological values that calculate the network size, and the output is determined by the minimum of the quantile error (QE) and topological error (TE) [19] (Kohonen, 2013).
  • The weights obtained from the clustering results of SOM are used as the initial clustering centers to initialize the K-means algorithm, and then the K-means algorithm is executed to cluster them.

3. Results and Analysis

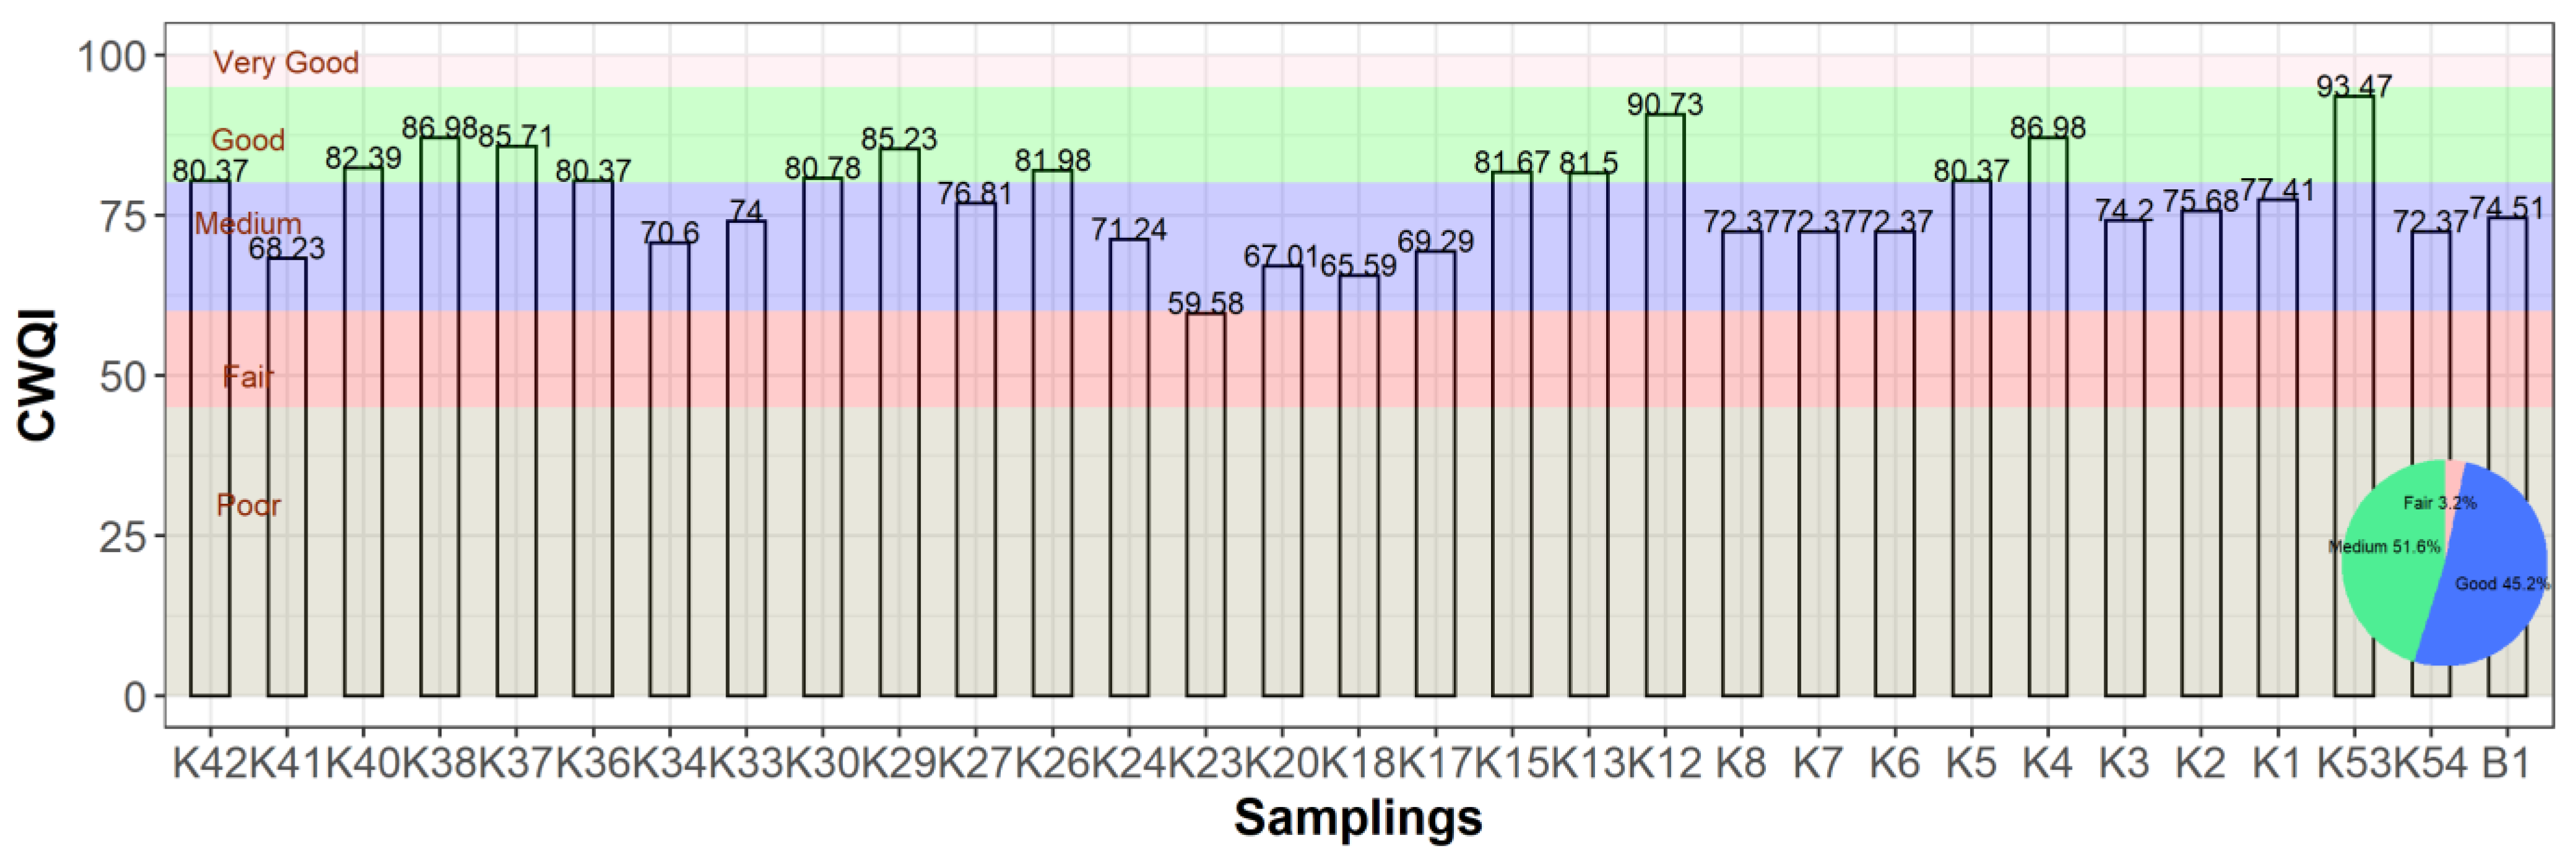
3.1. Status-Quo of Water Quality in the Kaidu River

Before discussing the characteristics of the DOM, it is necessary to understand the current water quality status of the lower Kaidu River. Therefore, the CWQI was taken to provide water quality information quantitatively. Descriptive statistics of water quality CWQI values were conducted for the upper, middle, and lower reaches of the Kaidu River (Table 2) using water quality indicators such as: NH4+-N, Suspended Particulate Matter (SPM), Biochemical Oxygen Demand (BOD5), etc. (Table 1 and Figure 3). Among them, all water quality indicators, with the exception of Total nitrogen (TN) concentration, meet the II class water function standard (GB 3838-2002).
The overall average amount of the TN concentration in the three river sections is 1.5 mg/L; 26% of the sampling points exceeds class V. Certain amounts of pesticides and fertilizers are brought into the agricultural drainage around these sampling points, thus increasing the nitrogen and phosphorus content of the Kaidu River. In addition, the mineralization and decomposition of organic matter, and the release of nutrient salts from the bottom sediment of river water bodies, also cause the increase of TN concentration. DO concentration can be used as an indirect indicator to assess the degree of pollution of water bodies and their ability for self-purification. Most of the DO concentrations exceeded Class II. This is most likely due to the fact that the rising temperature during the dry season results in the rapid growth of algae and other aquatic plants, mainly reeds, in rivers and lakes. The release of oxygen from their photosynthesis can supersaturate the dissolved oxygen in the water and increase the DO concentration; the BOD5 and COD levels in the three river sections are higher than Class II functional standards for waters. The comprehensive reflects that the amount of organic matter in the water body is at a low level, indicating that the concentration of organic pollutants in the downstream water body of the Kaidu River is low, and meets the requirements of the water body function.
According to the WQI value, water bodies are classified into five levels: Very good (95–100), Good (80–94), Medium (60–79), Fair (45–59), and Poor (0–44) [30]. Figure 3 indicates that the overall CWQI values in the study area vary significantly, spatially, with values fluctuating between 59.58 and 93.47. The CWQI classification results show that the water quality of the lower Kaidu River is primarily “moderate” and “good”, accounting for 45.16% and 51.61% of the total samples, respectively. The CWQI values in the middle river section fluctuate significantly, with values dropping abruptly to a minimum score of approximately 60, and then gradually increasing. This may be related to the fact that the intensity of human activity gradually increases, and land use tends to be complex, from the middle river section to Yanqi County, via distributed villages and oasis farmland.
After an on-site investigation, we found that the lowest CWQI value (K23), and the nearby points with low quality levels (K20, K18, K17), are located near the local Corps Second Division 21 Mission and Kizanmu village, where local people discharge agricultural sewage, production and domestic water into the main stream and tributaries of the Kaidu River. In the subsequent water quality tests, we also found that the NH4+-N concentration at sampling point K23 was much higher than the standard (1.79 mg/L). The reason for this high concentration of NH4+-N may be due to the large area of fertilized farmland near the site, and the unreasonable use of chemical fertilizers and pesticides, which caused a large amount of nitrogen, phosphorus, and other nutrients to enter the water body, exceeding its self-purification capacity. Therefore, we speculate that the productive life and agricultural activities of local people may have contributed to the poor water quality at the sampling sites. The external pollution into the river causes the abnormal water quality condition at this point. The highest CWQI value (K53) appeared in the lower river section, corresponding to the sampling point located in the regional wetland around the Bosten Lake, which is located in the transition zone between the terrestrial ecosystem in the eastern part of Yanqi Basin and the aquatic ecosystem of Bosten Lake. It has a certain role in purifying water quality and regulating climate. The nearby low water quality points (K1 and K54) are located near the entrance of the artificially constructed scenic spots, around the Bohu Lake and the national highway S206, respectively, both of which have small-scale human activity disturbances. It is evident that the sampling points with low CWQI values (including K34, K7, K41, K3 and K54) are surrounded by several locations with strong human activities, indicating that the influence of human activities on the water quality of regional rivers is extremely obvious.

3.2. DOM Characteristics of the Kaidu River

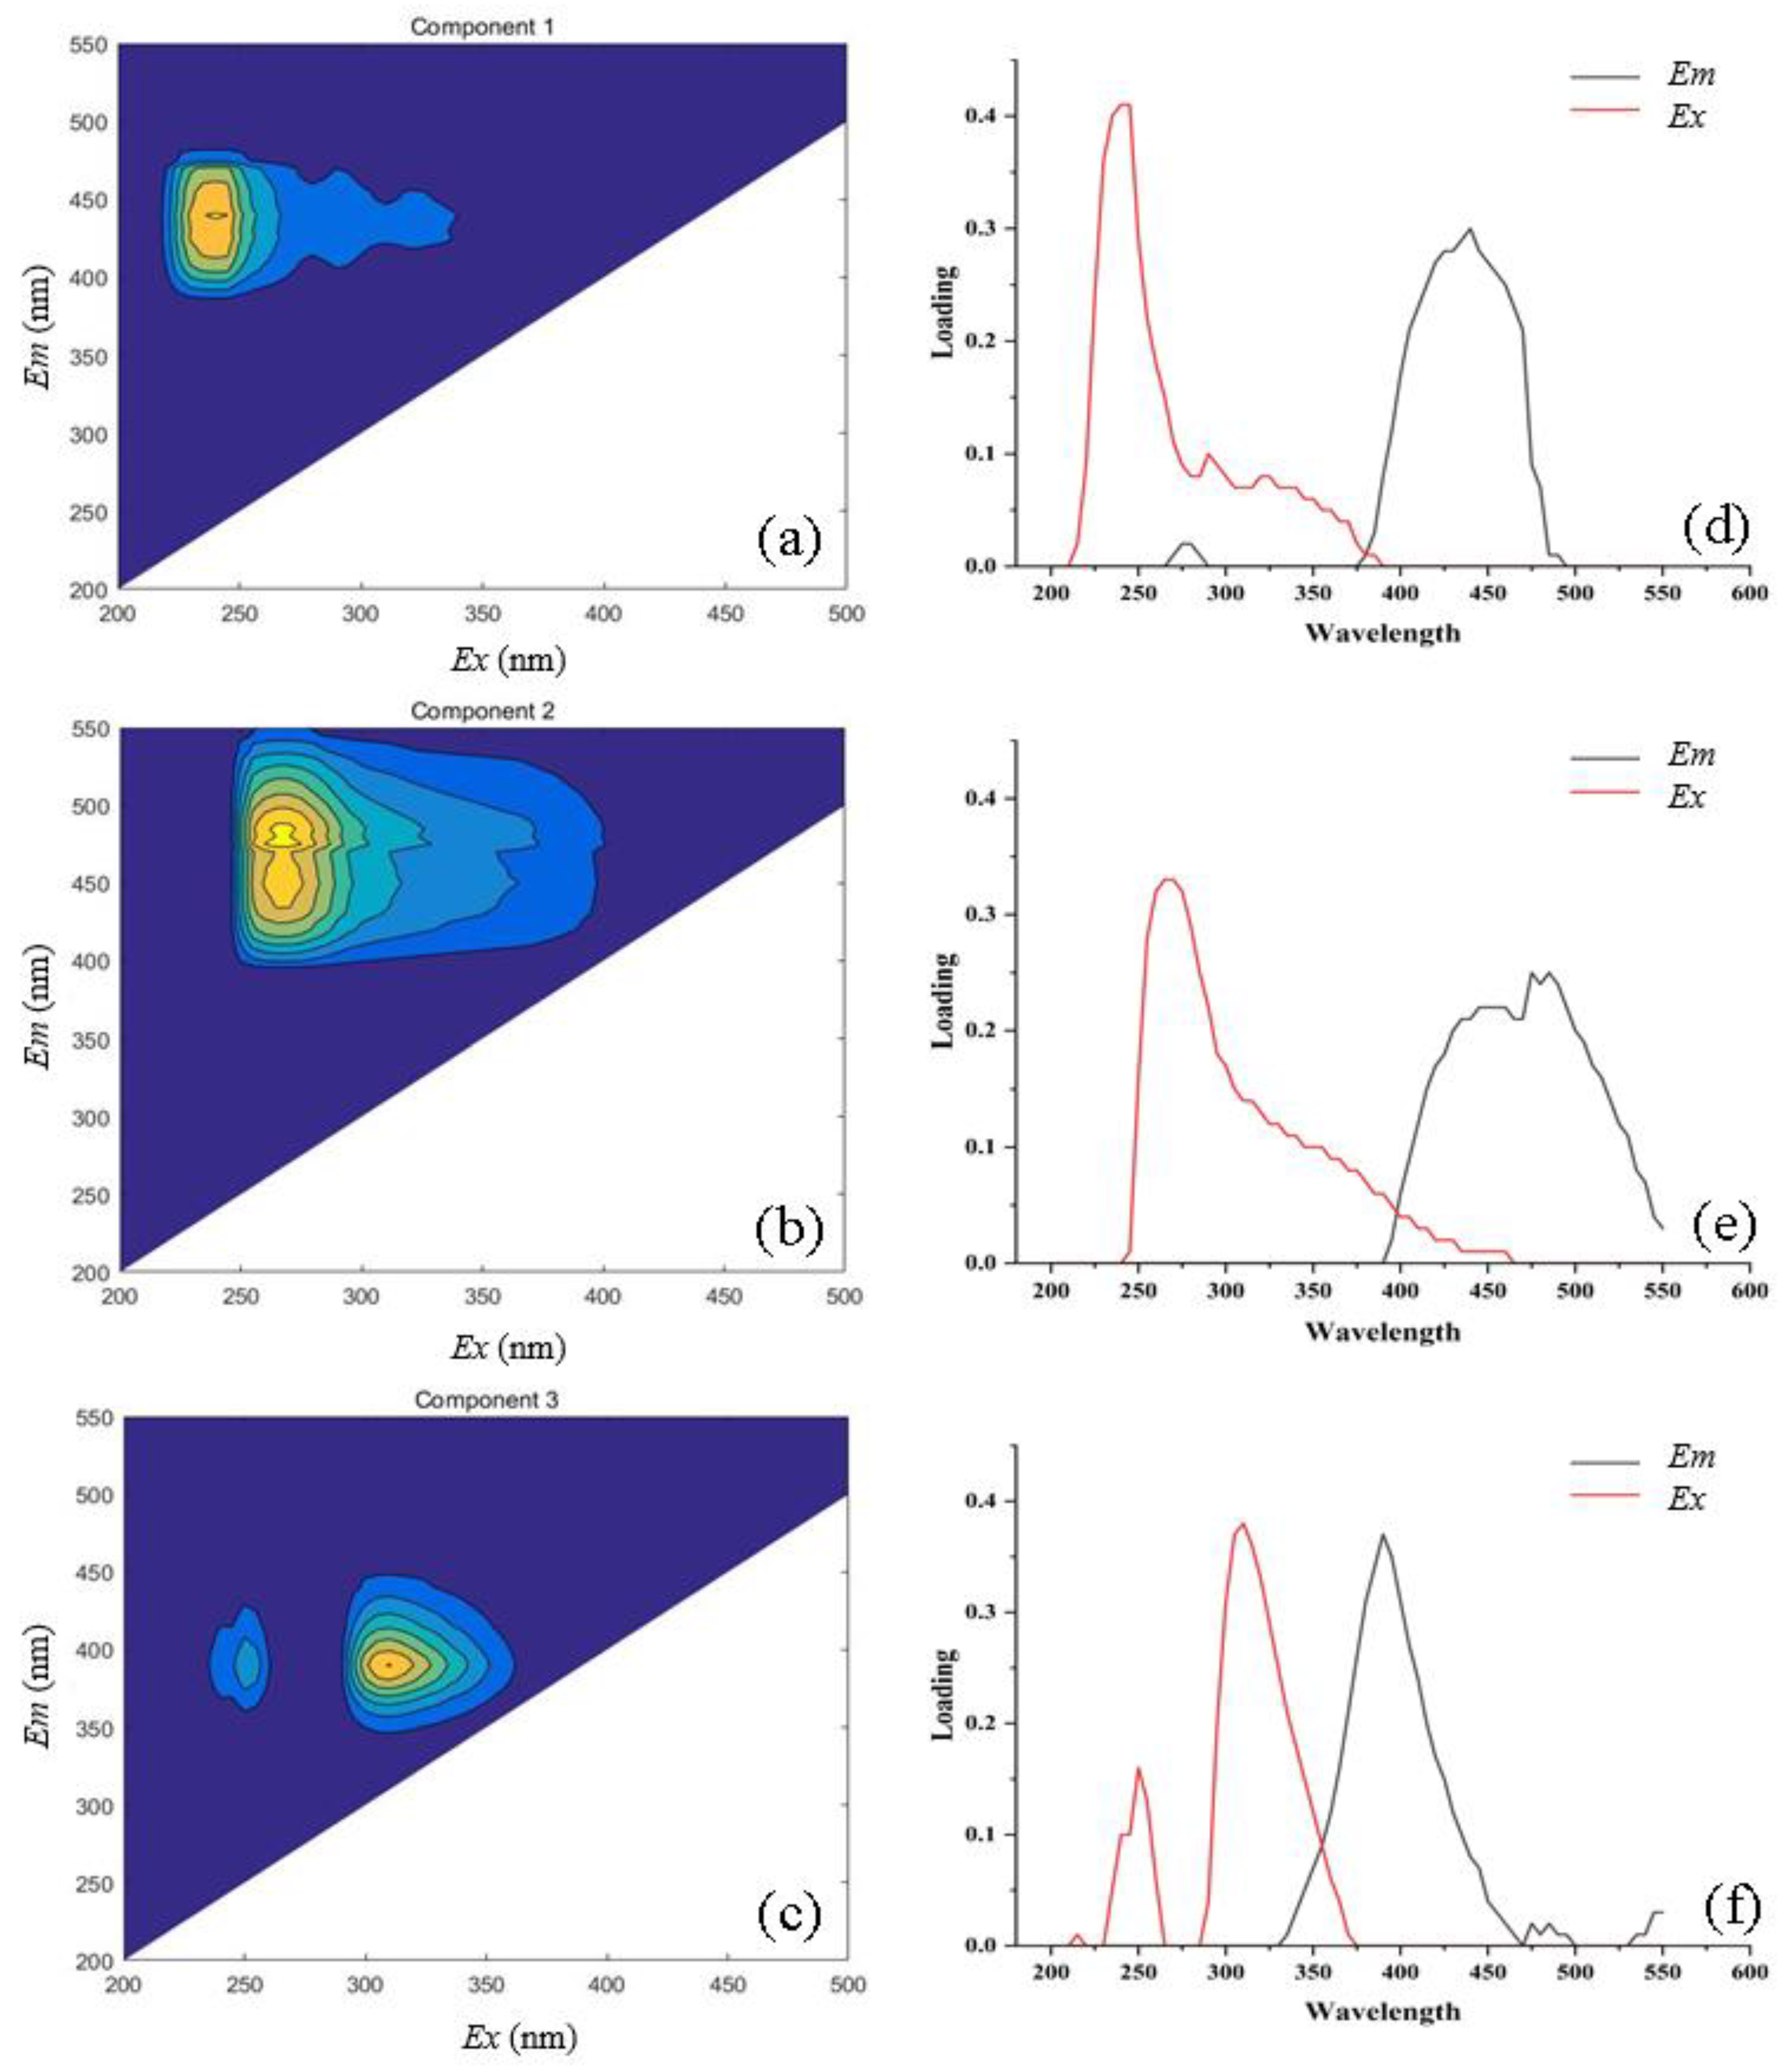
3.2.1. Fluorescence Component Characteristics

Given that the water quality of the Kaidu River is currently in good condition, we used fluorescence techniques to further quantify the DOM characteristics of the area. The adopted parallel factor analysis of the three-dimensional fluorescence spectrum is analyzed for the downstream region of the Kaidu River. The modeled data were uploaded to the Open Fluor (https://openfluor.lablicate.com, accessed on 16 January 2022), in the database matching (TCC > 0.95), in order to obtain the corresponding components of the information, matched with 12 major estuary models in the Open Fluor database [48,49,50]. Three fluorescence components were found, including three humus-like components C1, C2 and C3 (Figure 4).
C1 is commonly considered to be a tracer of terrestrial phase detrital organic matter, widely present in freshwater and originating from phenolics and algal cellular material decomposition in the freshwater system. C1 has a single peak at Ex/Em = 240/440 nm and is considered a UV-like humic substance. The wavelengths correspond to the conventional A peaks, which are mainly associated with highly aromatic, high molecular weight groups that are not readily available for biodegradation and are used to indicate exogenous inputs. The C1 component mainly reflects humic acid produced by terrestrial or aquatic microorganisms when processing DOM, and is negatively correlated with the bioavailability of DOM.
The excitation and emission of C2 for the primary peak was recorded at Ex/Em = 265/475 nm, while the second peak was recorded at Ex/Em= 265/455 nm. For humic acid-like substances, located in the region of the traditional C peak, associated with high molecular weight aromatic molecules, are humic substances composed of high molecular weight and high aromatic organic compounds. C2 is mainly derived from microbial degradation products and the input of surface runoff materials, which is frequently found in wetland and agricultural environments. The double emission peak of C2 is commonly found in aquatic and terrestrial xanthic humic acids, and the fluorescent material in the region of the secondary peak is subjected to a weaker photochemical oxidation than the region of the main peak. Peaks A and C reflect fluorescence peaks formed by humic and fulvic acids, representing the more difficult to degrade DOM, produced by humic species with complex molecular structures.
C3 humic substances have primary peaks at Ex/Em = 310/390 nm and secondary peaks at Ex/Em = 250/390 nm. Compared with C1 and C2, the main peak of component 3 is close to the photochemical degradation of endogenous class phytoplankton to produce M microbial class humic substances. The fluorescence peak M is the fluorescence produced by sea-derived class humic substances, mainly related to soluble organic matter produced by heterotrophic metabolism, with large relative molecular mass, complex and stable structure, not easily biodegraded or utilized; C3 also has a relatively small secondary peak feature, and the Ex peak is in the short-wave C3 can be considered as a mixture of traditional A- and M-peaks, with terrestrial input, related to local production or influence from anthropogenic sources.
The results of the PARAFAC analysis showed that humic-like fluorescence is dominated in the water column of the lower Kaidu River, with C1 and C2 being the most dominant components. The obtained fractions C1, C2 and C3 were classified as humic-like, which have been widely corroborated in environmental studies including forest streams, agricultural runoff, and wetlands [9,43,44,48]. It is a combined product of terrestrial input, microbial activity in the water column, and photochemical oxidation processes. The composition of DOM is very sensitive to human activities [51]. The dense population distribution and more developed agriculture around the lower reaches of the Kaidu River have received more DOM from land-based sources (e.g., domestic sewage and agricultural and rural sewage) along the downstream river. Hence, agricultural and urbanization activities may be responsible for the higher proportion of terrestrial source humus fraction in the downstream water bodies.

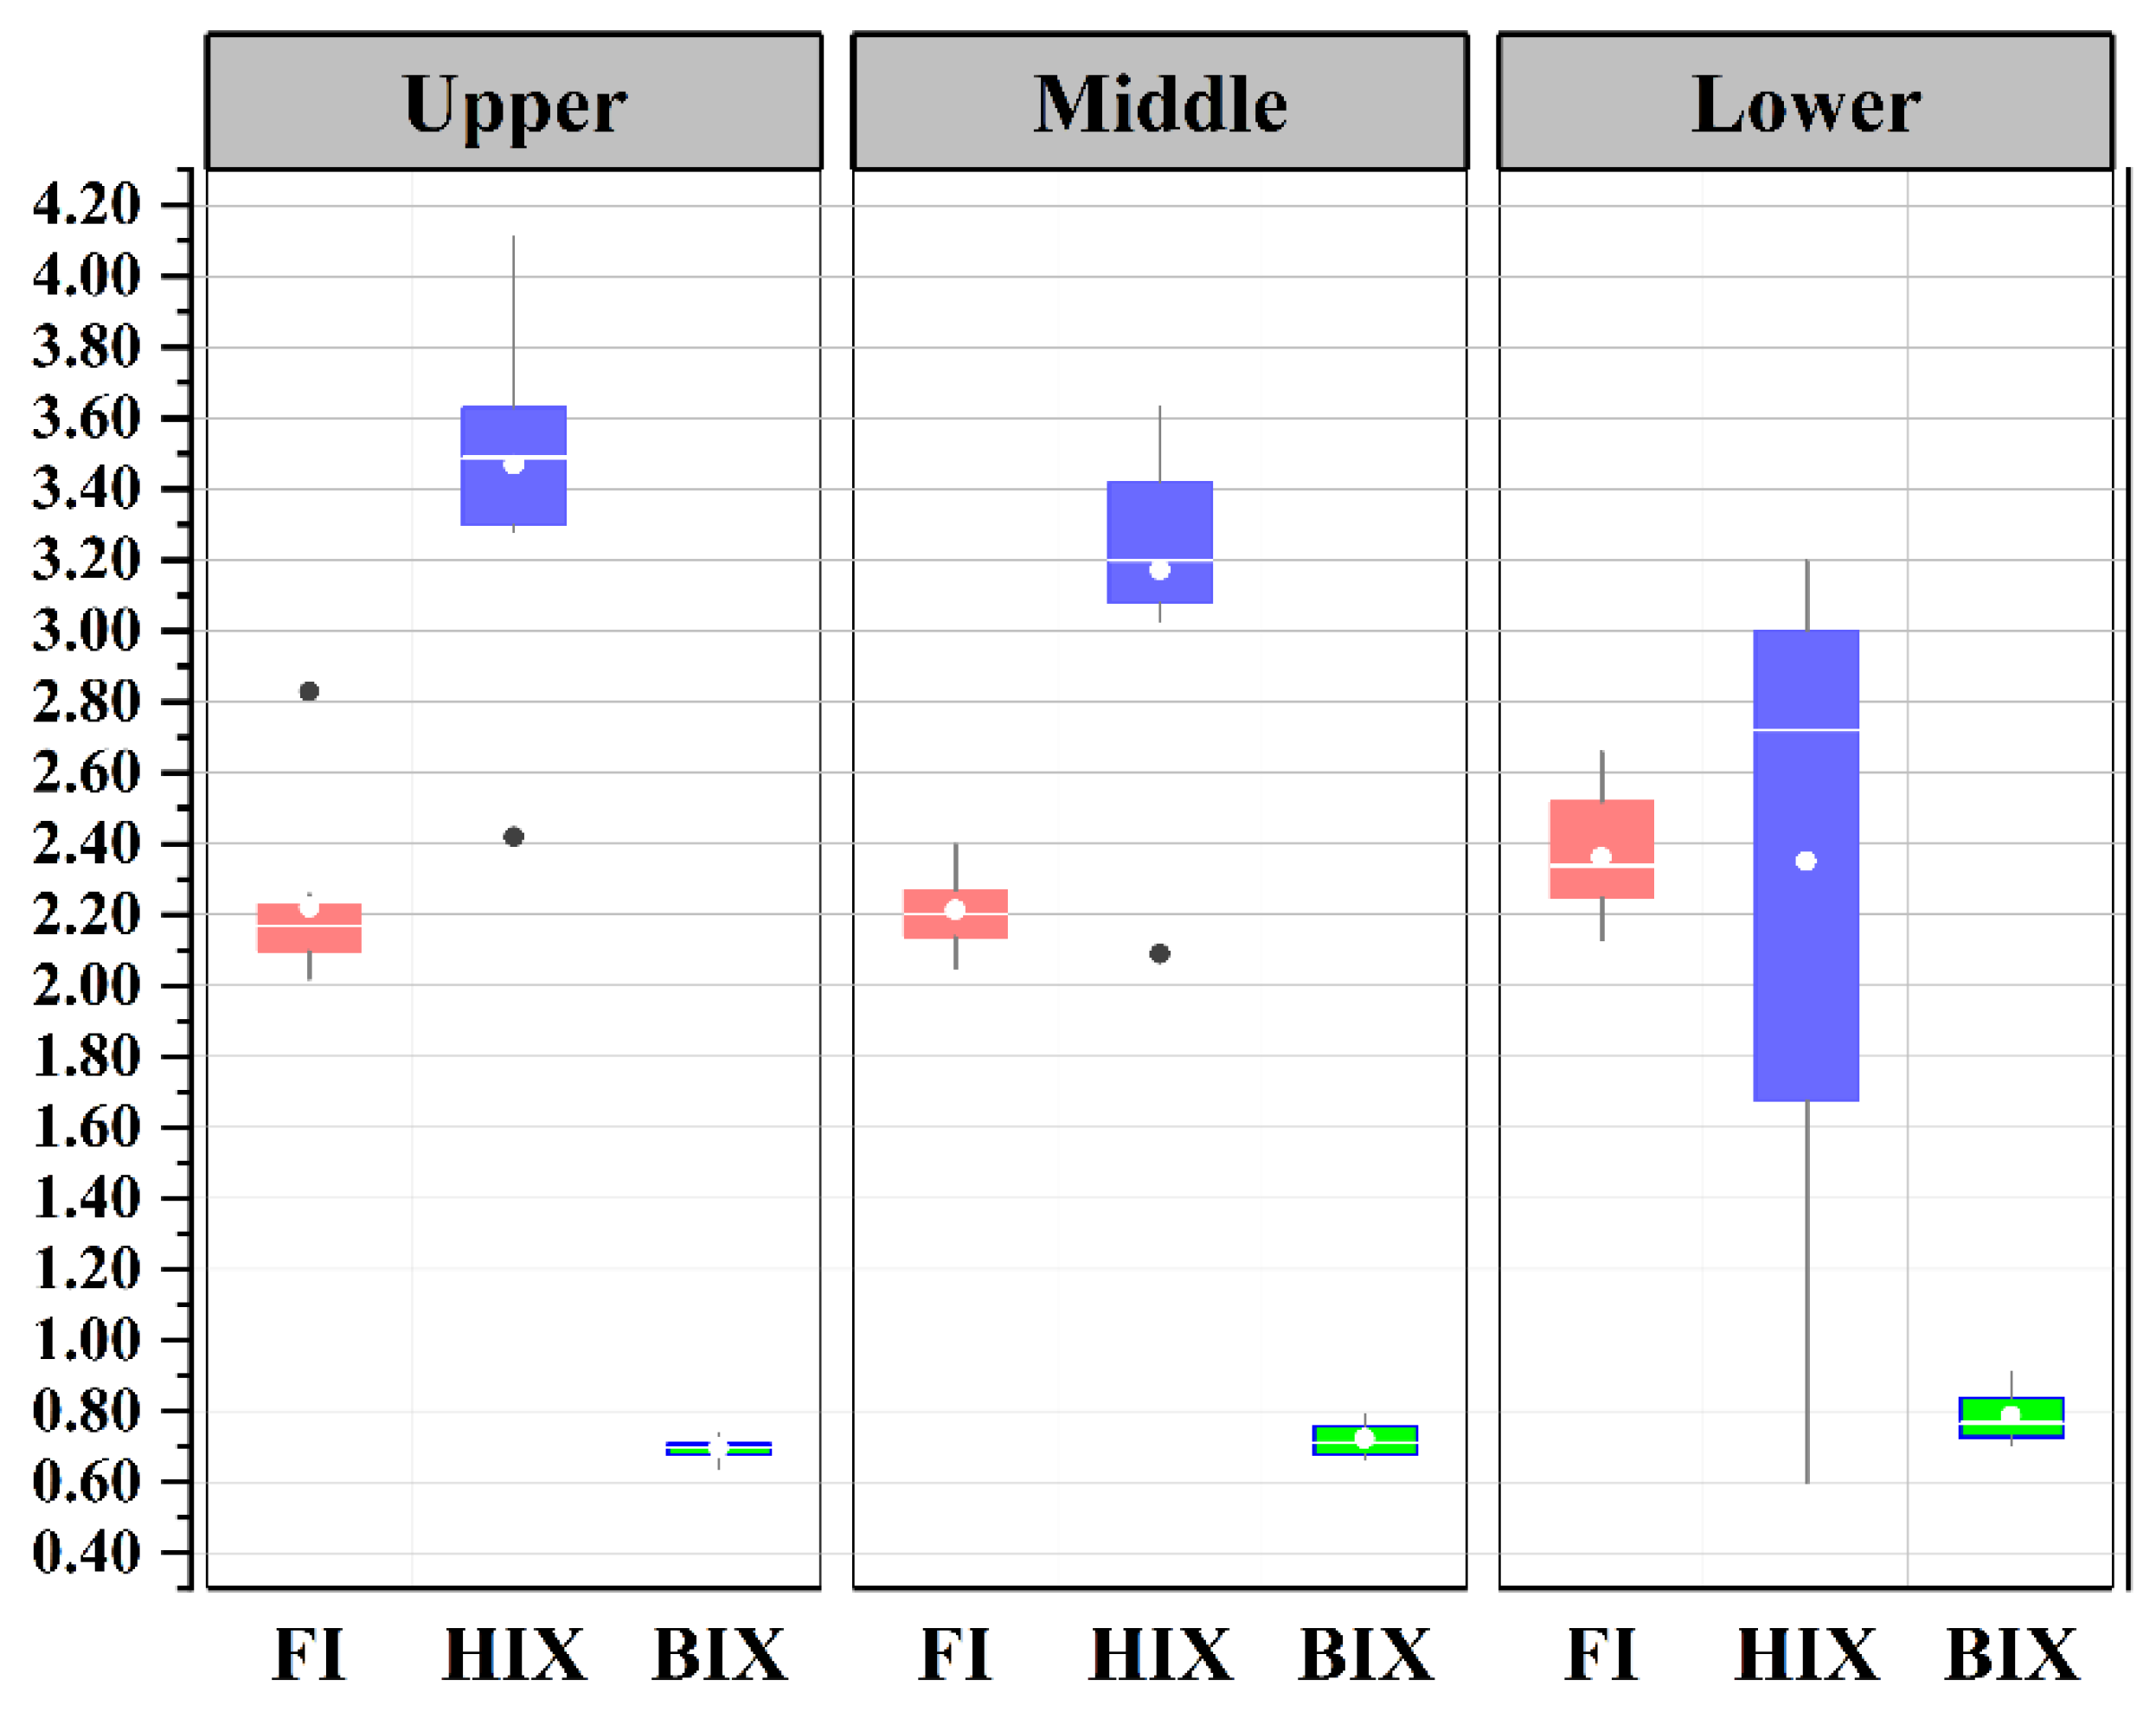
3.2.2. Fluorescence Index Characteristic

FI reflects the contribution of aromatic and non-aromatic amino acids to the fluorescence intensity of DOM. It is therefore often used as an indicator of the source of DOM material and its degradation. FI > 1.9 indicates that microbial metabolism is the main source of humic substances in DOM, while FI < 1.4 indicates that terrestrial input of humic substances is the main contribution. The FI values in the study area ranged between 2.02 and 2.83, indicating that the source of humic substances was predominantly endogenous input from autotrophic microorganisms or algal activities. As shown in Figure 5, the trend of FI values of DOM along the river flow in this study revealed that there was a small trend of increasing FI values in the river water, from the upper section to the lower section, until the confluence of Kaidu River into the inlet of the Bosten Lake, where the microbial degradation in the river was enhanced and the exogenous interference was relatively small.
HIX, usually used to characterize the level of humification of DOM, is a measure of the degree of humification of water bodies, and a larger HIX value shows a higher degree of humification and a more stable molecular structure of DOM. When the HIX value is 10~16, the degree of the humification of DOM is high and it is predominantly exogenous input. When HIX is <4, the degree of DOM decay is low and is primarily endogenous input. The HIX values of DOM in the lower reaches of the Kaidu River ranged between 4.11 and 0.6, indicating that the humic characteristics of DOM in the Kaidu River were weak and predominantly from autogenous sources. In addition, the HIX values gradually decreased along the river (Figure 5), showing that the DOM in the lower river sediments was less humified and less stable.
BIX reflects the level of autogenous contribution of DOM in water bodies and is often used to evaluate the relative contribution of endogenous materials to DOM in water bodies and the level of DOM bioavailability. The smaller the BIX value, the greater the influence of terrestrial input and the smaller the contribution of autogenous source. When BIX is <0.8, the contribution of the authigenic source in the DOM component is small; 1 > BIX > 0.8 shows the contribution of authigenic source is large; BIX > 1, DOM shows significant authigenic source characteristics. Figure 5 illustrates that the BIX values in the upper and lower reaches of the Kaidu River ranged between 0.9 and 0.64, and there was a trend of slowly increasing BIX values along the course, most likely due to the enhanced microbial activity with the accumulation of DOM in the river, which promoted the production of its autogenous DOM.
Overall, the fluctuation range of the three fluorescence indices in the sediments of the three reaches along the lower Kaidu River is not large, which indicates that the DOM sources are mainly auto-biogenic humus, with both terrigenous and endogenous characteristics. The degree of DOM humification reflects the terrigenous contribution rate. The higher the degree of DOM humification, the greater the terrigenous contribution of DOM. The change of water quality of Kaidu River along the river direction is mainly influenced by microbial activities and biological or bacterial activities, and the auto-biogenic contribution is the main part.

3.2.3. Fluorescence Index Characteristic

The PARAFAC-SOM model uses the PARAFAC component as an input variable to the SOM to further understand the response of fluorescent components in the SOM map. This method can not only generalize and visualize the change pattern of fluorescent components between different sources and components, but can also further observe the interrelationship between each fluorescent component. Based on the SOM training of fluorescent components, the optimal number of clusters was determined by combining the K-means and Davies-Bouldin index (DBI). The results showed that the corresponding DBI was lowest when the mean variance between the different clustering numbers had values lower than 5%, and the corresponding clustering number was the best clustering result at that time. The weights of the neuron nodes with completed training were input, and the number of clusters was selected by K-means clustering analysis combined with the DBI value as the index, and the results show that when the number of clusters equal to three, the DBI was lowest. Therefore, the fluorescence spectra could be divided into three class regions: Cluster I, Cluster II and Cluster III.
The output results of SOM visualization, based on the PARAFAC-SOM model, are shown in Figure 6 and Figure 7. After the SOM processing, the U matrix is first obtained, as is shown in Figure 6a. The darker the Euclidean distance is, the smaller the Euclidean distance is, indicating that the neuronal features (i.e., fluorescence properties) are similar [21]. In addition, the SOM auto-labeling function automatically labels neurons, as shown in Figure 6b, recording the locations of neurons, and thus reflecting the number of sample mappings and location differences. Figure 6c–e demonstrates that each neuron can be the winning neuron for multiple samples during the training process based on the similarity of the input data.
In the automatic labeling function of SOM with voting mode, only the labels with the most instances are kept. Figure 6 contains 28 sampling points. Combining the distribution of the actual sampling points, it can be seen that cluster 1 mainly includes sampling points around villages and farmlands in the middle section of the lower Kaidu River, cluster 2 mainly includes sampling points around oasis farmlands in Yanqi County and the area around Bohu County, and cluster 3 covers the sampling points around the dams in the upper section of the river and the country roads in the lower section of the river. As the population near the dam in the upper river section and in the road in the lower river section is sparse, human activities are relatively low. The organic matter in the water body primarily comes from algae, decay and dissolution of dead plants and animals, and extracellular secretions of microorganisms, etc. Therefore, the sampling sites of cluster 3 have weaker fluorescence intensity within each component. In order to further understand the reasons for these differences, and to further explore the characteristics of fluorescence components in the lower Kaidu River basin, the C1 to C3 component surface maps need to be analyzed, and each component variable is visualized, as shown in Figure 6, where f indicates the magnitude of fluorescence intensity.
Figure 7 shows the output results of the three components of the fluorescence spectra of different water samples visualized under the SOM neural network, and it can be seen that the values of neurons in the lower left of C1 are higher, those in the lower right of C2 are higher, and C3 is higher with the lower right and middle. Among them, C1 has the highest fluorescence intensity, followed by C2 and C3, indicating that the water samples have more UV-like humic and humic acid-like substances, and less huminic acid-like humic substances. Combining the distribution pattern of the samples in the SOM diagram (Figure 6b–e) and in Table 2, it can be seen that the fluorescence peak of component C1 in Figure 7a corresponds primarily to UV-like humic substances, and the fluorescence intensity is stronger in the river section around the village of Yanqi County Road. The sampling point of the farmland dry canal around the middle river section and the entrance of Bohu Lake, and the most important source of organic substances in the water body, is the terrestrial source input, in addition to the origin of phytoplankton in the component surface analysis of SOM. If the change patterns of a series of SOM component surfaces are similar, it indicates that there is a positive correlation between the variables represented by these component surfaces [25] (Nie, 2018). The color distribution of component C2 in Figure 6b is more similar among the corresponding neurons, indicating a high correlation between component C2. The fluorescence peak of component C2 corresponds to humic acid-like substances, and the strongest fluorescence intensity is at the point where the Kaidu River joins the inlet of Lake Bosten. A trend of gradually increasing fluorescence intensity was found around the roads and villages in the upper river section, around the oasis farmland in the middle river section, and near the mouth of Lake Bosten. The fluorescence peak of component C3 in Figure 7c corresponds primarily to humic acid-like substances in the upper and lower river sections.
In general, the fluorescence intensity of the sampling sites in the study area around the cultivated land, and the small lakes and wetlands around Bosten Lake, are more susceptible to human influence due to the agricultural activities and Yanqi County. A large number of small-scale distributed villages, large oasis farmlands, and rivers entering the lake are distributed around the course of Kaidu River, and therefore, more organic matter such as humus mainly comes from plankton, soil inside the oasis, decaying plants and farmland compost, etc., is present. Meanwhile, organic matter also enters the vicinity of Lake Constance through irrigation water and rainwater. Microorganisms degrade large molecules, such as protein-like substances, to produce small molecules and form stable humus through condensation and aromatization, i.e., the humification process of organic matter. This process leads to a decrease in the content of protein-like material and a relative increase in humic-like material. In addition, the relatively similar component surface distribution patterns of C1 and C3 indicate that UV-like humic substances and humic acid-like substances are homologous; the oppositional component surface distribution patterns of C2, C1, and C3 indicate that humic acid-like humic substances are not homologous to the fluorescent components of UV-like humic substances and humic acid-like substances.

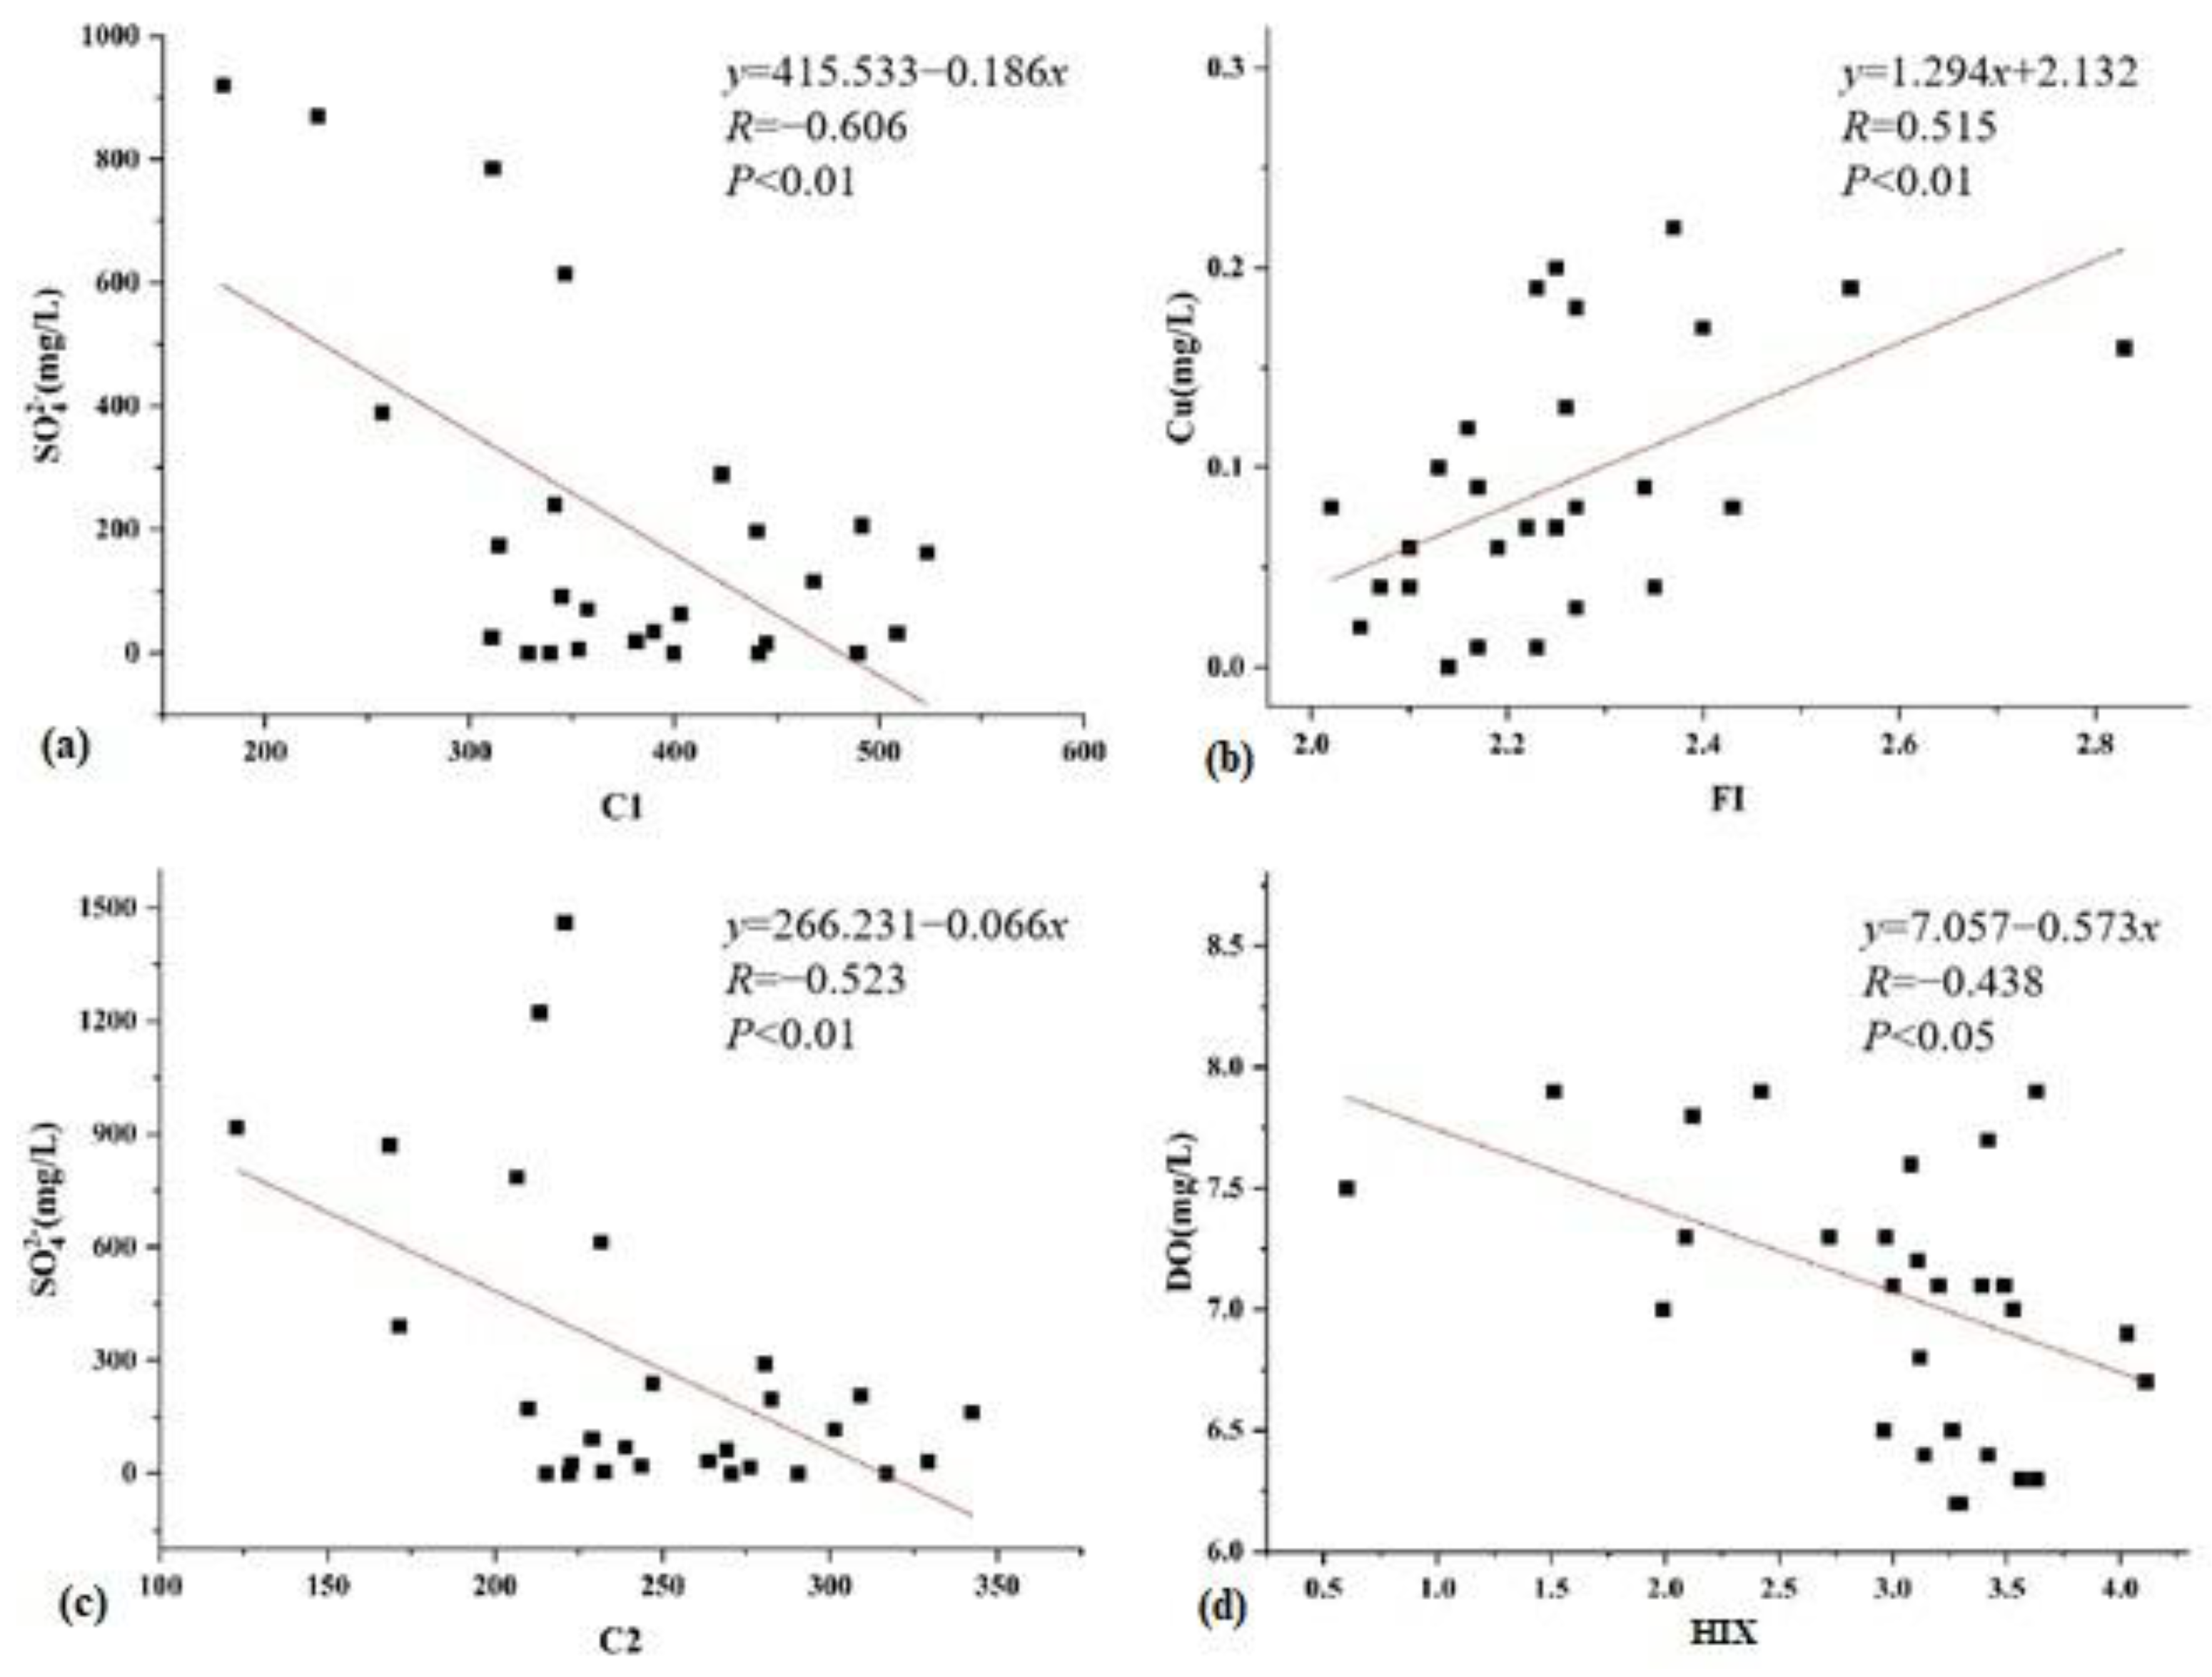
3.3. Linking Visible DOM Fluorescence Characteristics to Water Parameters

To investigate the relationship between the varying water quality, PARAFAC fluorescence components, and fluorescence index, Pearson correlation analysis was conducted for fluorescence components, fluorescence indexes and all water quality indexes, after checking the normality of the data. Next, we selected significant correlation for linear function fitting. C1, C2, and C3 are correlated with the concentration of Salinity (SAL), DO, Cu, SO42− and Total dissolved solids (TDS), among which, the correlation with the concentration of SAL, DO and Cu is weak (0.384, 0.402, 0.396). The three fluorescence components have a relatively strong relationship with the selected water quality parameters (SO42− and TDS), and they are all negatively correlated. The correlation coefficients of R=−0.606 (p < 0.01), R= −0.523 (p < 0.01) and R= −0.375 (p < 0.05), indicate that there was a strong negative correlation between the quantity and source of humus-like components in water and the concentrations of SO42− (Figure 8a,b) and TDS. Although the lower reaches of the Kaidu River Basin are dominated by agriculture, large areas of crops, such as wheat and cotton, had not been cultivated during the sampling period, and the use of pesticides and fertilizers is relatively small. Therefore, the content of TP, TN and NH4+-N is high only in some areas of the oasis, and the influence on the overall water quality of the Kaidu River is not obvious. On the whole, TP, TN and NH4+-N in the lower reaches of the Kaidu River basin are not the main factors affecting the fluorescence spectra and have little correlation with each fluorescence component. Typically, SO42− in water readily form sulphate with alkali metals such as calcium, magnesium and iron. As the level of sulphate ions in the water column increases, total dissolved solids gradually increase. The negative correlation between C1 and C2 and SO42− indicates that increasing SO42− concentration inhibits the formation of polydisperse, aggregates macromolecular organic matter in the water column, and affects the formation of complex organic matter and anaerobic decomposition processes in the water column, from the decomposition products of soil humic substances, aquatic plants and lower plankton through long-term physical, chemical and biological interactions. The production of humus-like substances occurs in the water column.
In addition, by observing the correlation between the fluorescence index and water quality parameters in the lower reaches of Kaidu River, it was found that FI was only strongly correlated with Cu concentration, with a correlation coefficient of 0.515 at a significant level of p < 0.01. HIX has a certain correlation with the three water quality parameters (SAL, SPM and DO), among which, HIX has a strong correlation with the concentration of DO, with a correlation coefficient of −0.438, showing a close negative correlation (p < 0.05) (Figure 8c,d). It can be seen that aquatic respiration in water bodies includes oxygen consumption by zooplankton, phytoplankton and bacterial respiration as well as oxygen consumption by the decomposition of organic matter with the involvement of bacteria. In conditions where other conditions are not controlled, humus, although not directly consuming much oxygen, is an important factor influencing the level of dissolved oxygen in the water environment and indirectly affecting the respiration of the water body. The size of HIX reflects the degree of saponification in DOM components. This indicates that the strength of organic humus in rivers is correlated with the concentration of SAL, SPM and DO, among which the concentration of DO is greatly affected. BIX is strongly correlated with SAL, TDS, and Cr6+ concentrations in water quality parameters, and the correlation coefficient is 0.487, showing a close positive correlation (p < 0.05) and indicating that biological and bacterial activities have a major impact on SAL concentration in the river where BIX is located.

4. Discussion

4.1. Sampling Time and Sampling Location Are Not Universal

Spring, especially during the month of May, is characterized by an arid climate, low rainfall, high evaporation, and low water level in the arid and semi-arid areas of Xinjiang. Due to the downstream outlet of the Kaidu River flowing through a well-developed agricultural oasis into the Bosten Lake, we are more concerned about the water quality in this area; therefore, the 31 sampling points are mainly concentrated in the downstream. This study aimed to understand the changing characteristics of organic matter in rivers during the spring farming period. In addition, this study focused primarily on the water quality characteristics of an inlet river flowing through an agricultural oasis in an arid region of China; we therefore only sampled along the main stream of the river, beginning at its mouth, until it reached the Bosten Lake. In addition, due to the fact that our study is based on a single sampling and the analysis of water quality safety, the data of some water quality indicators are not ideal. In addition, the result of the correlation between fluorescence components and fluorescence indices and water quality indicators is not ideal. However, care was taken to ensure that the samples were representative of various streams in the watershed, and we consider that the analyzed model in the Lower Kaidu River is applicable for arid areas of similar climate, hydrology, and landscape. With the exception of the present study, there are few studies involving slope/gradient that significantly affect DO and DOM, and there is still a need to explore how this affects water quality parameters in the future, in relation to changes in the local topographic environment, such as slope/gradient conditions.

4.2. Lack of Comprehensive Discussion of DOM and DOC

Since the 1960s, the ecological environment of Bosten Lake and its lakeside wetlands has deteriorated dramatically [52,53]. Our study revealed that the sediment DOM in the upper reaches of the river was predominantly terrestrial and soil-based humic substances and fulvic acid-like substances, while the sediment DOM in the lower reaches of the river was mostly authigenic humic substances. This shows a shift from terrestrial to authigenic sources in the composition and nature of the sediment DOM as the river progresses. The DOM components and properties of sediment have changed from terrestrial to autochthonous sources as the river progresses. In this study, the water quality parameters investigated in Section 4 do not include dissolved organic carbon (DOC); therefore, we believe that a comprehensive quantitative discussion of the various components of DOC in subsequent studies is still necessary.

4.3. Suggestions on Environmental Management of the Kaidu River

Cities are primarily located along the rivers in the basin, and the random discharge of pollutants from human activities will have a negative impact on the water quality of the rivers. Therefore, the actual situation of the Kaidu River basin should be combined with the focus on strengthening the allocation, conservation, and protection of water resources, enhancing the construction and management of water conservancy, controlling urban runoff, and ensuring that national discharge standards are met. Farmland and agricultural activities controlling the input of nitrogen and phosphorus coming from upstream, implementing ecological construction, conservation farming and precise fertilization, and reducing nutrient loss from farmland. In addition, natural woodlands and grasslands have an improving effect on water quality, and the coverage area of forests and grasslands should be increased in the lower basin of the Kaidu River. Therefore, controlling surface source pollution from fertilizer use in intensive agricultural and livestock areas, as well as increasing the centralized treatment rate of rural sewage and reducing the discharge of untreated domestic sewage, are some of the vital measures required to prevent the deterioration of water quality in the Kaidu River.

5. Conclusions

In this paper, the water body in the lower reaches of the Yanqi Basin, after the Kaidu River passes out, was taken as the research object. Combined with the CWQI, PARAFAC and SOM methods, the fluorescence characteristics of DOM in the lower reaches of Kaidu River and their relationship with surface water quality indices were quantitatively analyzed. The following conclusions are drawn:
(1)
At present, the CWQI of the lower reaches of the Kaidu River range between 59.58 and 93.47, which is generally considered medium to good, and meet the requirements of the Class II functional water standard. The order of water quality, from good to bad, is the wetland around Bosten Lake, Yanqi oasis, surrounding Bohu County, and surrounding Yanqi County.
(2)
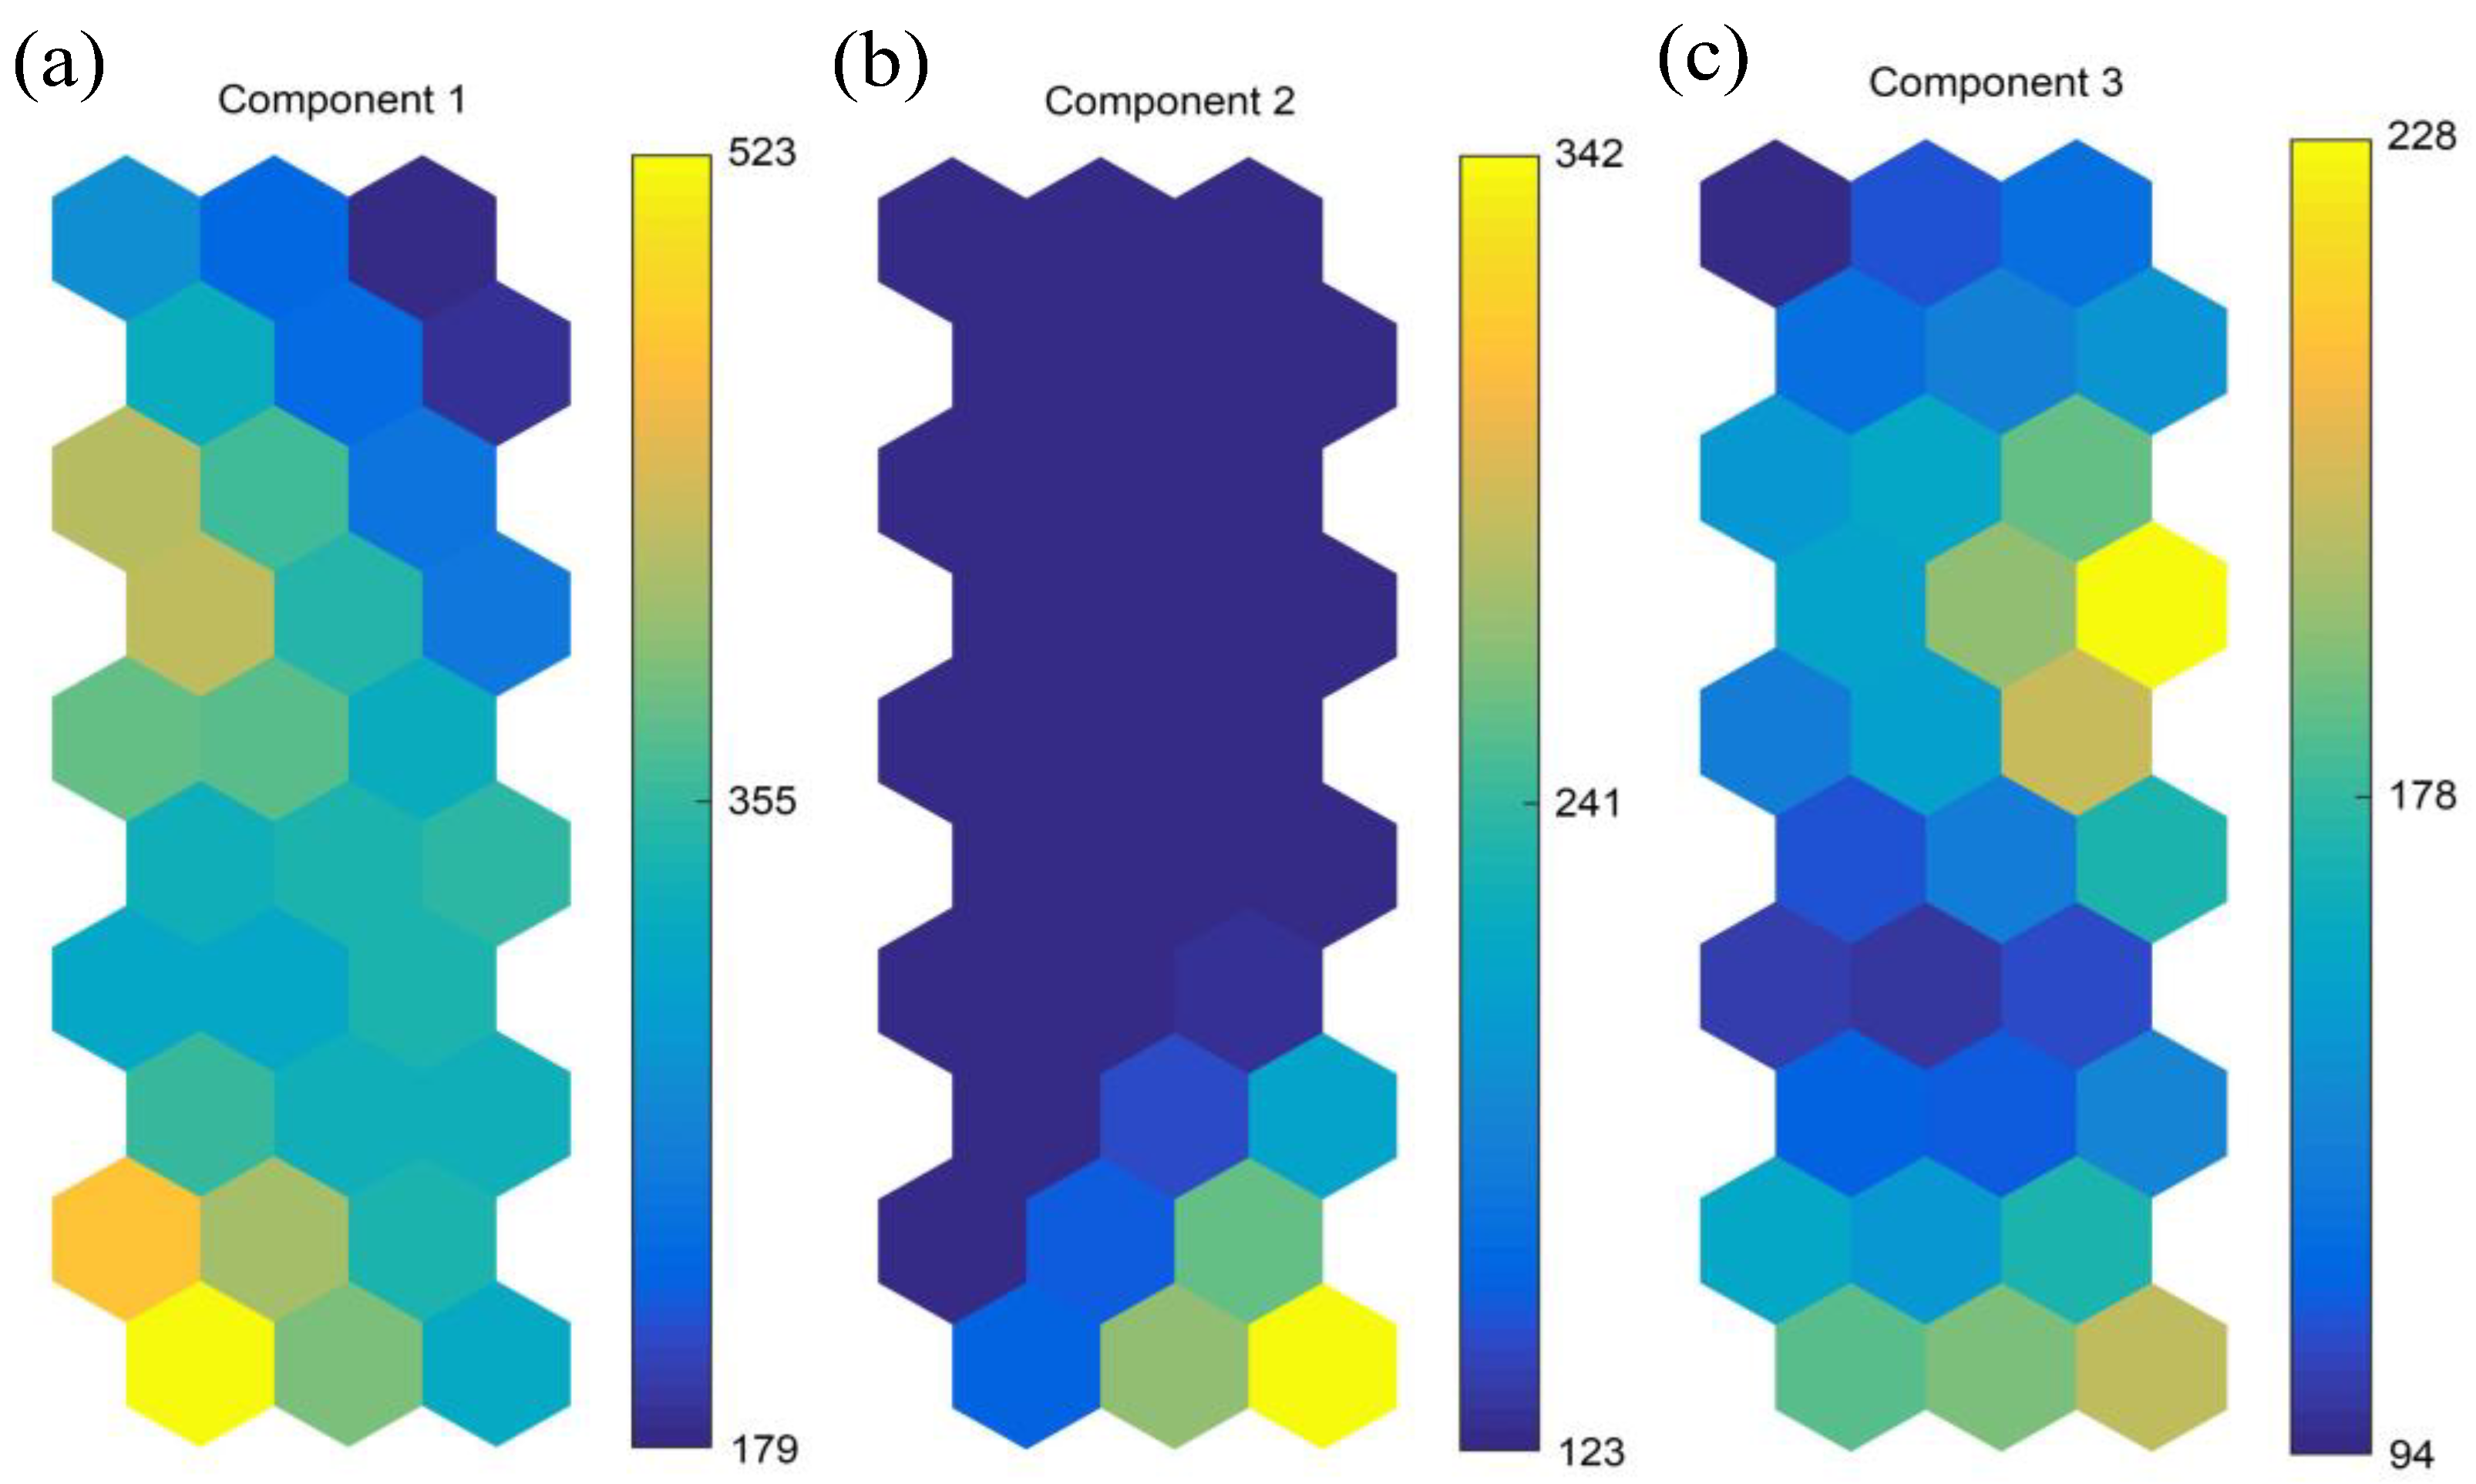
The PARAFAC method and SOM training model were used to extract three kinds of fluorescence components from the water samples in the lower reaches of the Kaidu River. The obtained components, C1 and C2, are classified as humid-like, which is one of the comprehensive products under the combined influence of terrestrial input, water microbial activity, and photochemical oxidation process.
(3)
The three fluorescence components, C1, C2 and C3, were negatively correlated with the concentrations of SO42− and TDS, respectively. The fluorescence indices, FI, HIX, and BIX, were positively correlated with SAL and Cu, and negatively correlated with DO.

Author Contributions

Conceptualization, C.C.; Data curation, C.C. and Q.Z.; Formal analysis, C.C.; Investigation, W.W., Y.C. and X.L.; Methodology, P.D.; Project administration, F.Z.; Supervision, F.Z.; Validation, C.A.; Writing—Original draft, C.C.; Writing—review & editing, M.L.T., H.-T.K. and J.S. All authors have read and agreed to the published version of the manuscript.

Funding

This research was funded by the National Natural Science Foundation of China (U2003205), and the Tianshan Talent Project (Phase III) of the Xinjiang Uygur Autonomous Region.

Institutional Review Board Statement

Not applicable.

Informed Consent Statement

Informed consent was obtained from all subjects involved in the study.

Data Availability Statement

The data presented in this study are available on request from the corresponding author. The data are not publicly available due to confidentiality.

Acknowledgments

We thank the anonymous reviewers and editors for appraising our manuscript and offering helpful comments. We want to thank the editor and anonymous reviewers for their valuable comments and suggestions to this paper.

Conflicts of Interest

The authors declare no conflict of interest.

References

  1. Li, X.F.; Mitch, W.A. Drinking Water Disinfection Byproducts (DBPs) and Human Health Effects: Multidisciplinary Challenges and Opportunities. Environ. Sci. Technol. 2017, 52, 1681–1689. [Google Scholar] [CrossRef] [PubMed]
  2. Ikhlaq, A.; Kazmi, M.; Haydar, S. Evaluation of Drinking water quality parameters in the areas of East-Lahore Pakistan: A case study. J. Fac. Eng. Archit. Gazi Univ. 2014, 21, 1–21. [Google Scholar]
  3. UNESCO. The Global Water Quality Challenges and SDGs. 2019. Available online: https://en.unesco.org/waterquality-iiwq/wq-challenge (accessed on 29 May 2019).
  4. Xu, H.; Guo, L. Molecular size-dependent abundance and composition of dissolved organic matter in river, lake and sea waters. Water Res. 2017, 117, 115–126. [Google Scholar] [CrossRef] [PubMed]
  5. Liu, Q.; Jiang, Y.; Tian, Y.; Hou, Z.; He, K.; Fu, L.; Xu, H. Impact of land use on the DOM composition in different seasons in a subtropical river flowing through a region undergoing rapid urbanization. J. Clean. Prod. 2019, 212, 1224–1231. [Google Scholar] [CrossRef] [Green Version]
  6. Zhang, L.; Liu, H.; Wang, Y.; Peng, Y. Compositional characteristics of dissolved organic matter during coal liquefaction wastewater treatment and its environmental implications. Sci. Total Environ. 2020, 704, 135409. [Google Scholar] [CrossRef]
  7. Song, F.; Wu, F.; Feng, W.; Liu, S.; He, J.; Li, T.; Zhang, J.; Wu, A.; Amarasiriwardena, D.; Xing, B.; et al. Depth-dependent variations of dissolved organic matter composition and humification in a plateau lake using fluorescence spectroscopy. Chemosphere 2019, 225, 507–516. [Google Scholar] [CrossRef]
  8. Chen, M.L.; Li, C.L.; Spencer, R.G.M. Climatic, land cover, and anthropogenic controls on dissolved organic matter quantity and quality from major alpine rivers across the Himalayan-Tibetan Plateau. Sci. Total Environ. 2021, 754, 142411. [Google Scholar] [CrossRef]
  9. He, Q.; Xiao, Q.; Fan, J.; Zhao, H.; Cao, M.; Zhang, C.; Jiang, Y. Excitation-emission matrix fluorescence spectra of chromophoric dissolved organic matter reflected the composition and origination of dissolved organic carbon in Lijiang River, Southwest China. J. Hydrol. 2021, 598, 126240. [Google Scholar] [CrossRef]
  10. Li, M.; Kong, F.; Li, Y.; Zhang, J.; Xi, M. Ecological indication based on source, content, and structure characteristics of dissolved organic matter in surface sediment from Dagu River estuary, China. Environ. Sci. Pollut. Res. 2020, 27, 45499–45512. [Google Scholar] [CrossRef]
  11. Wang, X.P.; Zhang, F.; Kung, H.T.; Trumbo, A.L.; Yang, J.; Ren, Y.; Jing, Y. Evaluation and estimation of surface water quality in an arid region based on EEM-PARAFAC and 3D fluorescence spectral index: A case study of the Ebinur Lake Watershed, China. Catena 2017, 155, 62–74. [Google Scholar] [CrossRef]
  12. Stedmon, C.A. Tracing dissolved organic matter in aquatic environments using a new approach to fluorescence spectroscopy. Mar. Chem. 2003, 82, 239–254. [Google Scholar] [CrossRef]
  13. Hudson, N.; Baker, A.; Reynolds, D. Fluorescence analysis of dissolved organic matter in natural, waste and polluted waters—A review. River Res. Appl. 2007, 23, 631–649. [Google Scholar] [CrossRef]
  14. Goldman, J.H.; Rounds, S.A.; Needoba, J.A. Applications of fluorescence spectroscopy for predicting percent wastewater in an urban stream. Environ. Sci. Technol. 2012, 46, 4374–4381. [Google Scholar] [CrossRef]
  15. Zhao, N.; Zhang, X.; Yin, G.; Yang, R.; Hu, L.; Chen, S.; Liu, J.; Liu, W. On-line analysis of algae in water by discrete three-dimensional fluorescence spectroscopy. Opt. Express 2018, 26, A251. [Google Scholar] [CrossRef] [PubMed]
  16. Fouché, J.; Christiansen, C.T.; Lafrenière, M.J.; Grogan, P.; Lamoureux, S.F. Canadian permafrost stores large pools of ammonium and optically distinct dissolved organic matter. Nat. Commun. 2020, 11, 4500. [Google Scholar] [CrossRef] [PubMed]
  17. Ma, J.; Pei, D.; Zhang, X.; Lai, Q.; He, F.; Fu, C.; Liu, J.; Li, W. The Distribution of DOM in the Wanggang River Flowing into the East China Sea. Int. J. Environ. Res. Public Health 2022, 19, 9219. [Google Scholar]
  18. Kohonen, T. The self-organizing map. Proc. IEEE 1990, 78, 1464–1480. [Google Scholar] [CrossRef]
  19. Kohonen, T. Essentials of the self-organizing map. Neural Netw. 2013, 37, 52–65. [Google Scholar] [CrossRef]
  20. Bieroza, M.; Baker, A.; Bridgeman, J. Classification and calibration of organic matter fluorescence data with multiway analysis methods and artificial neural networks: An operational tool for improved drinking water. Environmetrics 2011, 22, 256–270. [Google Scholar] [CrossRef]
  21. Bieroza, M.; Baker, A.; Bridgeman, J. Exploratory analysis of excitation-emission matrix fluorescence spectra with self-organizing maps-A tutorial. Educ. Chem. Eng. 2012, 7, e22–e31. [Google Scholar] [CrossRef]
  22. He, D.; Li, P.; He, C.; Wang, Y.; Shi, Y. Eutrophication and watershed characteristics shape changes in dissolved organic matter chemistry along two river-estuarine transects. Water Res. 2022, 214, 118196. [Google Scholar] [CrossRef]
  23. Wang, J.; Zhang, F.; Wang, X.P.; Yang, S.T.; Chen, Y. Three-Dimensional Fluorescence Characteristics by Parallel Factor Method Coupled with Self-Organizing Map andIts Relationship with Water Quality. Acta Opt. Sin. 2017, 37, 357–367. (In Chinese) [Google Scholar]
  24. Yan, C.X.; Liu, H.H.; Sheng, Y.R.; Huang, X.; Nie, M.; Huang, Q.; Baalousha, M. Fluorescence characterization of fractionated dissolved organic matter in the five tributaries of Poyang Lake, China. Sci. Total Environ. 2018, 637–638, 1311–1320. [Google Scholar] [CrossRef] [PubMed]
  25. Nie, M.H.; Huang, X.; Yan, C.X.; Yang, Y.; Zhou, J.L.; Liu, M. Fluorescence characterization of fractionated colloids in different sources of waters based on PARAFAC and SOM. Acta Sci. Circumstantiae 2018, 38, 3672–3681. (In Chinese) [Google Scholar]
  26. Li, J.; Wang, L.; Geng, J.; Li, S.; Yu, Q.; Xu, K.; Ren, H. Distribution and removal of fluorescent dissolved organic matter in 15 municipal wastewater treatment plants in China. Chemosphere 2020, 251, 126375. [Google Scholar] [CrossRef]
  27. Bereskie, T.A. Drinking water management and governance in small drinking water systems: Integrating continuous performance improvement and risk-based benchmarking. Environ. Manag. 2017, 60, 243–262. [Google Scholar] [CrossRef] [PubMed]
  28. Najafzadeh, M.; Homaei, F.; Farhadi, H. Reliability assessment of water quality index based on guidelines of national sanitation foundation in natural streams: Integration of remote sensing and data-driven models. Artif. Intell. Rev. 2021, 54, 4619–4651. [Google Scholar] [CrossRef]
  29. Falah, F.; Haghizadeh, A. Hydrochemical evaluation of river water quality—A case study: Horroud River. Appl. Water Sci. 2017, 7, 4725–4733. [Google Scholar] [CrossRef] [Green Version]
  30. Nihalani, S.; Meeruty, A. Water quality index evaluation for major rivers in Gujarat. Environ. Sci. Pollut. Res. 2021, 28, 63523–63531. [Google Scholar] [CrossRef]
  31. Zhang, F.; Wang, W.W.; Xin, H.Y.; Hao, J.X.; Liu, C.J.; Duan, P. Changes of rivers and lakes water quality in Lake Ebinur Basin, Xinjiang(2005–2020). Lake Sci. 2022, 34, 478–495. (In Chinese) [Google Scholar]
  32. Mian, H.R.; Hu, G.; Hewage, K.; Rodriguez, M.J.; Sadiq, R. Drinking water quality assessment in distribution networks: A water footprint approach. Sci. Total Environ. 2021, 775, 145844. [Google Scholar] [CrossRef]
  33. Ba, W.L. Hydrology and Water Environment Research Based on Climate Change and Human Activity Scenarios in Kaidu River. Ph.D. Thesis, Tsinghua University, Beijing, China, 2019. (In Chinese). [Google Scholar]
  34. Shen, Y.J.; Shen, Y.; Fink, M.; Kralisch, S.; Brenning, A. Unraveling the Hydrology of the Glacierized Kaidu Basin by Integrating Multisource Data in the Tianshan Mountains, Northwestern China. Water Resour. Res. 2018, 54, 557–580. [Google Scholar] [CrossRef]
  35. Palmer, M.; Ruhi, A. Measuring earth’s rivers. Science 2018, 361, 546–547. [Google Scholar] [CrossRef] [PubMed]
  36. Mandaric, L.; Diamantini, E.; Stella, E.; Cano-Paoli, K.; Valle-Sistac, J.; MolinsDelgado, D.; Bellin, A.; Chiogna, G.; Majone, B.; Diaz-Cruz, M.; et al. Contamination sources and distribution patterns of pharmaceuticals and personal care products in Alpine rivers strongly affected by tourism. Sci. Total Environ. 2017, 590–591, 484–489. [Google Scholar] [CrossRef]
  37. Dong, J.; Yan, D.; Mo, K.; Chen, Q.; Zhang, J.; Chen, Y.; Wang, Z. Antibiotics along an alpine river and in the receiving lake with a catchment dominated by grazing husbandry. J. Environ. Sci. 2022, 115, 374–382. [Google Scholar] [CrossRef]
  38. Deng, H.; Chen, Y.; Wang, H.; Zhang, S. Climate change with elevation and its potential impact on water resources in the Tianshan Mountains, Central Asia. Glob. Planet. Change 2015, 135, 28–37. [Google Scholar] [CrossRef]
  39. Tohti, G.; Sai, B.; Zhang, J.; Hu, Y.; Shao, K.; Gao, G.; Tang, X. Water environmental characteristics of River Kaidu Catchment in Xinjiang. J. Environ. Eng. Technol. 2021, 11, 1102–1109. (In Chinese) [Google Scholar]
  40. Zhao, B.Q.; Sun, H.W.; Yan, D.; Wei, G.; Tuo, Y.; Zhang, W. Quantifying changes and drivers of runoff in the Kaidu River Basin associated with plausible climate scenarios. J. Hydrol. Reg. Stud. 2021, 38, 100968. [Google Scholar] [CrossRef]
  41. Zhao, J. Study on the Utilization of Agricultural and Pastoral Coupled Resources in Tarim River Basin. Master’s Thesis, Xinjiang Agricultural University, Urumqi, Xinjiang, China, 2016. (In Chinese). [Google Scholar]
  42. Liu, L.H.; Wu, L.X.; Wu, J.P.; Liu, L.S.; Huo, W.J. Review on surface water quality index assessment method in foreign countries. Water Resour. Prot. 2016, 32, 86–90+96. (In Chinese) [Google Scholar]
  43. Cui, Y.; Wu, Q.; Yang, M.; Cui, F. Three-dimensional excitation-emission matrix fluorescence spectroscopy and fractions of dissolved organic matter change in landfill leachate by biological treatment. Environ. Sci. Pollut. Res. 2016, 23, 793–799. [Google Scholar] [CrossRef]
  44. Baghoth, S.A.; Sharma, S.K.; Amy, G.I. Tracking natural organic matter (NOM) in a drinking water treatment plant using fluorescence excitation-emission matrices and PARAFAC. Water Res. 2011, 45, 797–809. [Google Scholar] [CrossRef] [PubMed]
  45. Jiang, T.; Skyllberg, U.; Björn, E.; Green, N.W.; Tang, J.; Wang, D.; Gao, J.; Li, C. Characteristics of dissolved organic matter (DOM) and relationship with dissolved mercury in Xiaoqing River-Laizhou Bay estuary, Bohai Sea, China. Environ. Pollut. 2017, 223, 19–30. [Google Scholar] [CrossRef] [PubMed] [Green Version]
  46. Vignudelli, S.; Santinelli, C.; Murru, E.; Nannicini, L.; Seritti, A. Distributions of dissolved organic carbon (DOC) and chromophoric dissolved organic matter (CDOM) in coastal waters of the northern Tyrrhenian Sea (Italy). Estuar. Coast. Shelf Sci. 2004, 60, 133–149. [Google Scholar] [CrossRef]
  47. Kohonen, T. Self-Organizing Maps, 3rd ed.; Springer: Berlin/Heidelberg, Germany, 2001. [Google Scholar]
  48. Peleato, N.M.; McKie, M.; Taylor-Edmonds, L.; Andrews, S.A.; Legge, R.L.; Andrews, R.C. Fluorescence spectroscopy for monitoring reduction of natural organic matter and halogenated furanone precursors by biofiltration. Chemosphere 2016, 153, 155–161. [Google Scholar] [CrossRef] [PubMed]
  49. Osburn, C.L.; Anderson, N.J.; Stedmon, C.A.; Giles, M.E.; Whiteford, E.J.; McGenity, T.J.; Dumbrell, A.J.; Underwood, G.J. Shifts in the source and composition of dissolved organic matter in Southwest Greenland lakes along a regional hydro-climatic gradient. J. Geophys. Res. Biogeosci. 2017, 122, 3431–3445. [Google Scholar] [CrossRef] [Green Version]
  50. Smith, M.A.; Kominoski, J.S.; Gaiser, E.E.; Price, R.M.; Troxler, T.G. Stormwater runoff and tidal flooding transform dissolved organic matter composition and increase bioavailability in urban coastal ecosystems. J. Geophys. Res. Biogeosci. 2021, 126, e2020JG006146. [Google Scholar] [CrossRef]
  51. Wang, D.; Zhang, F.; Zhang, Z.Y.; Zhang, H.W.; Zhu, S.D.; Zhang, X.L. Characteristics of three-dimensional fluorescence spectra and its correlation with water quality of surface water during dry and wet seasons in Lake Ebinur Watershed, Xinjiang. J. Lake Sci. 2020, 32, 483–495. (In Chinese) [Google Scholar]
  52. Xie, G.J.; Zhang, J.P.; Tang, X.M. Spatio-temporal heterogeneity of water quality (2010–2011) and succession patterns in Lake Bosten during the past 50 years. J. Lake Sci. 2011, 23, 837–846. (In Chinese) [Google Scholar]
  53. Zuo, Q.T. Effect and Risk of Ecological Water Transportation from Bosten Lake to Tarim River. Sci. Geogr. Sin. 2006, 26, 564–568. (In Chinese) [Google Scholar]
Figure 1. Maps and images of the study area: (a) The location of Xinjiang in China; (b) The location of the Kaidu River-Bosten Lake (the black rectangle) at the center of the basin; (c) The positions of 31 sampling points in the water body of the Lower Kaidu River; and (d) The Kaidu River flows through an agricultural oasis after exiting the mountain pass and converges into Bosten Lake and the actual landscape photos (d1d6) along its course.
Water 14 03544 g001
Figure 2. Methodology framework of this study.
Water 14 03544 g002
Figure 3. Variation of CWQI value of water quality in the lower reaches of Kaidu River.
Water 14 03544 g003
Figure 4. Fluorescence spectra of PARAFAC components (ac) and corresponding Ex-Em loads (df).
Water 14 03544 g004
Figure 5. Box plot of three fluorescence index changes along reach, and the black and white dots represent outliers.
Water 14 03544 g005
Figure 6. SOM visual output diagram based on PARAFAC (The self-organizing map U-matrix (a), Sample distribution on the SOM map (b), Single hit histogram (c), multiple hit histograms site 1 (d) and site 3 (e).
Water 14 03544 g006
Figure 7. Visualization of three fluorescence peak components based on SOM (C1: (a), C2: (b), C3: (c)).
Water 14 03544 g007
Figure 8. Correlation analysis of three fluorescence components (a,b) and fluorescence index (c,d) with water quality parameters.
Water 14 03544 g008
Table 1. Water quality indexes and experimental method.
ParameterExperiment Methods
NH4+-NNessler’s reagent spectrophotometry with the amount of visible light spectrophotometer 722 N determination the content of NH4+-N
TDSWeight method is used to determine the suspended particulate matter in the water (GB 11901-89)
BOD5Dilution and inoculation method (HJ 505-2009) with constant temperature incubator (HWS-150 type) for determining the content of BOD
Cr6+Atomic absorption spectrophotometry (HJ 687-2014)
TNUltraviolet spectrophotometry (HJ 535-2009) by ultraviolet visible light spectrophotometer, UV-6100 for determining the content of TN
CODDichromate method (GB 11914-89) using standard COD digestion apparatus (K-100) for determining the content of COD
DOIodine quantity method (GB/T 7489-87) using visible light spectrophotometer 722 N test instrument for determining the content of DO
SALResidue drying-quality method (SL-79-1994)
TPAccording to the ammonium molybdate spectrophotometric method (HJ 636-2012) using visible light spectrophotometer 722 N for determining the content of TP
CuAtomic absorption spectrophotometry (GB 7475-87)
SO42−Ion spectrometry (Essentia IC-16)
Table 2. Division of the three reaches of the lower reaches of Kaidu River in current study.
ReachesSamplingPosition Description
UpperK42, K41, K40, K38, K37, K36, K34, K33, K30, K29Dam–Arle Village
MiddleK27, K26, K24, K23, K20, K18, K17, K15, K13, K12Qahansar Village–Yanqi Main Canal
LowerK8, K7, K6, K5, K4, K3, K2, K1, K53, K54, B1Mid-lake Island–Lakes Entrance
Publisher’s Note: MDPI stays neutral with regard to jurisdictional claims in published maps and institutional affiliations.

