1. Introduction
The unsaturated zone is a region of the subsurface above the water table. Both air and water are present in pores in the unsaturated zone, and their relative quantities change dynamically over time as a result of external inputs (e.g., infiltration from rainfall) or outputs (evaporation and evapotranspiration), as well as due to spatial redistribution. At equilibrium, the relationship between the water content and elevation is described by the capillary pressure–saturation (Pc–S) relationship. In the absence of gas pressure gradients in a porous medium, capillary pressure (Pc) is equal to the negative water pressure; if vertical flow does not occur, Pc in height units is the same as the elevation above the water table. Saturation (S), a measure of water content, is the ratio of the volume of water in a porous medium to the volume of pores; a saturation of 1.0 indicates a fully saturated medium, while a saturation of 0.0 is a fully dry porous medium. The Pc–S relationship is a function of the porous medium, with finer-grained porous media exhibiting greater S at a given Pc (or elevation). Furthermore, the Pc–S relationship is hysteretic, meaning that the observed S at any given point depends not only on the Pc, but also on the wetting/drying history. In general, when water drains from a previously saturated porous medium, the S is higher at a given Pc (or elevation) than would be the case when water imbibes into a previously dry porous medium.
The capillary fringe is a region of the unsaturated zone just above the water table where the porous medium is near full saturation. Finer-grained porous media have thicker capillary fringes, while coarser-grained porous media have thinner capillary fringes. The ability to predict and control the water content in the unsaturated zone and the capillary fringe is of critical importance for many practical applications, including agriculture and plant growth [
1,
2], as well as the movement of solutes and colloids in the environment [
3,
4,
5,
6,
7,
8,
9]. Understanding and simulating water movement during these applications requires knowledge of the
Pc–
S relationship for the porous medium of interest. While methods of measuring or estimating
Pc–
S parameters for a particular porous medium are available (e.g., [
10,
11,
12]), little is known about how environmental effects, including evaporation, influence the
Pc–
S relationship. While the dynamics of evaporation and its effects on water content near the ground surface are of great interest and have been widely studied (e.g., [
13,
14,
15,
16,
17]), less information is available about its effect on the
Pc–
S relationship itself.
Previous work by the authors explored the hypothesis that the equilibrium
Pc–
S relationship is the result of a dynamic equilibrium between the various factors that influence water content in unsaturated media, including capillary forces, evaporative water loss, and the upward flow of water to replenish evaporated water [
18]. In that study, the
Pc–
S relationship was studied in both a coarse sand and a thin nylon membrane. The sand was studied in two parallel systems packed between two parallel surfaces, in one case with one surface open to the atmosphere, in the other with both surfaces closed to the atmosphere (in both cases, the top of the porous media was open to the atmosphere). Drainage curves were imaged over 117 days, and it was observed that evaporation caused the saturation to continually drop over time in the open system, with the observed
Pc–
S curves gradually moving towards (although not reaching) the imbibition
Pc–
S relationship, and the thickness of the capillary fringe steadily decreasing. In contrast, the
Pc–
S relationships in the closed system remained relatively constant over time over much of the system, only exhibiting saturation decreases near the open top of the column, where a drying front induced by evaporation continued to move downward over the 117 days of the experiment. The membrane system studied in that work explored an extreme case where evaporation dominated the observed
Pc–
S behavior due to the large external area available for evaporative mass transfer. In that system, decreasing the driving force for evaporation by covering the system (thus increasing relative humidity in the air in contact with the membrane) led to rapid increases in the water content in the membrane.
The purpose of this work was to further explore the effects of evaporation on the moisture content in the unsaturated zone and the capillary fringe, with emphasis on understanding how evaporation might impact water content over a much longer time period in a tall laboratory column. The experiment conducted for the work extended over 1207 days (3.31 years), more than ten times the duration of the previous sand experiment, and was conducted in a conventional laboratory sand column with only minimal venting.
2. Materials and Methods
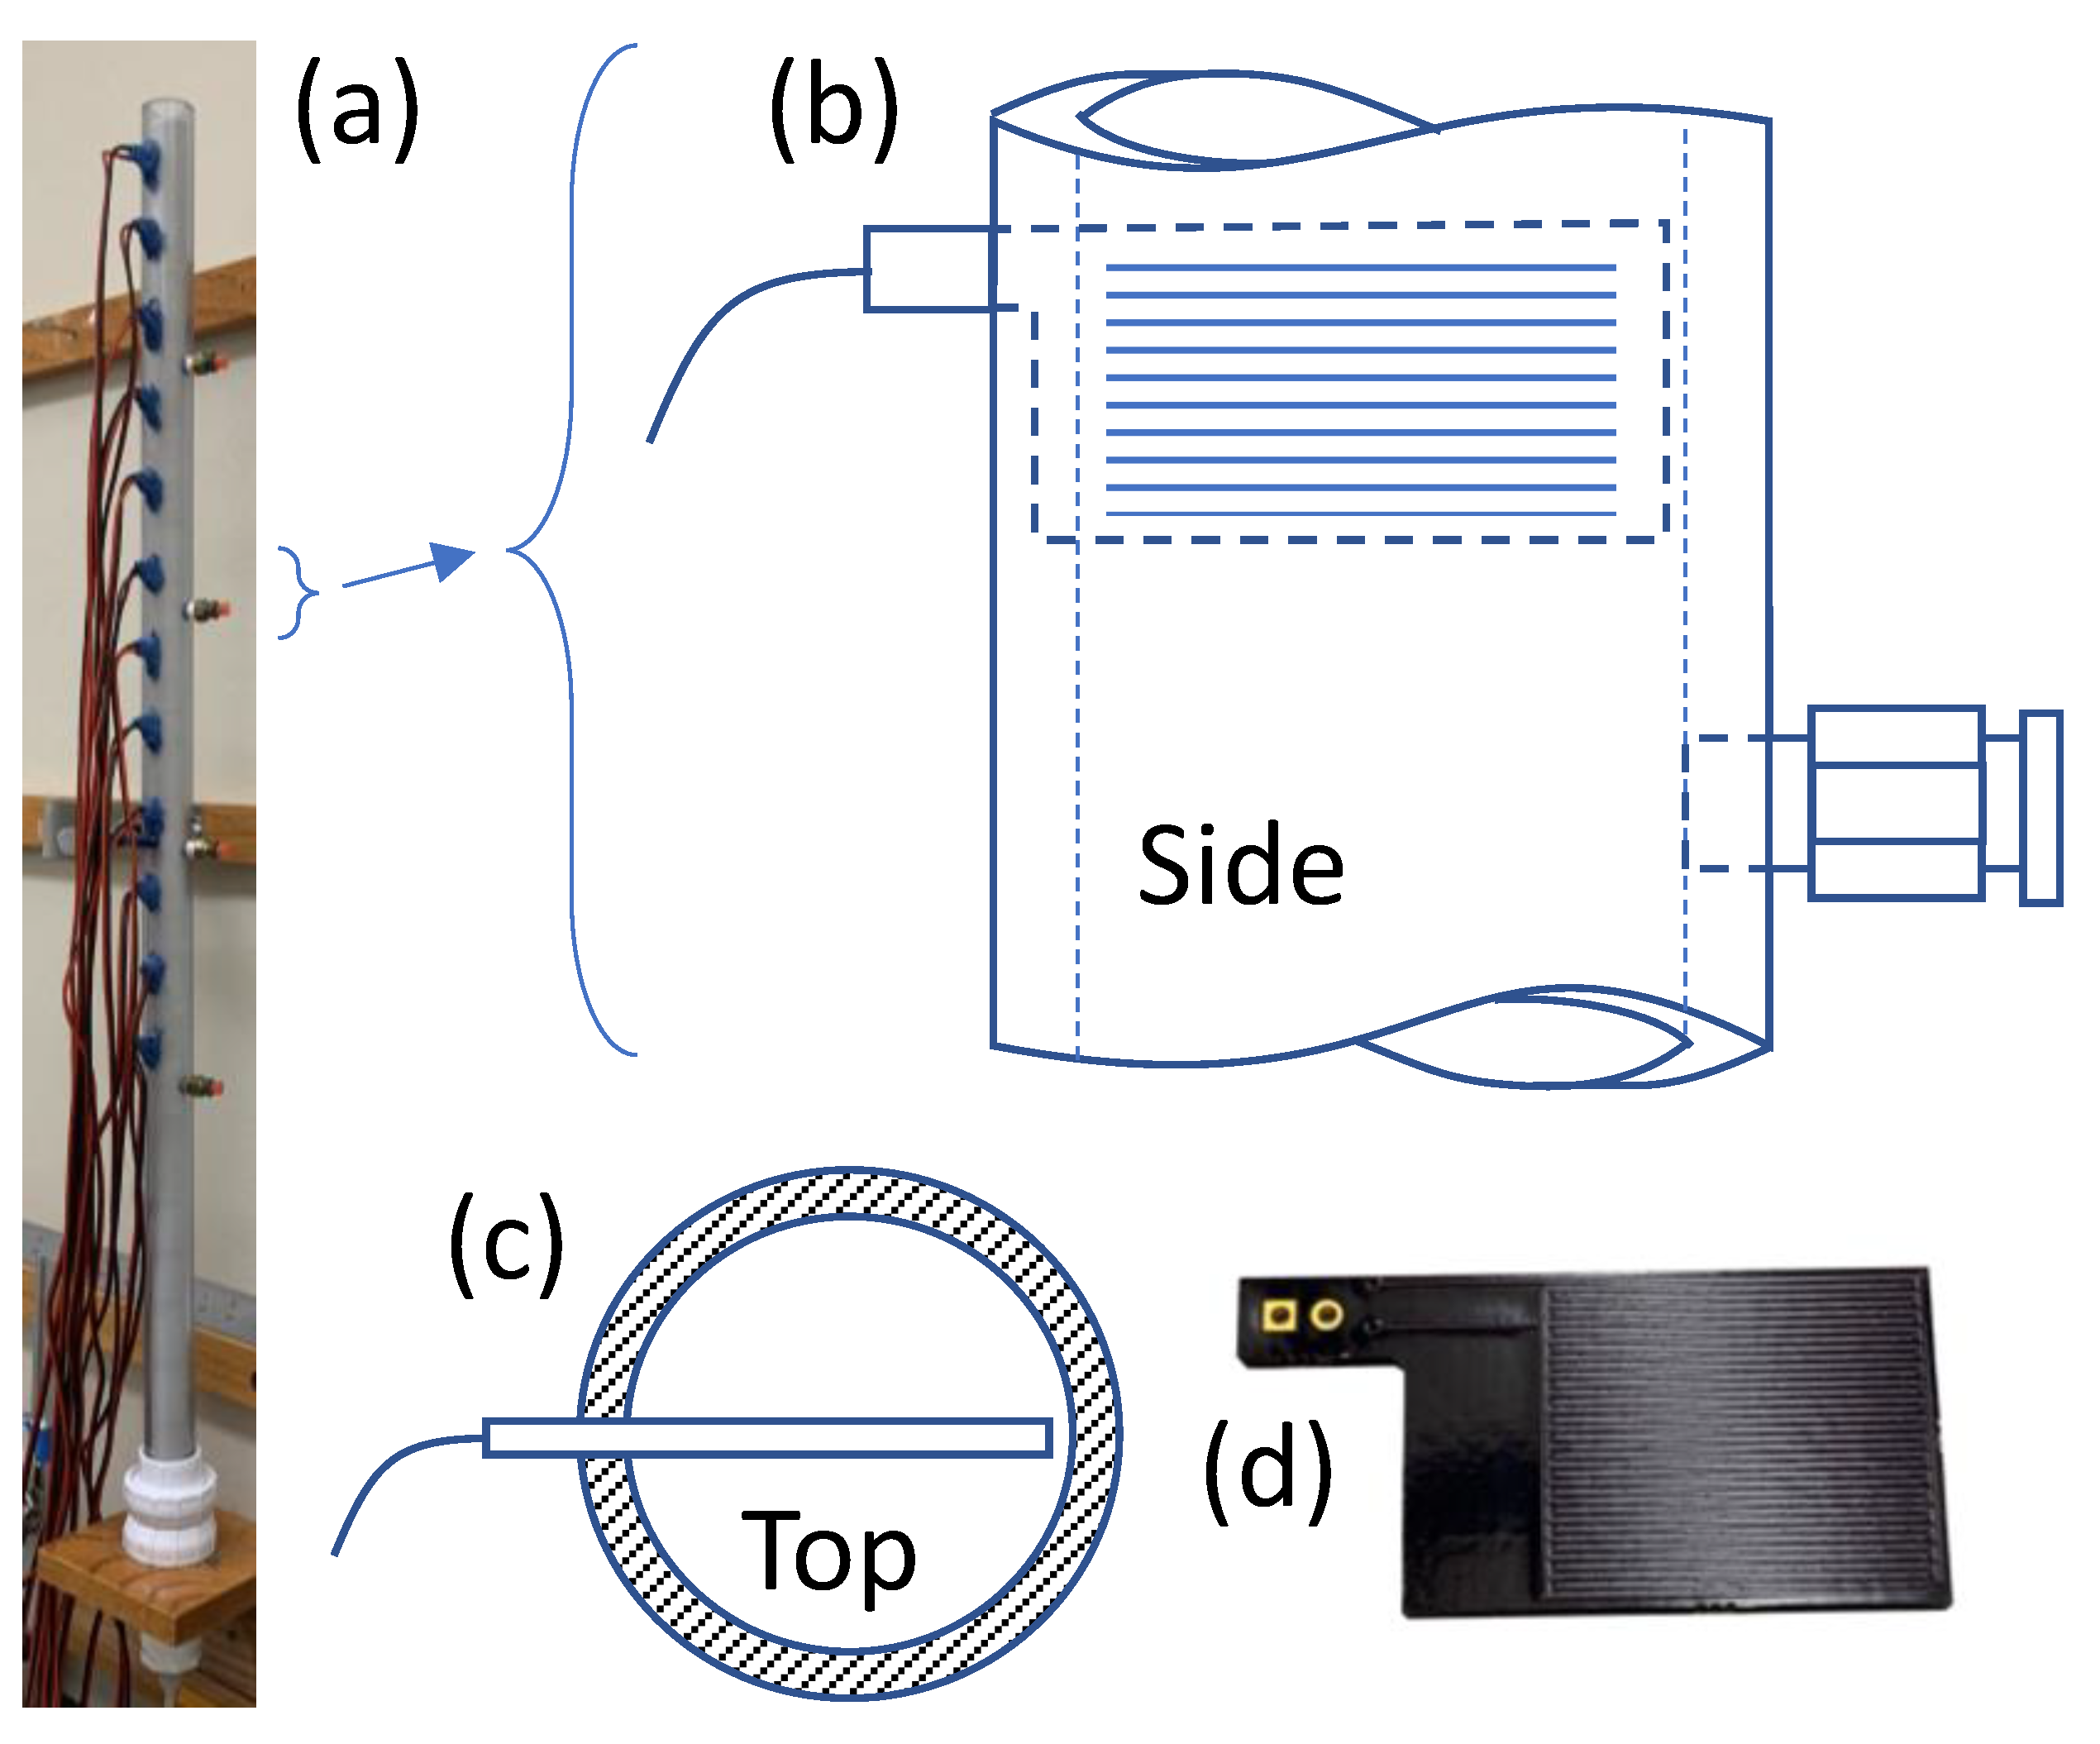
Figure 1 shows the experimental configuration of the sand column used for this work. The sand column was constructed from clear polyvinyl chloride plastic with an inner diameter of 2.5 cm, and a final packed height of approximately 87 cm. The column was outfitted with 12 custom capacitive water content sensors and four vents based on 1/8″ NPT quick connects for ¼″ tubing. Sand at the bottom of the column was supported by a #80 mesh stainless steel screen, and connected to an external reservoir using the same fittings described in earlier work [
4]. Sensors were glued into milled slots at 5 cm spacings starting 30.5 cm from the bottom of the column using RTV silicone. Vents were positioned 2.5 cm below sensors 1, 4, 7 and 10 (as numbered from the bottom). The column was dry-packed to allow spontaneous imbibition measurements to be conducted. Packing was conducted a few cm at a time, and the material was compressed by tapping with a long rod after each sand addition. Sensors were glued in sequentially from the bottom as the level of added sand reached each sensor location; this allowed the sand to be packed without interference from sensors present higher in the column.
Sensors for the work were fabricated as custom printed circuits. Each sensor was double-sided, with 36 interdigitated traces on each side, and approximate dimensions of 2 cm × 2 cm for the active region. Water content was determined by measuring capacitance between the interdigitated traces. Capacitance was measured using an Arduino Uno, by way of a multiplexor to allow sensors to be read sequentially. All sensors were read at 10 s intervals for all but the later portion of the imbibition experiment, during which sensors were read at 325 s intervals; observed noise in the sensor data during imbibition led to reversion to 10 s intervals for the remainder of the experiment to permit greater amounts of averaging smoothing.
Final values were taken from averaging multiple measured points. In the case of imbibition and initial drainage, rolling averages were used, while for presentation of data from the drainage curves over the full 1207-day duration, samples were taken by averaging data over 600 s (60 sample) windows in one-day intervals. Calibration of the sensors was conducted at the completion of the experiment based on an assumed linear response between maximum and minimum signals observed for wet and dry states at each sensor; in-place calibration is necessary because sensor response is influenced slightly by differences in the amount of silicone used for installation, so individual sensor ranges vary slightly. Separate calibration tests with similar sensors in the past found near-linear behavior. Note that drainage Pc–S curves measured with the sensors in this work are in close agreement with previously measured curves for the same material, supporting the calibration approach.
The water table for all experiments was controlled by maintaining the water level in an external 4 L high-density polyethylene container with a 15 cm inner diameter connected to the bottom of the column by 0.25 inch outer diameter nylon tubing with a ball valve. The reservoir had a screw-cap to minimize evaporation from the reservoir; a 1.5 mm diameter hole in the cap allowed air to enter and leave so the air in the reservoir would remain at atmospheric pressure.
An experiment measuring imbibition from a dry state was conducted by opening the valve and physically raising the reservoir so the water level was below the bottom sensor. After approximately 20 h, the reservoir was raised above the top of the column and held overnight to saturate the column. On October 22, 2018, the reservoir was then again lowered to below the bottom sensor, and the column was allowed to drain; this reservoir position was maintained for 1207 days (3.31 years), until February 10, 2022. Because of the large diameter of the reservoir, the full pore volume of the column above the water table would be equivalent to a 2.4 cm elevation difference on the reservoir itself. As such, even large changes in saturation over much of the column would only be expected to produce changes in reservoir water level on the order of mm. After the first 24 h, a time period that included a large fraction of the observed drainage, the measured water level in the reservoir had increased by less than 1 mm. For the duration of the 1207-day experiment, the water level was maintained within 0.25 cm of its initial position 5.75 cm below the bottom sensor through the addition of water as needed to adjust for evaporative losses through the column. The four column vents were closed for the imbibition experiment and for the first 128 days of the drainage experiment, and were then opened for the remaining 1079 days on day 128 (28 February 2019). Details of water additions are discussed in the Results and Discussion section in the context of saturation results.
Daily outdoor temperature and relative humidity data for Norman, Oklahoma were collected from the Oklahoma Mesonet [
19,
20]. Absolute humidity values were calculated based on reported relative humidity and calculated saturated water vapor pressure as a function of temperature. Indoor temperatures were monitored at one-hour intervals for the duration of the experiment using an Omega (Norwalk, CT) OM-63 temperature data logger.
The experiments described in this work were conducted using US Silica (Ottawa, IL) F45 sand, a high-purity, foundry-grade medium sand with an average grain size (d
50) of 323 µm. Previous work [
18] was based on a coarser sand (US Silica F-30, d
50 = 590 µm). The use of a finer sand for this work required the use of a taller column, as a result of the thicker capillary fringe for the F45 sand (an air-entry-pressure of ~30 cm for F45 vs. ~12 cm for F30).
3. Results and Discussion
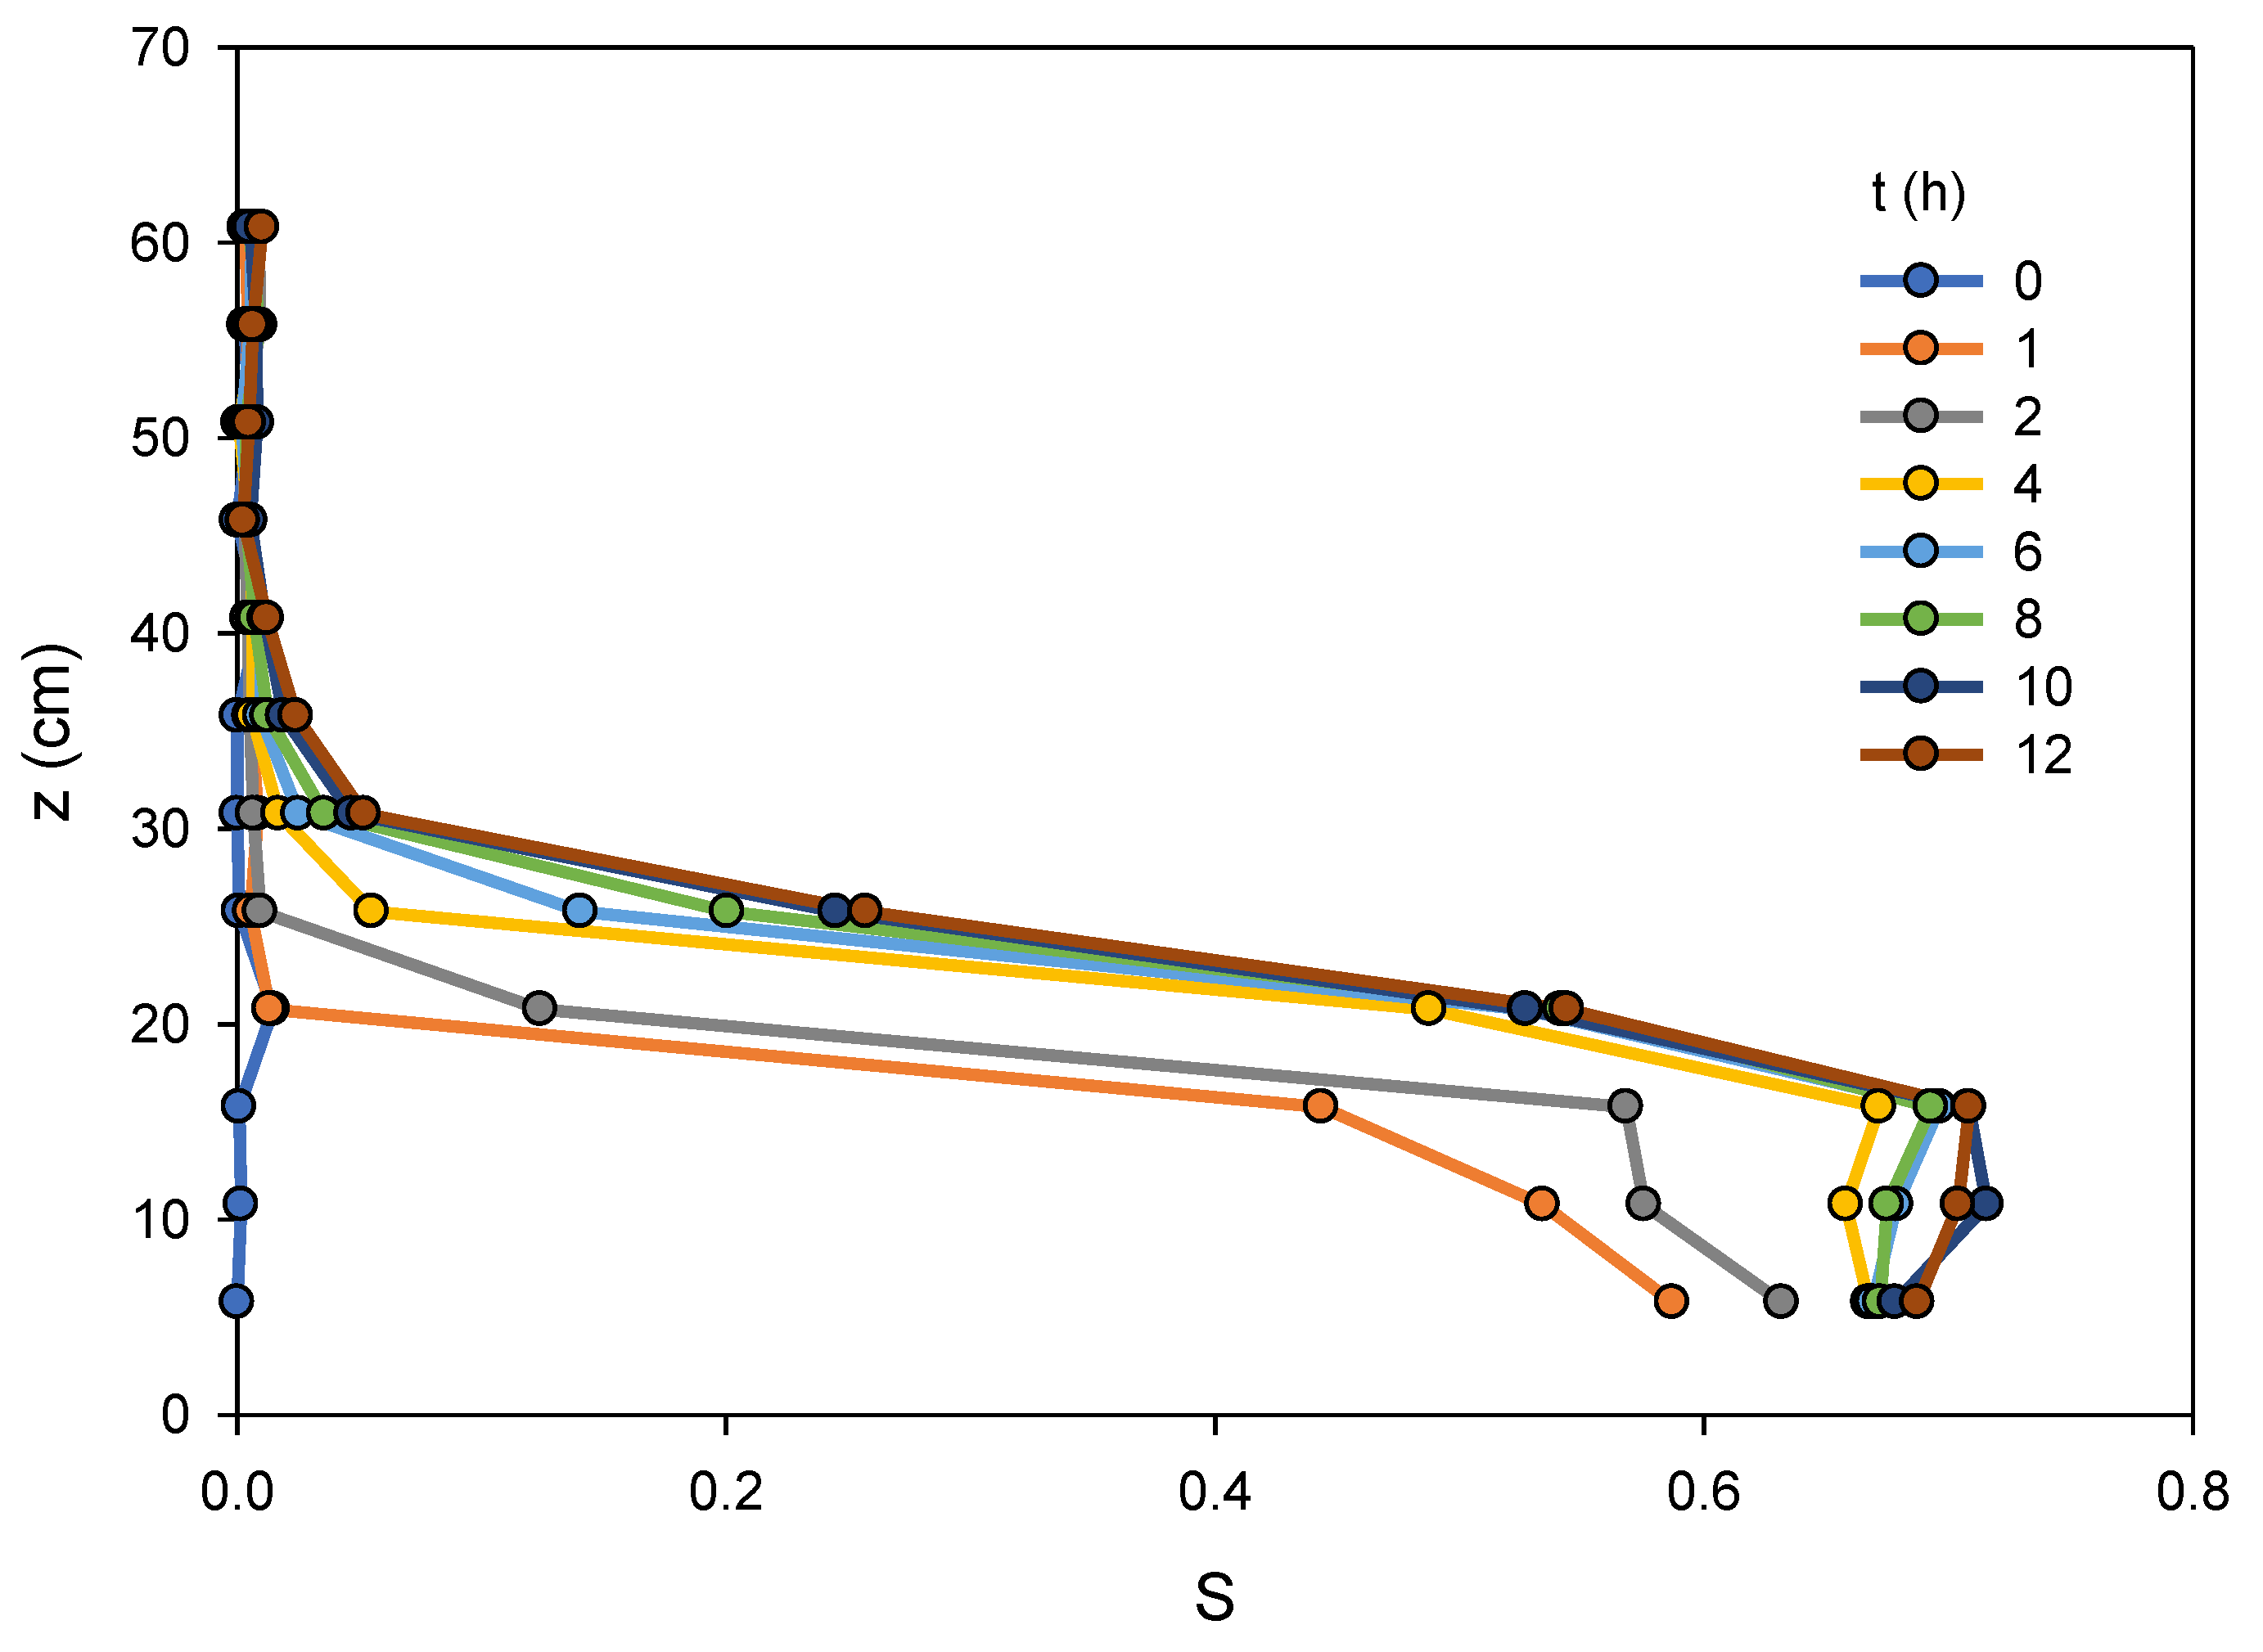
Figure 2 shows elevation vs. saturation for eight different times within the first 12 h following the start of imbibition. It is apparent from the figure that imbibition proceeds rapidly from the dry state, with the water saturation profile approaching its near final configuration after only four hours, and only subtle changes observed after eight hours. The rapid influx of water is not unexpected for imbibition to initially dry sand. Because the column was initially dry, the top of the column (more than about 45 cm above the water table) remains nearly dry after imbibition.
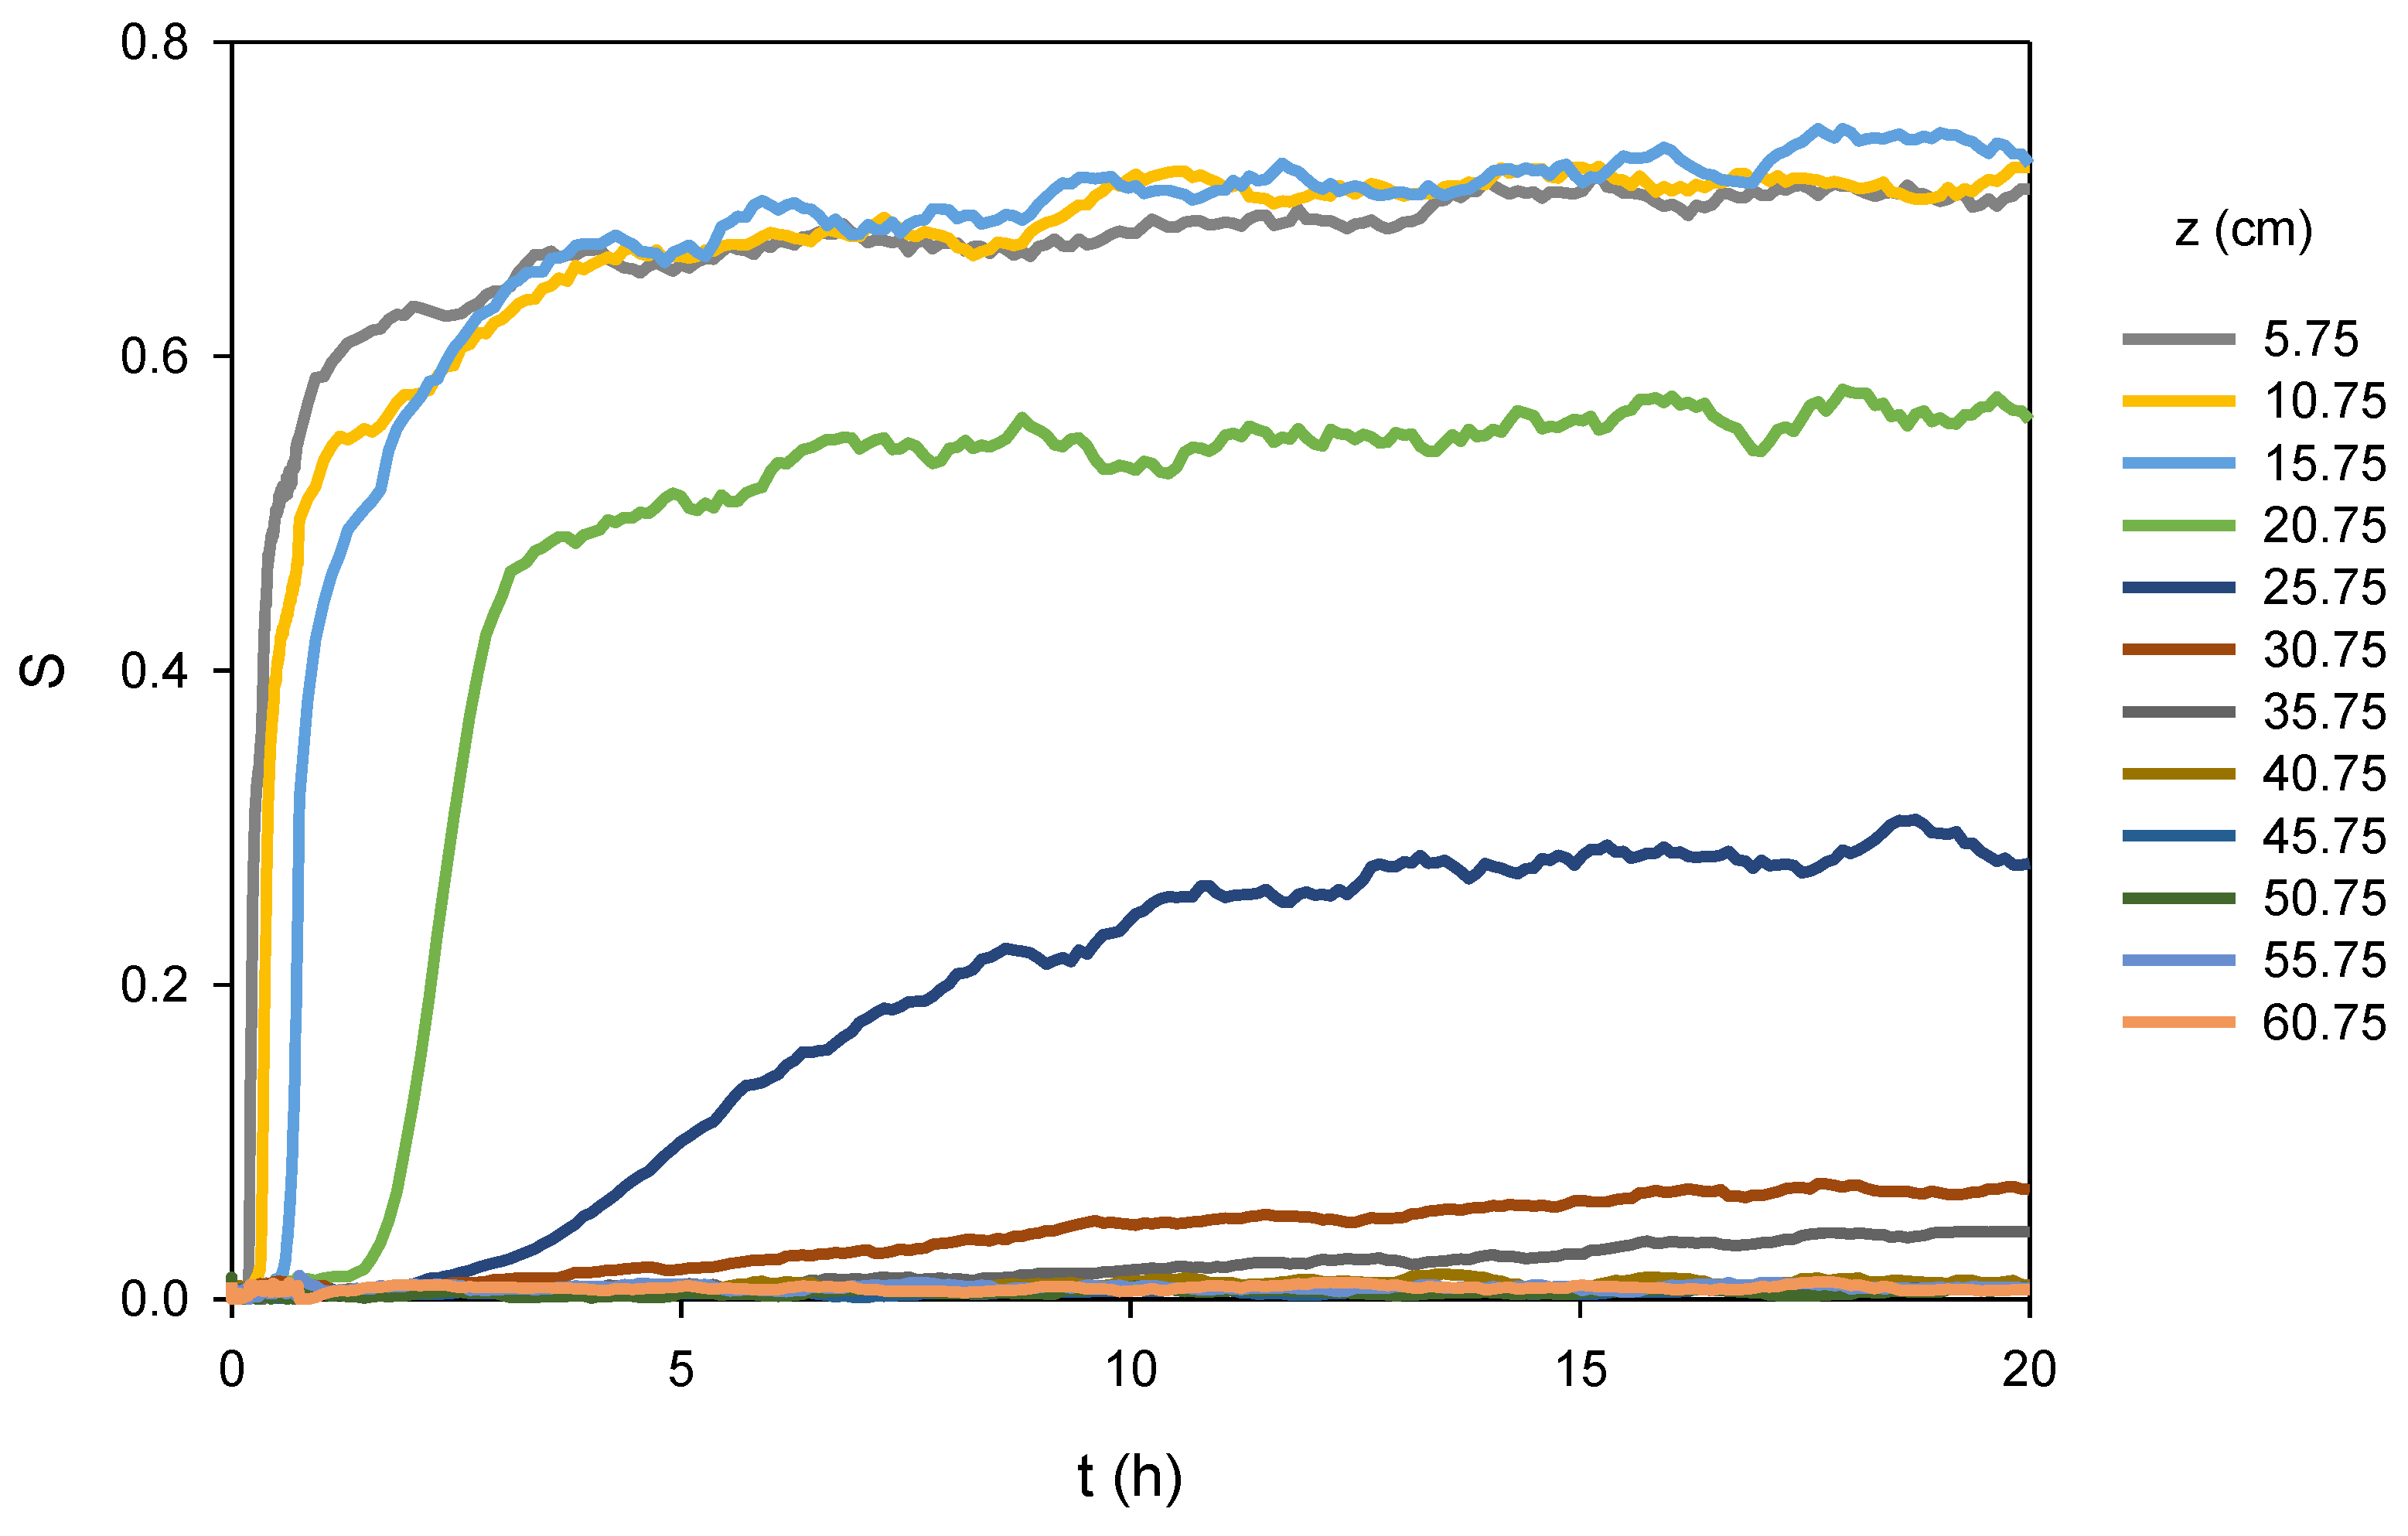
Figure 3 shows the measured saturations at the 12 sensors in the column, illustrating the almost instantaneous saturation increase low in the column, with a slowing saturation increase high in the column as the wetting front moves farther up the column; this is expected behavior. Note that the noise in
Figure 3 is due to a low frequency sampling that was used from 45 min to the end of the imbibition experiment, as described previously.
Following the completion of the imbibition experiment, the column was saturated by raising the reservoir above the top of the column, and then a drainage experiment was started by closing the valve, lowering the reservoir to the desired water table level and opening the valve.
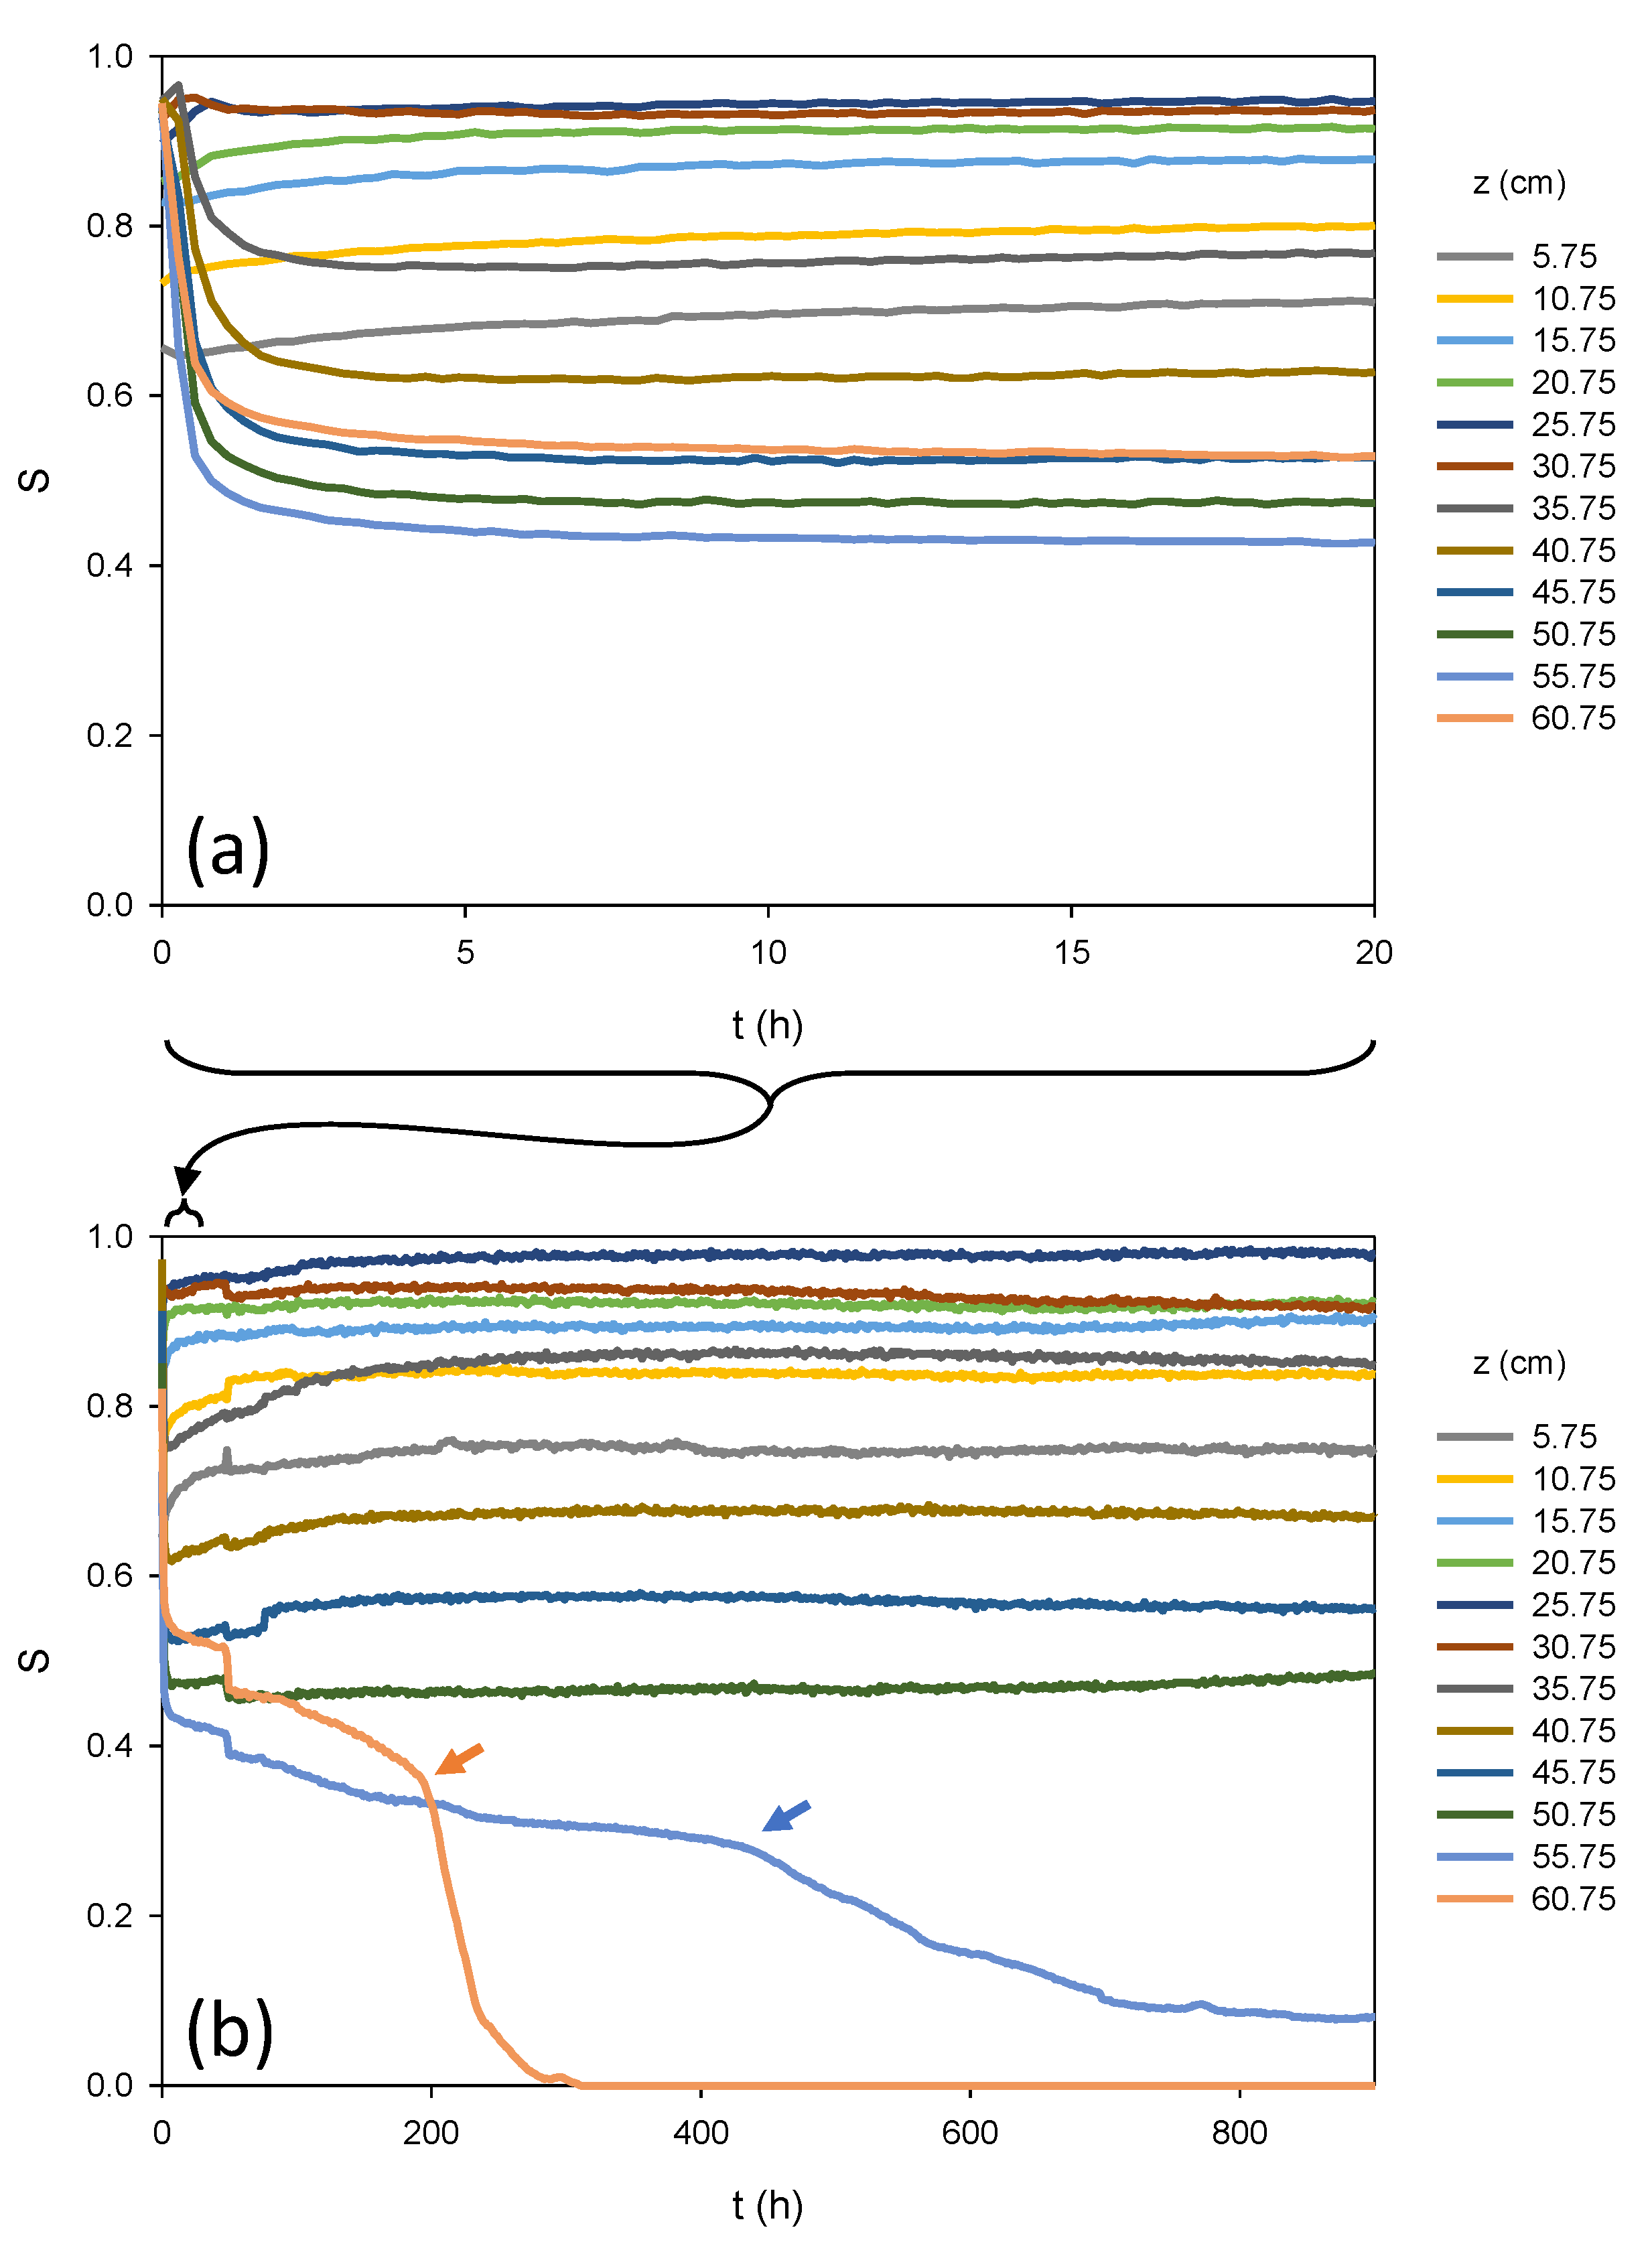
Figure 4 shows the measured saturations at the 12 sensors in the column over two time scales.
Figure 4a corresponds to the first 20 h of the experiment—the same time scale as the imbibition curves in
Figure 3—while
Figure 4b corresponds to the first 900 h (37.5 days) of the experiment.
From
Figure 4a, it is apparent that the onset of drainage is extremely rapid, with the most substantial changes in saturation occurring in the first hour—faster than for imbibition—after which saturation seemingly stabilizes throughout much of the column. It should be noted, however, that sensors near the bottom of the column show values below full saturation at the start of the experiment, possibly due to packing defects near the bottom sensors that allowed water to bypass pockets of porous media, trapping air. It is also possible that the water level was increased too rapidly when the reservoir was raised prior to the drainage experiment, trapping air in the column. Regardless, the fact that portions of the column were below full saturation (so would exhibit low relative permeabilities) may in part explain the fact that the top of the column was at a relatively high saturation after an elapsed time of 20 h. Note that at the end of 20 h, the water content at the top sensor (S~0.55) was actually higher than the water content at the three sensors below it (S~0.4 for the second from the top).
From
Figure 4b, it is apparent that the seemingly stabilized saturation values at the end of the 20 h period in
Figure 4a were, in fact, still changing, but over a much longer time scale, as redistribution occurs. Saturations corresponding to the bottom sensors continue to rise over approximately 200 h (~8.3 days), although in the time scale of this figure, the portion of the column near the water table remains below full saturation. Similarly, the saturations corresponding to the top two sensors gradually decrease over approximately 200 h. Of particular interest, however, is the change in slopes of the saturation vs. time curves for the top two sensors, notable around 200 h for the top sensor (orange arrow) and just after 400 h for the second from the top (blue arrow). These slope changes appear to correspond to an evaporative drying front moving down from the top of the column. The top sensor was approximately 2.5 cm from the top of the packed sand, while the next one was approximately 7.5 cm from the top of the packed sand. Once the evaporative front reached the top sensor, the saturation at that sensor dropped rapidly, reaching zero (i.e., completely dry) around 300 h (~12 days from the start of the experiment). The saturation at the second sensor from the top of the column dropped to approximately 0.1 around 800 h (~33 days). Saturation at the top sensor remained essentially zero for the duration of the 1207-day experiment, while saturation at the second sensor did not continue to drop, although it fluctuated over time. The evaporative drying front did not appear to reach the third sensor.
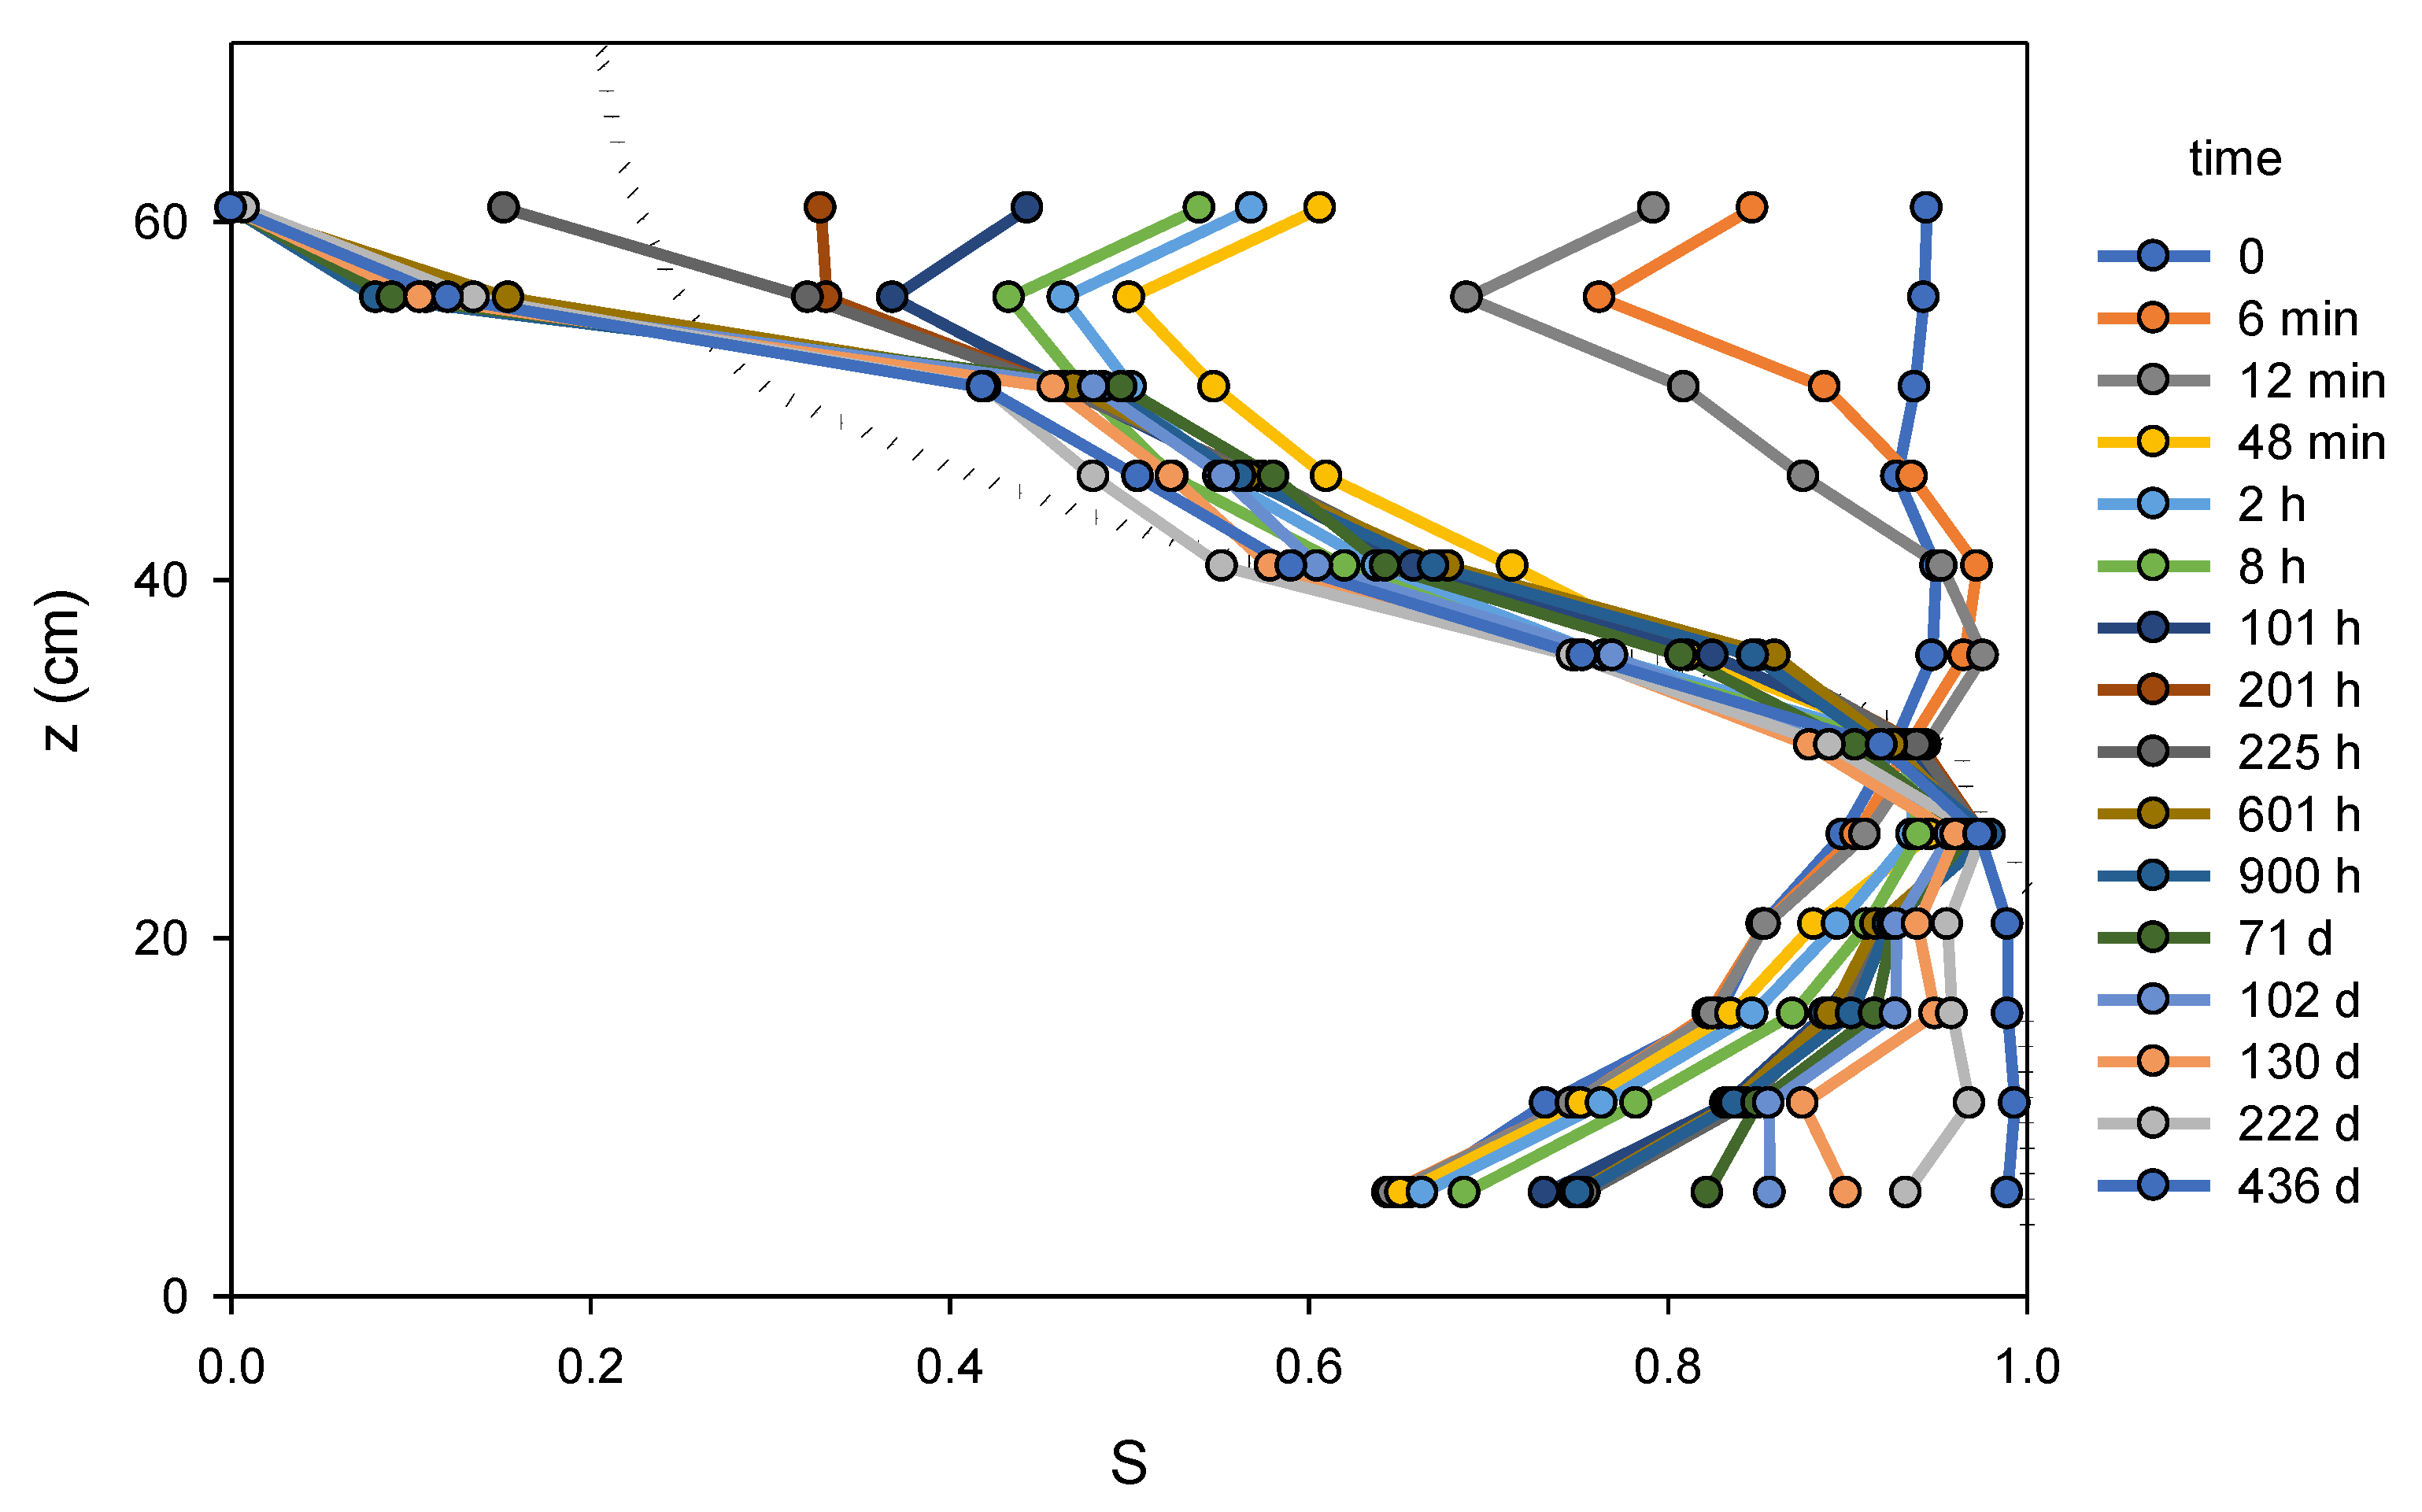
Figure 5 shows elevation vs. saturation for sixteen different times within the first 436 days following the start of drainage. Also shown in the figure is a measured
Pc–
S relationship for the same US-Silica F45 sand, determined in earlier work [
21,
22] using methods based on a small (2.54 cm inner diameter × 1.27 cm height) soil cell described previously [
10]. Notable in the figure is the fact that the porous medium near the water table began below full saturation, but gradually approached full saturation over hundreds of days as water redistributed in the column. This process was likely accelerated by the opening of column vents at day 128, a step that allowed trapped air to leave the column. The similarity of the late time elevation-saturation curves to the previously measured
Pc–
S relationships is also apparent from the figure, except for the two sensors near the top of the column. Previously measured residual saturation in the F45 sand was found to be approximately 0.2, yet the saturations measured by the top two sensors fell below that within the first month of the experiment and remained below it for the full duration of the experiment, an indication of the role of evaporation at the top of the column.
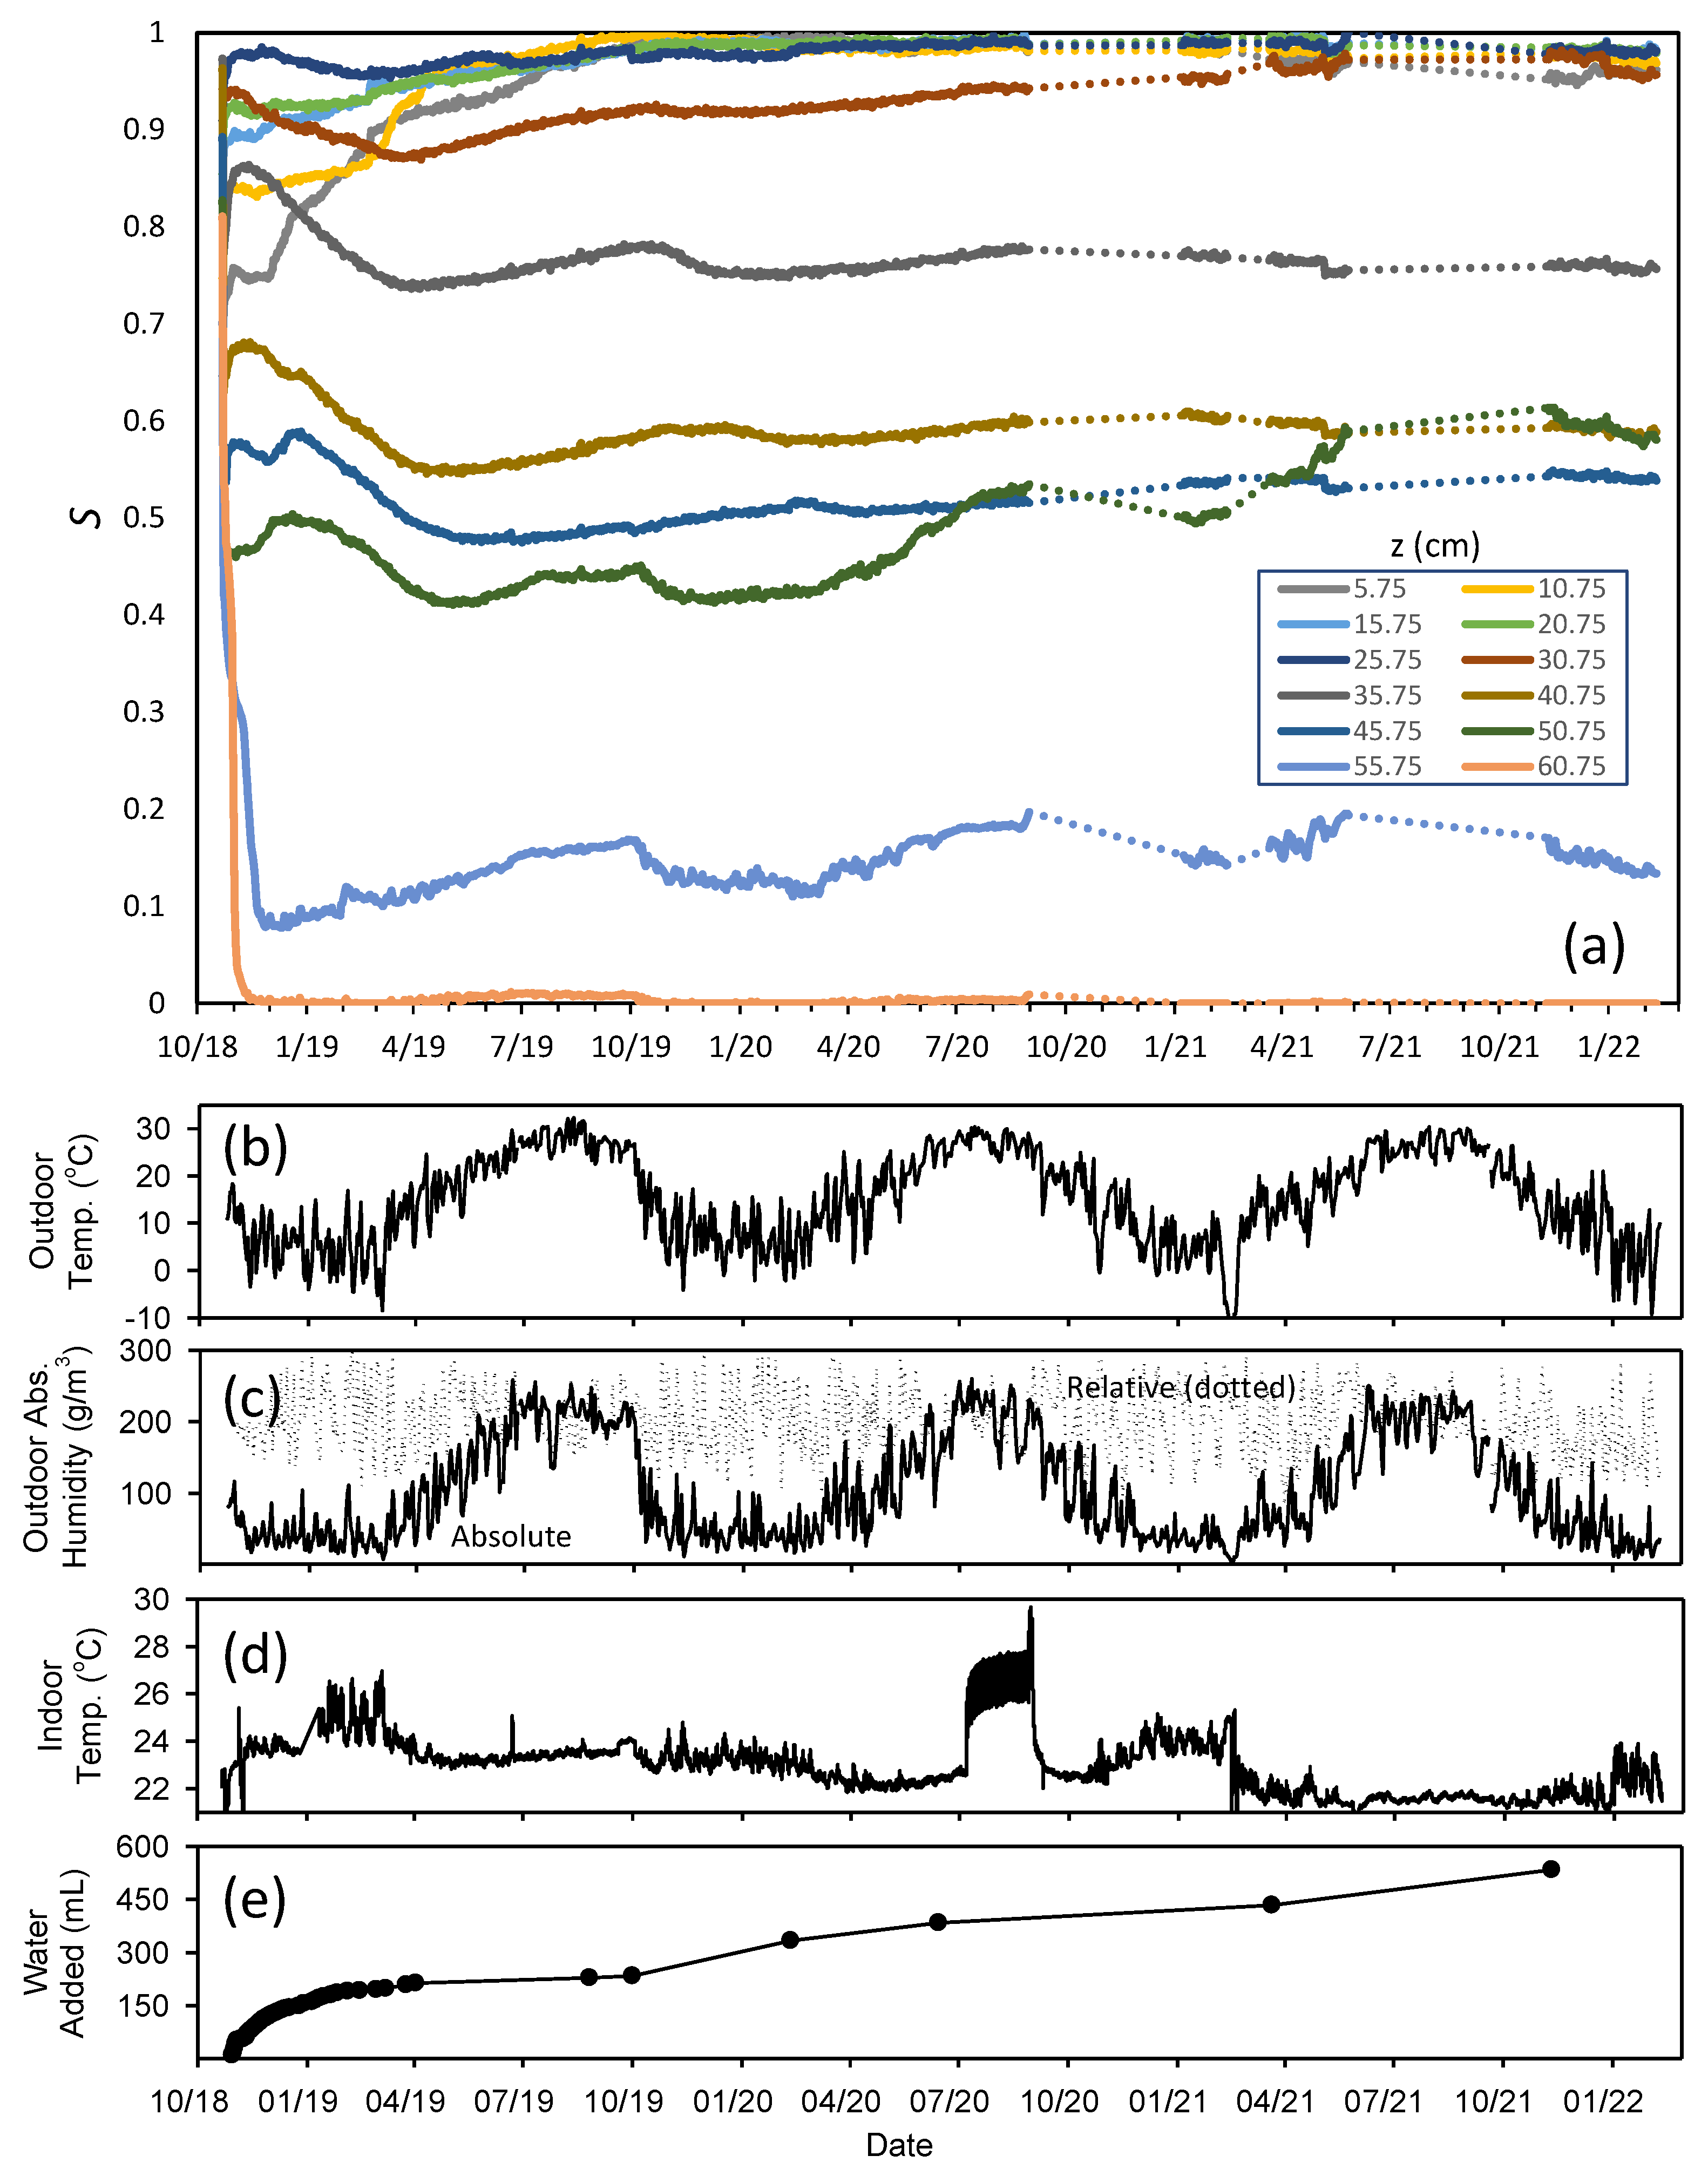
Figure 6 shows saturation measured by the 12 sensors over the full 1207-day duration of the experiment (
Figure 6a), as well as details on the environmental conditions during the experiment, including outdoor temperature (
Figure 6b), outdoor relative and absolute humidity (
Figure 6c) and indoor temperature (
Figure 6d). In addition, cumulative water additions over the course of the experiment are shown in
Figure 6e. Note that the sensors monitoring saturations experienced several interruptions, likely due to brief power outages that were not immediately detected; most occurred later in the experiment, when the experiment was only monitored intermittently.
Looking at
Figure 6a, one of the most interesting features of the experiment is the apparent evidence of seasonal fluctuations in the column saturations. While the water table (the level in the external reservoir) was kept within 0.25 cm of its initial position for the duration of the experiment, the saturation values at many levels in the column were observed to fluctuate by as much as 0.1, and the fluctuations appear to have a seasonal pattern. Except for the measured saturation at the top sensor, which remained nearly dry for most of the experiment, the greatest seasonal effects were observed higher in the column. In general, saturations tended to increase in the spring and summer, but decrease in the fall and winter. This is likely the result of changing indoor humidity.
Note the strong similarity between the seasonal trends in outdoor temperature (
Figure 6b) and outdoor absolute humidity (
Figure 6c) and column saturations. While outdoor relative humidity varies erratically over the course of a year (
Figure 6c, dotted lines), with no strong seasonal trends, the absolute humidity (
Figure 6c, solid lines) is strongly tied to temperature, because the saturated vapor pressure increases with increasing temperature. The total moisture content in the air in the summer exhibited peak summer values of ~250 g/m
3, more than eight times the typical winter value of ~30 g/m
3. That means that substantially more moisture is likely to be in indoor air exchanged with the outdoors during times when outdoor absolute humidity is high. Since indoor temperatures are relatively constant, that means that indoor relative humidity is likely much higher in the spring and summer than the fall and winter. It is relative humidity that controls evaporation rate, with higher relative humidities corresponding to less driving force for evaporation, and thus, slower evaporation. As such, slower evaporation would be expected indoors in the spring and summer, changing the balance between rate of evaporation and rate of capillary driven flow, allowing saturation to increase. Furthermore, note that the saturation change was reversible, with saturation increasing at times when evaporation would be expected to be slow, and decreasing at times when evaporation would be expected to be fast. This result highlights how the saturation profile results from a dynamic equilibrium between capillary-driven flow and evaporation.
Figure 6d shows the indoor temperature monitored throughout the experiment. Overall, temperature only varied within a narrow window over the 1207 days, typically staying within the 22–24 °C range for most of the 3.31 years, with a few exceptions, including one period in summer 2020, when the indoor temperature rose to ~26 °C for an extended period when the laboratories were closed for the pandemic, possibly due to a HVAC system problem. It is interesting to note that the indoor temperature was on the lower end of the range for the final year of the experiment, a time period that corresponded to some of the highest saturations at some levels, particularly at the level of the third sensor from the top (50.75 cm above the water table). This sustained lower indoor temperature may be responsible for the higher saturation late in the experiment, because a lower indoor temperature with the same absolute humidity would correspond to a higher indoor relative humidity, and thus, less driving force for evaporation.
Figure 6e shows the cumulative water addition in the column over the course of the experiment. Water was added intermittently as needed to maintain the level in the covered reservoir, particularly after the initial phase of the experiment. The large diameter of the reservoir relative to the column meant that even large volumes of water added to the reservoir produced extremely small changes in reservoir level. As such, the intermittent addition amounts are not a good measure of the water flux in the column over a short time scale. However, the cumulative amounts are of interest. A total of 533.5 mL of water was added to the reservoir over the duration of the experiment, more than eleven times the volume of water present in the column after the column water profile had stabilized early in the experiment. This means that there was significant upward flow over the course of experiment, with the water in the column continuously evaporating and being replaced by capillary-driven flow. Despite this, once the top of the column had dried, it remained dry for the duration of the experiment.
No water was added until 11 days into the experiment, due to rapid initial drainage. Subsequent water additions were initially high, as evidenced by the steep slope of the curve in
Figure 6e, but then slowed, likely as a result of the growing dry layer of sand at the top of the column effectively slowing exchange with the atmosphere. Required water additions were high initially (213 mL in the first six months), but slowed to an average of 127 mL/year later in the experiment. It should be noted that, although the column was vented, the areas of the vents (0.3 cm
2 each × 4) were small relative to the open top of the column (4.9 cm
2), a fact that may explain why no apparent drying was observed near the vents either through the sensor response or visually. This may also explain why the drying front did not proceed down into the capillary fringe as was observed in the highly-vented sand experiment in earlier work [
18]. Finally, although the cumulative upward flow was substantial over the duration of the experiment, the porewater velocity later in the experiment was negligibly small (127 mL/year corresponds to a porewater velocity of ~2 × 10
−8 m/s in this system); as such, pressure gradients from flow are essentially negligible after the initial portion of the experiment (on the order of 10
−5 cm water/cm sand), meaning that elevation in the column was a good measure of capillary pressure over much of the experiment. That means that the seasonal effects observed in
Figure 6 result from the impact of environmental conditions on the
Pc–
S relationship itself.
4. Conclusions
Results of this work support the assertion that there is a link between the observed Pc–S relationship in a porous medium and the rate of evaporation. Strong seasonal effects were observed, with saturations increasing during times when the driving forces for evaporation would be expected to be low, and decreasing at times when the driving forces for evaporation would be expected to be high. Column saturation change occurred over different time scales, with initial imbibition and drainage occurring relatively rapidly within hours to tens of hours, but then evaporative drying effects becoming apparent at much longer time scales in the hundreds of hours. Seasonal changes occurred at still longer time scales, and corresponded to reversible increases and decreases in saturation based on environmental conditions, despite the stable water table level. While the existence of upward flow due to evaporation has long been recognized and plays an important role in the movement of contaminants and plant nutrients in the subsurface, the temporal saturation increases and decreases observed in this work are interesting. This is particularly true given that the Pc–S relationship is hysteretic, with imbibition at a given Pc corresponding to a lower S than drainage at that same Pc. That fact might create the expectation that something that causes a decrease in saturation at a given elevation above the water table might not be followed by a reversible increase in saturation, simply because an increase in saturation due to net flow of water is typically associated with imbibition, which predicts a lower saturation at a given elevation above the water table. In this work, however, it is apparent that the saturations following drainage decreased and increased reversibly around the values associated with drainage.
Many contaminants must pass through the unsaturated zone in order to reach groundwater, and the presence of both air and water in the unsaturated zone means that adsorption to air–water interfaces can significantly retard transport for some contaminants. This means that anything that impacts water content in the unsaturated zone has the potential to influence fate and transport. As such, seasonal effects on the Pc–S relationship might be expected to contribute to the vertical smearing of environmental contaminants in the unsaturated zone, and may play an important role in determining ultimate fate. Furthermore, recognition of the distinct evaporation-associated environmental effects on the Pc–S relationship may be needed for accurate long-term predictive simulations of transport of contaminants in the unsaturated zone, because use of the hysteretic Pc–S relationship in computations may yield incorrect predictions of water content when evaporation is the major driver of saturation change.
Evaporation at the top of the column was observed, with water in the top of the column evaporating to dryness. Despite substantial water flux upward in the column, the top of the column remained dry for the duration of the experiment. However, unlike previous work in a highly vented column [
18], the drying front in this experiment did not continue to progress downward in the column, but instead was likely limited by a dynamic equilibrium between capillary-driven flow and evaporation.
