Article

Two-Phase Flow Modeling for Bed Erosion by a Plane Jet Impingement

by
Damien Pham Van Bang
1,†,
Miguel Uh Zapata
1,2,*,†,
Georges Gauthier
3,†,
Philippe Gondret
3,†,
Wei Zhang
4,† and
Kim Dan Nguyen
5,†
1
Laboratory for Hydraulics and Environment, INRS-ETE, Quebec, QC G1K 9A9, Canada
2
CONACYT–Centro de Investigación en Matemáticas A. C., CIMAT Unidad Mérida, PCTY, Sierra Papacal, Merida 97302, Mexico
3
Laboratoire FAST, CNRS, Université Paris Sud, Bât. 502, Campus Universitaire, 91405 Orsay, France
4
Department of Civil Engineering, Xi’an Jiaotong-Liverpool University, Suzhou 215123, China
5
Laboratory for Hydraulics Saint Venant, École des Ponts, EDF-CEREMA, 78400 Chatou, France
*
Author to whom correspondence should be addressed.
These authors contributed equally to this work.
Water 2022, 14(20), 3290; https://doi.org/10.3390/w14203290
Submission received: 23 September 2022 / Revised: 15 October 2022 / Accepted: 17 October 2022 / Published: 18 October 2022
(This article belongs to the Special Issue Advances in Experimental Hydraulics, Coast and Ocean Hydrodynamics)

Abstract

:
This paper presents experimental and numerical studies on the erosion of a horizontal granular bed by a two-dimensional plane vertical impinging jet to predict the eroded craters’ size scaling (depth and width). The simulations help understand the microscopic processes that govern erosion in this complex flow. A modified jet-bed distance, accounting for the plane jet virtual origin, is successfully used to obtain a unique relationship between the crater size and a local Shields parameter. This work develops a two-phase flow numerical model to reproduce the experimental results. The numerical techniques are based on a finite volume formulation to approximate spatial derivatives, a projection technique to calculate the pressure and velocity for each phase, and a staggered grid to avoid spurious oscillations. Different options for the sediment’s solid-to-liquid transition during erosion are proposed, tested, and discussed. One model is based on unified equations of continuum mechanics, others on modified closure equations for viscosity or momentum transfer. A good agreement between the numerical solutions and the experimental measurements is obtained.

1. Introduction

Vertical jet-induced scour erosion of soil has been studied for many industrial applications, such as aerospace or hydraulic engineering [1,2,3,4,5,6]. As reported by Metzger et al. [1,2], in aerospace engineering, soil erosion and crater formation could generate problems for launching and landing spacecraft. In hydraulic engineering, we have several examples, such as the work of Rouse [3] for testing criteria on erosion, the study of Hanson and Cook [4] assessing in situ the erodibility of soil material, and the research developed by Hanson and Hunt [5] in the so-called jet erosion test (JET). We also have the work of Perng and Capart [6] for water injection dredging (WID) and trenching in harbors by jet translation and possible jet inclination.
Experimental investigations of the jet normal impingement on plane surfaces have been conducted in various conditions. Although the jet nozzle section is circular in most cases [4,7,8,9,10,11,12,13,14], it can also be rectangular [15,16,17,18]. The circular and rectangular cases are called quasi-three-dimensional (3D) axisymmetric and two-dimensional (2D) plane jets, respectively. The jet can be either gas [1,2] or liquid [4,6] within unsubmerged [1,2] or submerged [8,9,11,12,13,14,15,16,17,18] conditions. Finally, the soil can be either cohesive [11] or non-cohesive [13,16].
Based on experiments of 3D axisymmetric jets impinging on a smooth non-erodible wall, Rajaratnam and Beltaos [8] and Phares et al. [18] divided the flow into three zones:
  • The free jet region. There is no influence of the boundary. It can be described by self-similar solutions [19,20].
  • The impinging region. It is characterized by a stagnation point on the jet axis at the wall with a deflexion of flow streamlines [21].
  • The wall jet region. It is close to the wall but away from the impinging zone where the flow is mainly parallel to the wall [22,23,24].
Based on pressure and shear stress measurements on the bed, Rajaratnam and Beltaos [8] reported that the most extreme hydrodynamic action is located in the impinging region with maximum pressure at the stagnation point and maximum shear stress just away from it.
On erodible beds, two main crater shapes have been identified [1,2,7,8,9,10,15]. The first one consists of wide and shallow craters for high impingement heights L (distance from the jet nozzle to the initial flatbed). Here, the flow streamlines weakly deflect in the impinging region, and a smooth crater shape remains stable after the jet flow stop, see Figure 1a. For the second shape, narrower and deeper craters are obtained for small L and large flow rates. Here, the flow streamlines strongly deflect, and the crater shape changes after the jet stop with granular avalanches lowering the steep slopes, see Figure 1b.
Aderibigbe and Rajaratnam [9] state that these two crater regimes depend on the value of an adimensional erosion parameter. This parameter is defined for quasi-3D axisymmetric jets as
E = U J b L 1 ( s 1 ) g d 1 / 2 ,
where U J is the mean velocity at the nozzle outlet, b is the nozzle diameter, L is the impingement height, d is the sediment grain size, and s = ρ p / ρ f is the particle/fluid density ratio. This parameter is sometimes called a densimetric Froude number [17] and roughly corresponds to the Rouse number [3].
For the 3D axisymmetric experimental data [9], the erosion parameter E is ranged up to 5. This parameter was used by Sutherland and Dalziel [14] to investigate the crater formation dynamics in granular beds by a 3D water jet. In the 2D turbulent plane jet case, the erosion threshold is well governed by E, as shown in [17]. Recently, Badr et al. [15] proposed that the modified Shields can control the erosion threshold for both turbulent and laminar regimes. However, we should consider the correct decay law of self-similar regimes and the precise position of the corresponding virtual origin. Moreover, in the 2D plane jet test case of Badr et al. [15], the critical value of the local Shields number for erosion is a constant S h c 1 independently of the jet flow regime and the grain diameter of the bed.
On the other hand, several numerical studies have been proposed to study the crater formation by an incident jet. We can clearly identify two types of numerical modeling frameworks. In the first type, numerical models apply computational fluid dynamics (CFD) software for computing the fluid motion only above the bed [1,25,26,27]. The second modeling framework is based on two-phase approaches, in which the motion equations solve both solid and fluid phases [28,29,30,31,32,33,34,35].
The common point of models based on CFD software is that the sediment bed is considered an impermeable wall (no-slip conditions). However, their modeling approaches mainly differ in treating the two-phase interaction between the fluid and the sediment bed. For example, Metzger et al. [1] use CFD++ software to study the steady-state flow above different stationary boundary conditions (or crater geometries) but calculate the porous flow inside the sediment bed by Darcy’s law and pressure values. Weidner et al. [25] and Mercier et al. [26] use FLUENT to dynamically adapt the computational grid into the bed’s evolving geometry; however, they do not consider the sediment below the bed interface.
For the two-phase formulation, the Eulerian approach usually models the fluid phase, but Eulerian or Lagrangian techniques can be used for the solid phase. A Lagrangian model for the solid phase enables a microscopic description of the particle motion. The flowing (eroded) and jammed (non-eroded) regions in the sediment bed are directly simulated, grain by grain. However, this framework suffers from high computational costs due to the number of solid particles. For examples of this formulation, we refer the work of Kuang et al. [28], and more recently the studies of Benseghier et al. [29,30].
On the other hand, in the Eulerian–Eulerian framework, clear fluid and solid particles are treated as two interpenetrating fluids. The fluid–particle and particle–particle interactions are described at the scale of the continuum media [32,33,34,35]. However, if only a liquid-like behavior of solid particles is modeled to handle the motion of the granular phase for the jet problem, the sediment motion becomes unrealistic, particularly in the jammed region [32,33].
Therefore, solid-like and liquid-like behaviors of sediment are essential and need to be considered for more accurate models. In recent years, few efforts have been performed to include this property in the Eulerian approach; for example, Yuan et al. [33] applied an incipient motion theory in their numerical simulations, Uh Zapata et al. [34] proposed a modified inter-phase momentum transfer formulation, and Wang et al. [35] used a model for the solid–fluid mixture combined with a viscoplastic description of soil. Consequently, this paper proposes a unified formulation for continuum mechanics to simulate vertical-jet-induced erosion with a unique local parameter governing the solid/liquid transition for the sediment. This model is based on a technique initially developed by Greenshields and Weller [36] to handle fluid–structure interactions of flexible and impermeable tubes under fluid flows.
This paper’s originality relies on the experimental results and new numerical model for submerged vertical plane jet-induced craters on horizontal non-cohesive sediment. The remaining document organization is as follows. Section 2 presents the experimental setup to generate craters, measuring their sizes for different impingement distances and jet velocities. The presentation of the two-phase model, using the two-phase Euler–Euler approach, is proposed in Section 3. We give a complete description of the model improvements, which produce both solid-like and liquid-like behaviors of the sediment. Next, Section 4 shows that the correct local Shields number choice for this governing parameter leads to very close agreement with the experimental results. Finally, we present the discussion, conclusions, and future work.

2. Laboratory Experiments

In this section, the experimental results for the crater depth and width are analyzed following Badr et al. [15] in terms of the self-similar jet model. We pay particular attention to the corresponding virtual origin. Simple scaling for the crater sizes is found in terms of a local erosion parameter.

2.1. Experimental Setup

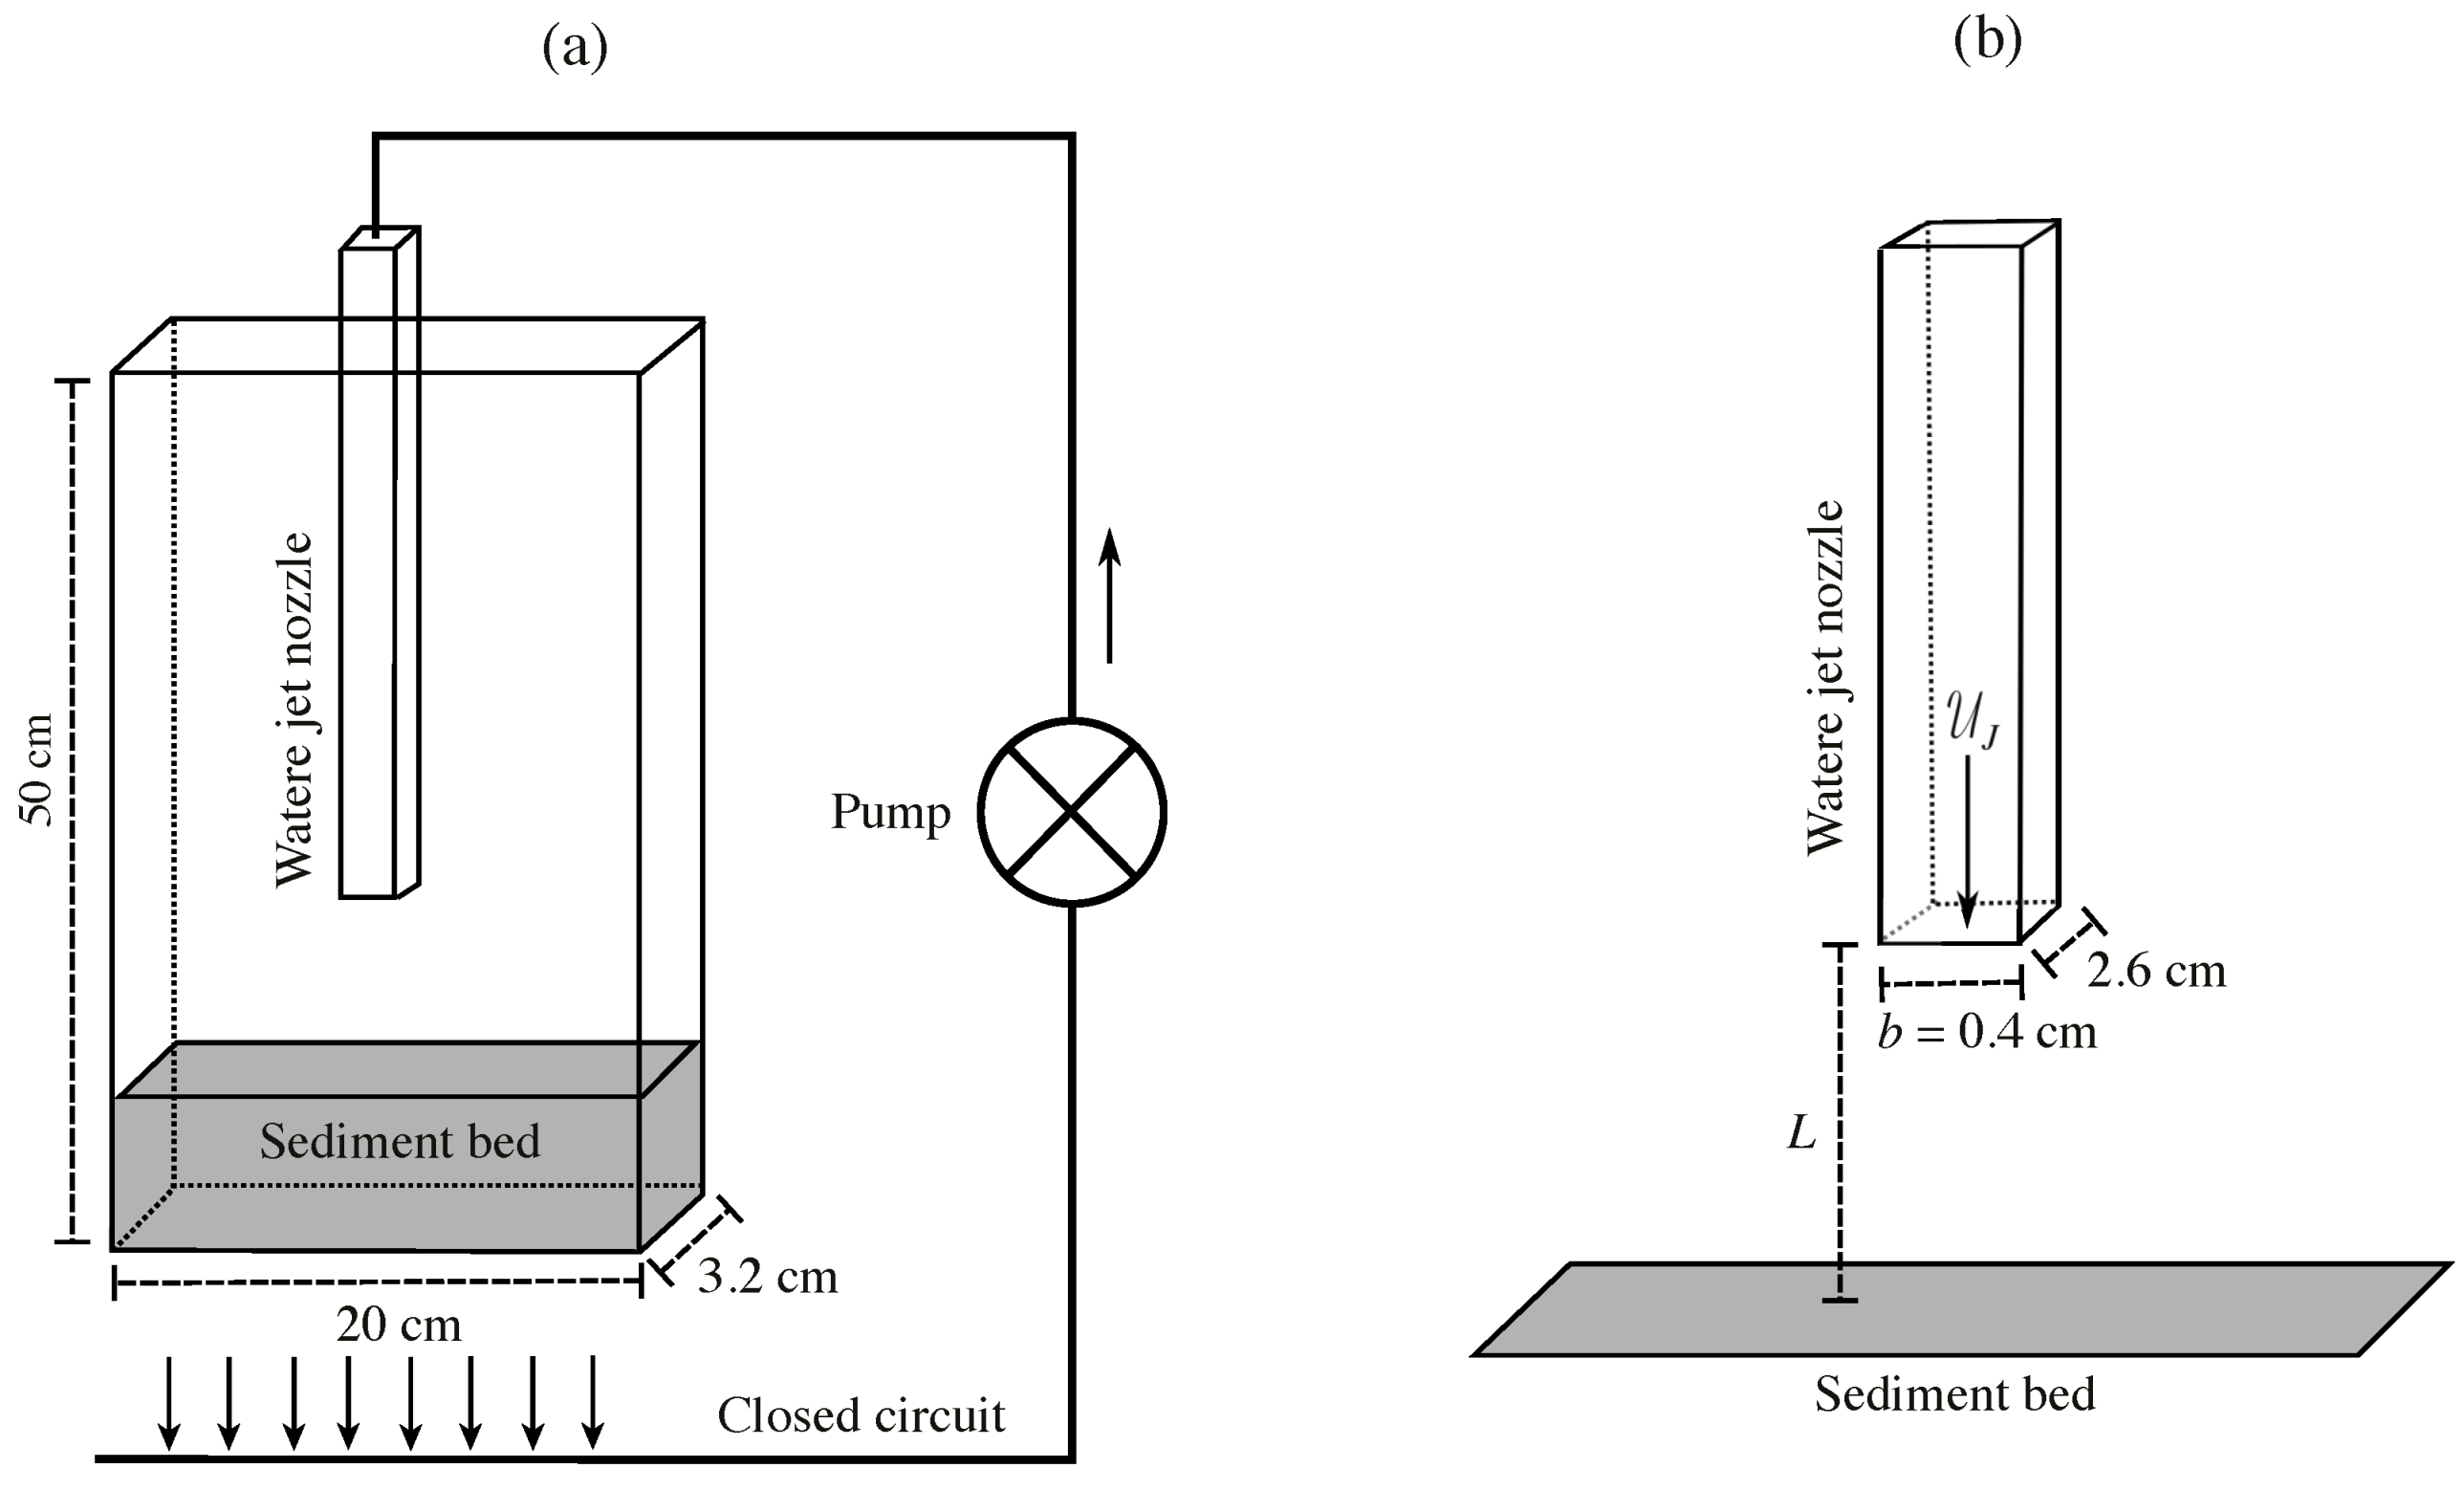
The experimental set-up consists of a vertical plane water jet impinging a horizontal granular bed immersed in water, as sketched in Figure 2. The grains are monodisperse glass beads with diameter d = 350 μ m with the density ρ p = 2.5 × 10 3 kg/m 3 . The granular bed is 10 cm in height (about 300-grain diameters) with a solid volume fraction of about 0.6 . It lies on the bottom of a 3D rectangular container of dimensions 50 × 20 × 3.2 cm 3 filled with water (density ρ f = 10 3 kg/m 3 and kinematic viscosity ν f = 10 6 m 2 /s); see Figure 2a. The container walls are in polymethyl methacrylate (PMMA), allowing visualization.
A vertical plane water jet is generated at the exit of an injector with an inner rectangular cross-section of dimensions b × w J = 0.4 × 2.6 cm 2 . The outside cross-section of the injector is 1 × 3.2 cm 2 to fit within the container gap. The injector is at a distance L above the granular bed, see Figure 2b.
The mean velocity of the jet is given by U J = Q / ( b w J ) . A gear pump controls the steady water flow Q with very low negligible fluctuations in a closed circuit. Here, water is sucked through the bed from the porous bottom of the container and re-injected by the pump through the injector.
In this paper, the jet Reynolds number is defined as
R e = U J b ν f .
Although R e is not much relevant to describe the erosion phenomena, the jet Reynolds number is essential to characterize the jet regime among laminar, oscillating laminar, oscillating turbulent, and fully turbulent, as detailed by Badr et al. [15] and Tritton [19]. The injector is long enough (20 cm) to ensure a laminar regime inside the injector. It also has a parabolic Poiseuille velocity profile across the thickness b at the nozzle in the range of jet Reynolds numbers R e < 2 × 10 3 .

2.2. Measure of the Crater Dimensions

The erosion process is observed until the resulting crater reaches a quasi-stationary state in a few seconds. The size of the jet-induced scour hole is characterized by the two measured parameters: crater depth and width, as shown in Figure 1. The depth, H, is defined as the distance from the bottom of the crater to the initial bed surface. The width, D, is also determined at the level of the initial bed surface and not at the level of the crater crests.
The measurements are extracted from the images taken by a camera placed in front of the container with backlighting. When the crater stops evolving, we measure the results from the difference between the quasi-stationary image and the initial flatbed image. This procedure allows an easy and accurate determination of H and D. It is important to remark that the measured crater has dynamical sizes, which result from the dynamical crater equilibrium sustained by the steady jet flow. In that case, the dynamic angle may be larger than the avalanche angle.

2.3. Experimental Results

The crater size measurements are shown in Table 1 and Figure 3. We use six different jet velocities in the range of 0.16 < U J < 0.47 m/s ( 630 < R e < 1900 ) and different jet-bed distances ( 2 L / b 40 ). Figure 3 shows the crater depth H and width D normalized by the jet thickness b.
Figure 3a shows that for a given mean jet velocity U J , the crater is deeper at lower L values. As one would expect, H decreases toward zero as L increases. Above a critical distance, L c , there is no erosion and thus no crater formation is seen anymore. Note that the critical distance L c also increases with U J . For a given value of L (see for instance L / b = 10 ), H increases with the jet velocity U J . At low enough U J , here, U J < 0.1 m/s, no erosion can be seen, whatever the value of the jet-bed distance. On the other hand, Figure 3b shows that the crater width D increases with L and U J from a non-zero value, D 0 , close to the erosion threshold.
Previous behavior can be understood when considering the jet spatial evolution downstream of the injector nozzle. As the jet Reynolds number is larger than 200, the jet regime is turbulent with a local velocity u 0 at the jet axis. This velocity decreases according to the distance L with a law that can be approximated by the following self-similar model for free jets [37]:
u 0 U J = 1 K L / b λ / b ,
where K 1 / 2 is the decay rate and λ is the distance of the virtual origin of the jet from the nozzle exit. Here λ > 0 for a virtual origin downstream of the jet nozzle. In the proposed experimental conditions, λ is equal to 10 b . From jet momentum conservation, the jet width δ increases in the meantime with L by the following law:
δ b = K 2 L / b λ / b ,
where K 2 1 / 4 corresponds to the jet opening angle θ = tan 1 ( K 2 ) 15 . We remark that the jet velocity spatial profile (3) and (4) is only valid downstream the potential core. By contrast, in the injector, the jet velocity u 0 remains constant and equal to u 0 = ( 3 / 2 ) U J for a laminar parabolic Poiseuille profile.
In such a self-similar model, the reduced jet-bed distance, L λ , appears as the pertinent length scale that may govern the crater size. Thus, taking into account the virtual origin of the jet, a relevant dimensionless parameter for the jet erosion strength is the local erosion parameter E or Rouse number. In the present inertial regime of high particle Reynolds number, this parameter is given by
E = U J b L λ 1 / 2 1 ( s 1 ) g d 1 / 2 ,
which corresponds to the ratio of the local jet velocity to the grain settling velocity. Equation (5) is similar to expression (1) proposed in [9]. Note that if U J goes with b in the numerator of Equation (5), then non-dimensionalization will need a L factor in the denominator. It is all a direct consequence of the jet being characterized by its momentum flux. Thus, besides considering the effective jet-sediment distance, the model differs in the exponent −1/2 (instead of −1) for the L scaling. This exponent is coming from the self-similar free jet models for a 2D plane (instead of 3D axisymmetric) flow geometry.
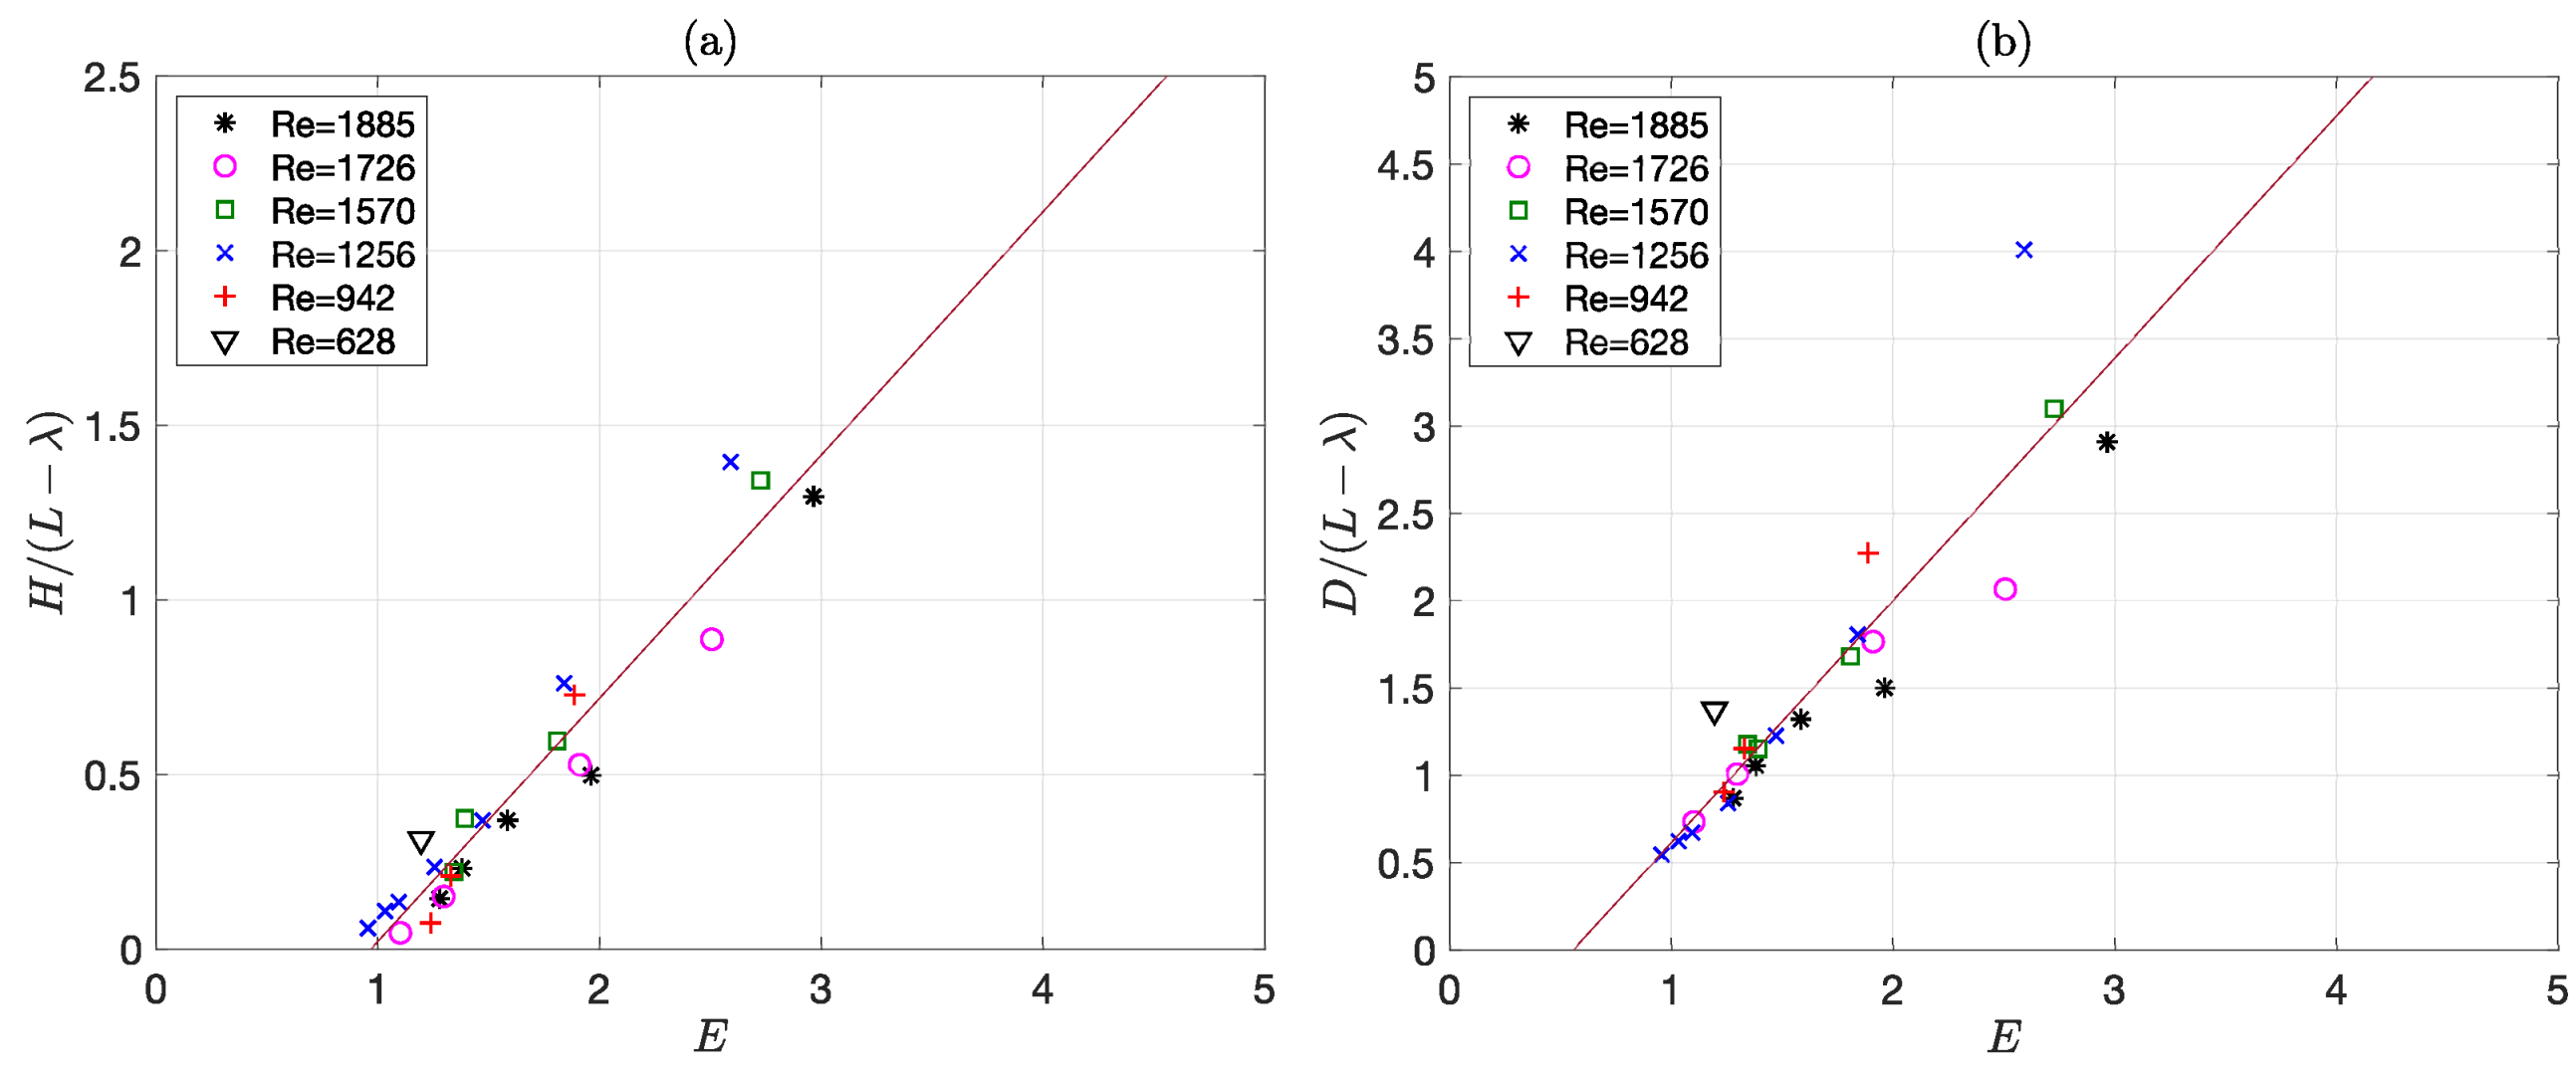
Figure 4 shows the crater size data normalized by the reduced distance L λ as a function of the dimensionless erosion parameter E given by Equation (5). We compute E using s 1 = 1.5 , g = 9.8 m/s 2 and d = 350 μ m. Note that the different curves collapse into a master curve of simple trend. The dimensionless crater depth H / ( L λ ) increases linearly with E above a critical value E c corresponding to erosion threshold, as follows:
H / ( L λ ) = m H ( E E c ) ,
where m H = 0.7 ± 0.0 5 and E c = 1 ± 0.1 . Similarly, the dimensionless crater size D / ( L λ ) increases linearly with E above the critical value E c ; however, it has a non-zero value D 0 at the threshold. Thus, we obtain
D / ( L λ ) = m D ( E E c ) + D 0 * ,
where m D = 1.4 ± 0.1 and D 0 * = D 0 / ( L λ ) = 0.55 ± 0.05 .
The critical value E c 1 found here for the erosion threshold at vanishing crater depth agrees very well with the critical value one reported by Badr et al. [15] with just a visual criterion of the few first moving grains in a similar setup. It is worth noting that taking into account the distance λ of the virtual origin of the jet from the nozzle exit is crucial to obtain a good rescaling of the data and such simple scaling laws. Indeed, the critical value E c 1 at the threshold is very satisfying, meaning that E is a pertinent parameter for describing vertical jet-induced erosion.
Finally, considering the evolution of crater sizes H and D with the jet flow action, the shape of the crater evolves with a typical slope H / ( D / 2 ) that tends toward the value 2 m H / m D 1 at large erosive strength E ( E 1 ). This value corresponds to a global slope angle of about 45 , thus much larger than the usual critical avalanche angle 25 without any jet flow [38]. This shows that at large E, the crater slope is enhanced by an upward-back flow of the jet, as happens in homogeneous parallel shear flow [39].

3. Mathematical Model

The present two-phase flow model comes from a strict application of the mathematical formulation of Drew and Lahey [40], using a Eulerian–Eulerian description for the fluid–particle system. In this section, the governing equations for the two phases corresponding to clear fluid (water) and disperse medium (sediment particles in a fluid) are briefly recalled with special closure laws.
The present two-phase flow model is initially based on the two-fluid model presented in Barbry et al. [41] and Nguyen et al. [42,43]. This model only assumes a liquid-like behavior for the disperse phase (solid grains). We refer to this formulation as the standard or classical model. However, it cannot account for a possible solid-like behavior of the granular bed. In the present study on scouring erosion, we propose an improved model considering mobile and immobile parts of the granular media by a simple switch from fluid mechanics to soil mechanics equations. The benefit of this new treatment for the sediment particles is illustrated and justified in the numerical results when the method is compared with the initial two-fluid model.

3.1. Governing Equations

Before specifying the novel feature introduced to the model in the present paper, let us first recall the initial two-fluid model. For a constant width-integrated 2D x / z two-phase flow model, the governing equations in a Eulerian formulation for the k-phase read as
( α k ρ k ) t + · ( α k ρ k u k ) = 0 ,
( α k ρ k u k ) t + · ( α k ρ k u k u k ) = · α k σ ¯ ¯ k + α k ρ k g + M k ,
where k = f stands for the clear fluid (water) and k = s for the solid particles, respectively. The volume fraction is represented by values α k with α f + α s = 1 . Here, ρ k is the density, u k = ( u k , w k ) is the velocity vector, and g stands for gravity. The symbol M k refers to the inter-phase momentum transfer, and σ ¯ ¯ k is the total stress tensor of phase k. In this paper, the double bar over a symbol means a tensor of order two.
The total stress tensor of phase k is given by
σ ¯ ¯ k = p k I ¯ ¯ + τ ¯ ¯ k + τ ¯ ¯ k R e .
where I ¯ ¯ is the identity tensor. Equation (10) is the sum of three contributions: the pressure ( p k ) of phase k, the deviatoric viscous ( τ ¯ ¯ k ), and Reynolds stresses ( τ ¯ ¯ k R e ). Following Lundgren [44] for the slow motion of two-fluids, the non-turbulent stresses are expressed by
α f σ ¯ ¯ f = α f p f I ¯ ¯ + 2 μ f α s D ¯ ¯ s + α f D ¯ ¯ f ,
α s σ ¯ ¯ s = α s p s I ¯ ¯ + 2 μ f α s β α s D ¯ ¯ s + α f D ¯ ¯ f ,
where D ¯ ¯ k = 1 2 u k + u k T is the shear rate tensor of phase k. In Equations (11) and (12), the parameter μ f is the dynamic viscosity of the clear fluid (water) and β is an increasing function of the solid volume fraction of grains, for which we use the expression of Graham [45]. We refer to Nguyen et al. [42,43] for more details.
To compute the Reynolds stresses τ ¯ ¯ k R e for the two-phase model, the standard k f ϵ f model is used for the fluid phase. For the turbulent model of the solid phase, we use the closure equations k s k f s (turbulent kinetic energy of particulate phase, k s , with covariance of fluid and solid velocity fluctuations, k f p ). This model is considered a two-way coupling because it can evaluate the effects of solid particles on fluid turbulence and vice versa [42,46].
The momentum exchange between phases, M k , is decomposed into jump conditions ( p k i and τ ¯ ¯ k i ) and different forces ( M k * ) acting on phase k, as follows
M f = p f i I ¯ ¯ τ ¯ ¯ f i α f + M f * ,
M s = p s i I ¯ ¯ τ ¯ ¯ s i α s + M s * .
Here, the subscript i specifies the solid/fluid interface. As the interfacial tension is zero, there is no discontinuity of the pressure ( p s i = p f i = p f ρ f | | u f u s | | 2 / 4 , where · means the Euclidean norm) and the shear stress ( τ ¯ ¯ s i = τ ¯ ¯ f i = β τ ¯ ¯ f ) across the fluid/sediment interface (Drew and Lahey [40]).
In Equations (13) and (14), the momentum exchanged between phases ( M f * = M s * ) is the sum of the drag and lift forces exerted on the solid particles, the added mass effect, the Faxén correction and the Basset historical term. In the present formulation, we only retain the drag force as it is dominant, as follows:
M s * = F D u r , F D = α s ρ s / τ f s ,
where u r = u f u s u d is the relative velocity of fluid-particles. Here, u d is the drift velocity which represents the correlation between the fluctuating velocity of the fluid and the instantaneous spatial distribution of particles. The drag force is also expressed as a function of the solid concentration ( α s ) and the particle relaxation time τ f s given by
τ f s = 4 d ρ s / 3 ρ f C D | | u r | | , C D = 24 R e p f ( R e p ) .
For turbulent two-phase flows, the drift velocity and particle relaxation time are very important, as discussed in Nguyen et al. [42]. For the present study, the drag coefficient ( C D ) is computed from the formula of Haider and Levenspiel [47], where R e p is the particle Reynolds number.

3.2. A Unified Momentum Equation for the Solid Phase

The set of Equations (8)–(16) roughly describes the fluid–sediment system as a two-fluid system. In particular, Equations (11) and (12) for the viscous stress correspond to a rheological law for complex fluids. Such a model is only valid below the packing fraction when the granular material has a liquid-like suspension behavior. However, we expect a solid-like behavior for the particulate phase close to the packing fraction at the bed surface or deeper in bulk.
The numerical solution given by Equations (8)–(16) are unphysical and erroneous in high solid fraction regions: the sediment’s liquid-like behavior is clearly visualized by wavy iso-contour lines in the sediment bed; see Section 4.1. We remark that similar results are obtained using the Eulerian model proposed by Qian et al. [32] and Yuan et al. [33] for this problem. To overcome this issue, this paper adapts a unified formulation, mainly inspired by Greenshields and Weller [36], to describe both the liquid-like and solid-like behavior of the sediment phase.

Solid-Like Model

For the solid-like model, we assume a Hookean material that undergoes small deformations. In this case, a linear elastic, isotropic model is used. Thus, the strain tensor ( ε ¯ ¯ s ) corresponds to the time integration of the strain rate tensor ( D ¯ ¯ s ) as follows:
σ s = p s I ¯ ¯ + dev ( σ ¯ ¯ s ) = p s I ¯ ¯ + t 0 t n dev ( σ ¯ ¯ ˙ s ) d t + dev ( σ ¯ ¯ 0 ) ,
where the deviatoric component of σ ¯ ¯ is defined as dev ( σ ¯ ¯ ) σ ¯ ¯ 1 3 tr ( σ ¯ ¯ ) I ¯ ¯ , and dev ( σ ¯ ¯ 0 ) is the deviatoric solid stress at the initial time. Equation (17) can be approximated by a quadrature formula for the integral, as follows:
t 0 t n dev ( σ s ) d t = ω n dev ( σ ˙ s ) n + i = 1 n 1 ω i dev ( σ ˙ s ) i ,
where ω i represents the quadrature weighting functions. Here, ( · ) n indicates the current time ( t n ). Note that the sum is taken over previous stages t i ( i = 1 , , n 1 ).
Next, we can substitute (18) into (17). Now, using the relationship between ε s and D s , we obtain
σ ¯ ¯ s = p s I ¯ ¯ + 2 G ω n dev ( D ¯ ¯ s ) + Σ ,
where the shear modulus is given in terms of the elastic Young modulus ( E ) and the Poisson’s ratio ( ν ) by G = E / 2 ( 1 + ν ) . In Equation (19), Σ is given by
Σ = i = 1 n 1 ω i dev ( σ ¯ ¯ ˙ s ) i + dev ( σ ¯ ¯ 0 ) ,
representing the accumulation of elastic stress from the beginning of the loading. Thus, the solid-like behavior of the granular phase can be modeled as
α s σ ¯ ¯ s = α s p s I ¯ ¯ + α s 2 G ω n dev ( D ¯ ¯ s ) + α s Σ .
Finally, we obtain a unified momentum equation for the sediment incorporating (21) into the two-phase flow model (8)–(15). Thus, to unify liquid-like model (12) and solid-like model (21), we introduce a smooth transition function (F), as follows:
α s σ ¯ ¯ s = ( 1 F ) α s p s I ¯ ¯ + α s β μ α s D ¯ ¯ s + α f D ¯ ¯ f + F α s p s I ¯ ¯ + α s 2 G ω n dev ( D ¯ ¯ s ) + α s Σ ,
where 0 F 1 . We remark that if F = 1 then Equation (22) reduces to the solid-like model (21). If F = 0 then a liquid-like motion is obtained by Equation (12). In other terms, the improvement proposed in this paper has a non-intrusive character since the original two-fluid model is recovered. For the fluid phase, the equations remain unchanged.

3.3. Solid-Liquid Transition of the Granular Phase

In the original development of Greenshields and Weller [36], F is a step function that takes either the value 0 or 1 according to the fluid or solid regions, respectively, since there is no interpenetration between them. In our modeling, F varies continuously from 1 to 0 using a smooth solid–liquid transition for the sediment.
From a physical viewpoint, function F encodes the erosion or fluidization criterion because it determines at any point of the computational domain if the disperse phase is flowing (eroded/fluidized bed for F = 0 ) or not (static bed for F = 1 ). Therefore, this function’s formulation is as complex as the physics of the erosion threshold. From a numerical point of view, function F should be monotone and sufficiently smooth with a continuous first derivative to avoid any numerical instability.
This paper considers for F an S-shape function with the following analytical expression:
F = 1 2 1 erf ( ξ ) ,
where erf is the Gaussian error function. We remark that Equation (23) has a unique parameter ξ governing the liquid–solid transition. In the numerical simulations, we select
ξ = S h S h c , with S h = ( u f 2 + w f 2 ) / ( s 1 ) g d ,
corresponding to the deviation of the local Shields number S h from its critical value for erosion S h c 1 . This choice is consistent with the erosion criteria of Badr et al. [15] for the plane jet impinging into granular beds. This selection also agrees with the dimensionless crater depth and width formulas given in the experimental results, as presented in the following section.

3.4. Numerical Technique

To solve the system of Equations (8)–(17), we use the techniques initially developed by Guillou and Barbry [41,48] and later improved by Uh Zapata et al. [34,49]. This in-house program is currently written in Fortran 90, displaying the results in Paraview software.
The σ -transformation is applied to the vertical coordinates to fit the computing mesh to the free surface evolution. A finite volume formulation approximates spatial derivatives. A projection technique [50] is applied to calculate the pressure and velocity for each phase. We use a staggered grid to avoid the spurious oscillations induced by the projection technique [51]. Advection terms in Equation (9) are handled by a total variation diminishing (TVD) scheme. The time scheme is implicit in both vertical and horizontal directions.
A successive order relaxation (SOR) iterative solver is used for the resulting linear equation system. Furthermore, the code was fully parallelized through a message passing interface (MPI) and graphics processing unit (GPU), which significantly optimize the performance of the two-phase flow program.

4. Numerical Results

In this section, the numerical results are obtained using a 2D rectangular domain with 0.25 m of height and 0.2 m of width. We impose a Poiseuille profile of velocity at the nozzle outlet of thickness b, which is fixed at a distance L from the bed.
In the simulations, we consider a rectangular mesh grid. The highest resolution is given by a uniform mesh of 401 points along the horizontal and 501 points in the vertical direction. Thus, the spatial steps are given by Δ x = Δ z = 0.5 mm. This choice corresponds to a grid resolution close to one-grain diameter. It would not be pertinent to consider finer meshes as we can not have grid resolutions more refined than the sediment diameter for the Euler–Euler two-phase flow formulation. For this fine space resolution, small time steps are reduced to Δ t = 2 × 10 6 s to have stable simulations. In agreement with the experiments, each run lasts a few seconds of simulated time.

4.1. Original and Unified Model

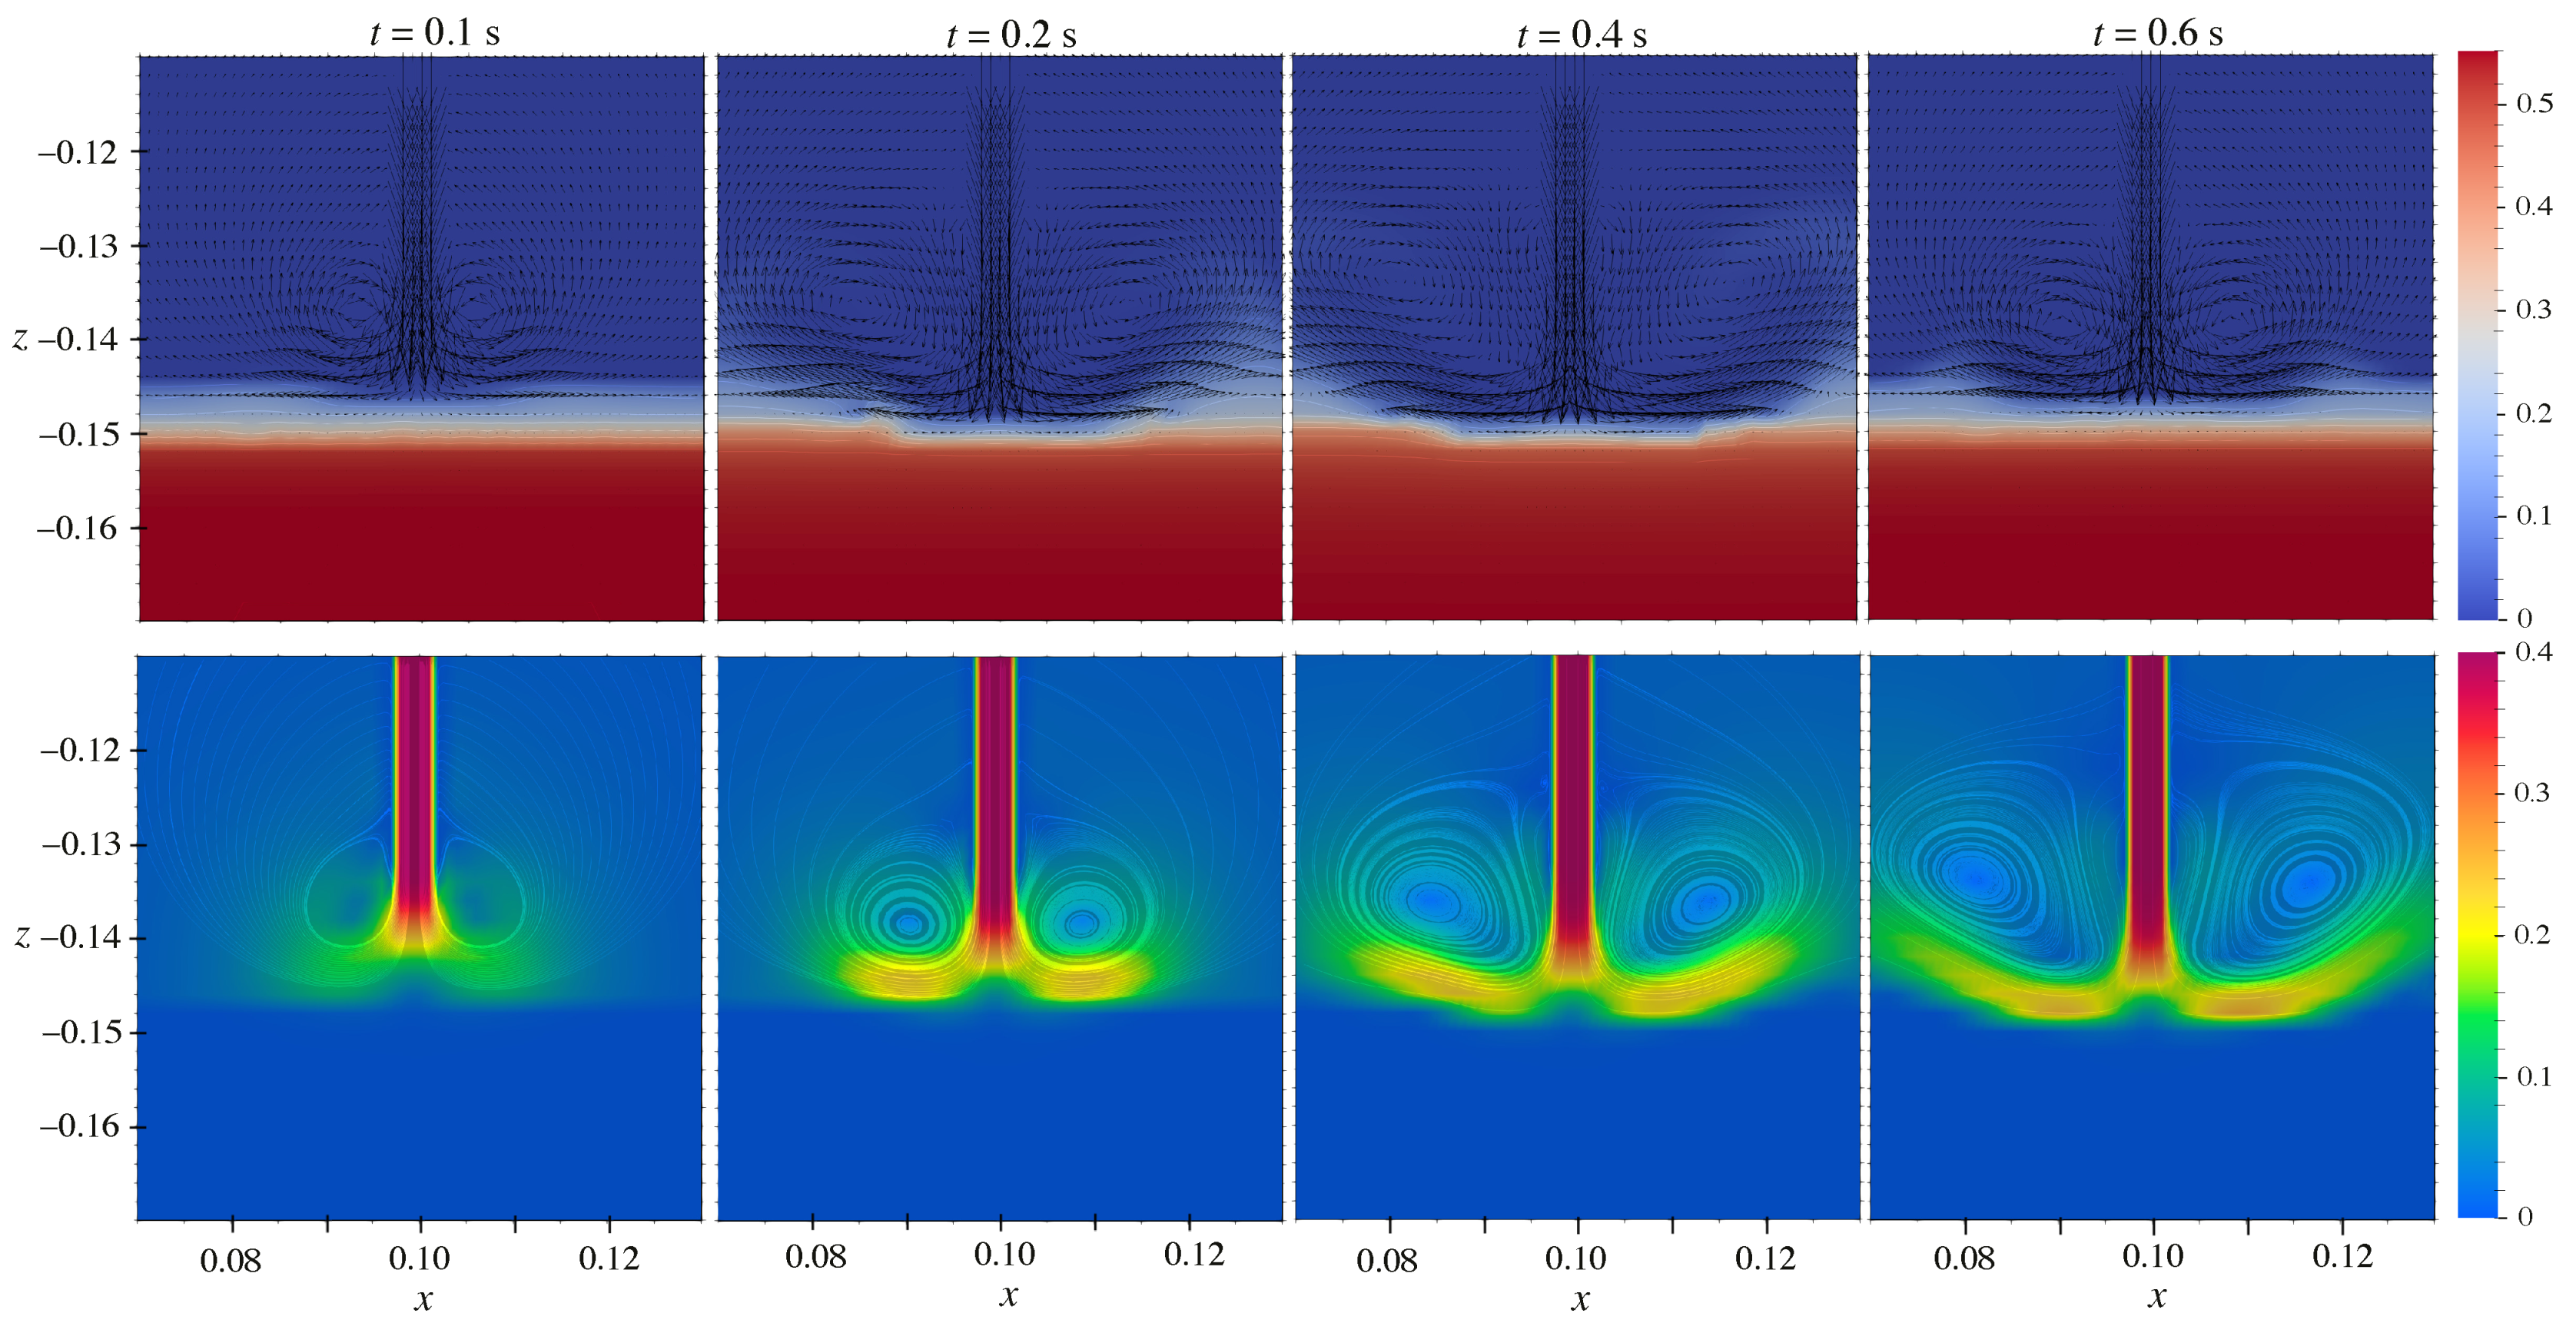
To illustrate the benefit of the proposed treatment for the solid–liquid transition, Figure 5 presents the numerical results using the original two-phase flow model (transition function F = 0 ). For these simulations, we use a coarse grid ( Δ x = 1 mm, Δ z = 2 mm), and parameters b = 4 mm, U J = 0.4 m/s, and L = 2 cm). The initial flatbed interface is located at z = 0.15 m. Although we have a crater at the early stages, the bed shows unrealistic wavy modulation of the bed.
On the other hand, Figure 6 shows the numerical results using the proposed unified two-phase Euler–Euler model. For these simulations, we use the same parameters as the standard model. Note that the qualitative behavior is now close to the experimental observations: the bed does not present a wavy behavior but a localized crater. Furthermore, zero particle velocity is predicted within the sediment bed. In other words, our numerical treatment for the solid–liquid transition in the model mainly corrects the identified numerical inaccuracies associated with the original two-fluid formulation.
As previously pointed out, the profile function plays an essential role in modeling correctly the solid phase. Figure 7 shows the profiles for F given by Equation (23) and the numerical results of previous simulations. Note how this function correctly varies continuously from 1 to 0 dividing the computational domain into liquid-like and solid-like regions. We remark the correlation between the scour dimensions and the values of F.
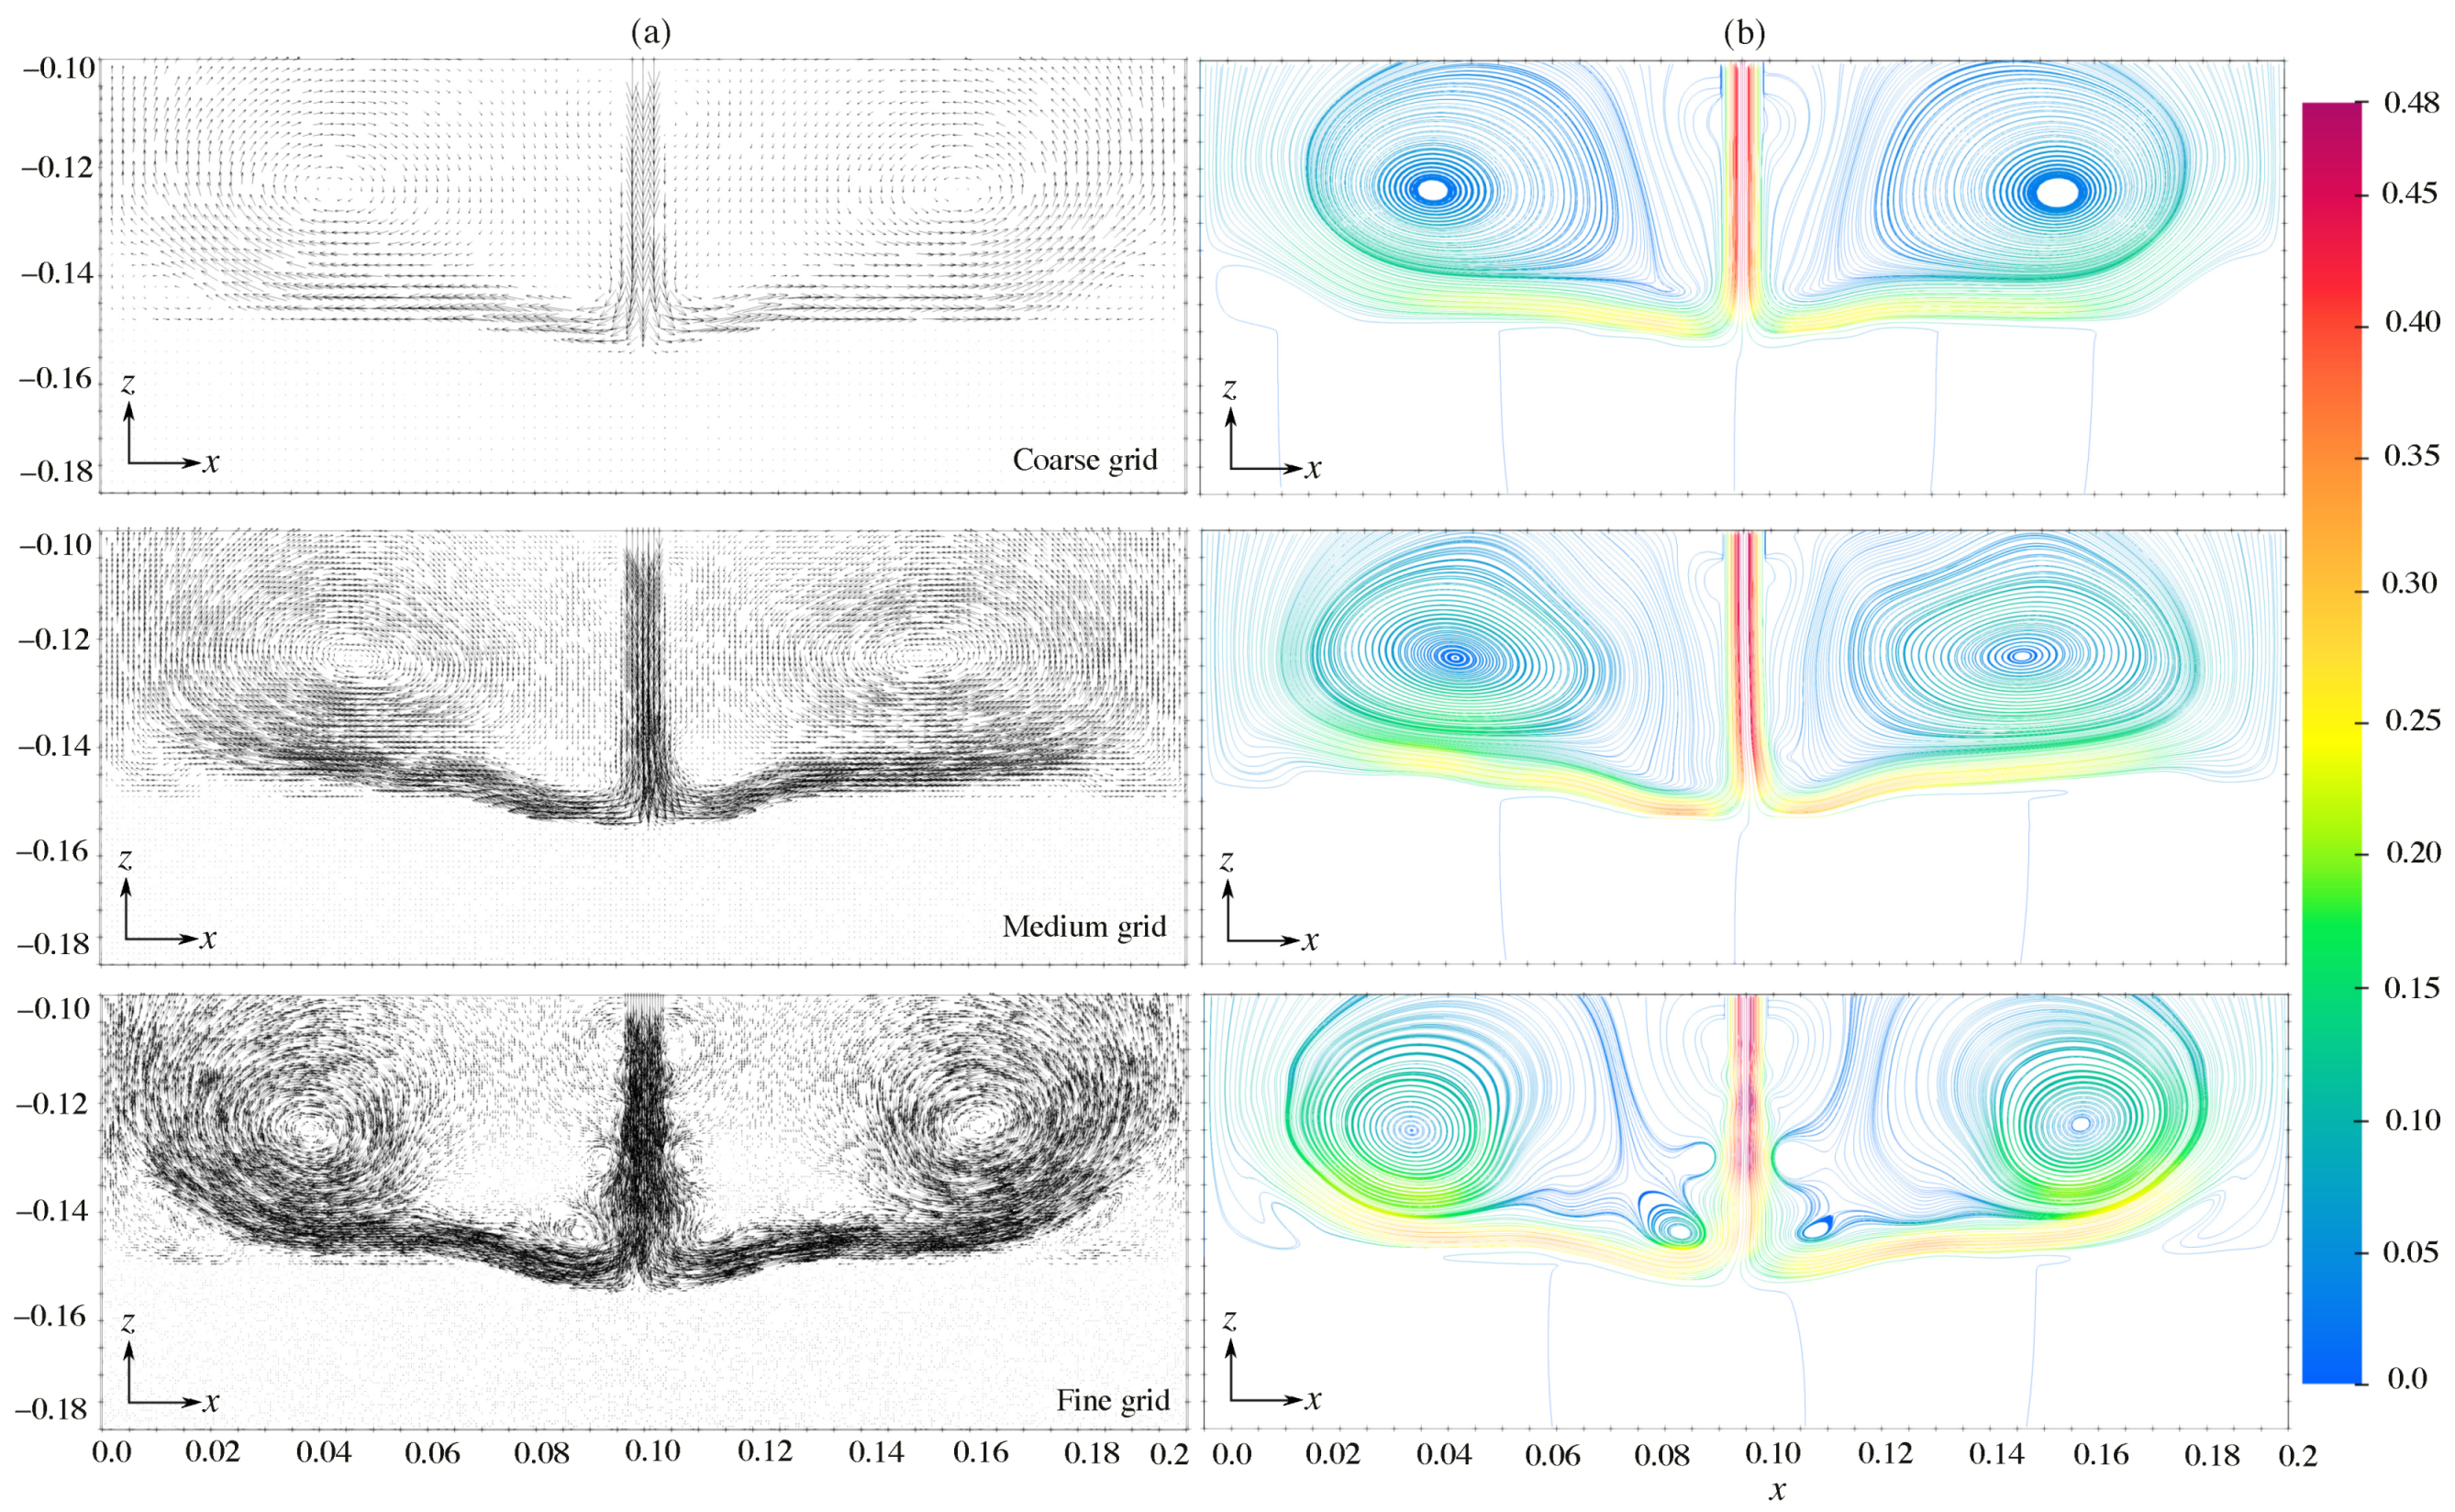
Although previous results shows the correct implementation of the model, the mesh resolution does not allow to fully observe the complex structure of the water jet and crater formation. Figure 8 and Figure 9 present the velocity field and solid volume fraction results at t = 1.5 seconds using b = 8 mm, U J = 0.323 m/s, and L = 4.6 cm. In these simulations, we use a fine ( Δ x = Δ z = 0.5 mm), a medium ( Δ x = Δ z = 1 mm), and a coarse ( Δ x = Δ z = 2 mm) grid resolutions. As illustrated in Figure 8, the plane jet flow shows a complex structure with some fluctuation and vortices along the jet. However, the jet flow structure is out of the scope of the present paper, so we only focus on the cratering. Note that the region of solid-like behavior of the sediment is characterized by low fluid velocity, in contrast to the high velocity just above this region.
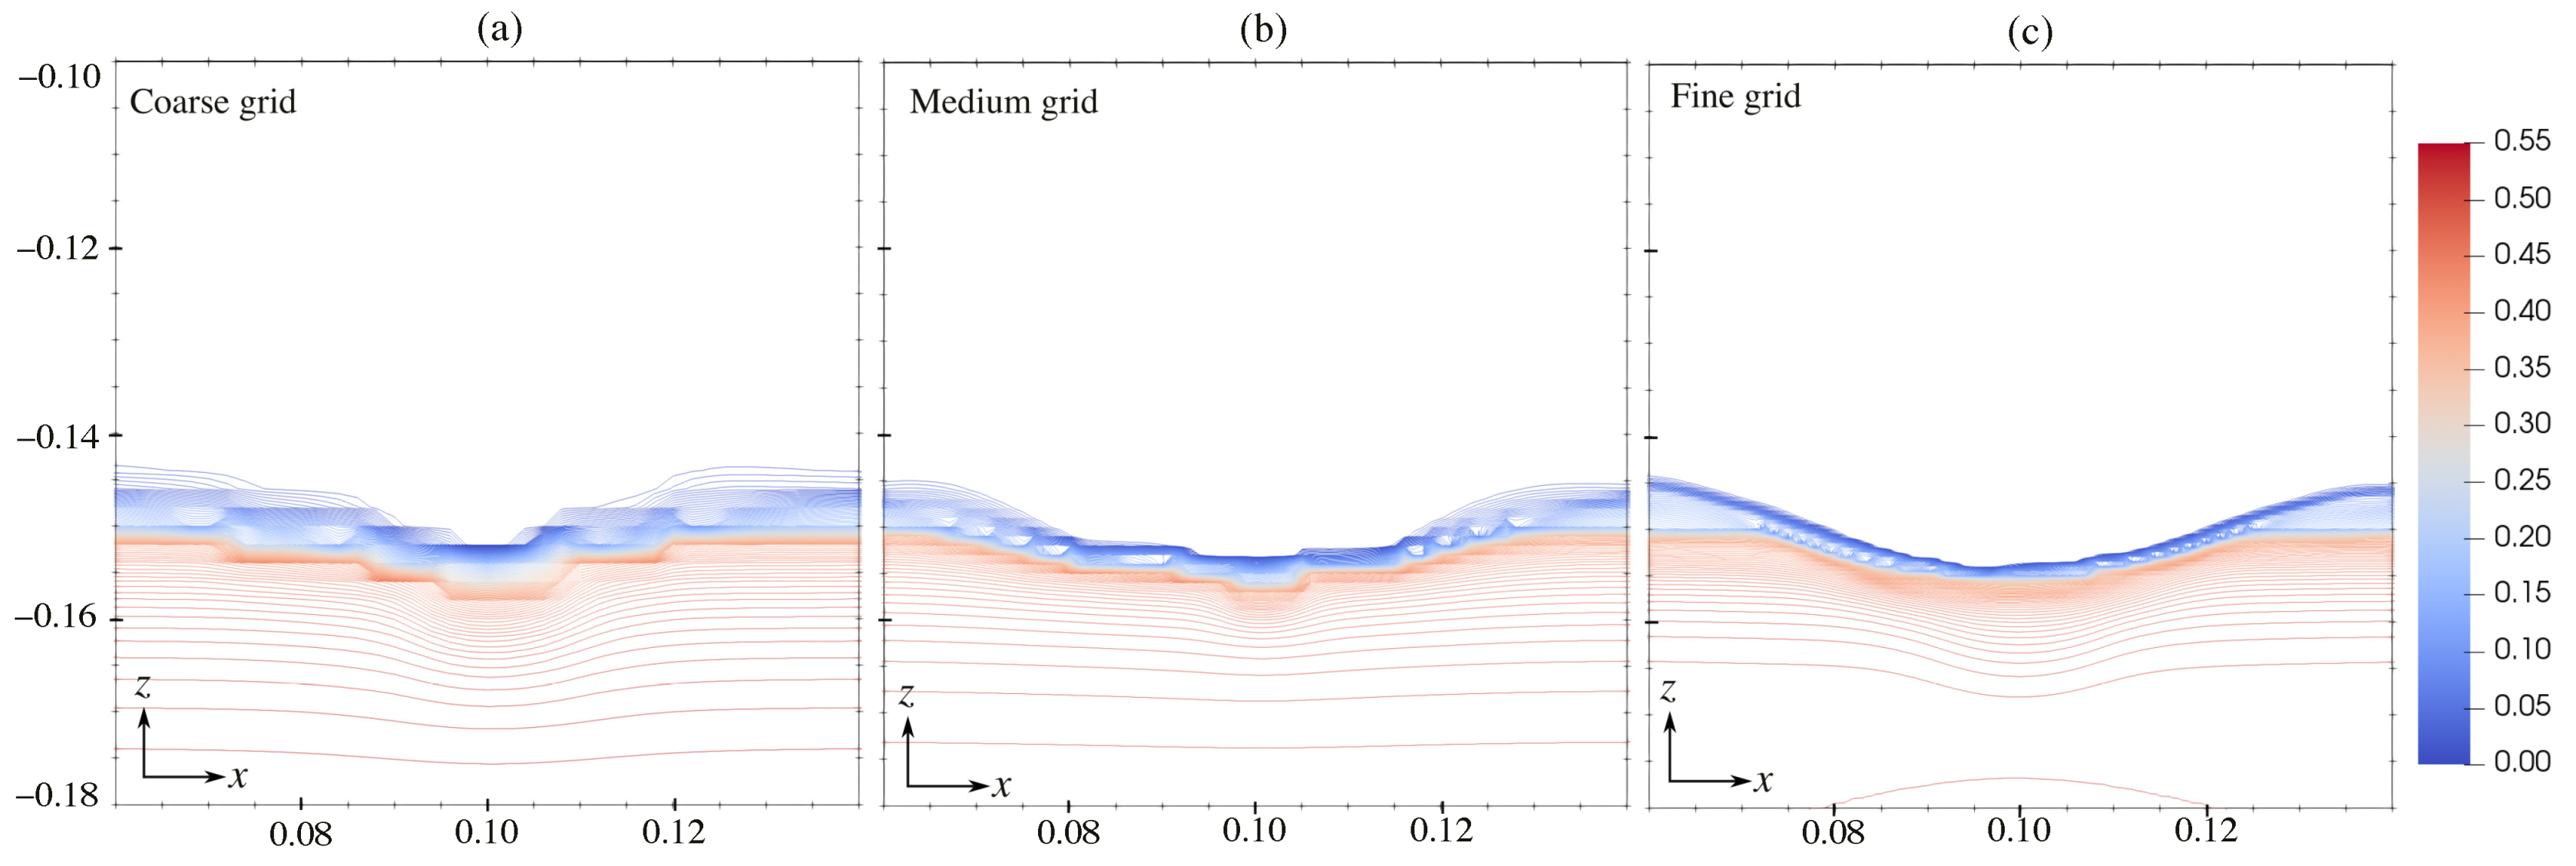
The abrupt variation in the velocity magnitude indicates that a continuous interface line can model the solid–liquid transition zone. This interface cane be verified in Figure 9 showing 100 contour lines of the solid volume fraction distributed uniformly in the interval [ 0 , 0.55 ] . Note that the transition zone between the sediment bed and the liquid is less diffusive as the mesh resolution increases, as expected. This interface is used to measure the crater size ( H , D ) .

4.2. Crater Size Predictions

As discussed in Section 3.3, we use the local parameter ξ = S h S h c for governing the sediment solid–liquid transition, where S h is the local Shields number S h and S h c stands for its critical value. Notice that this formulation considers the total fluid velocity instead of only its tangential component. Indeed, we systematically obtain a zero value of the local Shields parameter at the stagnation point in front of the jet by considering only the horizontal component of the fluid velocity. As a result, the scour hole geometry would present a non-eroded zone at the jet axis with a whiskers-like shape.
Numerical results have shown to have an excellent agreement with experimental data using S h c = 0.9 . This value also agrees with the critical Shields number near one reported by Badr et al. [15]. Figure 10 presents the fluid velocity field for b = 4 mm with different values of the impingement distance (L) and mean jet velocity ( U J ) using the same S h c = 0.9 . Results demonstrate that the crater is wider and shallower as L increases, as expected. We also notice that the velocity field for the fluid phase presents more oscillations for higher jet velocities. Experiments also show these jet oscillations. Moreover, the proposed two-phase model generates both strongly and weakly deflected cases with recirculation zones inside or outside the crater, respectively (see Figure 10c,d).
To verify the assumptions made for the velocity based on the Shield parameter and its critical value, we test a series of three numerical simulations for different jet widths b equal to 4 mm, 6 mm, and 8 mm (Table 2). The critical value S h c = 0.9 is kept constant for all numerical simulations. Numerical results confirm that D is larger and H is smaller as L increases. We note that the crater dimensions also increases as the mean jet velocity U J is larger, as expected.
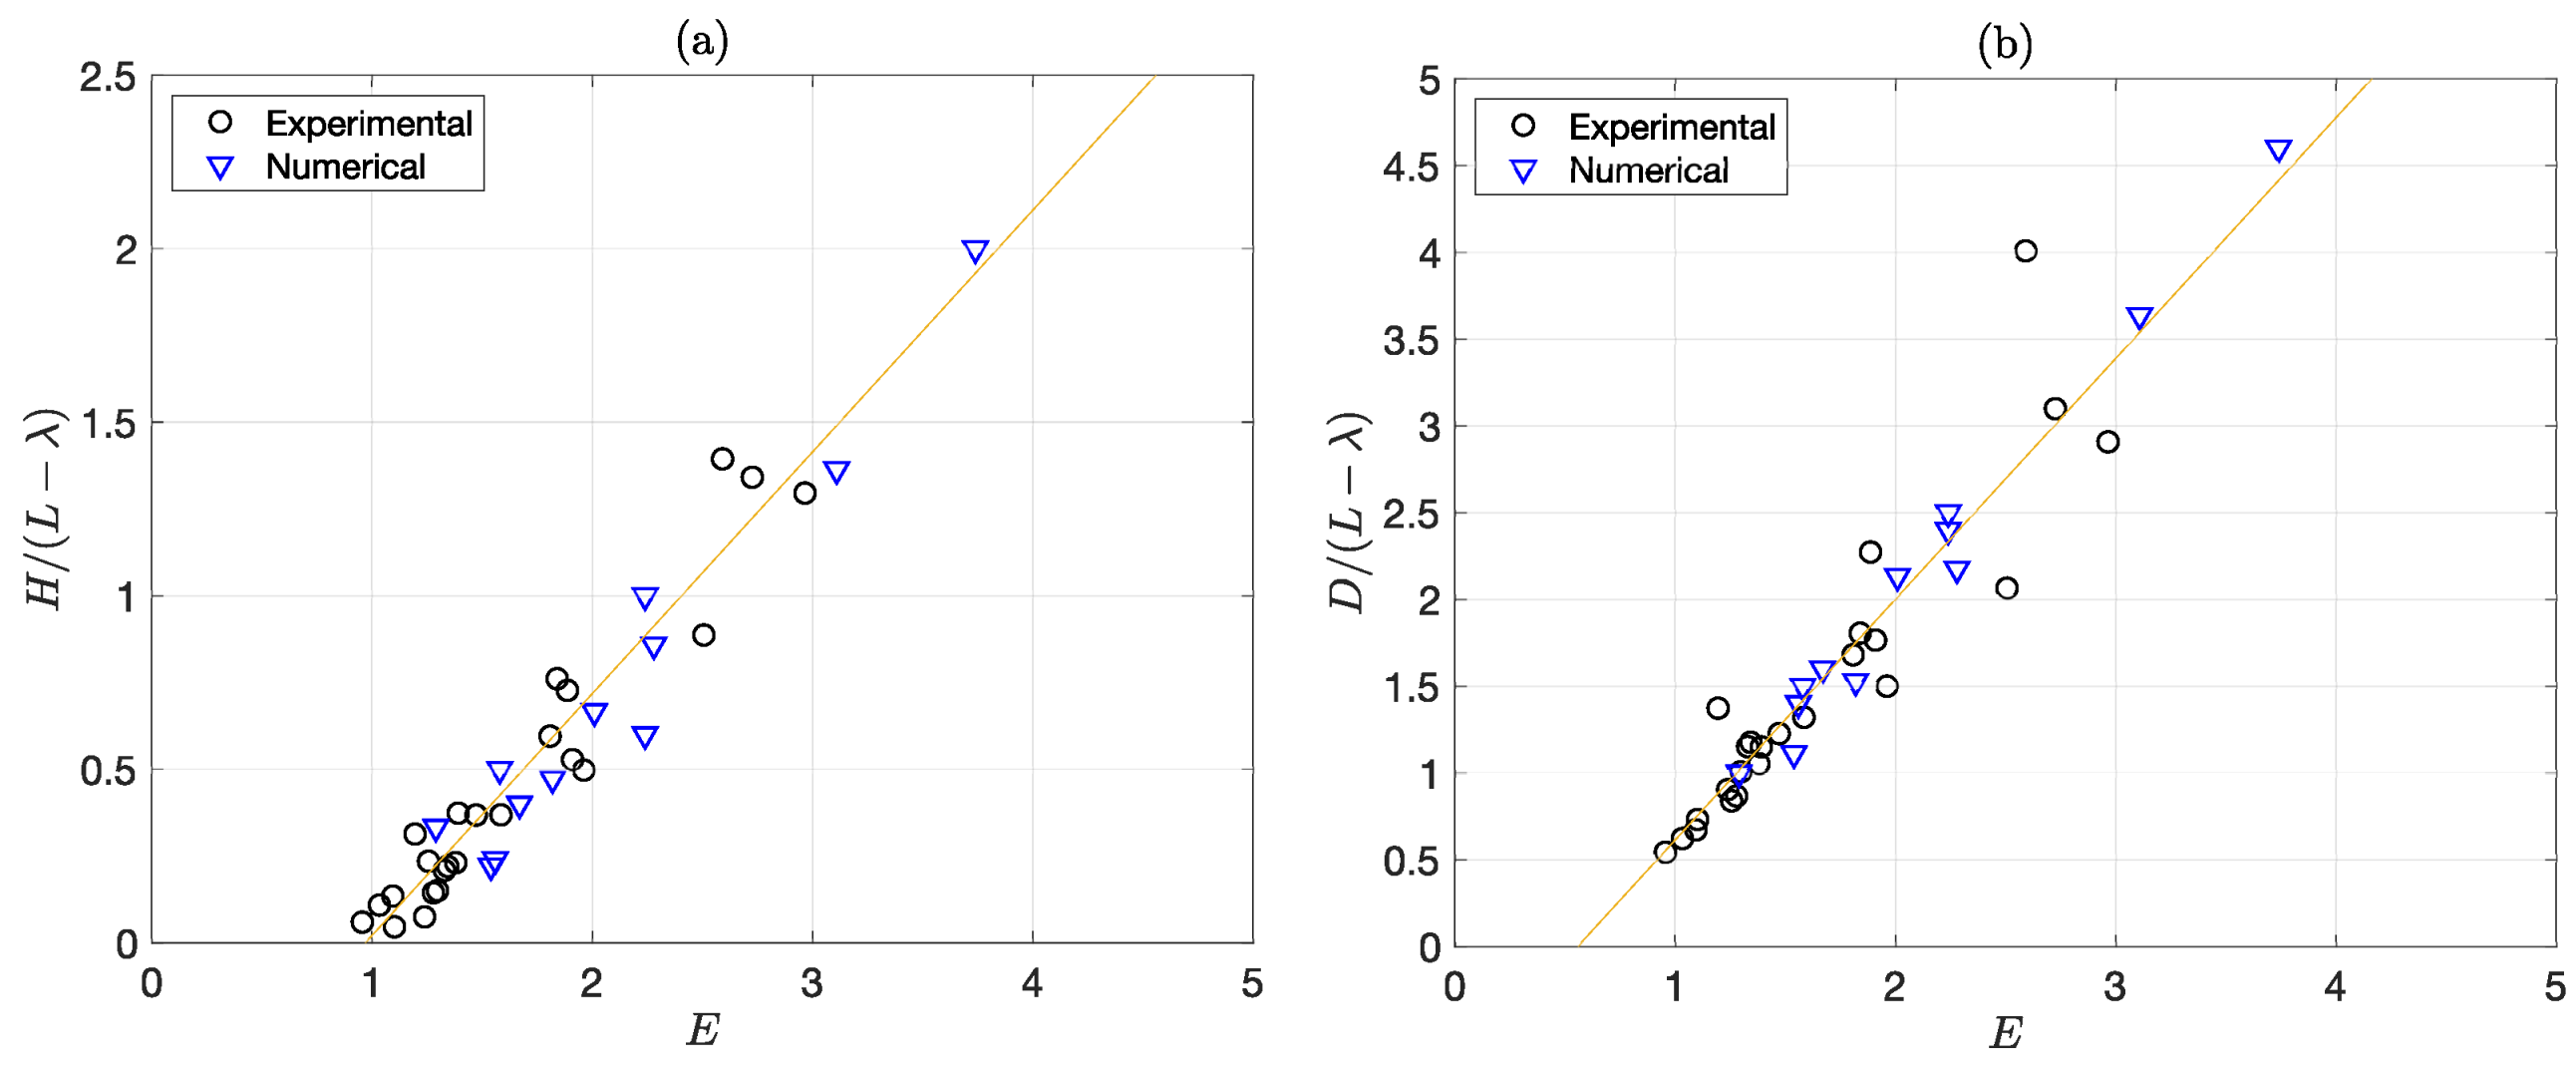
Finally, Figure 11 compares the numerical and experimental results of the crater dimensions D and H. The experimental data are the same as those presented in Figure 4. The straight lines correspond to the linear models from experimental data given by Equations (6) and (7). The numerical results are made according to the information given in Table 2. The comparison shows a very good agreement for all values. These findings show the ability of the proposed two-phase model to reproduce complex flows with sediment.

5. Discussion and Conclusions

In this paper, we study experimentally and numerically the crater sizes generated on horizontal non-cohesive sediment by a submerged vertical 2D plane jet. We showed that the crater depth and width, measured under various impinging distances and jet velocities conditions, are governed by the effective impinging distance L λ corrected from the virtual jet origin, and by a dimensionless erosion parameter E. This erosion parameter, inspired by the one proposed by Aderibigbe and Rajaratnam [9], also accounts for the virtual origin of the jet, as proposed by Badr et al. [15] and Sutherland and Dalziel [14]. The dimensionless crater sizes evolve approximately linearly with respect to E above the critical value E c 1 corresponding to the erosion threshold. In contrast to the crater depth, the crater width is non-zero at the threshold, as already found in [10,14].
A two-phase numerical model was used successfully to simulate the crater formation. We suppress numerical inaccuracies from a standard two-fluid model by considering a new formulation for the sediment. It consists of a unified equation for the solid phase, which employs a smooth function governing the transition between the liquid-like and solid-like regimes. This function is based on the deviation of a local Shields number from a critical value S h c 1 . Numerical results agree accurately with the experimental data for all the proposed tests. Further studies will focus on testing the proposed approach with different configurations. For instance, we are interested in scour holes generated by inclined or even horizontal jet flows.

Author Contributions

Numerical methodology, M.U.Z., D.P.V.B., W.Z. and K.D.N.; experimental study, G.G. and P.G.; writing, D.P.V.B. and M.U.Z. All authors have read and agreed to the published version of the manuscript.

Funding

This research was partially funded by the Quebec Ministry of Foreign Affairs (MRIF, project AVOCAP-2021-2023), the Mexican Council of Science and Technology (Investigadoras e Investigadores por Mexico, CONACYT). Additional supports by Jiangsu Science and Technology Programme (RRSP10120220131), the NSERC-Discovery program (RGPIN-2018-0677) and Compute-Canada (project SINAPSE, No. 3148) are also acknowledged.

Institutional Review Board Statement

Not applicable.

Informed Consent Statement

Not applicable.

Data Availability Statement

Not applicable.

Acknowledgments

The authors extend special thanks to Compute Canada (contract No. 3148) for providing access to the computing facility.

Conflicts of Interest

The authors declare no conflict of interest.

Abbreviations

The following abbreviations are used in this manuscript:
2DTwo Dimensional
3DThree Dimensional
JETJet Erosion Test
WIDWater Injection Dredging
CFDComputational Fluid Dynamics
MPIMessage Passing Interface
SORSuccessive Over Relaxation
GPUGraphics Processing Unit
TVDTotal Variation Diminishing
PMMAPolymethyl Methacrylate

References

  1. Metzger, P.T.; Latta, R.C.; Schuler, J.M.; Immer, C.D. Craters formed in granular beds by impinging jets of gas. AIP Conf. Proc. 2009, 1145, 767–770. [Google Scholar]
  2. Metzger, P.T.; Immer, C.D.; Donahue, C.M.; Vu, B.T.; Latta, R.C.; Deyo-Svendsen, M. Jet-induced cratering of a granular surface with application to lunar spaceports. J. Aerosp. Eng. 2009, 22, 24–32. [Google Scholar] [CrossRef] [Green Version]
  3. Rouse, H. Criteria for similarity in the transportation of sediment. In Proceedings of the 1st Hydraulics Conference, Bulletin 20, State University of Iowa, Iowa City, IA, USA, 12–15 June 1939; pp. 33–49. [Google Scholar]
  4. Hanson, G.J.; Cook, K.R. Apparatus, test procedures, and analytical methods to measure soil erodibility in situ. Appl. Eng. Agric. 2004, 20, 455–462. [Google Scholar] [CrossRef]
  5. Hanson, G.J.; Hunt, S.L. Lessons learned using laboratory JET method to measure soil erobibility of compacted soils. Appl. Eng. Agric. 2007, 23, 305–312. [Google Scholar] [CrossRef]
  6. Perng, A.T.H.; Capart, H. Underwater sand bed erosion and internal jump formation by a travelling plane jets. J. Fluid. Mech. 2008, 595, 1–43. [Google Scholar] [CrossRef] [Green Version]
  7. Kobus, H.; Leister, P.; Westrich, B. Flow field and scouring effects of steady and pulsating jets impinging on a movable bed. J. Hydr. Res. 1979, 17, 175–192. [Google Scholar] [CrossRef]
  8. Rajaratnam, N.; Beltaos, S. Erosion by impinging circular turbulent jets. Procs. ASCE J. Hydr. Div. 1977, 103, 1191–1205. [Google Scholar] [CrossRef]
  9. Aderibigbe, O.O.; Rajaratnam, N. Erosion of loose beds by submerged circular impinging vertical turbulent jets. J. Hydraulic Res. 1996, 34, 19–33. [Google Scholar] [CrossRef]
  10. Badr, S.; Gauthier, G.; Gondret, P. Crater jet morphology. Phys. Fluids 2016, 28, 033305. [Google Scholar] [CrossRef]
  11. Rajaratnam, N.; Mazurek, K.A. Erosion of Sand by Circular Impinging Water Jets with Small Tailwater. J. Hydr. Eng. 2003, 129, 225–229. [Google Scholar] [CrossRef]
  12. Rajaratnam, N.; Mazurek, K.A. Impingement of circular turbulent jets on rough boundaries Impact des jets turbulents sur des parois rugueuses. J. Hydr. Res. 2005, 43, 688–694. [Google Scholar] [CrossRef]
  13. Mazurek, K.A.; Gheisi, A.R. Assessment of the Erodibility of a Cohesive Soil using a Submerged Circular Turbulent Impinging Jet. In Proceedings of the 33rd IAHR Congress, Vancouver, BC, Canada, 9–14 August 2009. [Google Scholar]
  14. Sutherland, B.R.; Dalziel, S. Bedload transport by a vertical jet impinging upon sediments. Phys. Fluids 2014, 26, 035103. [Google Scholar] [CrossRef]
  15. Badr, S.; Gauthier, G.; Gondret, P. Erosion threshold of a liquid immersed granular bed by an impinging plane liquid jet. Phys. Fluids 2014, 26, 023302. [Google Scholar] [CrossRef] [Green Version]
  16. Beltaos, S.; Rajaratnam, N. Plane turbulent impinging jets. J. Hydr. Res. 1973, 11, 29–59. [Google Scholar] [CrossRef]
  17. Rajaratnam, N. Erosion by plane turbulent jets. J. Hydr. Res. 1981, 19, 339–358. [Google Scholar] [CrossRef]
  18. Phares, D.; Smedley, G.; Flagan, R. The wall shear stress produced by a normal impingement of a jet on a flat surface. J. Fluid Mech. 2000, 418, 351–375. [Google Scholar] [CrossRef] [Green Version]
  19. Tritton, D.J. Physical Fluid Dynamics, 2nd ed.; Springer: Oxford, UK, 1988. [Google Scholar]
  20. Pope, S.B. Turbulent Flows, 1st ed.; Cambridge University Press: Cambridge, UK, 2000. [Google Scholar]
  21. Donalson, C.D.; Snedeker, R.S. A study of free jet impingement. Part 1. Mean properties of free and impinging jets. J. Fluid Mech. 1971, 45, 281–319. [Google Scholar] [CrossRef]
  22. Glauert, M.B. The wall jet. J. Fluid Mech. 1956, 1, 625–643. [Google Scholar] [CrossRef]
  23. Launder, B.E.; Rodi, W. The turbulent wall: Measurements and modeling. Ann. Rev. Fluid Mech. 1983, 15, 429–459. [Google Scholar] [CrossRef]
  24. Magyari, E.; Keller, B. The algebraically decaying wall jet. Eur. J. Mech. B Fluids 2004, 23, 601–605. [Google Scholar] [CrossRef]
  25. Weidner, K.; Petrie, J.; Diplas, P.; Nam, S.; Gutierrez, M.; Ellenberg, M. Numerical simulation of jet test and associated soil erosion. In Proceedings of the 6th International Conference on Scour and Erosion, ICSE6, Paris, France, 27–31 August 2012. [Google Scholar]
  26. Mercier, F.; Bonelli, S.; Anselmet, F.; Pinettes, P.; Courivaud, J.R.; Fry, J.J. On the numerical modelling of the Jet Erosion Test. In Proceedings of the 6th International Conference on Scour and Erosion, ICSE6, Paris, France, 27–31 August 2012. [Google Scholar]
  27. Wang, T.; Song, B. Study on deepwater conductor jet excavation mechanism in cohesive soil. Appl. Ocean Res. 2019, 82, 225–235. [Google Scholar] [CrossRef]
  28. Kuang, S.B.; LaMarche, C.Q.; Curtis, J.S.; Yu, A.B. Discrete particle simulation of jet-induced cratering of a granular bed. Powder Technol. 2013, 239, 319–336. [Google Scholar] [CrossRef]
  29. Benseghier, Z.; Cuéllar, P.; Luu, L.H.; Delenne, J.Y.; Bonelli, S.; Philippe, P. Relevance of free jet model for soil erosion by impinging jets. J. Hydraul. Eng. 2020, 146, 04019047. [Google Scholar] [CrossRef]
  30. Benseghier, Z.; Cuéllar, P.; Luu, L.H.; Bonelli, S.; Philippe, P. A parallel GPU-based computational framework for the micromechanical analysis of geotechnical and erosion problems. Comput. Geotech. 2020, 120, 103404. [Google Scholar] [CrossRef]
  31. Boyaval, S.; Caboussat, A.; Mrad, A.; Picasso, M.; Steiner, G. A semi-Lagrangian splitting method for the numerical simulation of sediment transport with free surface flows. Comput. Fluids 2018, 172, 384–396. [Google Scholar] [CrossRef]
  32. Qian, Z.D.; Hu, X.Q.; Huai, W.X.; Xue, W.Y. Numerical simulation of sediment erosion by submerged jets using an Eulerian model. Sci. China Technol. Sci. 2010, 53, 3324–3330. [Google Scholar] [CrossRef]
  33. Yuan, Q.; Zhao, M.; Wang, C.; Ge, T. Numerical study of sand scour with a modified Eulerian model based on incipient motion theory. Mar. Georesour. Geotechnol. 2018, 36, 818–826. [Google Scholar] [CrossRef]
  34. Uh Zapata, M.; Pham Van Bang, D.; Nguyen, K.D. Parallel simulations for a 2D x/z two-phase flow fluid-solid particle model. Comput. Fluids 2018, 173, 103–110. [Google Scholar] [CrossRef]
  35. Wang, B.; van Rhee, C.; Nobel, A.; Keetels, G. Modeling the hydraulic excavation of cohesive soil by a moving vertical jet. Ocean Eng. 2021, 227, 108796. [Google Scholar] [CrossRef]
  36. Greenshields, C.J.; Weller, H.G. A unified formulation for continuum mechanics applied to fluid-structure interaction in flexible tubes. Int. J. Numer. Meth. Engng. 2005, 64, 1575–1593. [Google Scholar] [CrossRef]
  37. Chua, L.P.; Lua, A.C. Measurements of a confined jet. Phys. Fluids 1998, 10, 3137–3144. [Google Scholar] [CrossRef]
  38. Midi, G.D.R. On dense granular flows. Eur. Phys. J. E 2004, 14, 341–365. [Google Scholar] [CrossRef] [Green Version]
  39. Loiseleux, T.; Gondret, P.; Rabaud, M.; Doppler, D. Onset of erosion and avalanche for an inclined granular bed sheared by a continuous laminar flow. Phys. Fluids 2005, 17, 103304. [Google Scholar] [CrossRef]
  40. Drew, D.A.; Lahey, R.T. Analytical Modelling of Multiphase Flow, in Particulate Two-Phase Flow; Roco, M.C., Ed.; Butterworth-Heinemann: Boston, MA, USA, 1993. [Google Scholar]
  41. Barbry, N.; Guillou, S.; Nguyen, K.D. Une approche diphasique pour le calcul du transport sédimentaire en milieux estuariens. C.R. Acad. Sci. IIb 2000, 328, 793–799. [Google Scholar] [CrossRef]
  42. Nguyen, K.D.; Guillou, S.; Chauchat, J.; Barbry, N. A two-phase numerical model for suspended-sediment transport in estuaries. Adv. Water Resour. 2009, 32, 1187–1196. [Google Scholar] [CrossRef]
  43. Nguyen, D.H.; Levy, F.; Van Bang, D.P.; Nguyen, K.D.; Guillou, S.; Chauchat, J. Simulation of dredged sediment releases into homogeneous water using a two-phase model. Adv. Water Resour. 2012, 48, 102–112. [Google Scholar] [CrossRef]
  44. Lundgren, T. Slow flow through stationary random beds and suspensions of spheres. J. Fluid. Mech. 1972, 51, 273–299. [Google Scholar] [CrossRef]
  45. Graham, A.L. On the viscosity of suspensions of solid spheres. Appl. Sci. Res. 1981, 37, 275–286. [Google Scholar] [CrossRef]
  46. Chauchat, J.; Guillou, S. On turbulence closures for two-phase sediment-laden flow models. J. Geophys. Res. 2008, 113, C11017. [Google Scholar] [CrossRef] [Green Version]
  47. Haider, A.; Levenspiel, O. Drag coefficient and terminal velocity of spherical and non-spherical particles. Powder Technol. 1989, 58, 63–70. [Google Scholar] [CrossRef]
  48. Guillou, S.; Barbry, N.; Nguyen, K.D. Calcul numérique des ondes de surface par une méthode de projection et un maillage eulérien adaptatif. C.R. Acad. Sci. IIb 2000, 328, 875–881. [Google Scholar]
  49. Uh Zapata, M.; Zhang, W.; Marois, L.; Hammouti, A.; Pham Van Bang, D.; Nguyen, K.D. Two-phase experimental and numerical studies on scouring at the toe of vertical seawall. Eur. J. Mech. B Fluids 2022, 93, 13–28. [Google Scholar] [CrossRef]
  50. Chorin, A.J. Numerical solution of the Navier–Stokes equations. Math. Comp. 1968, 22, 745–762. [Google Scholar] [CrossRef]
  51. Guillou, S.; Nguyen, K.D. An improved technique for solving two-dimensional shallow water problems. Int. J. Num. Meth. Fluids 1999, 29, 465–483. [Google Scholar] [CrossRef]
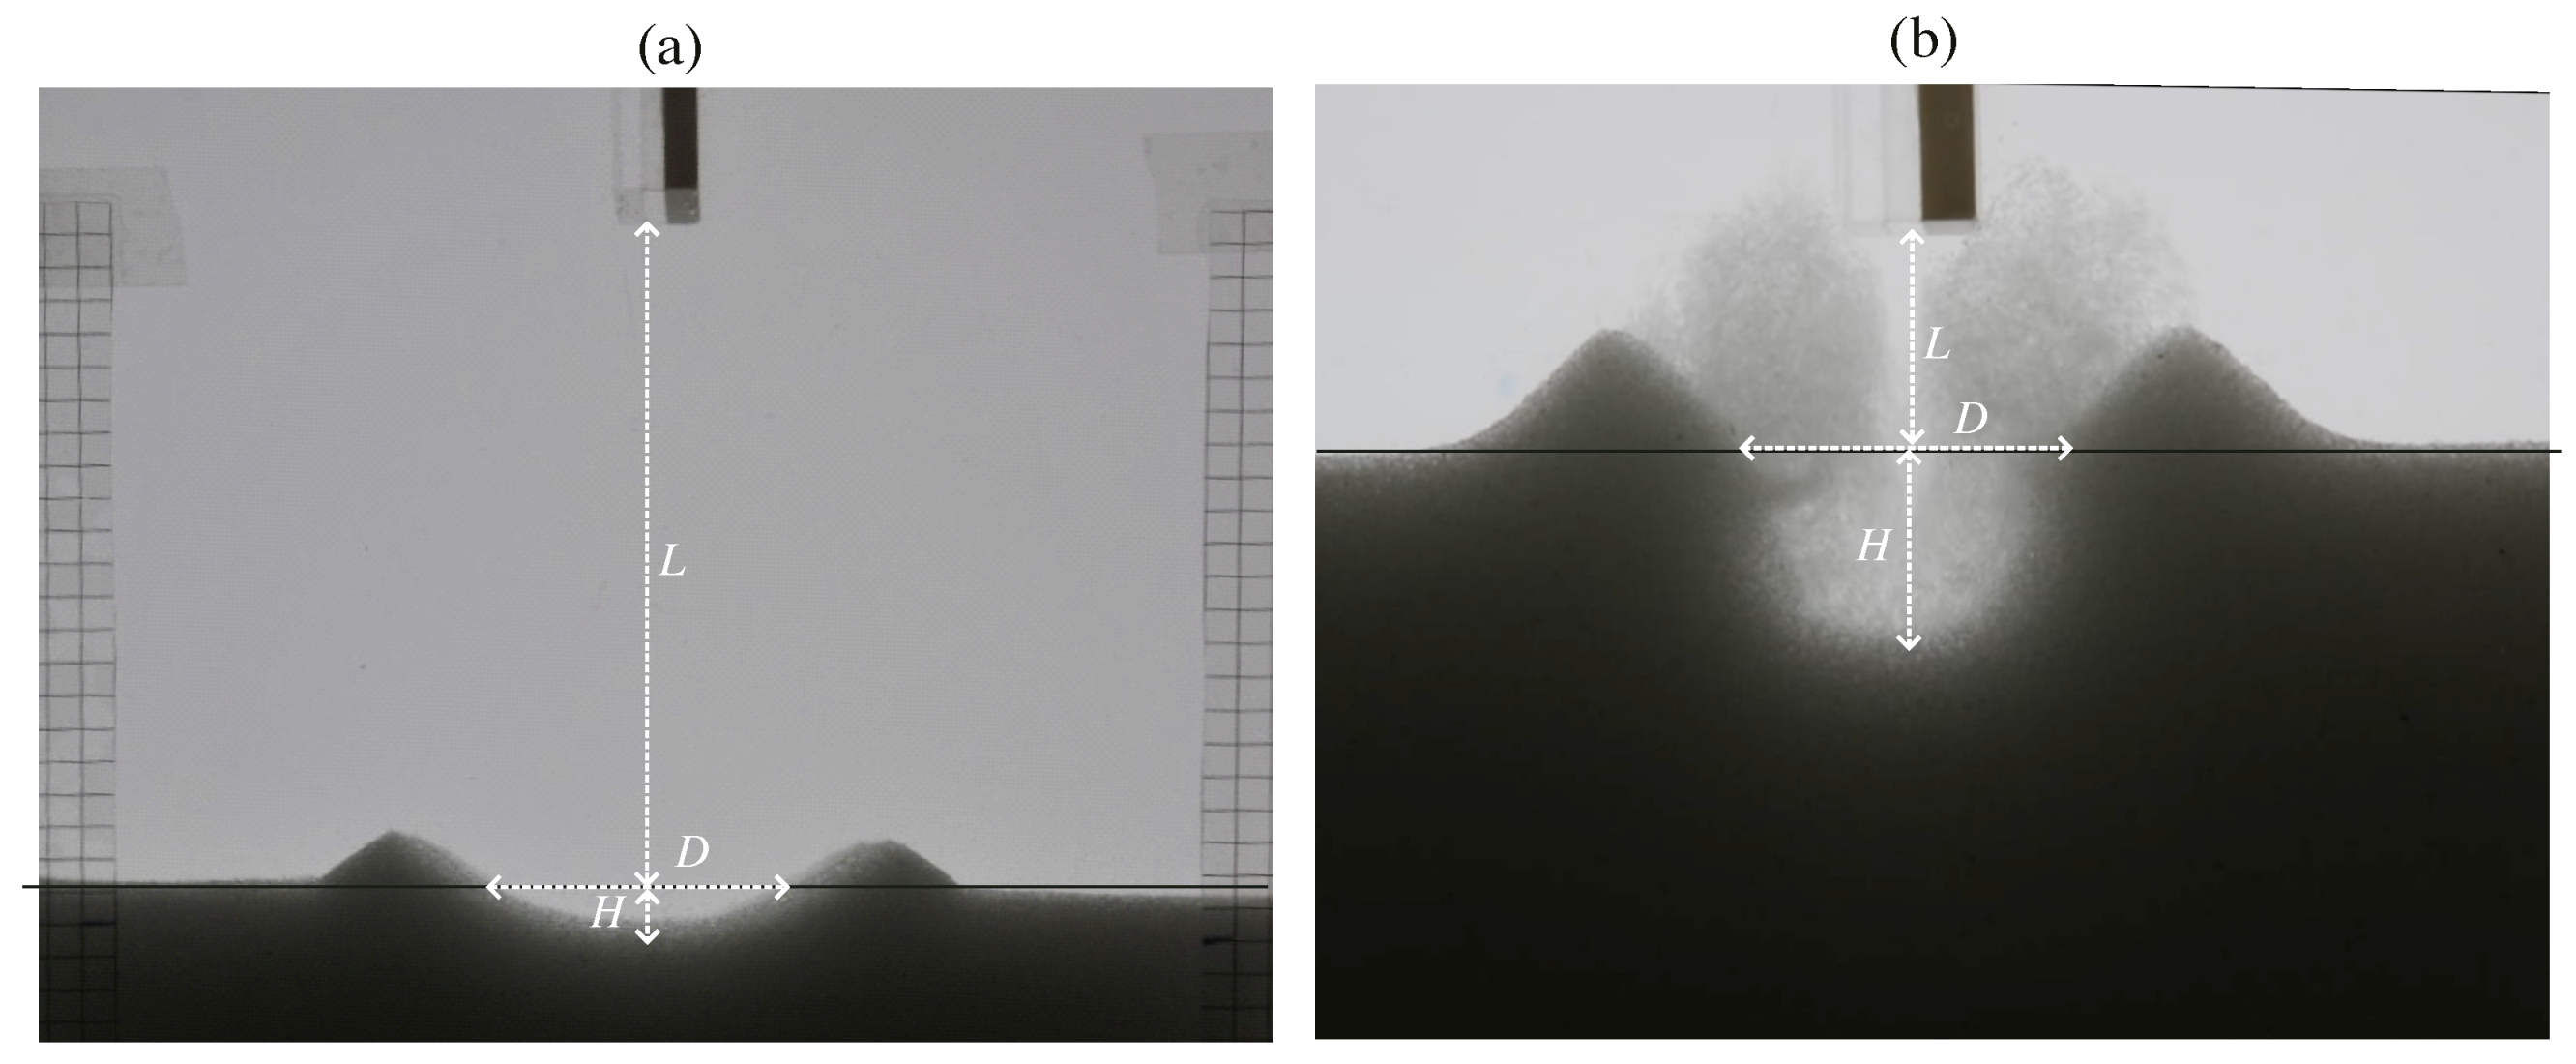
Figure 1. Geometrical parameters of the eroded sediment bed for a flow (a) weakly and (b) strongly deflected. Here, H and D are the crater depth and width, respectively, and L is the distance above the granular bed.
Water 14 03290 g001
Figure 2. Sketch of the device to study the erosion of a granular bed by a water jet: (a) hydraulic circuit, and (b) water jet injector dimensions.
Water 14 03290 g002
Figure 3. Experimental results of the crater (a) depth and (b) width normalized by the jet width b as function of the normalized jet-bed distance L / b for different jet Reynolds numbers.
Water 14 03290 g003
Figure 4. Experimental results of the crater (a) depth and (b) width normalized by the reduced jet-bed distance L λ as a function of E for different jet Reynolds numbers. The solid line corresponds to the linear fit model through the data.
Water 14 03290 g004
Figure 5. Numerical simulations at different stages for the standard two-phase flow model: the solid concentration with fluid field (top), and velocity magnitude of the fluid (bottom).
Water 14 03290 g005
Figure 6. Solid concentration (top) and fluid velocity magnitude (bottom) for the proposed two-phase flow model using a solid–liquid transition model of the sediment phase at different stages.
Water 14 03290 g006
Figure 7. Numerical results of the liquid–solid transition function F at different stages. The fluid velocity field is also plotted as a reference.
Water 14 03290 g007
Figure 8. Numerical results of the fluid velocity (a) field, and (b) magnitude with streamlines at t = 1.5 s using b = 8 mm, U J = 0.323 m/s, and L = 4.6 cm for different grid resolutions.
Water 14 03290 g008
Figure 9. Solid volume fraction at t = 1.5 s using b = 8 mm, U J = 0.323 m/s, and L = 4.6 cm for different grid resolutions.
Water 14 03290 g009
Figure 10. Velocity field and crater shapes for different jet configurations using b = 4 mm and fine mesh ( Δ x = Δ z = 0.5 mm).
Water 14 03290 g010
Figure 11. Comparison between experiments and numerical results for (a) the crater depth and (b) width normalized by the reduced jet-bed distance ( L λ ) . Solid lines correspond to linear laws given by Equations (6) and (7).
Water 14 03290 g011
Table 1. Experimental results using different experimental parameters of U J , L and jet thickness b = 0.004 m.
Mean VelocityReynolds NumberImpingement DistanceCrater WidthCrater DepthMean VelocityReynolds NumberImpingement DistanceCrater WidthCrater Depth
U J (m/s)ReL (m)D (m)H (m) U J (m/s)ReL (m)D (m)H (m)
0.47118850.1450.0150.0910.31412560.1110.0070.044
0.47118850.1300.0200.0950.31412560.1030.0080.042
0.47118850.0840.0220.0670.31412560.0880.0110.040
0.47118850.0590.0250.0570.31412560.0750.0130.043
0.47118850.0360.0250.0340.31412560.0620.0170.040
0.47118850.1080.0250.0900.31412560.0510.0150.045
0.43117260.1590.0050.0870.31412560.0410.0210.050
0.43117260.1250.0120.0860.2359420.0680.0020.025
0.43117260.0790.0200.0690.2359420.0640.0050.028
0.43117260.0630.0200.0470.2359420.0520.0080.027
0.43117260.0420.0250.0500.2359420.0390.0110.024
0.39215700.1060.0140.0780.2359420.0320.0110.019
0.39215700.1010.0230.0710.2359420.0200.0120.012
0.39215700.0760.0210.0610.2359420.0090.0200.019
0.39215700.0560.0210.0490.1576280.0530.0040.018
0.39215700.0340.0220.0320.1576280.0410.0060.016
0.39215700.0200.0240.0350.1576280.0290.0070.016
Table 2. Numerical results of the crater dimensions using different parameters ( U J , L, b) and λ = 8.75 .
Mean VelocityImpingement DistanceJet WidthJet-Bed DistanceReynolds NumberErosion ParameterCrater WidthCrater Depth
U J (m/s)L (mm)b (mm) L / b ReED (mm)H (mm)
0.18404107202.24123
0.1850412.57201.29155
0.2850412.511202.013210
0.286041511201.56356
0.304041012003.742310
0.306041512001.674010
0.3746411.514803.114015
0.378042014801.545010
0.2870611.6616802.283815
0.2880613.3316801.824213
0.188081014402.242510
0.1890811.2514401.583010
Publisher’s Note: MDPI stays neutral with regard to jurisdictional claims in published maps and institutional affiliations.