1. Introduction
For internally unstable soil, its coarse matrix cannot restrict a part of its fine particles, and fine particles may move through the constrictions with seepage flow when the hydraulic condition exceeds the critical value. This phenomenon is referred to as internal erosion [
1,
2], or more precisely, seepage-induced internal instability. The internal erosion phenomenon can be further subdivided into suffusion and suffosion [
3] depending on whether the fine particle loss resulted in a considerable deformation. Internal erosion is one of the main reasons for embankment dam accidents and failures [
4]. Therefore, special attention should be paid to the internal stability and internal erosion characteristics of the natural alluvium foundations of water retaining projects [
1,
2,
4].
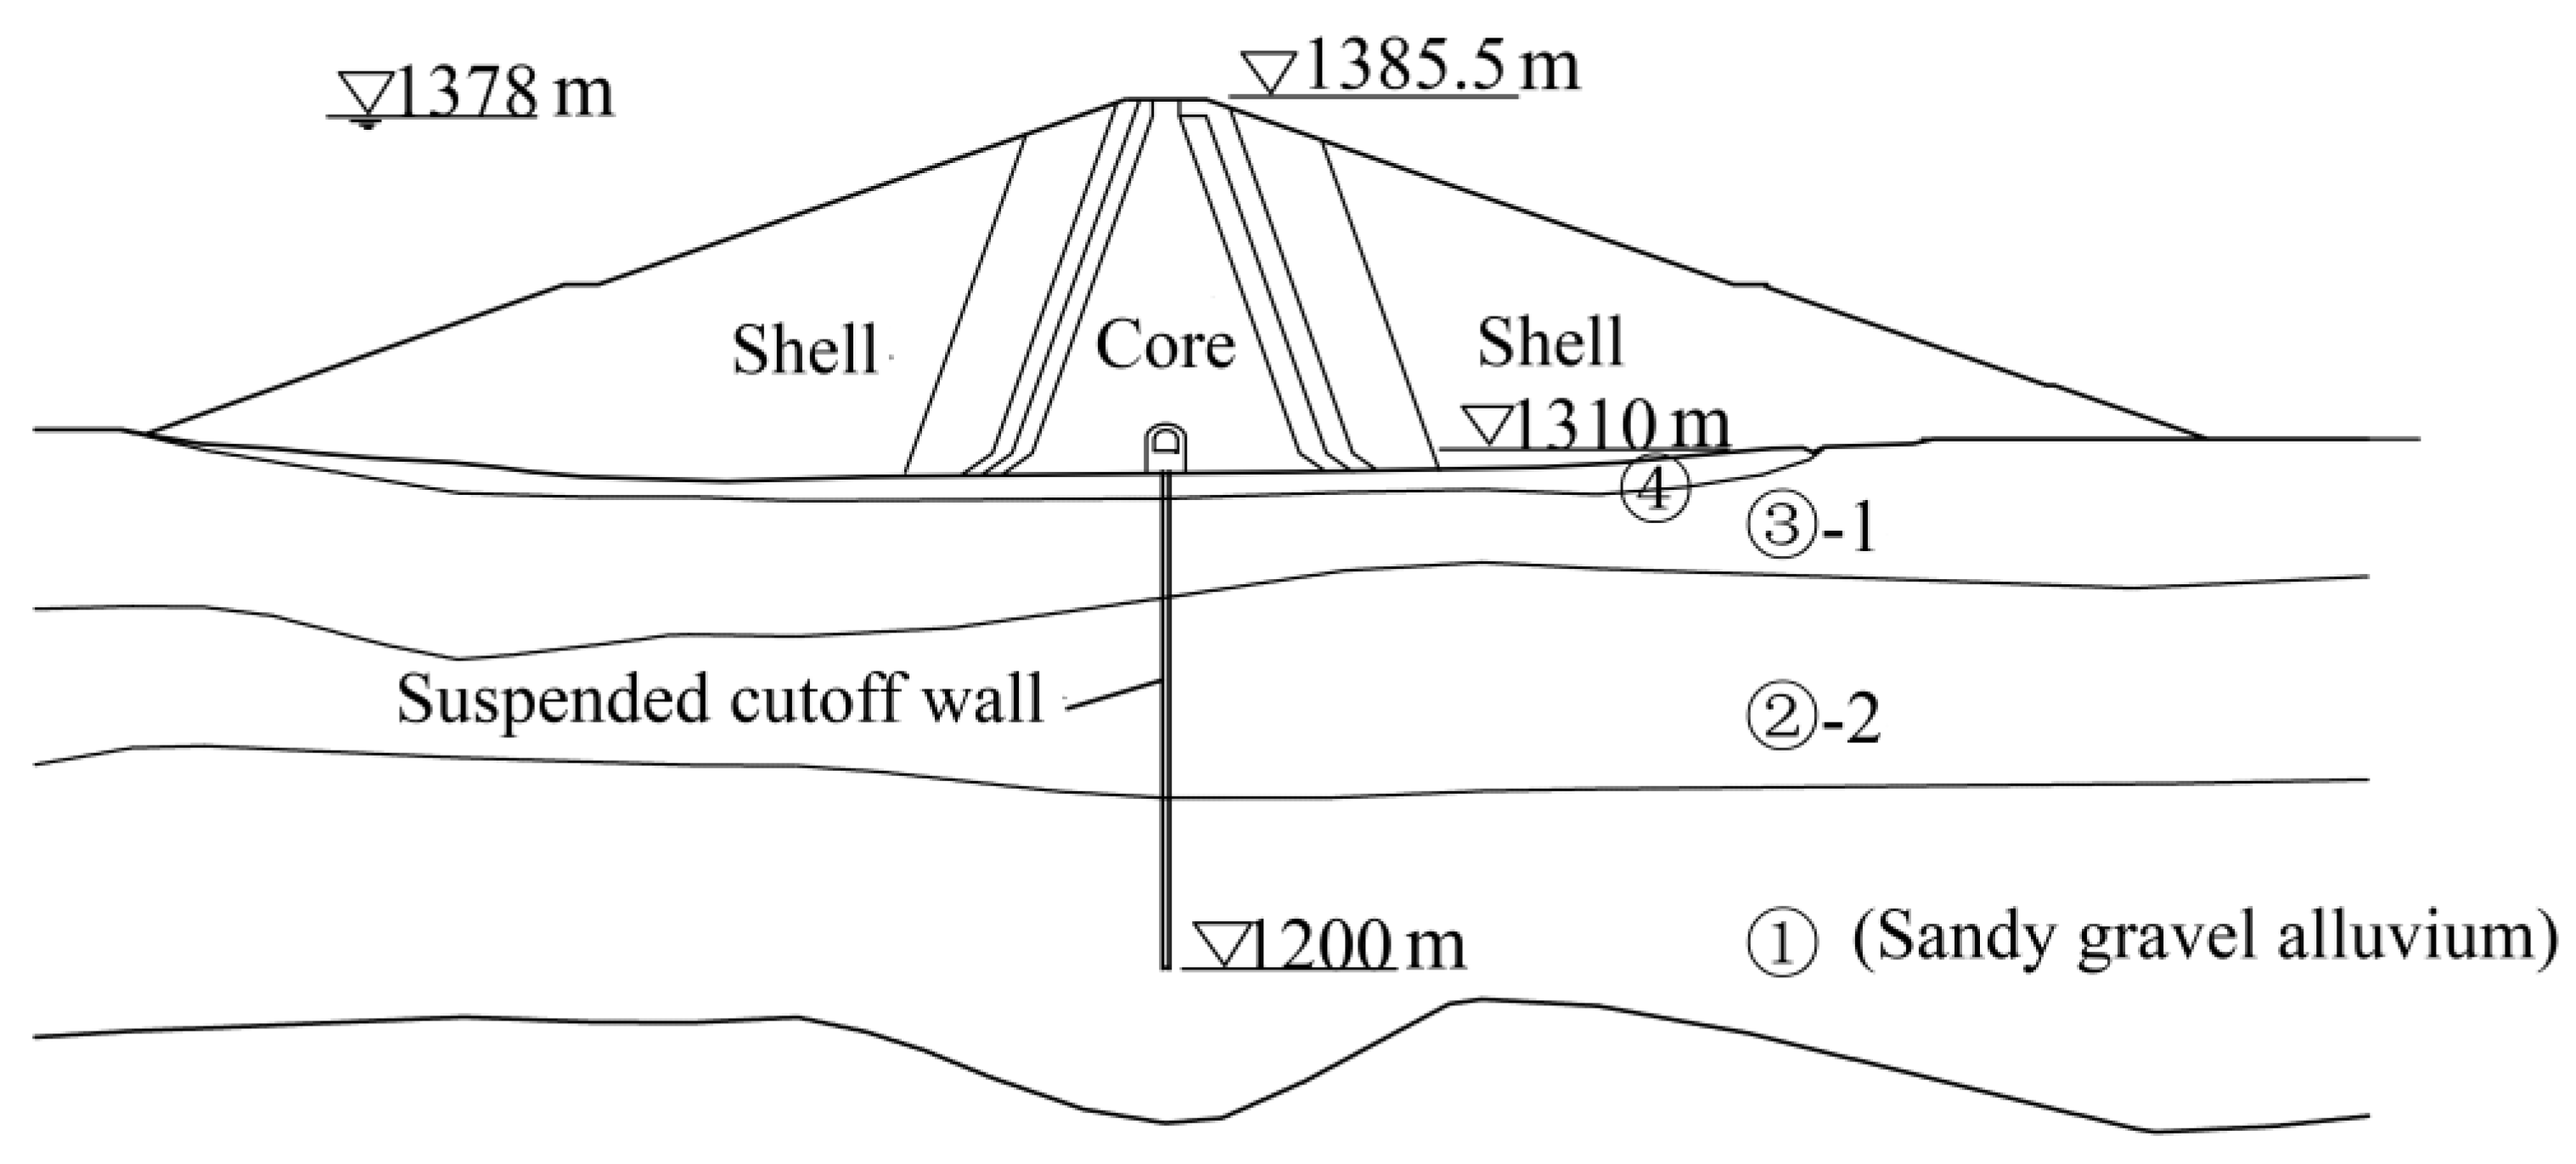
Figure 1 shows the profile of a sandy gravel alluvium foundation of an embankment dam. According to the geometric criteria for evaluating the internal stability of soils and seepage tests, the strata ②-2, ③-1, and ④ in the middle and upper part of the alluvium layer are unlikely to suffer internal erosion. However, the bottom stratum ① was glacial deposited sediments and was broadly graded in gradation. According to the particle size distributions (PSDs) of borehole sampling, stratum ① was preliminarily estimated as internally unstable. A concrete suspended cutoff wall of 100 m in depth and 1 m in thickness was employed to reduce the leakage through the foundation and improve the foundation’s resistance to seepage failure. As the suspended cutoff wall narrows the flow channel, the zone beneath the wall usually shows a higher hydraulic gradient and flow velocity, e.g., [
5]. These two unfavorable factors are combined together, thus raising concern about the seepage safety of the zone beneath the cutoff wall. Therefore, it is necessary to conduct seepage tests to determine the hydraulic conditions for stratum ① to develop internal erosion and the corresponding consequences (i.e., the change in hydraulic conductivity, the fine particle erosion ratio, and volumetric strain under different hydraulic gradients).
Considering the relatively large particle size of the soil, the high in situ overburden pressure (approximately 2.0 MPa), and the horizontally dominated seepage direction, laboratory seepage tests to evaluate the internal erosion characteristics of the soil are not easy. It should be noted that most of the past laboratory seepage tests employed mixtures of different proportions of sands and silts, e.g., [
6,
7,
8,
9,
10,
11], to fit with small-scale apparatus (of specimen sizes usually less than 10 cm) and conducted seepage tests along vertical flow direction with no or very low surcharge pressure imposed. Though these studies provided valuable insights into the laws and mechanisms of internal erosion, their results should be referred to with caution in evaluating the internal erosion characteristics of gravelly alluvium because of the following experimental facts: For the specimens of an identical gradation, Zhang et al. [
12] found that hydraulic conductivity increased with the increasing specimen size, and Zhong et al. [
13] found that the critical hydraulic gradient for internal erosion decreased with the increasing specimen size. Therefore, a large-scale permeameter should be used for gravel soils to reduce the scale-effect deviation in seepage tests. Furthermore, alluvium is usually deposited horizontally or nearly horizontally, which induces strong anisotropy. Under the combined effect of gravity, the anisotropy in the soil will lead to distinct characteristics in soil permeability along different flow directions. Pachideh et al. [
14] and Marot et al. [
15] carried out seepage tests in multiple directions. They found that the angle between the seepage direction and the gravity direction had a significant influence on the critical hydraulic gradient and failure phenomena. The stress conditions also have considerable effects on internal erosion behavior. Moffat et al. [
16], Chen et al. [
17], and Wang et al. [
18] conducted internal erosion experimental studies using apparatuses that can consider surcharge pressure loading conditions. These studies indicated that the soils under different surcharge pressures could show different internal instability resistance and distinct internal erosion characteristics. For more complicated stress conditions, Chang et al. [
6]. Ke et al. [
7,
8], Liang et al. [
10], and Luo et al. [
19] carried out internal erosion tests using modified triaxial apparatus. These studies showed that the stress state and its magnitude could significantly impact the critical hydraulic gradients, as well as the erosion-induced hydraulic and mechanical changes. These studies emphasized the necessity of using large-scale apparatus to conduct horizontal seepage tests under high overburden pressure to evaluate the permeability and internal erosion characteristics of sandy gravel alluvium, which is shown in
Figure 1.
In recent years, some large-scale seepage apparatuses have been developed. Zou et al. [
20] developed a plane-strain apparatus that could independently apply vertical and horizontal stresses. Chen et al. [
21] developed a large permeameter that could independently apply true triaxial loading. Unfortunately, these two apparatuses focused on the application of stress states, while the eroded soil collection device was not equipped. Chen et al. [
17] developed a horizontal permeameter. This device can collect the eroded fine particles, but the pressure bladder can only apply maximum vertical stress of 600 kPa, and the vertical deformation of the specimen cannot be measured. In recent studies based on discrete element simulations (e.g., Nguyen et al. [
22,
23], Hu et al. [
24], Zhang et al. [
25], and Ma et al. [
26]), it was found that the evolutions of the erosion ratio of fine particles, flow velocity, and porosity have a strong intrinsic relationship from the mesoscopic perspective. To enable comprehensive studies with considerations of macroscopic and mesoscopic features in large-scale experimental studies, Wang et al. [
18] developed a large-scale high-pressure erosion apparatus with a specimen size of 600 mm × 400 mm × 400 mm, and the apparatus can apply a maximum pressure of up to 3 MPa. In addition to measuring the common quantities in seepage tests such as water head loss along the seepage path and total flux, this apparatus can measure the process of fine particle loss and the consequent vertical deformation. Regretfully, though several large-scale apparatuses have been developed, systematic test results are still lacking due to the difficulty and high cost of large tests.
In this study, the internal stability of sandy gravel alluvium (stratum ① in
Figure 1) was evaluated preliminarily using commonly used geometric criteria according to its representative gradations. Then, a series of large-scale seepage tests were conducted on the representative gradations considering the in situ stress states and seepage flow direction. The change in hydraulic conductivity, the process of fine particle loss, and the corresponding deformation, as well as the evolution of porosity inside the specimen, were systematically presented. The distinction among the erosion characteristics of the representative gradations and the influence of the stress state on internal stability were summarized. The mesoscopic mechanisms were analyzed based on the difference in soil fabrics. Finally, the seepage failure risk of the embankment dam foundation was preliminarily and qualitatively evaluated according to the experimental results.
2. Preliminary Evaluation of Internal Stability
The prerequisite for soil to exhibit an internal instability behavior is that the pore constrictions within the coarse particles should be larger than the size of fine particles [
27,
28,
29,
30,
31,
32]. Therefore, the internal stability of soil can be evaluated first according to its particle size distribution (PSD).
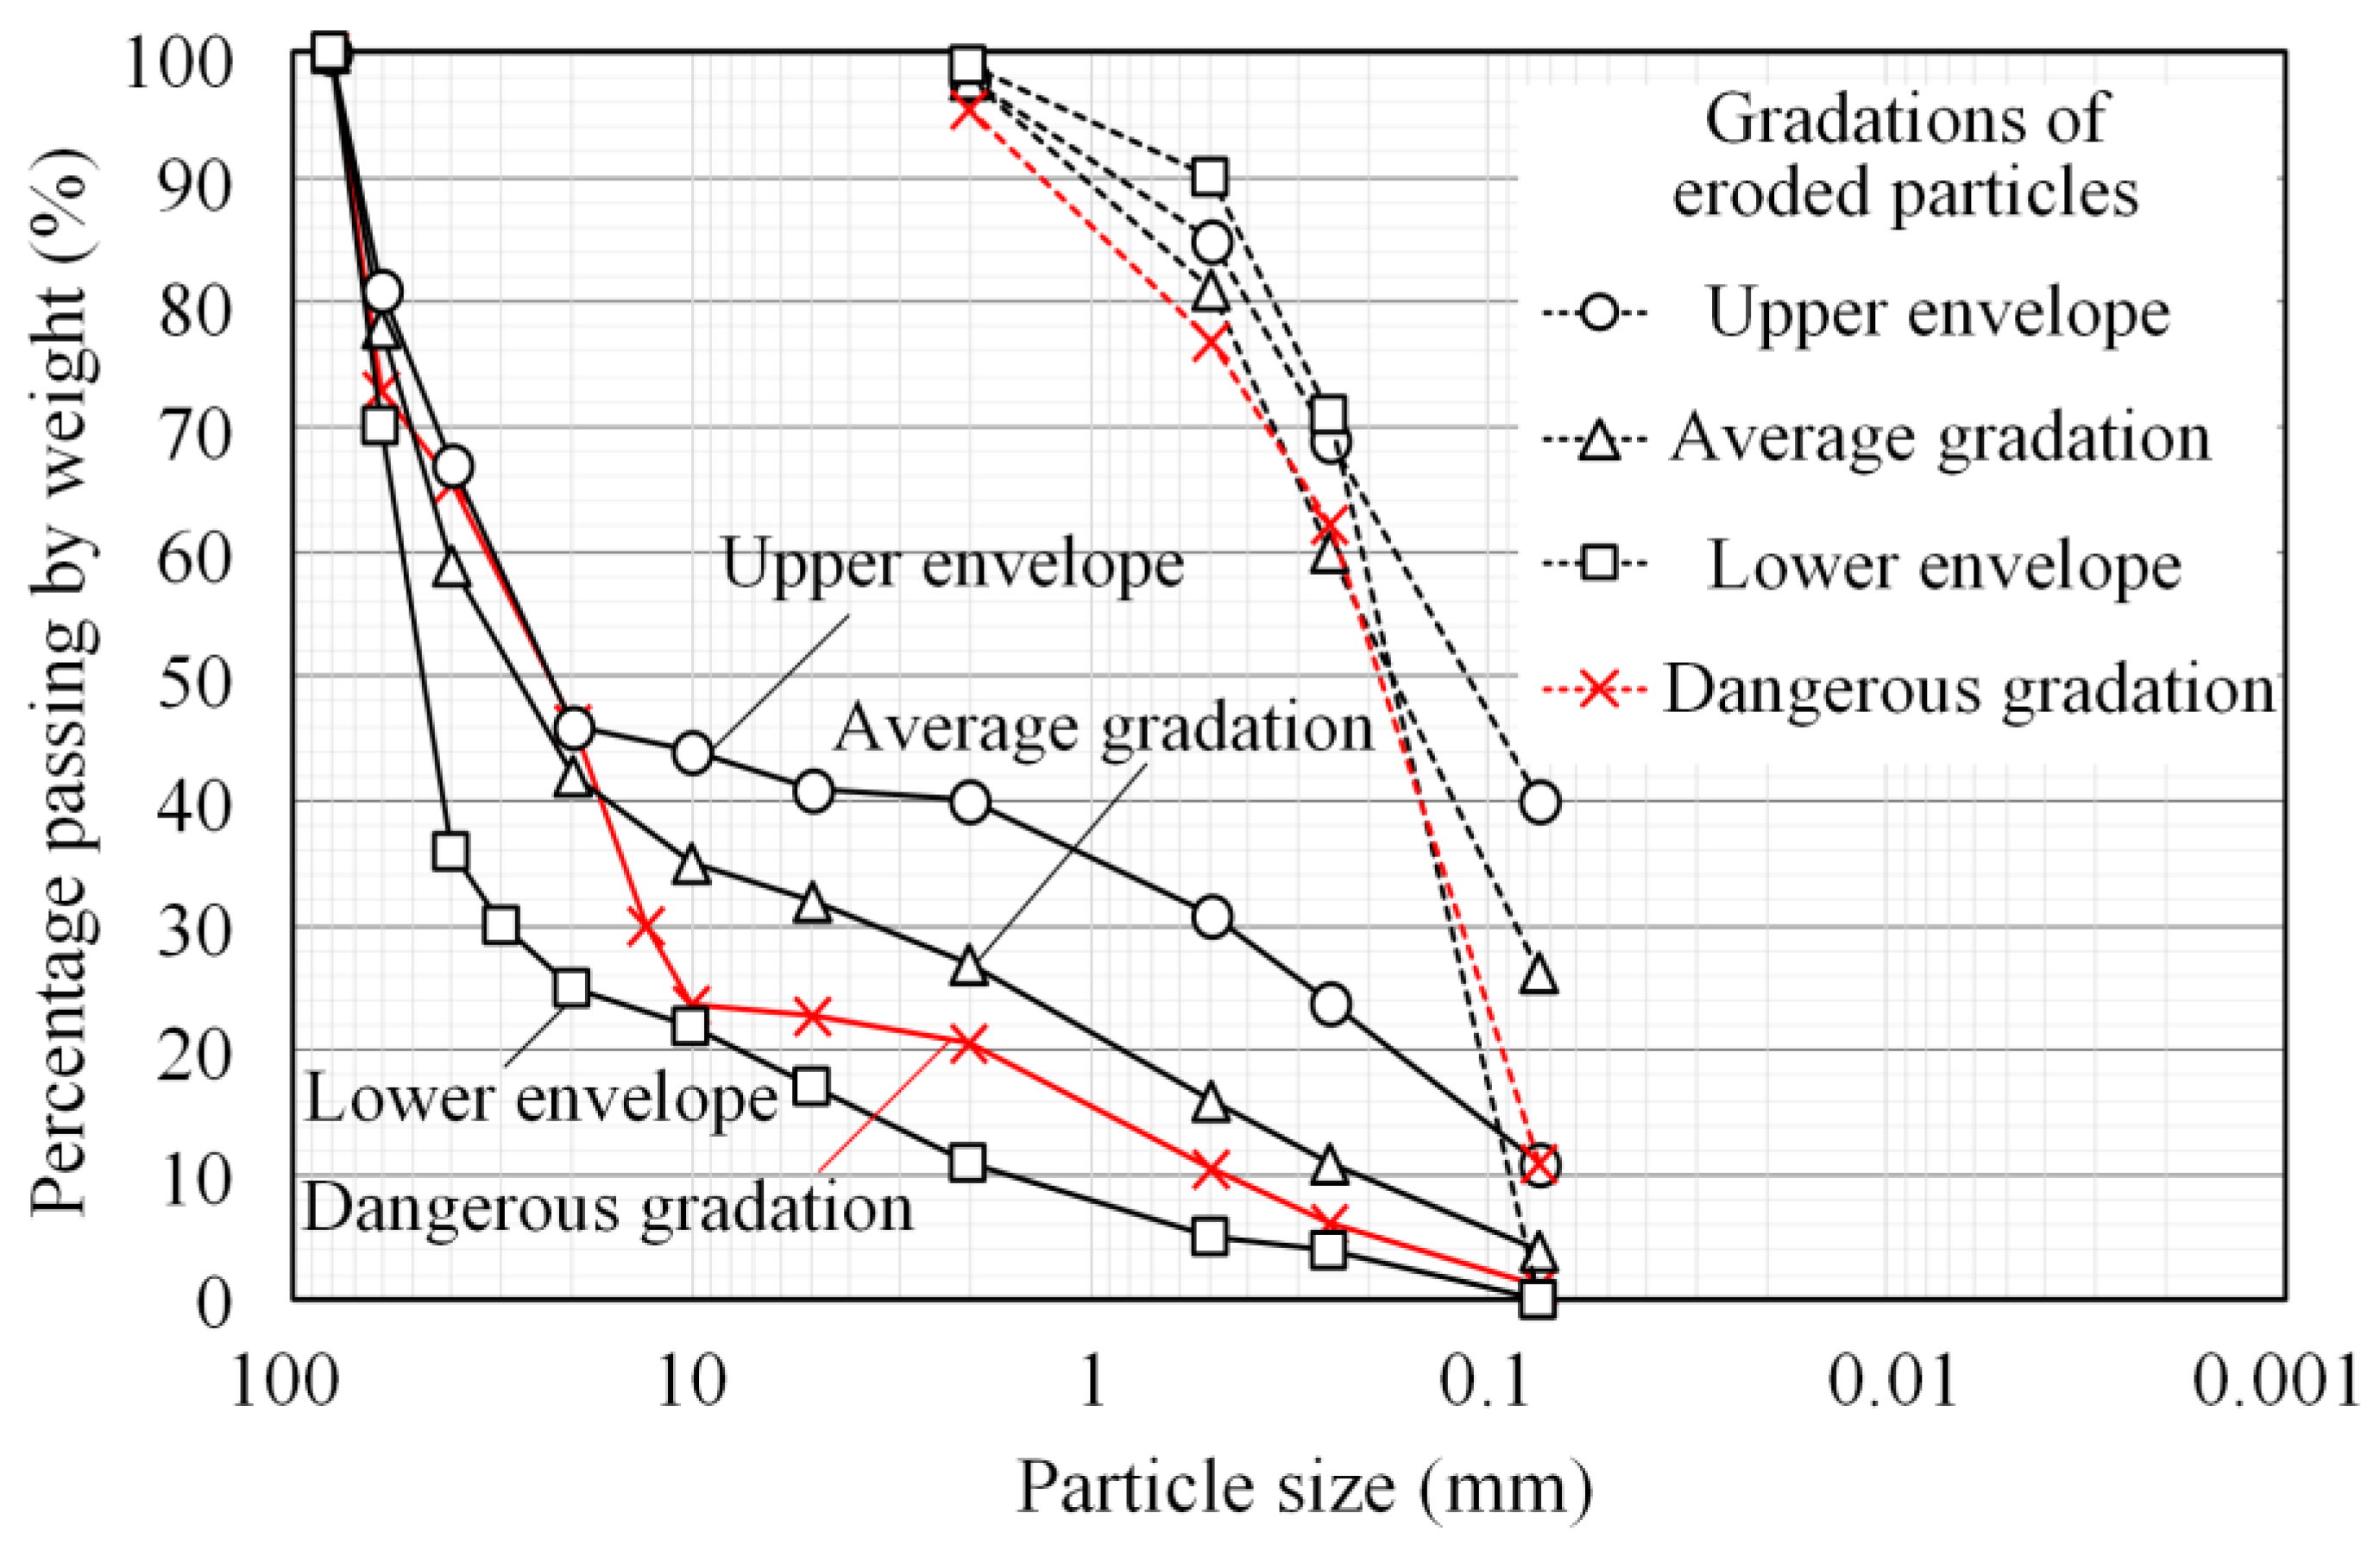
Figure 2 shows the lower and upper envelope lines and the average lines of all the gradations of the borehole samples of stratum ① in the PSD chart. As can be seen, the PSD curves are quite diverse and the fine particle contents of the PSD curves are distinct, implying that stratum ① is heterogeneous. To cover the in situ range of particle composition, all three PSD lines were selected as representative gradations for the internal erosion study, named lower envelope gradation, upper envelope gradation, and average gradation, respectively. As gap-graded soils are susceptible to internal erosion, a gap-graded PSD in the borehole samples (also plotted in
Figure 2) was also employed in erosion analysis to cover the dangerous situation; the gap-graded PSD curve is named dangerous gradation.
Table 1 shows the internal stability evaluation results of the four gradations according to common geometric criteria. For the upper envelope, according to the criteria of Istomina [
27], Kezdi [
28], and Bruenkova [
29], the soil was internally unstable. However, according to the criteria of Kenney and Lau [
30], Li and Fannin [
31], and Wan and Fell [
32], the soil was internally stable. For the average gradation, the internal stability was evaluated as transitional or unstable. For the lower envelope and dangerous gradations, all criteria were judged as internally unstable.
4. Testing Results
Stress condition has a considerable effect on internal stability [
6,
7,
8,
10,
16,
17,
18,
19]. The overburden pressure of stratum ① beneath the suspended cutoff wall was about 2.0 MPa. Furthermore, in order to study the sensitivity of the internal stability of stratum ① to stress magnitude, for all four gradations, three tests were carried out under three different surcharge pressures (
= 0.5, 1.0, and 2.0 MPa). The tests conducted and their typical results are summarized in
Table 2.
4.1. Hydraulic Conductivity and Critical Hydraulic Gradient
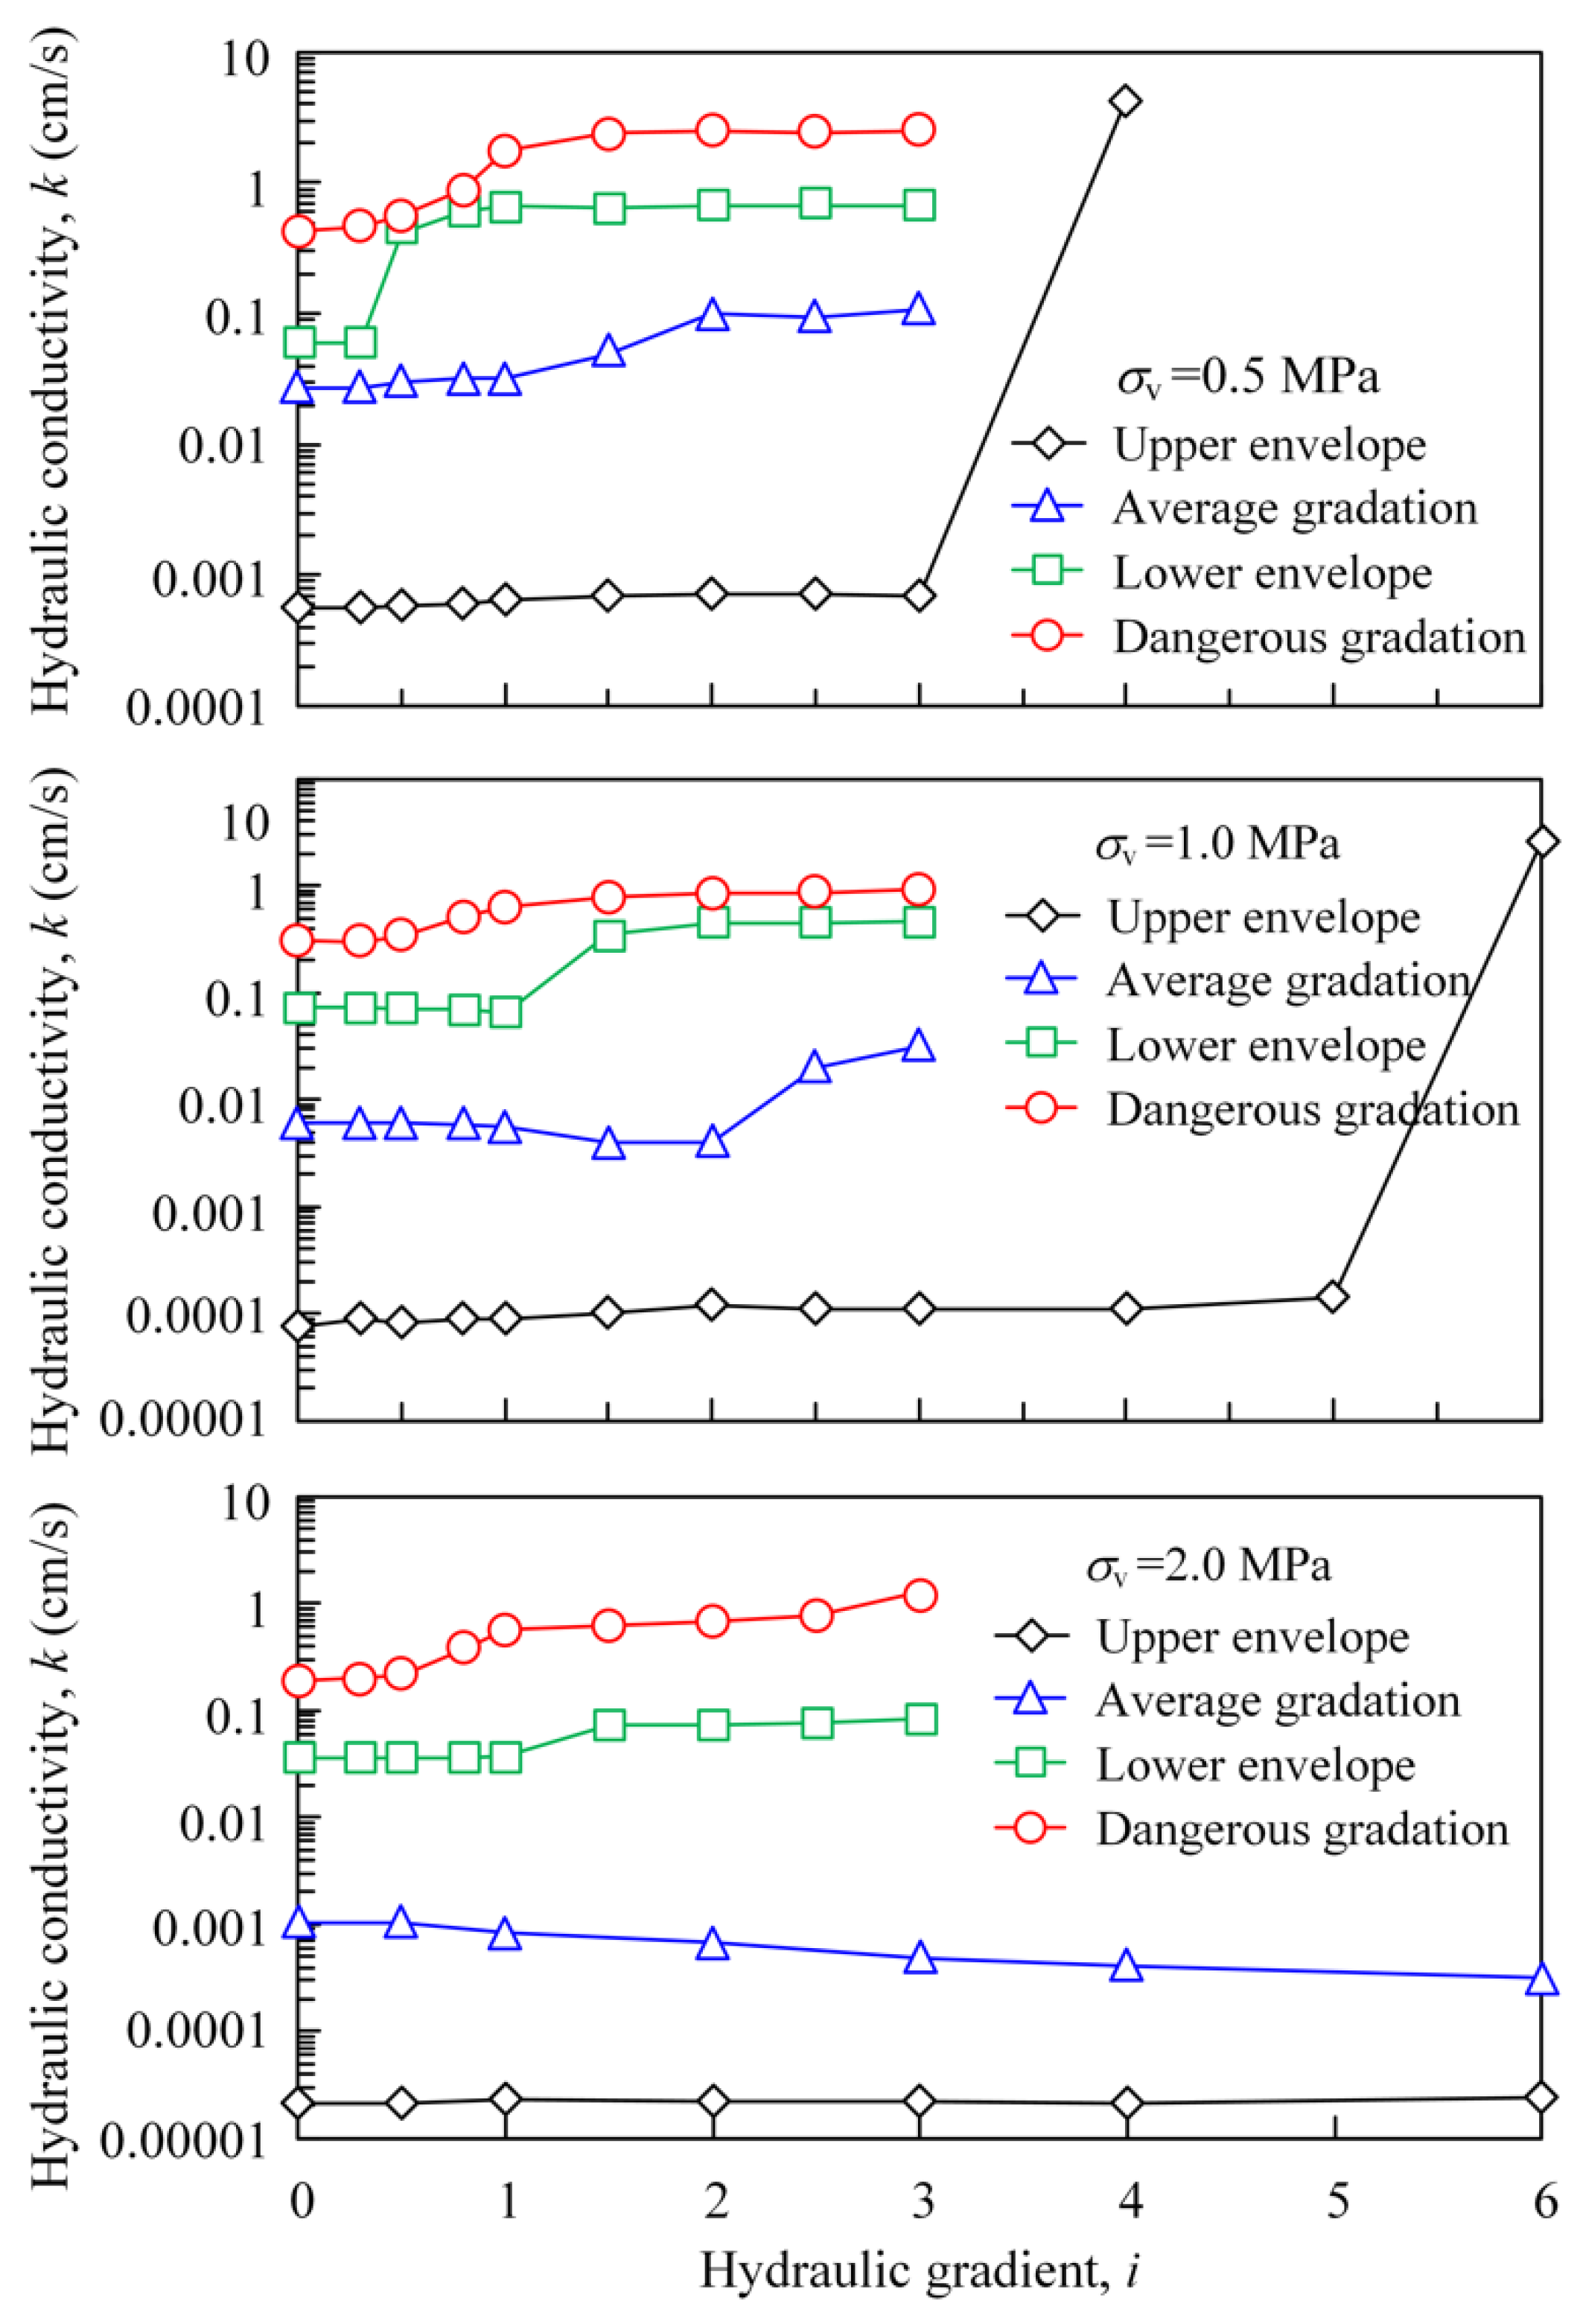
Figure 6 shows the change in hydraulic conductivity with the applied hydraulic gradients for all the tests grouped by surcharge pressures. It can be seen that when the applied hydraulic gradients were smaller than a specific value, the hydraulic conductivities of the specimens almost remained constant. The hydraulic conductivity at this stage can be referred to as the initial hydraulic conductivity
. The initial hydraulic conductivities of all the specimens are summarized in
Table 2. It can be found that for the specimens of the same gradation, the initial hydraulic conductivity showed a decrease with the increasing surcharge pressure, due to the compression effect. Meanwhile, it can be found that even under the same surcharge pressure, the initial hydraulic conductivities of different gradations varied by orders of magnitude. Among them, the upper envelope showed the lowest initial hydraulic conductivity, while the permeability of the average gradation and the lower envelope increased in order due to the decrease in fine particle content. This phenomenon is consistent with the consensus that soil with more fine particles will generally have smaller hydraulic conductivity [
33]. However, it is worth noting that although the fine particle content of the dangerous gradation was higher than that of the lower envelope, the initial hydraulic conductivity of the dangerous gradation was significantly higher than that of the lower envelope. This can be explained from a mesostructural point of view, namely that in the dangerous gradation, there were large pores in the soil due to the absence of particles ranging from 2 mm to 10 mm; hence, it can be concluded that gradation continuity is also an important factor affecting soil permeability.
As shown in
Figure 6, when the hydraulic gradient was increased to a certain step, the hydraulic conductivity of the specimen might exhibit a sudden increase, which means that particle redistribution and loss in the specimen had a substantial effect on the permeability characteristics of the specimen. This hydraulic gradient value was regarded as resistance to seepage failure or seepage strength in common seepage safety evaluations. In a series of values indicating the correlation between hydraulic conductivity and the imposed hydraulic gradient, the critical hydraulic gradient
can be estimated as [
35]:
where
is the hydraulic gradient at the step when hydraulic conductivity suddenly increases;
is the hydraulic gradient before step
.
Table 2 lists the critical hydraulic gradient of each gradation under different surcharge pressures. It can be seen that under the same surcharge pressure, the critical hydraulic gradients of the upper envelope, the average gradation, the lower envelope, and the dangerous gradation decreased in order, indicating that the internal stability of the soil gradually decreased. Comparing the data in
Table 2, the critical hydraulic gradients of the upper envelope and the average gradation significantly increased with the increase in surcharge pressure, while the lower envelope and dangerous gradation did not show any obvious change. These results verified that the increase in surcharge pressure can improve the internal stability of soil [
6,
17,
18], but the effect depends on the gradation feature. The mesomechanism was analyzed in combination with the process of particle erosion, the results of which are presented in a later section. Moreover, it can be found that the sensitivity of the erosion-induced hydraulic conductivity change to the surcharge pressure was diverse in different gradations. For the dangerous gradation and lower envelope, the hydraulic conductivity increased under the three surcharge pressures after the hydraulic gradient exceeded the critical hydraulic gradient, and the increasing level showed a reduced trend with the increase in surcharge pressure. In comparison, for the average gradation, before the hydraulic gradient reached the critical hydraulic gradient, the hydraulic conductivity change showed a trend of increasing to decreasing with the increase in surcharge pressure. For the upper envelope, the hydraulic conductivity remained almost constant before the hydraulic gradient reached the critical hydraulic gradient under all the surcharge pressures.
4.2. Fine Particle Erosion Ratio and Volumetric Strain
The experimental results showed that for the upper envelope, there were few fine particles eroded out, and no obvious volumetric strain and hydraulic conductivity change before hydraulic loading reached the critical hydraulic gradient. However, when the imposed hydraulic gradient exceeded the critical hydraulic gradient, continuous and excessive fine particles were eroded out, and thus a stable state was unable to be maintained. The test had to be ceased until the top loading cap fell, reaching its maximum movement limit, or until it generated seriously uneven settlement leading to leakage. Hence, the process of the fine particle loss and volumetric strain for the upper envelope could not be measured and thus was not given. For the lower envelope and dangerous gradation, although the critical hydraulic gradients were relatively low, the fine particle erosion and volumetric strain could gradually reach a stable state in each subsequent hydraulic gradient. Therefore, fine particle erosion and volumetric strain were measured.
The fine particle erosion ratio
and the volumetric strain
can be calculated as:
where
is the accumulated mass of the eroded fine particles at the current time;
is the initial total mass of fine fractions (particles < 2 mm) in the compacted specimen;
is the settlement of the loading cap, i.e., the vertical deformation of the specimen;
is the initial specimen height after the consolidation. It can be seen from
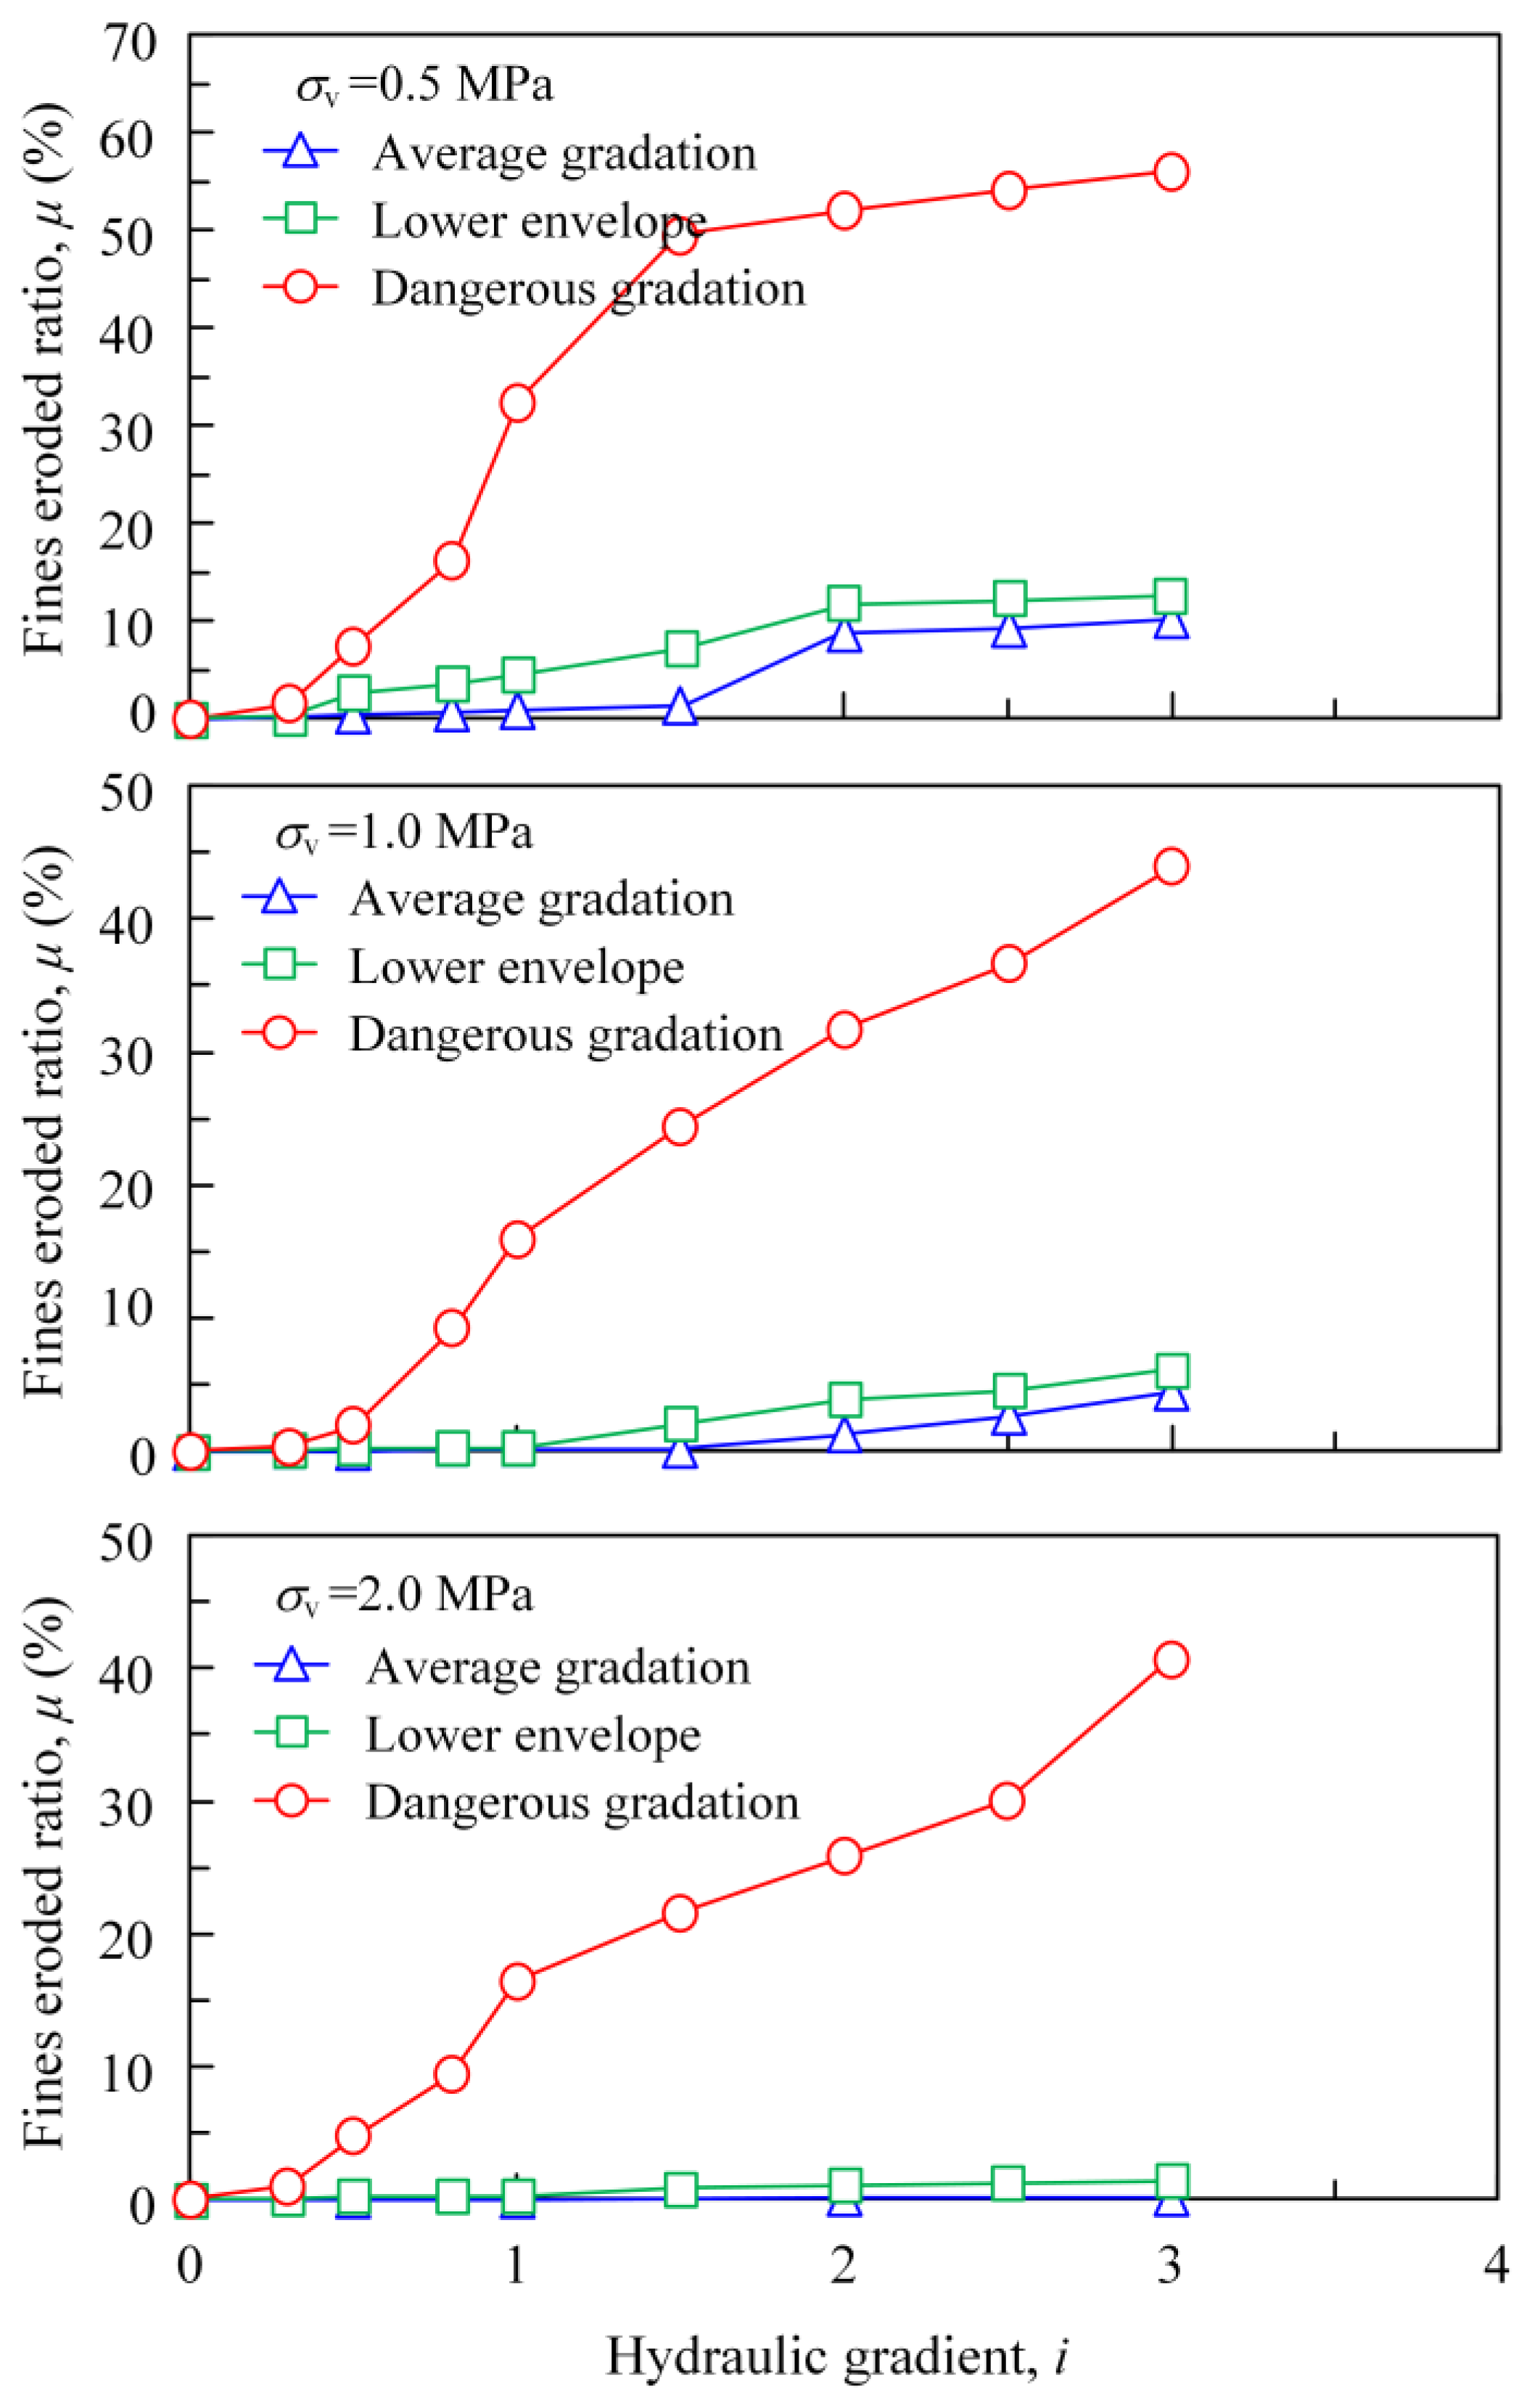
Figure 7 that the fine particle erosion ratio gradually increased with the stepwise increase in the hydraulic gradient. Moreover, the fine particle erosion ratio of the dangerous gradation was much higher than those of the average gradation and the lower envelope under the same hydraulic gradient.
Table 2 lists the eventual fine particle erosion ratio of all the tests, which is the erosion ratio of the accumulated fine particles at the end of a test (corresponding to an imposed hydraulic gradient value of 3). It can be seen that the fine particle erosion ratio showed a consistent decreasing tendency with the increase in surcharge pressure, indicating that surcharge pressure would restrict the erosion of fine particles; however, the extent of this influence significantly varied depending on the gradation. For the average gradation, the eventual fine particle erosion ratio was 10 % under the surcharge pressure of 0.5 MPa and reduced to negligible when the surcharge pressure increased to 2 MPa. For the lower envelope, the eventual fine particle erosion ratio was 11.7 % under the surcharge pressure of 0.5 MPa and reduced to 1.4 % under the surcharge pressure of 2 MPa. In contrast, for the dangerous gradation, the decrease in the fine particle erosion ratio with surcharge pressure was not obvious. As can be seen, the eventual fine particle erosion ratio was 56% under the surcharge pressure of 0.5 MPa and still remained at a value of 40% under the surcharge pressure of 2 MPa.
Such differences can be explained by the soil fabric and the effective loading on fine particles, as indicated in, e.g., [
36,
37]. As shown in
Figure 8, the fine particles in a soil element can be subdivided into free fine particles and skeleton fine particles. The free fine particles lie down in the pore bodies and do not contribute to effective stress. The skeleton fine particles are a part of the skeleton and bear effective stress, and thus they are constrained by coarse particles. Due to the gradation gap of the dangerous gradation, the coarse particles form the primary soil skeleton and bear most of the effective stress, leaving most of the fine particles free [
37]. As a consequence, the increase in surcharge pressure had little influence on the erosion of these free fine particles. For the average gradation and the lower envelope, continuous gradation means that more fine particles are skeleton fine particles. Under lower surcharge pressure, some skeleton fine particles that were weakly constrained by effective stress could be dragged out from the skeleton by seepage flow, while under higher surcharge pressure, the constrain stress increased, and thus fewer particles were dragged out by the seepage flow of the same intensity.
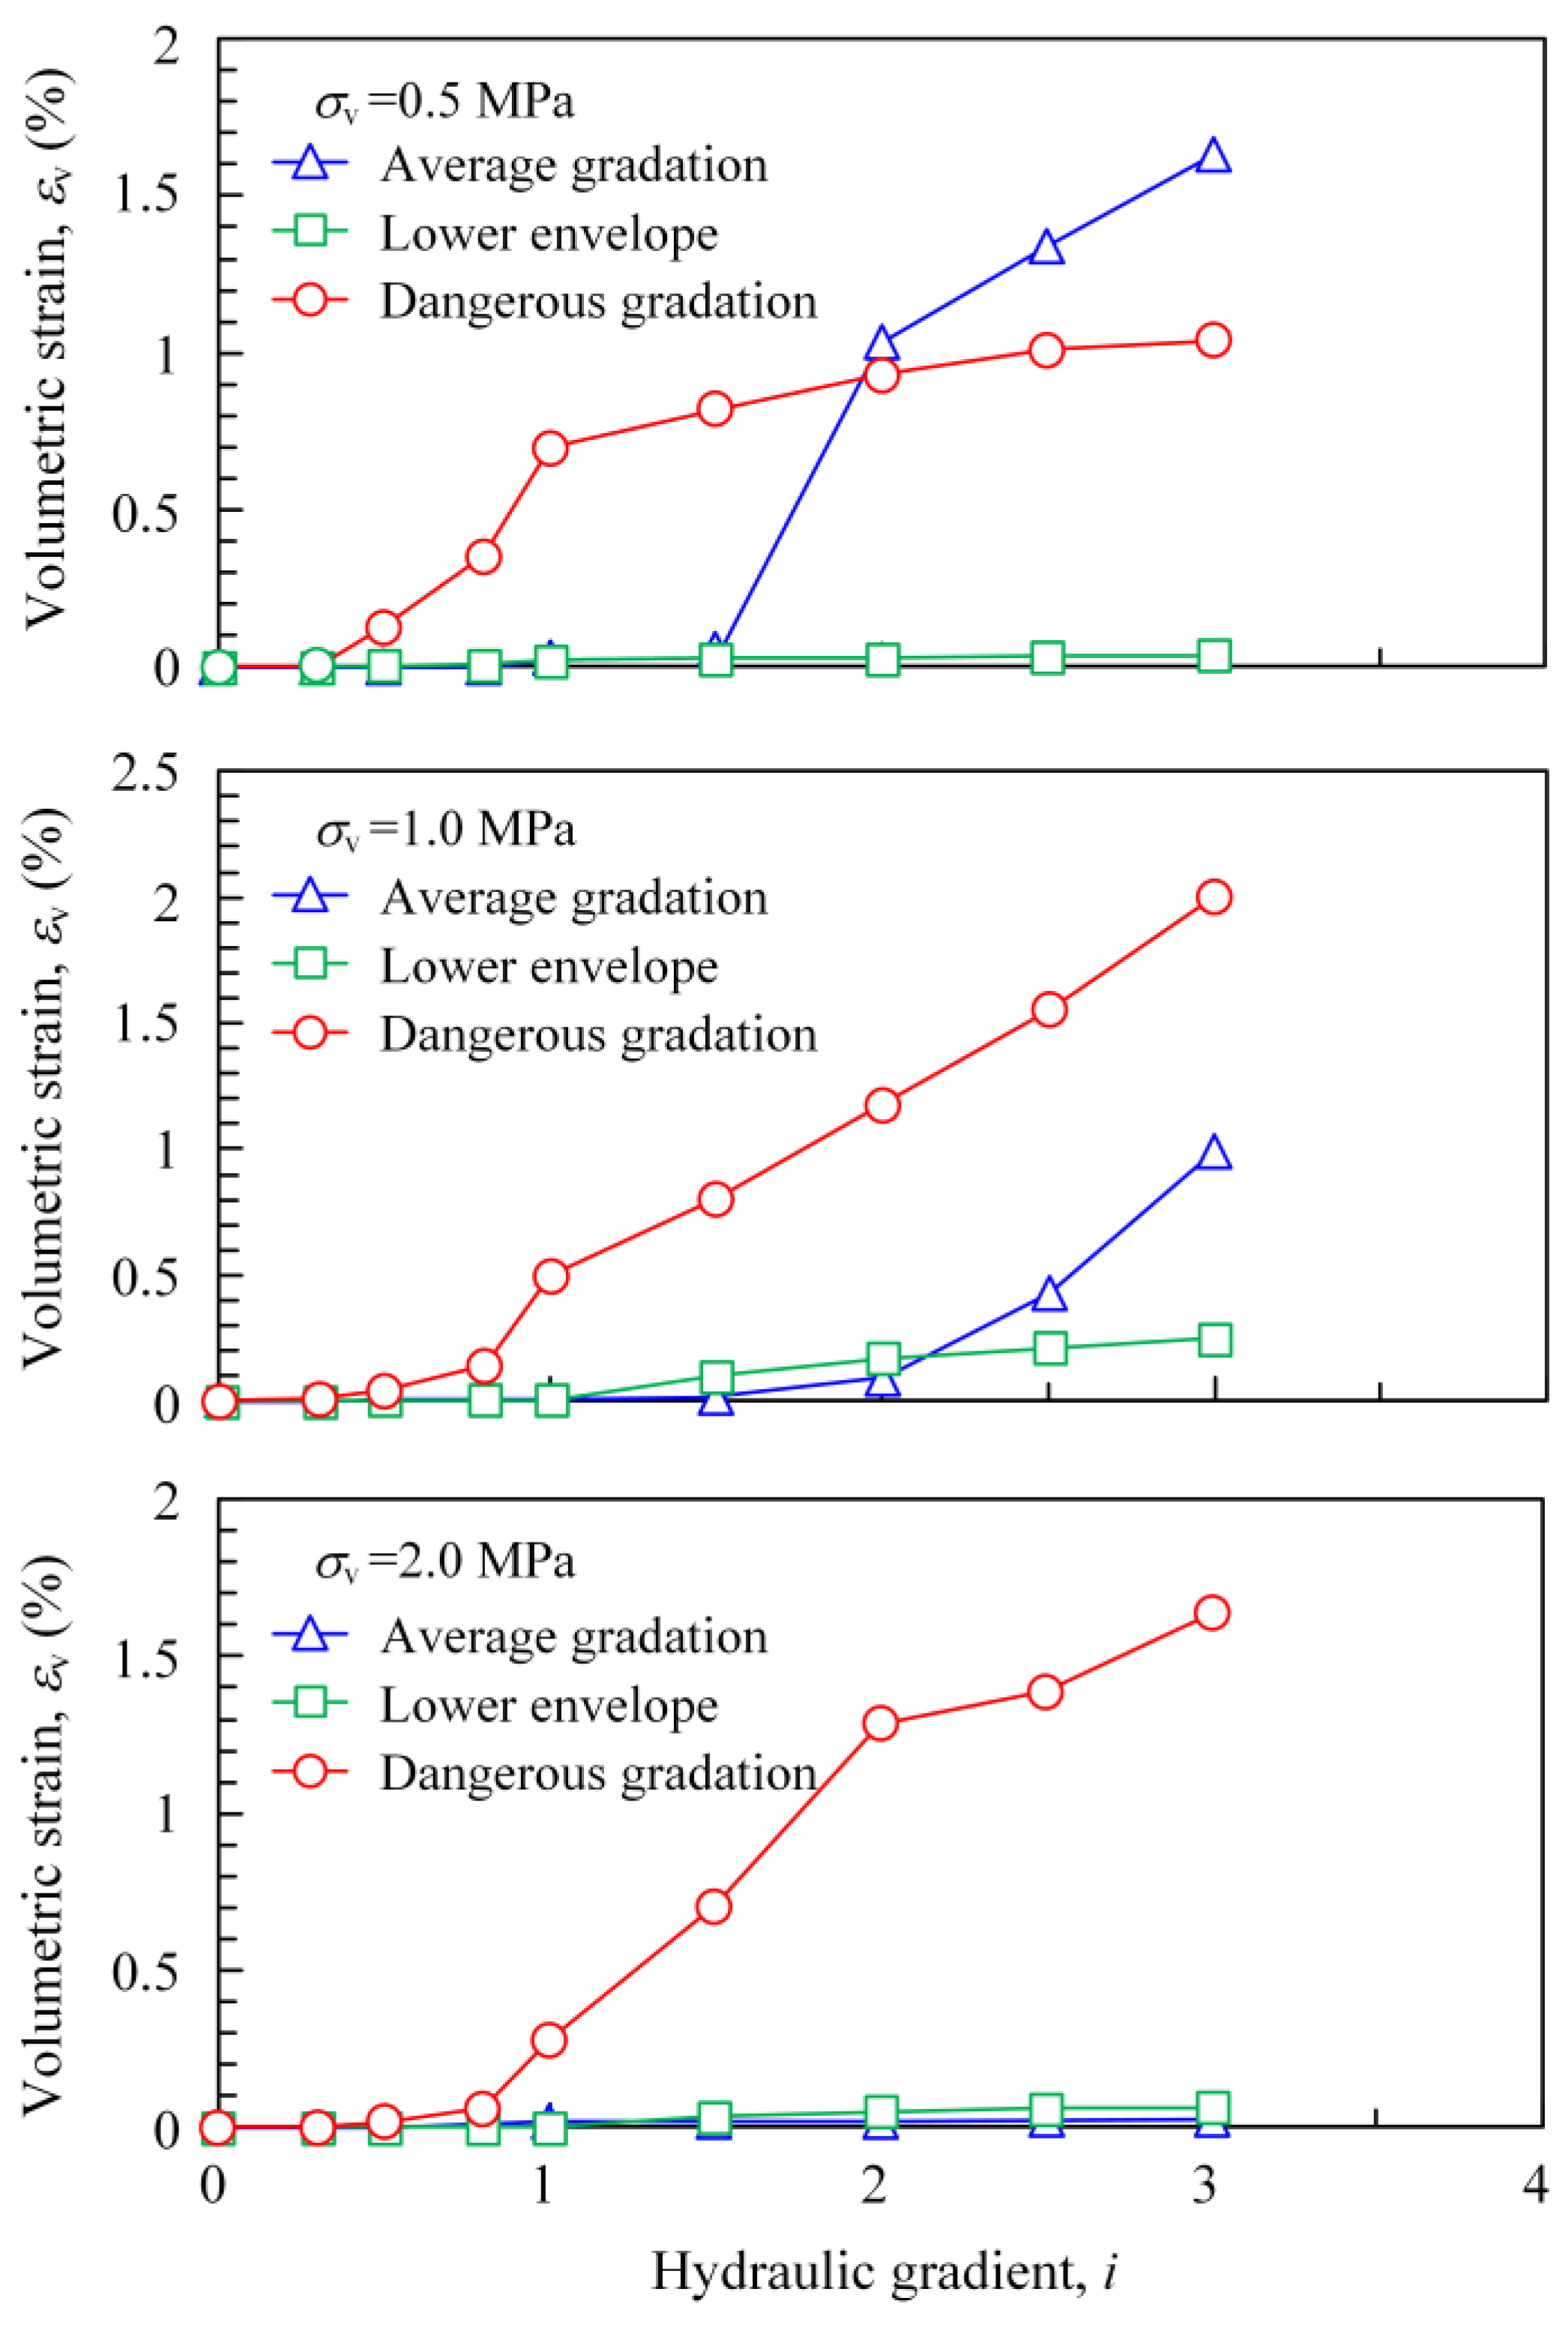
In
Figure 9, the development of volumetric strain is compared with the hydraulic gradient for the three gradations grouped by surcharge pressures. As can be seen, the volumetric strain development curves did not show a consistent location relationship with gradation or surcharge pressure. For the average gradation, the proportion of skeleton fine particles was higher, as the fine particle content was relatively higher. Therefore, a small erosion ratio of fine particles can lead to obvious volumetric strain. For the dangerous gradation, the soil skeleton was mainly formed by coarse particles. Therefore, even a large erosion ratio of fine particles (over 40%) only caused a small volumetric strain (about 2%). For the lower envelope, because the fine particle content was relatively lower, the soil skeleton was mainly formed by coarse particles. Therefore, the volumetric strains were all small under the three surcharge pressures.
4.3. Average Porosity
The porosity change can give an insight into the mechanism of the permeability change in the soil during seepage erosion tests. For a given fine particle erosion ratio
and volumetric strain
, the average porosity change in the specimen can be calculated as:
where
and
are the porosity and dry density after the consolidation.
is the specific density of the soil particles,
is the initial mass content of the fine fraction, and
is the porosity increment caused by fine particle erosion. According to the time history curves of the fine particle erosion ratios (
Figure 7) and volumetric strain (
Figure 9), the development of porosity with the hydraulic gradient for the three gradations was calculated, and its diagrams are presented in
Figure 10. Surprisingly, all the porosity curves showed a monotonically increasing trend, indicating that the porosity decrease caused by volumetric strain was smaller than the porosity increase caused by fine particle erosion. Furthermore, comparing the porosity evolution with the hydraulic conductivity change in
Figure 6 and the evolution of the fine particle erosion ratio shown in
Figure 7, it can be found that the changes in porosity and the fine particle erosion ratio showed a similar trend, which was consistent with the phenomena in the microscopic studies of Nguyen et al. [
23], Hu et al. [
24], and Ma et al. [
26]. However, for some specimens (e.g., the dangerous gradation under 0.5 MPa and 1.0 MPa and the lower gradation under 0.5 MPa), it can be found that both the fine particle erosion ratio and porosity continually increased during the whole process, while the hydraulic conductivity did not show a continuous increase after
i > 1.0. In other words, the erosion of fine particles caused an increase in porosity but did not cause a change in the soil’s permeability.
The permeability change in the soil during an erosion process depends on the combined effects of the following four factors: (1) The erosion of fine particles will increase the porosity, thus increasing the permeability. (2) Vertical deformation will decrease the porosity, thus decreasing the permeability. (3) In the process of migration, fine particles might be clogged at the pore constrictions, which reduces the connectivity of the seepage channels and decreases the permeability. (4) Even if the average porosity decreases, internal erosion is usually inhomogeneous and may lead to preferential seepage paths [
38], thus increasing the permeability. Thus, the combined effects of these four factors might lead to various changing patterns in soil permeability such as an increase, decrease, or fluctuation [
6,
12,
17,
18]. That is why the hydraulic conductivity curves in
Figure 6 did not show a consistent change trend with the fine particle erosion ratio curves in
Figure 7 and the average porosity curves in
Figure 10. For example, the hydraulic conductivity of the average gradation fluctuated downward at
i = 1.5 under the surcharge pressure of 1 MPa and even showed a decreasing trend under the surcharge pressure of 2 MPa. This change can probably be attributed to particle clogging during the particle migration process.
5. Practical Implications
For an embankment dam foundation with a suspended cutoff wall, the zone beneath the suspended cutoff wall usually shows a high hydraulic gradient. Due to the relatively lower critical hydraulic gradient of the internally unstable soil, the results of seepage analysis generally show that this zone has a hydraulic gradient value much larger than the critical value for the internal erosion or piping behavior, as indicated in, e.g., [
5]. However, engineering practice shows that, even if the hydraulic gradient in this zone greatly exceeds the critical hydraulic gradient, it has no considerable consequence because this zone is located inside of the foundation. This uncertainty brings much ambiguity to safety evaluations. It is difficult for engineers to make a decision for a specific project.
For the project shown in
Figure 1, a spring of the maximum flux of 200 L/s was observed at the downstream alluvium of the dam after the first reservoir impoundment. Although the outlet of the spring was treated with backfill filters, much concern was raised about the seepage safety of the alluvium layer, especially on the internal erosion risk of stratum ① beneath the suspended cutoff wall.
Based on the erosion tests on the representative gradations of stratum ①, the following basic judgments can be made: (1) The upper envelope and the average gradation had higher fine particle content, and the internal stability significantly increased with the increase in the overburden pressure. The two gradations had the sufficient capability ( > 12) to retain their fine particles under the in situ overburden pressure of 2 MPa. (2) For the lower envelope and the dangerous gradation, when the imposed hydraulic gradient exceeded the critical hydraulic gradient, the soil did suffer a loss of free fine particles to some extent. However, because of the relatively stable coarse skeleton, the loss of free fine particles would only lead to a small volumetric strain and a certain permeability increase. Therefore, the risk of severe seepage failure and excessive deformation of the dam foundation was relatively small. The consequence of internal erosion is an increase in the amount of water leakage through the dam foundation. This small increase in leakage is acceptable, and moreover, the development of excessive leakage can be forewarned by the pore water pressure monitors in stratum ① and the flux measurement at the flow outlet. After the treatment of the spring leakage outlet, during the 8 years of monitoring, the pore water pressure and flux did not exhibit abnormal change, indicating that no considerable erosion occurred in the hydraulic gradient exceeding zone beneath the suspended cutoff wall.
