Article

Lettuce Fertigation with Domestic Effluent Treated with Orange Pomace Biochar

by
Antonio Magno dos Santos Souza
1,
Fernando França da Cunha
1,*,
Gregorio Guirado Faccioli
2,
Fabiano Santos Santana
2 and
Ketylen Vieira Santos
2
1
Department of Agricultural Engineering (DEA), Federal University of Viçosa (UFV), Viçosa CEP 36570-290, Brazil
2
Department of Agricultural Engineering (DEAGRI), Federal University of Sergipe (UFS), São Cristóvão CEP 49095-000, Brazil
*
Author to whom correspondence should be addressed.
Water 2022, 14(20), 3272; https://doi.org/10.3390/w14203272
Submission received: 9 September 2022 / Revised: 3 October 2022 / Accepted: 13 October 2022 / Published: 17 October 2022
(This article belongs to the Section Wastewater Treatment and Reuse)

Abstract

:
The objective of this study was to evaluate the adsorption capacity of orange pomace biochar, applying its benefits in irrigated agriculture. For this, a low-cost system for tertiary treatment using biochar was developed. The objective was also to compare the physicochemical and microbiological attributes of irrigation water with the limits established by the legislation. The impacts of wastewater from the filtration system on the soil and on the agronomic and biological characteristics of the lettuce crop were assessed. Biochar was produced in a muffle furnace and characterized by thermogravimetry and scanning electron microscopy (SEM). The experimental design was randomized blocks, in a 5 (irrigation depths) × 5 (combinations of water sources and fertilization) factorial arrangement, with three replicates. It was found that the use of biochar as a filter material improved the microbiological quality of wastewater. The water sources used in irrigation did not cause changes in soil salinity. Fertigation using wastewater that passed through the filtration system positively affected the agronomic characteristics of lettuce, with no need for top-dressing fertilization. Lettuce leaves produced in the experiment were acceptable for human consumption, according to the standards of Resolution-RDC No. 12, of 2 January 2001, of the National Health Surveillance Agency (ANVISA).

Graphical Abstract

1. Introduction

Water is an indispensable natural resource for human survival and development. It also plays an important role in ensuring agricultural production, food security and the sustainability of the ecological environment [1,2]. The development of agriculture and the use of new technologies to increase yield are highly dependent on the availability of water resources [3]. It is worth noting that agriculture is the activity that consumes the largest amount of water.
Irrigated agriculture is responsible for using almost 70% of all fresh water consumed on the planet [4,5]. By 2030, this figure is expected to increase by about 15% [6,7], further intensifying water crises and conflicts over the appropriation and use of water, especially in arid and semi-arid regions.
Agricultural crops are greatly influenced by the availability of these water resources, since their development is strongly dependent on soil moisture conditions. The replacement of soil water by irrigation systems is a decisive factor for the success of horticulture. Proper application of irrigation depth promotes yield and quality gains [8].
Among the vegetables of interest, lettuce (Lactuca sativa) stands out, since it is cultivated and consumed worldwide. In 2018, its production exceeded 27 million tons [9]. In Brazil, it is the most consumed leafy vegetable because it is cheap, easy to trade and produced all year round [10,11].
The use of wastewater in irrigated agriculture has been growing worldwide. Its use as an economic water resource management technique has proven environmentally appropriate to deal with the increasing pollution of and demand for fresh water [12]. Supporting this idea, the study conducted by Urbano et al. [13] indicated that the use of this water source for irrigation of a short-cycle crop, such as lettuce, may be an alternative to save drinking water in times of scarcity of this resource, besides the additional benefit of increasing yield and improving soil fertility.
Nagarajan et al. [14] add that wastewater is an abundant source of nutrients to be recovered and reused. In addition, wastewater is rich in organic/inorganic forms of carbon, nitrogen and phosphorus. According to Dragonetti et al. [15], one way to take advantage of wastewater is to use it for irrigation purposes. Planned reuse can improve water circularity and ensure optimal use of available resources [16].
Concerns with irrigation using treated wastewater include risks to soil quality and crop development [17]. Nunes-Carvalho et al. [18] warn that the presence of fecal contamination in irrigation water represents a serious public health problem, especially for irrigation of vegetables that are consumed raw. Thus, the use of filter materials such as biochar as a tool in the adsorption process presents itself as an alternative to improve the microbiological quality of the treated effluent.
By definition, biochar is a porous solid, rich in carbon and produced from biomass pyrolysis in the absence of oxygen [19]. It has been employed as a low-cost and environmentally friendly bioagent in soil-pollution remediation, as well as in adsorption of contaminants from aqueous solutions [20,21]. Its production using waste and by-products as a source of raw material has aroused more interest among researchers, since the economic factor of the raw material is viable in its large-scale production [22,23].
Orange pomace is a residue with the potential to be exploited as a source of biochar raw material. It is capable of causing several economic and environmental problems, due to its high fermentation. Currently, the residue has been used mainly in animal feed [24] or disposed of directly in landfills [25]. However, the industrial sector has been thinking of ways to expand the applications for orange pomace, including the use of this residue in the treatment of effluents [26]. In addition, Brazil is the largest producer of oranges in the world, with the northeast region accounting for 10% of the national production. It is worth pointing out that the Coastal Tablelands of Bahia and Sergipe stand out for composing 90% of this, mostly with oranges of the variety ‘Pêra’—Citrus sinensis [27].
It is common to find articles in the literature on wastewater application for the fertigation of agricultural crops [28,29,30]. However, it is rare to find articles that use biochar as a tool in the process of improving the microbiological quality of wastewater, maintaining its nutritional contribution, focusing on the same destination. There are studies that produce biochar, but do not apply it to irrigated agriculture [31,32,33,34,35]. It is also common to find studies in the literature that apply biochar from different raw materials to the soil [36,37,38], but the approach, as used in the adsorptive process seeking to improve water quality, is uncommon. None of the articles cited in this paragraph sought to discuss what legislation on the use of wastewater in irrigated agriculture is about. The application of wastewater on the soil must be carried out following the recommendations of the current legislation, guaranteeing a safe activity with regard to the risks of contamination of the soil, cultures, surface water and groundwater. Problems related to human health must also be considered. A critical analysis of the rigidity of its framework for the predominant use of the technique is also valid.
Based on the hypothesis that biochar promotes improvements in the microbiological quality of wastewater to be used in irrigation, this study seeks to evaluate the adsorption capacity of orange pomace biochar. The objective was also to compare the physicochemical and microbiological attributes of irrigation water with the limits established by CONAMA Resolution No. 357, of 17 March 2005 [39], and Complementary Resolution No. 430, of 13 May 2011 [40]. The findings of this research should be used to benefit agriculture and the environment, because, with this study, it will be possible to give a final destination to two by-products (domestic effluent and orange pomace) for food production. For this, a low-cost system for tertiary treatment using orange pomace biochar was developed, aiming to improve the microbiological quality of the domestic effluent and maintain the nutritional load contained in this type of water source. The impacts of fertigation with effluent that passed through the filtration system on the chemical attributes of the soil and on the agronomic and biological characteristics of the lettuce crop (Lactuca sativa) cultivated in a protected environment were assessed.

2. Materials and Methods

2.1. Biochar

2.1.1. Biochar Production

Biochar was produced under controlled conditions in a muffle furnace. The raw material used was pomace of orange, ‘Pêra’ variety. The orange pomace was collected in a food establishment located in the industrial district, municipality of Aracaju, state of Sergipe, Brazil. The material was properly washed, pressed, cut into 1 × 1 cm pieces, spread on countertops and exposed to sunlight until dehydration. After this procedure, it was placed in trays in an oven with air circulation and renewal, where it dried at 80 °C for 24 h. Subsequently, the residue was ground in a Wiley-type macro knife mill, with 20-mesh sieve. Then, the resulting material was mixed and placed in plastic bags.
In the carbonization stage, the ground pomace was placed in porcelain crucibles. Subsequently, the crucibles were placed in a muffle furnace at temperature of 550 °C and kept for 60 min, as recommended by Carvalho [41]. As only 18 porcelain crucibles fit in the muffle furnace, each of which contained only 25 g of ground pomace, the procedure was repeated until approximately one kilogram of biochar was obtained. In each process and crucible, approximately 5 g of biochar was produced. Subsequently, all material was sieved and homogenized for use in biochar characterization analyses and filter composition.

2.1.2. Biochar Characterization

Two samplings were used to perform all characterizations: fresh biochar and biochar after use as filter element. This allowed a comparison of the physicochemical behavior after the use of the filter element. The techniques used were scanning electron microscopy (SEM) and thermogravimetry.
A benchtop scanning electron microscope was used to map the elemental composition of solids and observe the morphology of the material. The device operated with voltage of 15 kV and amplification of images ranging from 50 to 10,000×. This device enables microscopic analysis by backscattered electrons (BSE), with magnification of up to 30,000 times and beams of 5 and 15 keV, resulting in a better visualization of the surfaces of the samples. In this analysis, the material is fixed with double-sided carbon tape and positioned in the lens field.
To monitor the mass variation of the materials as a function of temperature variation, thermogravimetric curves were constructed. The device used has a sensitive scale of μg, coupled with a programmable oven. The samples were subjected to a controlled temperature program within the range from 30 to 600 °C in a platinum sample holder, heating rate of 10 °C min−1, inert gas (N2) with flow rate of 50 mL min−1 and sample mass of 5 mg.

2.2. Experimental Design

2.2.1. Experimental Area Location and Characterization

The experiment was conducted in pots with 15 L capacity (upper diameter of 32 cm, lower diameter of 22 cm and height of 26 cm) arranged on pallets, within the protected environment. The structure is located in the Department of Agronomic Engineering (DEA) of the Federal University of Sergipe (UFS), in the municipality of São Cristóvão, Sergipe (SE), Brazil. The geographical coordinates of the site are 10°55′46″ S latitude, 37°06′13″ W longitude and 8 m above sea level altitude.
According to Köppen’s classification, the municipality of São Cristóvão has an A climate–tropical climate (winter–autumn rains) with dry summer season. The climate of the site is characterized by the humid and subhumid megathermal type, with an average annual temperature of 25.2 °C and average annual rainfall of 1331 mm, concentrated between March and August [42].
The structure corresponding to the protected environment is 9.0 m long and 6.5 m wide with ceiling height of 3.0 m. The structural cover is made of transparent low-density polyethylene, with 0.15 mm thickness (150 micron), which reduces the impacts caused by storms and rains. The sides of the greenhouse consist of anti-aphid screens that protect the crops.

2.2.2. Water Sources

Three water sources were used to fertigate the lettuce crop:
-
Drinking water for human supply (DW), from the Sergipe Basic Sanitation Company (DESO), collected in a pipe outlet located within the protected environment;
-
Treated wastewater by a biological process (TW), from the Rosa Elze Sewage Treatment Plant (STP), located near the Federal University of Sergipe, in São Cristóvão/Sergipe; and
-
Post-treated water by the adsorption process (BW), coming from the STP and then passed through the filtration system (using the biochar produced), assembled for the experiment.
The sewage treatment plant (STP) is located in the Rosa Elze neighborhood, in the municipality of São Cristóvão, Sergipe, Brazil, under the geographical coordinates of 10°55′59.34″ S latitude and 37°07′02.68″ W longitude, at an altitude of 7 m.

2.2.3. Experimental Design

Two cycles of lettuce cultivation were performed following the randomized block design (RBD), in a 5 × 5 factorial arrangement, with 3 replicates and totaling 75 experimental units. The factors consisted of five irrigation depths and five treatments. The irrigation depths were applied to replace 50%, 75%, 100%, 125% and 150% of crop evapotranspiration (ETc). The treatments were: T1—irrigated with human-supply water from the concessionaire and top-dressing fertilization; T2—irrigated with treated wastewater from the Rosa Elze STP; T3—irrigated with treated wastewater from biochar filtration; T4—irrigated with treated wastewater from the Rosa Elze STP and top-dressing fertilization; T5—irrigated with treated wastewater from biochar filtration and top-dressing fertilization.

2.2.4. Characterization of STP

The Rosa Elze Sewage Treatment Plant (STP) was built in the 1980s and has since been maintained and operated by the Sergipe Sanitation Company. The housing neighborhoods that have their wastewater treated are Rosa Elze and Eduardo Gomes, with a flow rate close to 7.6 L s−1. The STP is composed of five stabilization ponds arranged in series, two facultative ponds and three maturation ponds, totaling an area of 29,650 m2. The description of physical characteristics is presented in Table 1.
The STP used in the study is fed by the sanitary sewage in two sites. The first site is in the primary facultative pond, responsible for the largest contribution of the system, according to information from DESO [43], receiving sewage from the lift station. The other site is in the secondary facultative pond, which receives sewage by gravity. Together, the sewage from the two points reaches the pretreatment unit, formed by grid and sandbox, and is then conducted to the stabilization ponds.

2.2.5. Assembly of the Filtration System

Three different filtration systems were assembled to be tested and then select the filter to be used in the experiment. Filter columns consisting of plastic bottles, with approximate diameter of 8.5 cm and length of 28 cm, were assembled. The biochar of filter 1 was arranged inside the column with a height of 5 cm. This biochar remained between a 1 cm thick top layer of gauze and a 3 cm thick bottom layer of fine sand. Below this layer of fine sand, there were a 3 cm thick layer of coarse sand and a 5 cm thick layer of cotton. In filter 2, the biochar was arranged inside the column with a height of 5 cm, between a 5 cm thick layer of cotton (bottom) and 3 cm thick layer of fine sand (top). A 3 cm thick layer of coarse sand was placed above the layer of fine sand to minimize the impact caused by the fall of the effluent. Filter 3 had the same physical characteristics as filter 2, but the biochar layer was 3 cm thick. The columns were arranged vertically, and screens were fixed with rubber bands at their lower ends to contain the whole system (Figure 1A).
Based on the results obtained as a function of dissolved oxygen (DO) and pH of the filtered effluent, it was decided to use filter 2 (Figure 1B) to continue the experiment. It is worth noting that the results were compared with the limits established by CONAMA Resolution No. 357, of 17 March 2005 [39].
Plastic containers of 20 L were also installed below the filters for their support and proper collection of the filtered effluent. Taps were installed in the 20 L plastic containers, and hoses were used to feed the filters (Figure 1C).

2.2.6. Soil

The soil used in the experiment came from the Rural Campus, an experimental farm belonging to the Federal University of Sergipe. The collection was performed on 20 January 2021, and the depth used for collection was up to 20 cm. After collection, the soil was sieved, homogenized and arranged in the plastic pots, on a 10 cm thick layer of crushed stone.
To determine the composition of the soil, before transplanting, a sample of approximately 500 g was collected and taken to the laboratory for analysis. The results showed field capacity (FC) of 8.38% (mass, dry basis), permanent wilting point (PWP) of 2.25% (mass, dry basis) and loamy sand textural classification.
In the chemical analysis of the soil, the result of calcium and magnesium was 1.76 cmolc dm−3, aluminum was 0.08 cmolc dm−3, calcium was 1.21 cmolc dm−3, hydrogen + aluminum was 1.05 cmolc dm−3, the sum of exchangeable bases was 1.82 cmolc dm−3, the exchangeable sodium percentage was 0.66% and the base saturation percentage was 63.4%. In view of the results, it was verified the need for acidity correction, in which liming was performed by applying 320 mg of limestone kg−1 of soil. After mixing the limestone with the entire volume of soil in the pot, saturation was carried out until water percolation was observed. The soil was then left for a period of approximately 90 days, which was long enough for the product to react and correct soil pH and fertility.
Based on the results of the soil chemical analysis, transplanting fertilization was performed in all pots. Top-dressing fertilization was performed in the pots of treatments T1, T4 and T5. The amounts of nutrients applied were 30 mg dm−3 of N, 30 mg dm−3 of K2O and 60 mg dm−3 of P2O5. The commercial sources of the nutrients used were urea, potassium chloride and single superphosphate.
Physicochemical characterization of the soil was performed after the harvest of each cycle, to check for the possible impacts caused by the use of the effluent. The soil used to fill the pots was sieved and homogenized. To determine the composition of the soil, before transplanting, a sample of approximately 500 g was collected and taken to the ITPS certified soil laboratory for analysis. After collection, soil samples from each plot with irrigation depth equivalent to 100% ETc were collected from the 0–20 cm layer. These soil samples were mixed and homogenized according to their treatment, stored in properly identified plastic bags and taken to the laboratory for analysis.
The parameters analyzed were: pH in water, electrical conductivity (EC), soil classification for salinity, organic matter (OM), sodium, potassium, cation exchange capacity (CEC) and exchangeable sodium percentage (ESP).

2.2.7. Crop

In the two cycles, three lettuce seedlings were transplanted into each pot. After the stability of the crop, thinning was performed, leaving only the most vigorous plant in each pot, when the treatments began to be differentiated. During the first seven days after transplanting, irrigation with only supply water was applied in all plots. Transplanting fertilization was performed in all plots at the time of transplantation, and top-dressing fertilization was performed 21 days after transplantation in the pots of treatments T1, T4 and T5.
The microbiological characteristics analyzed were Salmonella sp. and coliforms at 45 °C. Samples of lettuce from each plot with irrigation depth equivalent to 100% ETc were collected. These samples were homogenized according to their treatment, stored in properly identified plastic bags, containing approximately 100 g each, and finally taken to the ITPS microbiology laboratory. The values obtained were compared with the limits established by Resolution-RDC No. 12, of 2 January 2001, of the National Health Surveillance Agency (ANVISA) [44].
The agronomic characteristics analyzed in lettuce plants were shoot fresh mass, shoot dry mass, number of leaves and water-use productivity (g L−1). During harvest, some procedures were performed. First, the crop was cut to separate the shoots from the roots, fresh mass was determined, and the number of leaves per plant was counted. Subsequently, to determine the dry mass, each sample was placed in paper bags and sent to the laboratory of the Department of Agronomic Engineering of UFS. The samples were dried in an oven with forced air circulation at 65 °C for 72 h. After this period, the dry mass of each plant was measured.

2.2.8. Estimation of Water Requirements

The water requirement of the crop was estimated using the direct method, by determining daily the masses of the pots under irrigation depths equivalent to 100% ETc. The differences between the masses of the previous day (referring to the field capacity) and the present day corresponded to the loss of water by evapotranspiration.
Crop evapotranspiration in any period between two irrigations is given by Equation (1).
ETc = 1000   ×   POT F C   POT a + ( PLANT prev   PLANT pres )
where
  • ETc—crop evapotranspiration (mL pot−1);
  • POTFC—pot mass at field capacity (kg);
  • POTa—pot mass at actual moisture (kg);
  • PLANTprev—plant mass on the previous day (kg); and
  • PLANTpres—plant mass on the present day (kg).
To adjust the variation in pot mass due to plant growth, 45 lettuce seedlings were transplanted into 5 L pots in each cycle. Every day a plant was chosen, its shoots were separated, and the mass was determined. The variation in plant mass corresponds to the difference between its mass on the previous day and its mass on the present day.
For each treatment, an average was obtained from the 3 replicates, and irrigation was applied proportionally to their respective depths. In the treatment of 100% ETc, irrigation was performed daily to raise the current moisture to the field capacity of the soil, using 100 mL graduated cylinders for better precision of the applied depth.

2.2.9. Collection of Water Sources for Irrigation

Treated wastewater was collected weekly, according to the demand, in 20 L plastic containers and taken to the protected environment for its use in irrigation. Part of this water source passed through the filtration system and was later used for irrigation of lettuce crop. In the domestic-effluent filtration process, a water column of 5 cm was maintained. The supply water used in irrigation came from the water outlet located inside the protected environment.

2.2.10. Analyses of Water Sources

Physicochemical analyses were performed in the three types of water sources used in the study. Microbiological analyses were performed only in the domestic effluent and water post-treated with biochar, because, as it is considered drinkable, the source of human-supply water from the concessionaire is expected to be free of pathogens.
For physicochemical characteristics, the parameters evaluated were: biochemical oxygen demand (BOD), total iron, total phosphorus, sodium adsorption ratio (SAR), dissolved oxygen (DO) and electrical conductivity (EC). The microbiological characteristic analyzed was the number of total coliforms. The method used for the analyzes was the Standard Methods for the Examination of Water and Wastewater [45].
Samples were collected weekly during each cycle (for 8 weeks, 4 for each cycle). BOD parameters were checked every 15 days, and only DO and EC parameters were monitored daily. The samples were placed in standardized containers of approximately 1 L and sent to the laboratory on the same day of collection, adopting all procedures established by the ITPS. The results were compared based on acceptable standards with the three classifications of fresh water used for irrigation, according to CONAMA Resolution No. 357, of 17 March 2005 [39], and Complementary Resolution No. 430, of 13 May 2011 [40].

2.2.11. Statistical Analysis

Agronomic variables and soil variables were subjected to analysis of variance (ANOVA), at 5% significance level in the F test. Bartlett test at 5% significance level was used to check the assumption of homogeneity of variances, and Shapiro–Wilk test at 5% significance level was used to check the assumption of normality. For qualitative factors, the means were compared by Tukey’s test at 5% significance level. For quantitative factors, the models were chosen based on the coefficients of determination (r2), on the significance of the regression coefficients and on the biological phenomenon. The statistical analyses were performed using R software, version 3.6.3.

3. Results and Discussion

3.1. Filtration System

The results obtained during the tests of the filtration systems were compared based on the acceptable standards of the three classifications of fresh water intended for irrigation, according to CONAMA Resolution No. 357, of 17 March 2005 [39], and Complementary Resolution No. 430, of 13 May 2011 [40]. Figure 2 shows the pH results verified in the three filtration systems (filter 1—filter with 5 cm thick layer of biochar and top layer with gauze; filter 2—filter with 5 cm thick layer of biochar and top layer of fine sand; filter 3—filter with 3 cm thick layer of biochar and top layer of fine sand) and the comparison with the limits established by CONAMA Resolution No. 357, of 17 March 2005 [39].
According to CONAMA Resolution No. 357 of 17 March 2005, for pH in irrigation waters, values between 6 and 9 are recommended [39]. According to Guimarães et al. [46], pH is one of the parameters that characterizes the quality of water for irrigation and may influence soil microbiology and the process of cation exchange between soil and plant. Therefore, according to the data presented in Figure 2A, the pH levels were within the limits of the resolution, and filter 3 obtained the lowest standard deviation, followed by filter 2.
Figure 2B shows the dissolved oxygen (DO) values observed in the three filtration systems and the comparison with the limits established by CONAMA Resolution No. 357, of 17 March 2005 [39]. According to Brasil [39], DO values should not be less than 6, 5 and 4 mg L−1 of O2, according to classes 1, 2 and 3, respectively, of fresh water intended for irrigation. It can be observed in Figure 2B that the means of filters 1 and 3 fit in class 3, and the mean of filter 2 fit in class 2. Filter 2 obtained a lower standard deviation compared to filters 1 and 3.
In view of the results obtained, filter 2 was chosen to continue the experiment, because it showed more consistent values with CONAMA Resolution No. 357, of 17 March 2005 [39].

3.2. Evaluation of Water Sources for Use in Irrigation

The physicochemical and microbiological results obtained in the present study were compared based on the acceptable standards of the three classifications of fresh water intended for irrigation, according to CONAMA Resolution No. 357, of 17 March 2005, [39], and Complementary Resolution No. 430, of 13 May 2011 [40]. Figure 3 shows the results of biochemical oxygen demand (BOD), total iron, total phosphorus and dissolved oxygen for the water sources used in the study and the limits established by the three classifications of fresh water intended for irrigation according to the CONAMA resolution.
BOD is one of the polluting constituents that characterize the quality of water used in irrigation. According to Brasil [39], BOD values should not exceed 3, 5 and 10 mg L−1 of O2, according to classes 1, 2 and 3, respectively, of fresh water intended for irrigation. It can be observed in Figure 3A that the BOD values of the filtered water remained close to the values found in the wastewater and that most of the points were outside the limits established by the resolution. The laboratory results also showed an increase in the value from 1 September 2021, suggesting that prolonged use of the filtration system can reduce its efficiency.
Complementary Resolution No. 430, of 13 May 2011 [40], establishes a maximum value of 120 mg L−1 of O2, emphasizing that the established limit can only be exceeded if the treatment system has minimum BOD removal efficiency of 60% from the effluent. Mendonça et al. [47] reported that the Rosa Elze STP has an average efficiency of 79%. Therefore, the mean values of the results obtained for 53.70 and 59.04 mg L−1 of O2 for treated wastewater and water filtered with biochar, respectively, met the Complementary Resolution No. 430, of 13 May 2011 [40].
CONAMA Resolution No. 357, of 17 March 2005 [39], presents maximum values of 0.3 mg L−1 Fe for class 1 and 5 mg L−1 Fe for class 3 of fresh water intended for irrigation. Figure 3B shows that the water-sources treated wastewater (TW) and water post-treated with biochar (BW) fit in classification 1 of this resolution. On 07 September 2021, the water source consisting of drinking water for human supply (DW) showed the value of 0.37 mg L−1 of Fe, a value very close to that established by class 1. On the other dates and for the other water sources, the total iron values were within the range of class 1.
According to Brasil [39], the values of total phosphorus (intermediate environment, with residence time between 2 and 40 days), for fresh water intended for irrigation, should not exceed 0.025, 0.050 and 0.075 mg L−1 P, for classes 1, 2 and 3, respectively. According to Figure 3C, the sources TW and BW did not fit any classification of this resolution. For the DW source, only two samples fit, on 14 July 2021 in class 1 and on 1 September 2021 in class 2.
For fresh water intended for irrigation, Brasil [39] recommends that the DO values should not be lower than 6, 5 and 4 mg L−1 of O2 for classes 1, 2 and 3, respectively. Figure 3D shows that the values of the three water sources oscillated among the three classifications. This occurred mainly with the water sources TW and AB, which had high DO values, with most of them in class 1. Most of the values in the DW source fit in class 2.
The raw domestic effluent and the effluent post-treated with biochar were subjected to microbiological analyses. Human-supply water was not analyzed, as it is considered drinkable and is expected to be free of pathogens. Figure 4 shows the values of total coliforms present in the water sources and the limit established by class 3 of fresh water, according to the CONAMA resolution.
For the use of water in irrigation, Brasil [39] determines that the amount of thermotolerant coliforms should not exceed the limits of 200, 1000 and 4000 MPN 100 mL−1 for classes 1, 2 and 3, respectively, in 80% or more of at least six samples collected over one year, with bimonthly frequency. Total coliforms were used to replace the thermotolerant coliform parameter.
The results of the total coliform analyses (Figure 4) showed none of the water sources meet the values required, since the limit of at least 4000 total coliforms per 100 mL should not be exceeded, preventing their use for irrigation because the levels exceed the acceptable values according to this resolution.
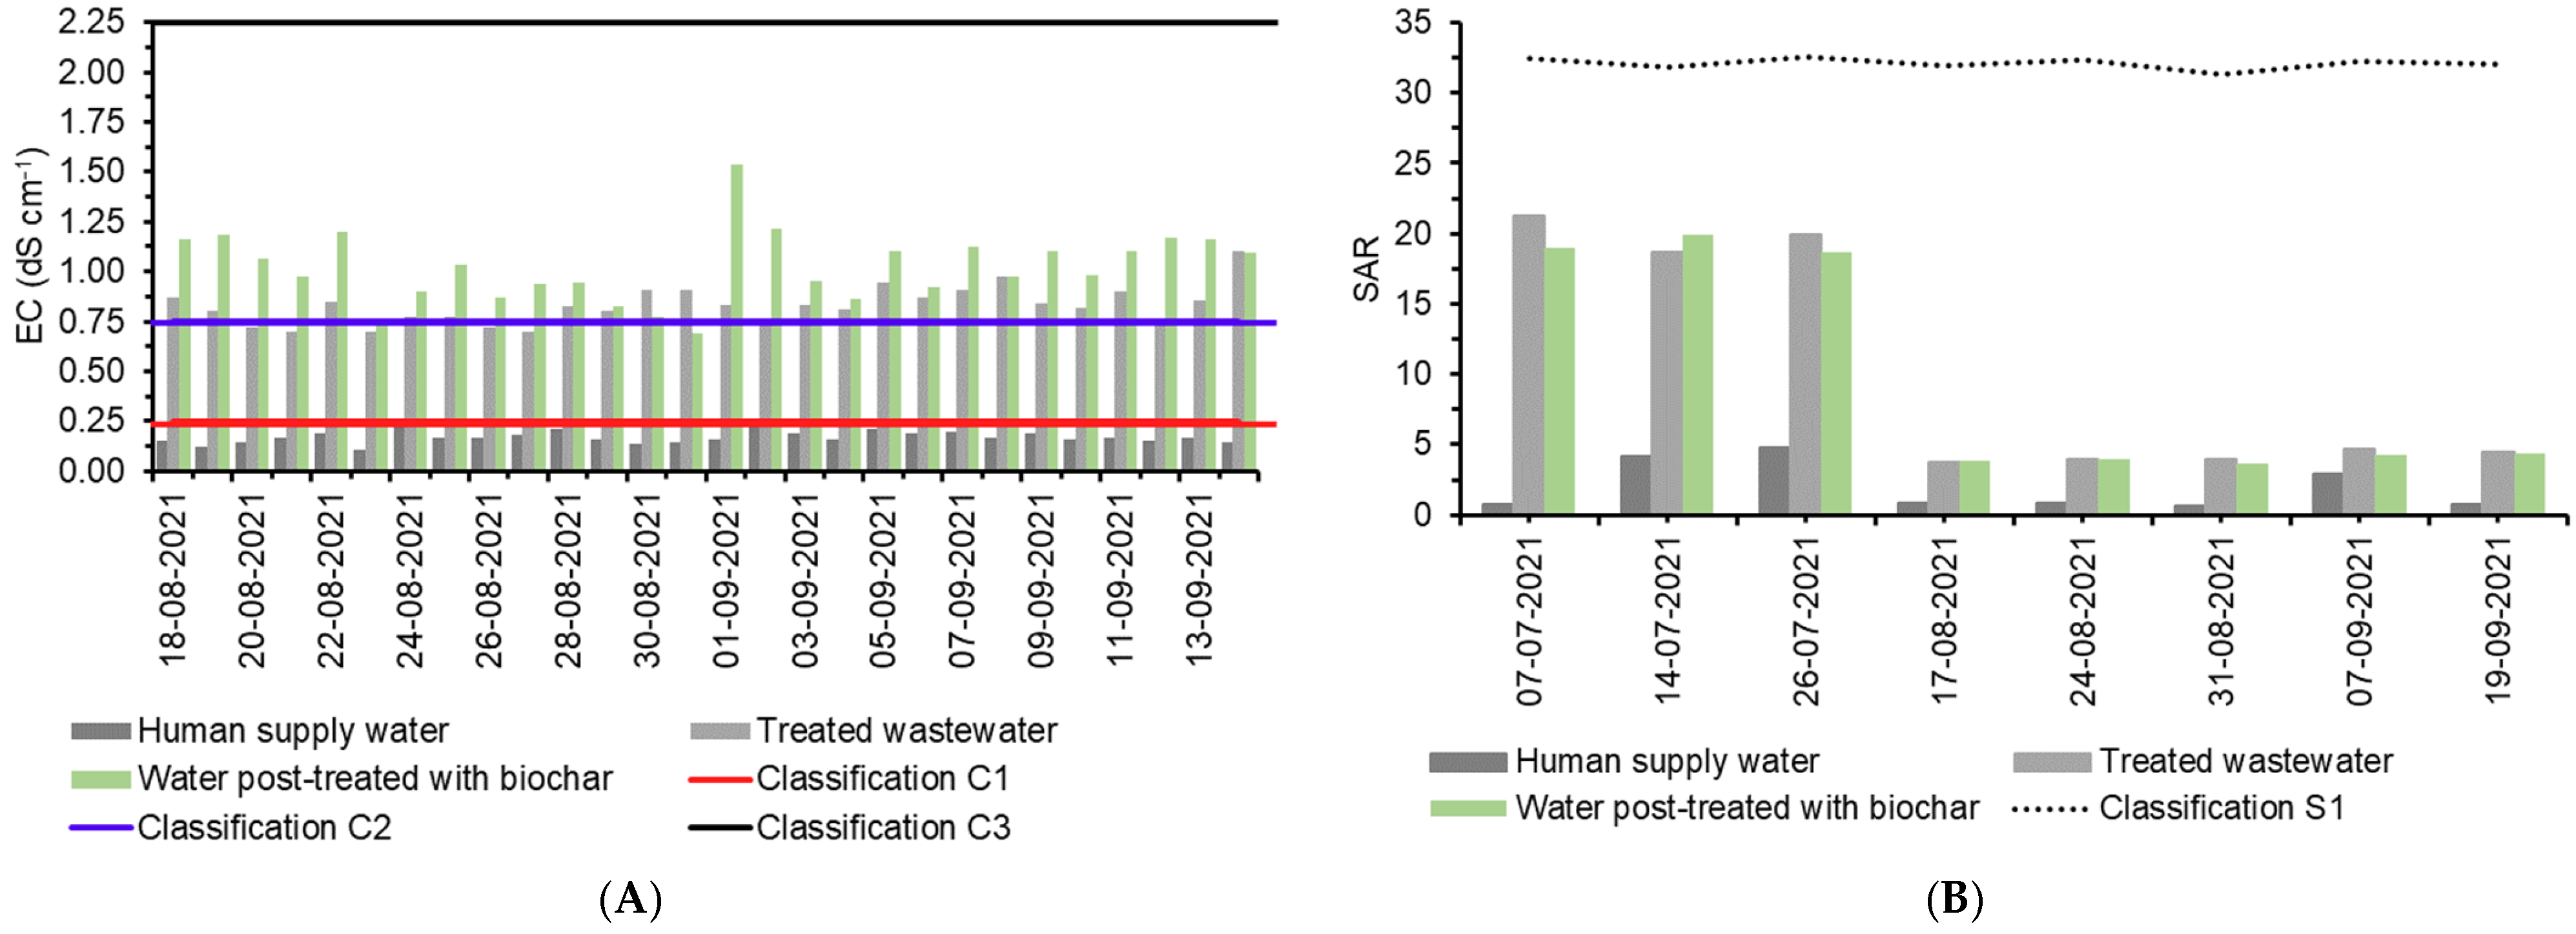
The classification of water sources for irrigation was performed following the model proposed by the technicians of the United States Salinity Laboratory [48]. This model is based on electrical conductivity (EC), as an indicator of the risk of soil salinization, and on the sodium adsorption ratio (SAR), as an indicator of the risk of soil alkalinization or sodification.
Figure 5 shows the EC and SAR values for the different water sources and their classifications regarding the risk of soil salinization and sodification.
In relation to the risk of soil salinization, the human-supply water was classified as C1, considered low-salinity water, and can be used in most crops and soils, with a low probability of causing salinity. On the other hand, the water-sources treated wastewater and water from biochar filtration obtained a C3 classification, considered high-salinity water, and cannot be used in soils with poor drainage. Higher results were already expected in both EC values and their classifications, as these sources had a higher organic matter load than the human-supply water.
Regarding the risk of soil sodification, all three water sources showed an S1 classification, considered water with low sodium concentration. This water can be used in almost all soil types, with little possibility of reaching undesirable levels of exchangeable sodium. Santos [49], when using domestic effluent that served as a nutritional input for okra irrigation, observed increasing sodium values in the soil. It is believed that the prolonged use of this water source in the same soil will cause its sodification, resulting in an unbalanced nutritional and structural balance.
Bernardo et al. [48] state that it is possible to use in irrigation some waters classified as “dubious”. For this, the authors report the need for good irrigation management, using leaching fractions and appropriate correctives. In this way, it is possible to achieve success with the use of lower quality waters in agriculture.

3.3. Soil

After the end of each cultivation cycle, the chemical characteristics of the soil with irrigation depth equivalent to 100% ETc were determined, in order to check the possible changes that occurred after the application of the different water sources and fertilizers. A summary of the analysis of variance is presented in Table 2. It is possible to observe the effects caused on the soil subjected to prolonged application of the treatments.
Soil pH is an important index, as it can interfere with the availability of nutrients to plants. According to Table 2, soil pH was not altered by the different water sources and fertilizers. Similar results were found by Urbano et al. [13,17] and Chaganti et al. [50]. According to Puissant et al. [51], pH is a parameter that characterizes the level of acidity or alkalinity of a solution or dispersion and, in the case of the soil, the pH range considered normal is from 5.0 to 7.0. Lettuce does not develop properly in soils with acid reactions (pH < 5.5) and in highly alkaline soils [52]. Nunes [53] determines that the ideal for lettuce cultivation is that the pH is within the range from 6.0 to 6.8.
The associations of different water sources and fertilizers also had no effect on the organic matter (OM), CEC, potassium and ESP of the soil (Table 3). According to Crespo et al. [54], OM is key to increasing soil CEC and providing nutrients such as nitrogen, phosphorus and sulfur for plant nutrition. Velescu et al. [55] define CEC as the soil’s ability to store nutrients such as calcium, potassium and magnesium for plants. According to Pedrero et al. [56], the addition of OM favors physical attributes of the soil, such as density, aggregate stability and total porosity, favoring adequate leaching and preventing its degradation due to the accumulation of salts.
Although it was not affected by the treatments, the increase in soil ESP has been frequently reported by studies using treated effluents in irrigation, probably due to the concentration of sodium in water [57]. Urbano et al. [17] observed that, after five cycles of lettuce cultivation under irrigation with wastewater, the physical properties of an Oxisol did not change. The wastewater used in the abovementioned study had a mild-to-moderate risk of salinity for irrigation and, consequently, increased the ESP in the soil and the sodium concentration.
Electrical conductivity (EC) represents the content of mineral salts in the soil. Table 2 shows higher EC values in the soils of T4 and T5 treatments. These, in addition to having been irrigated with nutrient-rich water sources, received input from the top-dressing fertilization. According to Bernardo et al. [48], the lettuce crop has a tolerance of 1.3 dS m−1 at 25 °C of EC of soil-saturation extract, to achieve the potential production of 100%, and a tolerance of 2.1 dS m−1 at 25 °C, for the production to reach 90%. The results prove that the treatments irrigated with the water sources, without the need for the input from top-dressing fertilization, have the potential to reach their maximum production.
Erel et al. [58] state that effluents have higher salt concentrations than fresh water and that these concentrations may be high enough to compromise plant growth and degrade soil quality. Awedat et al. [59] add that soil salinity and sodicity tend to accumulate throughout the soil profile. However, Zalacáin et al. [60] found that soil salinization, over 5 years of irrigation research, did not occur in the plots irrigated with treated wastewater, and that the park irrigated with treated wastewater for 15 years showed only a slight salinization of the soil.
In relation to sodium, according to Table 2, higher values were obtained in treatments irrigated with treated wastewater and STP water that passed through the filtration system, especially those that also received nutritional input from the top-dressing fertilization. Libutti et al. [61], working with wastewater sources, found similar results: lower values in the plots irrigated with drinking water.
Potassium and sodium are chemical elements found at relatively high concentrations in wastewater from the urban environment [57]. For being clay dispersants, when effluents are disposed of in inadequate ways, they can cause the destruction of soil macropores. Consequently, physical problems will appear, such as those associated with aeration, water infiltration and root penetration [62].
The soils of all treatments were classified as normal (Table 2) regarding their salinity. According to Bernardo et al. [48], saline soils are those with an electrical conductivity of the saturated soil solution that is greater than 4 dS m−1 at 25 °C, with ESP of less than 15% and pH usually below 8.5. Moreover, according to the authors, the main problems of salinization, occurring in the soils of the country, arose in irrigation projects, especially in public projects carried out in the “Polygon of Drought”, and are not directly related to the quality of water used for irrigation. The authors blame the lack of drainage combined with the low efficiency of the surface irrigation carried out in most projects.

3.4. Agronomic Characteristics of Lettuce

In this topic, the results of the agronomic characteristics of the lettuce crop will be discussed. Several studies have widely reported the advantages of reusing treated wastewater in agriculture [13,63,64,65]. Nutrients present in wastewater such as nitrogen, phosphorus and potassium may reduce the need for complementary mineral compounds. In addition, it may increase the concentrations of some elements (Ca, B, Fe, Cu, Zn and Mn) that are essential for the growth and development of crops [13,66,67]. Urbano et al. [13], when comparing the characteristics between drinking water and wastewater, observed that the concentrations of sodium, calcium, nitrogen, potassium and phosphorus in wastewater were at least 200% higher than the concentrations of the same nutrients in drinking water.
The results of the present study indicated the continuity of the nutritional input from wastewater, even after filtration with biochar, and its use, with no need for top-dressing fertilization for the development of crops. A summary of the analysis of variance and test of means are presented in Table 3.
There were simple effects of irrigation depths and water sources with fertilization on the shoot fresh mass and shoot dry mass of lettuce plants in cycle 1. In cycle 2, there was an interaction between the factors for these variables. According to the data presented in Table 3, in cycles 1 and 2, shoot fresh mass and shoot dry mass showed higher means in the treatment irrigated with the effluent that passed through the filtration system and did not require top-dressing fertilization (T3). When irrigated with the depth corresponding to 125% ETc, the treatments irrigated with the two nutrient-rich water sources and those that received top-dressing fertilization (T4 and T5) also stood out. When irrigation was performed with the depth corresponding to 150% ETc, there was no difference in these variables between the treatments in cycle 2.
Dry mass is the product of the material that has lost all its moisture after going through the drying process and physiologically characterizes the evolution of the plant throughout its development cycle. The results presented prove that the nutritional value of filtered water satisfactorily met the physiological growth of crops, without the need for using top-dressing fertilization. Urbano et al. [13], Urbano et al. [68] and Sandri et al. [69], when irrigating the lettuce crop with wastewater, verified higher means of fresh mass compared to plants irrigated with supply water.
Faccioli et al. [70] and Dantas et al. [71] found similar results in their studies, growing two varieties of cowpea and radish, respectively. These authors used the same water sources, human-supply water and treated wastewater, as this experiment and found no significant differences at 5% probability level by Tukey’s test for shoot dry mass and plant height.
Regarding the number of leaves, no simple or interaction effects were observed, and a mean value of 49 un pl−1 was obtained in the first lettuce cultivation cycle. In the second cycle, there were simple effects of irrigation depths and water sources and fertilization on the number of leaves of the crop. T3 had a higher mean than T1, while the other treatments showed no difference. Ramos [72], after irrigating cabbage with wastewater from the same STP, found that the means of the number of leaves were higher than those found in plants irrigated with human-supply water. A similar result was found by Amori et al. [73], who grew lettuce.
For water-use productivity, the analysis of variance showed simple effect of water sources and fertilization in cycle 1 and interaction between irrigation depths and water sources in cycle 2 of lettuce. According to the test of means, it was observed in cycle 1 that T2 had higher mean compared to T1, and the other treatments did not differ from any of them. In cycle 2, regardless of the irrigation depth, T3 had the highest means.
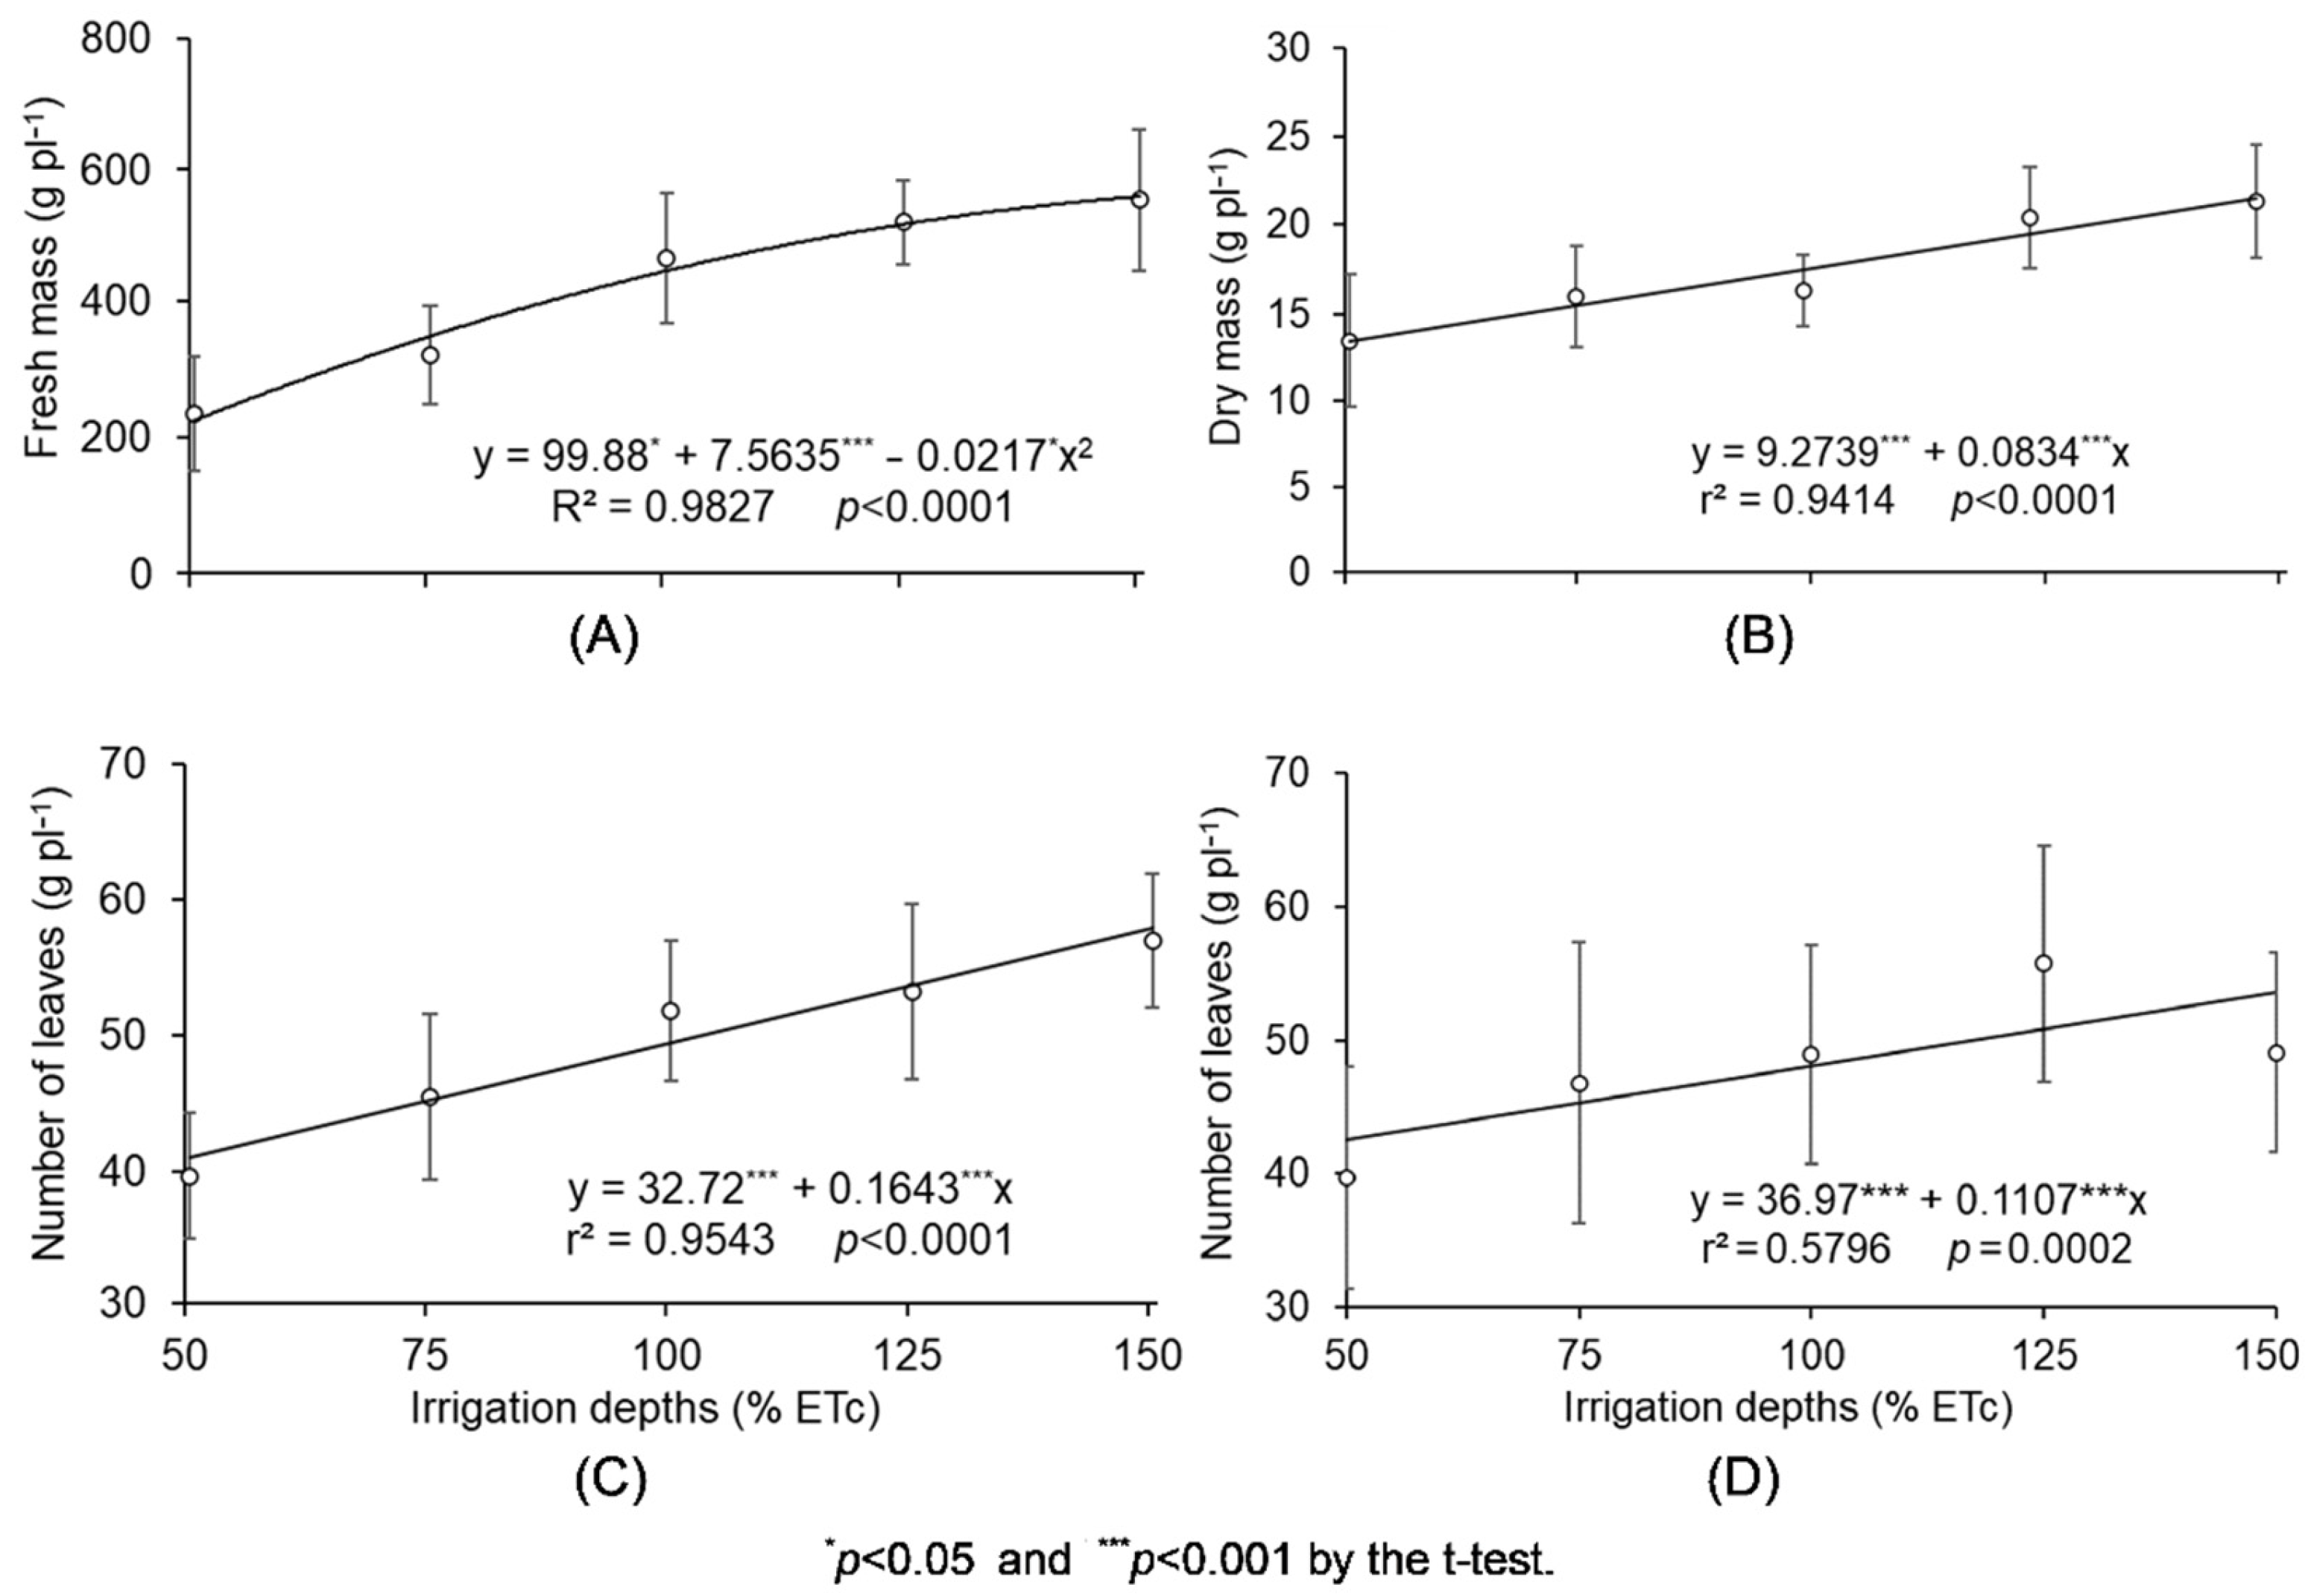
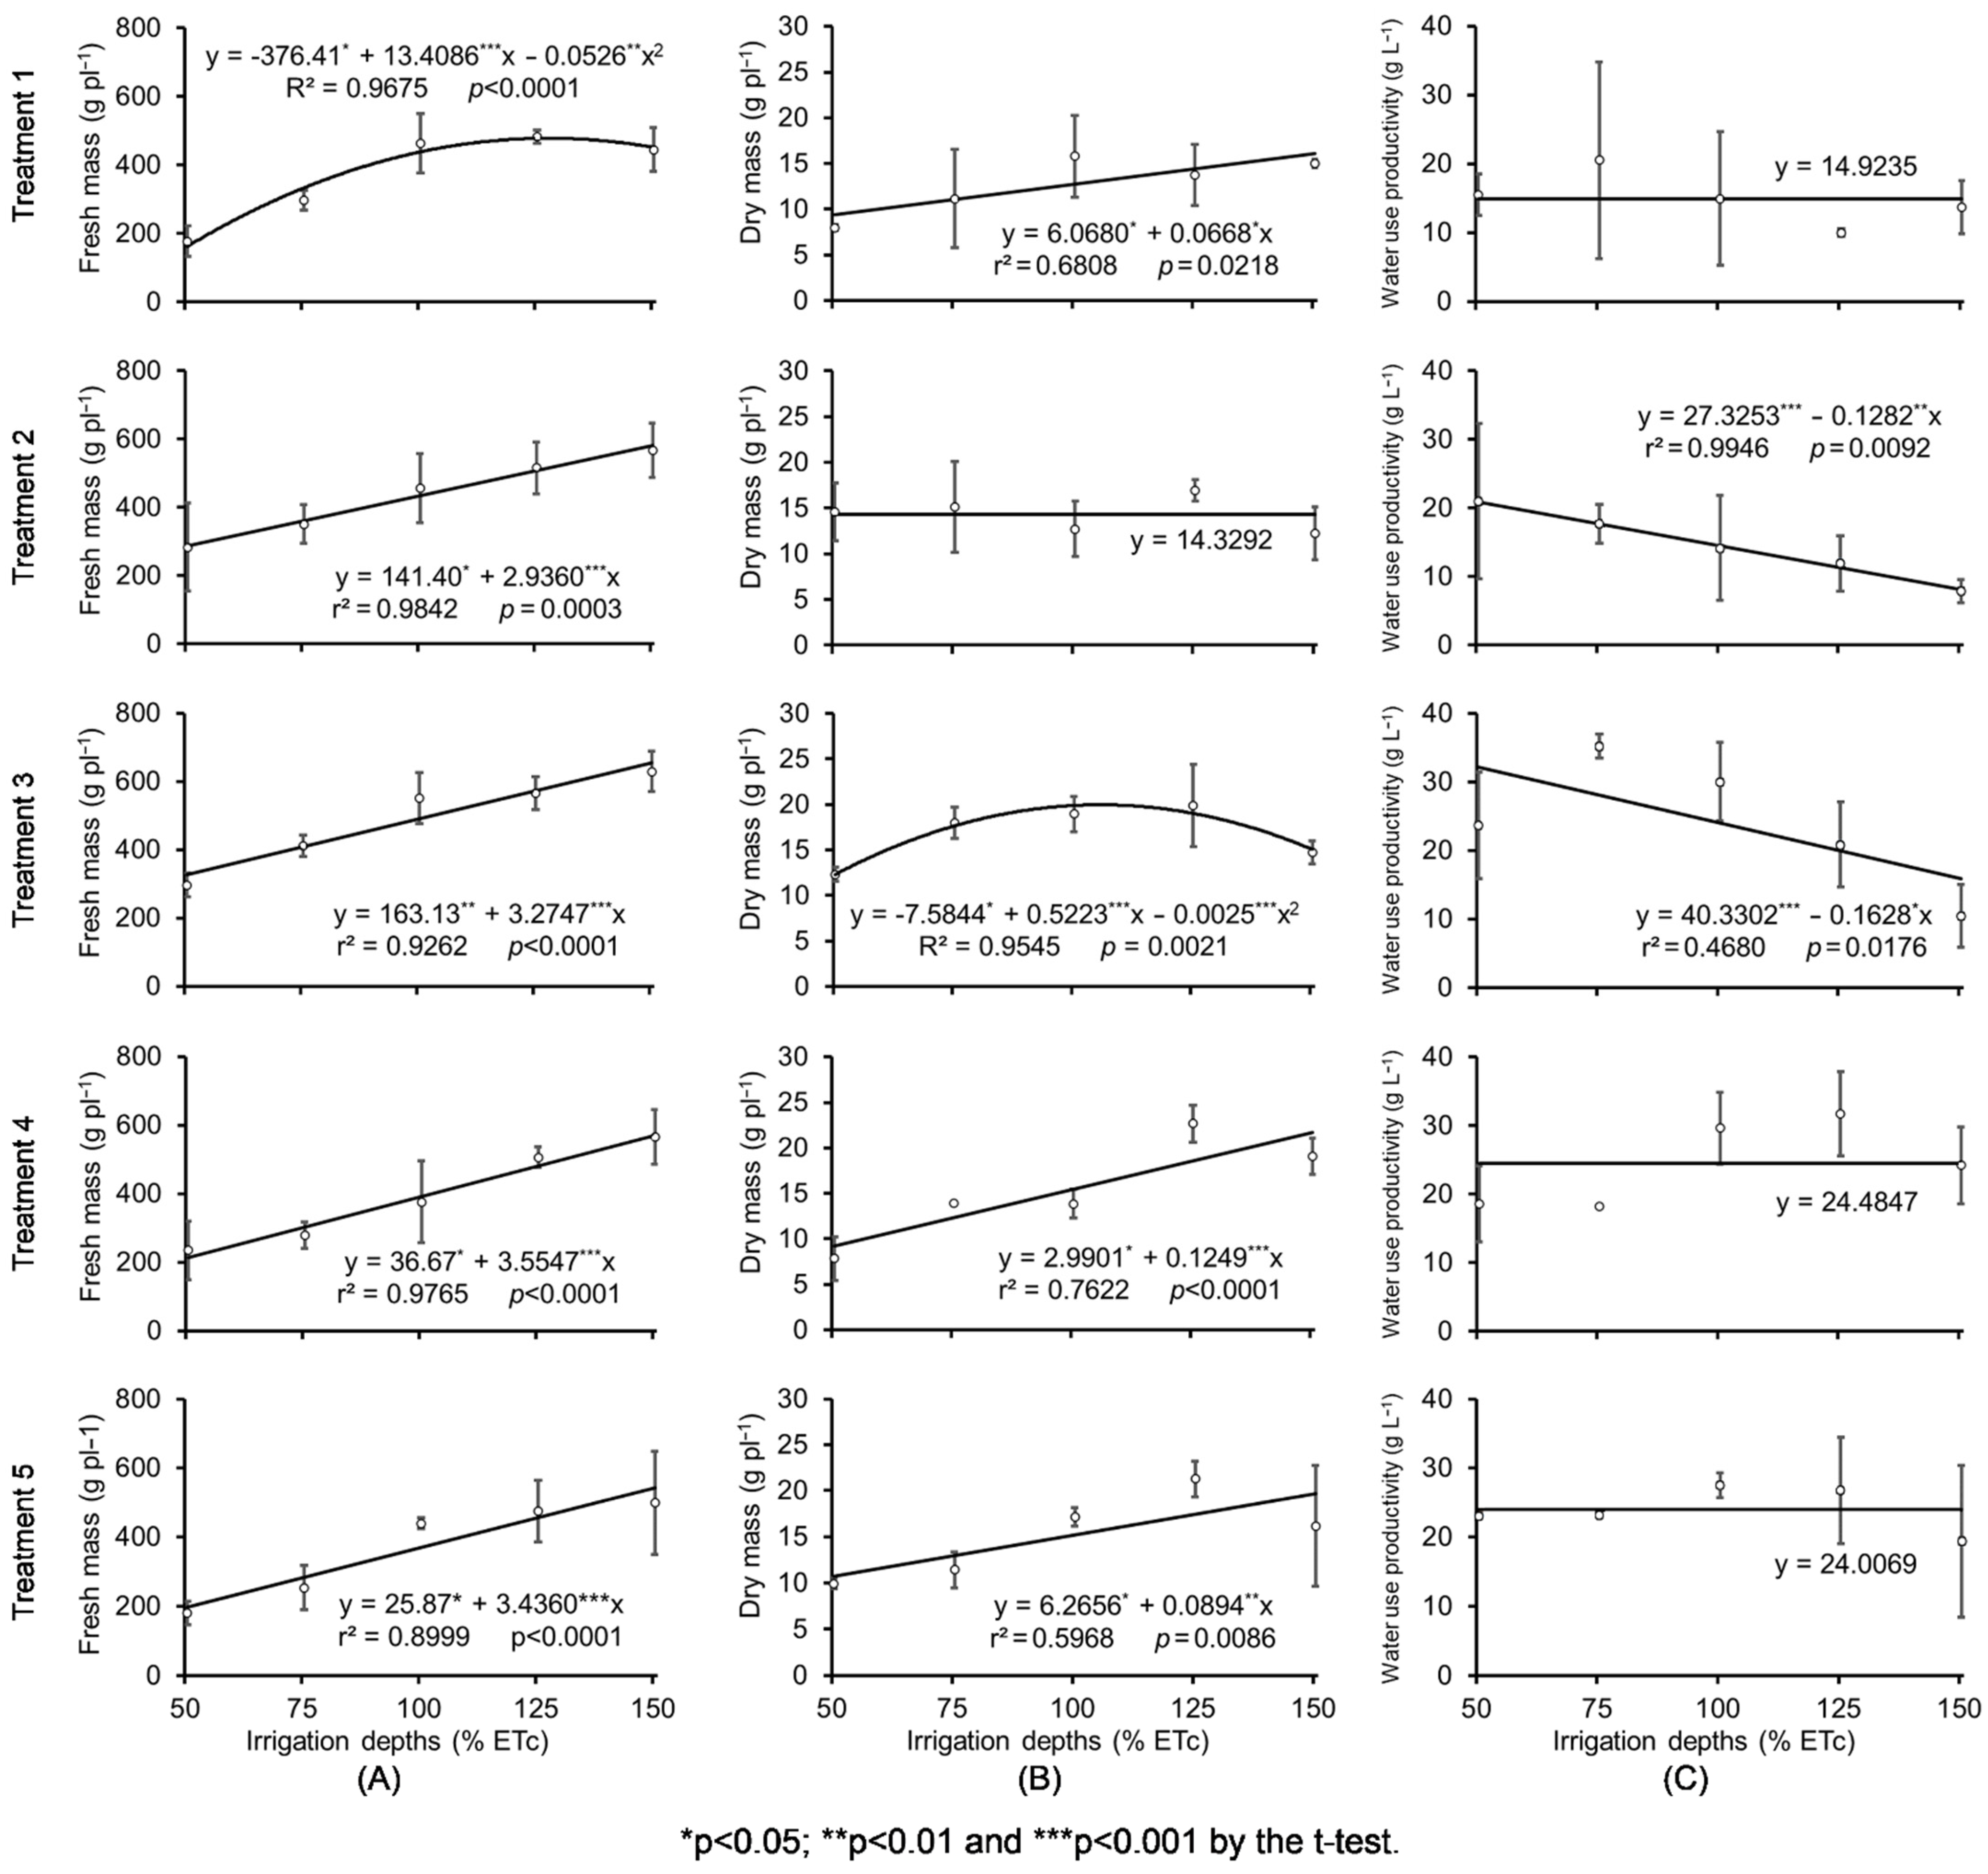
Regarding the responses of the variables evaluated to the irrigation depths, Figure 6A shows that the shoot fresh mass of lettuce was quadratically affected in cycle 1. According to the fit regression equation, the irrigation depths promoted an increase in this variable from 50% to 150% ETc. In cycle 2, the irrigation depths also caused a quadratic effect on shoot fresh mass when human-supply water and fertilization was used (T1) (Figure 6A). According to the regression equation, the irrigation depth of 127% ETc promoted the highest fresh mass, resulting in an approximate value of 478 g pl−1. For the other water sources (Figure 6A), the irrigation depths had a positive linear effect: the increase in irrigation depths promoted increments in lettuce shoot fresh mass.
The literature disagrees, regarding the effect of irrigation depths on the shoot fresh mass of lettuce crop. Guimarães et al. [74] applied irrigation depths between 50% and 125% ETc and verified quadratic effect on different varieties of lettuce. The authors observed that the irrigation depth for replacement of 100% ETc was the one that maximized the values of the fresh biomass of the different lettuce varieties. Magalhães et al. [75] studied different varieties of lettuce and also applied different irrigation depths, between 50% and 125% ETc, and verified a positive linear effect on the shoot fresh mass of lettuce.
For the shoot dry mass of lettuce in the first cultivation cycle, the irrigation depths had a positive linear effect (Figure 6B). In relation to cycle 2, this same effect was observed for treatments 1, 4 and 5 (Figure 7B). For lettuce fertigated with wastewater (T2), it was not possible to fit a regression model. On the other hand, for the treatment fertigated with treated wastewater from biochar filtration, it was found that the irrigation depths had a quadratic effect on the shoot dry mass. According to the fit regression equation, the irrigation depth of 104% maximized the shoot dry mass, resulting in the value of 19.7 g pl−1.
Regardless of the cultivation cycle, the irrigation depths promoted a linear increase in the number of lettuce leaves (Figure 6C,D). Magalhães et al. [75], working with the Rapids and Mônica varieties, also verified that the irrigation depths between 50% and 125% ETc promoted an increase in the number of leaves of lettuce.
In cycle 1, the irrigation depths had no effect on the water-use productivity of lettuce (Table 4). In cycle 2 (Figure 7C), it was not possible to fit a regression model to the data for treatments T1, T4 and T5. In the treatments that received only wastewater, without complementation of fertilization (T2 and T3), the irrigation depths caused a negative linear effect.
In relation to the reduction in water productivity as a function of the increase in irrigation depth, this possibly occurred because the increase in the volume of water supplied in lettuce cultivation was not accompanied by biomass increments at the same intensity. It should be noted that water productivity is directly proportional to biomass yield and inversely proportional to irrigation depth. Guimarães et al. [74] and Magalhães et al. [75] corroborate the results obtained. These authors also verified that the increase in irrigation depths caused a linear reduction in water productivity in different lettuce varieties.

3.5. Microbiological Characteristics of Lettuce

The microbiological characteristics analyzed were Salmonella sp. and coliforms at 45 °C. Samples of lettuce from each plot were taken to the ITPS microbiology laboratory for analysis. The results obtained were compared with the microbiological sanitary standards for food of Resolution-RDC No. 12, of 2 January 2001, of the National Health Surveillance Agency (ANVISA) [44], which presents in Annex I the “Microbiological Sanitary Standards for Food”. Table 4 shows the results of the analyses.
Resolution-RDC No. 12, of 2 January 2001 [44], refers to “coliforms at 45 °C” as equivalent to “coliforms of fecal origin” and “thermotolerant coliforms”. It recommends the absence of Salmonella sp. in 25 g and the maximum population of 102 PMN g−1 of thermotolerant coliforms for “fresh vegetables, whole, selected or not, with the exception of mushrooms”.
Table 4 shows the presence of 9.2 MPN g−1 of coliforms at 45 °C g−1 only in the T1 treatment of cycle 2, a result that may have been caused by an incorrect procedure during irrigation management. However, all results are within the microbiological standards established by the resolution. As in the coliform population, the results for Salmonella sp. are within the microbiological standards of the resolution, as its presence was not detected in lettuce plants. Thus, it is possible to affirm that the water sources of the present study did not interfere in the microbiological characteristics of lettuce.
It is worth mentioning that while the wastewater exceeded the minimum limit of total coliforms (Figure 4) this did not interfere in the results of coliforms present in the plant. Considering only the problems caused in the plant, it is suggested that the minimum accepted limit for coliforms present in irrigation water can be increased, since values up to 106 MPN 100 mL−1 were not sufficient to cause contamination in lettuce crop.
Corroborating this result, studies that used the same source of treated wastewater, such as those of Ramos [72] with irrigation of cabbage and Faccioli et al. [70] with irrigation of two varieties of cowpea, reported results for coliforms and Salmonella sp. within the acceptable microbiological standards of Resolution-RDC No. 12, of 2 January 2001, of the National Health Surveillance Agency (ANVISA) [44]. Similar results were also found by Dantas [76] for the irrigation of carrots and beets, Dantas et al. [71] for the irrigation of radish and Carvalho et al. [77] for the irrigation of sunflower.
Souza et al. [78] concluded that the quality of wastewater is suitable for use in the fertigation of agricultural crops. However, the sprinkler irrigation method was not recommended, only the drip irrigation method, in order to avoid contamination by pathogens and monitor soil salinity, due to the high concentration of sodium in the effluent. It is important to warn that in large-scale production, wastewater can splash on the leaves. Thus, strict quality control measures must be taken for human consumption. Lettuce must be cleaned after harvest to ensure food safety.
It is worth noting that wastewater has a higher density than human-supply water, which can cause clogging of the filters and labyrinths of the drippers. Further studies are recommended to perform drip irrigation properly. Evaluation of crops with longer cultivation cycle and studies with more replicates are also recommended. Future studies using the same conditions as those of this study in the field are encouraged.

3.6. Characterization of Biochar

3.6.1. SEM Analyses

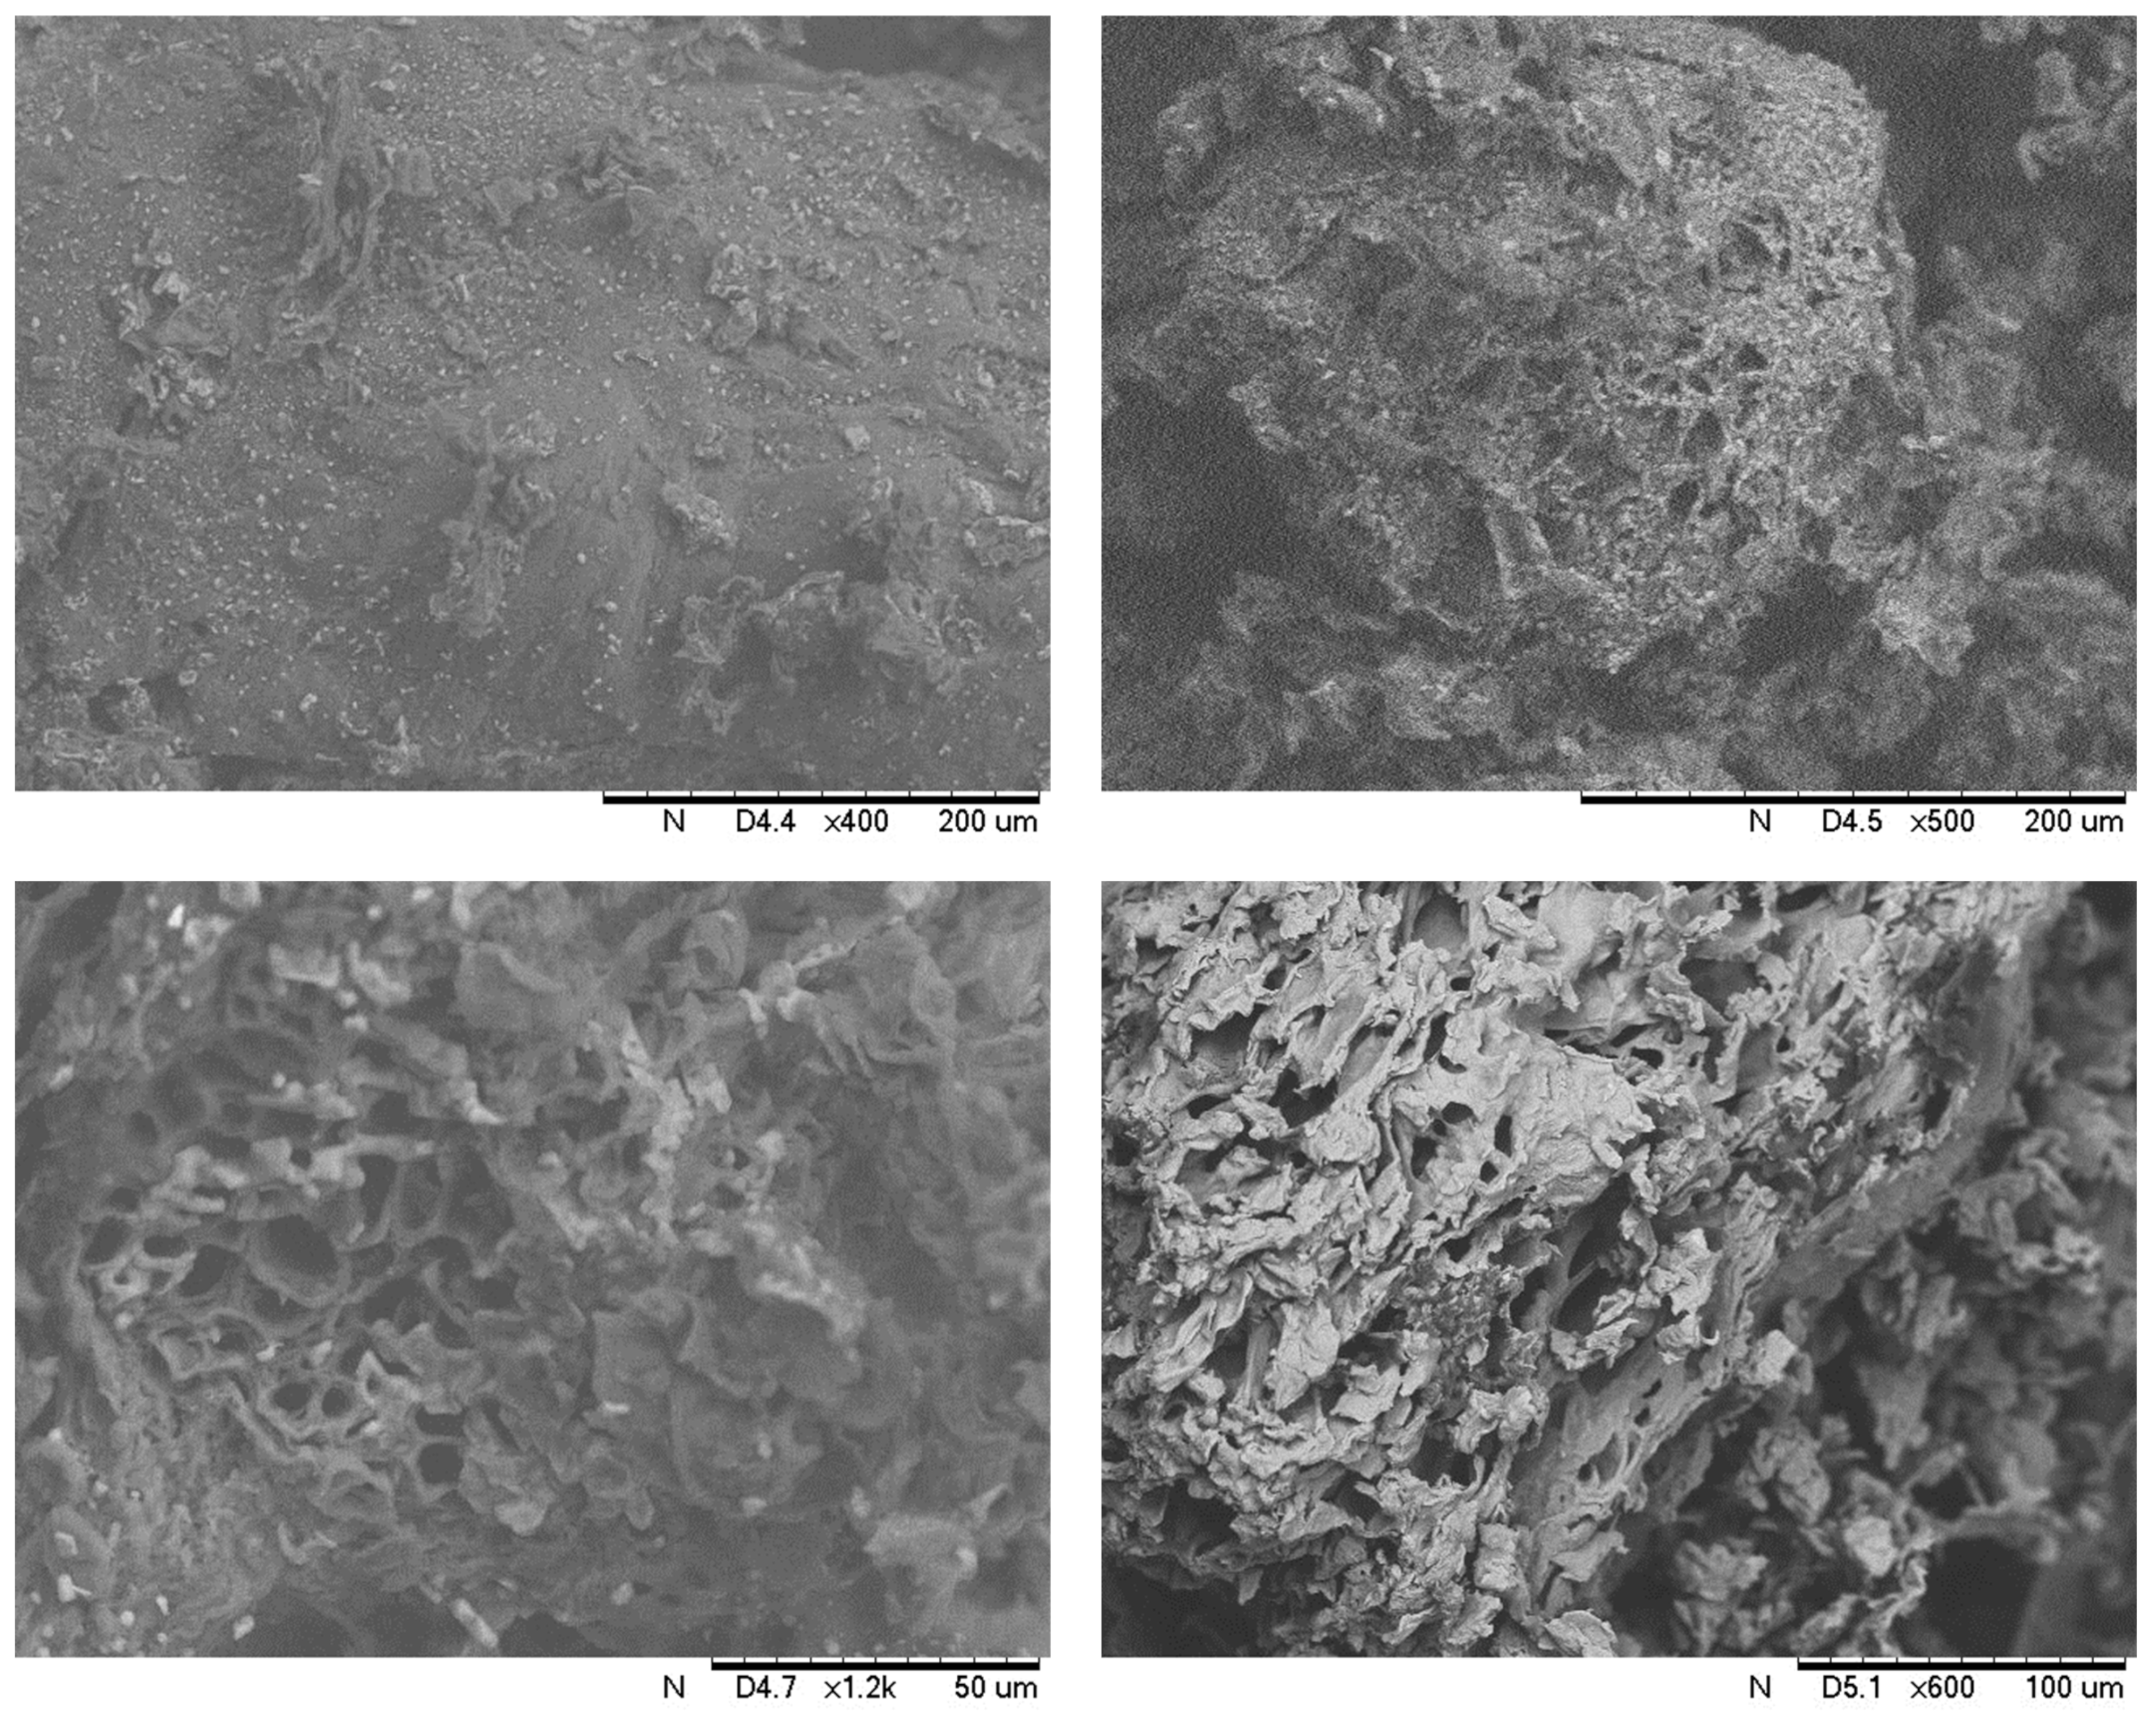
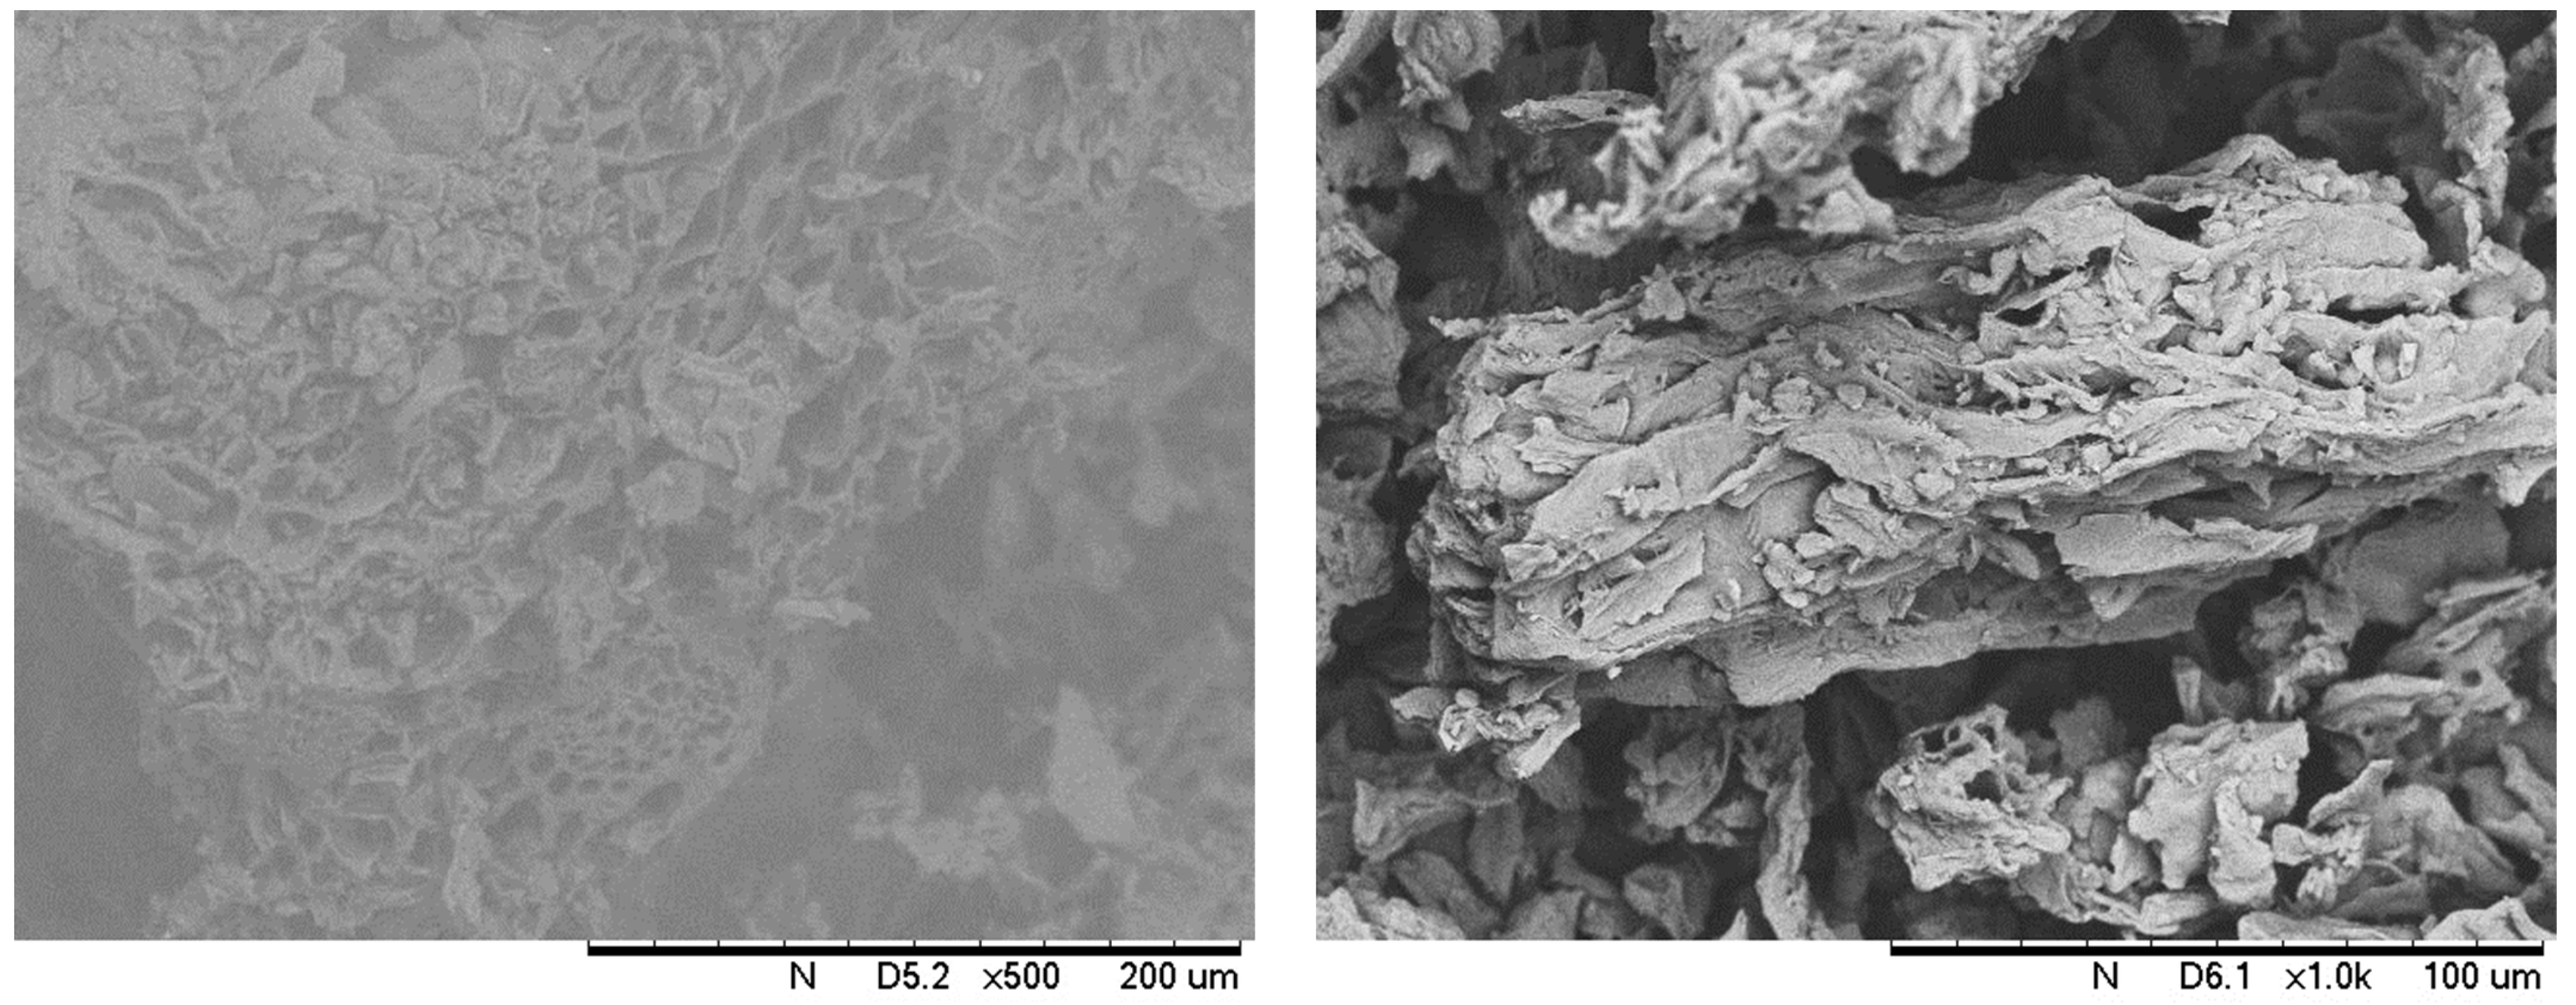
In the analysis by scanning electron microscopy (SEM), it was possible to compare the morphological alteration of the fresh orange pomace biochar (Figure 8), with the biochar after use as a filter element (Figure 9). Fresh biochar proved to be a porous, fibrous and heterogeneous material. It is also possible to verify the presence of ash and that its structure is composed of channels and particles with deep, rounded and open cavities. According to Carvalho [41], the structure presents itself in this way due to the release of volatile matter. This effect may be related to the existence of some mineral material that causes increased disintegration of biochar particles.
In the observation of biochar after use as a filter element, it is possible to verify a more filled, homogeneous and, apparently, more compact surface. It is also possible to notice that the ash has been solubilized and that its channels are less deep.

3.6.2. Thermogravimetric Analyses

Thermogravimetry is the most effective technique for optimizing pyrolysis temperature. It also provides a notion of moisture content, volatile matter and composition. Biomass is composed mainly of cellulose, hemicellulose and lignin. Each element of biomass has a unique thermal decomposition range that affects pyrolysis.
During the biomass pyrolysis process several stages that cause the loss of mass occur. The first stage corresponds to the evaporation of water, and the others correspond to the thermal degradation of the different organic compounds of biomass (cellulose, hemicellulose, lignin and pectin) [79,80]. It is noteworthy that, in thermogravimetric analyses, the overlap of the mentioned stages should be considered.
Table 5 shows the interaction of temperature intervals with the stages of the biomass pyrolysis process.
In Figure 10A, which shows the TGA and DrTGA of the fresh orange pomace biochar, when considering Table 5, it is possible to observe three phases in the pyrolysis process of the material. In the first phase, a mass loss of 9% was detected in the temperature range up to 180 °C. This phase comprises the degradation of fresh biochar, due to the evaporation of water and molecules of lower molecular weight, and initiates the decomposition of hemicellulose. When the temperature approached 150 °C, the mass loss of the biomass was very small, and most of the water had already been removed. In the second phase, a mass loss of 11% was detected in the temperature range between 180 °C and 480 °C. This phase comprises the decomposition of hemicellulose, cellulose and lignin. The mass loss remained low until reaching the temperature of 250 °C and increased considerably until the end of this phase at 480 °C. Finally, in the third phase of biomass pyrolysis, which was detected in the temperature range between 480 and 600 °C, there was a mass loss of more than 9%, and pectin was degraded together with lignin. At the end of the whole process, a residual mass of approximately 72% was found.
Analyzing Figure 10B, which presents the TGA and DrTGA of the biochar after use as a filter element, when considering Table 5, two phases were observed in the pyrolysis process of the material. In the first phase, a mass loss of 6% was detected in the temperature range up to 90 °C. In the second phase, mass loss of 13% was detected in the temperature range between 90 °C and 600 °C, which comprises the decomposition of hemicellulose, cellulose, lignin and pectin. At the end of the whole process, a residual mass of approximately 81% was found.
The results show that fresh biochar has greater sensitivity to thermal degradation, leading to more individual stages of decomposition; possibly, after use as a filter element, the biochar goes through a degradation process.

4. Conclusions

The results of this study indicated that fertigation using treated effluents may be an alternative for short-cycle crops in irrigated agriculture. This strategy should be used mainly in regions with water scarcity, with the benefit of increasing nutrients in the soil and increasing crop yield, with no need for top-dressing fertilization.
The use of biochar as an adsorbent material in the filtration process improved the microbiological quality of wastewater.
In general, irrigation with wastewater did not significantly modify the soil’s macronutrient contents. However, significantly higher sodium contents were observed in soils irrigated with treated wastewater and STP water that passed through the filtration system, although the soil of all treatments was classified as normal in terms of salinity.
Fertigation using STP water that passed through the filtration system led to the highest means of fresh mass, dry mass and number of leaves in the cultivated plants, with no need for top-dressing fertilization.
Lettuce leaves produced during the experiment are acceptable for human consumption, since the absence of Salmonella sp. was found in all treatments, and the maximum coliform population of all treatments complies with the limit established by Resolution-RDC No. 12, of 2 January 2001, of the National Health Surveillance Agency (ANVISA).
For larger-scale production, the researchers suggest strict quality control measures to avoid contamination of the edible parts of the product intended for human consumption. The product must be sanitized after harvesting to ensure food safety.

Author Contributions

Conceptualization: A.M.d.S.S., F.F.d.C. and G.G.F.; methodology: A.M.d.S.S. and G.G.F.; validation: A.M.d.S.S. and G.G.F.; formal analysis: A.M.d.S.S., F.F.d.C. and G.G.F.; investigation: A.M.d.S.S., F.S.S. and K.V.S.; resources: F.F.d.C. and G.G.F.; data curation: A.M.d.S.S., F.S.S. and K.V.S.; writing—original draft preparation: A.M.d.S.S., F.F.d.C. and G.G.F.; writing—review and editing: A.M.d.S.S., F.F.d.C. and G.G.F.; visualization: A.M.d.S.S., F.F.d.C. and G.G.F.; supervision: F.F.d.C. and G.G.F.; project administration: F.F.d.C.; funding acquisition: F.F.d.C. and G.G.F. All authors have read and agreed to the published version of the manuscript.

Funding

This study was funded by the Coordination for the Improvement of Higher Education Personnel—Brazil (CAPES—Funding Code 001).

Institutional Review Board Statement

Not applicable.

Informed Consent Statement

Not applicable.

Data Availability Statement

Not applicable.

Conflicts of Interest

The authors declare no conflict of interest.

Nomenclature

The following abbreviations are used in this manuscript:
ANOVAanalysis of variance
ANVISAnational health surveillance agency
BODbiochemical oxygen demand
BSEbackscattered electrons
BWpost-treated water by the adsorption process
CECcation exchange capacity
CONAMAnational environment council
DEAdepartment of agronomic engineering
DESOSergipe Basic Sanitation Company
DOdissolved oxygen
DrTGAderives from the thermogravimetric curve
DWdrinking water for human supply
ECelectrical conductivity
ESPexchangeable sodium percentage
ETccrop evapotranspiration
FCfield capacity
ITPSInstitute of Technology and Research of the state of Sergipe
OMorganic matter
PLANTpresplant mass on the present day
PLANTprevplant mass on the previous day
POTapot mass at actual moisture
POTFCpot mass at field capacity
PWPpermanent wilting point
RBDrandomized block design
SARsodium adsorption ratio
SEfederal state of Sergipe
SEMscanning electron microscopy
STPsewage treatment plant
TGAthermogravimetric curve
TWtreated wastewater by a biological process
UFSFederal University of Sergipe

References

  1. Harken, B.; Chang, C.; Dietrich, P.; Kalbacher, T.; Rubin, Y. Hydrogeological modeling and water resources management: Improving the link between data, prediction, and decision making. Water Resour. Res. 2019, 55, 10340–10357. [Google Scholar] [CrossRef]
  2. Liu, J.; Engel, B.A.; Dai, L.; Wang, Y.; Wu, Y.; Yan, G.; Cong, L.; Zhai, J.; Zhang, Z.; Zhang, M. Capturing hydrological connectivity structure of wetlands with indices based on graph theory: A case study in Yellow River Delta. J. Clean. Prod. 2019, 239, 118059. [Google Scholar] [CrossRef]
  3. Li, P.; Ren, L. Evaluating the saline water irrigation schemes using a distributed agro-hydrological model. J. Hydrol. 2021, 594, 125688. [Google Scholar] [CrossRef]
  4. FAO. Water for Sustainable Food and Agriculture: A Report Produced for the G20 Presidency of Germany; Food and Agriculture Organization of the United Nations: Rome, Italy, 2017; 33p, Available online: https://www.fao.org/3/i7959e/i7959e.pdf (accessed on 1 October 2022).
  5. Velasco-Muñoz, J.F.; Aznar-Sánchez, J.A.; Batlles-dela Fuente, A.; Fidelibus, M.D. Sustainable irrigation in agriculture: An analysis of global research. Water 2019, 11, 1758. [Google Scholar] [CrossRef] [Green Version]
  6. United Nations the Sustainable Development Goals Report. Department of Economic and Social Affairs. Available online: https://unstats.un.org/sdgs/report/2017 (accessed on 14 April 2022).
  7. World Bank Water Resources Management. Available online: https://www.worldbank.org/en/topic/waterresourcesmanagement#1 (accessed on 15 April 2022).
  8. Nazari, B.; Liaghat, A.; Akbari, M.R.; Keshavarz, M. Irrigation water management in Iran: Implications for water use efficiency improvement. Agric. Water Manag. 2018, 208, 7–18. [Google Scholar] [CrossRef]
  9. FAO Production/Yield Quantities of Lettuce and Chicory in World + (Total). 2018. Available online: http://www.fao.org/faostat/en/#data/QC/visualize (accessed on 15 April 2022).
  10. Ceuppens, S.; Hessel, C.T.; Rodrigues, R.Q.; Bartz, S.; Tondo, E.C.; Uyttendaele, M. Microbiological quality and safety assessment of lettuce production in Brazil. Int. J. Food Microbiol. 2014, 181, 67–76. [Google Scholar] [CrossRef]
  11. Moura, L.O.; Carlos, L.A.; Oliveira, K.G.; Martins, L.M.; Silva, E.C. Physicochemical characteristics of purple lettuce harvested at different ages. Caatinga 2016, 29, 489–495. [Google Scholar] [CrossRef]
  12. Egbuikwem, P.N.; Mierzwa, J.C.; Saroj, D.P. Assessment of suspended growth biological process for treatment and reuse of mixed wastewater for irrigation of edible crops under hydroponic conditions. Agric. Water Manag. 2020, 231, 106034. [Google Scholar] [CrossRef]
  13. Urbano, V.R.; Mendonça, T.G.; Bastos, R.G.; Souza, C.F. Effects of treated wastewater irrigation on soil properties and lettuce yield. Agric. Water Manag. 2017, 181, 108–115. [Google Scholar] [CrossRef]
  14. Nagarajan, D.; Lee, D.J.; Chen, C.Y.; Chang, J.-S. Resource recovery from wastewaters using microalgae-based approaches: A circular bioeconomy perspective. Bioresour. Technol. 2020, 302, 122817. [Google Scholar] [CrossRef]
  15. Dragonetti, G.; Khadra, R.; Daccache, A.; Oubelkacem, A.; Choukr-Allah, R.; Lamaddalena, N. Development and application of a predictive model for treated wastewater irrigation management in a Semiarid area. Integr. Environ. Assess. Manag. 2020, 16, 910–919. [Google Scholar] [CrossRef]
  16. Wielemaker, R.C.; Weijma, J.; Zeeman, G. Harvest to harvest: Recovering nutrients with new sanitation systems for reuse in urban agriculture. Resour. Conserv. Recycl. 2018, 128, 426–437. [Google Scholar] [CrossRef] [Green Version]
  17. Urbano, V.R.; Mendonça, T.G.; Bastos, R.G.; Souza, C.F. Physical-chemical effects of irrigation with treated wastewater on dusky red latosol soil. Rev. Ambient. Água 2015, 10, 737–747. [Google Scholar] [CrossRef] [Green Version]
  18. Nunes-Carvalho, M.C.; Jayme, M.M.A.; Carmo, F.L.; Pyrrho, A.S.; Leite, S.G.F.; Araujo, F.V. Influence of different sources of contamination on the microbiological quality of lettuce in the Teresópolis Region, RJ, Brazil. Eng. Sanit. Ambient. 2020, 25, 229–235. [Google Scholar] [CrossRef]
  19. Liu, Y.; Lonappan, L.; Brar, S.K.; Yang, S. Impact of biochar amendment in agricultural soils on the sorption, desorption, and degradation of pesticides: A review. Sci. Total Environ. 2018, 645, 60–70. [Google Scholar] [CrossRef]
  20. Wang, Y.; Sun, Y.; He, T.; Deng, H.; Wang, Z.; Wang, J.; Zheng, X.; Zhou, L.; Zhong, H. Biochar amendment mitigates the health risks of dietary methylmercury exposure from rice consumption in mercury-contaminated areas. Environ. Pollut. 2020, 267, 115547. [Google Scholar] [CrossRef]
  21. Xiang, W.; Zhang, X.; Chen, J.; Zou, W.; He, F.; Hu, X.; Tsang, D.C.W.; Ok, Y.S.; Gao, B. Biochar technology in wastewater treatment: A critical review. Chemosphere 2020, 252, 126539. [Google Scholar] [CrossRef]
  22. Cheng, N.; Wang, B.; Wu, P.; Lee, X.; Xing, Y.; Chen, M.; Gao, B. Adsorption of emerging contaminants from water and wastewater by modified biochar: A review. Environ. Pollut. 2021, 273, 116448. [Google Scholar] [CrossRef]
  23. Wang, F.; Harindintwali, J.D.; Yuan, Z.; Wang, M.; Wang, F.; Li, S.; Yin, Z.; Huang, L.; Fu, Y.; Li, L.; et al. Technologies and perspectives for achieving carbon neutrality. Innovation 2021, 2, 100180. [Google Scholar] [CrossRef]
  24. Erinle, T.J.; Adewole, D.I. Fruit pomaces—Their nutrient and bioactive components, effects on growth and health of poultry species, and possible optimization techniques. Anim. Nutr. 2022, 9, 357–377. [Google Scholar] [CrossRef]
  25. Osorio, L.L.D.R.; Flórez-López, E.; Grande-Tovar, C.D. The Potential of selected agri-food loss and waste to contribute to a circular economy: Applications in the food, cosmetic and pharmaceutical industries. Molecules 2021, 26, 515. [Google Scholar] [CrossRef]
  26. Issaka, E.; Fapohunda, F.O.; Amu-Darko, J.N.O.; Yeboah, L.; Yakubu, S.; Varjani, S.; Ali, N.; Bilal, M. Biochar-based composites for remediation of polluted wastewater and soil environments: Challenges and prospects. Chemosphere 2022, 297, 134163. [Google Scholar] [CrossRef]
  27. Carvalho, L.M.; Carvalho, H.W.L.; Soares Filho, W.S.; Martins, C.R.; Passos, O.S. Porta-enxertos promissores, alternativos ao limoeiro “cravo”, nos tabuleiros costeiros de Sergipe. Pesqui. Agropecu. Bras. 2016, 51, 132–141. [Google Scholar] [CrossRef]
  28. Ait-Mouheb, N.; Mange, A.; Froment, G.; Lequette, K.; Bru-Adan, V.; Maihol, J.; Molle, B.; Wéry, N. Effect of untreated or reclaimed wastewater drip-irrigation for lettuces and leeks on yield, soil and fecal indicators. Environ. Dev. Sustain. 2022, 8, 100053. [Google Scholar] [CrossRef]
  29. Gorfie, B.N.; Tuhar, A.W.; Keraga, A.S.; Woldeyohannes, A.B. Effect of brewery wastewater irrigation on soil characteristics and lettuce (Lactuca sativa) crop in Ethiopia. Agric. Water Manag. 2022, 269, 107633. [Google Scholar] [CrossRef]
  30. Perez-Mercado, L.F.; Lalander, C.; Joel, A.; Ottoson, J.; Iriarte, M.; Vinnerås, B. Managing microbial risks in informal wastewater-irrigated agriculture through irrigation water substitution. Agric. Water Manag. 2022, 269, 107733. [Google Scholar] [CrossRef]
  31. Almeida, S.G.C.; Tarelho, L.A.C.; Hauschild, T.; Costa, M.A.M.; Dussán, K.J. Biochar production from sugarcane biomass using slow pyrolysis: Characterization of the solid fraction. Chem. Eng. Process. 2022, 179, 109054. [Google Scholar] [CrossRef]
  32. Anand, A.; Pathak, S.; Kumar, V.; Kaushal, P. Biochar production from crop residues, its characterization and utilization for electricity generation in India. J. Clean. Prod. 2022, 368, 133074. [Google Scholar] [CrossRef]
  33. Carvalho, R.S.; Arguelho, M.L.P.M.; Faccioli, G.G.; Oliveira, R.A.; Passos, E.S.; Silva, A.V.; Santos, B.F.S. Utilização do biocarvão de bagaço de laranja na remoção de tetraciclina em água residuária. Matéria 2022, 26, e12980. [Google Scholar] [CrossRef]
  34. Gonzaga, M.I.S.; Mackowiak, C.; Almeida, A.Q.; Carvalho Junior, J.I.T.; Andrade, K.R. Positive and negative effects of biochar from coconut husks, orange bagasse and pine wood chips on maize (Zea mays L.) growth and nutrition. Catena 2018, 162, 414–420. [Google Scholar] [CrossRef]
  35. Sahoo, S.S.; Vijay, V.K.; Chandra, R.; Kumar, H. Production and characterization of biochar produced from slow pyrolysis of pigeon pea stalk and bamboo. Clean. Eng. Technol. 2021, 3, 100101. [Google Scholar] [CrossRef]
  36. Hale, L.; Curtis, D.; Azeem, M.; Montgomery, J.; Crowley, D.E.; McGiffen, M.E. Influence of compost and biochar on soil biological properties under turfgrass supplied deficit irrigation. Appl. Soil Ecol. 2021, 168, 104134. [Google Scholar] [CrossRef]
  37. Singh, G.; Mavi, M.S.; Choudhary, O.P.; Gupta, N.; Singh, Y. Rice straw biochar application to soil irrigated with saline water in a cotton-wheat system improves crop performance and soil functionality in north-west India. J. Environ. Manag. 2021, 295, 113277. [Google Scholar] [CrossRef] [PubMed]
  38. Wang, S.; Xia, G.; Zheng, J.; Wang, Y.; Chen, T.; Chi, D.; Bolan, N.S.; Chang, S.X.; Wang, T.; Ok, Y.S. Mulched drip irrigation and biochar application reduce gaseous nitrogen emissions, but increase nitrogen uptake and peanut yield. Sci. Total Environ. 2022, 830, 154753. [Google Scholar] [CrossRef]
  39. Brasil. Resolução No 357, de 17 de Março de 2005; Ministério do Meio Ambiente: Brasília, Brasil, 2005; pp. 1–23.
  40. Brasil. Resolução No 430, de 13 de Maio de 2011; Ministério do Meio Ambiente: Brasília, Brasil, 2011; pp. 1–8.
  41. Carvalho, R.S. Produção e Caracterização de Biocarvão de Bagaço de Laranja Para Utilização no pós-Tratamento de Água residuária. Doutorado em Desenvolvimento e Meio Ambiente; Universidade Federal de Sergipe: São Cristóvão, Brazil, 2018; 149p. [Google Scholar]
  42. Bomfim, L.F.C.; Costa, I.V.G.; Benvenuti, S.M.P. Projeto Cadastro da Infra-Estrutura Hídrica do Nordeste: Estado de Sergipe. Diagnóstico do Município São Cristóvão, 1st ed.; CPRM: Aracaju, Brazil, 2002; p. 13.
  43. DESO. Companhia de Saneamento de Sergipe. Available online: http://www.deso-se.com.br (accessed on 15 April 2022).
  44. Brasil. Resolução de Diretoria Colegiada-RDC No 12, de 02 de Janeiro de 2001; Ministério da Saúde: Brasília, Brasil, 2001; pp. 1–51.
  45. Rice, E.W.; Baird, R.B.; Eaton, A.D. Standard Methods for the Examination of Water and Wastewater, 23rd ed.; APHA: Washington, DC, USA, 2017; ISBN 9780875532875. [Google Scholar]
  46. Guimarães, J.J.; Sousa, F.G.G.; Román, R.M.S.; Dal Pai, A.; Rodrigues, S.A.; Sarnighausen, V.C.R. Effect of irrigation water pH on the agronomic development of hops in protected cultivation. Agric. Water Manag. 2021, 253, 106924. [Google Scholar] [CrossRef]
  47. Mendonça, L.C.; Pinto, A.S.; Sampaio, L.F.S.; Cardoso, L.R. Caracterização e avaliação da ETE Rosa Elze para reúso do efluente. Rev. Bras. Eng. Agric. Ambient. 2005, 9, 143–145. [Google Scholar] [CrossRef]
  48. Bernardo, S.; Mantovani, E.C.; Silva, D.D.; Soares, A.A. Manual de Irrigação, 9th ed.; Editora UFV: Viçosa, MG, Brazil, 2019; 545p, ISBN 9788572696104. [Google Scholar]
  49. Santos, C.K.; Santana, F.S.; Ramos, F.S.M.; Faccioli, G.G.; Gomes Filho, R.R. Impacto do uso de efluentes nas características do solo cultivado com quiabo (Abelmoschus Esculentus L.). Rev. Bras. Agric. Irrig. 2018, 12, 2776–2783. [Google Scholar] [CrossRef]
  50. Chaganti, V.N.; Ganjegunte, G.; Niu, G.; Ulery, A.; Flynn, R.; Enciso, J.M.; Meki, M.N.; Kiniry, J.R. Effects of treated urban wastewater irrigation on bioenergy sorghum and soil quality. Agric. Water Manag. 2020, 228, 105894. [Google Scholar] [CrossRef]
  51. Puissant, J.; Jones, B.; Goodall, T.; Mang, D.; Blaud, A.; Gweon, H.S.; Malik, A.; Jones, D.L.; Clark, I.M.; Hirsch, P.R.; et al. The pH optimum of soil exoenzymes adapt to long term changes in soil pH. Soil Biol. Biochem. 2019, 138, 107601. [Google Scholar] [CrossRef]
  52. Yuri, J.E.; Mota, J.H.; Resende, G.M.; Souza, R.J. Nutrição e adubação da cultura da alface. In Nutrição e Adubação de Hortaliças; Prado, R.M., Cecílio Filho, A.B., Eds.; FCAV/CAPES: Jaboticabal, SP, Brazil, 2016; 600p, ISBN 978-85-61848-15-6. [Google Scholar]
  53. Nunes, M.U.C. Alface. In Recomendações para o Uso de Corretivos e Fertilizantes no Estado de Sergipe; Sobral, L.F., Viegas, P.R.A., Siqueira, O.J.W., Anjos, J.L., Barretto, M.C.V., Gomes, J.B.V., Eds.; Embrapa Tabuleiros Costeiros: Aracaju, SE, Brazil, 2007; 251p, ISBN 978-85-85809-27-0. [Google Scholar]
  54. Crespo, C.; Wyngaard, N.; Sainz Rozas, H.; Barbagelata, P.; Barraco, M.; Gudelj, V.; Barbieri, P. Improving soil organic nitrogen and sulfur pools by cover cropping and crop fertilization in soybean-based cropping systems. Soil Till. Res. 2021, 213, 105138. [Google Scholar] [CrossRef]
  55. Velescu, A.; Homeier, J.; Bendix, J.; Valarezo, C.; Wilcke, W. Response of water-bound fluxes of potassium, calcium, magnesium and sodium to nutrient additions in an Ecuadorian tropical montane forest. For. Ecol. Manag. 2021, 501, 119661. [Google Scholar] [CrossRef]
  56. Pedrero, F.; Grattan, S.R.; Ben-Gal, A.; Vivaldi, G.A. Opportunities for Expanding the Use of Wastewaters for Irrigation of Olives. Agric. Water Manag. 2020, 241, 106333. [Google Scholar] [CrossRef]
  57. Liang, X.; Rengasamy, P.; Smernik, R.; Mosley, L.M. Does the high potassium content in recycled winery wastewater used for irrigation pose risks to soil structural stability? Agric. Water Manag. 2021, 243, 106422. [Google Scholar] [CrossRef]
  58. Erel, R.; Eppel, A.; Yermiyahu, U.; Ben-Gal, A.; Levy, G.; Zipori, I.; Schaumann, G.E.; Mayer, O.; Dag, A. Long-term irrigation with reclaimed wastewater: Implications on nutrient management, soil chemistry and olive (Olea Europaea L.) performance. Agric. Water Manag. 2019, 213, 324–335. [Google Scholar] [CrossRef]
  59. Awedat, A.M.; Zhu, Y.; Bennett, J.M.; Raine, S.R. The impact of clay dispersion and migration on soil hydraulic conductivity and pore networks. Geoderma 2021, 404, 115297. [Google Scholar] [CrossRef]
  60. Zalacáin, D.; Martínez-Pérez, S.; Bienes, R.; García-Díaz, A.; Sastre-Merlín, A. Salt accumulation in soils and plants under reclaimed water irrigation in Urban Parks of Madrid (Spain). Agric. Water Manag. 2019, 213, 468–476. [Google Scholar] [CrossRef]
  61. Libutti, A.; Gatta, G.; Gagliardi, A.; Vergine, P.; Pollice, A.; Beneduce, L.; Disciglio, G.; Tarantino, E. Agro-industrial wastewater reuse for irrigation of a vegetable crop succession under Mediterranean conditions. Agric. Water Manag. 2018, 196, 1–14. [Google Scholar] [CrossRef]
  62. Gharaibeh, M.A.; Albalasmeh, A.A.; Pratt, C.; El Hanandeh, A. Estimation of exchangeable sodium percentage from sodium adsorption ratio of salt-affected soils using traditional and dilution extracts, saturation percentage, electrical conductivity, and generalized regression neural networks. Catena 2021, 205, 105466. [Google Scholar] [CrossRef]
  63. Bakari, Z.; El Ghadraoui, A.; Boujelben, N.; del Bubba, M.; Elleuch, B. Assessment of the impact of irrigation with treated wastewater at different dilutions on growth, quality parameters and contamination transfer in strawberry fruits and soil: Health risk assessment. Sci. Hortic. 2022, 297, 110942. [Google Scholar] [CrossRef]
  64. Shannag, H.K.; Al-Mefleh, N.K.; Freihat, N.M. Reuse of wastewaters in irrigation of broad bean and their effect on plant-aphid interaction. Agric. Water Manag. 2021, 257, 107156. [Google Scholar] [CrossRef]
  65. Yan, Q.; Xu, Y.; Chen, L.; Cao, Z.; Shao, Y.; Xu, Y.; Yu, Y.; Fang, C.; Zhu, Z.; Feng, G.; et al. Irrigation with secondary municipal-treated wastewater: Potential effects, accumulation of typical antibiotics and grain quality responses in rice (Oryza Sativa L.). J. Hazard. Mater. 2021, 410, 124655. [Google Scholar] [CrossRef]
  66. Gatta, G.; Libutti, A.; Beneduce, L.; Gagliardi, A.; Disciglio, G.; Lonigro, A.; Tarantino, E. Reuse of treated municipal wastewater for globe artichoke irrigation: Assessment of effects on morpho-quantitative parameters and microbial safety of yield. Sci. Hortic. 2016, 213, 55–65. [Google Scholar] [CrossRef]
  67. Vivaldi, G.A.; Camposeo, S.; Lopriore, G.; Romero-Trigueros, C.; Salcedo, F.P. Using saline reclaimed water on almond grown in mediterranean conditions: Deficit irrigation strategies and salinity effects. Water Supp. 2019, 19, 1413–1421. [Google Scholar] [CrossRef]
  68. Gallego, S.; Montemurro, N.; Béguet, J.; Rouard, N.; Philippot, L.; Pérez, S.; Martin-Laurent, F. Ecotoxicological risk assessment of wastewater irrigation on soil microorganisms: Fate and impact of wastewater-borne micropollutants in lettuce-soil system. Ecotoxicol. Environ. Saf. 2021, 223, 112595. [Google Scholar] [CrossRef]
  69. Sandri, D.; Matsura, E.E.; Testezlaf, R. Desenvolvimento da alface elisa em diferentes sistemas de irrigação com água residuária. Rev. Bras. Eng. Agric. Ambient. 2007, 11, 17–29. [Google Scholar] [CrossRef] [Green Version]
  70. Faccioli, G.G.; Ramos, F.S.M.; Santana, F.S.; Dantas, C.K.S. Análise das características agronômicas e microbiológicas do feijão-caupi (Vigna ungiculada (L.) Walp.) BRS novaera e BRS guariba com aplicação de água residuária tratada. Rev. Bras. Agric. Irrig. 2017, 11, 1707–1713. [Google Scholar] [CrossRef] [Green Version]
  71. Dantas, I.L.A.; Faccioli, G.G.; Mendonça, L.C.; Nunes, T.P.; Viegas, P.R.A.; Santana, L.O.G. Viabilidade do uso de água residuária tratada na irrigação da cultura do rabanete (Raphanus sativus L.). Rev. Ambient. Água 2014, 9, 109–117. [Google Scholar] [CrossRef] [Green Version]
  72. Ramos, F.S.M. Características Agronômicas e Microbiológicas da Couve Manteiga (Brassica oleracea L.) Irrigada com Água residuária Tratada em Ambiente Protegido. Mestrado em Recursos Hídricos; Universidade Federal de Sergipe: São Cristóvão, Brazil, 2021. [Google Scholar]
  73. Amori, P.N.; Mierzwa, J.C.; Bartelt-Hunt, S.; Guo, B.; Saroj, D.P. Germination and growth of horticultural crops irrigated with reclaimed water after biological treatment and ozonation. J. Clean. Prod. 2022, 336, 130173. [Google Scholar] [CrossRef]
  74. Guimarães, C.M.; Cunha, F.F.; Silva, F.C.S.; Araújo, E.D.; Guimarães, A.B.F.; Mantovani, E.C.; Silva, D.J.H. Agronomic performance of lettuce cultivars submitted to different irrigation depths. PLoS ONE 2019, 14, e0224264. [Google Scholar] [CrossRef] [Green Version]
  75. Magalhães, F.F.; Cunha, F.F.; Godoy, A.R.; Souza, E.J.; Silva, T.R. Produção de cultivares de alface tipo crespa sob diferentes lâminas de irrigação. Water Res. Irr. Manag. 2015, 4, 41–50. [Google Scholar] [CrossRef]
  76. Dantas, I.L.A. Análise microbiológica de cenoura e beterraba irrigadas com águas residuárias domésticas tratadas. Mestrado em Recursos Hídricos; Universidade Federal de Sergipe: São Cristóvão, Brazil, 2015. [Google Scholar]
  77. Carvalho, R.S.; Santos Filho, J.S.; Santana, L.O.G.; Gomes, D.A.; Mendonça, L.C.; Faccioli, G.G. Influence of wastewater reuse on the microbiological quality of sunflowers for animal feed. Rev. Ambient. Água 2013, 8, 157–167. [Google Scholar] [CrossRef] [Green Version]
  78. Souza, C.F.; Bastos, R.G.; Gomes, M.P.D.M.; Pulschen, A.A. Eficiência de estação de tratamento de esgoto doméstico visando reuso agrícola. Rev. Ambient. Água 2015, 10, 587–597. [Google Scholar] [CrossRef] [Green Version]
  79. Cai, J.; Liu, R. Research on water evaporation in the process of biomass pyrolysis. Energy Fuels 2007, 21, 3695–3697. [Google Scholar] [CrossRef]
  80. Kim, Y.M.; Lee, H.W.; Kim, S.; Watanabe, C.; Park, Y.K. Non-isothermal pyrolysis of citrus unshiu peel. BioEnergy Res. 2015, 8, 431–439. [Google Scholar] [CrossRef]
  81. Chen, D.; Zheng, Y.; Zhu, X. In-depth investigation on the pyrolysis kinetics of raw biomass. Part I: Kinetic analysis for the drying and devolatilization stages. Bioresour. Technol. 2013, 131, 40–46. [Google Scholar] [CrossRef]
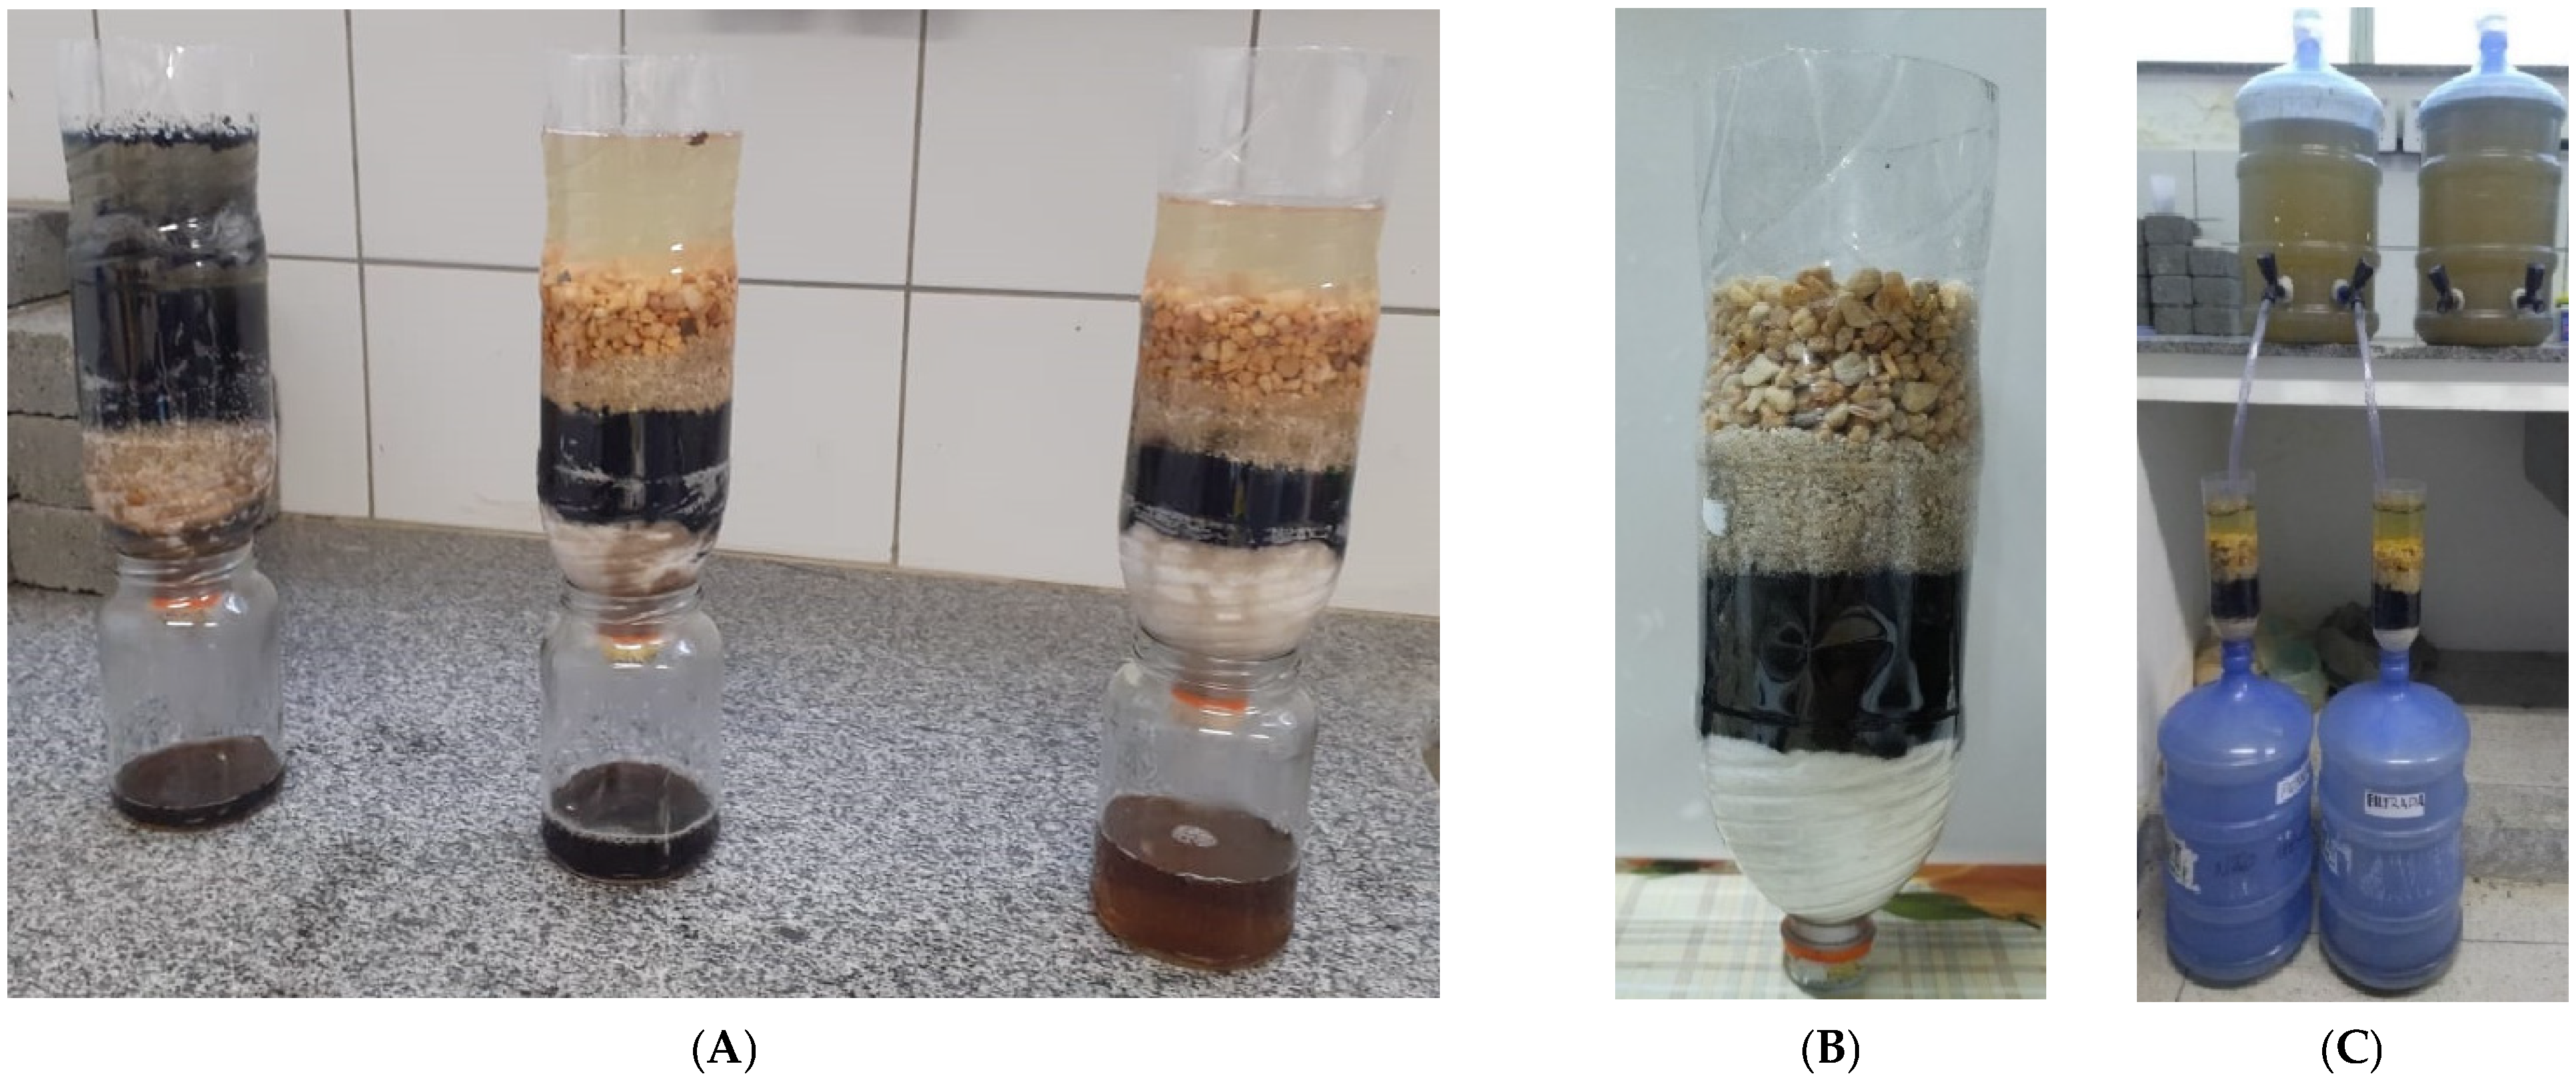
Figure 1. Filtration systems: (A) test of filtration systems for use in the experiment; (B) filtration system used in the post-treatment of domestic wastewater; (C) structure used in the post-treatment of domestic effluent.
Water 14 03272 g001
Figure 2. Means of the parameters of the three filtration systems and comparison with CONAMA Resolution No. 357: (A) pH values; (B) dissolved oxygen (DO) values.
Water 14 03272 g002
Figure 3. Physicochemical parameters of water sources: (A) biochemical oxygen demand (BOD); (B) total iron; (C) total phosphorus; (D) dissolved oxygen (DO).
Water 14 03272 g003
Figure 4. Values of total coliforms present in different water sources.
Water 14 03272 g004
Figure 5. Values of water sources and limits for the risk of soil salinization and sodification: (A) electrical conductivity (EC) and (B) sodium adsorption ratio (SAR).
Water 14 03272 g005
Figure 6. Shoot fresh mass (A) and shoot dry mass (B) of lettuce grown in cycle 1 and number of leaves in the first (C) and second (D) cultivation cycles as a function of different irrigation depths.
Water 14 03272 g006
Figure 7. Shoot fresh mass (A), shoot dry mass (B) and water-use productivity (C) of lettuce as a function of different irrigation depths and cultivated in cycle 2. T1—treatment irrigated with human-supply water from the concessionaire and planting and top-dressing.
Water 14 03272 g007
Figure 8. Recording of the microstructural characteristics of fresh biochar.
Water 14 03272 g008
Figure 9. Recording of the microstructural characteristics of biochar after use as a filter element.
Water 14 03272 g009aWater 14 03272 g009b
Figure 10. Thermogravimetry: (A) fresh biochar; (B) biochar after use as a filter element.
Water 14 03272 g010
Table 1. Physical characteristics of STP.
PondDepth (m)Area (m2)Volume (m3)
Primary Facultative2.008.7417.47
Secondary Facultative1.986.9613.79
Maturation 11.964.719.24
Maturation 21.944.628.96
Maturation 31.924.628.88
Note: Rosa Elze stabilization pond system design adapted from DESO [43].
Table 2. Summary of the analysis of variance and mean values of soil chemical characteristics as a function of different water sources and fertilizers.
FactorCV (%)Mean SquareTreatments
T1T2T3T4T5
pH12.120.2837 nsŷ = 5.42
EC (dS m−1 at 25 °C)11.560.4014 *0.74b0.83b0.68b1.37a1.70a
Sodium (mg dm−3)10.87180.072 *19.80b37.05a35.40a37.45a45.90a
Potassium (mg dm−3)78.571223.2 nsŷ = 47.81
Organic matter (g dm−3)16.800.9383 nsŷ = 11.28
CEC (cmolc dm−3)35.250.7418 nsŷ = 4.86
ESP (%)36.992.0227 nsŷ = 3.37
Soil classification regarding salinityCycle 1NormalNormalNormalNormalNormal
Cycle 2NormalNormalNormalNormalNormal
Note: ns—not significant (p > 0.05); *—significant (p < 0.05). Means followed by equal letters in rows do not differ statistically by Tukey’s test (p < 0.05). T1—treatment irrigated with human-supply water from the concessionaire and planting and top-dressing fertilization; T2—treatment irrigated with treated wastewater from Rosa Elze STP; T3—treatment irrigated with treated wastewater from biochar filtration; T4—treatment irrigated with treated wastewater from Rosa Elze STP and planting and top-dressing fertilization; T5—treatment irrigated with treated wastewater from biochar filtration and planting and top-dressing fertilization.
Table 3. Mean values of shoot fresh mass, shoot dry mass, number of leaves (NL) and water-use productivity.
FactorCycleF TestIrrigation DepthsTreatments
IDTREATID *
TREAT
T1T2T3T4T5
Shoot fresh
mass (g pl−1)
146.164 ***7.040 ***0.575 ns 372.9b435.0ab490.6a392.1b369.5b
28.786 ***6.901 ***2.376 *50% ETc107.0a187.3a184.3a115.0a152.0a
75% ETc194.7b221.3ab380.0a153.0b207.7ab
100% ETc180.0b227.7b414.7a314.7ab312.0ab
125% ETc146.0b234.3ab351.0a407.0ab367.7ab
150% ETc236.7a182.7a208.3a364.3a313.3a
Shoot dry
mass (g pl−1)
125.418 ***3.451 *0.935 ns 17.26ab17.52ab19.75a16.50b17.05b
216.745 ***4.066 **2.758 **50% ETc7.97ab14.60a12.32ab7.83b9.95ab
75% ETc11.17b15.13ab18.00a13.94ab11.42ab
100% ETc15.82a12.72a18.97a13.88a17.18a
125% ETc13.73b16.97ab19.91ab22.65a21.28a
150% ETc15.04a12.23a14.78a19.08a16.20a
NL
(un pl−1)
122.141 ***2.022 ns0.541 nsŷ = 49
28.359 ***3.341 *1.743 ns 43.93b48.00ab53.67a46.20ab48.53ab
Water use
productivity
(g L−1)
11.511 ns4.255 **0.677 ns 32.31b43.79a38.59ab38.70ab35.73ab
24.089 **10.415 ***2.408 **50% ETc15.48a20.98a23.68a18.60a23.19a
75% ETc20.52b17.68b35.20a18.22b23.20ab
100% ETc14.92b14.14b30.03a29.64a27.49ab
125% ETc9.97b11.90b20.87ab31.73a26.74a
150% ETc13.73ab7.85b10.50ab24.23a19.41ab
Note: ns—not significant (p > 0.05); *—significant (p < 0.05); **—significant (p < 0.01); ***—significant (p < 0.001). Means followed by equal letters in the rows do not differ statistically by Tukey’s test (p < 0.05). T1—treatment irrigated with human-supply water from the concessionaire and planting and top-dressing fertilization; T2—treatment irrigated with treated wastewater from Rosa Elze STP; T3—treatment irrigated with treated wastewater from biochar filtration; T4—treatment irrigated with treated wastewater from Rosa Elze STP and planting and top-dressing fertilization; T5—treatment irrigated with treated wastewater from biochar filtration and planting and top-dressing fertilization.
Table 4. Results of microbiological analyses of lettuce crop performed in the two cycles.
TreatmentCycle 1Cycle 2
Coliforms at 45 °CSalmonellaColiforms at 45 °CSalmonella
MPN g−1in 25 gMPN g−1in 25 g
T1<3.0Absence9.2Absence
T2<3.0Absence<3.0Absence
T3<3.0Absence<3.0Absence
T4<3.0Absence<3.0Absence
T5<3.0Absence<3.0Absence
Note: <—less than. T1—treatment irrigated with human-supply water from the concessionaire and planting and top-dressing fertilization; T2—treatment irrigated with treated wastewater from Rosa Elze STP; T3—treatment irrigated with treated wastewater from biochar filtration; T4—treatment irrigated with treated wastewater from Rosa Elze STP and planting and top-dressing fertilization; T5—treatment irrigated with treated wastewater from biochar filtration and planting and top-dressing fertilization.
Table 5. Temperature ranges and stages in the biomass pyrolysis process.
TemperaturesStages
Up to 150 °CRelease of free water (lower temperatures) and
bound water (stronger interaction with biomass)
Between 125 °C and 250 °CDecomposition of biopolymers (mainly hemicellulose)
occurs at lower temperatures compared to cellulose
Between 250 °C and 380 °CIntense scission of the polymeric chains of cellulose,
accompanied by the beginning of lignin decomposition
Between 180 °C and 500 °CLignin decomposition, with production of phenols and other aromatic compounds in biooil, with formation of methanol and part of acetic acid
Below 500 °CDecomposition of pectin
Note: Adapted from Chen et al. [81].
Publisher’s Note: MDPI stays neutral with regard to jurisdictional claims in published maps and institutional affiliations.