Article

Spray Characteristics and Parameter Optimization of Orifice Arrangement for Micro-Sprinkling Hoses

1
College of Water Resources and Civil Engineering, China Agricultural University, Beijing 100083, China
2
Beijing Engineering Research Center of Safety and Energy Saving Technology for Water Supply Network System, Beijing 100083, China
3
Engineering Resources Center of Agricultural Water-Saving and Water Resources, Ministry of Education, Beijing 100083, China
4
The Semi-Arid Agriculture Engineering & Technology Research Center of P.R. China, Shijiazhuang 050051, China
*
Author to whom correspondence should be addressed.
Water 2022, 14(20), 3260; https://doi.org/10.3390/w14203260
Submission received: 4 September 2022 / Revised: 11 October 2022 / Accepted: 14 October 2022 / Published: 15 October 2022
(This article belongs to the Special Issue Advances in Sprinkler Irrigation Systems and Water Saving)

Abstract

:
The spraying width and uniformity coefficient are important for the design of a micro-sprinkling hose. In this study, experiments were conducted on the water application intensity distribution for an individual orifice and multiple groups of orifices under three different working pressures (41, 69 and 103 kPa). In the test of an individual orifice, the spraying angles varied from 40° to 90°. The results showed that the water application intensity distributions of an individual orifice were well fitted by a two-dimensional Gaussian distribution. Further study indicated that the bimodal Gaussian distribution model performed well on tracking the two-dimensional features of the water application intensity distribution, with the determination coefficient R2 > 0.90 and the standard root mean square error NRMSE < 30%. It was revealed that the fitting parameters of the two-dimensional Gaussian distribution model had physical meaning and were directly related to the strength and location of the water application intensity distributions. Based on the analysis of these fitting parameters, it was found that the water application intensity distribution of an individual orifice was affected by the pressure, spraying angle and orifice area, among which the spraying angle was the most sensitive factor. By establishing a linear relationship between the fitting parameters and the spraying angles, the water application intensity distribution of an individual orifice for any spraying angle could be predicted by the Gaussian model. Therefore, the water application intensity distribution of multiple groups of orifices could be calculated by overlapping the water application intensity distributions of the individual orifices. The Monte Carlo method was used in this study to determine the maximum spraying width and uniformity coefficient by generating different groups of orifice arrangement for micro-sprinkling hoses. Eventually, the optimized orifice arrangement was recommended for the better design of micro-sprinkling hoses.

1. Introduction

As the largest global freshwater user, agricultural irrigation accounts for 70% of water withdrawal [1]. The total area of sprinkler and micro irrigation systems has reached 11.81 million hm2 in China by the end of 2020, accounting for approximately 31.3% of the total area of water-saving irrigation [2]. Sprinklers, drip irrigation and micro-sprinkler irrigation are used to improve water-use efficiency and ensure yield output with reduced water consumption [3,4,5,6].
Micro-sprinkling hoses have the advantages of easy reliable installation, low-head operation and low cost. Compared with surface irrigation, the water consumption of various crops was reduced by 10% to 40% using micro-sprinkling hoses. Meanwhile, the yield output and water-use efficiency increased by 15% to 19% [7,8,9]. Micro-sprinkling hoses, composed of individual small orifices with different arrangements, are widely used for the irrigation of vegetables, fruit trees and greenhouses, which are suitable for the integration of water and fertilizer [10,11,12,13]. The water application intensity distribution, along with some other important performance indicators, including spraying width (B) and uniformity coefficient (CU), are the key characteristics of micro-sprinkling hoses. However, due to the difficulty in data processing, many studies have focused on the qualitative analysis of the water application intensity distribution and have failed to accurately simulate the two-dimensional water application intensity distribution of micro-sprinkling hoses under various working conditions [14].
In terms of micro-sprinkling hoses, the water application intensity is usually affected by a set of orifices and many efforts have been made to obtain quick and accurate analyses of the water application intensity distribution of micro-sprinkling hoses and an individual orifice. There are many factors that may affect the water application intensity distribution of micro-sprinkling hoses, such as the materials of the hose, working pressure, wind speed and temperature [15,16]. Based on the available literature [17,18], the water application intensity distribution of an individual orifice is affected by the orifice area, orifice shape, wind speed and so forth, but the two-dimensional features of water application intensity distribution have not been considered. A non-linear mathematical model was developed to simulate the water application intensity distribution of an individual orifice by using data-fitting method of DUD (Doesn’t Use Derivatives) arithmetic based on experimental measurements [19]. This non-linear model has many unknown parameters, which, however, have no physical meaning. A model for the spraying width of micro-sprinkling hoses was proposed based on Newtonian fluid mechanics with the effects of air resistance, gravity and buoyancy, but this approach could only simulate the spraying width instead of the water application intensity [20].
For other types of sprinklers, some studies have been already conducted on simulating the water distribution of combined sprinklers by overlapping single-sprinkler distribution patterns, which provided an important research basis for the prediction of the micro-sprinkling hose in this study [21,22]. Zhou had already considered the overlapping of the water application intensity distribution of micro-sprinkling hoses, but they only conducted a simple overlapping of experimental measurement without any further prediction or optimization [23].
The uniformity coefficient is crucial for micro-sprinkling hoses, and the values vary from 20% to 50% in different micro-sprinkling hoses [24]. The uniformity coefficient is related to the working pressure, length, orifice size and spacing, spraying angle and folded inner diameter of a micro-sprinkling hose. To improve the uniformity coefficient, the structure needs to be optimized. There are few studies on the structural optimization of micro-sprinkling hoses, and these studies have focused on the length of the micro-sprinkling hose and the distance between multiple micro-sprinkling hoses [25,26]. There are many optimization methods for the design of sprinklers, such as orthogonal method, response surface methodology, the Monte Carlo method and so forth [27,28,29]. Based on the influencing factors of micro-sprinkling hoses, the Monte Carlo method was used in this study.
In this study, indoor experiments on the water application intensity distribution of an individual orifice were conducted under three different working pressures (41, 69 and 103 kPa) and different spraying angles from 40° to 90°. Indoor experiments were also conducted on multiple groups of orifices for the verification of the two-dimensional distribution models. The objectives were: (1) to put forward a mathematical model of a two-dimensional water application intensity distribution and evaluate the influence of pressure, spraying angle and orifice area on the water application intensity distribution based on a mathematical model; (2) to investigate the calculation method of the water application intensity from individual orifices to an orifice group, and from orifice groups to a micro-sprinkling hose; and (3) to propose a new optimization method for the design of the orifice arrangement of micro-sprinkling hoses.

2. Materials and Methods

2.1. Micro-Sprinkling Hoses

A micro-sprinkling hose (Sumitomo, Japan), commonly used in agricultural irrigation, was selected for this study. The folded inner diameter D was 54 mm, and the wall thickness was 0.5 mm. The tested micro-sprinkling hose was 2 m in length with four orifice groups, with 12 orifices in each orifice group. The orifices were manufactured by laser drilling. In each orifice group, the orifice diameter varied from 0.2 mm to 0.6 mm, and the orifice spacing l varied from 47 mm to 52 mm. The spacing between each group of orifice L varied from 47 mm to 52 mm. As shown in Figure 1, the orifices in each group were labeled as a1-1~a1-12. The two indexes in subscript denote the group number and the orifice number, respectively. It should be noted that the spraying direction was different for odd number orifices and even number orifices.
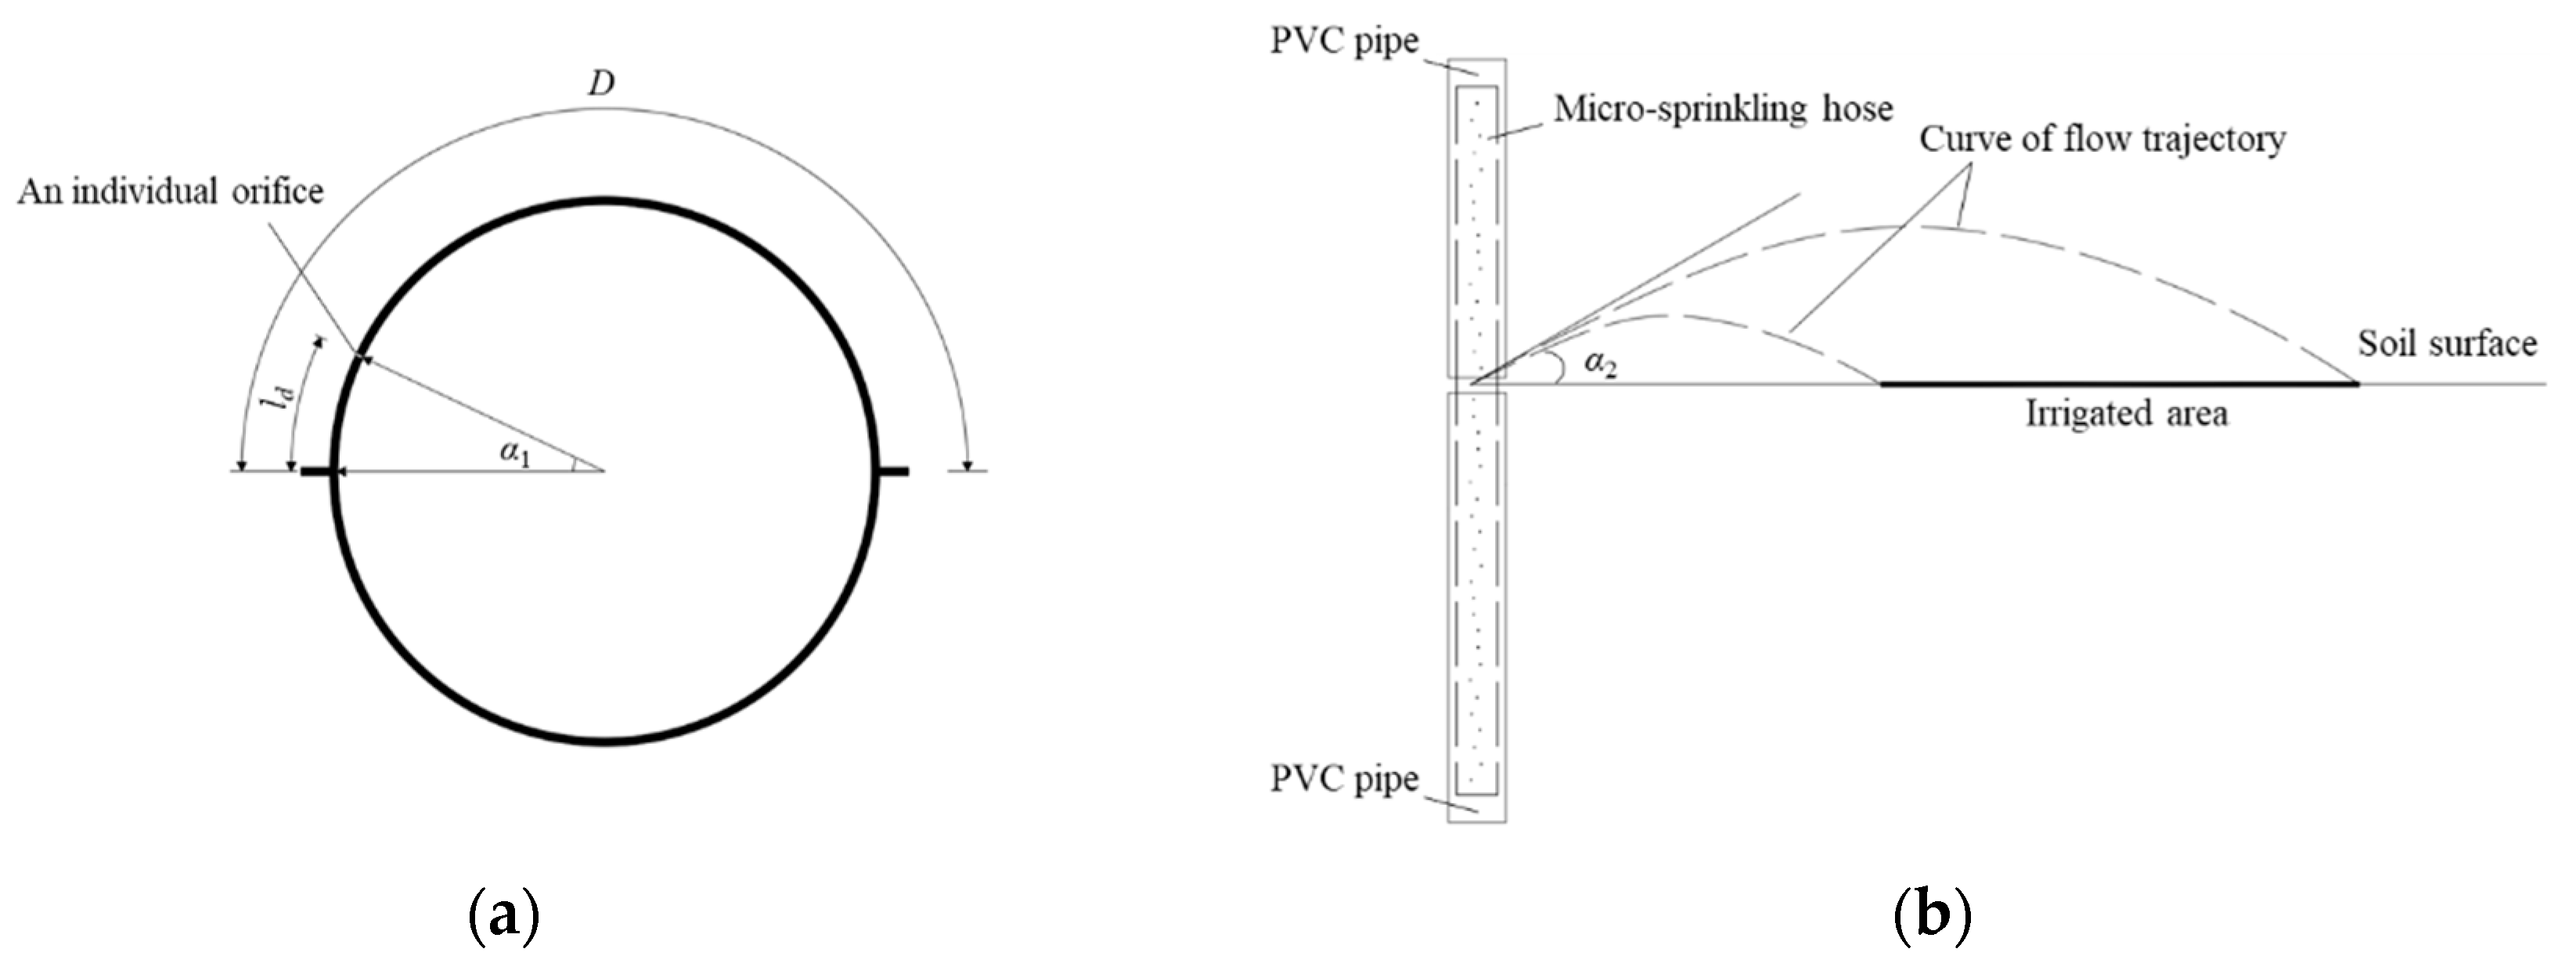
As shown in Figure 2a, when the flattened micro-sprinkling hose was filled with water, the shape of the cross-section was approximately circular, where an angle formed between the orifice center and the ground level. This angle was defined as orifice angle α1, which was calculated by the distance from the orifice center to edge ld based on the arc length formula. The arc length formula can be derived as:
l d = α 1 π r 180
where r denotes the radius of the circular cross-section of the water-filled micro-sprinkling hose.
The angle between the water flow sprayed from an individual orifice and the ground plane was defined as spraying angle α2, shown in Figure 2b. These two angles ware slightly different, which will be discussed later in this paper.

2.2. Experimental Design

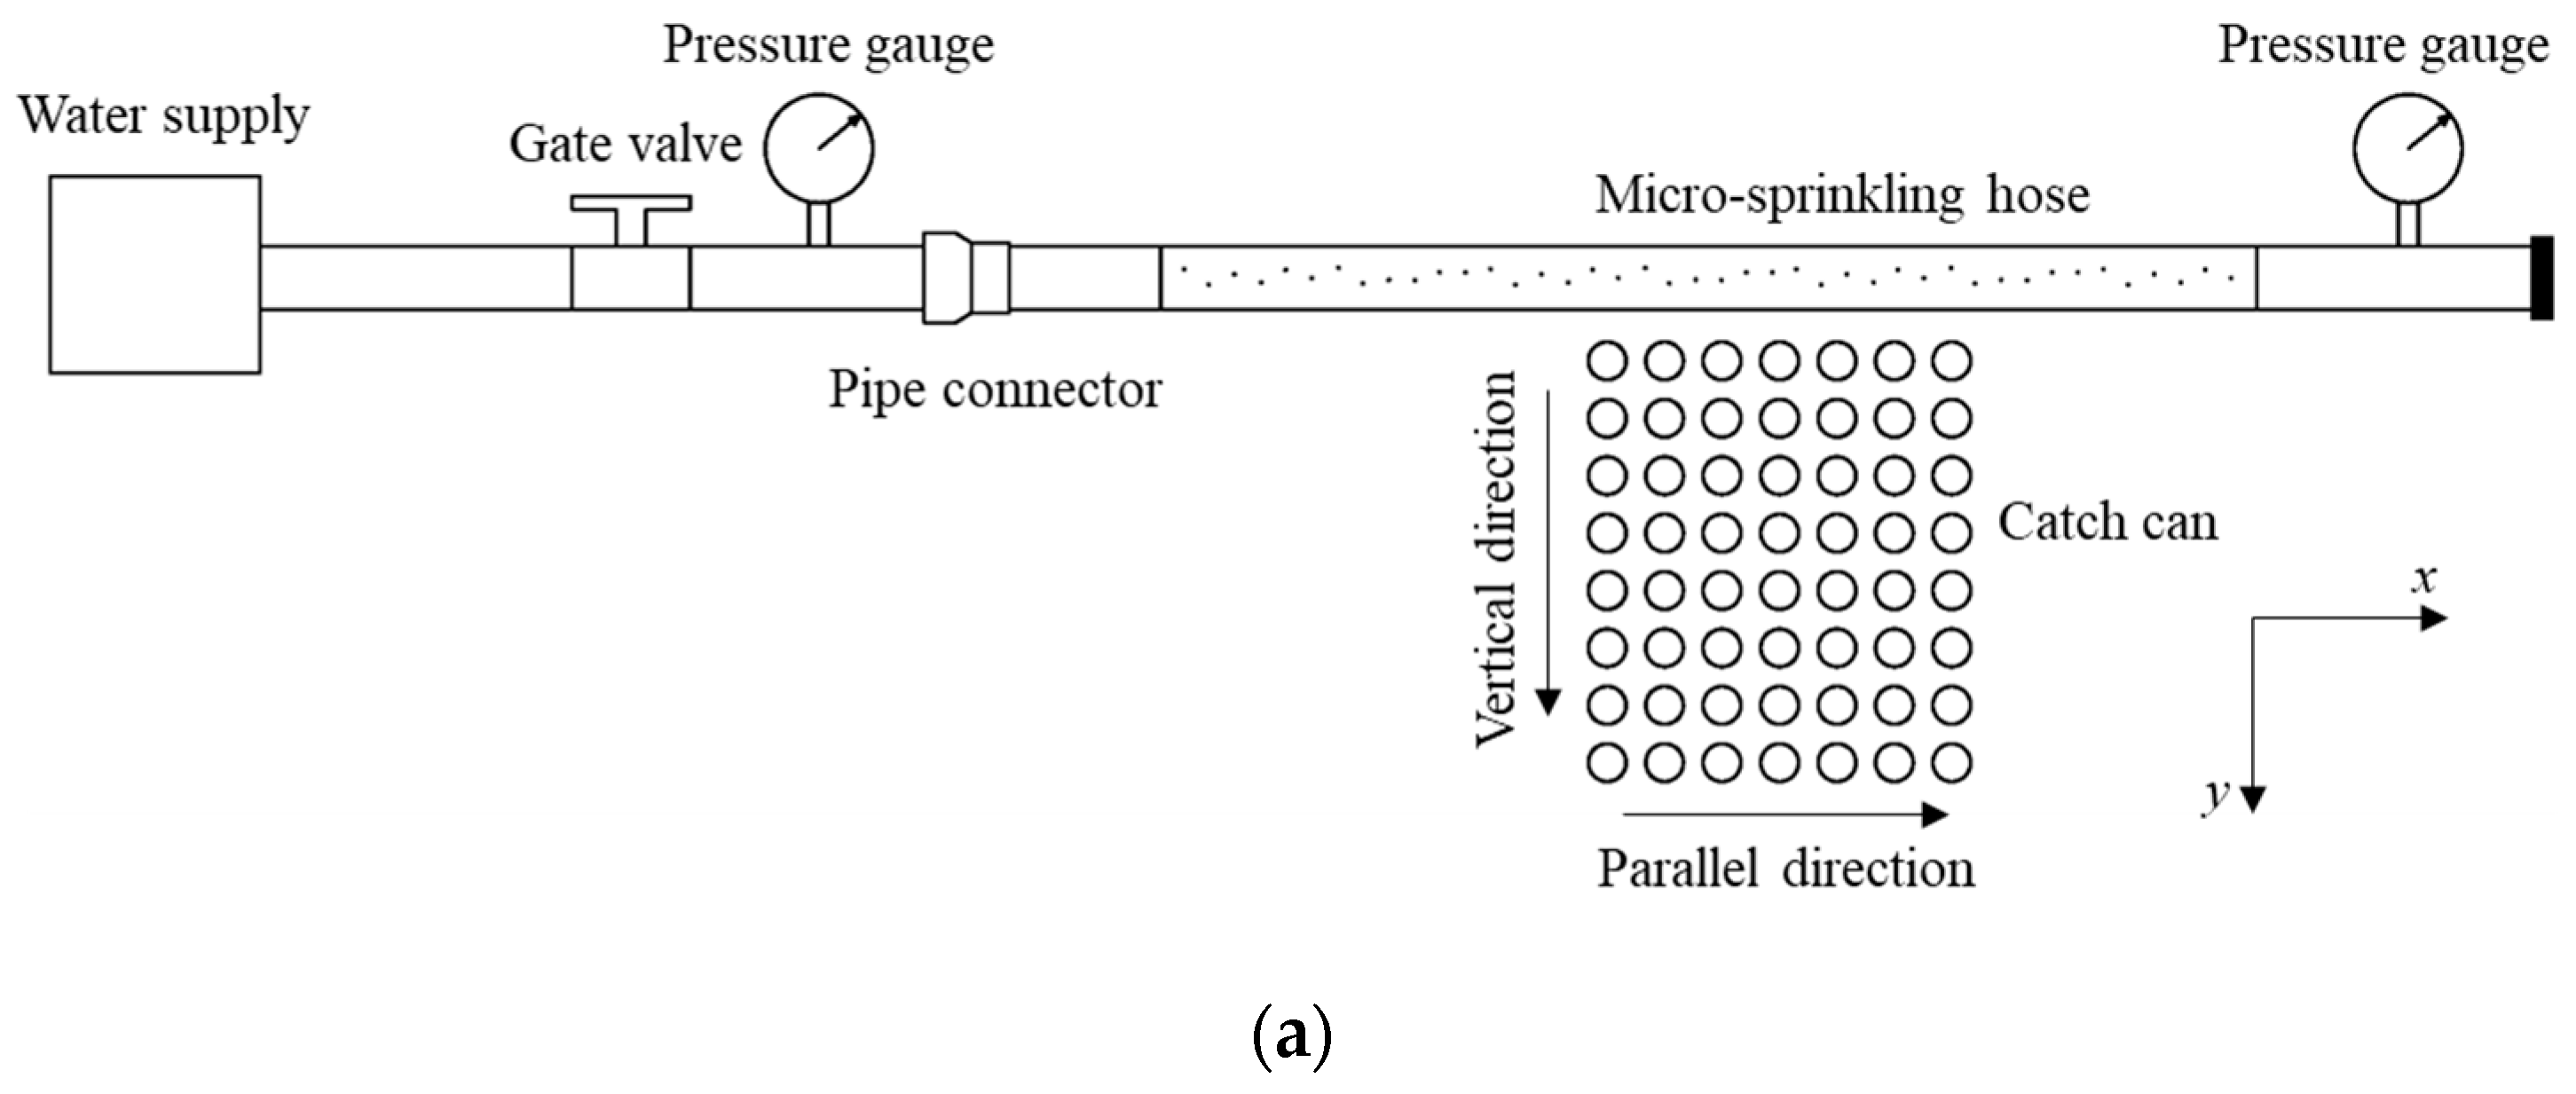
The indoor experiments on the water application intensity distribution were conducted without wind effects, where the temperature was about 20 °C and the relative humidity was about 55%. The experiments were designed to measure the water application intensity of multiple groups of orifices and each orifice. As shown in Figure 3a, two pressure gauges with a range from 0 to 600 kPa were installed at the two ends of the micro-sprinkling hose, respectively. A pressure regulator was installed upstream of the micro-sprinkling hose to control the fluctuating water pressure induced by the municipal water supply. Therefore, the working pressures of the micro-sprinkling hose frequently below 100 kPa were set as 41 kPa (6 psi), 69 kPa (10 psi) and 103 kPa (15 psi), based on the pressure regulators available. The outlet end of the micro-sprinkling hose was blocked by a plug.
In the measurement of an individual orifice, a PVC pipe was cut in half longitudinally to make shelters, which were used to cover the unmeasured orifices of the micro-sprinkling hose, as shown in Figure 3b. In order to reduce the influence of the water flow at the inlet and outlet, 12 individual orifices in the third group were selected to test individually, which were labeled as a3-1~a3-12. The micro-sprinkling hose was laid flat and catch cans were placed on the spraying side. The origin of the coordinate system was set at the center of the measured individual orifice, the direction of flowing water in the micro-sprinkling hose was set as the x-axis and the placement direction of the catch cans was set as the y-axis. As shown in Figure 3b, the catch cans were all evenly spaced, where the vertical spacing (in the y direction) was 0.20 or 0.25 m and the parallel spacing (in the x direction) was 0.20 m. The number of catch cans was guaranteed to be sufficient to cover the spraying region of each orifice. During each measurement, the actual spraying angle was carefully measured by a digital angle rule with an accuracy of 0.3°. The spraying angles varied from 40° to 90°, which were adjusted by artificially rotating the micro-sprinkling hose. In order to measure the flow rate of each orifice, a plastic bottle with a drilled hole near the bottom was used to catch the spraying water for 60 s. The tests of the water application intensity distribution lasted for 15 min. Either the water in the plastic bottles or the catch cans was weighed by an electronic scale with an accuracy of 0.01 g.
The tests of the four orifice groups were conducted indoors for different pressures. The micro-sprinkling hose was laid flat, and it was guaranteed that the spraying angle of each orifice in the third group was consistent with the test of an individual orifice at different pressures. The origin of the coordinate system was set at the center of the first individual orifice of the third group orifice. The vertical spacing of the catch cans was 0.50 m, and the parallel spacing was 0.20 m. Half-cut PVC pipes were also used as shelters to ensure that only the targeted orifice group of the micro-sprinkling hose was measured, which lasted for 15 min for each scheme.

2.3. Bimodal Two-Dimensional Gaussian Distribution Model

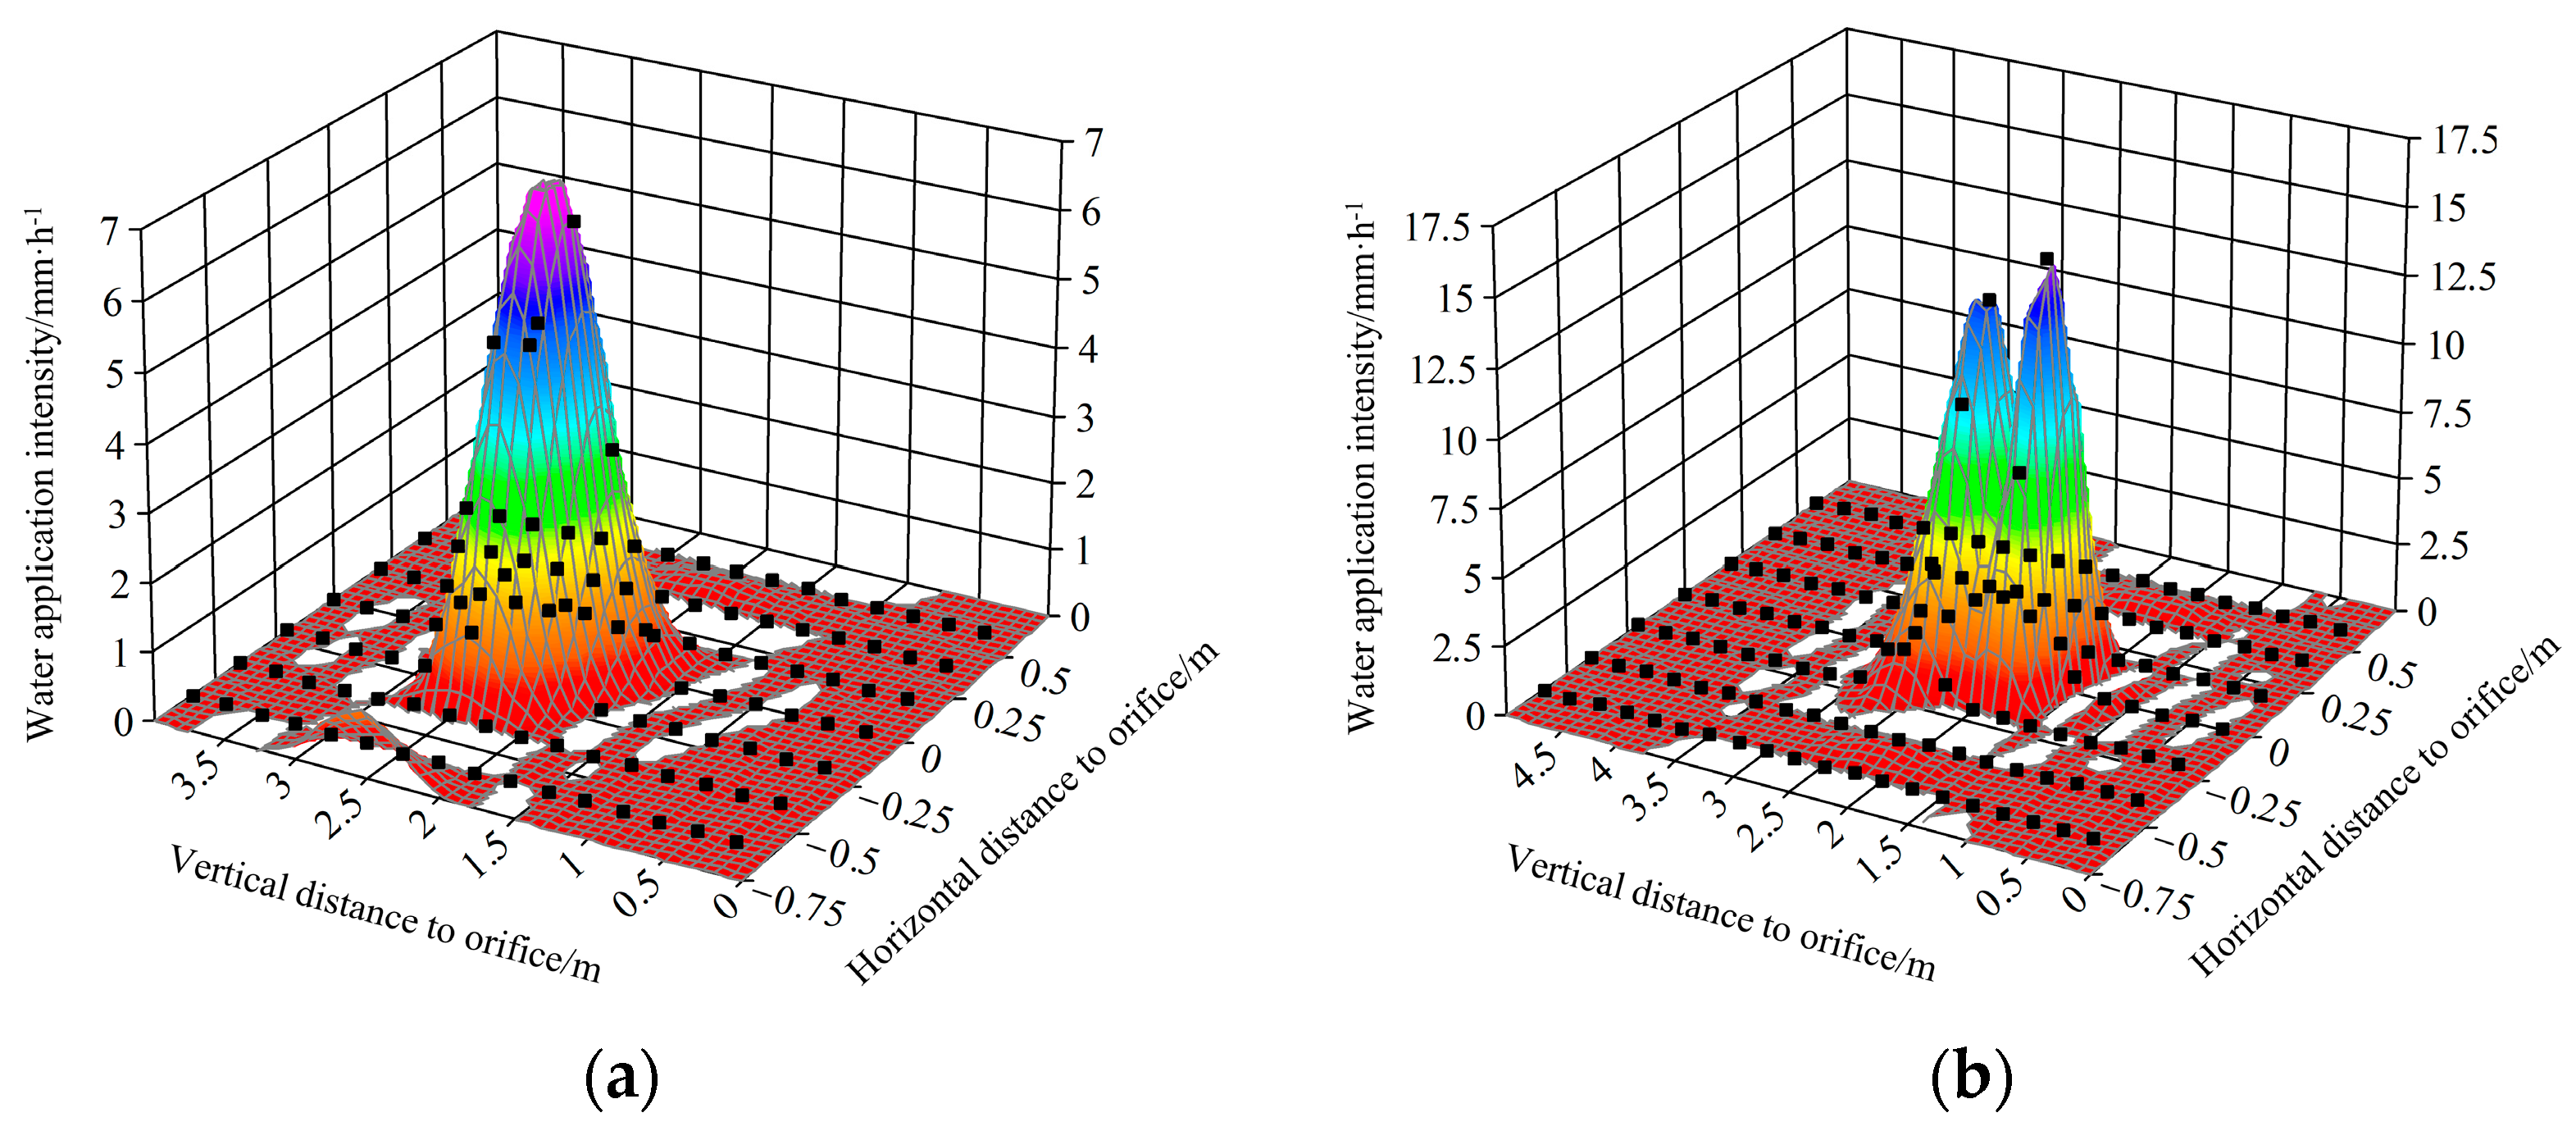
Figure 4 shows the water application intensity distribution of a3-5 and a3-1 at 41 kPa, the spraying angles of which were 47.8° and 40.7°, respectively. A three-dimensional contour was generated based on the experimental measurement datum represented with black squares. The experimental results on the water application intensity distribution of individual orifices showed unimodal or bimodal patterns in a two-dimensional distribution. The water application intensity characteristics of the 12 orifices at different pressures were complex, and it was difficult to analyze them together between the unimodal and bimodal distributions.
Cohen thought that the bimodal distribution was composed of two or more different unimodal distributions [30]. In this study, it was assumed that a bimodal distribution is composed of two unimodal distributions. A unimodal pattern can also be represented by a bimodal distribution, of which the two unimodal distributions happen to be the same. Based on the probability density function of the two-dimensional normal distribution, a bimodal two-dimensional Gaussian distribution model was proposed to fit the water application intensity distribution. The two-dimensional Gaussian distribution probability density function is written as follows:
f x , y = 1 2 π σ x σ y e 1 2 x μ x 2 2 σ x 2 + y μ y 2 2 σ y 2 ,
where μx and μy denote the location coordinates of the peak, respectively; σx and σy denote the dispersion in the x-direction and y-direction, respectively.
Based on Equation (2), a unimodal two-dimensional distribution model can be derived as:
h u x , y = k f ,
where k denotes the integral of hu, which also represents the total discharge of the spraying event.
A bimodal two-dimensional Gaussian distribution model can be written as the sum of two unimodal distribution models
h b x , y = k 1 f 1 + k 2 f 2 ,
h b x , y = k 1 2 π σ x 1 σ y 1 e 1 2 x μ x 1 2 2 σ x 1 2 + y μ y 1 2 2 σ y 1 2 + k 2 2 π σ x 2 σ y 2 e 1 2 x μ x 2 2 2 σ x 2 2 + y μ y 2 2 2 σ y 2 2 ,
where k1 and k2 are used to quantify the effects of the two unimodal peaks on the bimodal distribution. It should be noted that the two peak values can be calculated by substituting the coordinates of the peak location into Equation 3, which are hb(μx1, μy1) and hb(μx2, μy2), respectively. μx1 and μx2 are the peak location near and far away from an individual orifice in the x direction. μy1 and μy2 are the peak location near and far away from an individual orifice in the y direction. σx1 and σx2 are the dispersion degree of water distribution near and far away from an individual orifice in the x direction. σy1 and σy2 are the dispersion degree of water distribution near and far away from an individual orifice in the y direction.

2.4. Optimization Method

In agricultural irrigation, the uniformity coefficient (CU) and spraying width (B) of a micro-sprinkling hose are two important indicators to quantify its water distribution. There were many factors that may have affected the water application intensity of individual orifices and the micro-sprinkling hose. If all influencing factors were considered without being selected, the overall calculation sample was large. The value could be randomly selected in a reasonable range with the Monte Carlo method, and the value was thought to cover the entire range when the selected scenario reached a certain number.
The Christiansen uniformity coefficient (CU) was used [31]:
CU = 1 i = 1 n h i h ¯ i = 1 n h i × 100 % ,
where hi is the measured water application intensity in a rain gauge, mm/h; h ¯ is the average measured water application intensity of all catch cans, mm/h; and n is the number of catch cans.
In the study of the optimization, the measured micro-sprinkling hose was used as a reference, and the arrangement in a group of orifices was changed for optimization. It was assumed that adjacent orifices sprayed in opposite directions, and the orifice arrangement on both sides was the same. The position of an individual orifice depended on the distance from the orifice center to the edge ld and the orifice angle α1, as shown in Figure 2a. The orifice arrangement in a group was simplified as a combination of 6 orifice angles within a certain range, and the Monte Carlo method was used to select an appropriate scenario for optimization. Different scenarios were recorded as Si, and the uniformity coefficient and spraying width of different scenarios for a micro-sprinkle hose were recorded as CUi and Bi, respectively. The two indicators of a certain scenario reached the maximum at the same time, which meant that optimized orifice arrangement could improve the spraying performance of the micro-sprinkling hose.
The optimization steps of the Monte Carlo method were: (1) to determine a reasonable range of the orifice angle; (2) to give the origin sample number; (3) to generate a random sequence and calculate the water application intensity distribution of an arbitrarily generated spraying angle; (4) to calculate the uniform coefficient and spraying width for all scenarios; (5) to change the sample number and repeat steps (3) and (4); (6) to determine an appropriate sample number when the uniform coefficient and spraying width were kept constant; and (7) to choose an optimal scenario.

3. Results

3.1. Model Validation

Generally, the spraying angle measured in the experiment was used to calculate the spraying width. For simplicity, the orifice angle replaced the spraying angle for the spraying width calculation [14]. Table 1 shows the orifice angles α1 and spraying angles α2 of 12 individual orifices in the third group. It was found that the difference between α1 and α2 was small, and the relative errors were within 15%.
Table 2 shows the fitting evaluation parameters of the bimodal two-dimensional Gaussian distribution model under three different working pressures for twelve individual orifices. The results showed that the determination coefficient R2 and the standard root mean square error NRMSE of the bimodal two-dimensional Gaussian distribution model were smaller under lower working pressure. Most R2 values were greater than 0.90 and most NRMSE values were lower than 30%, which indicated a good fitting performance by this bimodal two-dimensional Gaussian distribution model.

3.2. Influencing Factor of Water Application Intensity Distribution of an Individual Orifice

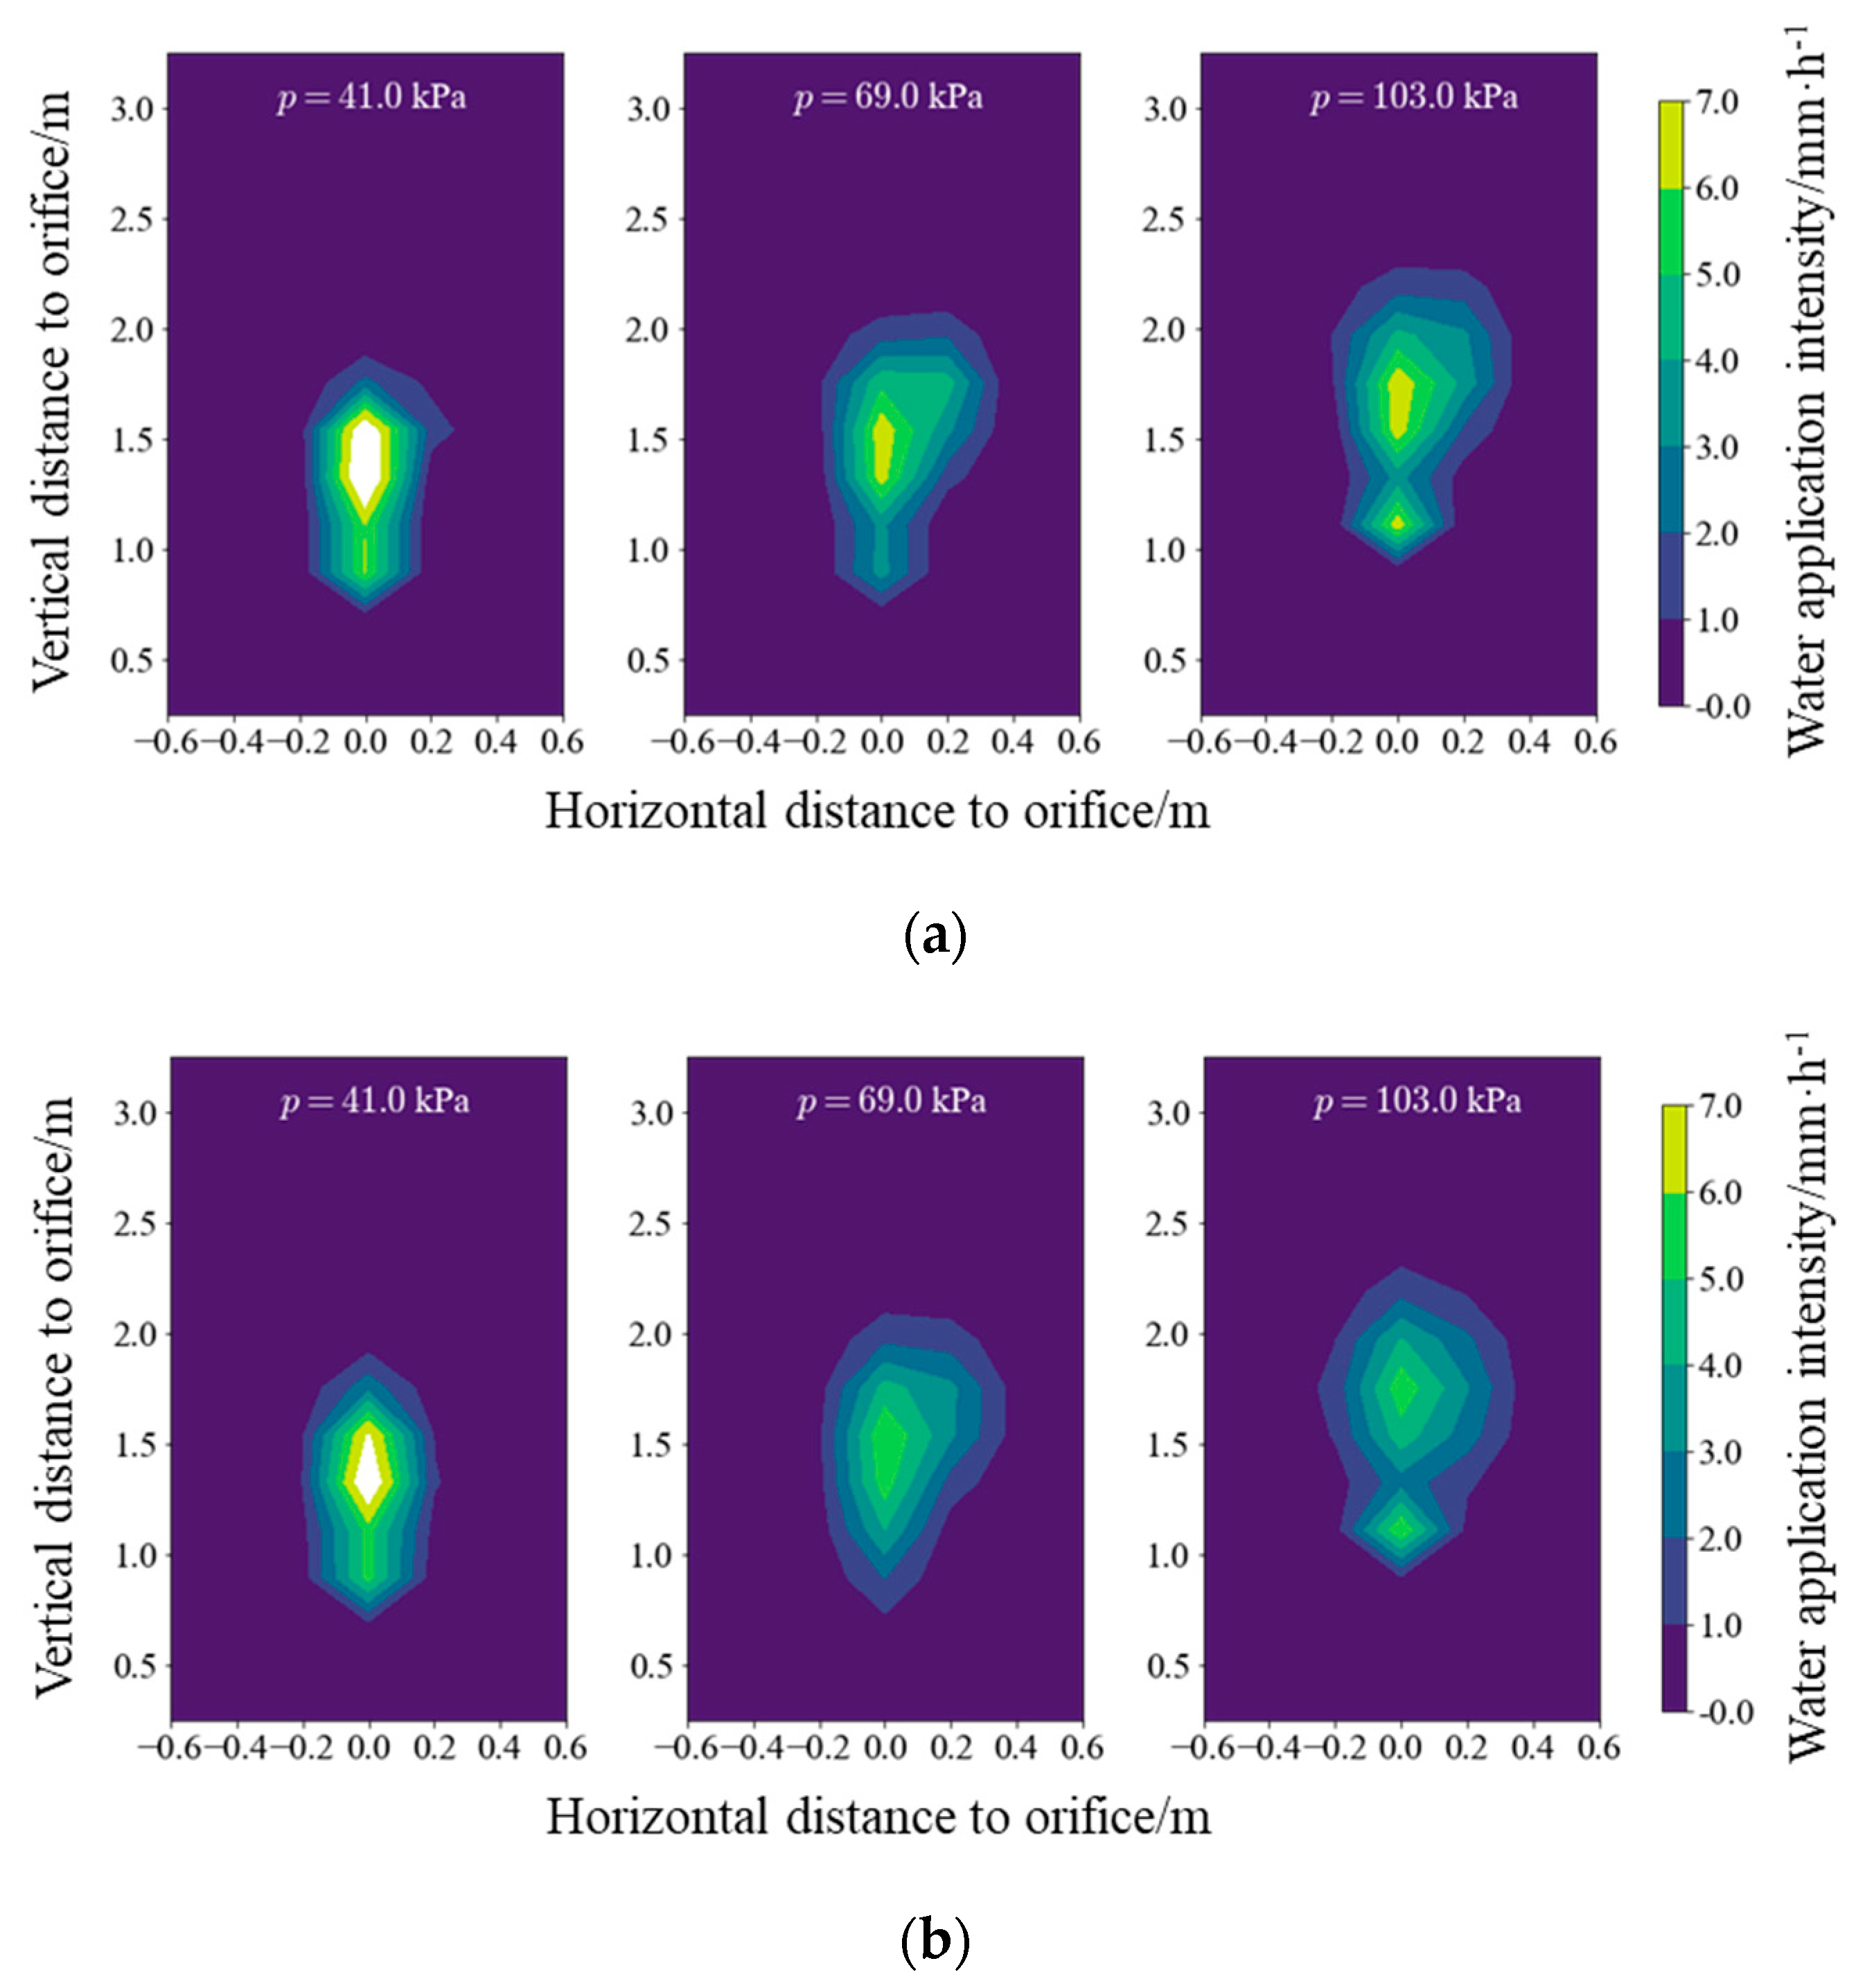
The influence of working pressure, spraying angle and orifice area were analyzed based on water application intensity distribution with the bimodal two-dimensional Gaussian distribution model. The fitting parameters of the bimodal distribution model intuitively indicated the peak variation trend and the range of water application intensity distribution. Figure 5 shows the comparison between the measured value and fitting value of the water application intensity distribution of orifice a3-4 at a spraying angle of 54.1°. When the pressure was 41 kPa, 69 kPa and 103 kPa, the distribution mode was bimodal, unimodal and bimodal, respectively, and the spraying region moved further from the orifice as the pressure increased. There was one peak in the measured water distribution at 69 kPa, and it was difficult to compare it with the fitted bimodal peak. In the cases of 41 kPa and 103 kPa, the peak further away from the orifice was always higher. The results showed that the fitting value of the water application intensity distribution was similar to the measured value. The two measured peak values near and far away from an individual orifice were 6.72 and 6.55 mm/h, and the two fitting peak values were 5.94 and 5.95 mm/h at a pressure of 103 kPa. The relative errors of 11.61% and 9.16% indicated that the fitting correlation was in good agreement with the experimental data.
The variation trend of the fitting parameters was used to analyze the influence of pressure, as shown in Figure 6. The dotted line represents a unimodal value far away from an individual orifice, and the solid line is the unimodal value close to an individual orifice in the figure. When the pressure gradually increased, the coefficients of k1 and k2 and the peak value near the orifice were almost constant. The peak value far away from the orifice decreased at first and then increased slowly, such as the solid line and black square in Figure 6a. When the pressure was 69 kPa or 103 kPa, two peak values were close with the same variation trend of Figure 5a. The results showed that μx and σx were almost constant at different pressures, while μy increased slightly with the pressure. The variation trend of σy was complicated and had a mutation at a pressure of 69 kPa. Compare with the other eleven individual orifices under three pressures, further analysis showed that the influence of the pressure on the peak value and the dispersion of the water application intensity was relatively complicated. The coefficients of k1 and k2, the peak location μx and the dispersion degree σx kept relatively little variation with the pressure increasing, but the peak location μy moved away from an individual orifice.
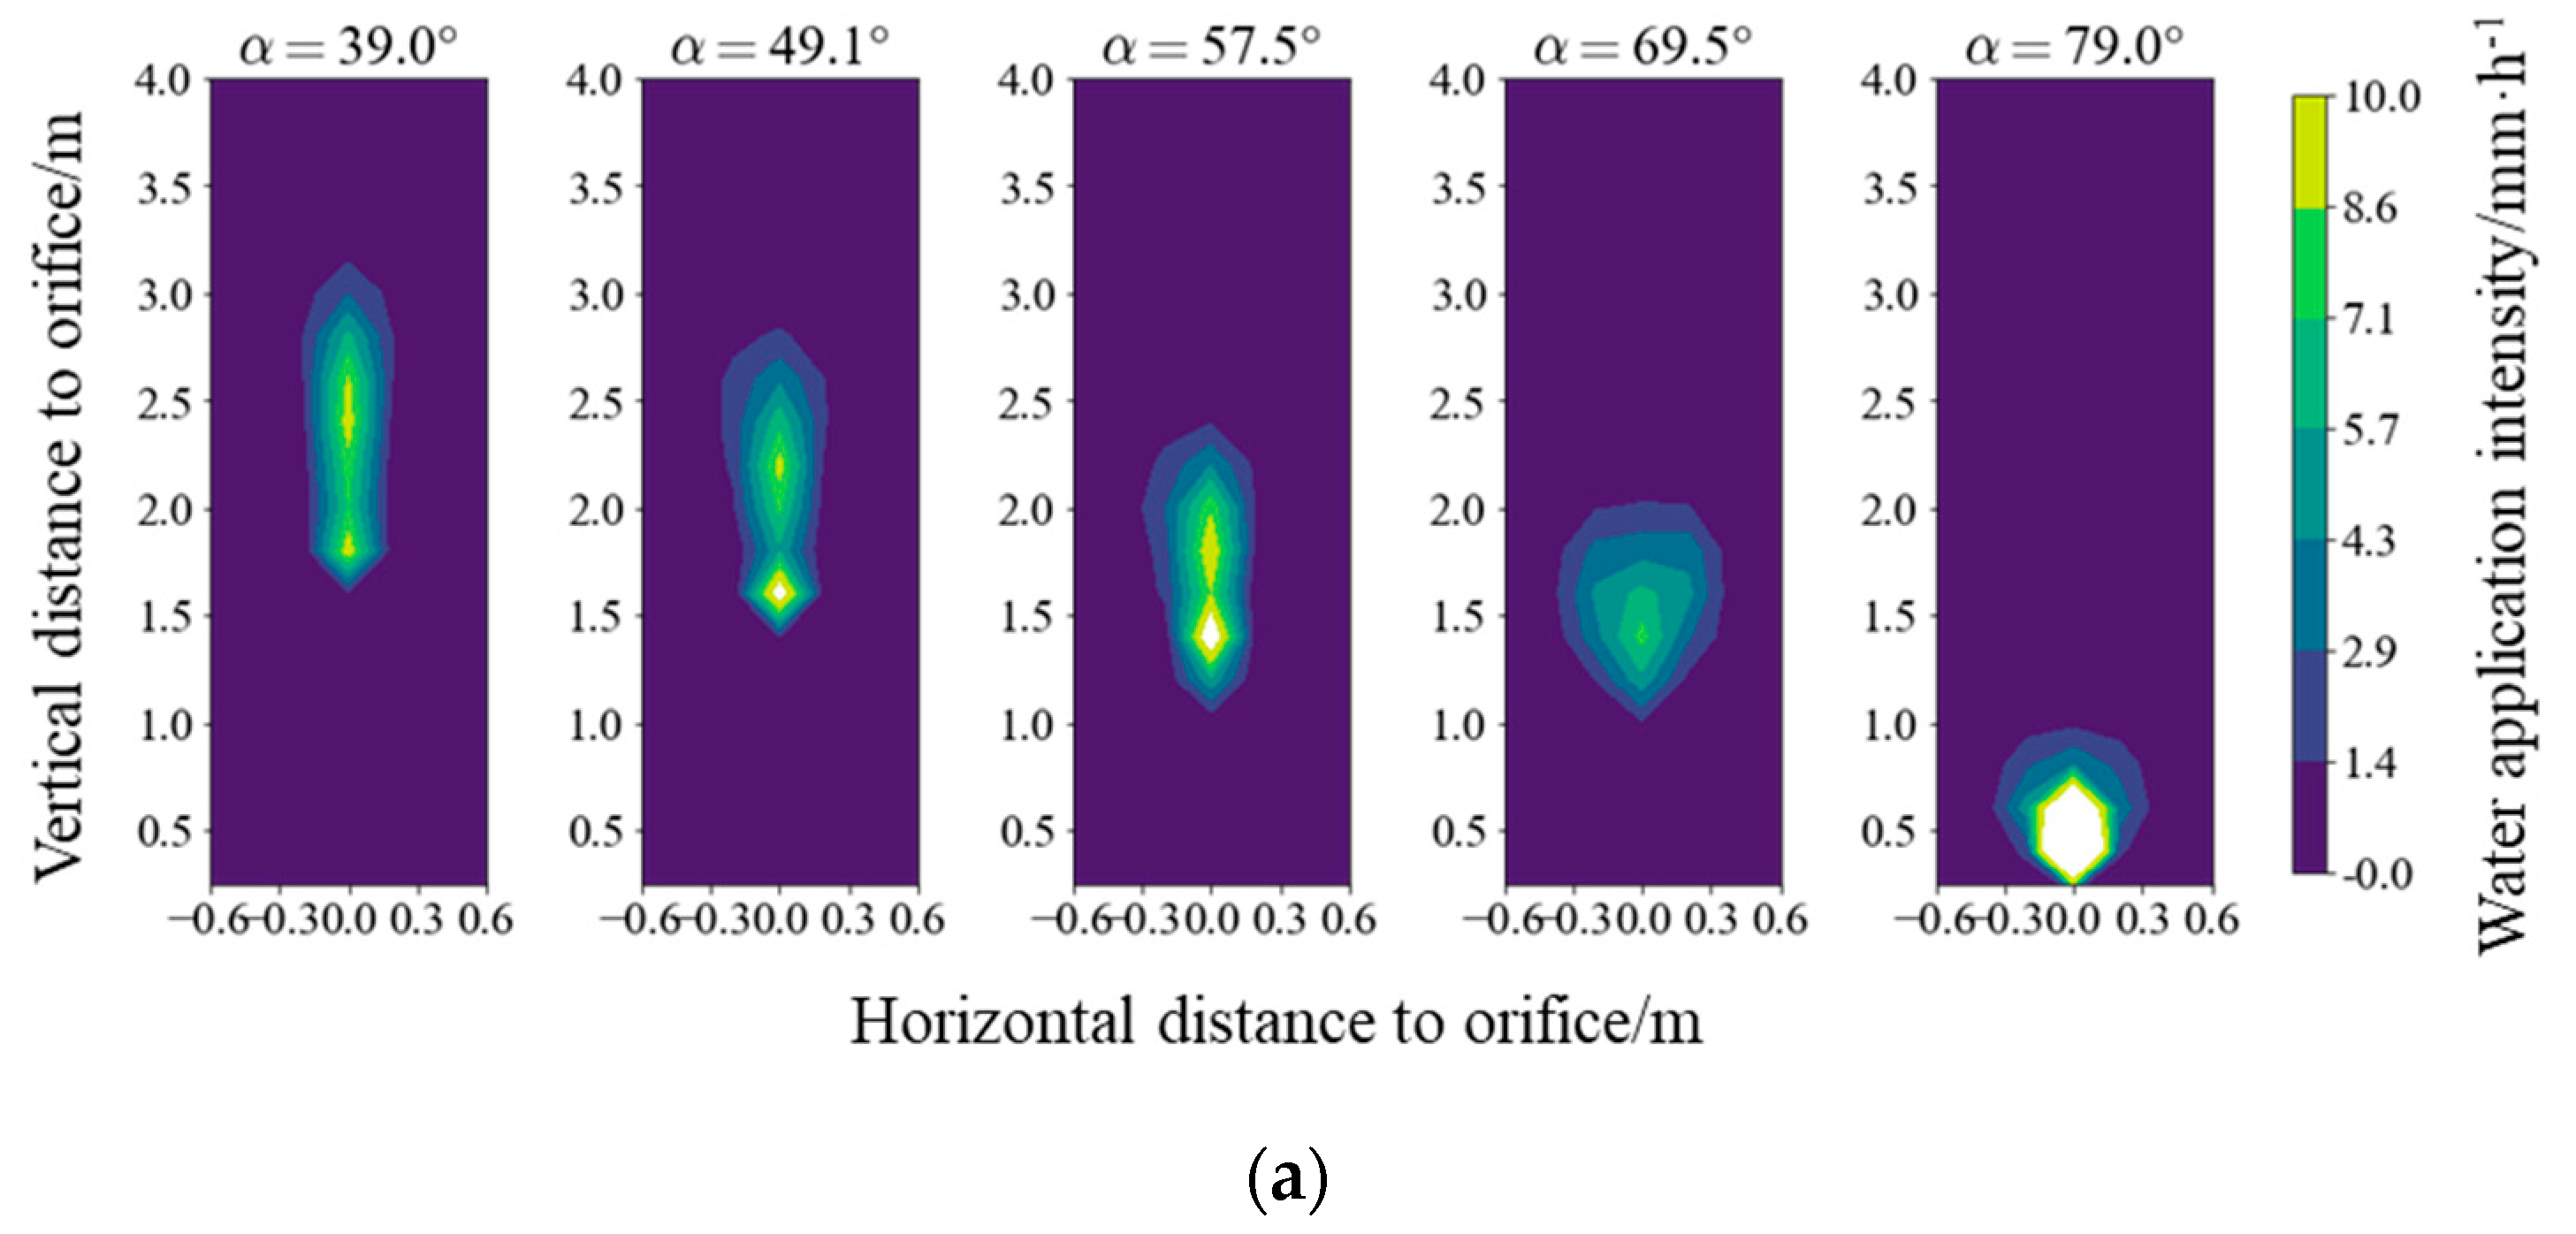
Figure 7 shows the measured value and fitting value of the water application intensity distribution of the individual orifice a3-6 at the five different spraying angles of 39.0°, 49.1°, 57.5°, 69.5° and 79.0°, when the pressure was at 103 kPa. The distributions were all unimodal at pressures of 41 kPa and 69 kPa, but there were unimodal and bimodal distributions at a pressure of 103 kPa, which was perfect for the demonstration of the proposed bimodal model in this study. The spraying region gradually moved away from the orifice, and the distance between the two peak locations gradually decreased with the increase in the spraying angle. The minimum and maximum peak values of water application intensity occurred at spraying angles of 69.5° and 79.0°, respectively. The fitting value of the water application intensity distribution was similar to the measured value, but there was little difference in the peak value.
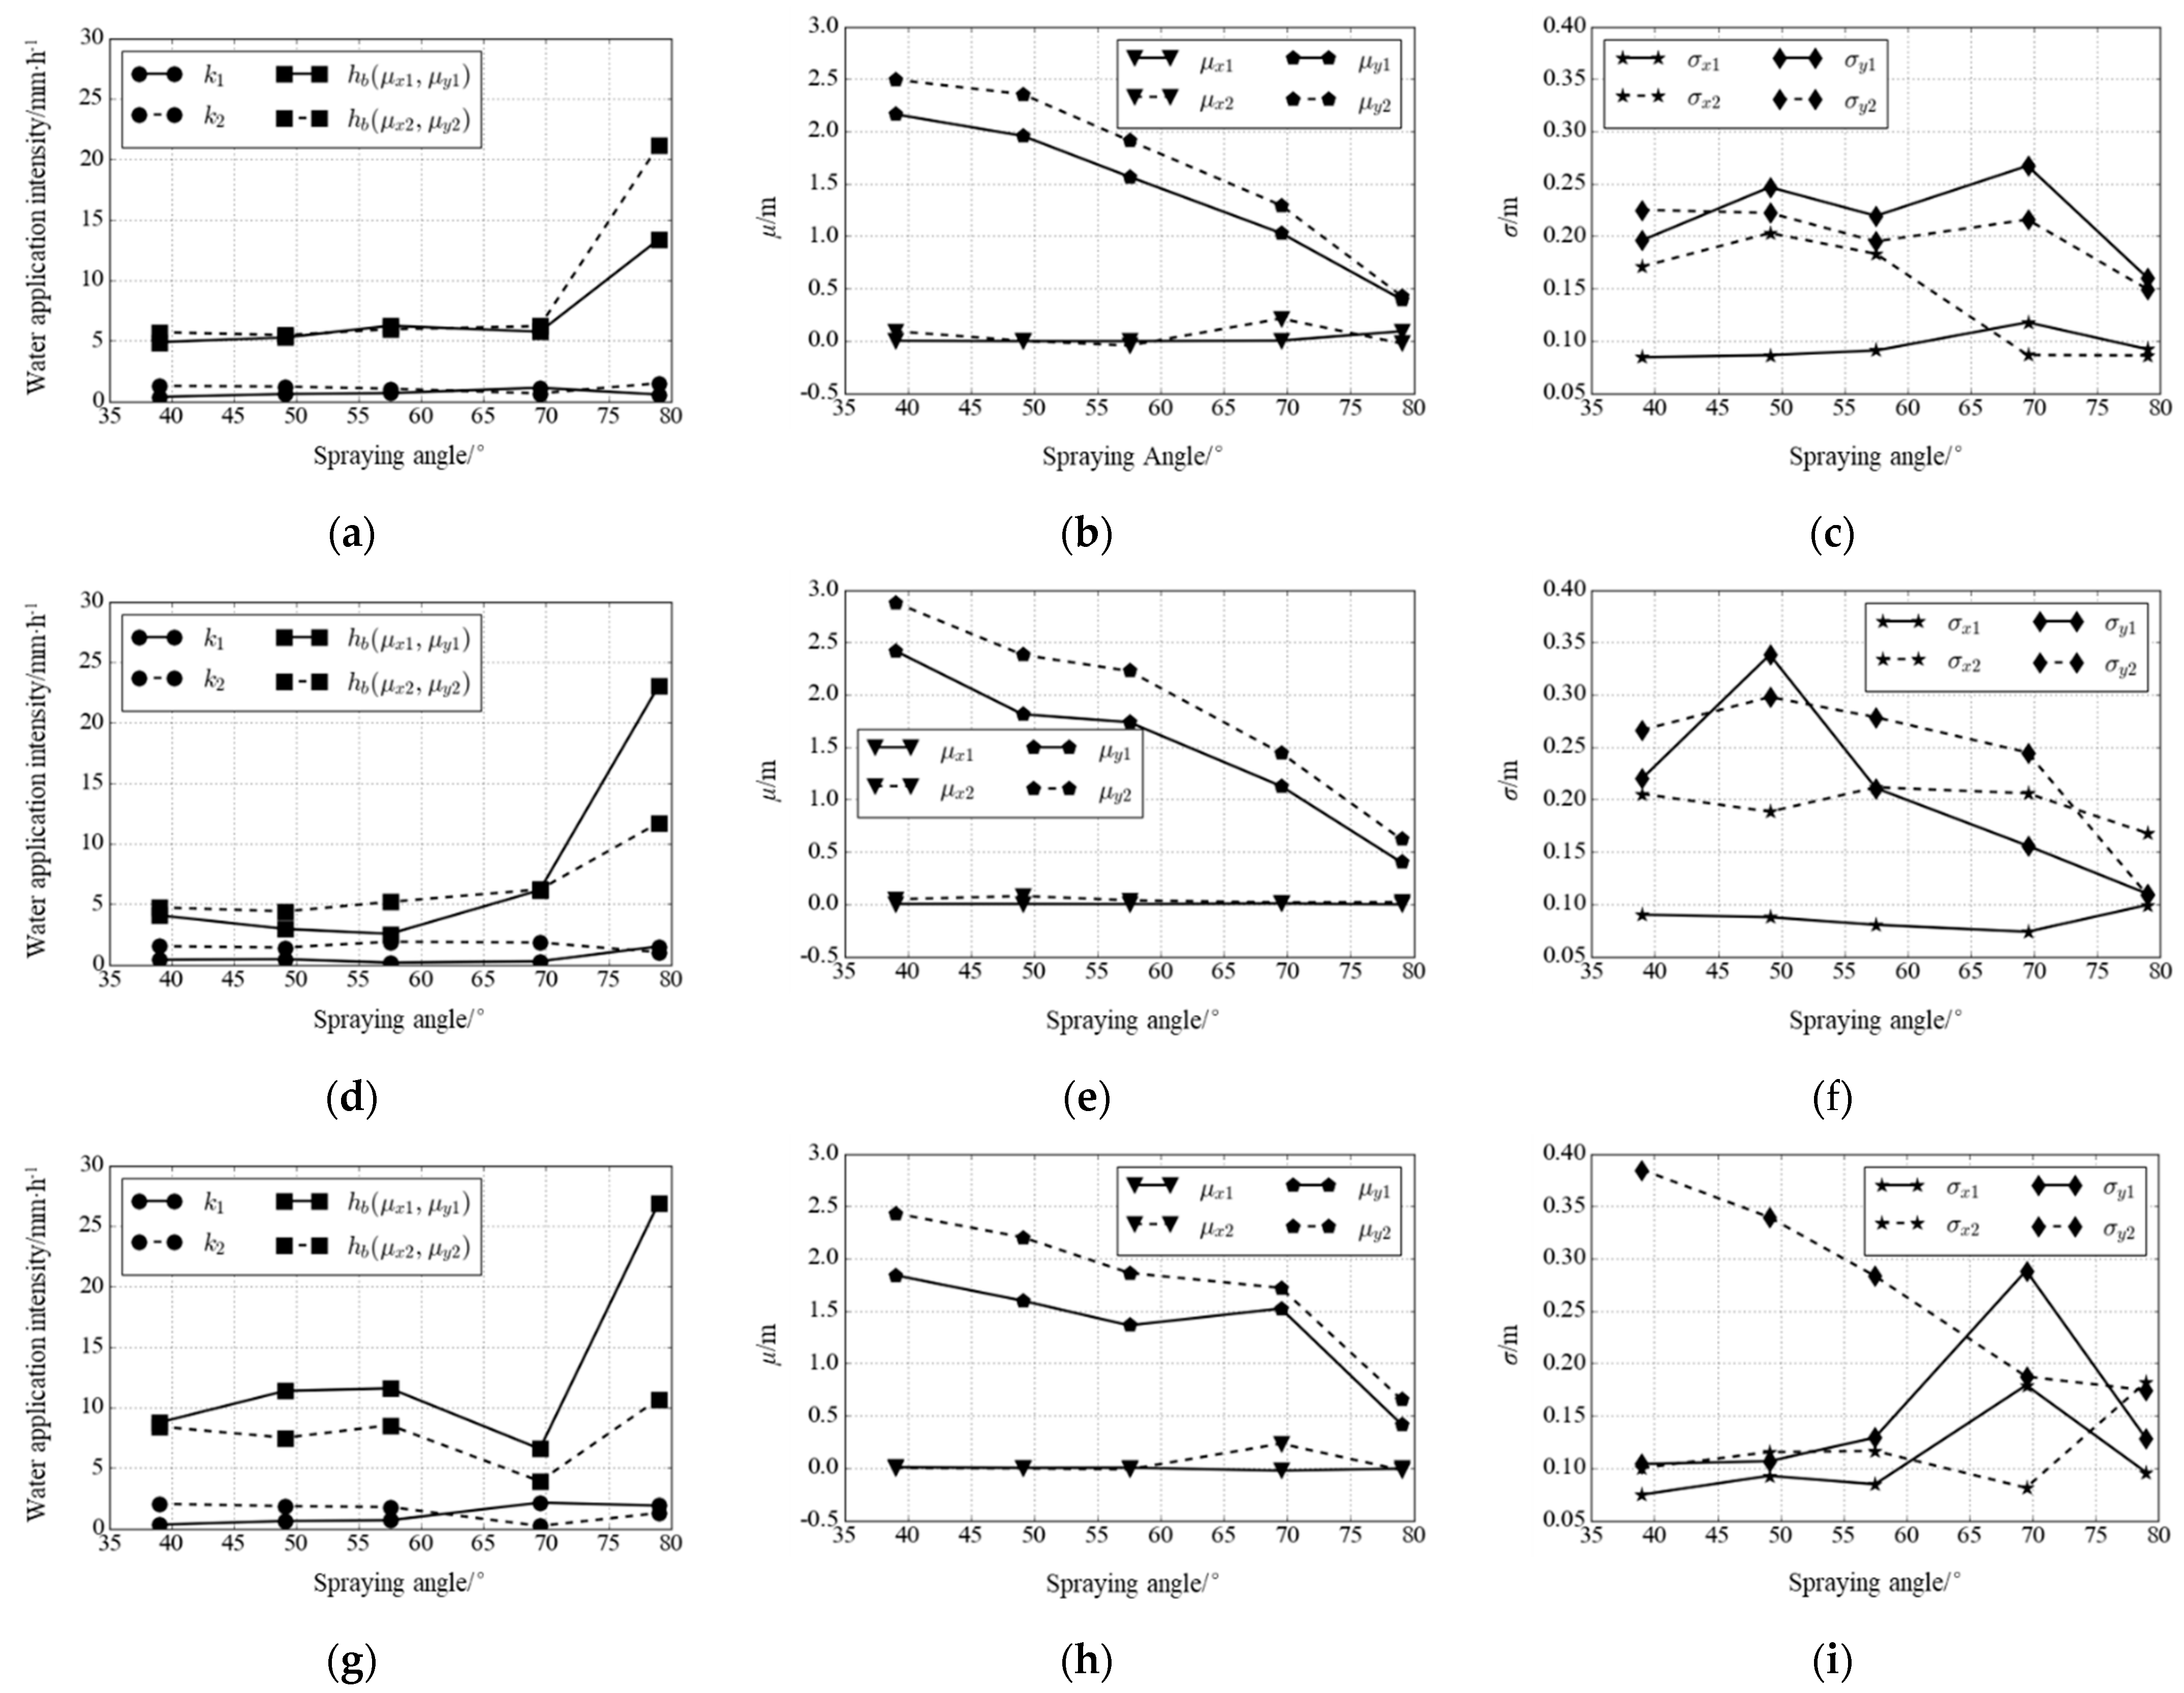
Basically, the coefficients of k1 and k2 were not sensitive to the pressure or spraying angle, except at very large spraying angles, as shown in Figure 8. As the spraying angle increased, the two peak values of the water application intensity fluctuated on a small scale. When the spraying angle exceeded 69.5°, the peak value began to increase, and the gap between the two peak values became larger. The peak value of the water application intensity gradually increased with the increase in pressure. μx1 and μx2 were almost constant, but μy1 and μy2 decreased with increasing angles, which meant the peak locations moved towards the spraying orifice. At a pressure of 103 kPa, the locations of the two peaks in the vertical direction gradually moved from separation to coincidence, which was consistent with the transition from a bimodal distribution to a unimodal distribution in Figure 7a. The dispersion σx was almost unchanged with the varying pressure and spraying angle, and the dispersion σy2 gradually decreased from 69 kPa to 103 kPa with the spraying angle increasing. The spraying angle had a great influence on the peak location and the position of the spraying region. With the increase in the spraying angle, the position of the spraying region moved towards the orifice spray hole, which affected the spraying width of the micro-sprinkling hose.
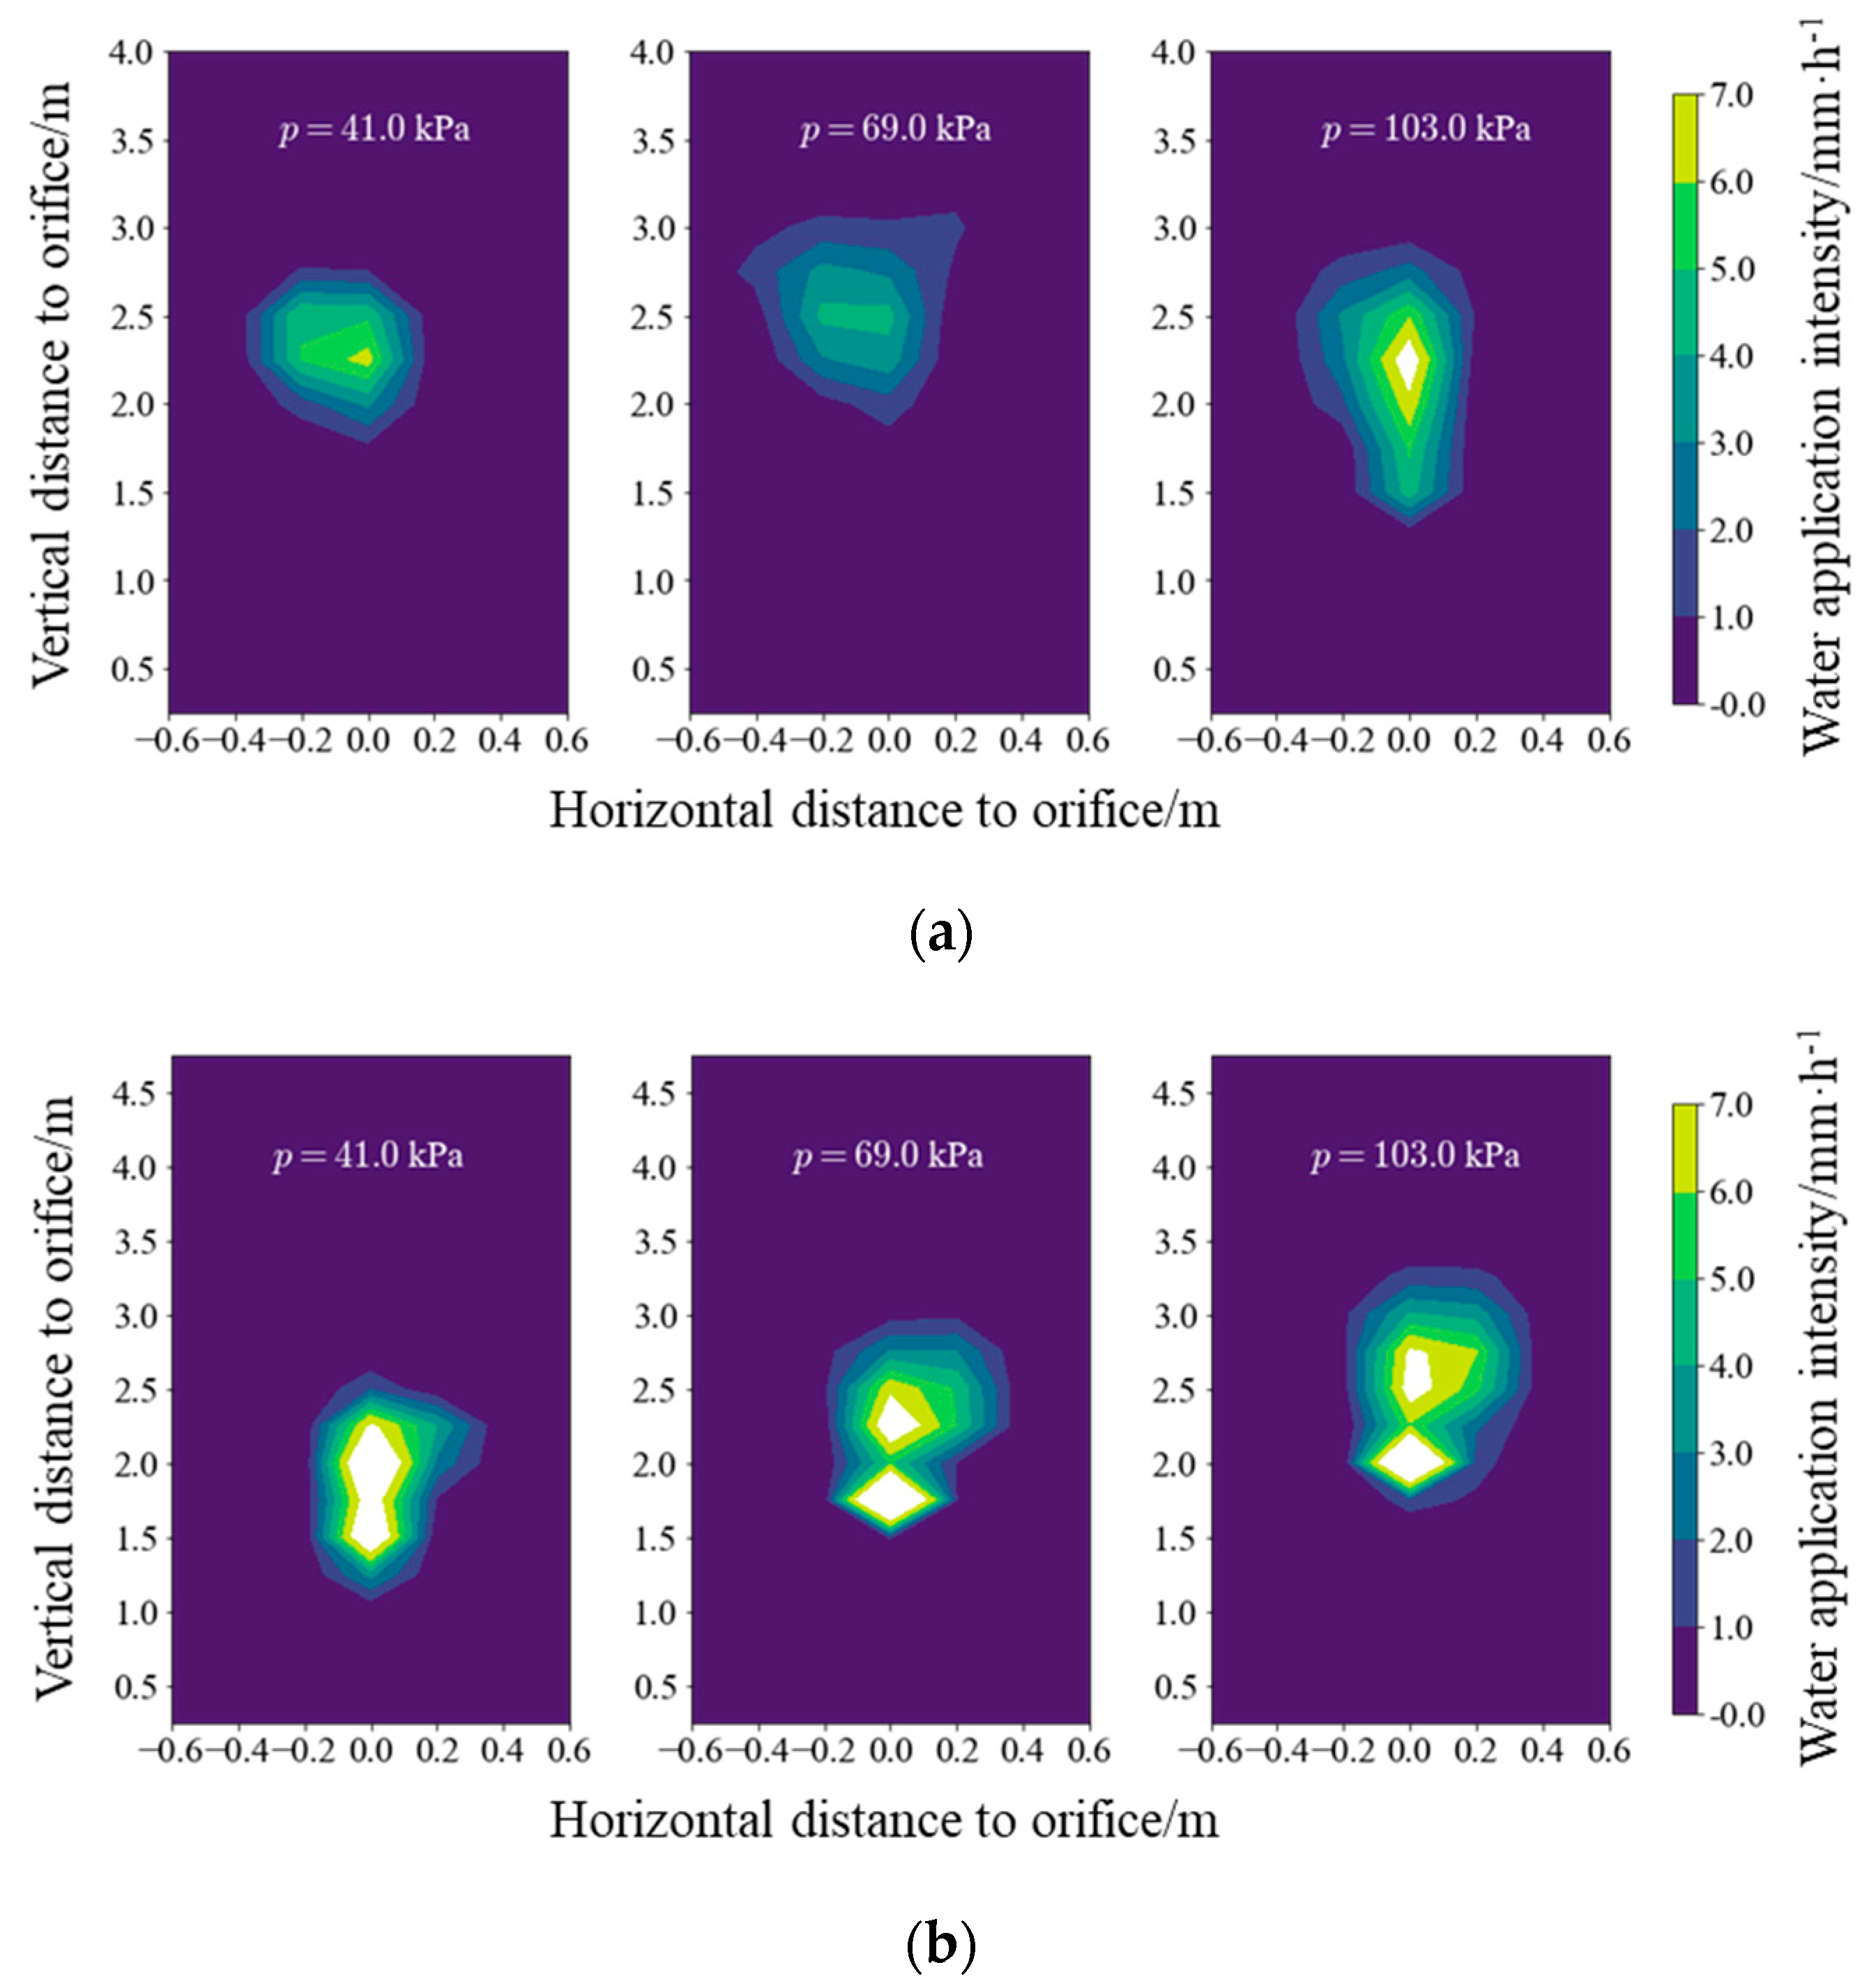
The influence of the structural parameters of an individual orifice was also significant for the prediction of its water application intensity distribution. The inner orifice area was used to quantify the influence of the drilling method and the wall thickness. Figure 9 shows the experimental value of the water application intensity distribution of orifice a3-5 and a3-8 at three pressures. The areas of the two orifices were 0.080 mm2 and 0.116 mm2, and the spraying angles were 47.8° and 47.7°, respectively. The peak values of the water application intensity of orifice a3-5 were much higher than that of orifice a3-5, and the patterns were different. Overall, the water application intensity distribution of small spraying angles might be unimodal or bimodal, and that of larger spraying angles were all unimodal. For the same pressure, two distribution modes, including all unimodal distributions and the transition from bimodal to unimodal, occurred with the spraying angle increasing.

3.3. Superposition of Water Application Intensity Distribution

It was assumed that there was no wind effect or the interaction of water droplets. The water application intensity distribution of a sample section of a micro-sprinkling hose was considered as the overlapping of the water distribution of multiple groups of orifices, while the water distribution of an orifice group was regarded as the overlapping of the water distribution of multiple individual orifices.
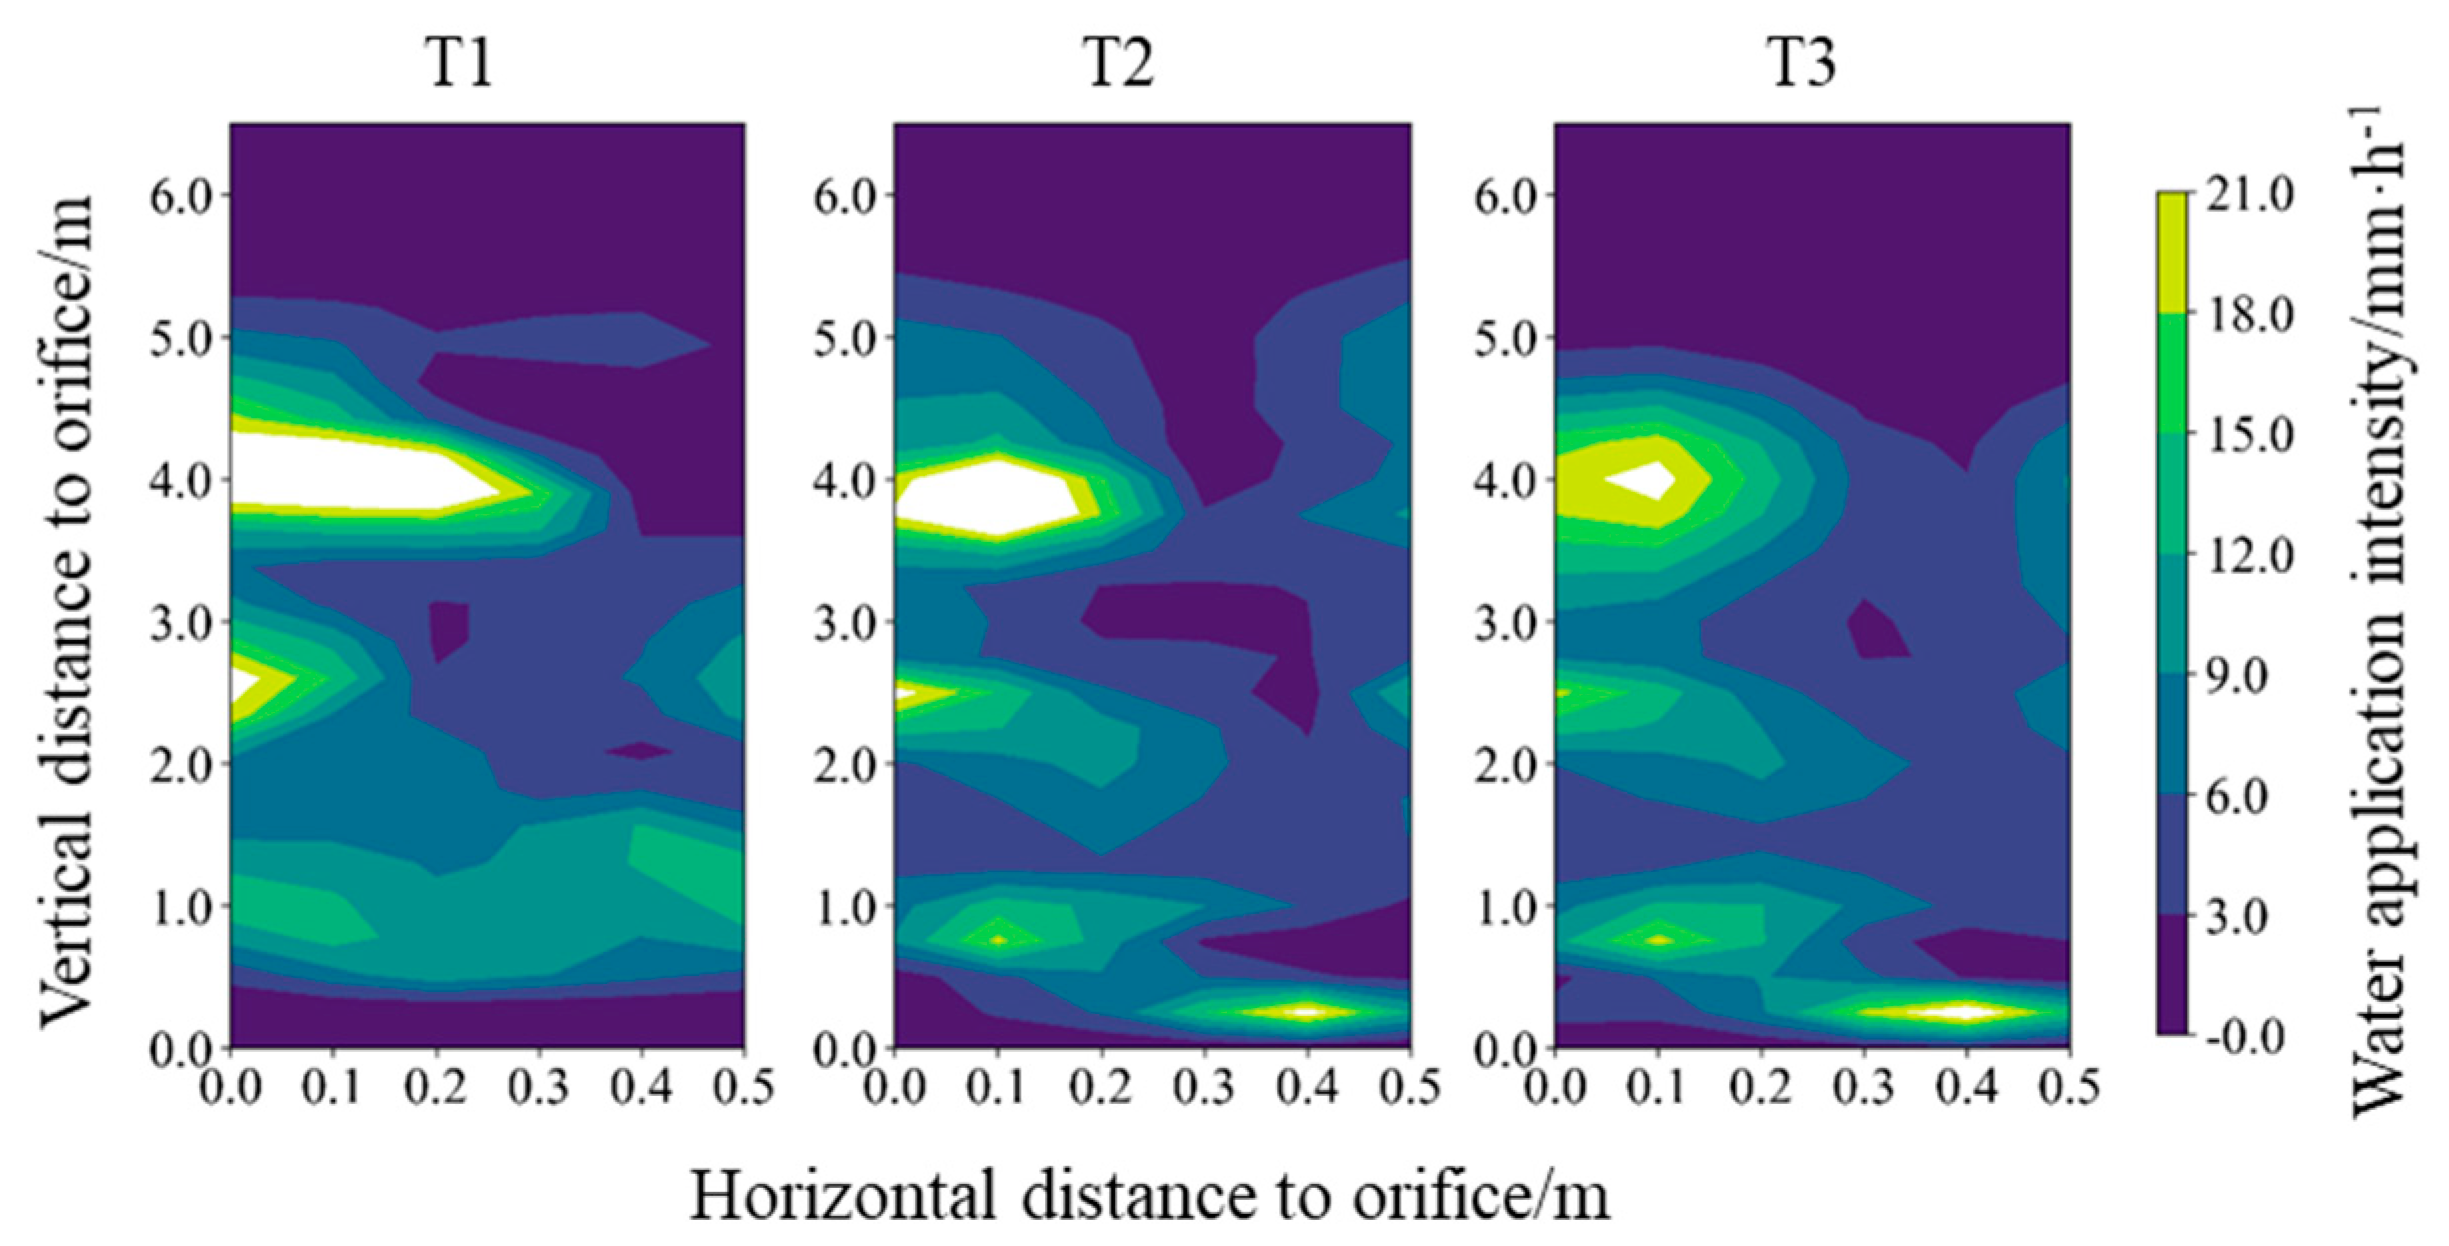
Figure 10 [32] presents the water application intensity distribution of single-sided (odd-numbered) micro-sprinkling hose with the third group of orifices at a pressure of 103 kPa. In Figure 10, T1 was the measured water application intensity distribution, T2 was calculated by overlapping the measured water application intensity of multiple individual orifices, and T3 was calculated by the overlapping of the fitting water application intensity distribution of multiple individual orifices with a bimodal two-dimensional Gaussian distribution model.
T2 was processed in the following steps:
  • Determine the spraying region of single-sided orifice groups;
  • Divide the spraying region using evenly distributed grid nodes;
  • Use coordinate transformation in the treatment of the measured values;
  • Apply linear interpolation to calculate the water application intensity of six individual orifices on the spraying region of single-sided orifice groups;
  • A summation of the water application intensity on six individual orifices in the same grid nodes is given to calculate the fitted value of single-sided orifice groups;
  • Determine the spraying region of the single-sided micro-sprinkling hose;
  • Divide the spraying region using evenly distributed grid nodes;
  • Use coordinate transformation in the treatment of the calculated values on single-sided orifice groups;
  • Apply linear interpolation to calculate the water application intensity of four single-sided orifice groups on the spraying region of the single-sided micro-sprinkling hose;
  • A summation of water application intensity on four single-sided orifice groups in the same grid nodes is given to calculate the value of the single-sided micro-sprinkling hose;
  • Determine the spraying region of the single-sided micro-sprinkling hose;
  • Based on above-mentioned stages, the calculated value of the water application intensity on the other-sided micro-sprinkling hose is calculated in the same way.
  • T3 was processed in the following steps:
  • Determine the spraying region of the single-sided micro-sprinkling hose;
  • Fit the water application intensity of all individual orifices on the single-sided micro-sprinkling hose with the bimodal two-dimensional Gaussian distribution model;
  • Use coordinate transformation in the treatment of the fitting formula on each orifice along x-axis, and move the origin of the coordinate system to the first individual orifice in the third group;
  • A summation of the fitting formula on all individual orifices is given to calculate the water application intensity with the coordinates on the spraying region of the single-sided micro-sprinkling hose.
  • Based on above-mentioned stages, the fitted value of the water application intensity on the other-sided micro-sprinkling hose is calculated in the same way.
The spraying region of the third orifice group was selected for comparison due to the limitations of the sample length of the micro-spraying hose and the rain gauge location. T1, T2 and T3 considered the overlapping of the second and fourth group of orifices. The total amount of the water sprayed on the one-sided ground, which was equal to the total discharge of the six individual orifices, was calculated by the water application intensity and the control area of each rain gauge. At a pressure of 103kPa, the total discharge of the six individual orifices (single-sided) was measured by plastic bottles, which was 0.024 m3/h. The total discharge was computed by the water application intensity and control area within the distribution region, and the values were 0.025, 0.023 and 0.022 m3/h for T1, T2 and T3, respectively. This indicated that the overlap method and the 2D bimodal model proposed in this study could be better used to calculate the discharge. In Figure 10, T1, T2 and T3 seemed to have similar patterns in the distribution of the water application intensity. Compared with T1, T2 and T3 captured more distribution details between 0 and 1.0 m in the vertical direction, and the reason was due to the different placement spacing of the catch cans between the orifice and orifice group experiment.
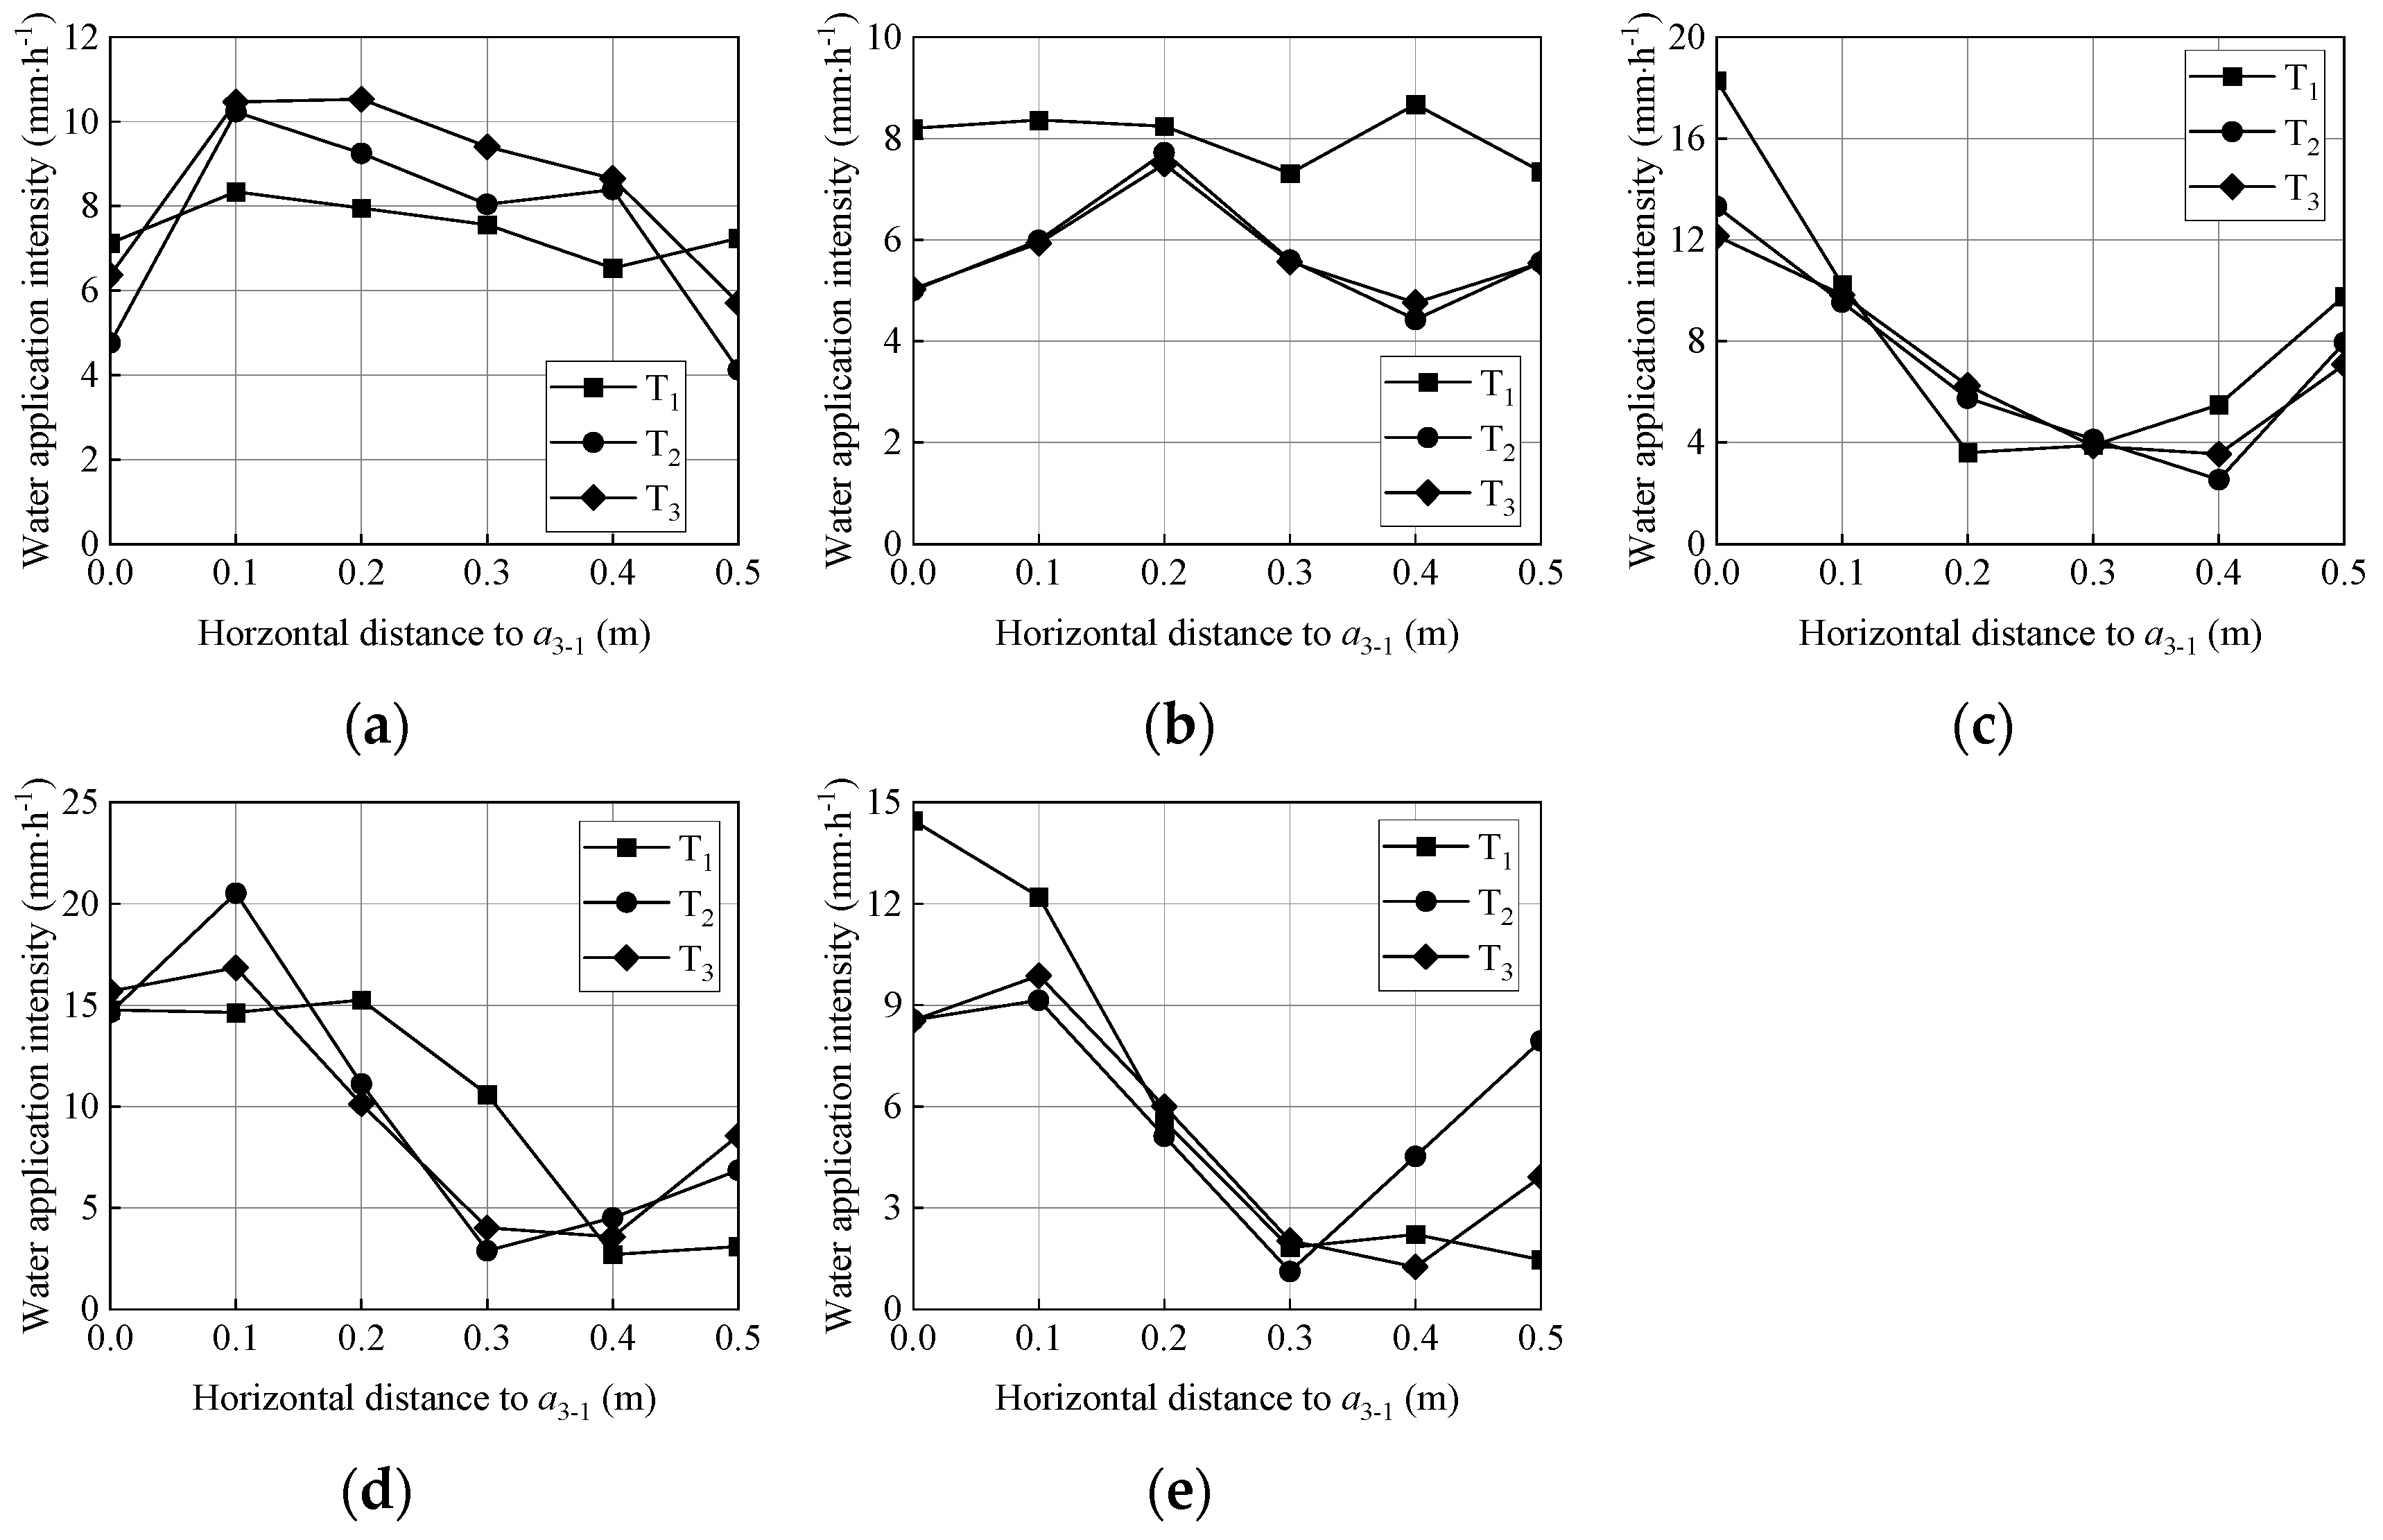
In order to better compare T1, T2, and T3, the spraying region was divided into five equidistant parts in the vertical direction. The average water application intensity was calculated at the corresponding points in different regions so as to accurately compare the difference in the water application intensity on a two-dimensional plane, as shown in Figure 11. In the vertical distance varying between 1.0 and 2.0 m, T1 had little error with T2 and T3. The variation trend was basically the same, and the error was small in the other equidistant regions. The average water application intensity first increased and then decreased in the vertical distance below 2 m, but the average first decreased then increased in the other regions.

3.4. Optimization Results

Comparing pressure and orifice area, the effect of the spraying angle on the water application intensity distribution was more intuitive. In this study, the measured micro-sprinkling hose was used as the initial model. The orifice spacing and the spacing between each group orifice were 0.5 m. It was assumed that 12 individual orifices in a group of orifices had the same orifice area depending on orifice a3-6. Based on the measured value of the water application intensity distribution of orifice a3-6 at the five different spraying angles of 39.0°, 49.1°, 57.5°, 69.5° and 79.0° at a pressure of 41 kPa, the reasonable range of orifice angle equal to spring angle varied from 39.0° to 79.0°.
During the calculation process with the Monte Carlo method, the initial sample number was 50, and a random sequence of the spraying angle including six individual orifices were generated on Python. Based on the two-dimensional distribution model and cubic spline interpolation, the fitted parameter of the water application intensity on any spraying angle varying from 39.0° to 79.0° was calculated, and Figure 12 shows the effect between the fitted parameter and spraying angle. The water application intensity distribution of any spraying angle could be determined by fitting parameters.
When the sample number was determined, the water application intensity of the micro-sprinkling hose was calculated by six individual orifices. The uniformity coefficient CU and the spraying width B of all scenarios from S1 to S50 were calculated in turn. Due to the different dimensions of CUi and Bi, a weighting method was used to convert the multi-objective problem into a single-objective problem. The following is the calculation formula for multi-objective problem solving:
w i = w × B i B tar + 1 w × CU i CU tar ,
where i is the i-th sample scenario under different sample numbers; wi is evaluation index; w is weight factor and its value was 0.5; Btar is the target value of the spraying width in the sample number and its value was 3.0 m; and CUtar is the target value of the Christianson uniformity coefficient and its value was 50%.
The optimal evaluation index is the maximum wi under different sample numbers. An appropriate sample number was used to reduce computing costs, and Table 3 shows max{wi} under different sample numbers. The results presented that max{wi} increased with the sample number increasing. When the sample number exceeded 10,000, max{wi} changed very little, which indicated that 10,000 might be the recommended sample number. The maximum wi corresponding to six individual orifices was the optimal orifice arrangement among the 10,000 scenarios, and the other single-sided group of orifices was arranged in the same way. Table 4 shows the orifice arrangement including the spraying angle α2 and the distance from the orifice center to the edge ld. An optimized orifice arrangement of the micro-sprinkling hose was obtained with a uniformity coefficient up to 58.5%. Compared with drip, sprinkler and micro-sprinkler irrigation, the uniformity coefficient of micro-sprinkling hoses was low. For the sprinkler irrigation system, the uniformity coefficient was calculated by the water distribution of multiple sprinklers [21]. The uniformity coefficient of the micro-sprinkling hose was not considered with the overlapping of multiple micro-sprinkling hoses, whereas its uniformity coefficient in soil can reach 90%, which is beneficial to crop growth [10].

4. Conclusions

This study conducted experiments to measure the water application intensity distribution for individual orifices and multiple groups of orifices under three working pressures including 41, 69 and 103 kPa. A bimodal Gaussian distribution model was used to fit the water application intensity distribution of individual orifices, so that the complicated two-dimensional patterns could be reduced to several fitting parameters. The following conclusions can be drawn:
  • The difference between the orifice angles and spraying angles was small. The bimodal Gaussian distribution model performed well on tracking the two-dimensional features of the water application intensity distribution, where R2 > 0.90 and NRMSE < 30%.
  • The water application intensity distribution of an individual orifice was affected by the pressure, spraying angle and orifice area, of which the spraying angle was the most sensitive factor. The influence of pressure on the peak value, peak location and the dispersion of the water application intensity distribution was relatively complicated. When the spraying angle exceeded 69.5°, the peak value began to increase, and μy1 and μy2 decreased with increasing angles.
  • The water application intensity distribution of multiple groups of orifices could be calculated by overlapping the water application intensity distribution of each orifice. The Monte Carlo method was used for the optimization investigation of the orifice arrangement. An optimized orifice arrangement of the micro-sprinkling hose was obtained with a uniformity coefficient up to 58.5%. When the working pressure is 41 kPa, it is recommended that the spraying angles of the 12 individual orifices are 62.5°, 62.5°, 46.0°, 46.0°, 76.8°, 76.8°, 68.5°, 68.5°, 49.1°, 49.1°, 76.0° and 76.0°. Correspondingly, the distance from the orifice center to the edge of the 12 individual orifices are 21.5, 32.5, 15.9, 38.1, 26.5, 27.5, 23.6, 30.4, 16.9, 37.1, 26.2 and 27.8 mm. This study involved the same orifice diameter with a different orifice arrangement in the optimization method, and further research is therefore required.

Author Contributions

Conceptualization, Y.X. and X.W.; methodology, Y.X. and X.W.; software, Y.X.; validation, X.W. and Y.X.; formal analysis, X.W.; resources, H.T. and H.Y.; writing—original draft preparation, X.W.; writing—review and editing, X.W. and Y.X.; visualization, X.W.; supervision, Y.X., H.Y. and L.Z.; project administration, H.Y.; funding acquisition, H.Y. All authors have read and agreed to the published version of the manuscript.

Funding

This research was funded by the Key Research and Development Program of Hebei Province (Grant No. 20327003D, 21327002D).

Data Availability Statement

Data is contained within the article.

Acknowledgments

The authors greatly thank Chengfan Sun and Shicheng Jin for help in the process of conducting the experiments and Xin Hui for help in data processing.

Conflicts of Interest

The authors declare no conflict of interest.

References

  1. Jägermeyr, J.; Gerten, D.; Heinke, J.; Schaphoff, S.; Kummu, M.; Lucht, W. Water savings potentials of irrigation systems: Global simulation of processes and linkages. Hydrol. Earth Syst. Sci. 2015, 19, 3073–3091. [Google Scholar] [CrossRef] [Green Version]
  2. Ministry of Water Resource. People’s Republic of China 2021 Statistic Bulletin on China Water Activities; China Water Power Press: Beijing, China, 2022.
  3. Hui, X.; Zheng, Y.D.; Yan, H.J. Water distributions of low-pressure sprinklers as affected by the maize canopy under a centre pivot irrigation system. Agric. Water Manag. 2021, 245, 106646. [Google Scholar] [CrossRef]
  4. Reyes-Cabrera, J.; Zotarelli, L.; Dukes, M.D.; Rowland, D.L.; Sargent, S.A. Soil moisture distribution under drip irrigation and seepage for potato production. Agric. Water Manag. 2016, 169, 183–192. [Google Scholar] [CrossRef] [Green Version]
  5. Koumanov, K.S.; Hopmans, J.W.; Schwankl, L.J.; Andreu, L.; Tuli, A. Application efficiency of micro-sprinkler irrigation of almond trees. Agric. Water Manag. 1997, 34, 247–263. [Google Scholar] [CrossRef]
  6. De Almeida, C.D.G.C.; Botrel, T.A.; Smith, R.J. Characterization of the microtube emitters used in a novel micro-sprinkler. Irrig. Sci. 2009, 27, 209–214. [Google Scholar] [CrossRef]
  7. Home, P.G.; Panda, R.K.; Kar, S. Effect of method and scheduling of irrigation on water and nitrogen use efficiencies of Okra (Abelmoschus esculentus). Agric. Water Manag. 2002, 55, 159–170. [Google Scholar] [CrossRef]
  8. Liu, H.F. Study on Hydraulic Characteristics of Micro-Pressure Perforated Flexible Hose. Ph.D. Thesis, Northwest Agriculture and Forestry University, Yangling, China, July 2008. (In Chinese). [Google Scholar]
  9. Shi, H.Z.; Gao, W.K.; Chang, S.M.; Di, H.H.; Wang, T.X.; Yang, S.Q.; Wang, T.Y.; Wang, G.S. Effect of irrigating water quota with micro-irrigation on soil physical properties and nutrient transport in different layers of tobacco soil. J. Henan Agric. Univ. 2009, 43, 485–490. (In Chinese) [Google Scholar]
  10. Man, J.G.; Yu, J.S.; White, P.J.; Gu, S.B.; Zhang, Y.L.; Guo, Q.F.; Shi, Y.; Wang, D. Effects of supplemental irrigation with micro-sprinkling hoses on water distribution in soil and grain yield of winter wheat. Field Crops Res. 2014, 161, 26–37. [Google Scholar] [CrossRef]
  11. Man, J.G.; Wang, D.; White, P.J.; Yu, Z.W. The length of micro-sprinkling hoses delivering supplemental irrigation affects photosynthesis and dry matter production of winter wheat. Field Crop Res. 2014, 168, 65–74. [Google Scholar] [CrossRef]
  12. Ghidiu, G.; Kuhar, T.; Palumbo, J.; Schuster, D. Drip chemigation of insecticides as a pest management tool in vegetable production. J. Integr. Pest Manag. 2012, 3, E1–E5. [Google Scholar] [CrossRef] [Green Version]
  13. Zhang, H.; Liu, H.; Wang, S.S.; Guo, X.; Gong, X.W.; Sun, J.S. Modelling the soil water dynamics under micro-sprinkling hose irrigation for distorted roots of transplanted cotton. Int. J. Agric. Biol. 2019, 21, 191–200. [Google Scholar]
  14. Zhang, X.J.; Wu, Z.W.; Ding, X.M.; Li, X. Experimental analysis of water distribution characteristics of micro-sprinkling hose. Trans. Chin. Soc. Agric. Eng. 2009, 25, 66–69. (In Chinese) [Google Scholar]
  15. Dou, C.Y.; Meng, W.Z.; Zhang, L.K.; Yu, H.D.; Guo, M. Effects of hole arrangement on irrigation uniformity under micro-spraying hose irrigation. J. Irrig. Drain. 2015, 34, 42–46. (In Chinese) [Google Scholar]
  16. Wang, W.J.; Wang, W.E.; Hu, X.T.; Dai, D.K. Effects of spraying angle and pressure on the droplet distribution of micro-sprinkling hose. Trans. Chin. Soc. Agric. Eng. 2021, 37, 73–81. (In Chinese) [Google Scholar]
  17. Wang, J.J.; Yang, Y.Q.; Cai, J.M.; Zhai, G.L. Experimental study on the influence of working pressure and spraying angle on the single-hole spray characteristics of micro-sprinkling hose. Water Sav. Irrig. 2018, 4, 35–38. (In Chinese) [Google Scholar]
  18. Zhou, B.; Feng, J.; Zhang, X.J.; Wu, Z.W.; Shen, X.M. Characteristics and indexes of water distribution of punched thin-soft tape for spray. Trans. Chin. Soc. Agric. Eng. 2003, 19, 101–103. (In Chinese) [Google Scholar]
  19. Zhang, L.D.; Feng, J.; Zeng, A.J.; Zhou, B. Mathematical model of distribution of water application rate with punched thin-soft spray tape. J. China Agric. Univ. 2002, 7, 30–33. (In Chinese) [Google Scholar]
  20. Di, Z.G.; Yang, L.H.; Gou, W.L.; Wang, J.Y. Model establishment of spraying width of thin-walled micro-sprinkling hose. Trans. Chin. Soc. Agric. Eng. 2019, 35, 28–34. (In Chinese) [Google Scholar]
  21. Li, Y.C.; Bai, G.; Yan, H.J. Development and validation of a modified model to simulate the sprinkler water distribution. Comput. Electron. Agric. 2015, 111, 38–47. [Google Scholar] [CrossRef]
  22. Sadeghi, H.; Peters, T.R.; Amini, M.Z.; Malone, L.S. Novel approach to evaluate the dynamic variation of wind drift and evaporation losses under moving irrigation systems. Biosyst. Eng. 2015, 135, 44–53. [Google Scholar] [CrossRef] [Green Version]
  23. Zhou, B. Study on the Water Application Rate Distribution of Punched Thin-Soft Spray Tape. Master’s Thesis, China Agricultural University, Beijing, China, 2001. (In Chinese). [Google Scholar]
  24. Xu, R.; Wang, W.E.; Hu, X.T. Experimental study on the influence of working pressure on water distribution uniformity of micro-sprinkler belt. Water Sav. Irrig. 2020, 9, 88–93. (In Chinese) [Google Scholar]
  25. Wang, J.Y.; Yang, L.H.; Gou, W.L.; Di, Z.G.; Dong, Y.H. Optimization analysis of laying length of thin wall micro-spray belt under different slope conditions. Water Sav. Irrig. 2020, 183, 56–60. (In Chinese) [Google Scholar]
  26. Wang, J.Y.; Yang, L.H.; Gou, W.L.; Di, Z.G. Experimental study on uniformity of combination and the paving spacing for thin wall micro spray belt. J. Irrig. Drain. 2020, 39, 72–77+83. (In Chinese) [Google Scholar]
  27. Tang, P.; Li, H.; Chen, C.; Sun, C.Z. Optimization and experiment of adjustable structural parameters for vertical impact sprinkler with working pressure. Trans. Chin. Soc. Agric. Eng. 2016, 32, 99–107. (In Chinese) [Google Scholar]
  28. Chen, D.D.; Wallender, W.W. Economic sprinkler selection, spacing, and orientation. Trans. ASAE 1984, 27, 734–743. [Google Scholar]
  29. Li, S. The Study on Spray Nozzle Random Performance Test and Its Mathematical Simulation. Master’s Thesis, Hebei Agricultural University, Baoding, China, June 2011. (In Chinese). [Google Scholar]
  30. Cohen, A.C. Estimation in mixtures of two normal distributions. Technometrics 1967, 9, 15–28. [Google Scholar] [CrossRef]
  31. Christiansen, J.E. Irrigation by Sprinkler; California Agricultural Experimental Station Research Bulletin: Berkeley, CA, USA, 1942. [Google Scholar]
  32. Wang, X.S.; Xu, Y.C.; Yan, H.J.; Zhou, L.J.; Tan, H.B. Development of water distribution model of single orifice on micro-sprinkling hose. Trans. Chin. Soc. Agric. Eng. 2022, 38, 93–101. (In Chinese) [Google Scholar]
Figure 1. Sketch of orifice arrangement on a part of the micro-sprinkling hose.
Water 14 03260 g001
Figure 2. Schematic diagram of (a) orifice angle α1 and (b) spraying angle α2 of an individual orifice.
Water 14 03260 g002
Figure 3. The experimental setup in (a) schematic diagram and (b) physical map.
Water 14 03260 g003aWater 14 03260 g003b
Figure 4. The water application intensity distribution of different individual orifices: (a) the individual orifice a3-5 and (b) the individual orifice a3-1 at 41 kPa, spraying angles of which were 47.8° and 40.7°.
Water 14 03260 g004
Figure 5. The water application intensity distribution of the individual orifice a3-4 under different working pressures: (a) the measured value; and (b) the fitting value.
Water 14 03260 g005
Figure 6. Fitting parameters of water application intensity on the individual orifice a3-4 under different working pressures: (a) k and peak value; (b) μx and μy and (c) σx and σy. Notes: k1 and k2 were used to quantify the effect of the two unimodal peaks on the bimodal distribution. hb(μx1, μy1) and hb(μx2, μy2) are two peak values. μx1 and μx2 are the peak locations near and far away from an individual orifice in x direction. μy1 and μy2 are the peak locations near and far away from an individual orifice in y direction. σx1 and σx2 are the dispersion degrees of water distribution near and far away from an individual orifice in x direction; σy1 and σy2 are the dispersion degrees of water distribution near and far away from an individual orifice in y direction.
Water 14 03260 g006
Figure 7. The water application intensity distribution of an individual orifice a3-6 under different spraying angles at 103 kPa: (a) the measured value; and (b) the fitting value.
Water 14 03260 g007aWater 14 03260 g007b
Figure 8. Fitting parameters of water application intensity on the individual orifice a3-6 under different spraying angles: (a) k and peak value at 41 kPa; (b) μx and μy at 41 kPa, (c) σx and σy at 41 kPa, (d) k and peak value at 69 kPa; (e) μx and μy at 69 kPa, (f) σx and σy at 69 kPa, (g) k and peak value at 103 kPa; (h) μx and μy at 103 kPa and (i) σx and σy at 103 kPa. Notes: k1 and k2 were used to quantify the effects of the two unimodal peaks on the bimodal distribution. hb(μx1, μy1) and hb(μx2, μy2) are two peak values. μx1 and μx2 are the peak locations near and far away from an individual orifice in x direction. μy1 and μy2 are the peak locations near and far away from an individual orifice in y direction. σx1 and σx2 are the dispersion degrees of water distribution near and far away from an individual orifice in x direction; σy1 and σy2 are the dispersion degrees of water distribution near and far away from an individual orifice in y direction.
Water 14 03260 g008
Figure 9. The measured value of water application intensity distribution under different orifice areas: (a) the individual orifice a3-5; and (b) the individual orifice a3-8.
Water 14 03260 g009
Figure 10. Water application intensity of single-sided micro-sprinkling hose composed of odd-numbered individual orifices in different test modes: T1 was the measured value, T2 was the fitting value by overlapping the measured water application intensity of multiple individual orifices and T3 was fitting value with the overlapping and bimodal two-dimensional Gaussian distribution model of multiple individual orifices.
Water 14 03260 g010
Figure 11. Average water application intensity of single-sided micro-sprinkling hose composed of odd-numbered individual orifices in different test modes: (a) y = 0~1 m; (b) y = 1~2 m; (c) y = 2~3 m; (d) y = 3~4 m and (e) y = 4~5 m.
Water 14 03260 g011
Figure 12. Effect for different spraying angles on fitting parameters of water application intensity at 41 kPa: (a) k and peak value; (b) μx and μy and (c) σx and σy. Notes: k1 and k2 were used to quantify the effect of the two unimodal peaks on the bimodal distribution. μx1 and μx2 are the peak locations near and far away from an individual orifice in x direction. μy1 and μy2 are the peak locations near and far away from an individual orifice in y direction. σx1 and σx2 are the dispersion degrees of water distribution near and far away from an individual orifice in x direction; σy1 and σy2 are the dispersion degrees of water distribution near and far away from an individual orifice in y direction.
Water 14 03260 g012
Table 1. The orifice angles and spraying angles of 12 individual orifices.
ParametersNumber of the Individual Orifice
a3-1a3-2a3-3a3-4a3-5a3-6a3-7a3-8a3-9a3-10a3-11a3-12
α1 (°)40.038.376.750.048.380.036.745.068.368.366.766.7
α2 (°)40.741.274.854.147.882.034.347.773.870.563.774.6
Relative error (%)1.87.6−2.58.21.02.5−7.05.78.13.2−4.511.8
Table 2. The fitting evaluation parameters of bimodal two-dimensional Gaussian distribution model under three different working pressures for twelve individual orifices.
Working Pressure (kPa)ParametersNumber of the Individual Orifice
a3-1a3-2a3-3a3-4a3-5a3-6a3-7a3-8a3-9a3-10a3-11a3-12
41R20.960.870.970.960.970.980.950.940.940.960.960.97
NRMSE(%)26.120.220.823.628.012.320.925.318.724.828.917.8
69R20.940.950.980.920.910.960.960.940.970.940.920.97
NRMSE(%)30.423.120.932.644.426.821.132.010.831.433.818.7
103R20.940.940.950.900.950.970.720.960.950.960.960.96
NRMSE(%)35.928.329.138.234.326.439.129.513.328.732.518.5
Table 3. The optimal evaluation index wi(j) with uniformity coefficient CUi and spraying width Bi under different sample numbers.
Sample Numbermax{wi}CUi/%Bi/m
502.0149.93.04
1002.0452.12.99
5002.0452.12.99
10002.0654.22.94
50002.1255.43.04
10,0002.1558.32.94
50,0002.1658.52.99
100,0002.1658.52.99
Table 4. The position of 12 individual orifices after orifice arrangement for micro-sprinkling hoses.
ParametersNumber of the Individual Orifice
123456789101112
α262.562.546.046.076.876.868.568.549.149.176.076.0
ld/mm21.532.515.938.126.527.523.630.416.937.126.227.8
Publisher’s Note: MDPI stays neutral with regard to jurisdictional claims in published maps and institutional affiliations.