
Computer-Assisted Bioidentification Using Freshwater Macroinvertebrates: A Scoping Review

 ,
,  , , and
Abstract
1. Introduction
1.1. Justification
1.2. Objectives
1.3. Research Questions
- RQ-1: What purposes are pursued when applying computational technology in bioindication tasks with FwM?
- RQ-2: What computer-assisted tools have been used in studies with FwM?
- RQ-3: What is the relationship between the application areas identified and the computational technologies used?
- RQ-4: What is the general approach to address FwM studies using computational technologies?
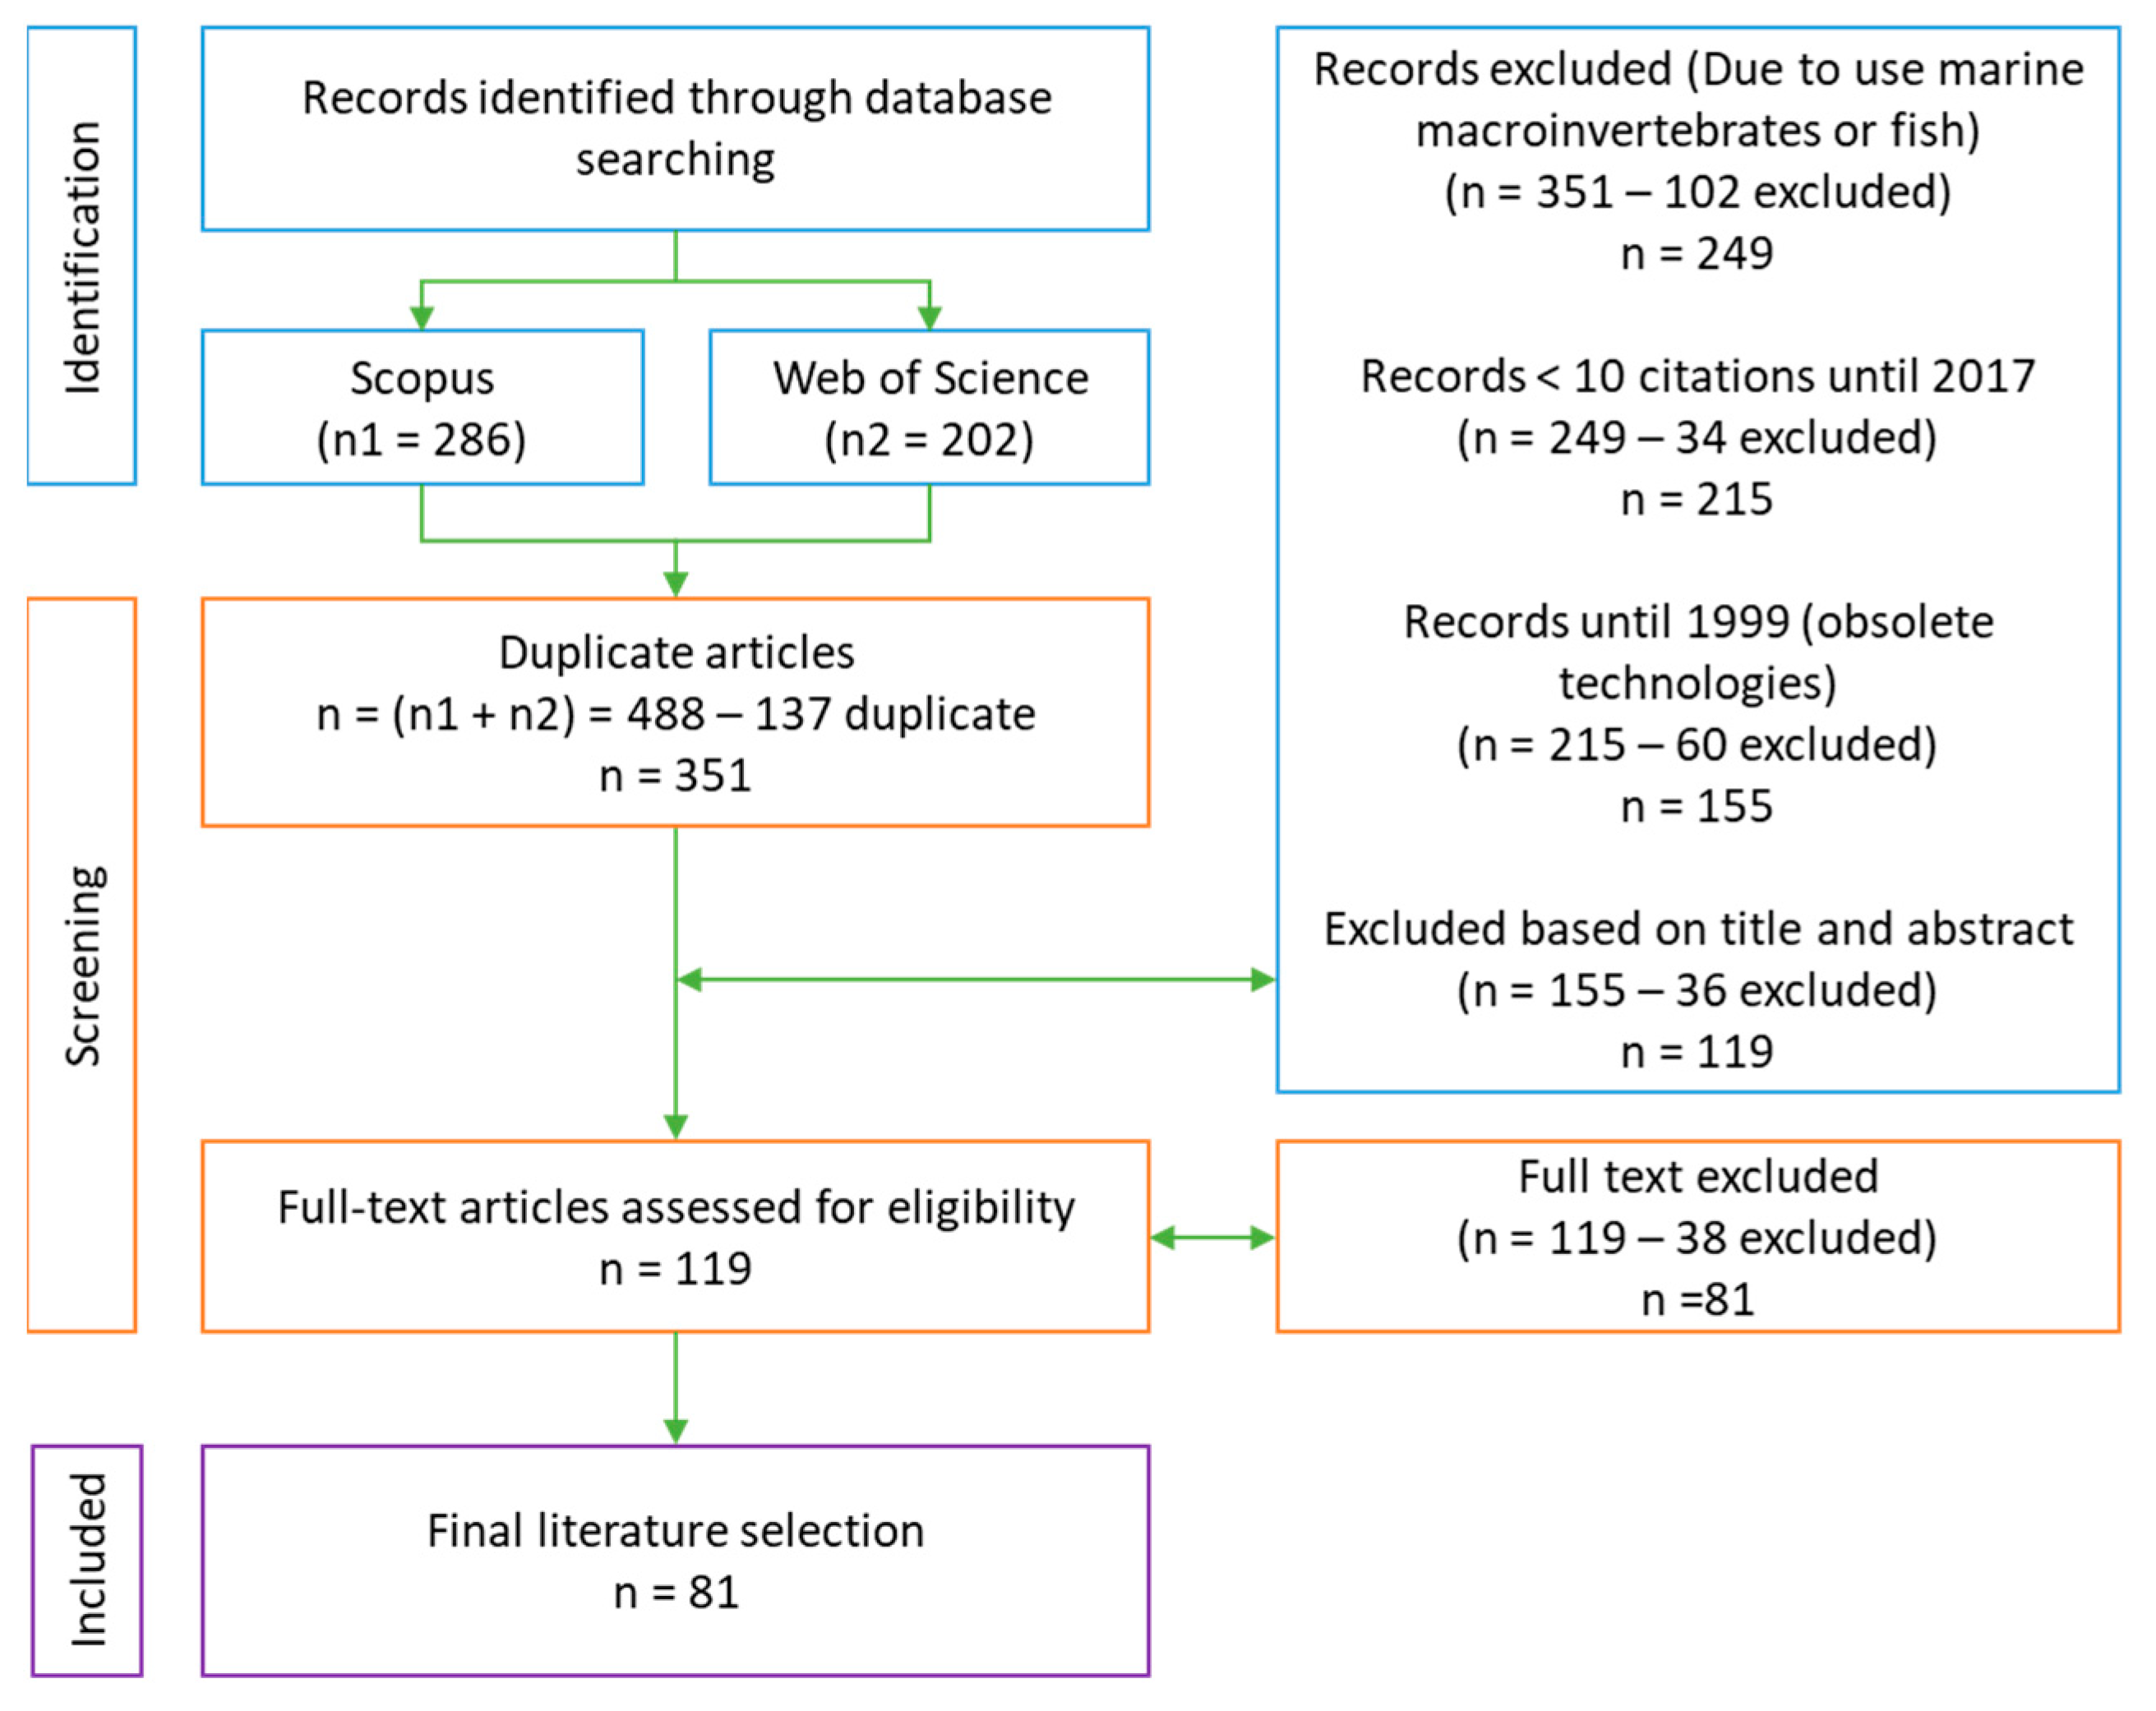
2. Methods
2.1. Eligibility Criteria
2.2. Source Information
2.3. Search
2.4. Selection of Sources of Evidence
2.5. Data Charting Process
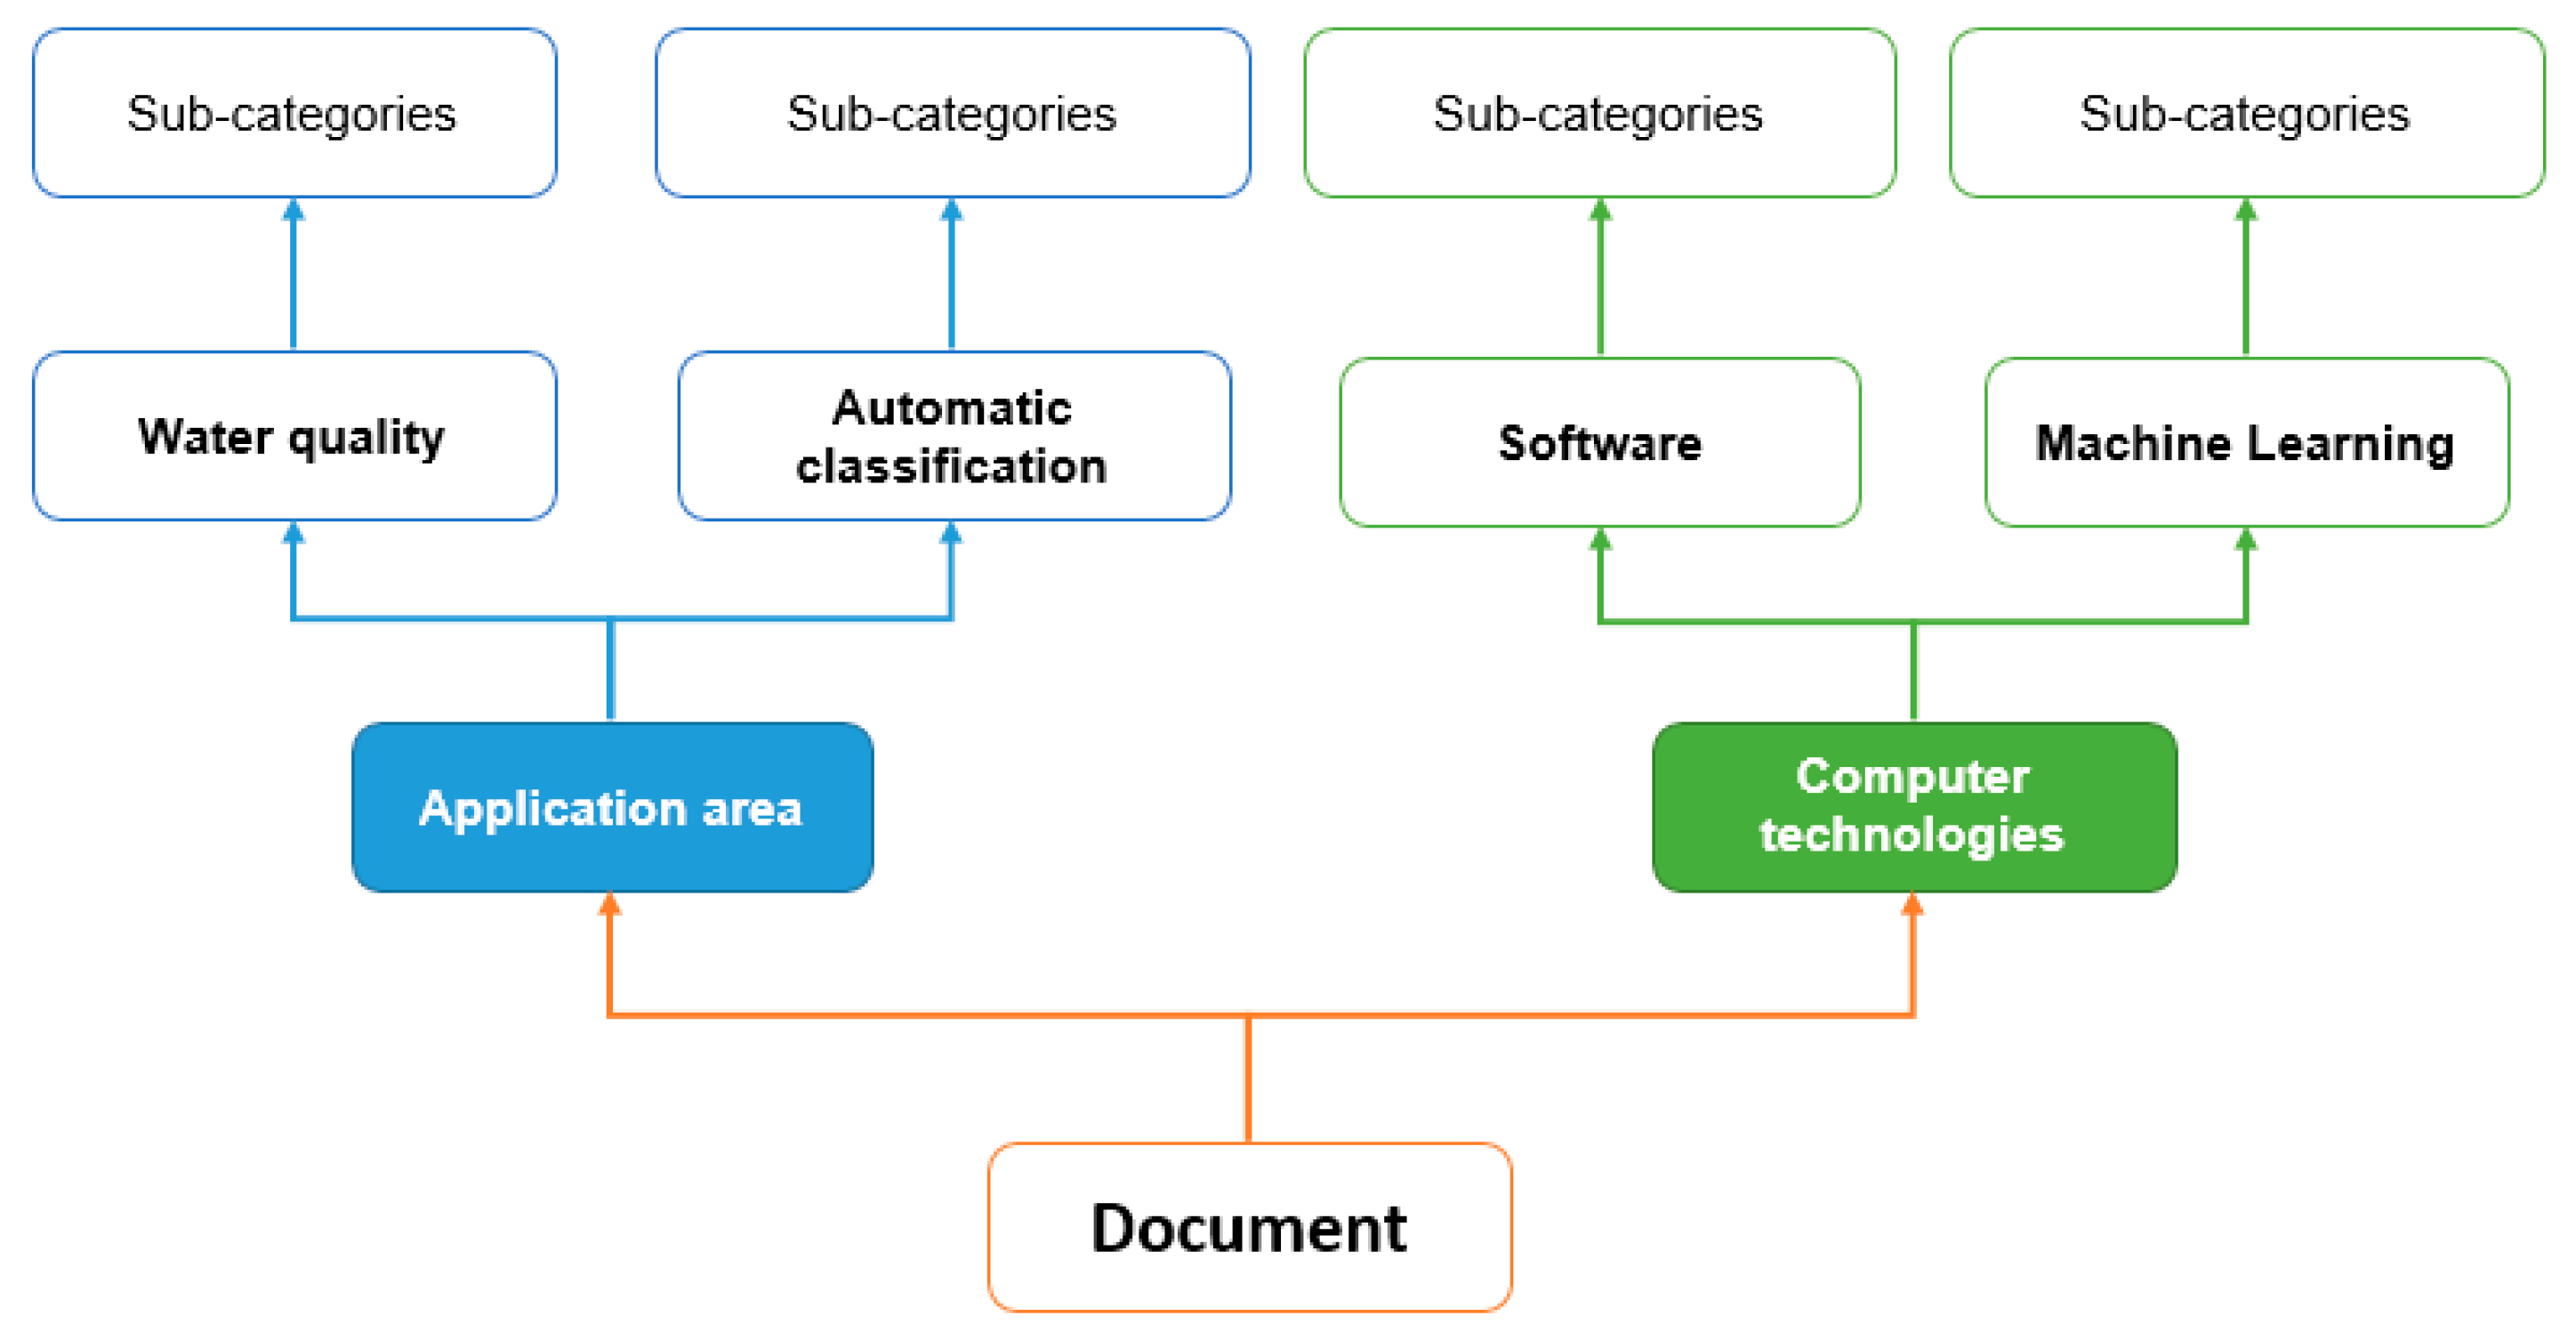
2.5.1. Quantitative Analysis of the Data Obtained, and the Categories Assigned
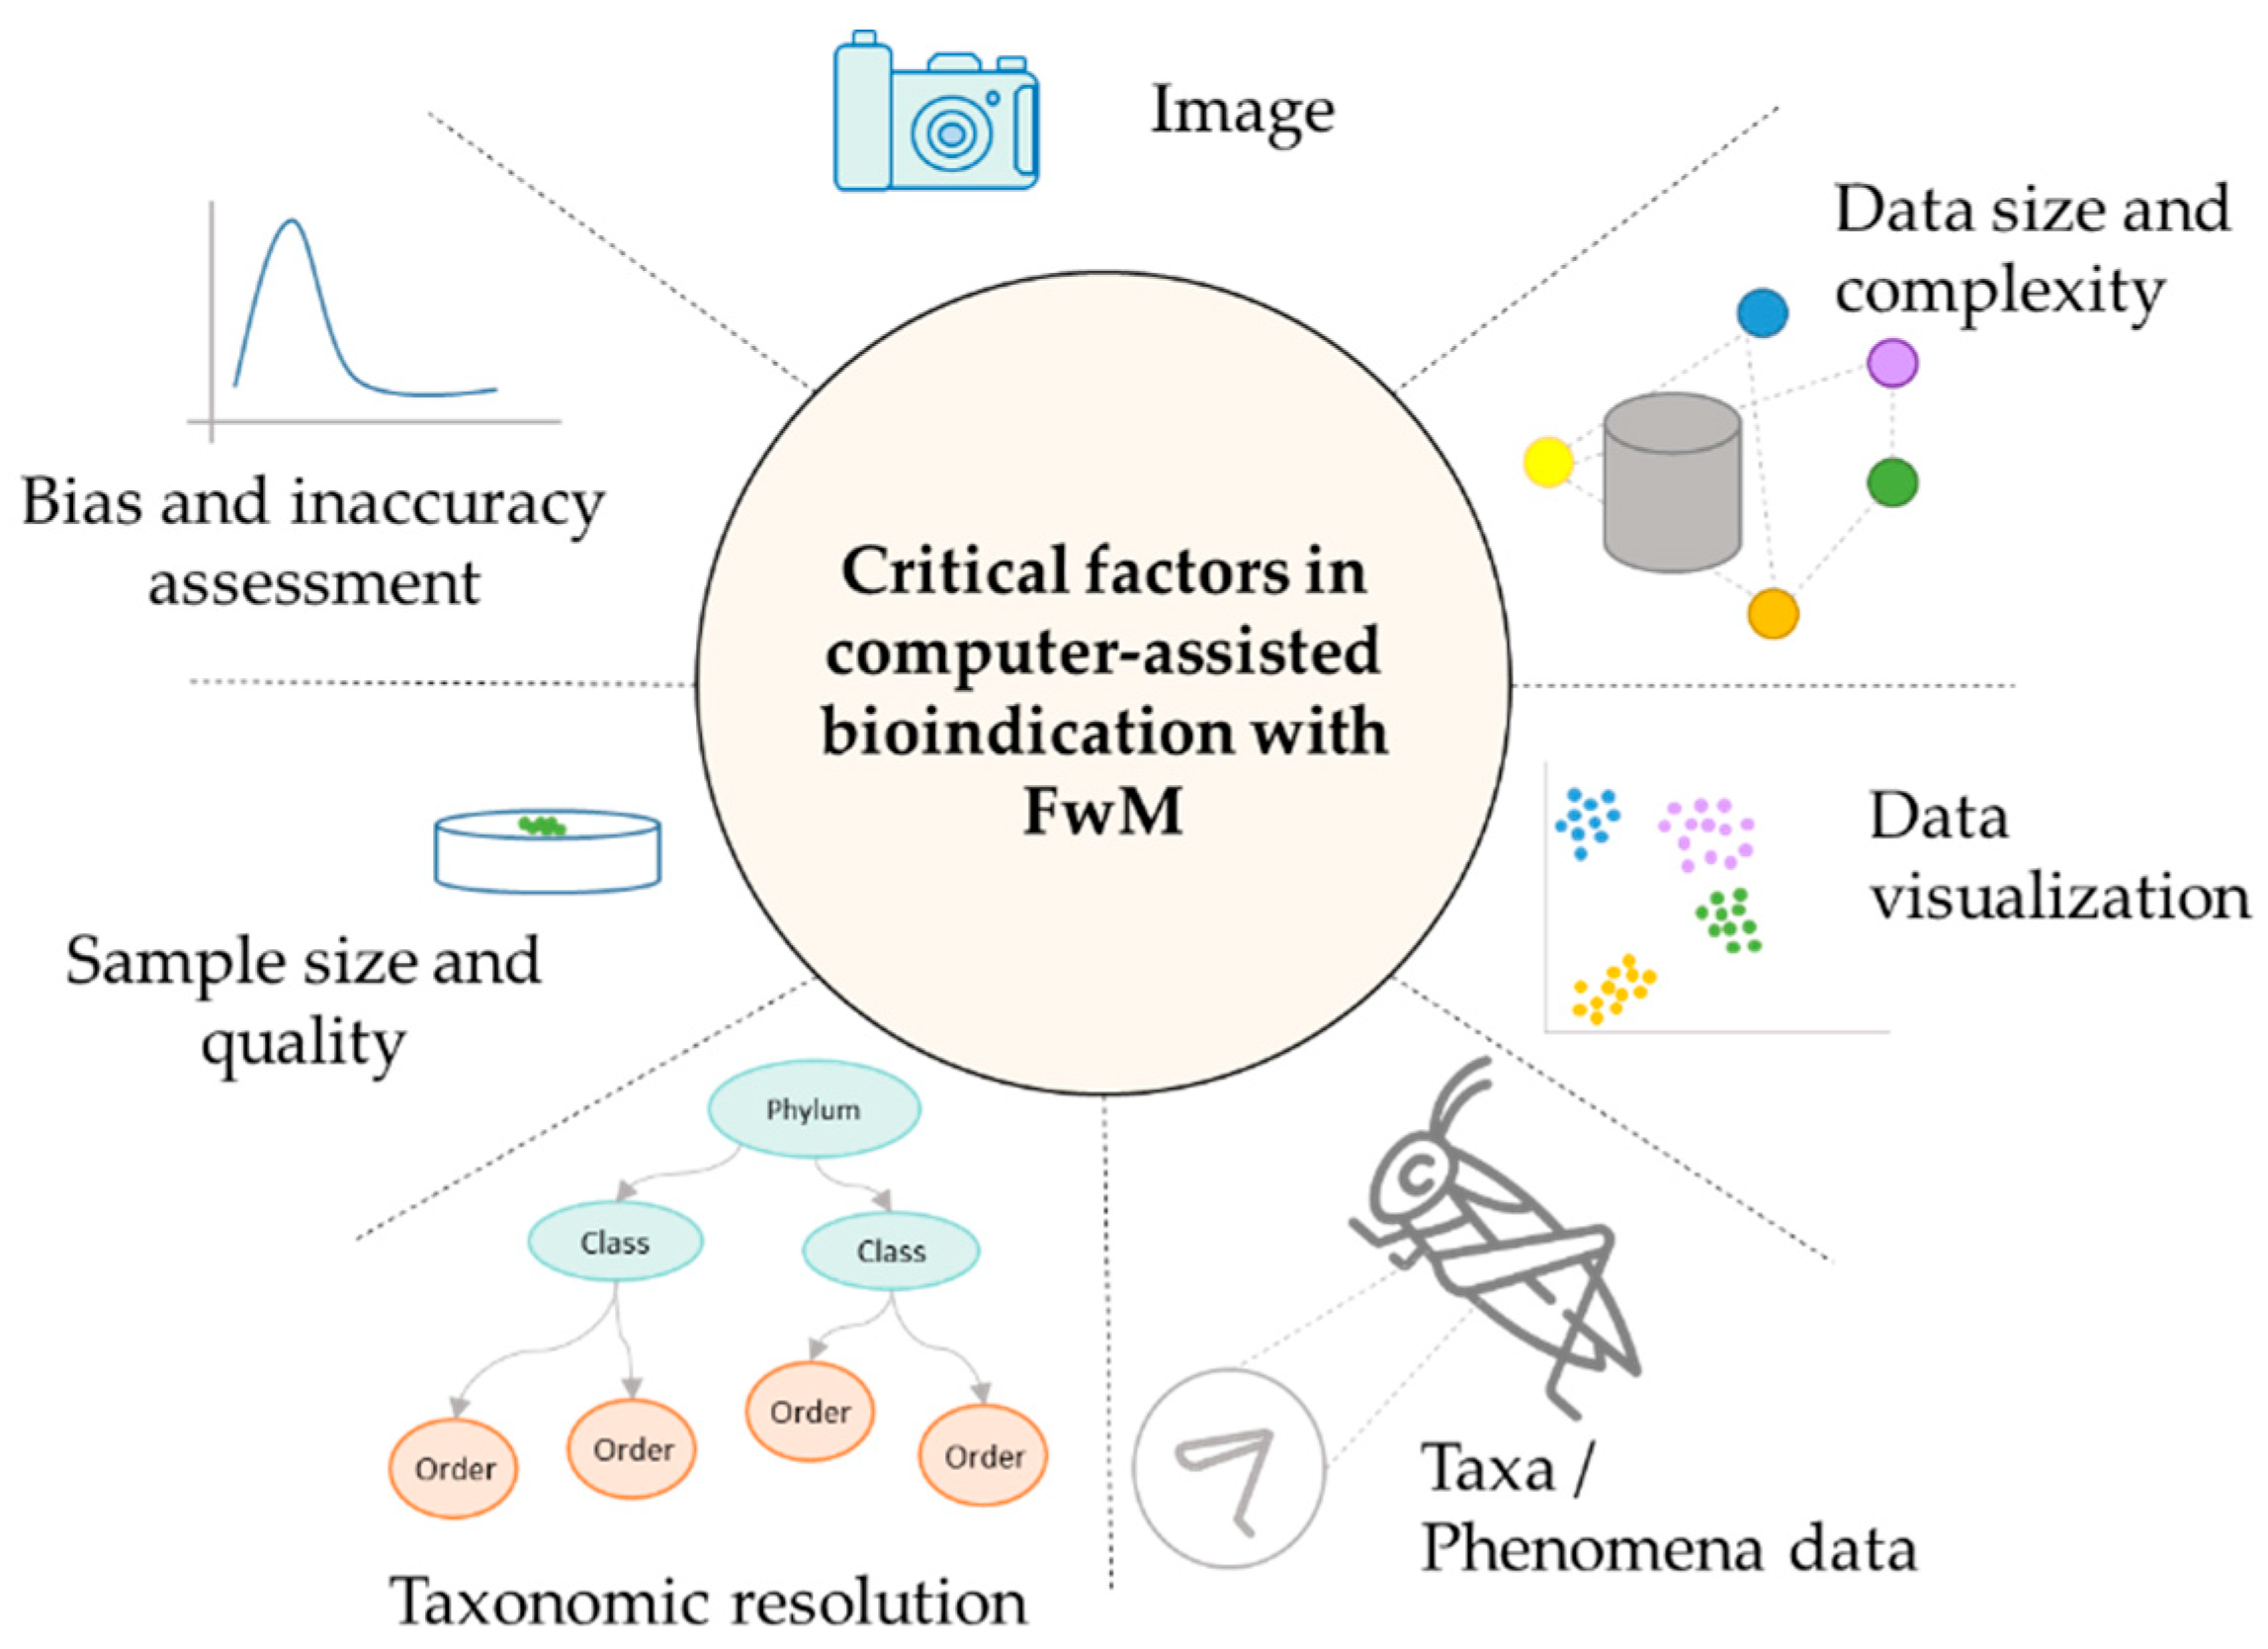
2.5.2. Qualitative Analysis of Critical Factors, Methods, Computer Technologies, and Strategies Employed
2.6. Data Elements
2.7. Synthesis of Results
3. Results
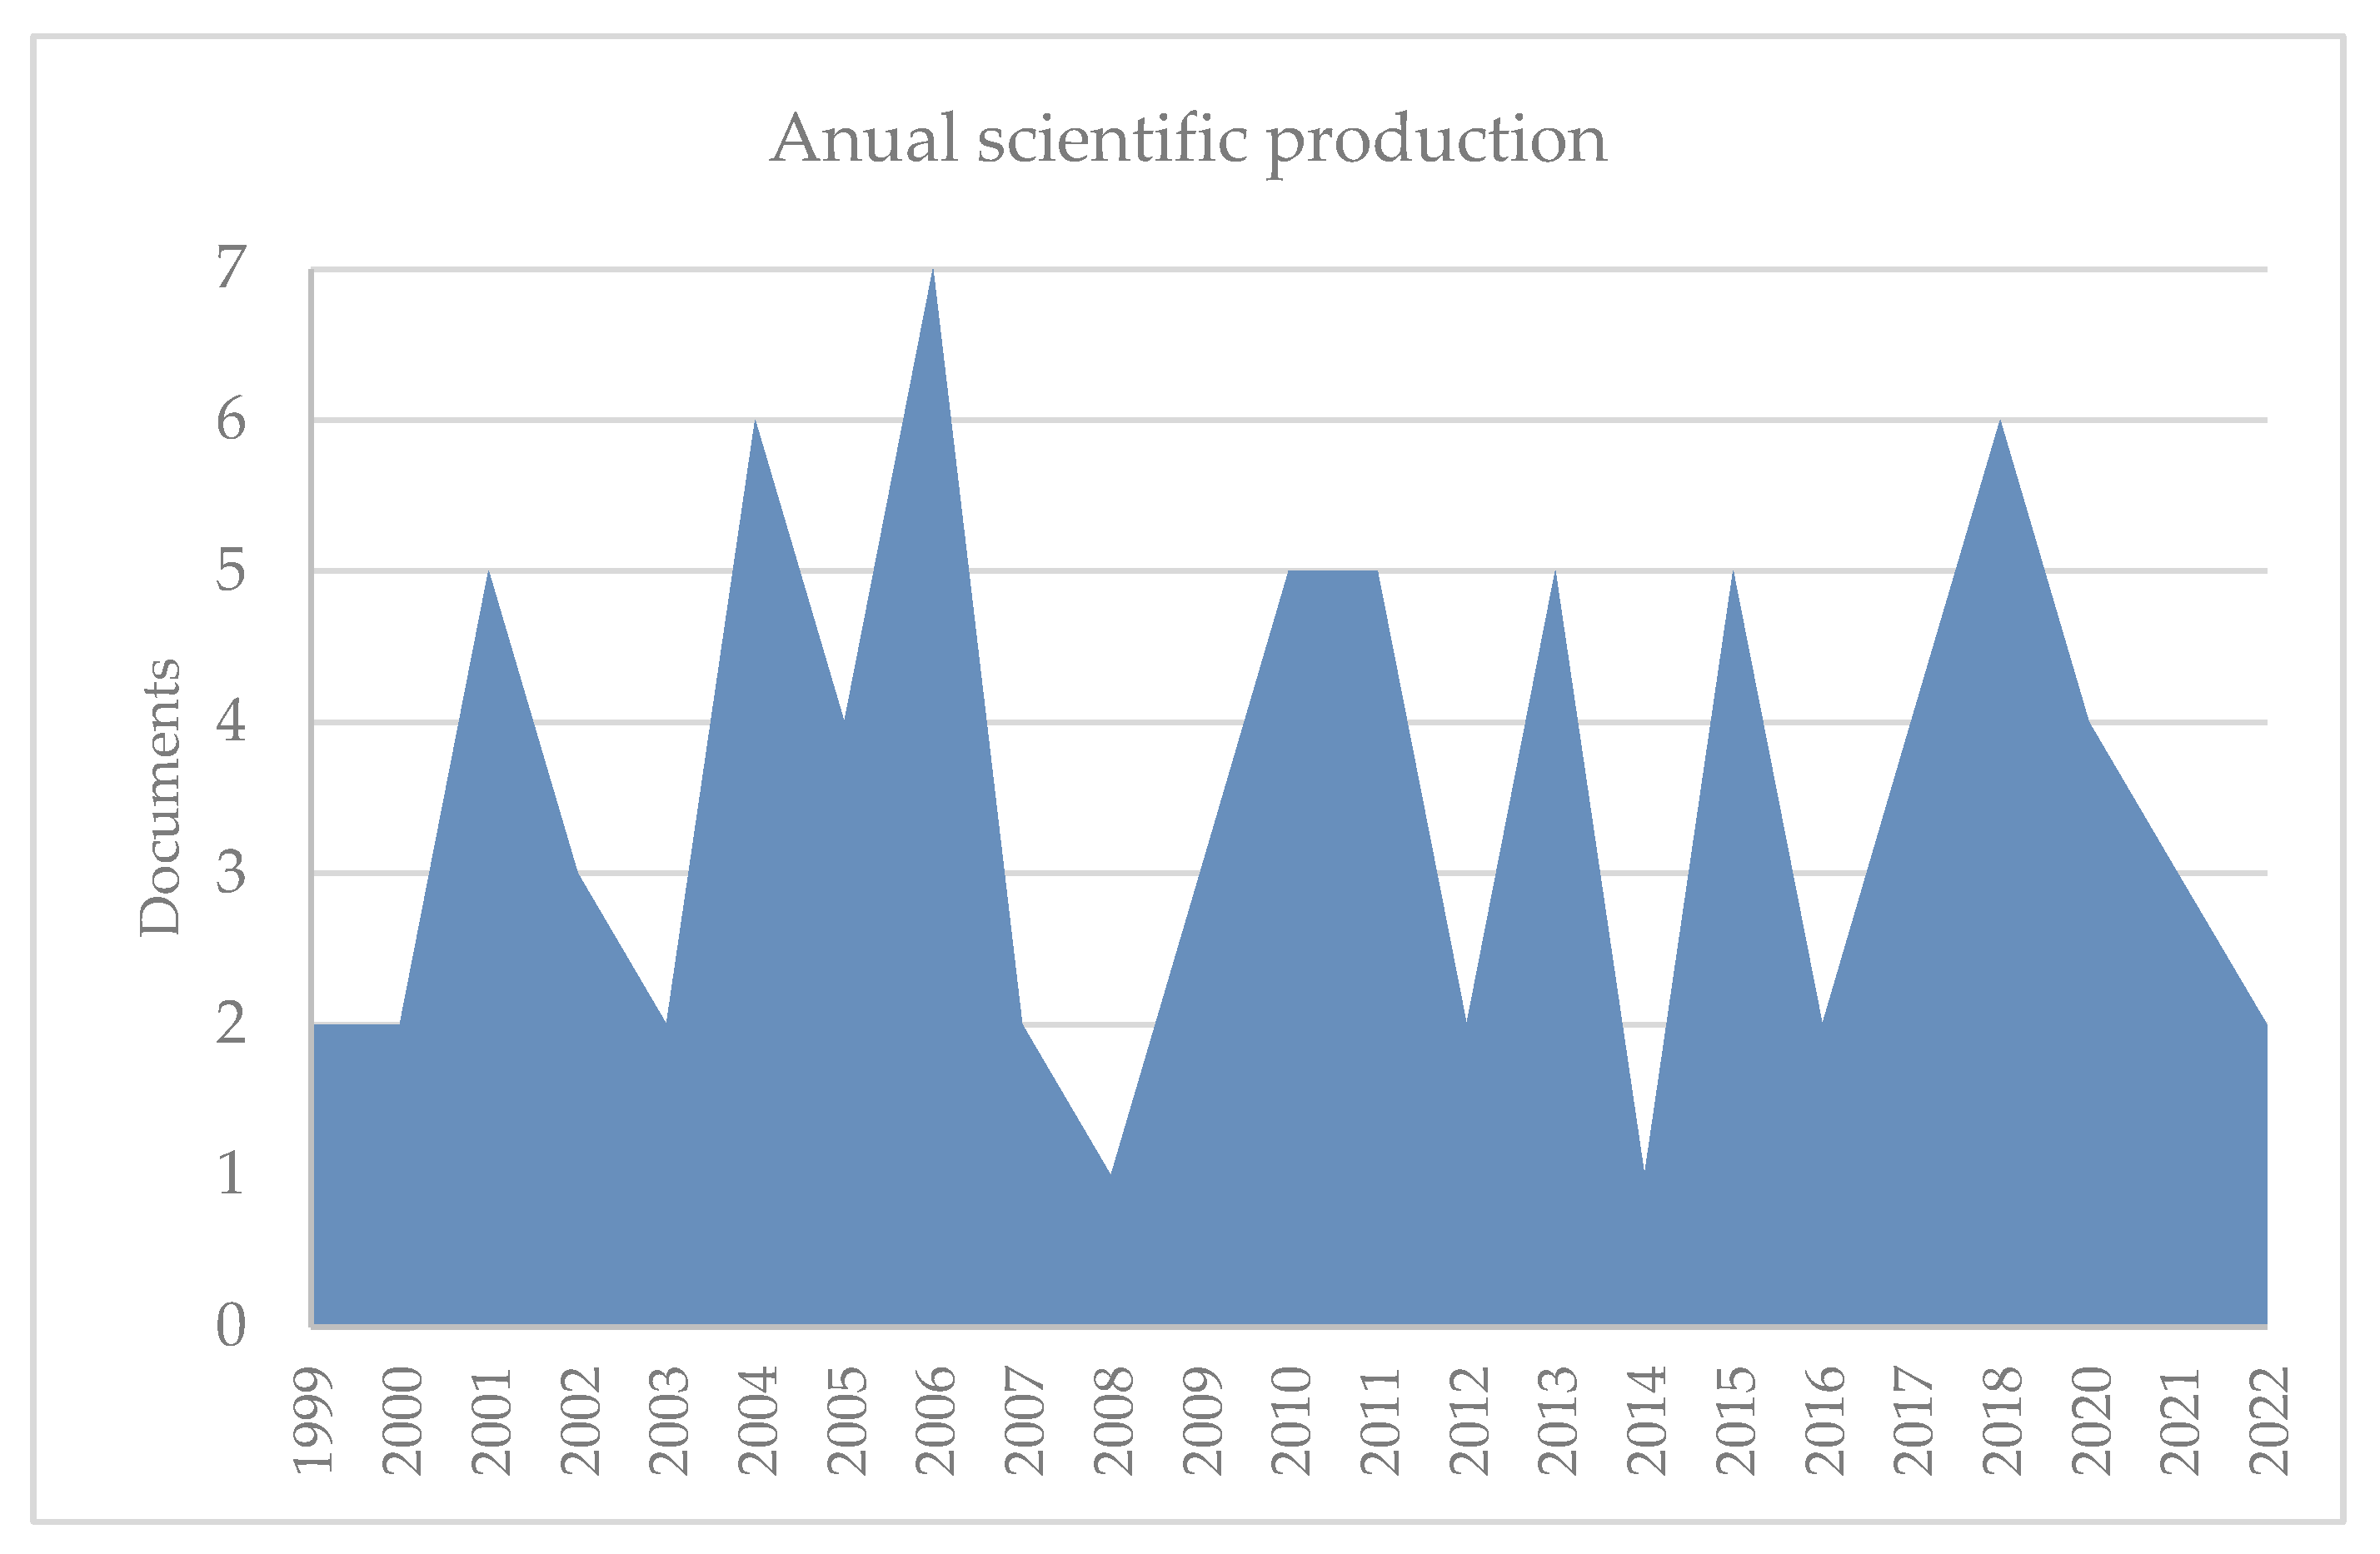
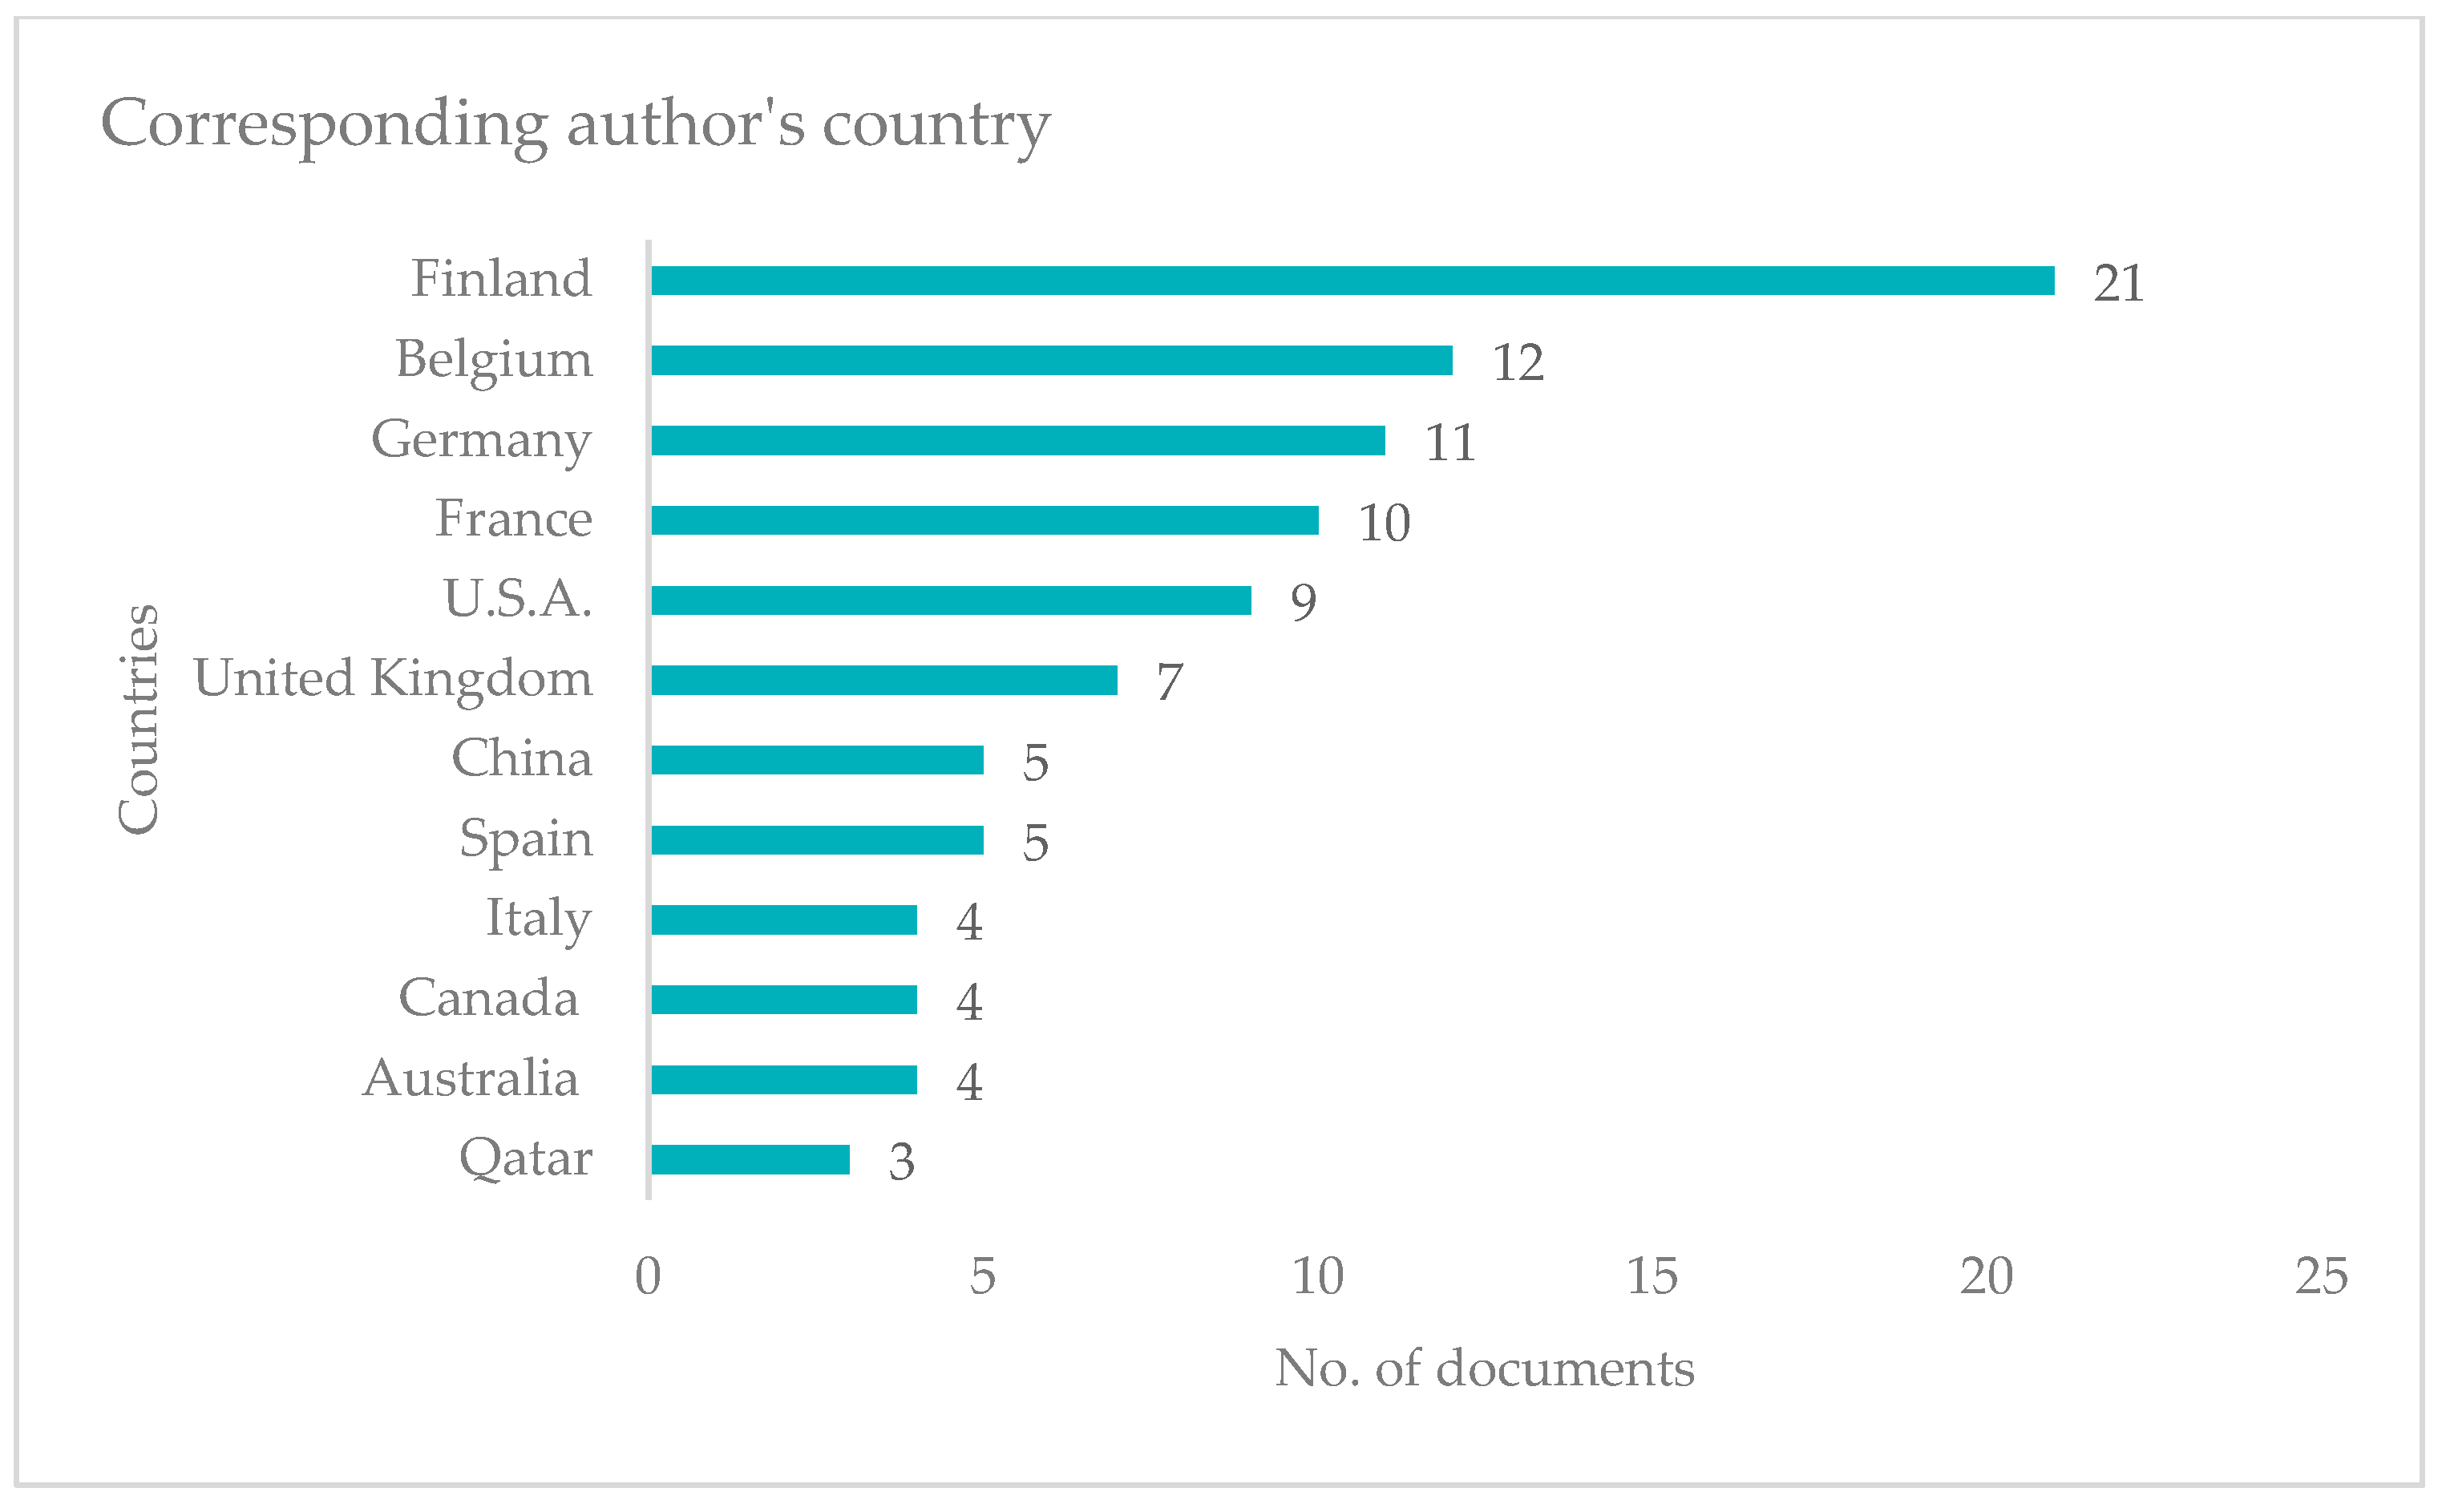
3.1. Characteristics of the Sources of Evidence
3.2. The Individual Outcome of the Sources of Evidence
3.3. Summary of Results
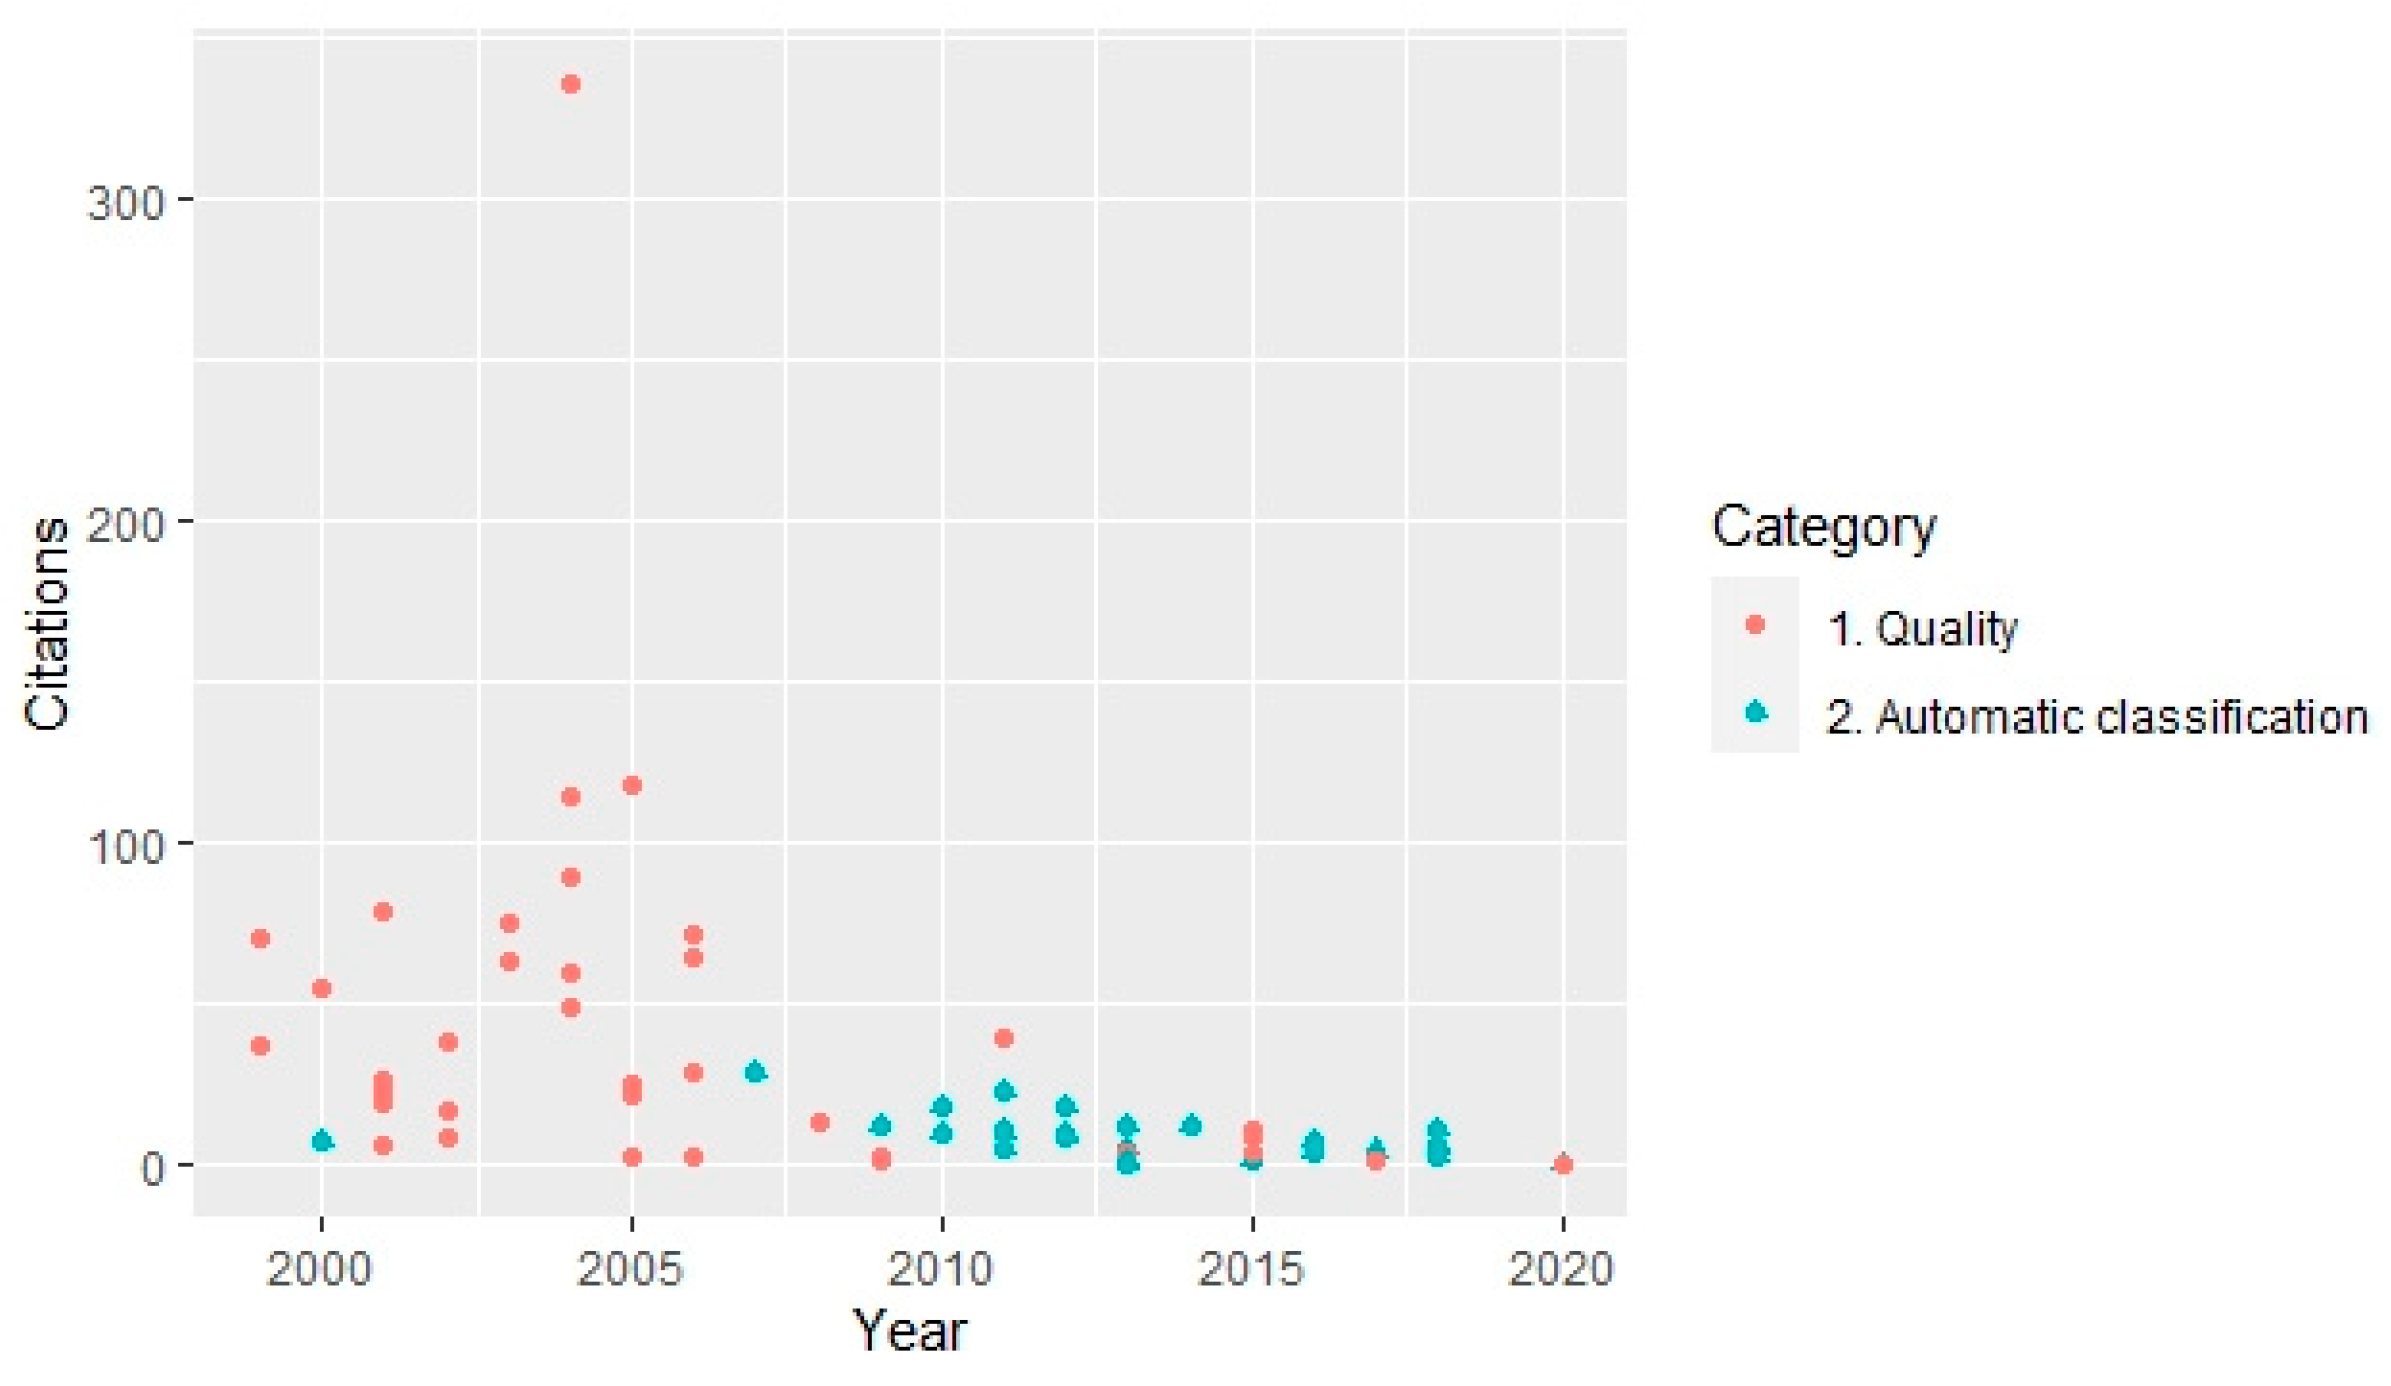
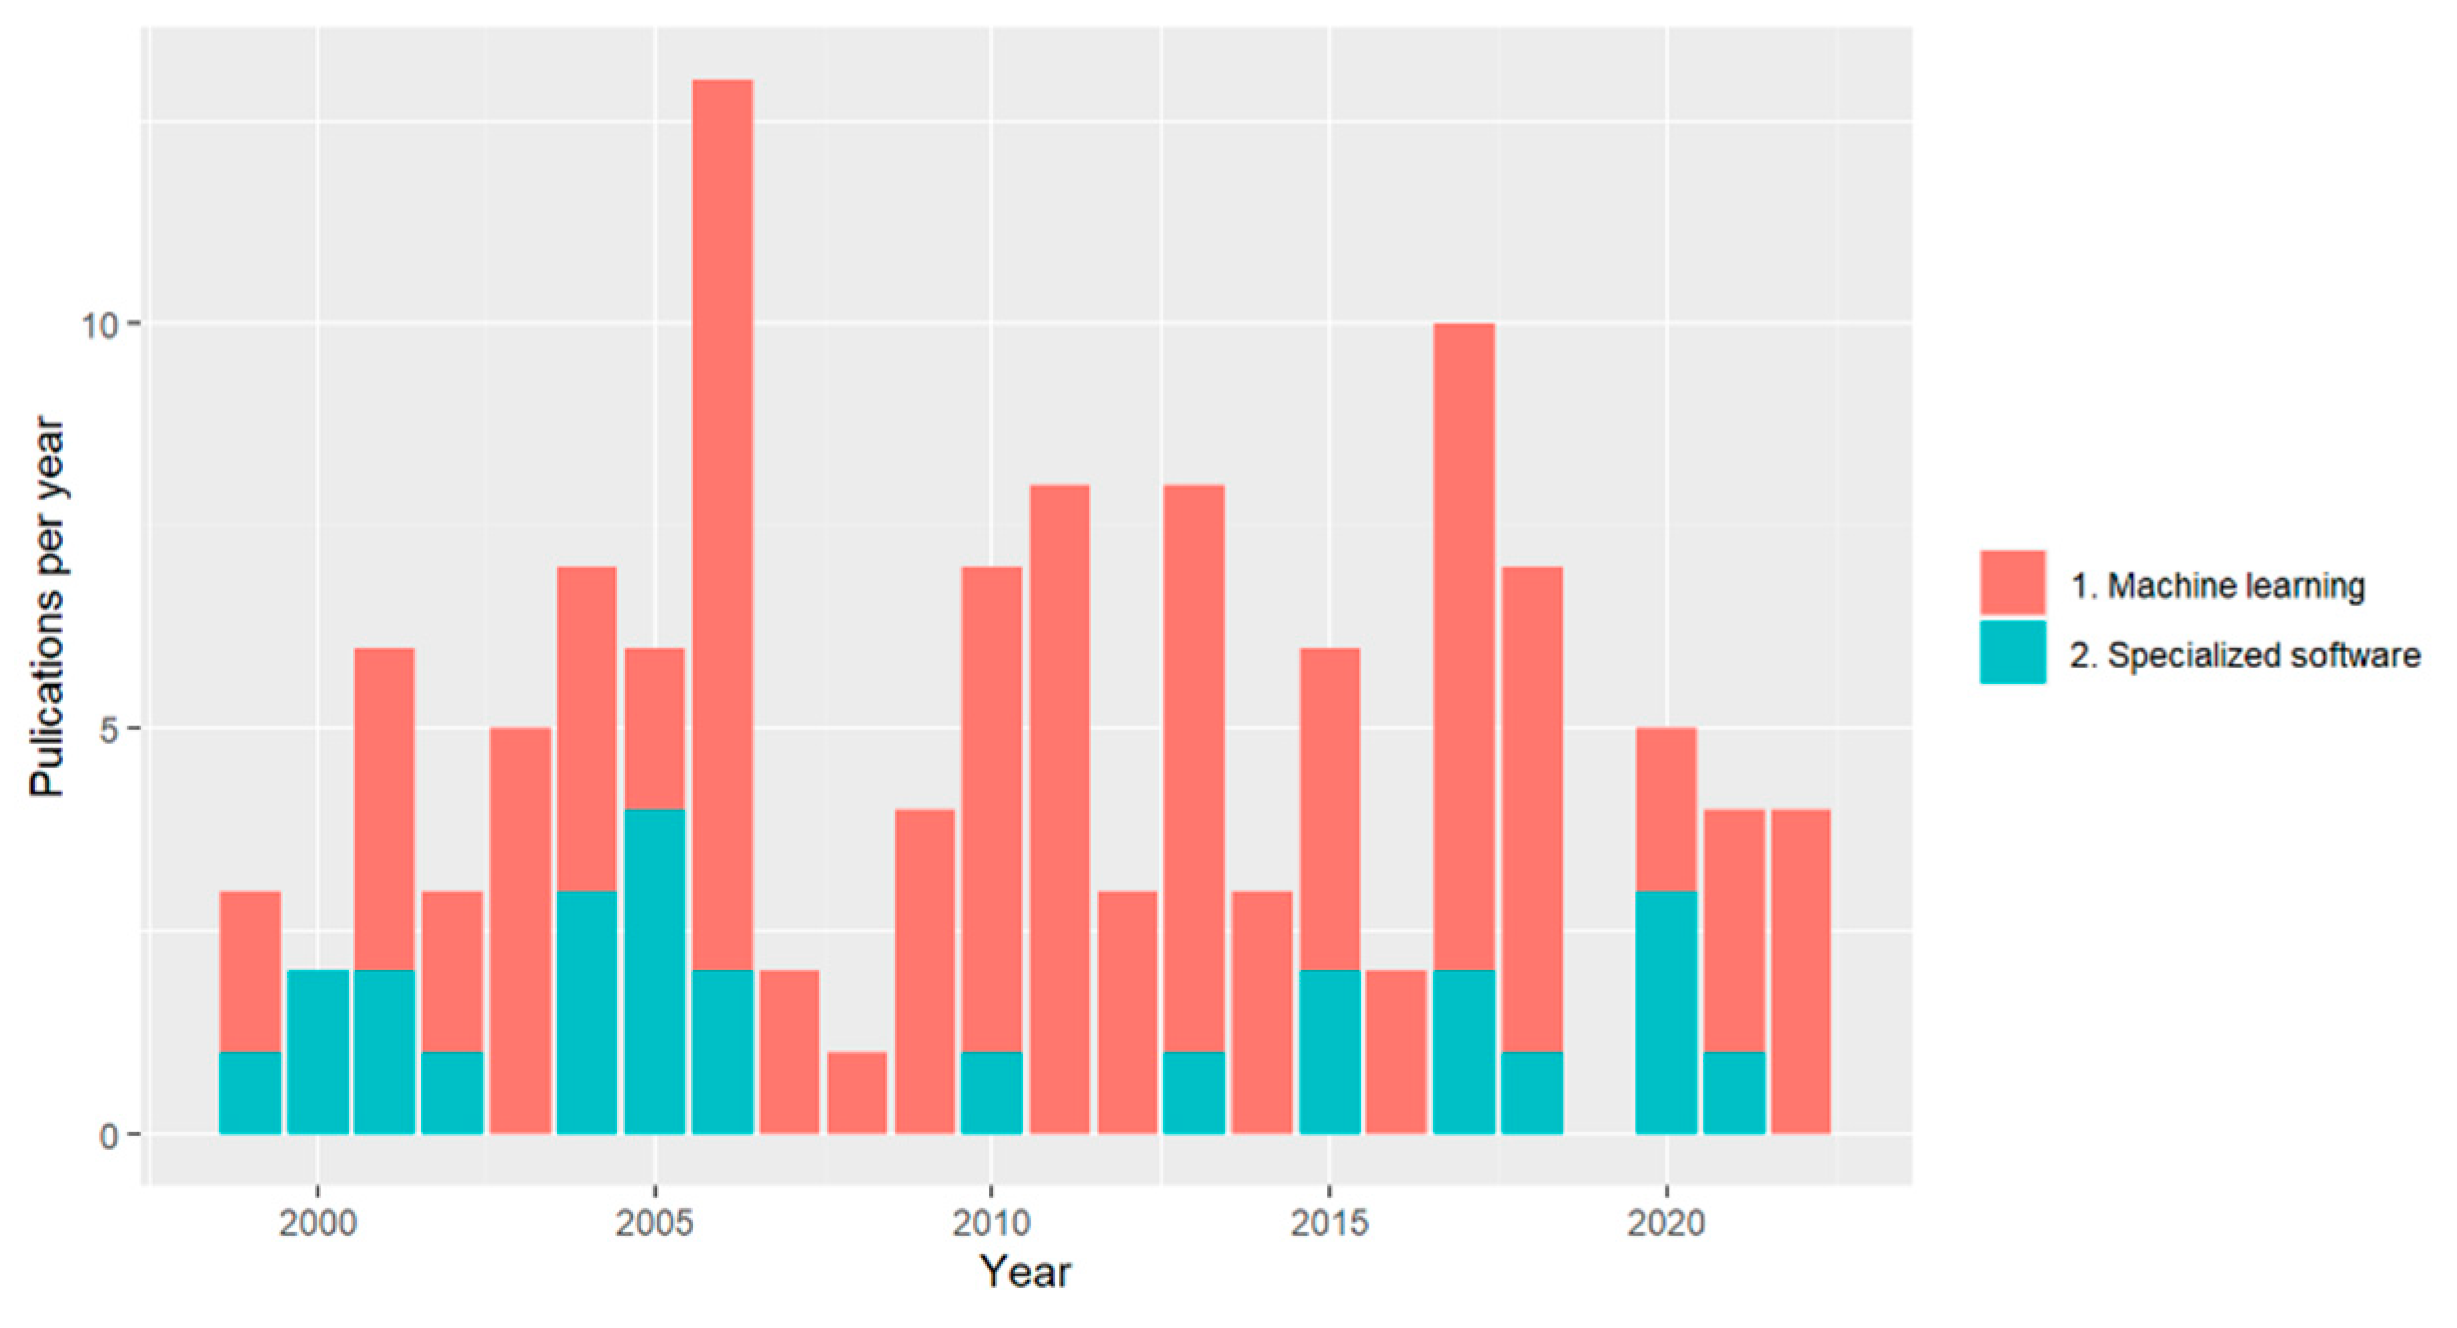
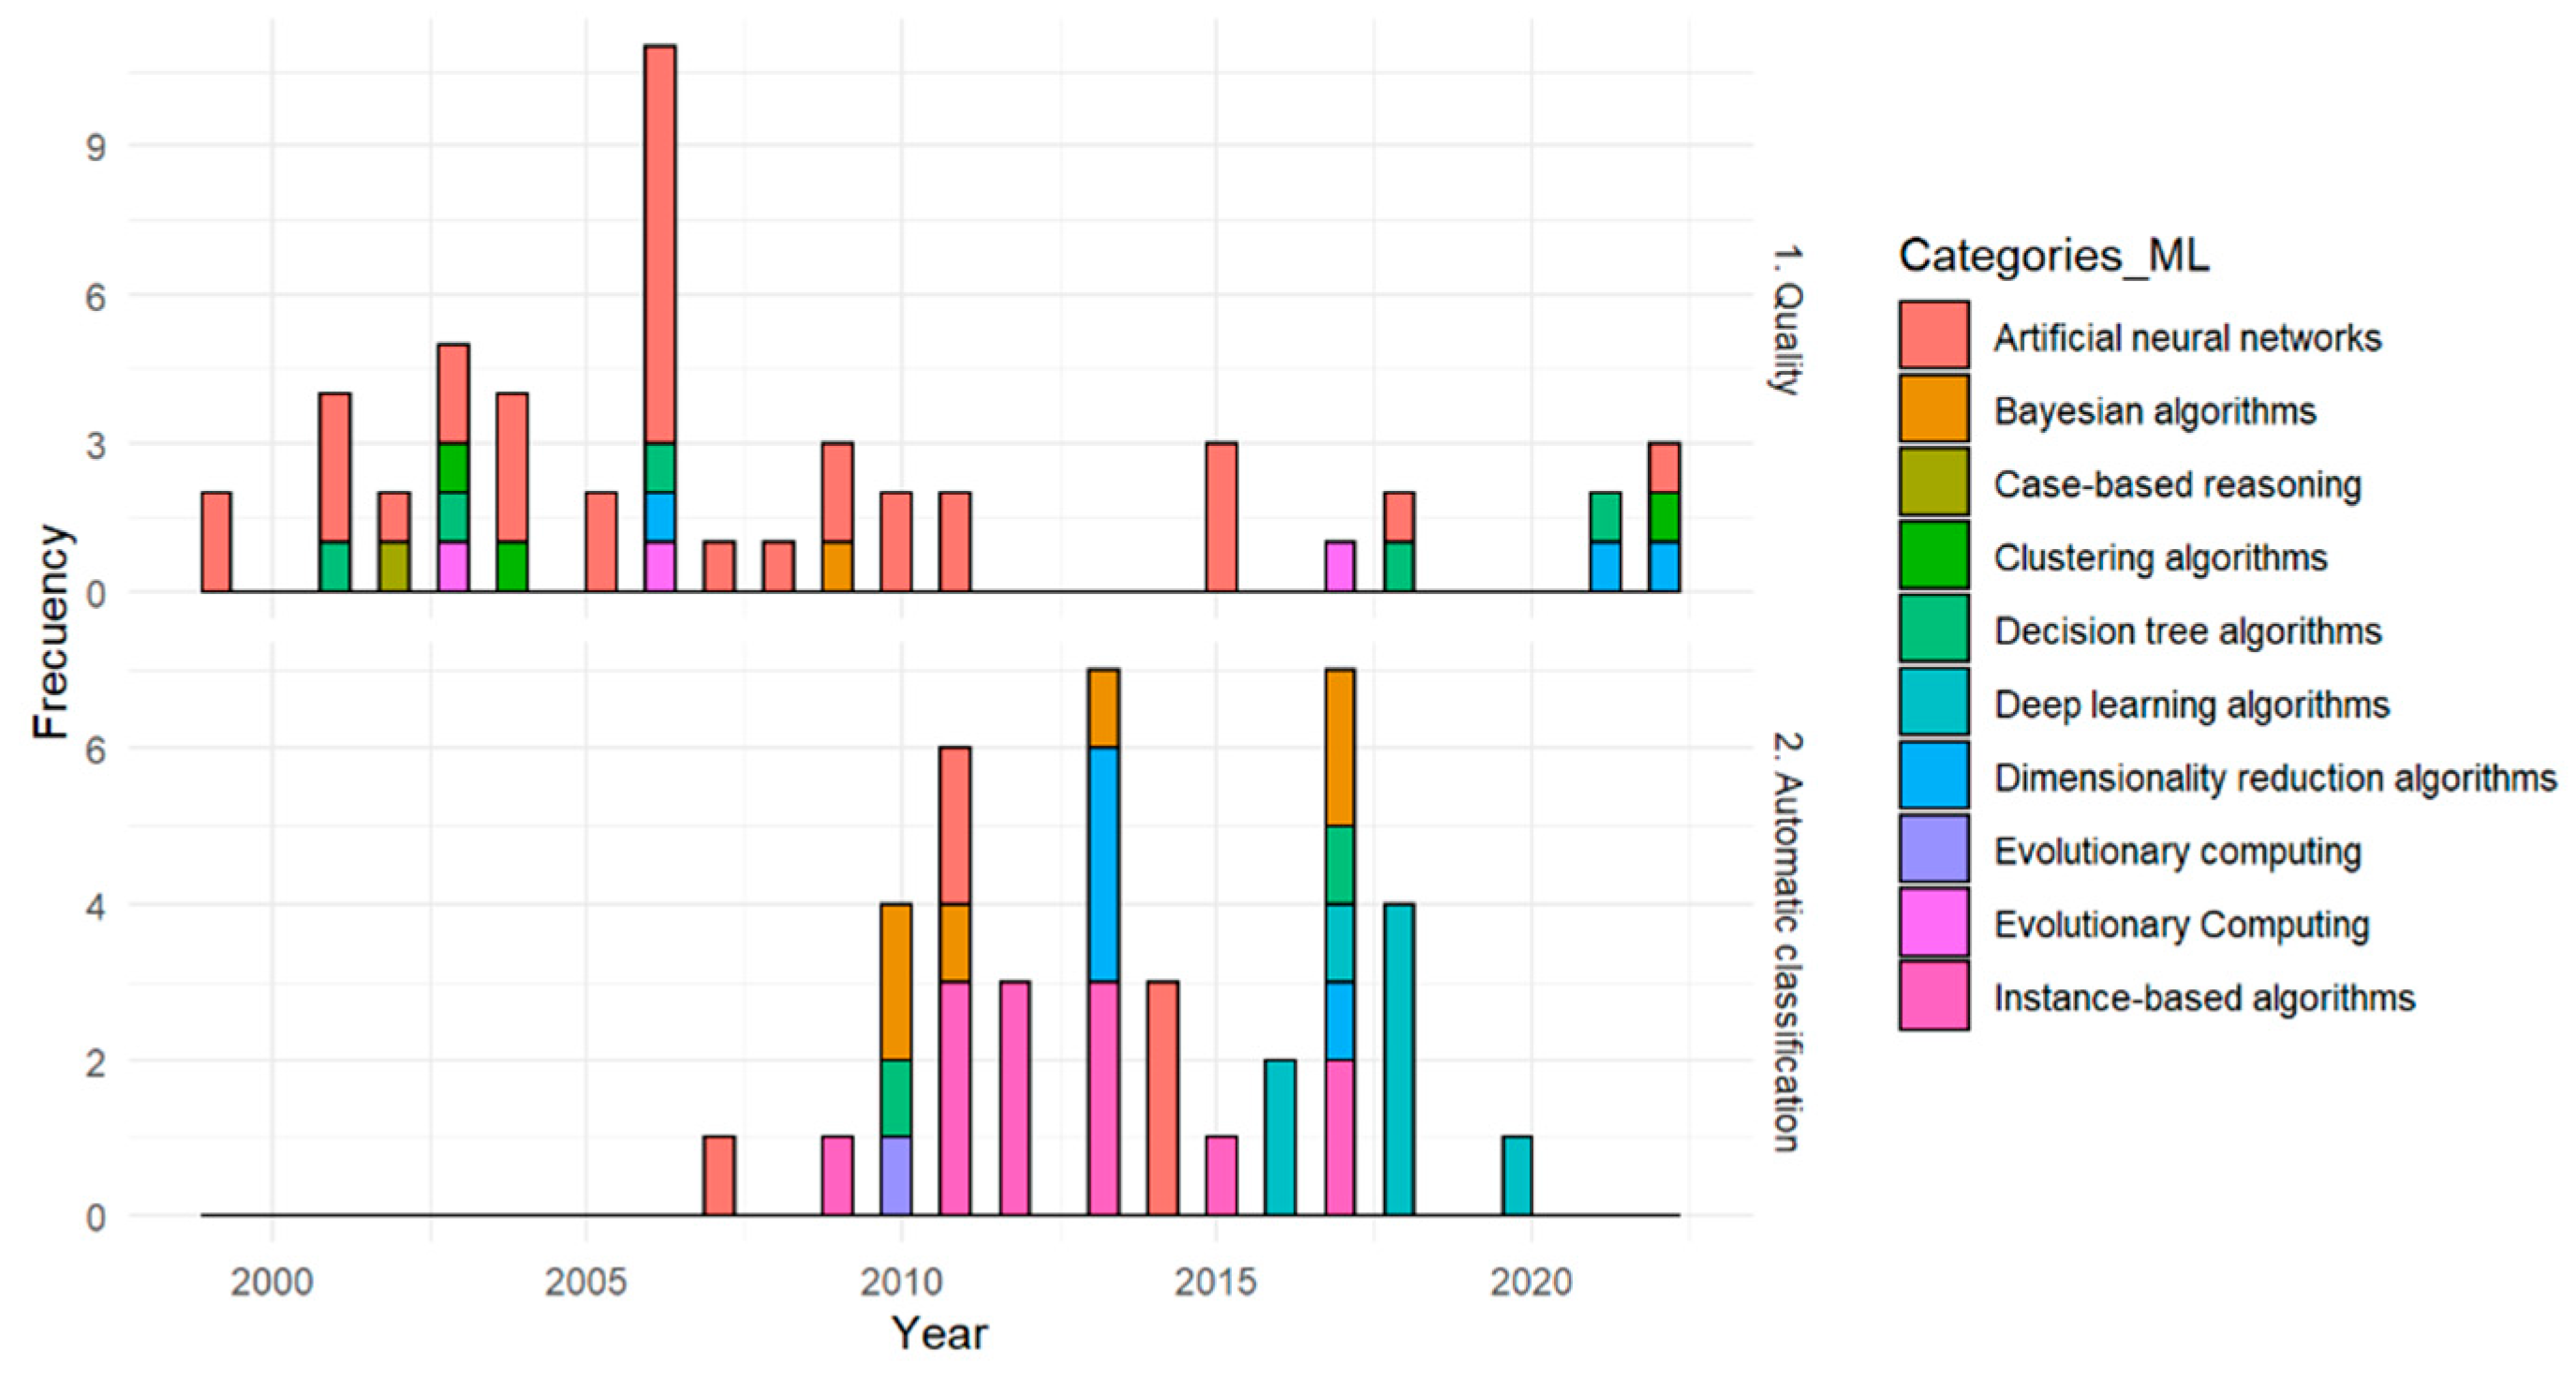
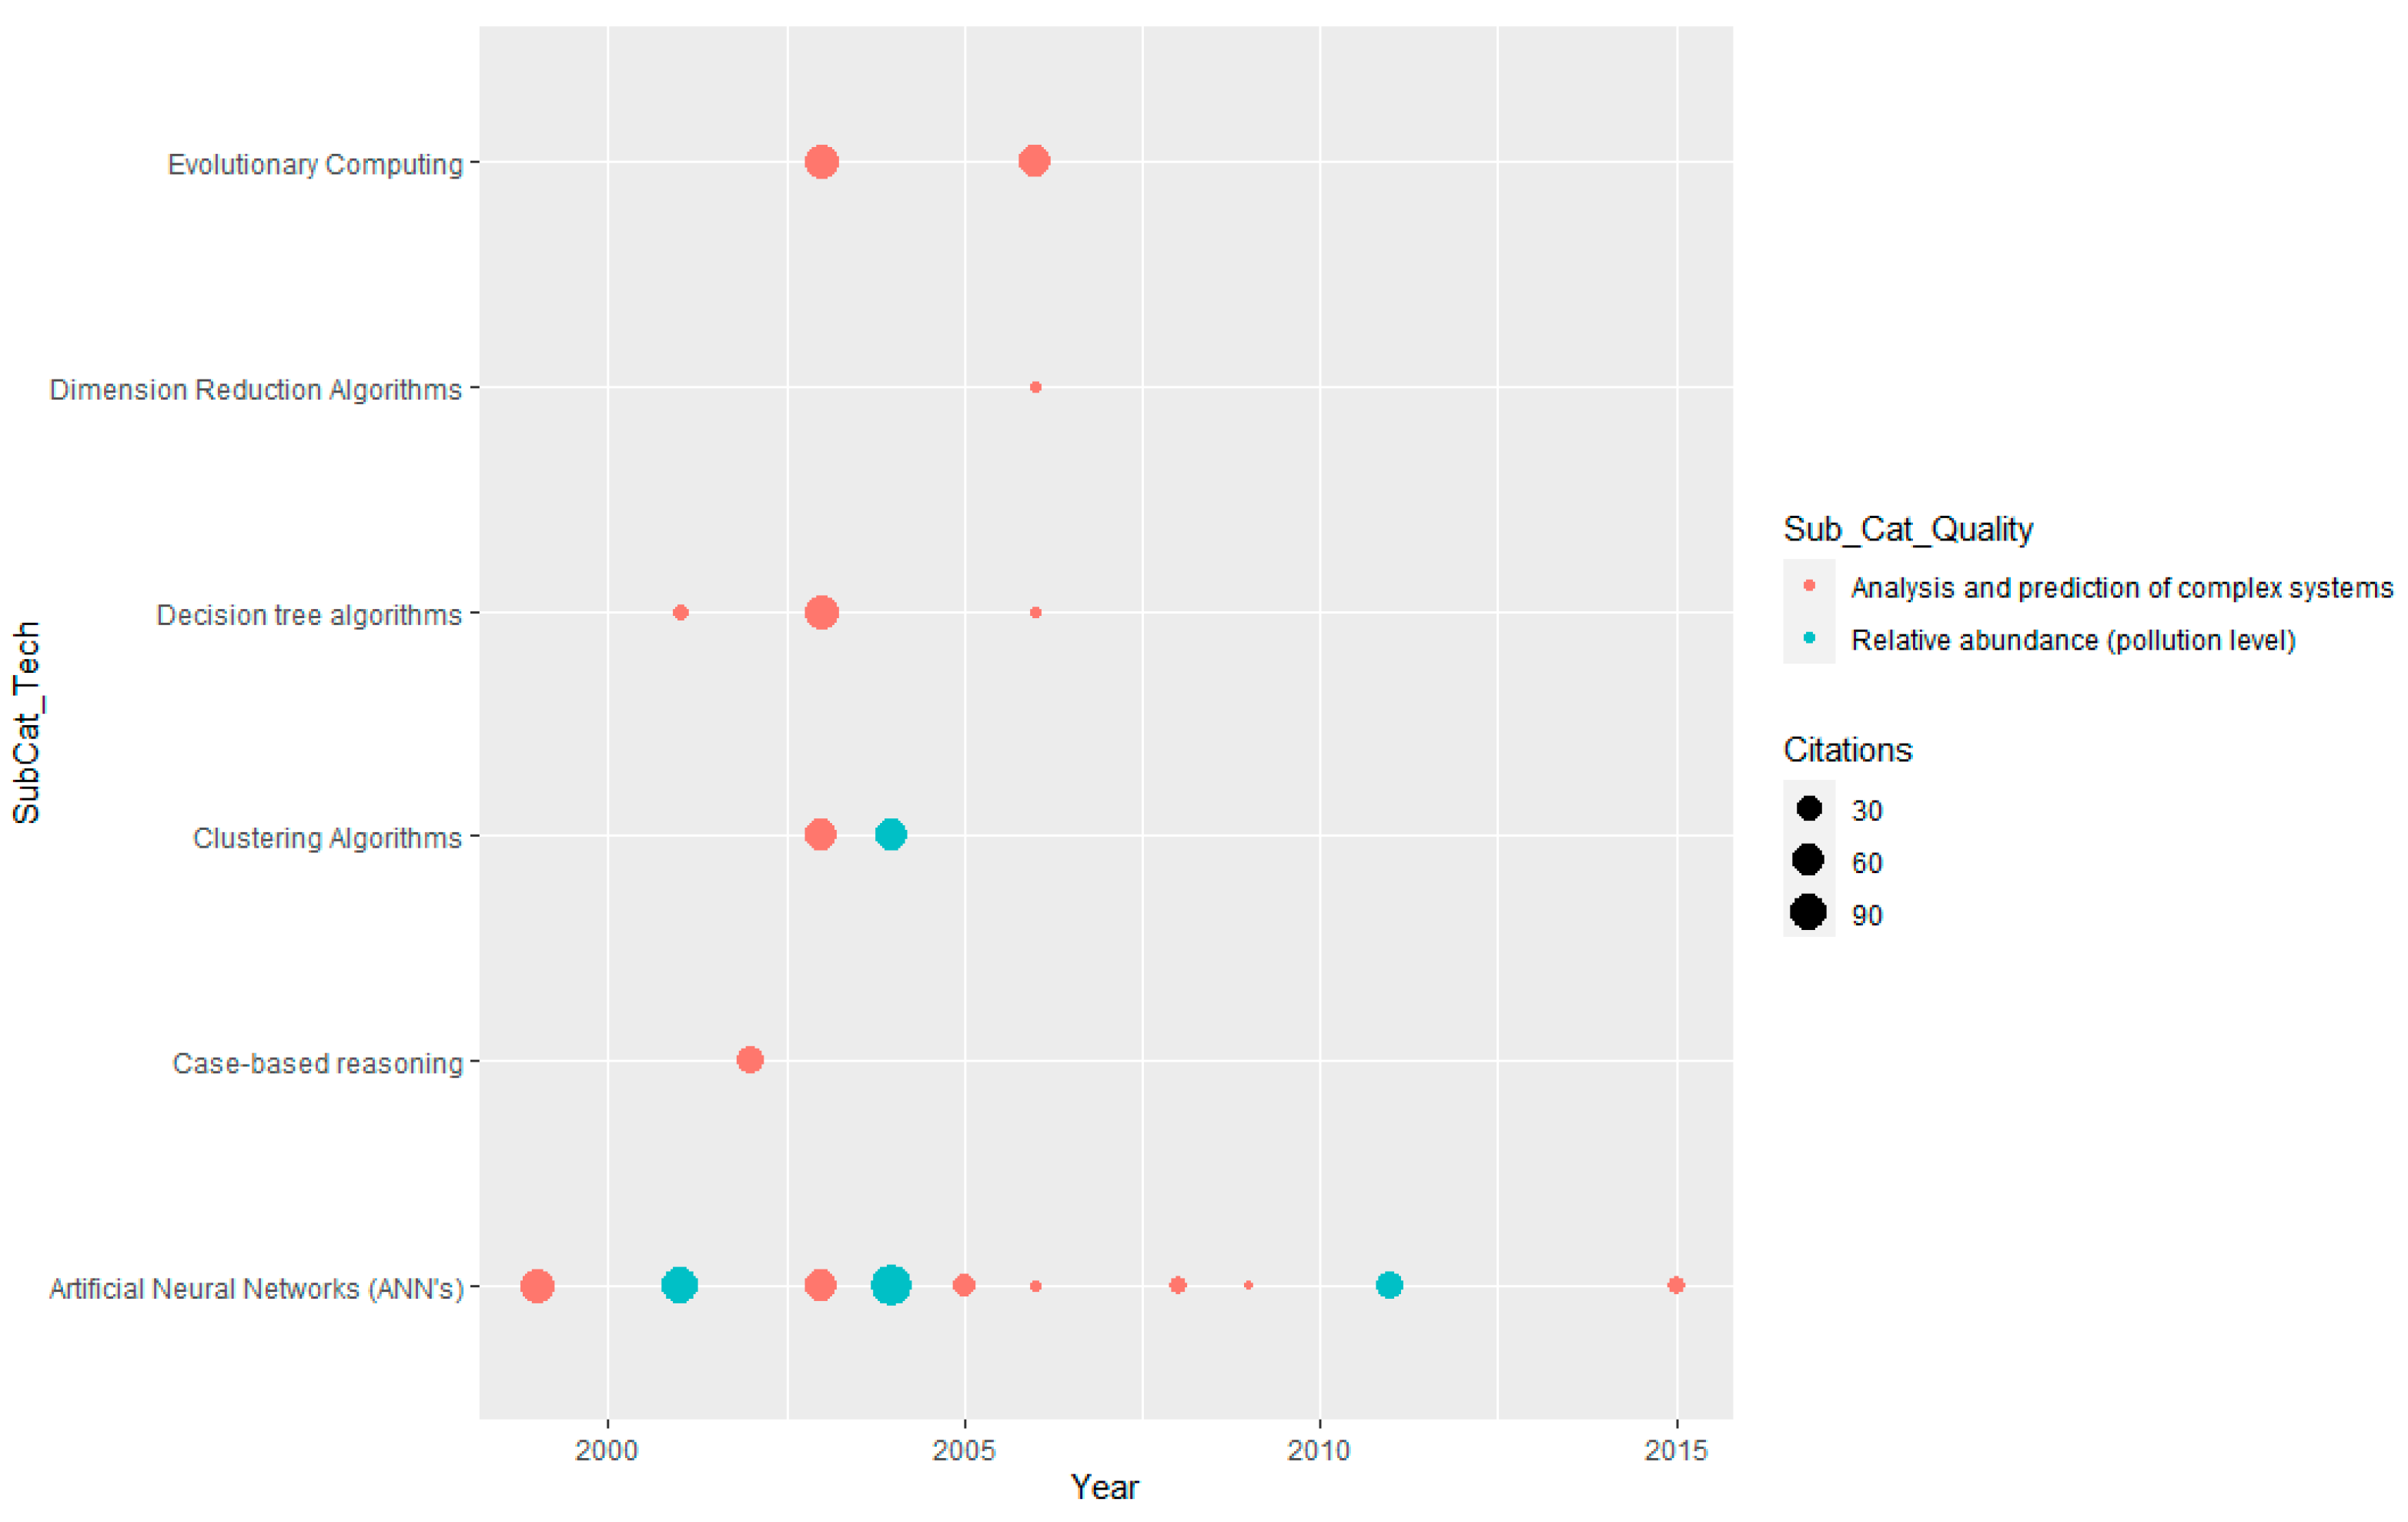
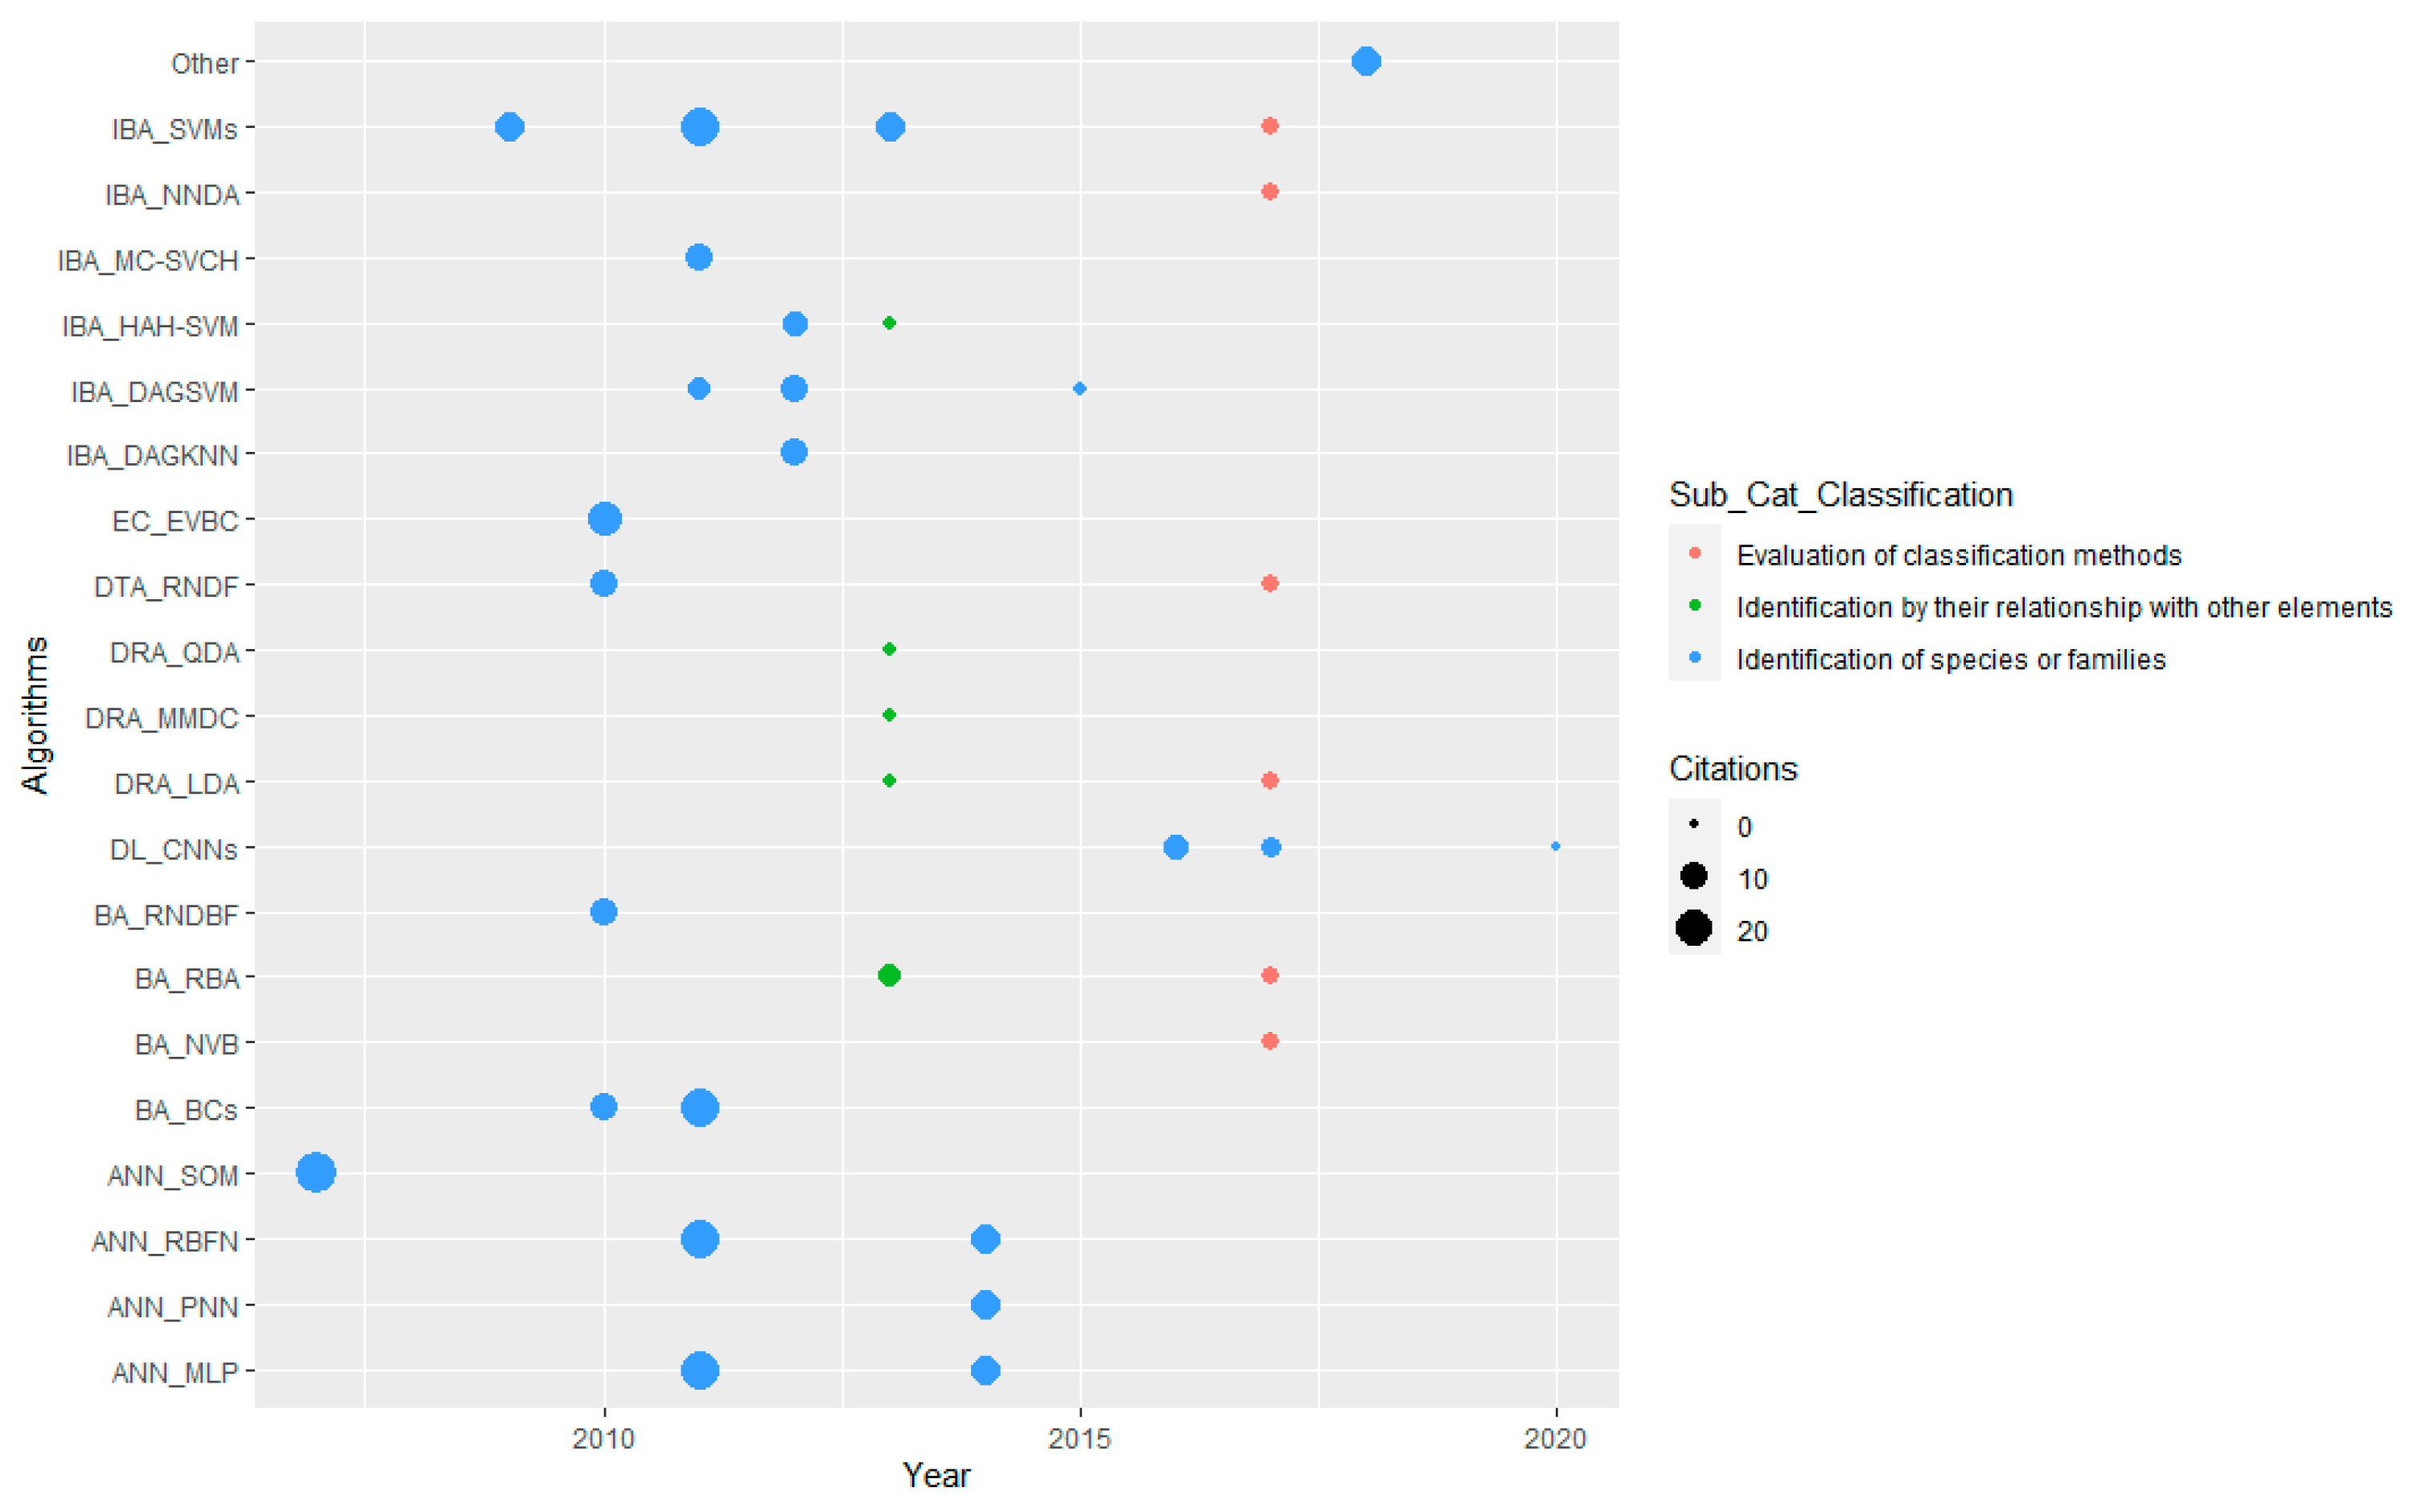
3.3.1. Phase 1: Quantitative Analysis of the Data Obtained, and Categories Assigned (RQ1, RQ2, RQ3)
- River Pollution Diagnostic System (RPDS) maximizes information retrieval through clustering and sorting biological and environmental data (nonlinear projection of data in two-dimensional space) [28].
- Water quality:
- Automatic classification:
3.3.2. Phase 2: Qualitative Analysis of Critical Factors, Methods, Computational Technologies, and Strategies Implemented
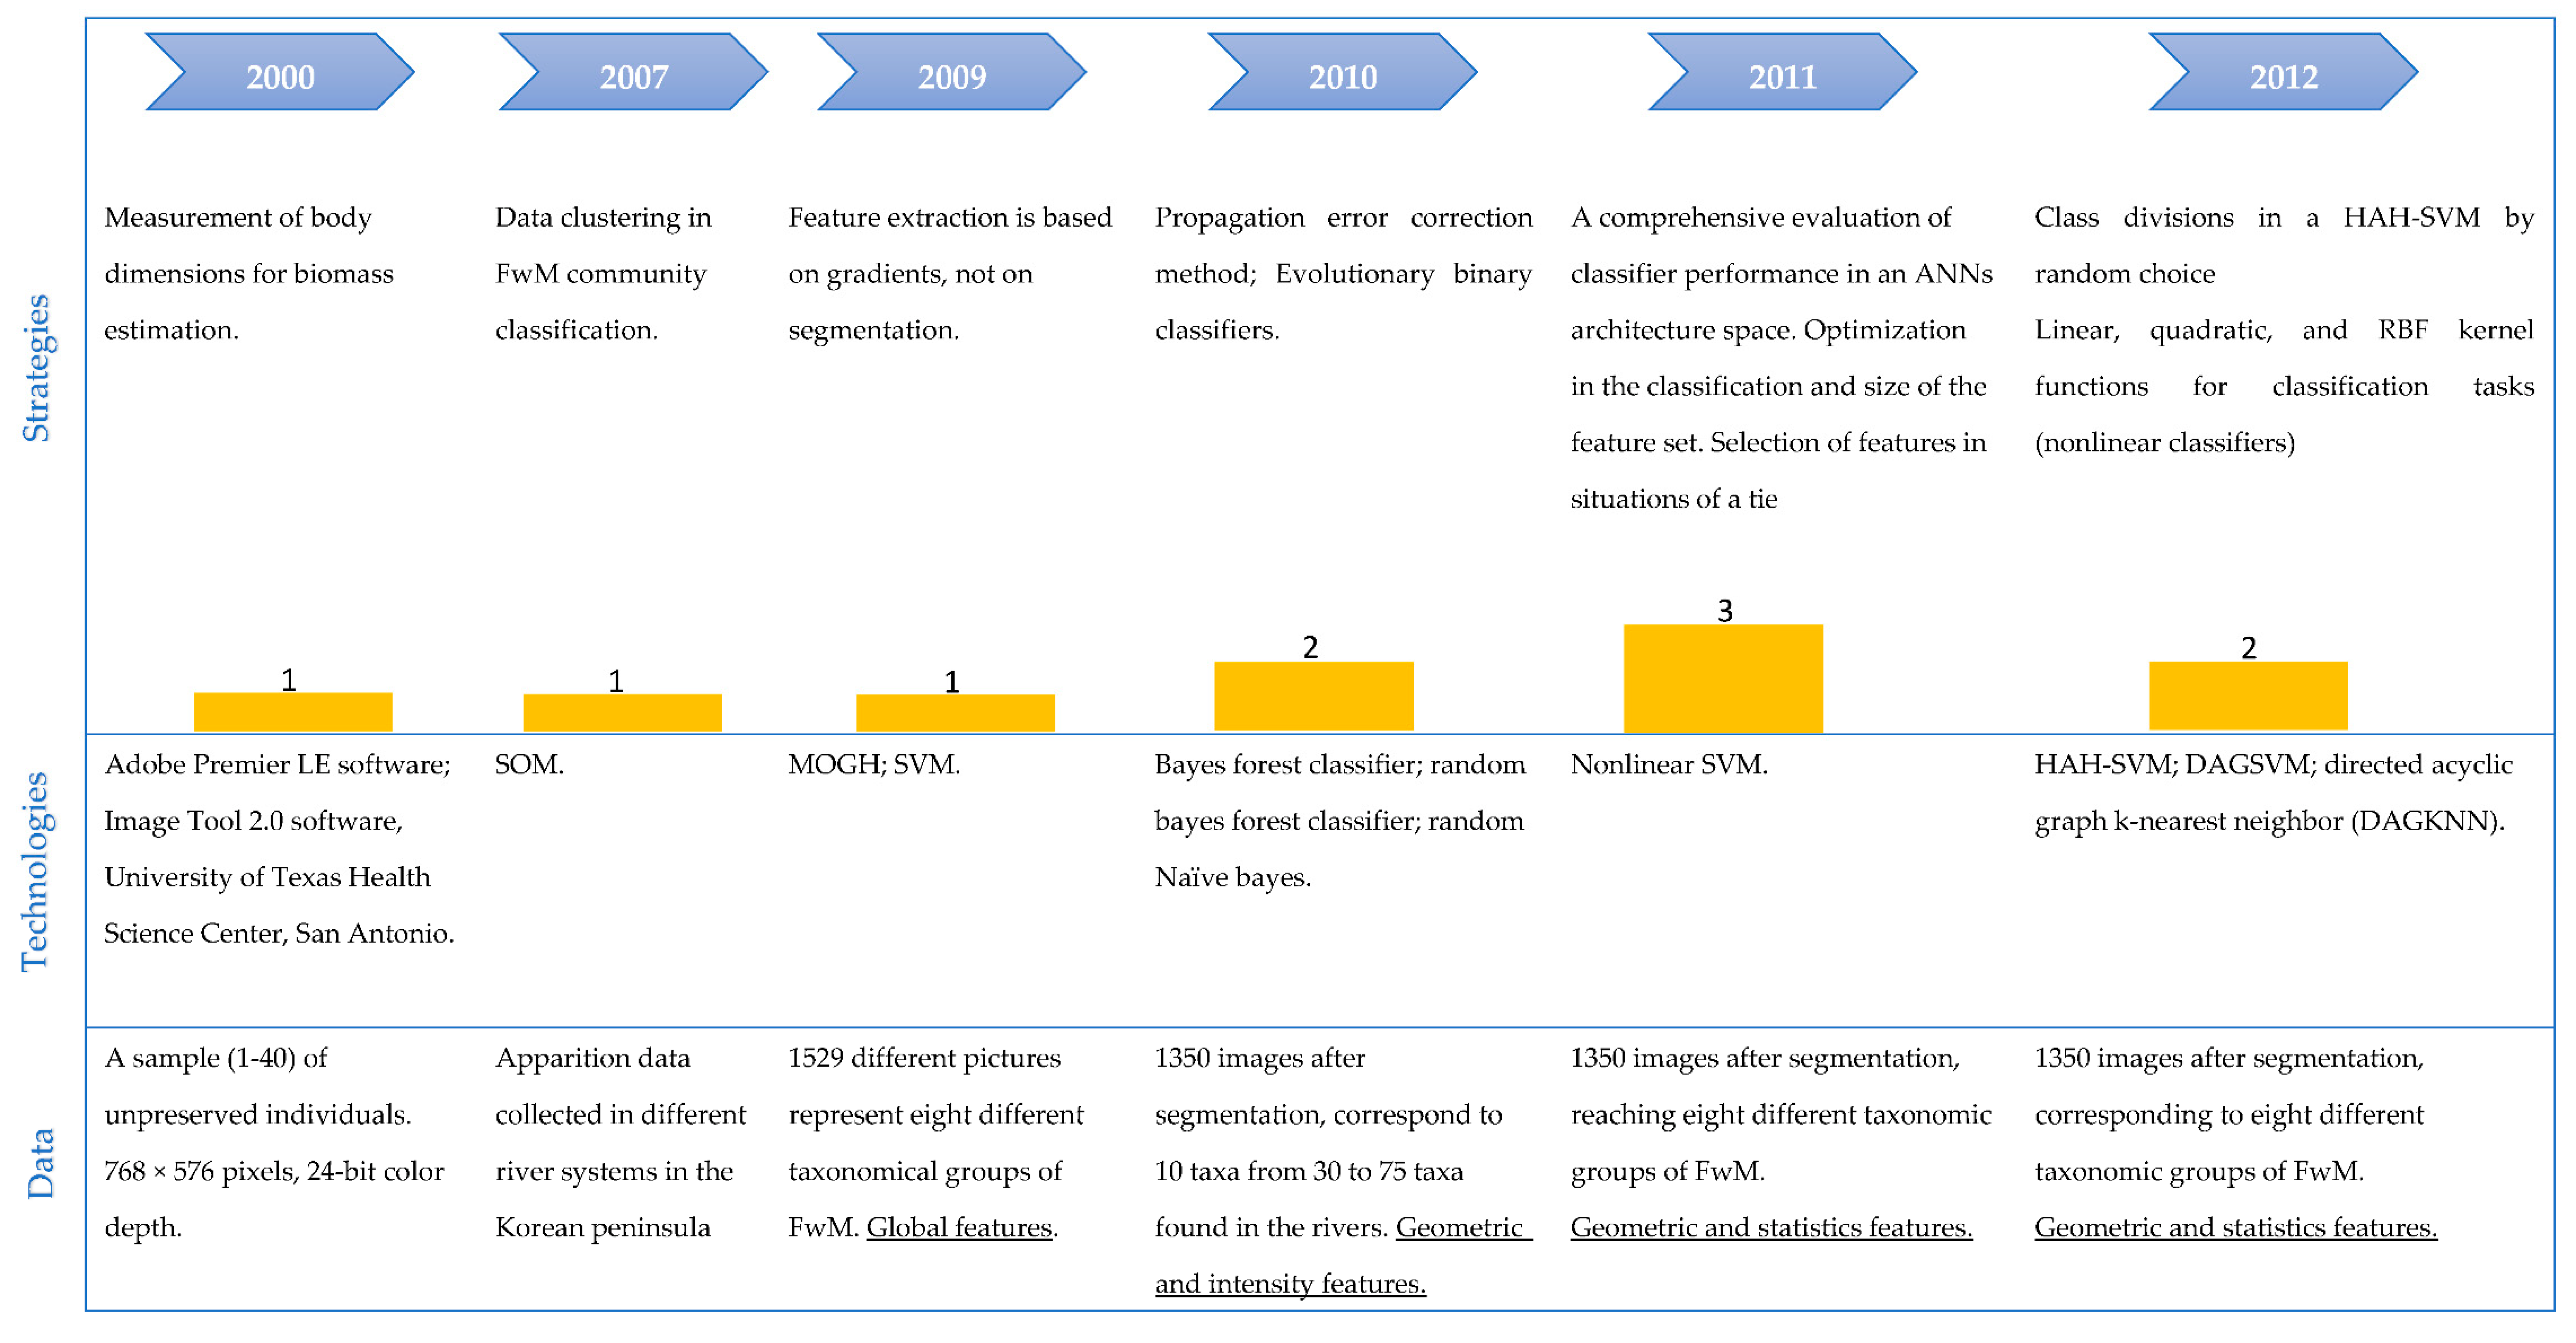
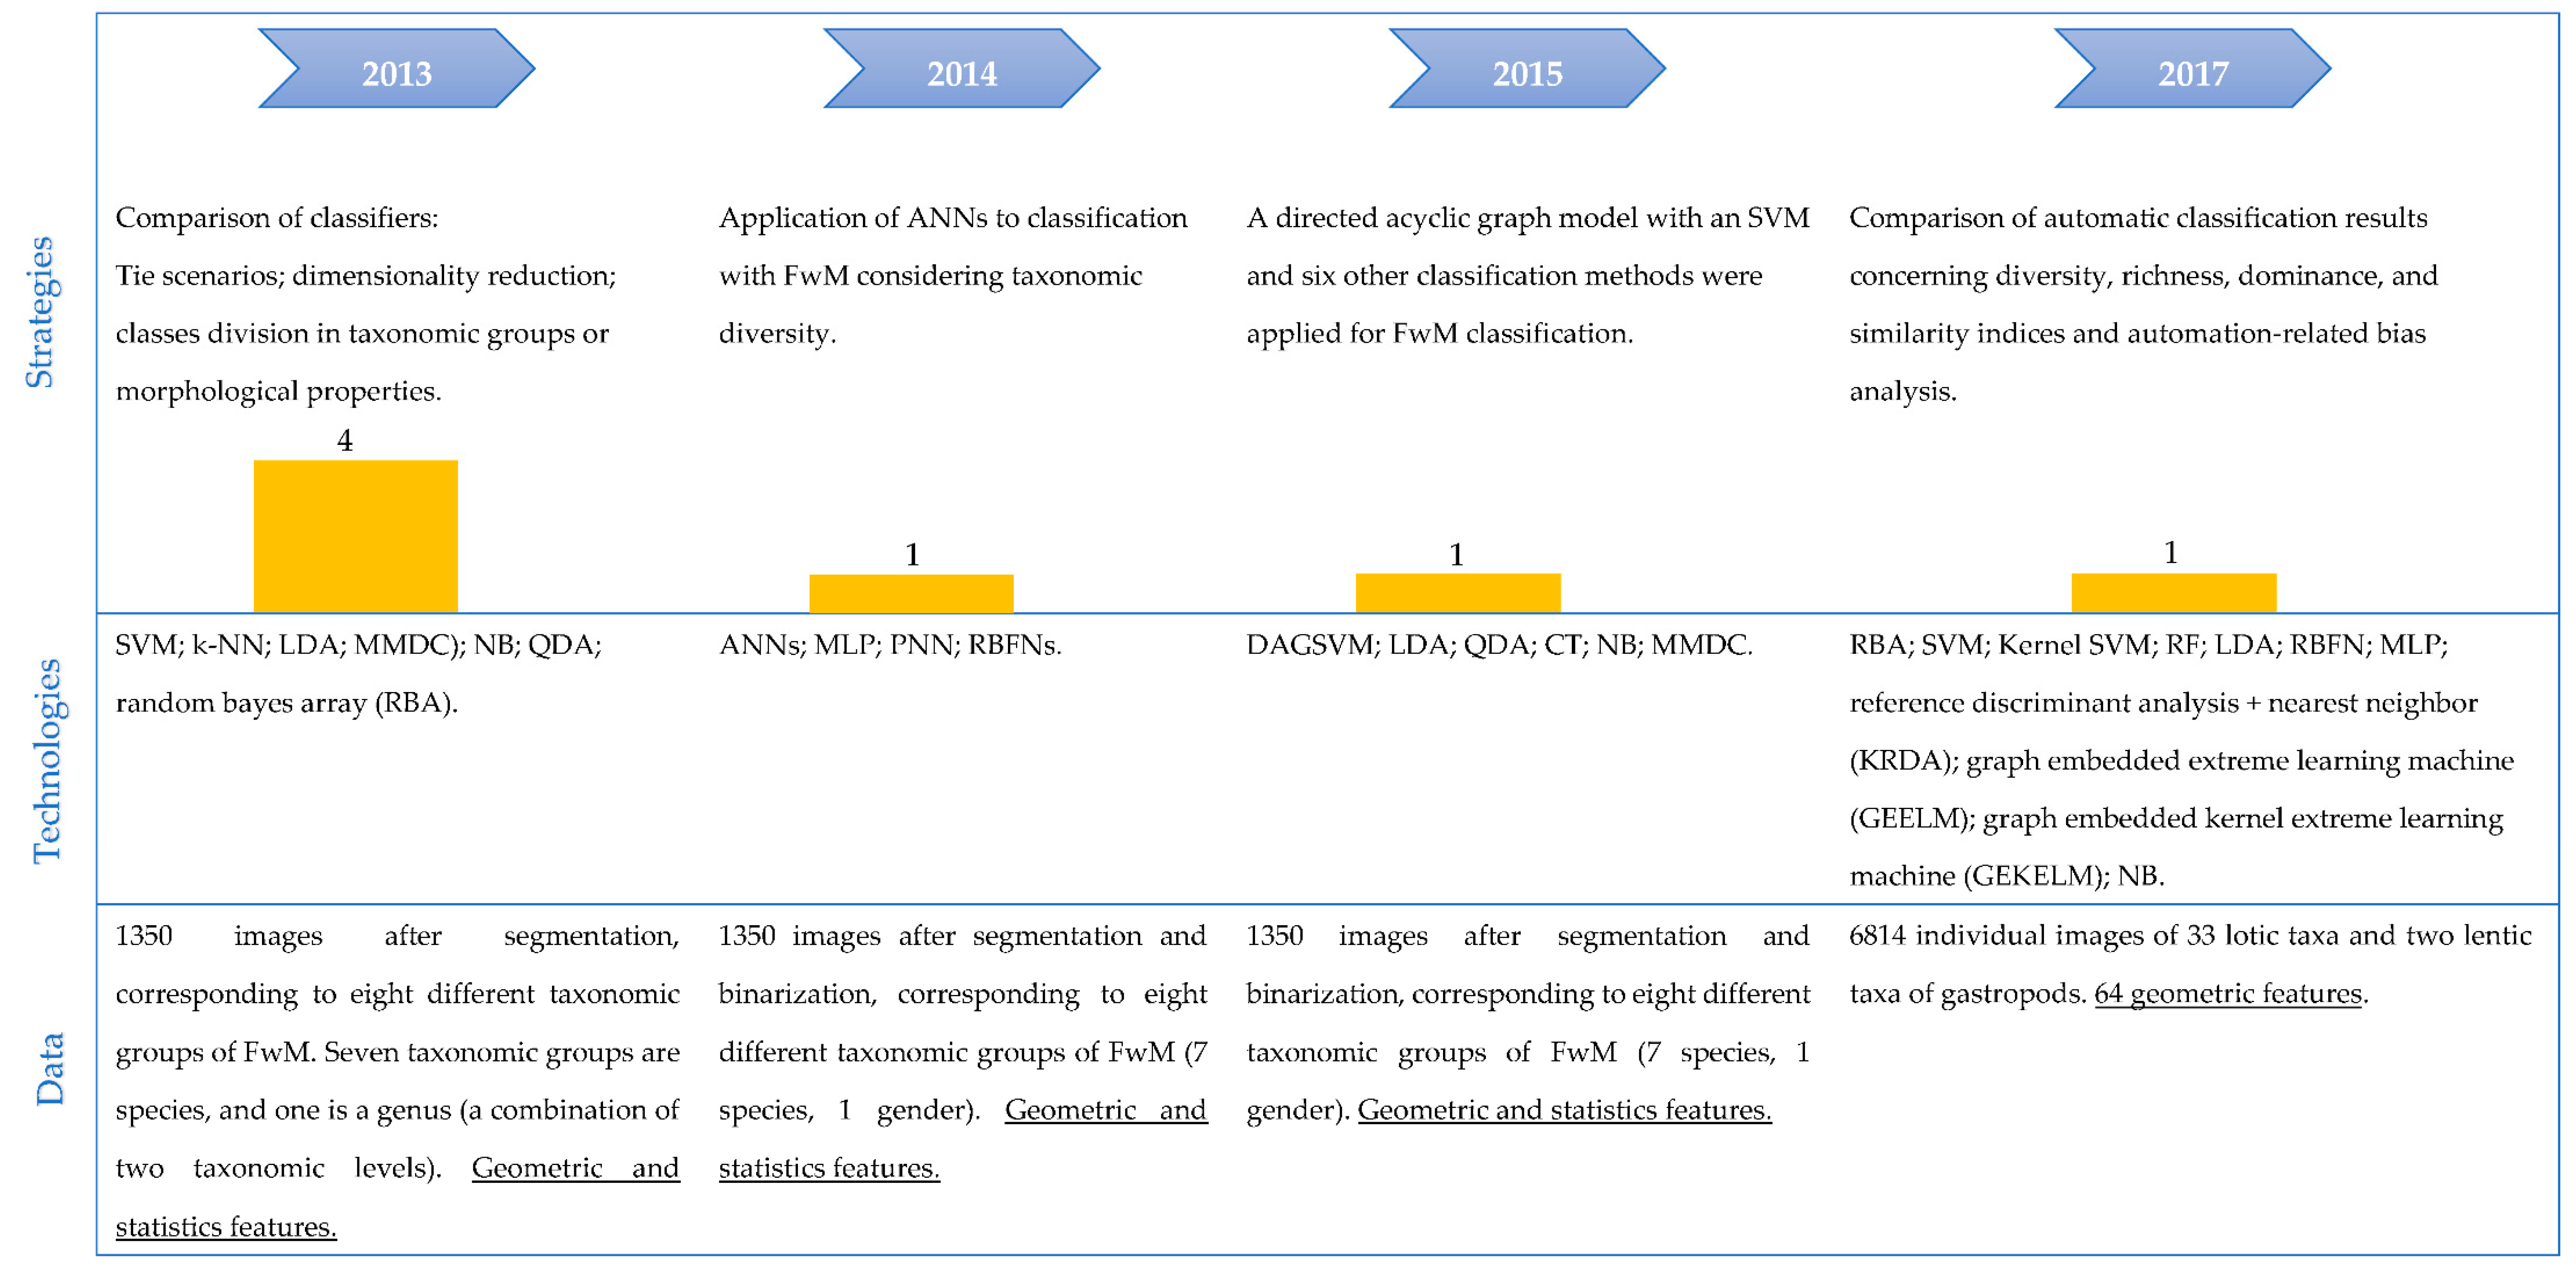
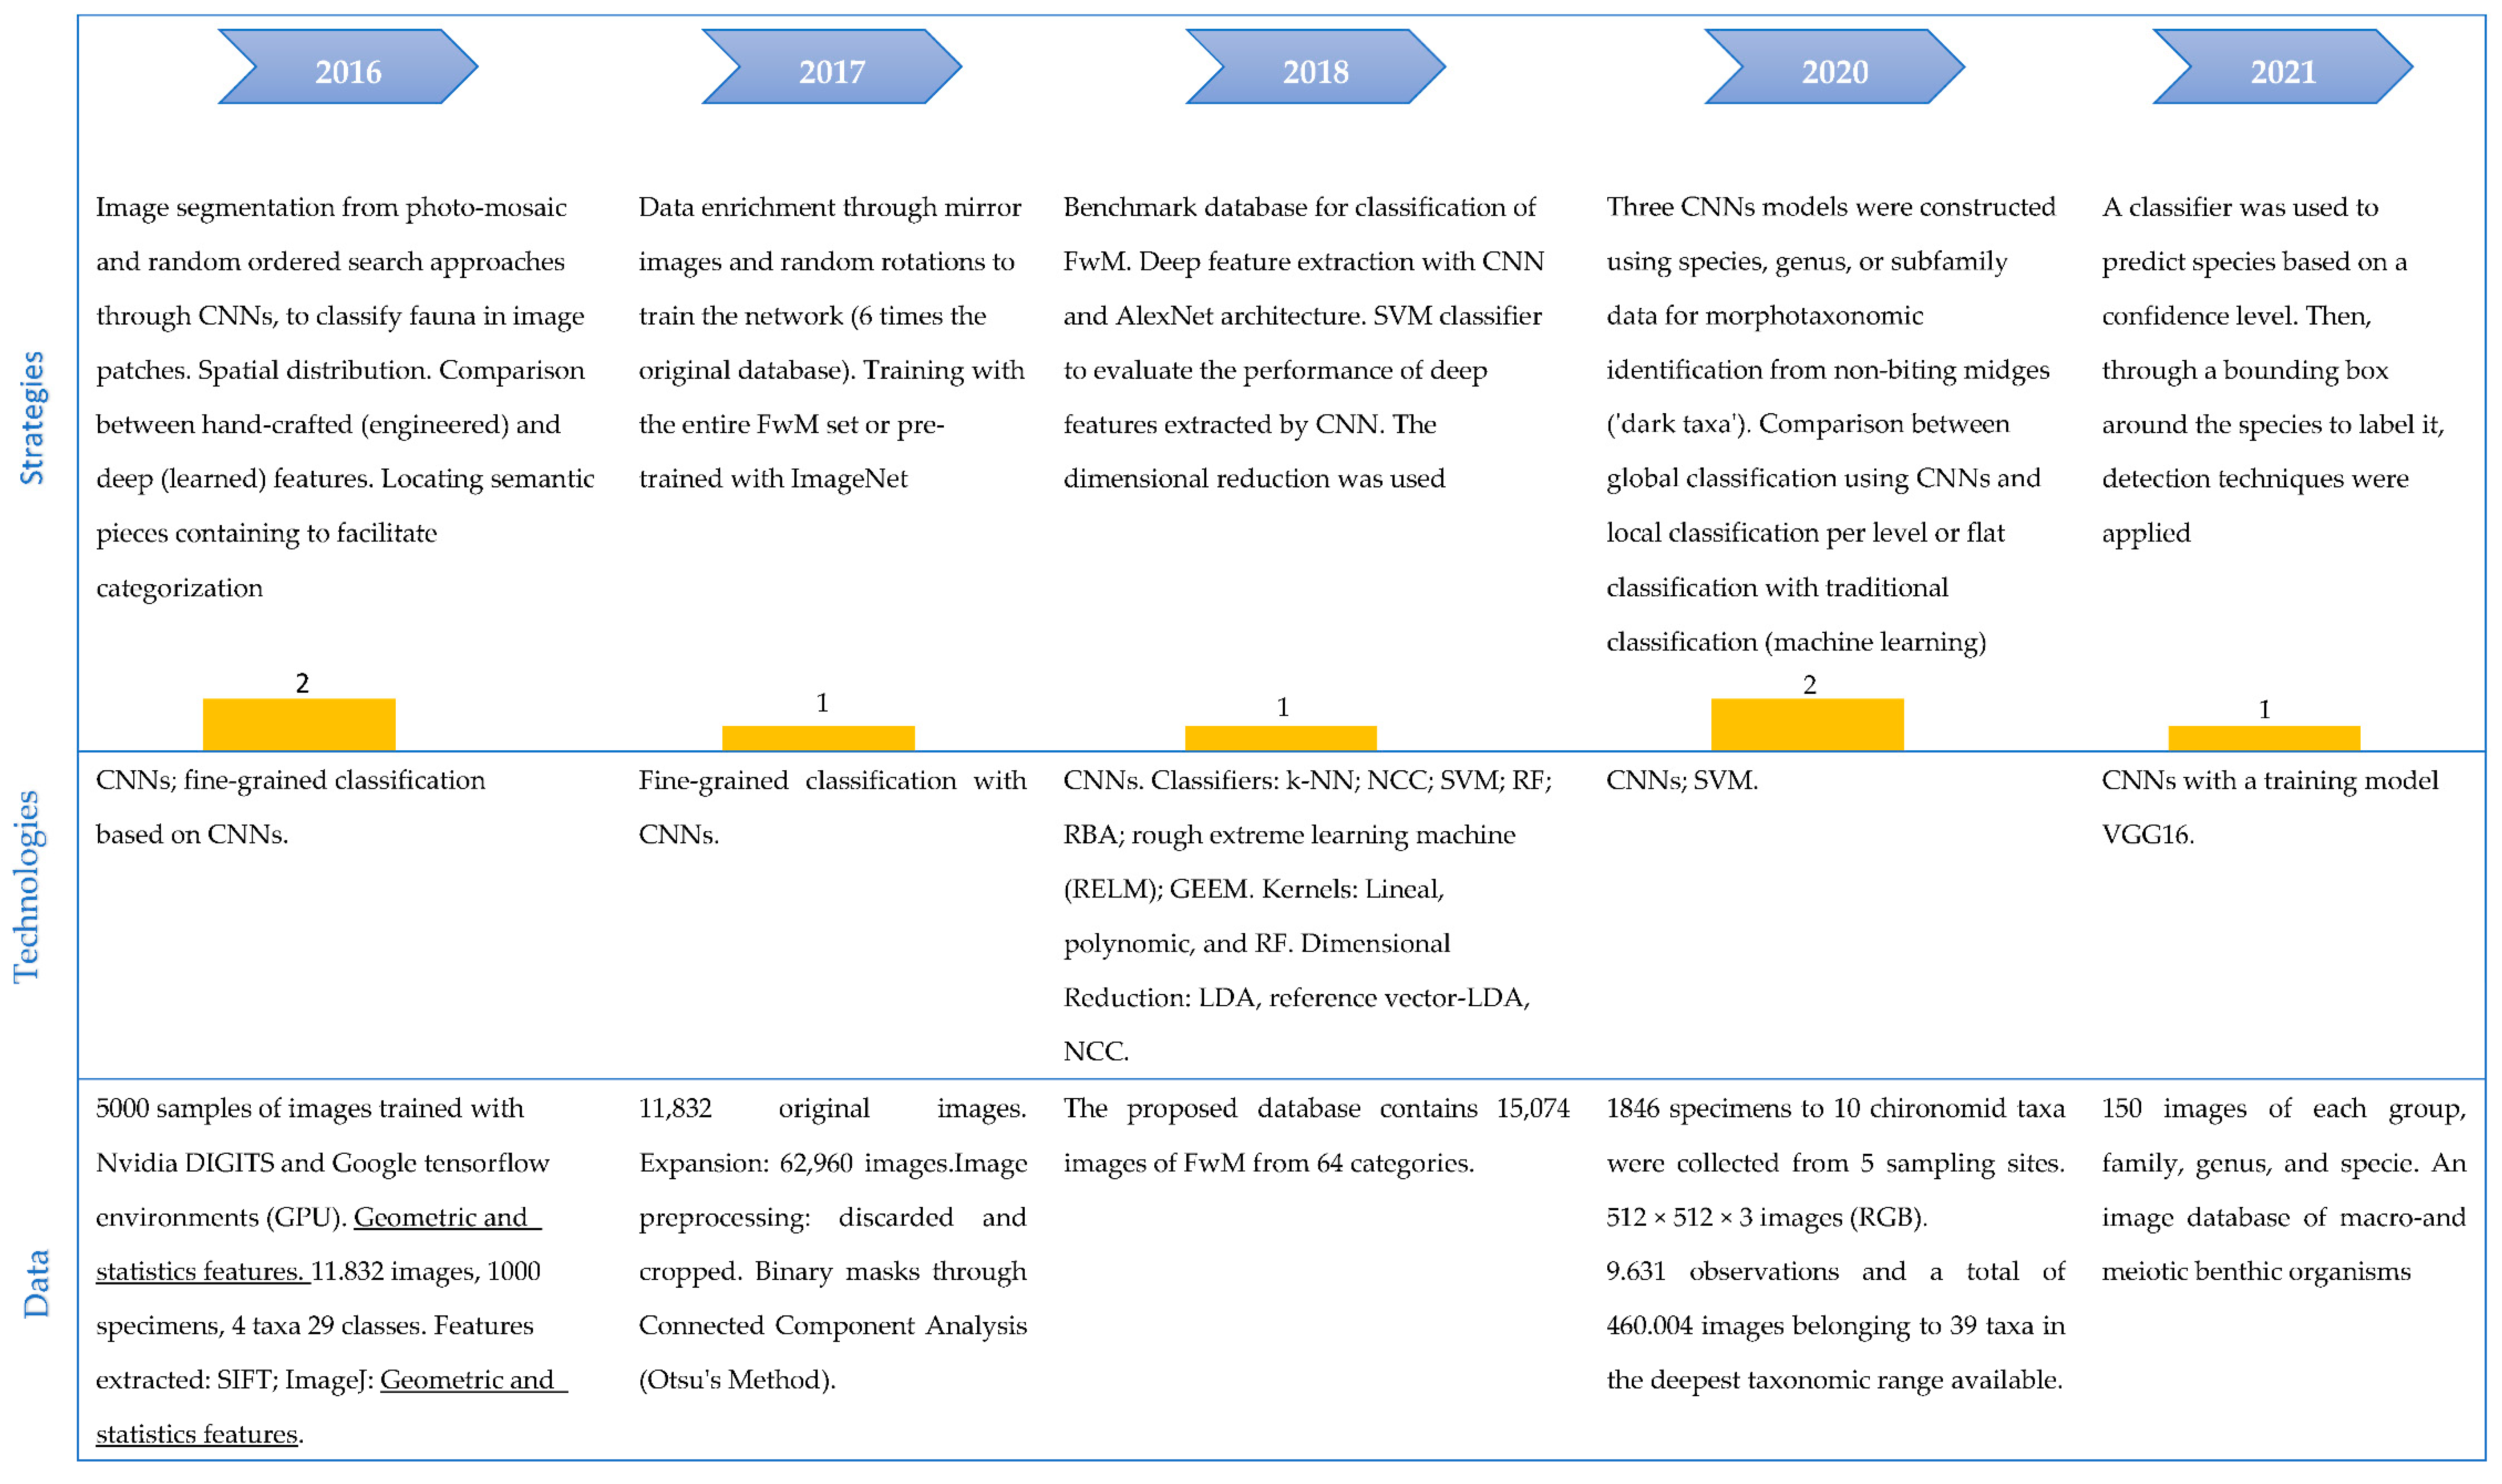
3.3.3. Characteristics of the Most Recent Studies
- Dimensional reduction: It was used only to reduce feature vectors obtained through deep learning and thus apply traditional classification techniques (e.g., SVM). However, they could not maintain the discriminative power of the original deep features [62].
- Morphotaxonomic classification: In [7] is the first time that morphotaxonomy is addressed regarding automatic classification methods. In this paper, the authors found that the performance of a deep classifier is more efficient on hierarchical multiclass data than traditional machine learning approaches applied on each taxonomic resolution level. Furthermore, their performance on images was superior to that of human experts. In another study [63], deep networks achieved excellent results compared to manual classification by humans on a limited set of classes.
3.3.4. Databases Used in Recent Years and Available for Automatic Classification Studies
4. Discussion
4.1. Summary of Evidence
4.1.1. Phase 1: Quantitative Analysis of Retrieved Data and Assigned Categories
4.1.2. Phase 2: Specific Analysis of Critical Factors, Methods, Computational Technologies, and Strategies Employed (Methodological Approach)
- Gaps in water quality
- Gaps in automatic classification
- Future challenges
4.2. Limitations
5. Conclusions
Author Contributions
Funding
Institutional Review Board Statement
Informed Consent Statement
Acknowledgments
Conflicts of Interest
Appendix A

| Application Areas | Computer Technology | ||
|---|---|---|---|
| Quality | Automatic Classification | Category | Subcategory |
|
| Machine Learning |
|
| Free software and proprietary |
| ||
Appendix B
| Database | FIN-Benthic |
| Link | https://etsin.fairdata.fi/dataset/b6faa81a-0d91-4fbd-b010-4ebf3f3da714 Accessed on 10 May 2020 |
| Date of publication/data creation | 11 March 2021/2016 |
| DOI | https://doi.org/10.1016/j.imavis.2018.06.005 |
| License | Creative Commons Attribution 4.0 International (CC BY 4.0) |
| Access | Open |
| Edit | Finnish Environment Institute |
| Authors | Raitoharju J., et al. (2018) |
| Aim | This is a dataset for automatic Fine-Grained Classification of FwM. |
| # image | 15.074 images |
| Categories | 64 |
| Images per category | From 577 to 7 |
| Content | several |
| Taxonomic groups | 12 groups of images at the species level 52 groups of images at the genus level |
| Resolution | 256 × 256 pixels |
| Size | 10.89 GB |
| Database | FIN-Benthic2—Accessed on 10 May 2020 |
| Link | https://etsin.fairdata.fi/dataset/a11cdc26-b9d0-4af1-9285-803d65a696a3 Accessed on 10 May 2020 |
| Date of publication | 30 June 2019 |
| DOI | https://doi.org/10.1016/j.image.2020.115917 |
| License | Creative Commons Attribution 4.0 International (CC BY 4.0) |
| Access | Open |
| Edit | Jenni Raitoharju |
| Authors | Jenni Raitoharju |
| Aim | This is a dataset for automatic Fine-Grained Classification of FwM |
| # image | 460.004 images |
| Categories | 39 |
| Images per category | From 490 to 44,240. Maximum number per copy: 50 |
| Content |
|
| Taxonomic groups | The data comprise 7 orders, 23 families, 30 genera, and 26 species. |
| Resolution | For these data, it ranges from 32 × 20 pixels to 468 × 540 pixels. The images come from 3 channels |
| Size | 11.01 GB |
Appendix C
| Critical Factors | Type of Computer Technology (SO *) | Strategies Used | Algorithm/Tool |
|---|---|---|---|
| Technical | |||
| Image | Image analysis software, X-Ray tomography (Q) | The use of spatial scales and fractal indices to detect biomass/body size relationship of FwM [89] or body dimensions [85], and to determine soil affectation to micro-porosity left by the burrowing system of FwM [90]. | Software: ImageJ software [89]; Adobe Premier LE; Image Tool 2.0 (University of Texas Health Science Center, San Antonio) [85]. |
| CNNs (C) | Image segmentation from photo-mosaicing and random ordered search approaches through CNNs, to classify fauna in image patches [60]. | Framework: Google tensorflow environments; Nvidia DIGITS [60]. | |
| Bias and accuracy in the evaluation of the data | Contamination diagnostic systems, case-based reasoning (CBR), decision trees, genetic algorithms (Q) | To maximize information retrieval from clustering and to sort biological and environmental data (nonlinear projection of data in two-dimensional space) [28]. Likewise, considering experience (e.g., CBR), the data were assigned a predictive character that ostensibly improves the results [91]. Genetic algorithms for automatic variable selection in decision trees reduced the error in models used to predict the relative absence of FwM [69]. | Software: RPDS [28]; PERPEST model;CBR [91], J48; WEKA [69]. |
| Classifiers (C) | To evaluate the performance of 6 classifiers through the one-vs-on method in tie situations, given that, in classification with FwM, it is often found with unambiguous final classes or unclassifiable regions [92]. | Classifiers: k-nearest neighbors algorithm (k-NN); Linear discriminant analysis (LDA); Minimum Mahalanobis distance classifier (MMDC); Naïve Bayes (NB); Quadratic discriminant analysis (QDA); and SVM. Future extraction: ImageJ. All tests and implementations of OVO were done with Matlab 2010b together with the Bioinformatics Toolbox and Statistics Toolbox. | |
| Data size and data complexity | Data processing software, ANNs, clustering algorithms, adaptive resonance, ecological evaluation software, classification trees, and genetic algorithms. (Q) | Among the most used strategies are: Decreasing data complexity [11,93,94,95]. Analysis of a large amount of data collected from samples [30]. Correlation between physico-chemical and biological variables [29,31,81]. Classification of data without prior knowledge [83]. Measuring frequency of occurrence of taxa [52]. Modeling and prediction of the richness of ecological and environmental data [82] through a selection of important predictors, information compression [45,96], and self-organization [47,48]. Data reduction through hierarchical clustering [38,42]. Obtaining ecological information and the causes of degradation through biological metrics, modeling, and prediction [24,44,73,95,96,97]. Automatic selection of input variables to ML algorithms [70]. Computer-assisted sampling methods and protocols address sample variability better [23] or identify temporal variation errors [27]. To recognize patterns in complex spatio-temporal data, related to migration activities [98]; biotic or abiotic parameters [50]; or delimitation of FwM communities [51,99,100]. Multivariate and multimetric analyses of FwM assemblages [101,102] The authors compared ANN configuration and performance criteria for analysing species diversity and environmental variation, considering non-linear variable relationships [103,104] | ANNs: SOM [38,50,51,83,99,102]; real-time recurrent network (RTRN) [93]; Senso-Net [11]; multi-layer-perceptrons based on the backpropagation (BP) [11,38,44,52,96]; generalized regression neural networks GRNN; linear neural networks (LNNs) [82]; multi-layer feed-forward neural network [84,97]. Algorithms: Bootstrap algorithm [81]; K-means [38,95]; decision trees (e.g., J48-WEKA); ANNs of MATLAB 5.3; genetic algorithm [70,73]; adaptive resonance theory (ART) [42]; Classification and regression trees (CART) [101]. Software: SYSTAT Software [29]; AQEM Software [24]; Framework Structural Equation Modelling (SEM) [94]; STARBUGS (STAR Bioassessment Uncertainty Software System) [27]; PRIMER [34]. |
| ANNs and classifiers (C) | Classification of FwM was performed through neural networks using the following strategies: Clustering of data in the classification of freshwater Macroinvertebrate communities through Self-Organizing Maps [68]. Creation of evolutionary binary classifier networks (NBCs) (scalable, adaptive, and accurate) when processing large image datasets [86]. Application of a comparison methodology based on a Neural Network architecture in which a comprehensive performance evaluation of several classifiers is carried out [33]. Feature selection in tie situations is based on nonlinear classifiers with one-vs.-one and one-vs.-all approaches, given the similarities and dissimilarities between taxonomic groups [54]. | ANNs: SOM [68]. Classifiers: NBCs [86]; SVM; Bayesianian classifiers (BCs); MLPs; RBFNs [33]; multi-class SVM [54]. Future extraction: ImageJ [33,54]. | |
| Classifiers (C) | Dimensionality reduction was applied in comparing various classification methods across feature subset selection and a variant of QDA using a random Bayes matrix (RBA); in the case of small samples with many features [58]. Besides, a directed acyclic graph model with a SVM was applied to classify FwM and six other classification methods [37]. | QDA [37]; random classifier Naïve Bayes (RNB) [58]; LDA [37]. Classifiers tested: MLP [58]; k-nearest-neighbor (KNN) [37,58]; RF [58]; SVM [37,58]; RBF (although it is not a classification method, it was constructed as such with a Naïve classifier) [58]; classification tree (CT), NB, MMDC [37]. Feature extraction: ImageJ [58]. Software: VueScan(c) software; HP Scanjet4850 flatbed scanner [58]. | |
| Data visualization | ANNs, clustering algorithms, adaptive resonance (Q) | Visualization of species assemblages in a two-dimensional field [83] or predicting community dynamics [38,93]. As well as for data reduction and hierarchical clustering at different spatio-temporal scales (nonlinear data projection) [28,42,89]. | ANNs: SOM [38,42,83]; backpropagation ANNs [38]; real-time recurrent network (RTRN) [93]. Specialized software: ImageJ [89]; RPDS [28]. Algorithms: K-means [38]. |
| Biologicals | |||
| Taxa/Phenomic data | Classifiers and their multiclass extensions (C) | Gradient-based feature extraction, eliminating segmentation and local feature detection on edges and other textual features of FwM [32]. Given the propagation of errors in FwM classes in the assigned proportions (automatic classification), a propagation error correction method known as confusion matrix correction in classification was proposed [57]. Optimization in classification and feature set size [34]. Comparison classifiers, improving class division by selecting taxonomic groups with similar external characteristics [56]. Comparison of classifiers with different kernel functions, analyzing tie situations and morphological properties of FwM [36]. | Feature extraction: Multiple order gradient histogram (SMOGH) [32]; ImageJ [36,56]. Classifiers: SVM—extension multiclass [32] and binary [36,56]; RF, RBF; Bayes classifier (BC) [57]; decision acyclic graph support vector machines (DAGSVM) [34]; LDA; QDA; MMDC [56]. |
| Taxonomic resolution | Ecological valuation software, ANNs(Q) | High taxonomic resolution to increase the quality of ecological assessment [25]. Mapping of structural and functional inter-taxa relationships [46]. Design of a protocol to provide a methodology for the selection of taxa and samples, which can be evaluated in a standardized way [23] | Software: Evaluation software AQEM (AAS) [25]; STAR bioassessment guidance software [23]. ANNs: SOM [46]. |
| Classifiers and their multiclass extensions, ANNs, DNNs (C). | Using multi-order gradients for feature extraction according to FwM variations in taxonomic resolution [32]. Advanced classification and data retrieval schemes in processing large image datasets with taxonomic features [86] Comprehensive performance evaluation of various classifiers in an ANNs architecture space addresses dissimilarities between taxa [33]. Addressing dissimilarities and similarities between taxonomic groups from a pattern recognition point of view (which species can be separated and which cannot) [54]. A novel approach to class division (Scatter) in a Half-Against-Half Support Vector Machine HAH-SVM by random choice [55]. Classification of hard-to-separate classes without taking into account tie situations [35]. Application of neural networks to classification with FwM taking into account taxonomic diversity [53]. Creation of a reference database in which deep learning techniques were applied, incorporating the AlexNet architecture. The DNNs were used to extract deep features, which were used by classifiers (SVM) to evaluate their performance. [62]. | Classifiers: The multi-class SVM classifier [32, 6262]; multiple order gradient histogram (MOGH) [32]; evolutionary binary classifier network [86]; SVM, Bayesian classifiers (BCs); HAH-SVM [55]; DAGSVM; directed acyclic graph k-nearest neighbor (DAGKNN) [35] ANNs: MLP; RBFN MLP; PNN; RBFNs [53]. Feature extraction: ImageJ [32,33,54,86]. DNNs: CNNs [62]. | |
Appendix D


Appendix E
| Id | Type | Year | Title | Author | Publication Title | DOI |
|---|---|---|---|---|---|---|
| 1 | Journal article | 2022 | A Bayesian belief network learning tool integrates multi-scale effects of riparian buffers on stream invertebrates | Forio, Marie Anne Eurie Burdon, Francis J. De Troyer, Niels Lock, Koen Witing, Felix Baert, Lotte De Saeyer, Nancy Rîșnoveanu, Geta Popescu, Cristina Kupilas, Benjamin Friberg, Nikolai Boets, Pieter Johnson, Richard K. Volk, Martin McKie, Brendan G. Goethals, Peter L.M. | Science of The Total Environment | 10.1016/j.scitotenv.2021.152146 |
| 2 | Journal article | 2022 | Influence of environmental variables on macroinvertebrate community structure in Lianhuan Lake | Dou Q., Du X., Cong Y., Wang L., Zhao C., Song D., Liu H., Huo T. | Ecology and evolution | 10.1002/ece3.8553 |
| 3 | Journal article | 2021 | Can SPEcies At Risk of pesticides (SPEAR) indices detect effects of target stressors among multiple interacting stressors? | Bray, Jonathan P. O’Reilly-Nugent, Andrew Kon Kam King, Guillaume Kaserzon, Sarit Nichols, Susan J. Nally, Ralph Mac Thompson, Ross M. Kefford, Ben J. | Science of The Total Environment | 10.1016/j.scitotenv.2020.142997 |
| 4 | Journal article | 2021 | Neural network model approach for automated benthic animal identification | Singh, Ravail Mumbarekar, Varun | ICT Express | 10.1016/j.icte.2021.03.003 |
| 5 | Journal article | 2021 | Agricultural activities compromise ecosystem health and functioning of rivers: Insights from multivariate and multimetric analyses of macroinvertebrate assemblages | Zhang Y., Leung J.Y.S., Zhang Y., Cai Y., Zhang Z., Li K. | Environmental Pollution | 10.1016/j.envpol.2021.116655 |
| 6 | Journal article | 2020 | Where does land use matter most? Contrasting land use effects on river quality at different spatial scales | Nelson Mwaijengo, G.Msigwa, A. Njau, K.N. Brendonck, L.Vanschoenwinkel, B. | Science of the Total Environment | 10.1016/j.scitotenv.2019.134825 |
| 7 | Journal article | 2020 | Application of deep learning in aquatic bioassessment: Towards automated identification of non-biting midges | Milošević, D. Milosavljević, A. Predić, B. Medeiros, A.S. Savić-Zdravković, D. Stojković Piperac, M. Kostić, T. Spasić, F. Leese, F. | Science of the Total Environment | 10.1016/j.scitotenv.2019.135160 |
| 8 | Journal article | 2020 | Tracking wireworm burrowing behaviour in soil over time using 3D X-ray computed tomography | Booth, S. Kurtz, B. de Heer, M.I. Mooney, S.J. Sturrock, C.J. | Pest Management Science | 10.1002/ps.5808 |
| 9 | Journal article | 2020 | Human experts vs. machines in taxa recognition | Johanna Ärje, Jenni Raitoharju, Alexandros Iosifidis, Ville Tirronen, Kristian Meissner, Moncef Gabbouj, Serkan Kiranyaz, Salme Kärkkäinen | Signal Processing: Image Communication | 10.1016/j.image.2020.115917 |
| 10 | Journal article | 2018 | Benchmark database for fine-grained image classification of benthic macroinvertebrates | Raitoharju, J. Riabchenko, E. Ahmad, I. Iosifidis, A. Gabbouj, M. Kiranyaz, S. Tirronen, V. Ärje, J. Kärkkäinen, S. Meissner, K. | Image and Vision Computing | 10.1016/j.imavis.2018.06.005 |
| 11 | Journal article | 2018 | Hyperspectral Imaging of Macroinvertebrates—a Pilot Study for Detecting Metal Contamination in Aquatic Ecosystems | Salmelin, J. Pölönen, I. Puupponen, H.-H. Hämäläinen, H. Karjalainen, A.K. Väisänen, A. Vuori, K.-M. | Water, Air, and Soil Pollution | 10.1007/s11270-018-3963-2 |
| 12 | Journal article | 2018 | Evaluating freshwater macroinvertebrates from eDNA metabarcoding: A river Nalón case study | Fernández, S. Rodríguez, S. Martínez, J.L. Borrell, Y.J. Ardura, A. García-Vázquez, E. | PLoS ONE | 10.1371/journal.pone.0201741 |
| 13 | Journal article | 2018 | Can high-throughput sequencing detect macroinvertebrate diversity for routine monitoring of an urban river? | Carew, M.E. Kellar, C.R. Pettigrove, V.J. Hoffmann, A.A. | Ecological Indicators | 10.1016/j.ecolind.2017.11.002 |
| 14 | Book section | 2018 | Linking DNA Metabarcoding and Text Mining to Create Network-Based Biomonitoring Tools: A Case Study on Boreal Wetland Macroinvertebrate Communities | Compson, Z.G. Monk, W.A. Curry, C.J. Gravel, D. Bush, A. Baker, C.J.O. Al Manir, M.S. Riazanov, A. Hajibabaei, M. Shokralla, S. Gibson, J.F. Stefani, S. Wright, M.T.G. Baird, D.J. | Advances in Ecological Research | 10.1016/bs.aecr.2018.09.001 |
| 15 | Journal article | 2018 | Determining the macroinvertebrate community indicators and relevant environmental predictors of the Hun, Tai River Basin (Northeast China): A study based on community patterning | Zhang M., Muñoz-Mas R., Martínez-Capel F., Qu X., Zhang H., Peng W., Liu X. | Science of The Total Environment | 10.1016/j.scitotenv.2018.04.021 |
| 16 | Journal article | 2017 | A digital reference collection for aquatic macroinvertebrates of North America | Walters, D.M. Ford, M.A. Zuellig, R.E. | Freshwater Science | 10.1086/694539 |
| 17 | Journal article | 2017 | The effect of automated taxa identification errors on biological indices | Ärje, J. Kärkkäinen, S. Meissner, K. Iosifidis, A. Ince, T. Gabbouj, M. Kiranyaz, S. | Expert Systems with Applications | 10.1016/j.eswa.2016.12.015 |
| 18 | Conference paper | 2017 | Data enrichment in fine-grained classification of aquatic macroinvertebrates | Raitoharju, J. Riabchenko, E. Meissner, K. Ahmad, I. Iosifidis, A. Gabbouj, M. Kiranyaz, S. | IEEE Xplore | 10.1109/CVAUI.2016.20 |
| 19 | Book section | 2017 | A variable length chromosome genetic algorithm approach to identify species distribution models useful for freshwater ecosystem management | Gobeyn, S. Goethals, P.L.M. | ||
| 20 | Conference paper | 2016 | Deep learning for benthic fauna identification | Marburg, A. Bigham, K. | IEEE Xplore | 10.1109/OCEANS.2016.7761146 |
| 21 | Conference paper | 2016 | Learned vs. engineered features for fine-grained classification of aquatic macroinvertebrates | Riabchenko, E. Meissner, K. Ahmad, I. Iosifidis, A. Tirronen, V. Gabbouj, M. Kiranyaz, S. | IEEE Xplore | 10.1109/ICPR.2016.7899975 |
| 22 | Journal article | 2015 | Directed acyclic graph support vector machines in classification of benthic macroinvertebrate samples | Joutsijoki, H. Siermala, M. Juhola, M. | Artificial Intelligence Review | 10.1007/s10462-014-9425-3 |
| 23 | Journal article | 2015 | Invertebrate diversity in relation to chemical pollution in an Umbrian stream system (Italy) | Pallottini, M. Goretti, E. Gaino, E. Selvaggi, R. Cappelletti, D. Céréghino, R. | Comptes Rendus—Biologies | 10.1016/j.crvi.2015.04.006 |
| 24 | Journal article | 2015 | Inferring landscape-scale land-use impacts on rivers using data from mesocosm experiments and artificial neural networks | Magierowski, R.H. Read, S.M. Carter, S.J.B. Warfe, D.M. Cook, L.S. Lefroy, E.C. Davies, P.E. | PLoS ONE | 10.1371/journal.pone.0120901 |
| 25 | Journal article | 2015 | Prediction of Glossosoma biomass spatial distribution in Valley Creek by field measurements and a three-dimensional turbulent open-channel flow model | Morris, M. Mohammadi, M.H. Day, S. Hondzo, M. Sotiropoulos, F. | Water Resources Research | 10.1002/2014WR015887 |
| 26 | Journal article | 2015 | Application of a self-organizing map and canonical correspondence analysis in modern benthic foraminiferal communities: A case study from the pearl river estuary, China | Li T., Xiang R., Li T. | Journal of Foraminiferal Research | 10.2113/gsjfr.45.3.305 |
| 27 | Journal article | 2014 | Evaluating the performance of artificial neural networks for the classification of freshwater benthic macroinvertebrates | Joutsijoki, H. Meissner, K. Gabbouj, M. Kiranyaz, S. Raitoharju, J. Ärje, J. Kärkkäinen, S. Tirronen, V. Turpeinen, T. Juhola, M. | Ecological Informatics | 10.1016/j.ecoinf.2014.01.004 |
| 28 | Conference paper | 2013 | Half-against-half structure in classification of benthic macroinvertebrate images | Joutsijoki, H. | IEEE Xplore | 10.1109/EMBC.2013.6610333 |
| 29 | Journal article | 2013 | Breaking the curse of dimensionality in quadratic discriminant analysis models with a novel variant of a Bayes classifier enhances automated taxa identification of freshwater macroinvertebrates | Ärje, J. Kärkkäinen, S. Turpeinen, T. Meissner, K. | Environmetrics | 10.1002/env.2208 |
| 30 | Journal article | 2013 | Comparison of species sensitivity distributions based on population or individual endpoints | Beaudouin, R. Péry, A.R.R. | Environmental Toxicology and Chemistry | 10.1002/etc.2148 |
| 31 | Journal article | 2013 | Kernel selection in multi-class support vector machines and its consequence to the number of ties in majority voting method | Joutsijoki, H. Juhola, M. | Artificial Intelligence Review | 10.1007/s10462-011-9281-3 |
| 32 | Conference paper | 2013 | An Application of One-vs-One Method in Automated Taxa Identification of Macroinvertebrates | Joutsijoki, Henry | 2013 Fourth Global Congress on Intelligent Systems | 10.1109/GCIS.2013.26 |
| 33 | Conference paper | 2012 | Half-Against-Half Multi-Class Support Vector Machines in classification of benthic macroinvertebrate images | Joutsijoki, H. | IEEE Xplore | 10.1109/ICCISci.2012.6297281 |
| 34 | Book section | 2012 | DAGSVM vs. DAGKNN: An experimental case study with benthic macroinvertebrate dataset | Joutsijoki, H. Juhola, M. | Lecture Notes in Computer Science | 10.1007/978-3-642-31537-4_35 |
| 35 | Conference paper | 2011 | Automated benthic macroinvertebrate identification with Decision Acyclic Graph Support Vector Machines | Joutsijoki, H. Juhola, M. | Intelligent Systems and Control/Computational Bioscience—2011 | 10.2316/P.2011.742-041 |
| 36 | Journal article | 2011 | Water toxicity assessment and spatial pollution patterns identification in a Mediterranean River Basin District. Tools for water management and risk analysis | Carafa, R. Faggiano, L. Real, M. Munné, A. Ginebreda, A. Guasch, H. Flo, M. Tirapu, L. der Ohe, P.C.V. | Science of the Total Environment | 10.1016/j.scitotenv.2011.06.053 |
| 37 | Book section | 2011 | Comparing the one-vs-one and one-vs-all methods in benthic macroinvertebrate image classification | Joutsijoki, H. Juhola, M. | Computer Science | 10.1007/978-3-642-23199-5_30 |
| 38 | Journal article | 2011 | Classification and retrieval on macroinvertebrate image databases | Kiranyaz, S. Ince, T. Pulkkinen, J. Gabbouj, M. Ärje, J. Kärkkäinen, S. Tirronen, V. Juhola, M. Turpeinen, T. Meissner, K. | Computers in Biology and Medicine | 10.1016/j.compbiomed.2011.04.008 |
| 39 | Journal article | 2011 | Development and application of a hybrid model to analyze spatial distribution of macroinvertebrates under flow regulation in the Lijiang River | Chen Q., Yang Q., Lin Y. | Ecological Informatics | 10.1016/j.ecoinf.2011.08.001 |
| 40 | Conference paper | 2010 | Network of evolutionary binary classifiers for classification and retrieval in macroinvertebrate databases | Kiranyaz, S. Gabbouj, M. Pulkkinen, J. Ince, T. Meissner, K. | IEEE Xplore | 10.1109/ICIP.2010.5651161 |
| 41 | Conference paper | 2010 | Statistical classification and proportion estimation—An application to a macroinvertebrate image database | Ärje, J. Kärkkäinen, S. Meissner, K. Turpeinen, T. | IEEE Xplore | 10.1109/MLSP.2010.5588324 |
| 42 | Journal article | 2010 | Automated processing and identification of benthic invertebrate samples | Lytle, David A. Martínez-Muñoz, Gonzalo Zhang, Wei Larios, Natalia Shapiro, Linda Paasch, Robert Moldenke, Andrew Mortensen, Eric N. Todorovic, Sinisa Dietterich, Thomas G. | Journal of the North American Benthological Society | 10.1899/09-080.1 |
| 43 | Journal article | 2010 | A heuristic approach to predicting water beetle diversity in temporary and fluctuating waters | Gutiérrez-Estrada J.C., Bilton D.T. | Ecological Modelling | 10.1016/j.ecolmodel.2010.03.007 |
| 44 | Journal article | 2010 | Selecting variables for habitat suitability of Asellus (Crustacea, Isopoda) by applying input variable contribution methods to artificial neural network models | Mouton A.M., Dedecker A.P., Lek S., Goethals P.L.M. | Environmental Modeling & Assessment | 10.1007/s10666-009-9192-8 |
| 45 | Conference paper | 2009 | Analysing biological, chemical and geomorphological interactions in rivers using Structural Equation Modelling | Bizzi, S. Surridge, B. Lerner, D.N. | World IMACS Congress | |
| 46 | Journal article | 2009 | Modeling of the hierarchical structure of freshwater macroinvertebrates using artificial neural networks | Rico, C. Paredes, M. Fernández, N. | Acta Biologica Colombiana | |
| 47 | Book section | 2009 | Multiple Order Gradient Feature for Macro-Invertebrate Identification Using Support Vector Machines | Tirronen, Ville Caponio, Andrea Haanpää, Tomi Meissner, Kristian | Adaptive and Natural Computing Algorithms | 10.1007/978-3-642-04921-7_50 |
| 48 | Journal article | 2008 | Implementation of artificial neural networks (ANNs) to analysis of inter-taxa communities of benthic microorganisms and macroinvertebrates in a polluted stream | Kim, B. Lee, S.-E. Song, M.-Y. Choi, J.-H. Ahn, S.-M. Lee, K.-S. Cho, E. Chon, T.-S. Koh, S.-C. | Science of the Total Environment | 10.1016/j.scitotenv.2007.09.009 |
| 49 | Journal article | 2007 | Self-organizing mapping of benthic macroinvertebrate communities implemented to community assessment and water quality evaluation | Song, M.-Y. Hwang, H.-J. Kwak, I.-S. Ji, C.W. Oh, Y.-N. Youn, B.J. Chon, T.-S. | Ecological Modelling | 10.1016/j.ecolmodel.2006.04.027 |
| 50 | Journal article | 2007 | Applications of artificial neural networks predicting macroinvertebrates in freshwaters | Goethals P.L.M., Dedecker A.P., Gabriels W., Lek S., De Pauw N. | Aquatic Ecology | 10.1007/s10452-007-9093-3 |
| 51 | Book section | 2006 | Development and application of predictive river ecosystem models based on classification trees and artificial neural networks | Goethals, P. Dedecker, A. Gabriels, W. De Pauw, N. | Ecological Informatics: Scope, Techniques and Applications | 10.1007/3-540-28426-5_8 |
| 52 | Journal article | 2006 | Errors and uncertainty in bioassessment methods—Major results and conclusions from the STAR project and their application using STARBUGS | Clarke, R.T. Hering, D. | Hydrobiologia | 10.1007/s10750-006-0079-2 |
| 53 | Journal article | 2006 | Estimates and comparisons of the effects of sampling variation using ‘national’ macroinvertebrate sampling protocols on the precision of metrics used to assess ecological status | Clarke, R.T. Davy-Bowker, J. Sandin, L. Friberg, N. Johnson, R.K. Bis, B. | Hydrobiologia | 10.1007/s10750-006-0076-5 |
| 54 | Journal article | 2006 | Genetic algorithms for optimisation of predictive ecosystems models based on decision trees and neural networks | D’heygere, T. Goethals, P.L.M. De Pauw, N. | Ecological Modelling | 10.1016/j.ecolmodel.2005.11.005 |
| 55 | Book section | 2006 | Modelling Ecological Interrelations in Running Water Ecosystems with Artificial Neural Networks | Schleiter, I. M. Obach, M. Wagner, R. Werner, H. Schmidt, H. -H. Borchardt, D. | Ecological Informatics | 10.1007/3-540-28426-5_9 |
| 56 | Journal article | 2006 | Development of an in-stream migration model for Gammarus pulex L. (Crustacea, Amphipoda) as a tool in river restoration management | Dedecker A.P., Goethals P.L.M., D’Heygere T., De Pauw N. | Aquatic Ecology | 10.1007/s10452-005-9022-2 |
| 57 | Journal article | 2006 | Patterning of impoundment impact on chironomid assemblages and their environment with use of the self-organizing map (SOM) | Penczak T., Kruk A., Grzybkowska M., Dukowska M. | Acta Oecologica | 10.1016/j.actao.2006.05.007 |
| 58 | Book section | 2005 | A neural network approach to the prediction of benthic macroinvertebrate fauna composition in rivers | Di Dato, P. Mancini, L. Tancioni, L. Scardi, M. | Modelling Community Structure in Freshwater Ecosystems | 10.1007/3-540-26894-4_14 |
| 59 | Journal article | 2005 | Application of artificial neural network models to analyse the relationships between gammarus pulex L. (Crustacea, Amphipoda) and river characteristics | Dedecker, A.P. Goethals, P.L. D’heygere, T. Gevrey, M. Lek, S. De Pauw, N. | Environmental Monitoring and Assessment | 10.1007/s10661-005-8221-6 |
| 60 | Journal article | 2005 | Effects of metal pollution on soil macroinvertebrate burrow systems | Nahmani, J. Capowiez, Y. Lavelle, P. | Biology and Fertility of Soils | 10.1007/s00374-005-0865-4 |
| 61 | Journal article | 2005 | Does macrophyte fractal complexity drive invertebrate diversity, biomass and body size distributions? | McAbendroth, L. Ramsay, P.M. Foggo, A. Rundle, S.D. Bilton, D.T. | Oikos | 10.1111/j.0030-1299.2005.13804.x |
| 62 | Journal article | 2004 | Hierarchical community classification and assessment of aquatic ecosystems using artificial neural networks | Park, Y.-S. Chon, T.-S. Kwak, I.-S. Lek, S. | Science of the Total Environment | 10.1016/j.scitotenv.2004.01.014 |
| 63 | Journal article | 2004 | Assigning macroinvertebrate tolerance classifications using generalised additive models | Yuan, L.L. | Freshwater Biology | 10.1111/j.1365-2427.2004.01206.x |
| 64 | Journal article | 2004 | Assessment methodology for southern siliceous basins in Portugal | Pinto, P. Rosado, J. Morais, M. Antunes, I. | Hydrobiologia | 10.1023/B:HYDR.0000025266.86493.a2 |
| 65 | Journal article | 2004 | Overview and application of the AQEM assessment system | Hering, D. Moog, O. Sandin, L. Verdonschot, P.F.M. | Hydrobiologia | 10.1023/B:HYDR.0000025255.70009.a5 |
| 66 | Journal article | 2004 | The effect of taxonomic resolution on the assessment of ecological water quality classes | Schmidt-Kloiber, A. Nijboer, R.C. | Hydrobiologia | 10.1023/B:HYDR.0000025270.10807.10 |
| 67 | Journal article | 2004 | Optimization of Artificial neural network (ANN) model design for prediction of macroinvertebrates in the Zwalm river basin (Flanders, Belgium) | Dedecker A.P., Goethals P.L.M., Gabriels W., De Pauw N. | Ecological Modelling | 10.1016/j.ecolmodel.2004.01.003 |
| 68 | Journal article | 2003 | Use of genetic algorithms to select input variables in decision tree models for the prediction of benthic macroinvertebrates | D’heygere, T. Goethals, P.L.M. De Pauw, N. | Ecological Modelling | 10.1016/S0304-3800(02)00260-0 |
| 69 | Journal article | 2003 | Predicting the species richness of aquatic insects in streams using a limited number of environmental variables | Céréghino, R. Park, Y.-S. Compin, A. Lek, S. | Journal of the North American Benthological Society | 10.2307/1468273 |
| 70 | Book section | 2002 | River Pollution Diagnostic System (RPDS)—Computer-based analysis and visualisation for bio-monitoring data | O’Connor, M.A. Walley, W.J. | 10.2166/wst.2002.0045 | |
| 71 | Journal article | 2002 | Comparison of Artificial Neural Network (ANN) Model Development Methods for Prediction of Macroinvertebrate Communities in the Zwalm River Basin in Flanders, Belgium. | Dedecker, A.P. Goethals, P.L. De Pauw, N. | TheScientificWorldJournal | 10.1100/tsw.2002.79 |
| 72 | Journal article | 2002 | Perpest model, a case-based reasoning approach to predict ecological risks of pesticides | Van den Brink, P.J. Roelsma, J. van Nes, E.H. Scheffer, M. Brock, T.C.M. | Environmental Toxicology and Chemistry | 10.1002/etc.5620211132 |
| 73 | Journal article | 2001 | Patterning and short-term predictions of benthic macroinvertebrate community dynamics by using a recurrent artificial neural network | Chon, T.-S. Kwak, I.-S. Park, Y.-S. Kim, T.-H. Kim, Y. | Ecological Modelling | 10.1016/S0304-3800(01)00305-2 |
| 74 | Journal article | 2001 | Spatial analysis of stream invertebrates distribution in the Adour-Garonne drainage basin (France), using Kohonen self-organizing maps | Céréghino, R. Giraudel, J.L. Compin, A. | Ecological Modelling | 10.1016/S0304-3800(01)00304-0 |
| 75 | Journal article | 2001 | Bioindication of chemical and hydromorphological habitat characteristics with benthic macro-invertebrates based on Artificial Neural Networks | Schleiter, I.M. Obach, M. Borchardt, D. Werner, H. | Aquatic Ecology | 10.1023/A:1011433529239 |
| 76 | Journal article | 2001 | Stream acidification in South Germany—Chemical and biological assessment methods and trends | Braukmann, U. | Aquatic Ecology | 10.1023/A:1011452014258 |
| 77 | Journal article | 2001 | River restoration simulations by ecosystem models predicting aquatic macroinvertebrate communities based on J48 classification trees. | Goethals, P. Gasparyan, K. De Pauw, N. | Mededelingen (Rijksuniversiteit te Gent. Fakulteit van de Landbouwkundige en Toegepaste Biologische Wetenschappen) | hdl.handle.net/1854/LU-147855 |
| 78 | Journal article | 2000 | Application of an image analysis system to the determination of biomass (ash free dry weight) of pond macroinvertebrates | Bernardini, V. Solimini, A.G. Carchini, G. | Hydrobiologia | 10.1023/A:1004153703748 |
| 79 | Journal article | 2000 | The effect of fixed-count subsampling on macroinvertebrate biomonitoring in small streams | Doberstein, C.P. Karr, J.R. Conquest, L.L. | Freshwater Biology | 10.1046/j.1365-2427.2000.00575.x |
| 80 | Journal article | 1999 | The influence of data transformations on biological monitoring studies using macroinvertebrates | Thorne, R.S.J. Williams, W.P. Cao, Y. | Water Research | 10.1016/S0043-1354(98)00247-4 |
| 81 | Journal article | 1999 | Modelling water quality, bioindication and population dynamics in lotic ecosystems using neural networks | Schleiter, I.M. Borchardt, D. Wagner, R. Dapper, T. Schmidt, K.-D. Schmidt, H.-H. Werner, H. | Ecological Modelling | 10.1016/S0304-3800(99)00108-8 |
References
- Džeroski, S. Applications of symbolic machine learning to ecological modelling. Ecol. Model. 2001, 146, 263–273. [Google Scholar] [CrossRef]
- Roldán, G.P. Guía Para el Estudio de los Macroinvertebrados Acuáticos del Departamento de Antioquia; Universidad de Antioquia: Medellín, Colombia, 1988. [Google Scholar]
- Markert, B.A.; Breure, A.M.; Zechmeister, H.G. (Eds.) Bioindicators & Biomonitors: Principles, Concepts, and Applications; Elsevier: Amsterdam, The Netherlands; Boston, MA, USA, 2003. [Google Scholar]
- Domínguez, E.; Fernández, H.R. (Eds.) Macroinvertebrados Bentónicos Sudamericanos: Sistemática y Biología; Fundación Miguel Lillo: Tucumán, Argentina, 2009. [Google Scholar]
- Liu, Z.; Chen, M.; Li, Y.; Huang, Y.; Fan, B.; Lv, W.; Yu, P.; Wu, D.; Zhao, Y. Different effects of reclamation methods on macrobenthos community structure in the Yangtze Estuary, China. Mar. Pollut. Bull. 2018, 127, 429–436. [Google Scholar] [CrossRef] [PubMed]
- Lv, W.; Huang, Y.; Liu, Z.; Yang, Y.; Fan, B.; Zhao, Y. Application of macrobenthic diversity to estimate ecological health of artificial oyster reef in Yangtze Estuary, China. Mar. Pollut. Bull. 2016, 103, 137–143. [Google Scholar] [CrossRef] [PubMed]
- Milošević, D.; Milosavljević, A.; Predić, B.; Medeiros, A.S.; Savić-Zdravković, D.; Piperac, M.S.; Kostić, T.; Spasić, F.; Leese, F. Application of deep learning in aquatic bioassessment: Towards automated identification of non-biting midges. Sci. Total Environ. 2019, 711, 135160. [Google Scholar] [CrossRef]
- Zuarth, C.A.G.; Vallarino, A.; Jiménes, J.C.P.; Pfeng, A.M.L. Bioindicadores: Guardianes de Nuestro Futuro Ambiental; El Colegio de la Frontera Sur (ECOSUR), Instituto Nacional de Ecología y Cambio Climático (INECC): Primera, Mexico, 2014. [Google Scholar]
- Arje, J.; Tirronen, V.; Raitoharju, J.; Meissner, K.; Ainen, S.K. Can humans be replaced by computers in taxarecognition? Eur. Young Stat.Meet. 2017, 27–34. [Google Scholar]
- Medellín, R.A.; Víquez-R, L.R. Los Murciélagos Como Bioindicadores de la Perturbación Ambiental. Bioindicadores: Guardianes de Nuestro Futuro Ambiental; S y G: Mexico, 2014; pp. 521–542. [Google Scholar]
- Schleiter, I.M.; Borchardt, D.; Wagner, R.; Dapper, T.; Schmidt, K.-D.; Schmidt, H.-H.; Werner, H. Modelling water quality, bioindication and population dynamics in lotic ecosystems using neural networks. Ecol. Model. 1999, 120, 271–286. [Google Scholar] [CrossRef]
- Joutsijoki, H. Half-Against-Half Structure with SVM and k-NN Classifiers in Benthic Macroinvertebrate Image Classification. JCP 2014, 9, 454–462. [Google Scholar] [CrossRef]
- Tricco, A.C.; Lillie, E.; Zarin, W.; O’Brien, K.K.; Colquhoun, H.; Levac, D.; Moher, D.; Peters, M.D.J.; Horsley, T.; Weeks, L.; et al. PRISMA Extension for Scoping Reviews (PRISMA-ScR): Checklist and Explanation. Ann. Intern. Med. 2018, 169, 467–473. [Google Scholar] [CrossRef]
- Ruiz-Rosero, J.; Ramirez-Gonzalez, G.; Viveros-Delgado, J. Software survey: ScientoPy, a scientometric tool for topics trend analysis in scientific publications. Scientometrics 2019, 121, 1165–1188. [Google Scholar] [CrossRef]
- Petersen, K.; Feldt, R.; Mujtaba, S.; Mattsson, M. Systematic Mapping Studies in Software Engineering. In Proceedings of the 12th International Conference on Evaluation and Assessment in Software Engineering (EASE), Gothenburg, Sweden, 13–15 June 2008. [Google Scholar] [CrossRef]
- Kitchenham, B.; Brereton, O.P.; Budgen, D.; Turner, M.; Bailey, J.; Linkman, S. Systematic literature reviews in software engineering–A systematic literature review. Inf. Softw. Technol. 2009, 51, 7–15. [Google Scholar] [CrossRef]
- Moher, D.; Liberati, A.; Tetzlaff, J.; Altman, D.G.; PRISMA Group. Preferred reporting items for systematic reviews and meta-analyses: The PRISMA statement. PLoS Med. 2009, 6, e1000097. [Google Scholar] [CrossRef]
- Mitchell, T.M. Machine Learning; McGraw-Hill: New York, NY, USA, 1997. [Google Scholar]
- R Core Team. R: A Language and Environment for Statistical Computing; R Foundation for Statistical Computing: Vienna, Austria, 2022. [Google Scholar]
- Aria, M.; Cuccurullo, C. bibliometrix: An R-tool for comprehensive science mapping analysis. J. Informetr. 2017, 11, 959–975. [Google Scholar] [CrossRef]
- Mills, H.D. Mathematical Foundations for Structured Programming; The Harlan D. Mills Collection: Knoxville, TN, USA, 1972. [Google Scholar]
- Wright, J.F. (Ed.) Assessing the Biological Quality of Fresh Waters: RIVPACS And Other Techniques; Invited Contributions from am International Workshop Held in Oxford, UK an 16–18 September 1997; Freswater Biological Assoc: Ambleside, UK, 2000. [Google Scholar]
- Clarke, R.T.; Davy-Bowker, J.; Sandin, L.; Friberg, N.; Johnson, R.; Bis, B. Estimates and comparisons of the effects of sampling variation using ‘national’ macroinvertebrate sampling protocols on the precision of metrics used to assess ecological status. Hydrobiologia 2006, 566, 477–503. [Google Scholar] [CrossRef]
- Hering, D.; Moog, O.; Sandin, L.; Verdonschot, P.F. Overview and application of the AQEM assessment system. Hydrobiologia 2004, 516, 1–20. [Google Scholar] [CrossRef]
- Schmidt-Kloiber, A.; Nijboer, R.C. The effect of taxonomic resolution on the assessment of ecological water quality classes. Hydrobiologia 2004, 516, 269–283. [Google Scholar] [CrossRef]
- Furse, M.T.; Hering, D.; Brabec, K.; Buffagni, A.; Sandin, L.; Verdonschot, P.F.M. The ecological status of European rivers: Evaluation and intercalibration of assessment methods. Hydrobiologia 2006, 566, 1–2. [Google Scholar] [CrossRef]
- Clarke, R.T.; Hering, D. Errors and uncertainty in bioassessment methods–major results and conclusions from the STAR project and their application using STARBUGS. Hydrobiologia 2006, 566, 433–439. [Google Scholar] [CrossRef]
- O’Connor, M.; Walley, W. River Pollution Diagnostic System (RPDS)-computer-based analysis and visualisation for bio-monitoring data. Water Sci. Technol. 2002, 46, 17–23. [Google Scholar] [CrossRef]
- Braukmann, U. Stream acidification in South Germany–chemical and biological assessment methods and trends. Aquat. Ecol. 2001, 35, 207–232. [Google Scholar] [CrossRef]
- Thorne, R.S.; Williams, W.; Cao, Y. The influence of data transformations on biological monitoring studies using macroinvertebrates. Water Res. 1999, 33, 343–350. [Google Scholar] [CrossRef]
- Yuan, L.L. Assigning macroinvertebrate tolerance classifications using generalised additive models. Freshw. Biol. 2004, 49, 662–667. [Google Scholar] [CrossRef]
- Tirronen, V.; Caponio, A.; Haanpää, T.; Meissner, K. Multiple order gradient feature for Macroinvertebrate identification using support vector machines. In Adaptive and Natural Computing Algorithms; Kolehmainen, M., Toivanen, P., Beliczynski, B., Eds.; Springer: Berlin/Heidelberg, Germany, 2009; Volume 5495, pp. 489–497. [Google Scholar] [CrossRef]
- Kiranyaz, S.; Ince, T.; Pulkkinen, J.; Gabbouj, M.; Ärje, J.; Kärkkäinen, S.; Tirronen, V.; Juhola, M.; Turpeinen, T.; Meissner, K. Classification and retrieval on macroinvertebrate image databases. Comput. Biol. Med. 2011, 41, 463–472. [Google Scholar] [CrossRef] [PubMed]
- Joutsijoki, H.; Juhola, M. Automated Benthic Macroinvertebrate Identification with Decision Acyclic Graph Support Vector Machines; Presentado en Intelligent Systems and Control: Cambridge, UK, 2011. [Google Scholar] [CrossRef]
- Joutsijoki, H.; Juhola, M. DAGSVM vs. DAGKNN: An Experimental Case Study with Benthic Macroinvertebrate Dataset. In Machine Learning and Data Mining in Pattern Recognition; Perner, P., Ed.; Springer: Berlin/Heidelberg, Germany, 2012; Volume 7376, pp. 439–453. [Google Scholar] [CrossRef]
- Joutsijoki, H.; Juhola, M. Kernel selection in multi-class support vector machines and its consequence to the number of ties in majority voting method. Artif. Intell. Rev. 2011, 40, 213–230. [Google Scholar] [CrossRef]
- Joutsijoki, H.; Siermala, M.; Juhola, M. Directed acyclic graph support vector machines in classification of benthic macroinvertebrate samples. Artif. Intell. Rev. 2014, 44, 215–233. [Google Scholar] [CrossRef]
- Céréghino, R.; Park, Y.-S.; Compin, A.; Lek, S. Predicting the species richness of aquatic insects in streams using a limited number of environmental variables. J. N. Am. Benthol. Soc. 2003, 22, 442–456. [Google Scholar] [CrossRef]
- Paller, M.H.; Martin, F.D.; Wike, L.D.; Specht, W.L. Factors Influencing the Accuracy of a Macroinvertebrate Bioassessment Protocol in South Carolina Coastal Plain Streams. J. Freshw. Ecol. 2007, 22, 23–32. [Google Scholar] [CrossRef]
- Snyder, C.D.; Hitt, N.P.; Smith, D.R.; Daily, J.P. Evaluating bioassessment designs and decision thresholds using simulation techniques. In Application of Threshold Concepts in Natural Resource Decision Making; Springer: New York, NY, USA, 2014; Volume 9781489980410, pp. 157–197. [Google Scholar] [CrossRef]
- Callanan, M.; Baars, J.-R.; Kelly-Quinn, M. Critical influence of seasonal sampling on the ecological quality assessment of small headwater streams. Hydrobiologia 2008, 610, 245–2555. [Google Scholar] [CrossRef]
- Park, Y.-S.; Chon, T.-S.; Kwak, I.-S.; Lek, S. Hierarchical community classification and assessment of aquatic ecosystems using artificial neural networks. Sci. Total Environ. 2004, 327, 105–122. [Google Scholar] [CrossRef]
- Council of the European Communities. Directive 2000/60/EC of the European Parliament and of the Council of 23 October 2000 establishing a framework for Community action in the field of water policy. Off. J. Eur. Communities 2000, L327, 1–72. [Google Scholar]
- Di Dato, P.; Mancini, L.; Tancioni, L.; Scardi, M. A neural network approach to the prediction of benthic macroinvertebrate fauna composition in rivers. In Modelling Community Structure in Freshwater Ecosystems; Springer: Berlin, Germany, 2005; pp. 147–157. [Google Scholar] [CrossRef]
- Schleiter, I.M.; Obach, M.; Wagner, R.; Werner, H.; Schmidt, H.-H.; Borchardt, D. Modelling ecological interrelations in running water ecosystems with artificial neural networks. In Ecological Informatics; Recknagel, F., Ed.; Springer: Berlin/Heidelberg, Germany, 2006; pp. 169–186. [Google Scholar] [CrossRef]
- Kim, B.; Lee, S.-E.; Song, M.-Y.; Choi, J.-H.; Ahn, S.-M.; Lee, K.-S.; Cho, E.; Chon, T.-S.; Koh, S.-C. Implementation of artificial neural networks (ANNs) to analysis of inter-taxa communities of benthic microorganisms and macroinvertebrates in a polluted stream. Sci. Total Environ. 2008, 390, 262–274. [Google Scholar] [CrossRef]
- Rico, C.; Paredes, M.; Fernández, N. Modeling of the hierarchical structure of freshwater Macroinvertebrates using artificial neural networks. Acta Biológica Colomb. 2009, 14, 71–96. [Google Scholar]
- Carafa, R.; Faggiano, L.; Real, M.; Munné, A.; Ginebreda, A.; Guasch, H.; Flo, M.; Tirapu, L.; von der Ohe, P.C. Water toxicity assessment and spatial pollution patterns identification in a Mediterranean River Basin District. Tools for water management and risk analysis. Sci. Total Environ. 2011, 409, 4269–4279. [Google Scholar] [CrossRef]
- Pallottini, M.; Goretti, E.; Gaino, E.; Selvaggi, R.; Cappelletti, D.; Céréghino, R. Invertebrate diversity in relation to chemical pollution in an Umbrian stream system (Italy). Comptes Rendus. Biol. 2015, 338, 511–520. [Google Scholar] [CrossRef]
- Penczak, T.; Kruk, A.; Grzybkowska, M.; Dukowska, M. Patterning of impoundment impact on chironomid assemblages and their environment with use of the self-organizing map (SOM). Acta Oecologica 2006, 30, 312–321. [Google Scholar] [CrossRef]
- Li, T.; Xiang, R. Application of a self-organizing map and canonical correspondence analysis in modern benthic foraminiferal communities: A case study from the pearl river estuary, China. J. Foraminifer. Res. 2015, 45, 305–318. [Google Scholar] [CrossRef]
- Dedecker, A.P.; Goethals, P.L.; De Pauw, N. Comparison of Artificial Neural Network (ANN) Model Development Methods for Prediction of Macroinvertebrate Communities in the Zwalm River Basin in Flanders, Belgium. Sci. World J. 2002, 2, 96–104. [Google Scholar] [CrossRef][Green Version]
- Joutsijoki, H.; Meissner, K.; Gabbouj, M.; Kiranyaz, S.; Raitoharju, J.; Ärje, J.; Kärkkäinen, S.; Tirronen, V.; Turpeinen, T.; Juhola, M. Evaluating the performance of artificial neural networks for the classification of freshwater benthic macroinvertebrates. Ecol. Inform. 2014, 20, 1–12. [Google Scholar] [CrossRef]
- Joutsijoki, H.; Juhola, M. Comparing the one-vs-one and one-vs-all methods in benthic macroinvertebrate image classification. In Machine Learning and Data Mining in Pattern Recognition; Perner, P., Ed.; Springer: Berlin/Heidelberg, Germany, 2011; Volume 6871, pp. 399–413. [Google Scholar] [CrossRef]
- Joutsijoki, H. Half-against-half multi-class support vector machines in classification of benthic Macroinvertebrate images. In Proceedings of the 2012 International Conference on Computer & Information Science (ICCIS), Kuala Lumpur, Malaysia, 12–14 June 2012; pp. 414–419. [Google Scholar] [CrossRef]
- Joutsijoki, H. Half-against-half structure in classification of benthic macroinvertebrate images. In Proceedings of the 2013 35th Annual International Conference of the IEEE Engineering in Medicine and Biology Society (EMBC), Osaka, Japan, 3–7 July 2013; pp. 3646–3649. [Google Scholar] [CrossRef]
- Arje, J.; Karkkainen, S.; Meissner, K.; Turpeinen, T. Statistical classification and proportion estimation—An application to a macroinvertebrate image database. In Proceedings of the 2010 IEEE International Workshop on Machine Learning for Signal Processing, Kittila, Finland, 29 August 2010; pp. 373–378. [Google Scholar] [CrossRef]
- Ärje, J.; Kärkkäinen, S.; Turpeinen, T.; Meissner, K. Breaking the curse of dimensionality in quadratic discriminant analysis models with a novel variant of a Bayes classifier enhances automated taxa identification of freshwater macroinvertebrates: Automated identification of macroinvertebrates. Environmetrics 2013, 24, 248–259. [Google Scholar] [CrossRef]
- Ärje, J.; Kärkkäinen, S.; Meissner, K.; Iosifidis, A.; Ince, T.; Gabbouj, M.; Kiranyaz, S. The effect of automated taxa identification errors on biological indices. Expert Syst. Appl. 2017, 72, 108–120. [Google Scholar] [CrossRef]
- Marburg, A.; Bigham, K. Deep learning for benthic fauna identification. In Proceedings of the OCEANS 2016 MTS/IEEE Monterey, OCE 2016, Monterey, CA, USA, 19–23 September 2016. [Google Scholar] [CrossRef]
- Raitoharju, J.; Riabchenko, E.; Meissner, K. Data enrichment in fine-grained classification of aquatic Macroinvertebrates 2017. In Proceedings of the 2016 ICPR 2nd Workshop on Computer Vision for Analysis of Underwater Imagery (CVAUI), Cancun, Mexico, 4 December 2016; pp. 43–48. [Google Scholar] [CrossRef]
- Raitoharju, J.; Riabchenko, E.; Ahmad, I.; Iosifidis, A.; Gabbouj, M.; Kiranyaz, S.; Tirronen, V.; Ärje, J.; Kärkkäinen, S.; Meissner, K. Benchmark database for fine-grained image classification of benthic macroinvertebrates. Image Vis. Comput. 2018, 78, 73–83. [Google Scholar] [CrossRef]
- Ärje, J.; Raitoharju, J. Human experts vs. machines in taxa recognition. Signal Processing: Image Commun. 2019, 87, 115917. [Google Scholar] [CrossRef]
- Singh, R.; Mumbarekar, V. Neural network model approach for automated benthic animal identification. ICT Express 2021. [Google Scholar] [CrossRef]
- Riabchenko, E.; Meissner, K. Learned vs. engineered features for fine-grained classification of aquatic macroinvertebrates. In Proceedings of the 2016 23rd International Conference on Pattern Recognition (ICPR), Cancun, Mexico, 4–8 December 2016; pp. 2276–2281. [Google Scholar] [CrossRef]
- Lürig, M.D.; Donoughe, S.; Svensson, E.I.; Porto, A.; Tsuboi, M. Computer Vision, Machine Learning, and the Promise of Phenomics in Ecology and Evolutionary Biology. Front. Ecol. Evol. 2021, 9, 642774. [Google Scholar] [CrossRef]
- Olawoyin, R.; Nieto, A.; Grayson, R.L.; Hardisty, F.; Oyewole, S. Application of artificial neural network (ANN)–self-organizing map (SOM) for the categorization of water, soil and sediment quality in petrochemical regions. Expert Syst. Appl. 2013, 40, 3634–3648. [Google Scholar] [CrossRef]
- Song, M.-Y.; Hwang, H.-J.; Kwak, I.-S.; Ji, C.W.; Oh, Y.-N.; Youn, B.J.; Chon, T.-S. Self-organizing mapping of benthic macroinvertebrate communities implemented to community assessment and water quality evaluation. Ecol. Model. 2007, 203, 18–25. [Google Scholar] [CrossRef]
- D’Heygere, T.; Goethals, P.L.; De Pauw, N. Use of genetic algorithms to select input variables in decision tree models for the prediction of benthic macroinvertebrates. Ecol. Model. 2003, 160, 291–300. [Google Scholar] [CrossRef]
- D’Heygere, T.; Goethals, P.L.; De Pauw, N. Genetic algorithms for optimisation of predictive ecosystems models based on decision trees and neural networks. Ecol. Model. 2006, 195, 20–29. [Google Scholar] [CrossRef]
- Gobeyn, S.; Goethals, P.L.M. A variable length chromosome genetic algorithm approach to identify species distribution models useful for freshwater ecosystem management. IFIP Adv. Inf. Commun. Technol. 2017, 507, 208. [Google Scholar] [CrossRef]
- Goethals, P.; Gasparyan, K.; De Pauw, N. River restoration simulations by ecosystem models predicting aquatic macroinvertebrate communities based on J48 classification trees. Meded. Rijksuniv. Te Gent Fak. Van Landbouwkd. Toegep. Biol. Wet. 2001, 66, 213–217. [Google Scholar]
- Goethals, P.; Dedecker, A.; Gabriels, W.; de Pauw, N. Development and application of predictive river ecosystem models based on classification trees and artificial neural networks. In Ecological Informatics; Recknagel, F., Ed.; Springer: Berlin/Heidelberg, Germany, 2006; pp. 151–167. [Google Scholar] [CrossRef]
- Li, F.; Yan, Y.; Zhang, J.; Zhang, Q.; Niu, J. Taxonomic, functional, and phylogenetic beta diversity in the Inner Mongolia grassland. Glob. Ecol. Conserv. 2021, 28, e01634. [Google Scholar] [CrossRef]
- Raitoharju, J. FIN-Benthic. Finnish Environment Institute. 2021. Available online: http://urn.fi/urn:nbn:fi:csc-kata20170615164351941516 (accessed on 13 May 2022).
- Raitoharju, J. FIN-Benthic2. Jenni Raitoharju, Finland. June 2019. Available online: https://etsin.fairdata.fi/dataset/a11cdc26-b9d0-4af1-9285-803d65a696a3 (accessed on 13 May 2022).
- Bertin, E.; Marcelpoil, R.; Chassery, J.-M. Morphological algorithms based on Voronoi and Delaunay graphs: Microscopic and medical applications. In Proceedings of the Image Algebra and Morphological Image Processing III, San Diego, CA, USA, 1 June 1992; pp. 356–367. [Google Scholar] [CrossRef]
- van Tonder, G.; Ejima, Y. The patchwork engine: Image segmentation from shape symmetries. Neural Networks 2000, 13, 291–303. [Google Scholar] [CrossRef]
- Arbelaez, P.; Maire, M.; Fowlkes, C.; Malik, J. Contour Detection and Hierarchical Image Segmentation. IEEE Trans. Pattern Anal. Mach. Intell. 2011, 33, 898–916. [Google Scholar] [CrossRef] [PubMed]
- Angermueller, C.; Pärnamaa, T.; Parts, L.; Stegle, O. Deep learning for computational biology. Mol. Syst. Biol. 2016, 12, 878. [Google Scholar] [CrossRef] [PubMed]
- Doberstein, C.P.; Karr, J.R.; Conquest, L.L. The effect of fixed-count subsampling on macroinvertebrate biomonitoring in small streams. Freshw. Biol. 2000, 44, 355–371. [Google Scholar] [CrossRef]
- Schleiter, I.M.; Obach, M.; Borchardt, D.; Werner, H. Bioindication of chemical and hydromorphological habitat characteristics with benthic macro-invertebrates based on Artificial Neural Networks. Aquat. Ecol. 2001, 35, 147–158. [Google Scholar] [CrossRef]
- Céréghino, R.; Giraudel, J.; Compin, A. Spatial analysis of stream invertebrates distribution in the Adour-Garonne drainage basin (France), using Kohonen self organizing maps. Ecol. Model. 2001, 146, 167–180. [Google Scholar] [CrossRef]
- Dedecker, A.P.; Goethals, P.L.M.; D’Heygere, T.; Gevrey, M.; Lek, S.; De Pauw, N. Application Of Artificial Neural Network Models To Analyse The Relationships Between Gammarus pulex L. (Crustacea, Amphipoda) And River Characteristics. Environ. Monit. Assess. 2005, 111, 223–241. [Google Scholar] [CrossRef]
- Bernardini, V.; Solimini, A.G.; Carchini, G. Application of an image analysis system to the determination of biomass (ash free dry weight) of pond macroinvertebrates. Hydrobiologia 2000, 439, 179–182. [Google Scholar] [CrossRef]
- Kiranyaz, S.; Gabbouj, M.; Pulkkinen, J.; Ince, T.; Meissner, K. Network of evolutionary binary classifiers for classification and retrieval in macroinvertebrate database. In Proceedings of the 2010 IEEE International Conference on Image Processing, Hong Kong, China, 26–29 September 2010; pp. 2257–2260. [Google Scholar] [CrossRef]
- Joutsijoki, H.; Juhola, M. A comparison of classification methods in automated taxa identification of benthic macroinvertebrates. Int. J. Data Sci. 2017, 2, 273. [Google Scholar] [CrossRef]
- Ministry of Environment, Housing and Territorial Development. National Policy for the Integrated Management of the Water Resource. 2010. Available online: https://www.minambiente.gov.co/images/GestionIntegraldelRecursoHidrico/pdf/Presentaci%C3%B3n_Pol%C3%ADtica_Nacional_-_Gesti%C3%B3n_/libro_pol_nal_rec_hidrico.pdf (accessed on 22 August 2020).
- McAbendroth, L.; Ramsay, P.M.; Foggo, A.; Rundle, S.D.; Bilton, D.T. Does macrophyte fractal complexity drive invertebrate diversity, biomass and body size distributions? Oikos 2005, 111, 279–290. [Google Scholar] [CrossRef]
- Nahmani, J.; Capowiez, Y.; Lavelle, P. Effects of metal pollution on soil macroinvertebrate burrow systems. Biol. Fertil. Soils 2005, 42, 31–39. [Google Scholar] [CrossRef]
- Brink, P.J.V.D.; Roelsma, J.; van Nes, E.H.; Scheffer, M.; Brock, T.C.M. Perpest model, a case-based reasoning approach to predict ecological risks of pesticides. Environ. Toxicol. Chem. 2002, 21, 2500–2506. [Google Scholar] [CrossRef]
- Joutsijoki, H. An application of one-vs-one method in automated taxa identification of Macroinvertebrates. In Proceedings of the 2013 Fourth Global Congress on Intelligent Systems, Hong Kong, China, 13 December 2013; pp. 125–130. [Google Scholar] [CrossRef]
- Chon, T.-S.; Kwak, I.-S.; Park, Y.-S.; Kim, T.-H.; Kim, Y. Patterning and short-term predictions of benthic macroinvertebrate community dynamics by using a recurrent artificial neural network. Ecol. Model. 2001, 146, 181–193. [Google Scholar] [CrossRef]
- Bizzi, S.; Surridge, B.; Lerner, D.N. Analysing Biological, Chemical and Geomorphological Interactions in Rivers Using Structural Equation Modelling; University of Western: Crawley, Australia, 2009; pp. 1837–1843. [Google Scholar]
- Pinto, P.; Rosado, J.; Morais, M.; Antunes, I. Assessment Methodology for Southern Siliceous Basins in Portugal. In Integrated Assessment of Running Waters in Europe; Hering, D., Verdonschot, P.F.M., Moog, O., Sandin, L., Eds.; Springer: Dordrecht, The Netherlands, 2004; pp. 191–214. [Google Scholar] [CrossRef]
- Dedecker, A.P.; Goethals, P.L.; Gabriels, W.; De Pauw, N. Optimization of Artificial Neural Network (ANN) model design for prediction of macroinvertebrates in the Zwalm river basin (Flanders, Belgium). Ecol. Model. 2004, 174, 161–173. [Google Scholar] [CrossRef]
- Mouton, A.M.; Dedecker, A.P.; Lek, S.; Goethals, P.L.M. Selecting Variables for Habitat Suitability of Asellus (Crustacea, Isopoda) by Applying Input Variable Contribution Methods to Artificial Neural Network Models. Environ. Model. Assess. 2009, 15, 65–79. [Google Scholar] [CrossRef]
- Dedecker, A.P.; Goethals, P.L.M.; D’Heygere, T.; De Pauw, N. Development of an in-stream migration model for Gammarus pulex L. (Crustacea, Amphipoda) as a tool in river restoration management. Aquat. Ecol. 2005, 40, 249–261. [Google Scholar] [CrossRef]
- Zhang, M.; Muñoz-Mas, R.; Martínez-Capel, F.; Qu, X.; Zhang, H.; Peng, W.; Liu, X. Determining the macroinvertebrate community indicators and relevant environmental predictors of the Hun-Tai River Basin (Northeast China): A study based on community patterning. Sci. Total Environ. 2018, 634, 749–759. [Google Scholar] [CrossRef]
- Chen, Q.; Yang, Q.; Lin, Y. Development and application of a hybrid model to analyze spatial distribution of macroinvertebrates under flow regulation in the Lijiang River. Ecol. Inform. 2011, 6, 407–413. [Google Scholar] [CrossRef]
- Zhang, Y.; Leung, J.Y.; Zhang, Y.; Cai, Y.; Zhang, Z.; Li, K. Agricultural activities compromise ecosystem health and functioning of rivers: Insights from multivariate and multimetric analyses of macroinvertebrate assemblages. Environ. Pollut. 2021, 275, 116655. [Google Scholar] [CrossRef]
- Dou, Q.; Du, X.; Cong, Y.; Wang, L.; Zhao, C.; Song, D.; Liu, H.; Huo, T. Influence of environmental variables on macroinvertebrate community structure in Lianhuan Lake. Ecol. Evol. 2022, 12, e8553. [Google Scholar] [CrossRef]
- Goethals, P.L.M.; Dedecker, A.P.; Gabriels, W.; Lek, S.; De Pauw, N. Applications of artificial neural networks predicting macroinvertebrates in freshwaters. Aquat. Ecol. 2007, 41, 491–508. [Google Scholar] [CrossRef]
- Gutiérrez-Estrada, J.C.; Bilton, D.T. A heuristic approach to predicting water beetle diversity in temporary and fluctuating waters. Ecol. Model. 2010, 221, 1451–1462. [Google Scholar] [CrossRef]


| Search String | Database | % Duplicates Removed | |
|---|---|---|---|
| Scopus | Web of Science | ||
| ((“water” OR “water quality”) AND (“benthic macroinvertebrates” OR “macroinvertebrates” OR “benthic fauna”) AND (“freshwater” OR “river” OR “lake”) AND (“classification” OR “software” OR “feature extraction” OR “artificial intelligence” OR “pattern recognition” OR “artificial neural network”) AND NOT (“*fish*” OR “ocean*” OR “marine” OR “sea”)) | 286 | 202 | 28% |
| Description | Results |
|---|---|
| General | |
| Timespan | 1999–2022 |
| Documents | 81 |
| Document types | |
| Article | 62 |
| Book chapter | 9 |
| Conference paper | 10 |
| Citations | |
| Average citations per document | 41, 5 |
| Average citations per year per doc | 3, 54 |
| Authors | |
| Authors | 243 |
| Authors of single-authored documents | 5 |
| Authors of multi-authored documents | 263 |
| Method | Phase | Template | Data | Description | Research Question |
|---|---|---|---|---|---|
| Top-Down | 1 | General data | ID, title, authors, year, citations, keywords. | Data extracted from sources. | RQ-1: What purposes are pursued when applying computational technologies in bioindication tasks with FwM? RQ-2: What computer-assisted tools have been used in studies with FwM? RQ-3: What is the relationship between the application areas and the computational technologies used? |
| Specific data | Category application area, subcategory application area, computer technology. | Categories are given to each of the records according to the general review phase. | |||
| Bottom-Up | 2 | Specific data | Critical factors; strategies; algorithms/computing tools; datasets and gaps. | Relevant information is extracted during the complete reading phase of each document. | RQ-4: What general approach is to address FwM studies using computational technologies? |
| General data | Several articles, general strategies, a grouping of computational technologies, and datasets. | Generalization of information on a timeline (application area and computational technologies). |
Publisher’s Note: MDPI stays neutral with regard to jurisdictional claims in published maps and institutional affiliations. |
© 2022 by the authors. Licensee MDPI, Basel, Switzerland. This article is an open access article distributed under the terms and conditions of the Creative Commons Attribution (CC BY) license (https://creativecommons.org/licenses/by/4.0/).
Share and Cite
Cruz, L.D.; Lopez, D.M.; Vargas-Canas, R.; Figueroa, A.; Corrales, J.C. Computer-Assisted Bioidentification Using Freshwater Macroinvertebrates: A Scoping Review. Water 2022, 14, 3249. https://doi.org/10.3390/w14203249
Cruz LD, Lopez DM, Vargas-Canas R, Figueroa A, Corrales JC. Computer-Assisted Bioidentification Using Freshwater Macroinvertebrates: A Scoping Review. Water. 2022; 14(20):3249. https://doi.org/10.3390/w14203249
Chicago/Turabian StyleCruz, Lilian Dayana, Diego Mauricio Lopez, Rubiel Vargas-Canas, Apolinar Figueroa, and Juan Carlos Corrales. 2022. "Computer-Assisted Bioidentification Using Freshwater Macroinvertebrates: A Scoping Review" Water 14, no. 20: 3249. https://doi.org/10.3390/w14203249
APA StyleCruz, L. D., Lopez, D. M., Vargas-Canas, R., Figueroa, A., & Corrales, J. C. (2022). Computer-Assisted Bioidentification Using Freshwater Macroinvertebrates: A Scoping Review. Water, 14(20), 3249. https://doi.org/10.3390/w14203249