Article

Arsenic Accumulation and Biotransformation Affected by Nutrients (N and P) in Common Blooming-Forming Microcystis wesenbergii (Komárek) Komárek ex Komárek (Cyanobacteria)

1
School of Environmental and Chemical Engineering, Shanghai University, Shanghai 200444, China
2
State Key Laboratory of Environmental Criteria and Risk Assessment, Chinese Research Academy of Environmental Sciences, Beijing 100012, China
*
Author to whom correspondence should be addressed.
Water 2022, 14(2), 245; https://doi.org/10.3390/w14020245
Submission received: 13 December 2021 / Revised: 11 January 2022 / Accepted: 12 January 2022 / Published: 15 January 2022

Abstract

:
Arsenic accumulation and biotransformation in algae was mostly carried out in a medium that contained far higher nutrient concentrations than that in natural freshwaters. The obtained results might have limited environmental validity and result in a failure to describe authentic arsenic biogeochemical cycles in natural freshwater systems. To validate the assumption, arsenic accumulation, and biotransformation in common bloom forming Microcystis wesenbergii was performed under a high nutrient concentration in BG11 medium (N = 250 mg/L, P = 7.13 mg/L), and adjusted low nutrients that mimicked values in natural freshwaters (N = 1.5 mg/L, P = 0.3 mg/L). The growth rate and maximum M. wesenbergii cell density were much lower in the high nutrient set, but more inhibition was shown with increasing ambient iAs(V) concentrations both in the high and low nutrient sets. The proportion of intracellular contents in total arsenicals decreased with increasing iAs(V) concentrations in both high and low nutrient sets but increased with incubation time. Intracellular iAs(III) was not found in the high nutrient set, while it formed high concentrations that could be comparable to that of an extracellular level in the low nutrient set. M. wesenbergii could methylate arsenic, and a higher proportion of organoarsenicals was formed in the low nutrient set. Lower intracellular MMA(V) and DMA(V) concentrations were found in the high nutrient set; contrarily, they presented a higher concentration that could be comparable to the extracellular ones in the low nutrient set. The results demonstrated that different nutrient regimes could affect arsenic accumulation and biotransformation in M. wesenbergii, and low nutrient concentrations could inhibit the excretion of iAs(III), MMA(V) and DMA(V) out of cells. Further investigations should be based on natural freshwater systems to obtain an authentic arsenic accumulation and biotransformation in cyanobacteria.

Graphical Abstract

1. Introduction

Arsenic (As) is a toxic and ubiquitous metalloid element in the environment, ranking first on the US Environmental Protection Agency’s (EPA) Superfund list of hazardous substances [1]. It is introduced from geochemical sources as well as anthropogenic activities, such as arsenic mining, the burning of fossil fuels, and the use of pesticide and growth enhancers for animal husbandry [2]. The toxicity, solubility, mobility, and fate of arsenic in the environment are determined by its species [3]. The trivalent arsenicals are more toxic than pentavalent arsenic ones because they could bind to the thiol sets in proteins and then disable cells to regulate their intracellular redox state [4].
Arsenic concentrations in the ocean are relatively low at ~1–2 μg/L, while they are variable in freshwaters, ranging from <1 up to 5000 μg/L in hot springs [5]. Inorganic arsenate (iAs(V)) and arsenite (iAs(III)) are predominant forms in aquatic systems. Due to the geothermally introduced arsenic in the environment predating the origin of life, microorganisms have evolved and possess a series of detoxifying mechanisms, including the most common efflux systems, reversible oxidation and reduction between iAs(III) and iAs(V), and methylation of inorganic arsenic into organic species [6,7]. Microbes play a critical role in the arsenic biogeochemical cycle. Cyanobacteria are prokaryotic and photosynthetic planktons in aquatic systems and contribute 20–30% of the photosynthesis on Earth [8]. They usually form blooms in summer, especially under a synergistic trend of global warming and anthropologically aggregated eutrophication [9,10]. Some cyanobacterial species, such as Microcystis, Nostoc, Synechocystis, Spirulina, and Anabaena have been found to have one to a few arsenic detoxifying mechanisms [11,12,13,14]. The biomagnification of arsenic by algae and its consumers into the food chain poses a threat to human health, thus detailed information about the arsenic species and concentrations in these organisms and their regulators are of great importance [15].
The arsenic accumulation and biotransformation in cyanobacteria are affected by multiple factors. A decreased uptake of arsenic content was found with an increasing phosphate supply in an M. aeruginosa culture [16]. Arsenic accumulation was related to cyanobacterial species, iAs(V) reduction was inhibited in an Anabaena isolate [17], while iAs(III) oxidation was more effective in Synechocystis under the elevated phosphate concentrations [18]. Moreover, arsenic speciation was influenced by the phosphate concentrations; iAs(V), iAs(III), and dimethylarsenate (DMA(V)) were found in mediums containing 0 µM and 175 µM phosphate, whereas only iAs(V) and DMA(V) were shown in 1 µM and 10 µM phosphate medium [16].
A number of studies have investigated the factors that controlled arsenic accumulation and biotransformation in cyanobacteria, while they were almost performed in cultural media that contained far higher nutrient concentrations (mainly nitrogen and phosphorus) than that in natural freshwater bodies [2,3,11,12,19,20,21]. The obtained results might have limited environmental validity, and result in a failure to describe authentic biogeochemical cycles of arsenicals in natural freshwaters. We hypothesize that arsenic accumulation and biotransformation in cyanobacteria differ greatly under high and low nutrients concentrations. Furthermore, our second hypothesis is that arsenic accumulation and speciation in cyanobacteria are also influenced by the ambient arsenicals contents added in the medium. To test the hypothesis, a series of iAs(V) gradient concentrations were added to an M. wesenbergii culture, with the high and low nutrient values that mimic natural freshwater systems, to investigate and compare arsenic accumulation and biotransformation in cyanobacteria under different nutrient and arsenic concentrations.

2. Materials and Methods

2.1. Experiment Design

Unialgal M. wesenbergii FACHB 908 isolate (Figure S1) was obtained from Institute of Hydrobiology, Chinese Academy of Sciences, which was isolated from Dianchi Lake in Yunnan Province, China. No colonies were formed, and only single cells were found in the culture (Figure S1). The culture was maintained in BG11 medium [22] that contained 250 mg/L nitrogen (N) and 7.13 mg/L phosphorus (P) and was treated as the high nutrient set. Adjusted nutrients with N and P concentrations of 1.5 mg/L and 0.3 mg/L, respectively, that mimicked natural freshwater values, was treated as the low nutrient set. A series of sodium arsenate (Na3AsO4) gradient concentrations with 10, 100, 200, 500 µg/L iAs(V) were added to the high nutrient set; cultures showed fine growth within two weeks. Thus, elevated iAs(V) gradient concentrations of 50, 200, 500, 1000 µg/L were added to the low nutrient set. All M. wesenbergii cultures were put in 250-milliliter flasks containing 220 mL of medium, of which initial M. wesenbergii cell density was set at about 1 × 10⁵ cells/mL. Three replicates were made for each of the design set, and a final of 24 flasks were included in the experiment. In the high nutrient set, M. wesenbergii cells decreased after 14 days; an intensive interval of 2 days was sampled. In the low nutrient set, M. wesenbergii cells slightly decreased after 28 days; an increased interval of 7 days was sampled. The 36-milliliter cultures were sampled for each replicate at each time of M. wesenbergii cells counting, and arsenic speciation and quantification. All cultures were grown at 25 °C with light intensity of 64 µmol photons/m2/s provided by cool-white fluorescent lamps on a 12:12-h light:dark cycle. Cultures were shaken manually three times per day.

2.2. Cell Counting and Specific Growth Rate

The 1-milliliter culture was diluted 10- or 20-fold for M. wesenbergii cells counting. At least 50 random fields of view were scanned using 400× microscope (Eclipse 50i, Nikon, Tokyo, Japan). The specific growth rate (μ) was determined by the following equation: μ = ln(Nt2 − Nt1)/(t2 − t1), where Nt2 and Nt1 represent cell density on days t2 and t1, respectively.

2.3. Reagents and Standards

Standard arsenic compounds (iAs(V), iAs(III), monomethylarsenate (MMA(V)), and (DMA(V))) were obtained from National Institute of Metrology (Beijing, China) and kept at 4 °C. The potassium borohydride (KBH4) was from Fuchen Chemical Reagent Co. Ltd. (Tianjin, China). The other reagents used were all from Sinopharm Chemical Reagent Co. Ltd. (Beijing, China). All chemicals were of analytical reagent grade. Milli-Q water (18.2 MΩ.cm) was used for reagents preparation and arsenic analysis (Millipore Corporation, Billerica, MA, USA). All glassware and plastic used for the experiments were all rinsed with Milli-Q water after being soaked in 10% HNO3 for 12 h.

2.4. Arsenic Speciation and Concentration

Four arsenic species, iAs(V), iAs(III), MMA(V), and DMA(V), were determined in the study. An aliquot of 35 mL of culture was used for intracellular arsenic speciation and concentrations. After centrifugation at 4000 rpm for 10 min, 10 mL of supernatant was filtered using syringe filters (0.2-micrometer Nylon membrane) (VWR International, West Chester, PA, USA), and was injected directly for determination of extracellular arsenic speciation and concentrations. The algae pellet was washed three times with cold MES buffer prepared for intracellular arsenic speciation and concentrations [11]. The algae pellet was decanted into Teflon vessels, then added to 10 mL of deionized water. The extraction process was heated to 90 °C and kept for 5 min using a microwave oven, then the extracts were centrifuged at 14,000 r/min for 10 min [23]. The supernatant was decanted into a clean flask, and residue particles were again added to 10 mL of deionized water for heating. These steps were repeated three times to extract total arsenicals to the greatest extent. The 30-milliliter supernatants were mixed and diluted to a final volume of 50 mL with deionized water for intracellular arsenic determination.
Arsenic determination in the extracted solution was carried out using an atomic fluorescence spectrometry (AFS) atomic detector (P S Analytical Ltd., Kent, UK). Instrumental couplings of the high-performance liquid chromatography (HPLC), an on-line ultraviolet (UV) photooxidation step (Shimadzu, Kyoto, Japan), and hydride generation (HG) (P S Analytical Ltd., Kent, UK) were used for arsenic species identification and quantification. AFS provided comparative limits of detection with the inductively coupled plasma-mass spectrometry (ICP-MS) atomic detector, and detection limits below 0.1 ng/mL were both obtained using HPLC-(VC)-HG-AFS and HPLC-HG-ICP-MS [24]. The instrumental scheme of coupled HPLC-HG-AFS was shown in Figure S2. The experimental condition in Roldán et al. [25] was adopted and shown in Table S1. Chromatographic separation of standards (As(III), As(V), MMA(V), DMA(V)) and extracted sample solutions were carried out by injecting solutions containing arsenicals onto the column. The standards and samples were all filtered through a 0.22-micrometer membrane filter before injection. All samples used for arsenic analysis were kept at 4 °C prior to analysis.

2.5. Statistical Analysis

Arsenic concentrations and their temporal variations with incubation time were estimated to compare significant differences under different iAs(V) treatments, with the univariate generalized linear model implemented by IBM SPSS Statistics 20 (SPSS Inc., IBM Co., New York, NY, USA).

3. Results

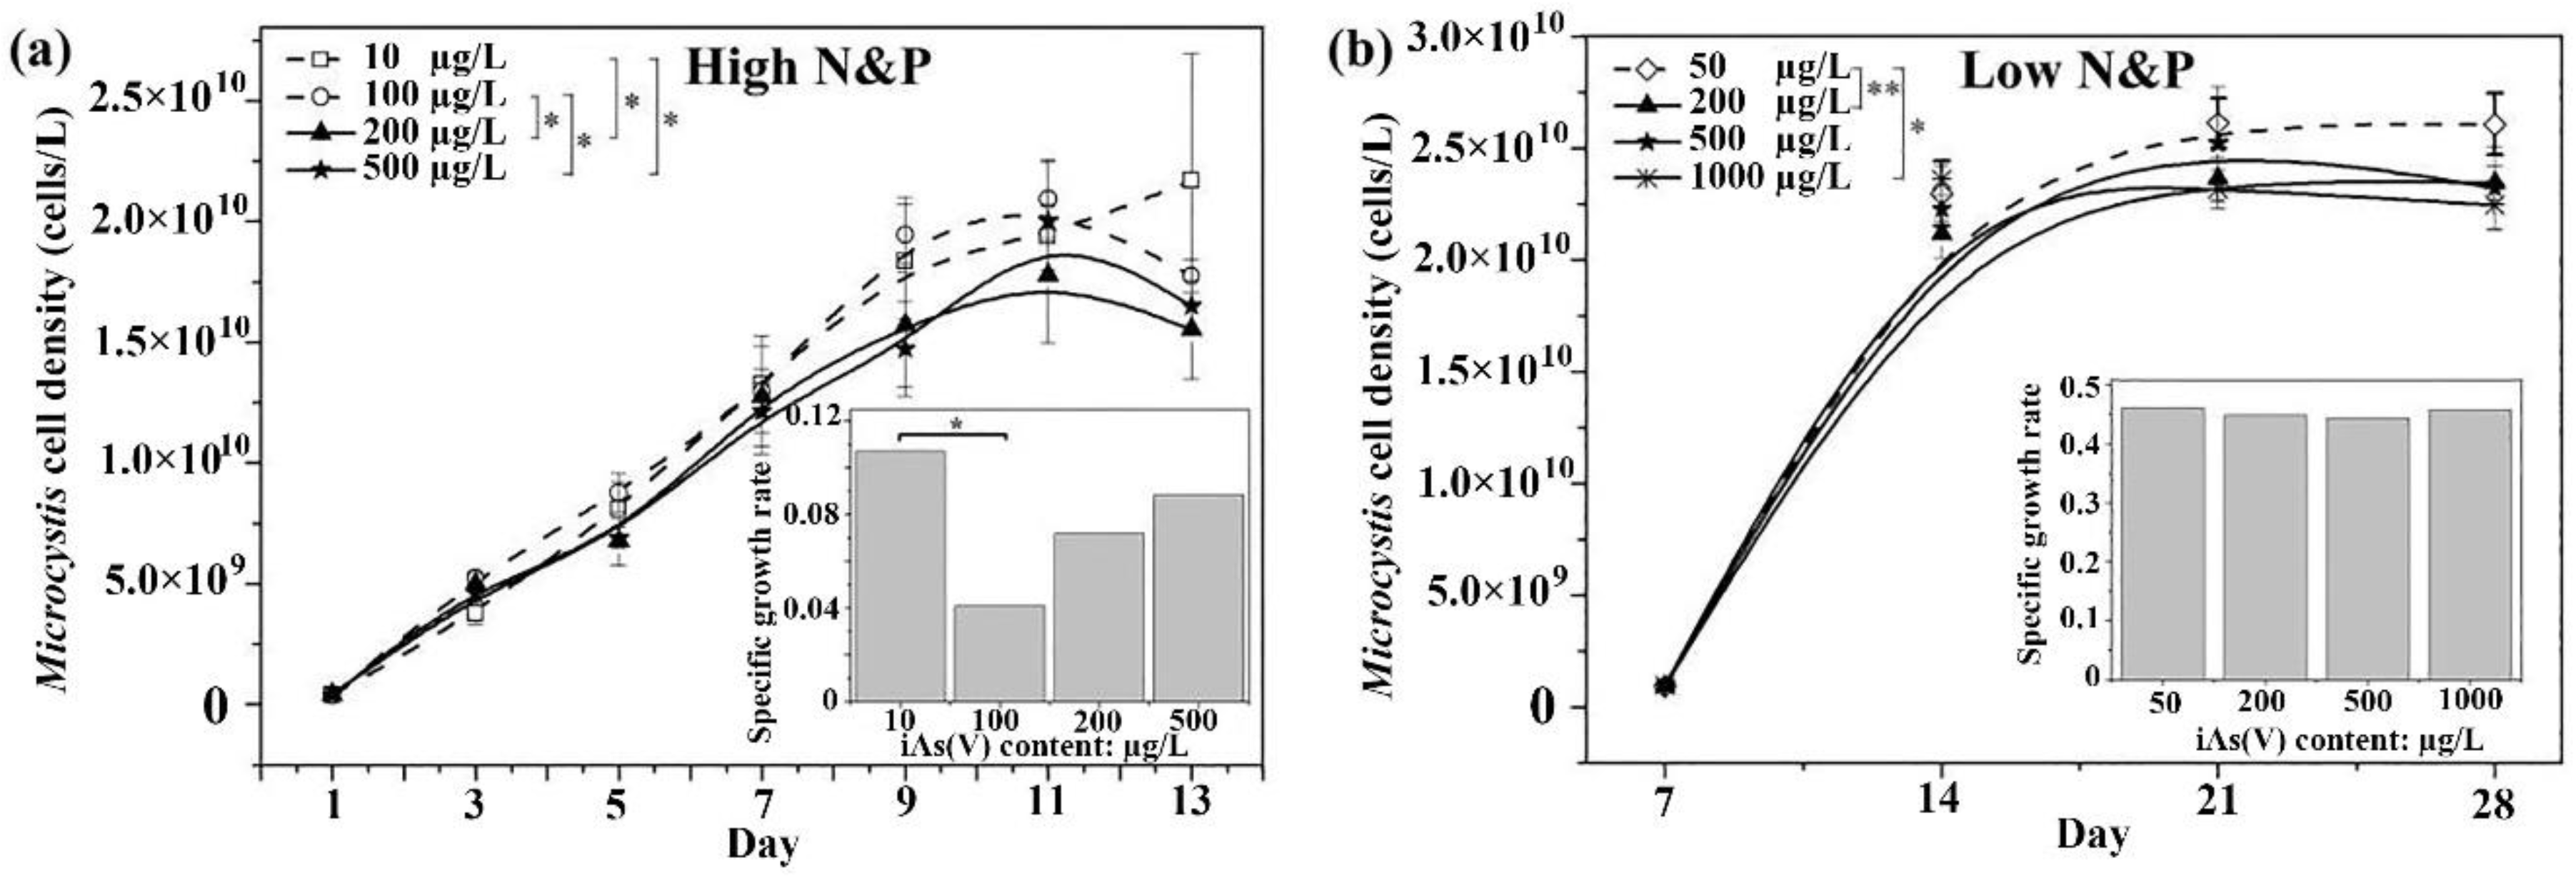
3.1. Effect of Arsenate and Nutrients on Growth

M. wesenbergii exhibited finer growth in the low nutrient set than that in the high nutrient set revealed by Microcystis cell density and growth rate, where the growth rates were greater than 0.4 in all iAs(V) concentrations in the low nutrient set, but they were all lower than 0.1 in the high nutrient set (Figure 1). In the low nutrient set, M. wesenbergii showed a significant decrease in cell numbers with an incubation time between the 50 and 200 or 1000 µg/L iAs(V) groups (Figure 1b). The inhibition was more obvious in the high nutrient set, where an evident decrease in M. wesenbergii cells was shown between the 10 and 100 or 500 µg/L iAs(V) groups, and the 100 and 200 or 500 µg/L iAs(V) groups.

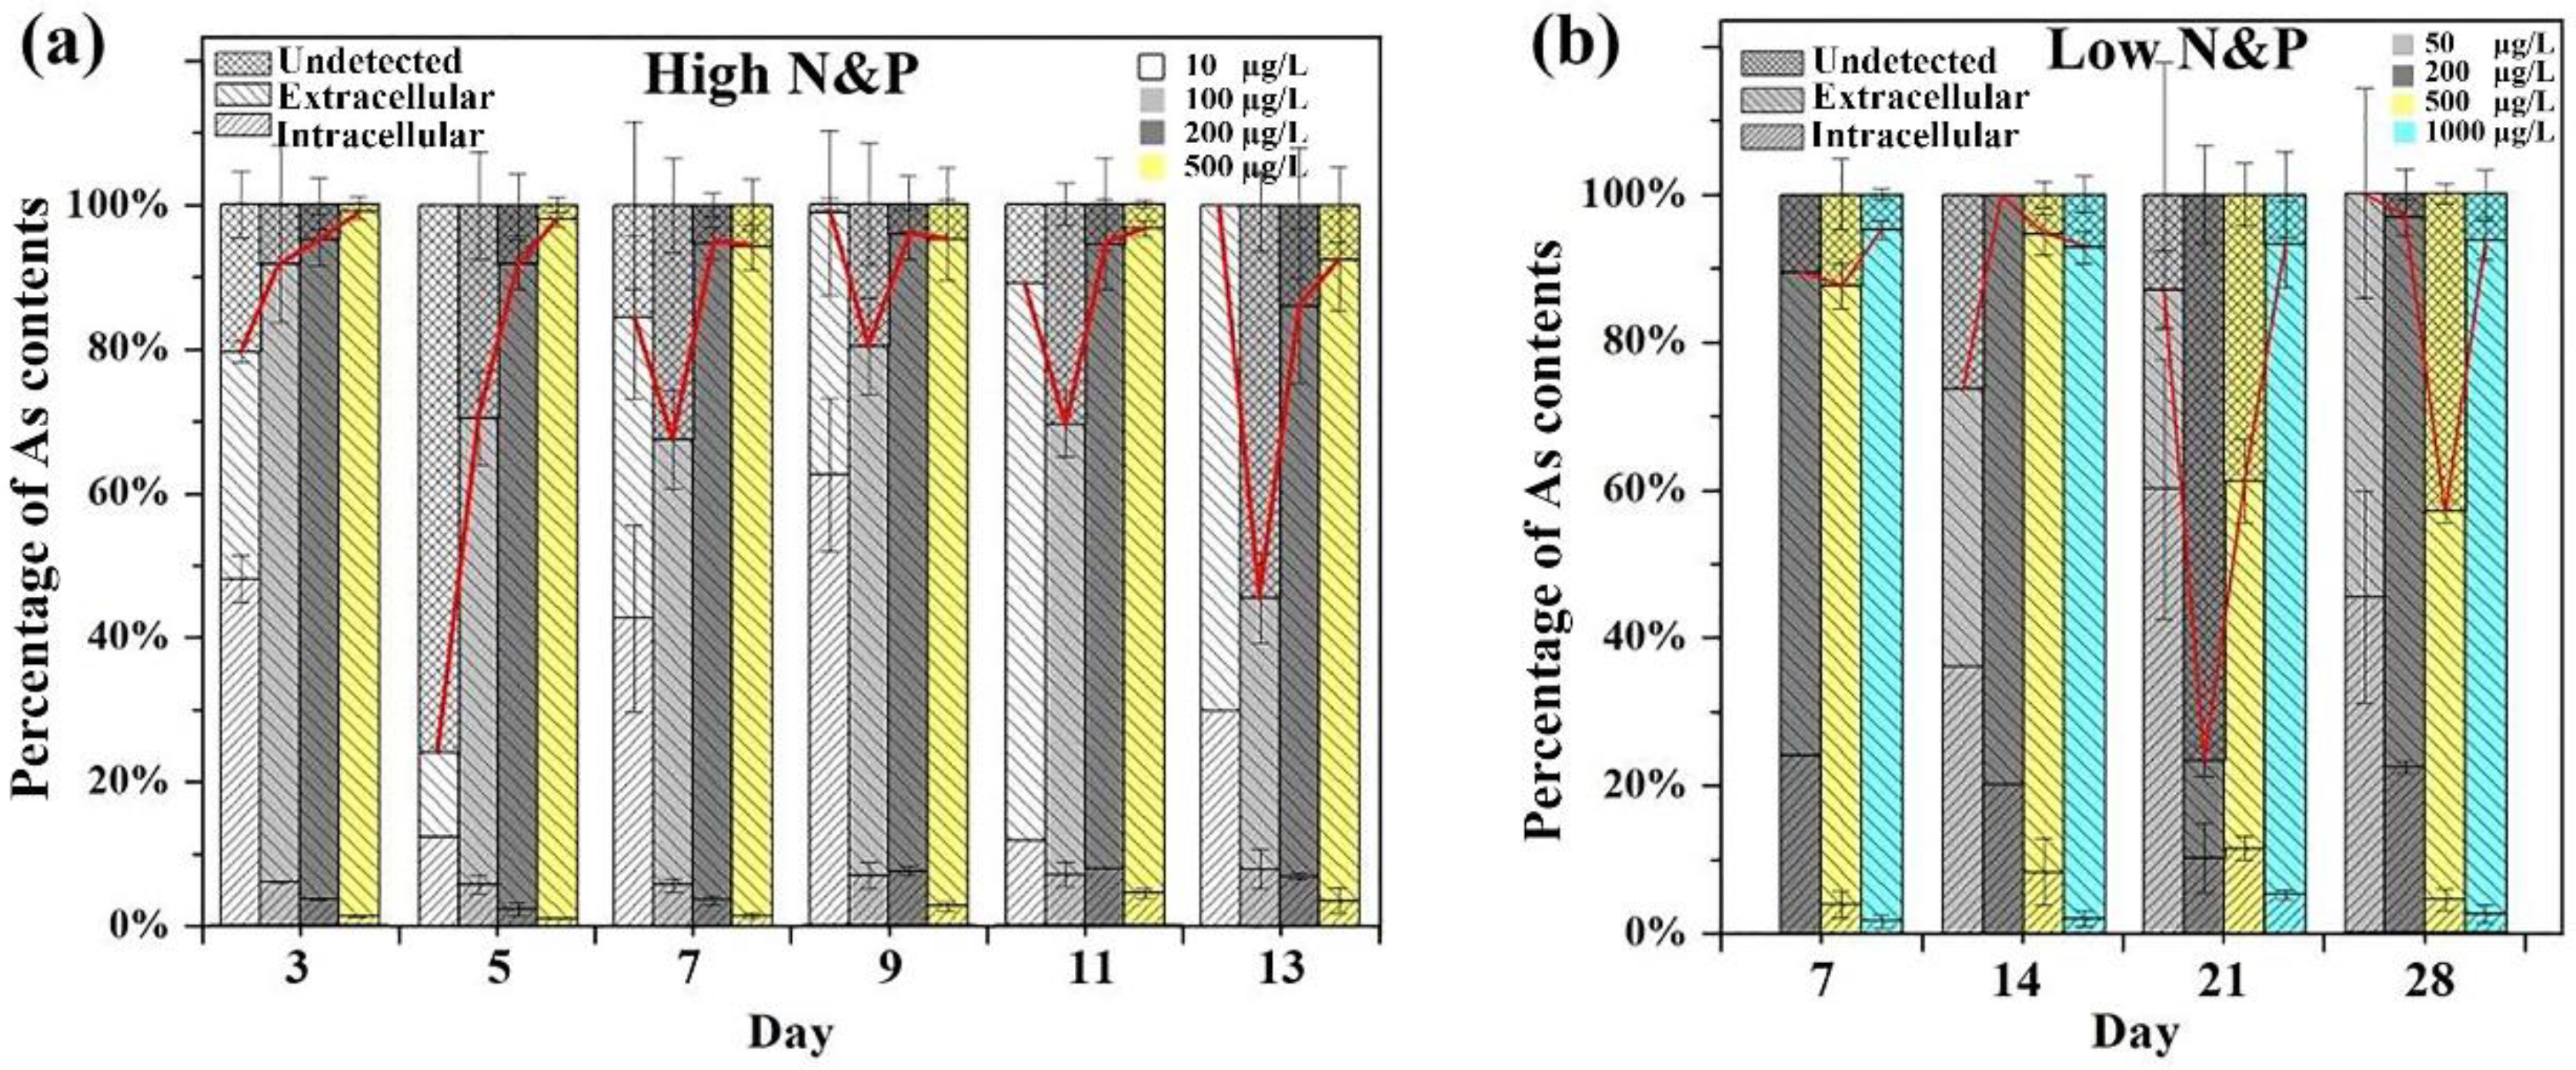
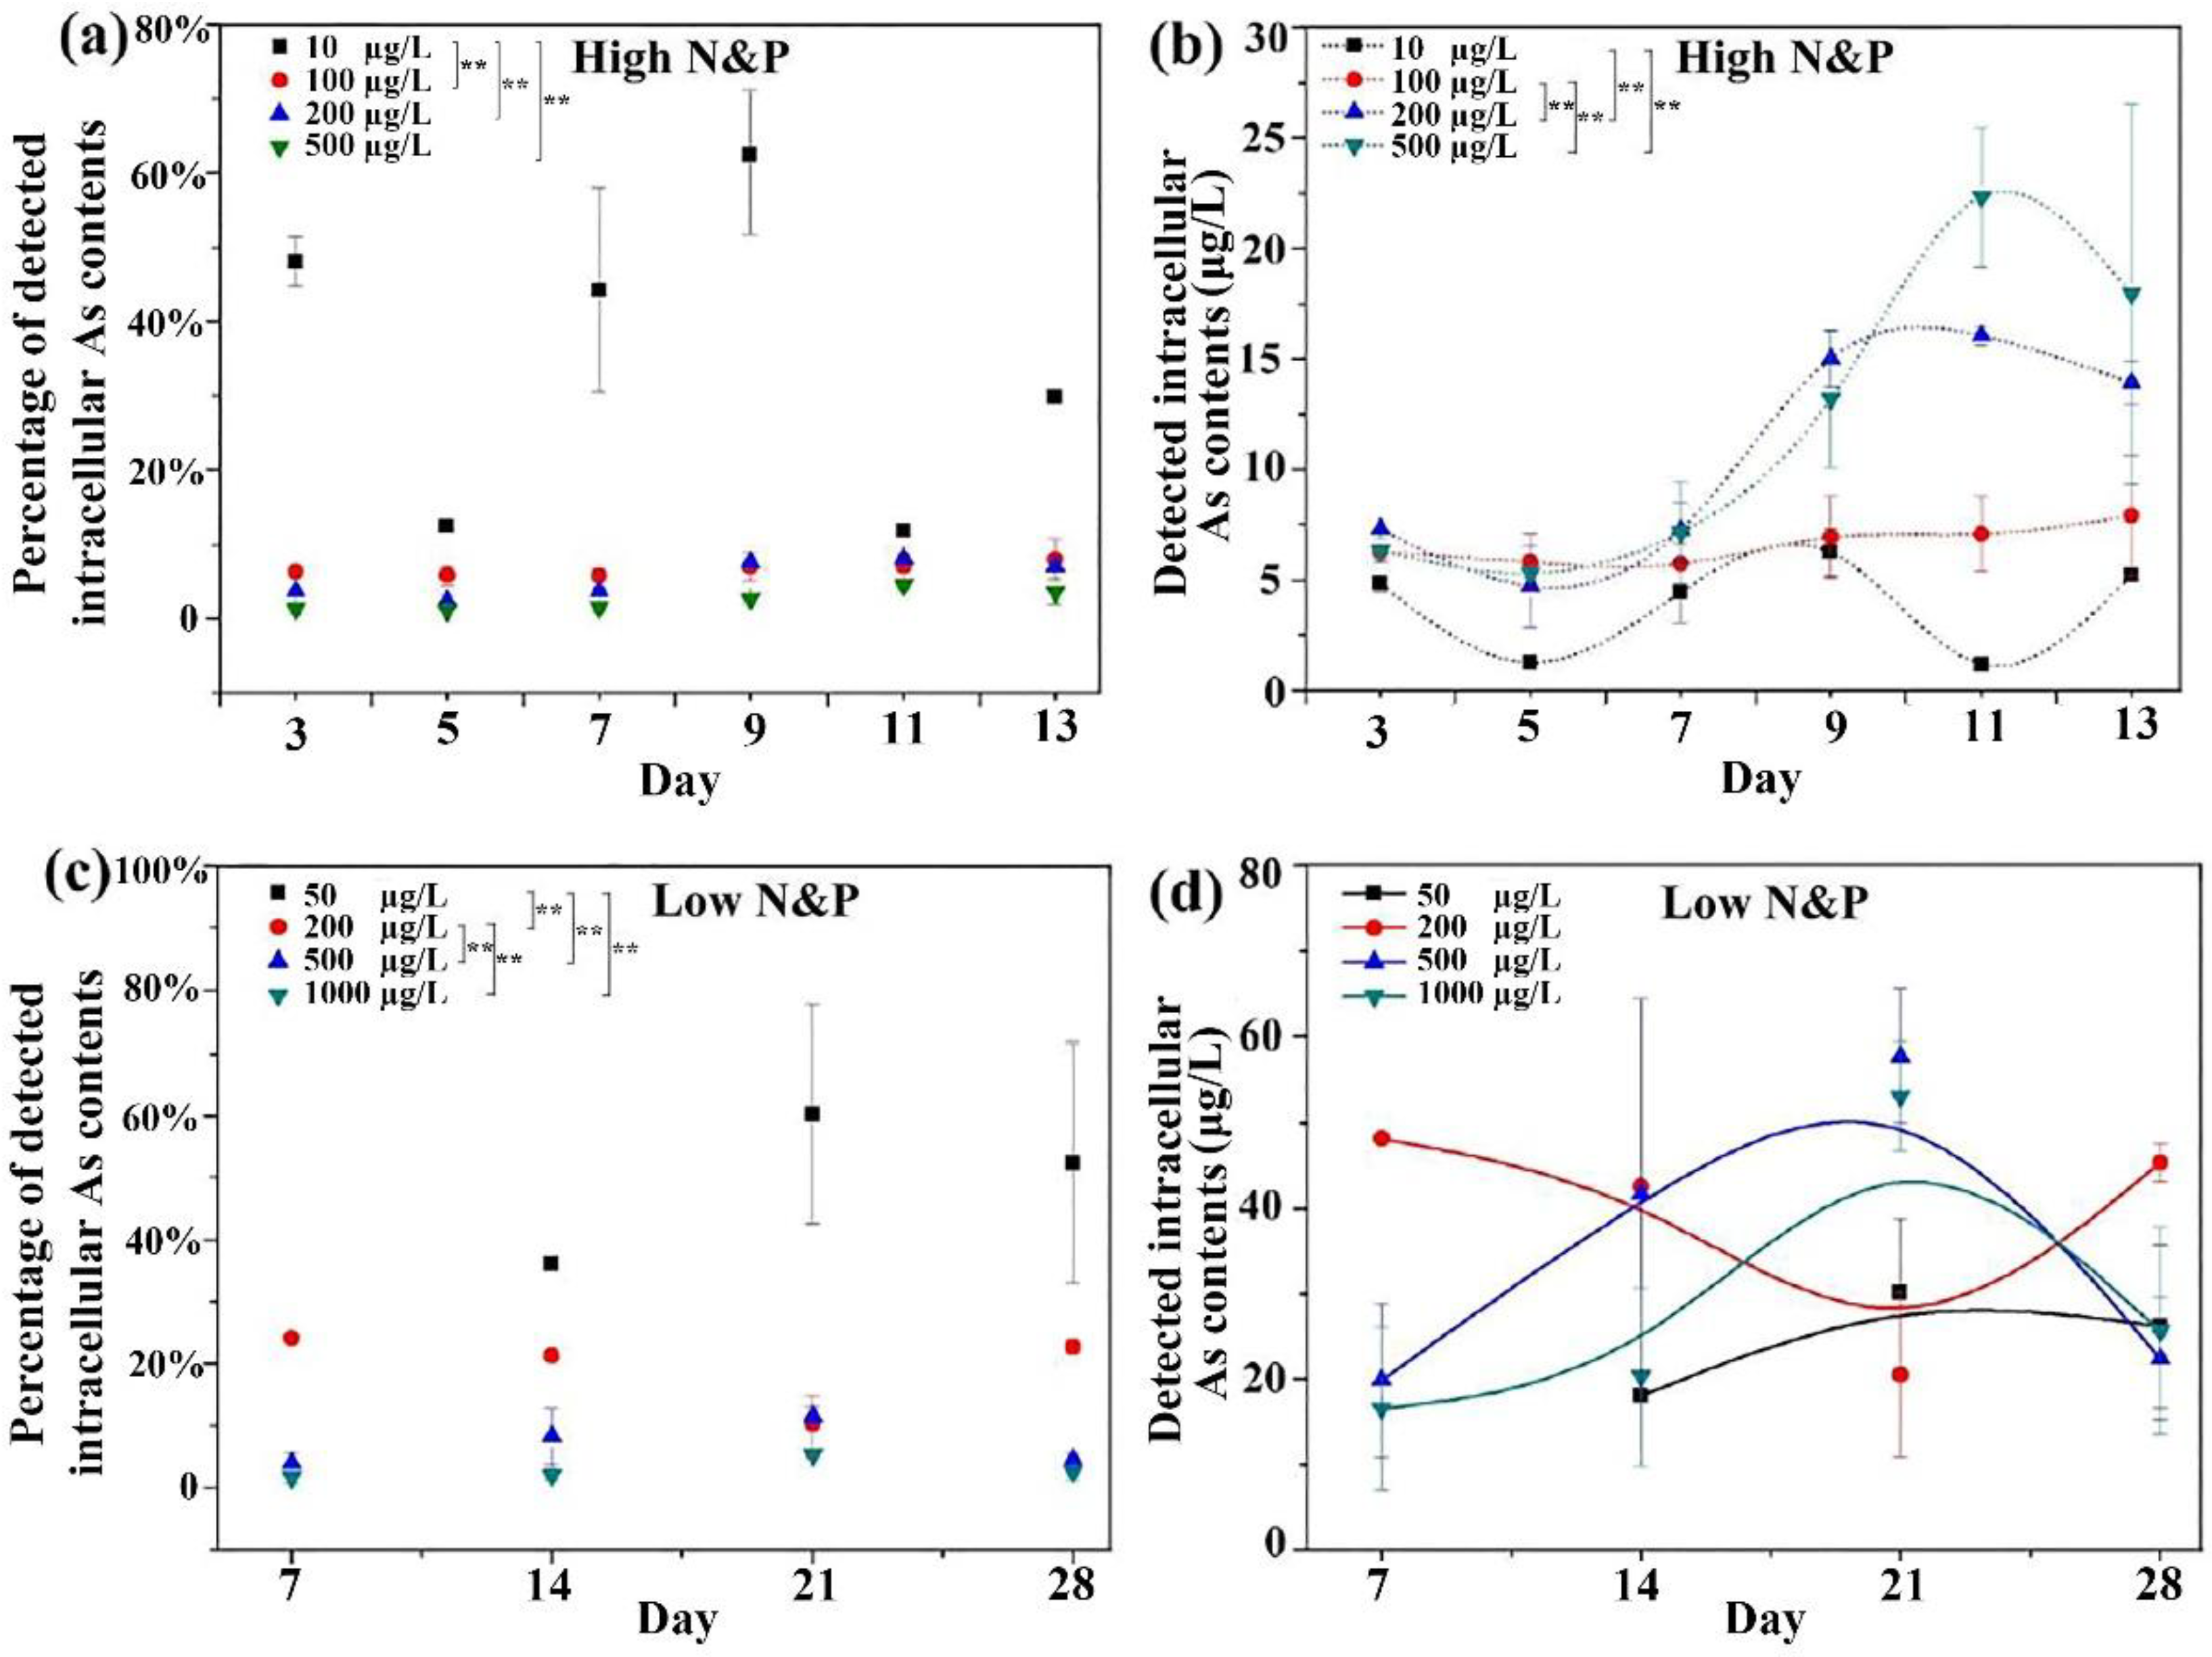
3.2. Intracellular and Extracellular Arsenic Concentrations.

Two inorganic (iAs(V) and iAs(III)) and two organic (MMA(V) and DMA(V)) arsenic species were determined in the study. The chromatographic separation of standards using HPLC-HG-AFS is shown in Figure 2.
In the high nutrient set, the percentage of the detected arsenic concentration in total arsenicals increased with rising iAs(V) concentrations with the exception of the 10 µg/L group. The arsenicals contributed over 70% to total arsenic concentrations in all the iAs(V) groups during the incubation time, except 45% was found in the 100 µg/L group on day 13 and 24% was found in the 10 µg/L group on day five (Figure 3a). In the low nutrient set, a similar increase pattern of detected arsenic concentration was found with rising iAs(V) concentrations, while an abnormal observation was displayed in the 200 µg/L group on day 28. The arsenicals contributed over a 70% proportion to the total arsenic concentrations in all the iAs(V) groups during the incubation time, except 61 and 57% in the 500 µg/L group on days 21 and 28, respectively, and 24% in the 200 µg/L group on day 21 (Figure 3b).
A decreased proportion of accumulated intracellular arsenicals exposed with a gradient of increasing iAs(V) concentrations were found during the incubation time both in the high and low nutrient sets (Figure 4a,c). There was an evident distinction of the proportion of intracellular arsenicals between the 10 and 100 or 200 or 500 μg/L groups in the high nutrient set (Figure 4a), while the proportion of intracellular arsenicals significantly differed in any comparison among the iAs(V) groups with the exception of that between the 500 and 1000 µg/L groups in the low nutrient set (Figure 4c).
In the high nutrient set, a constant increase in the intracellular arsenicals accumulated in M. wesenbergii with the incubation time in the 100 µg/L iAs(V) group, whereas in the 200 and 500 µg/L groups, the increase sustained on day 11 then declined until day 13. In the 10 µg/L group, the accumulation in M. wesenbergii exhibited a waveform variation (Figure 4b). In the low nutrient set, the accumulation in M. wesenbergii continued to increase until day 21 then decreased until day 28 in the 50, 500, and 1000 μg/L iAs(V) groups, while in the 200 μg/L group, the accumulation in cells exhibited a reverse pattern (Figure 4d).

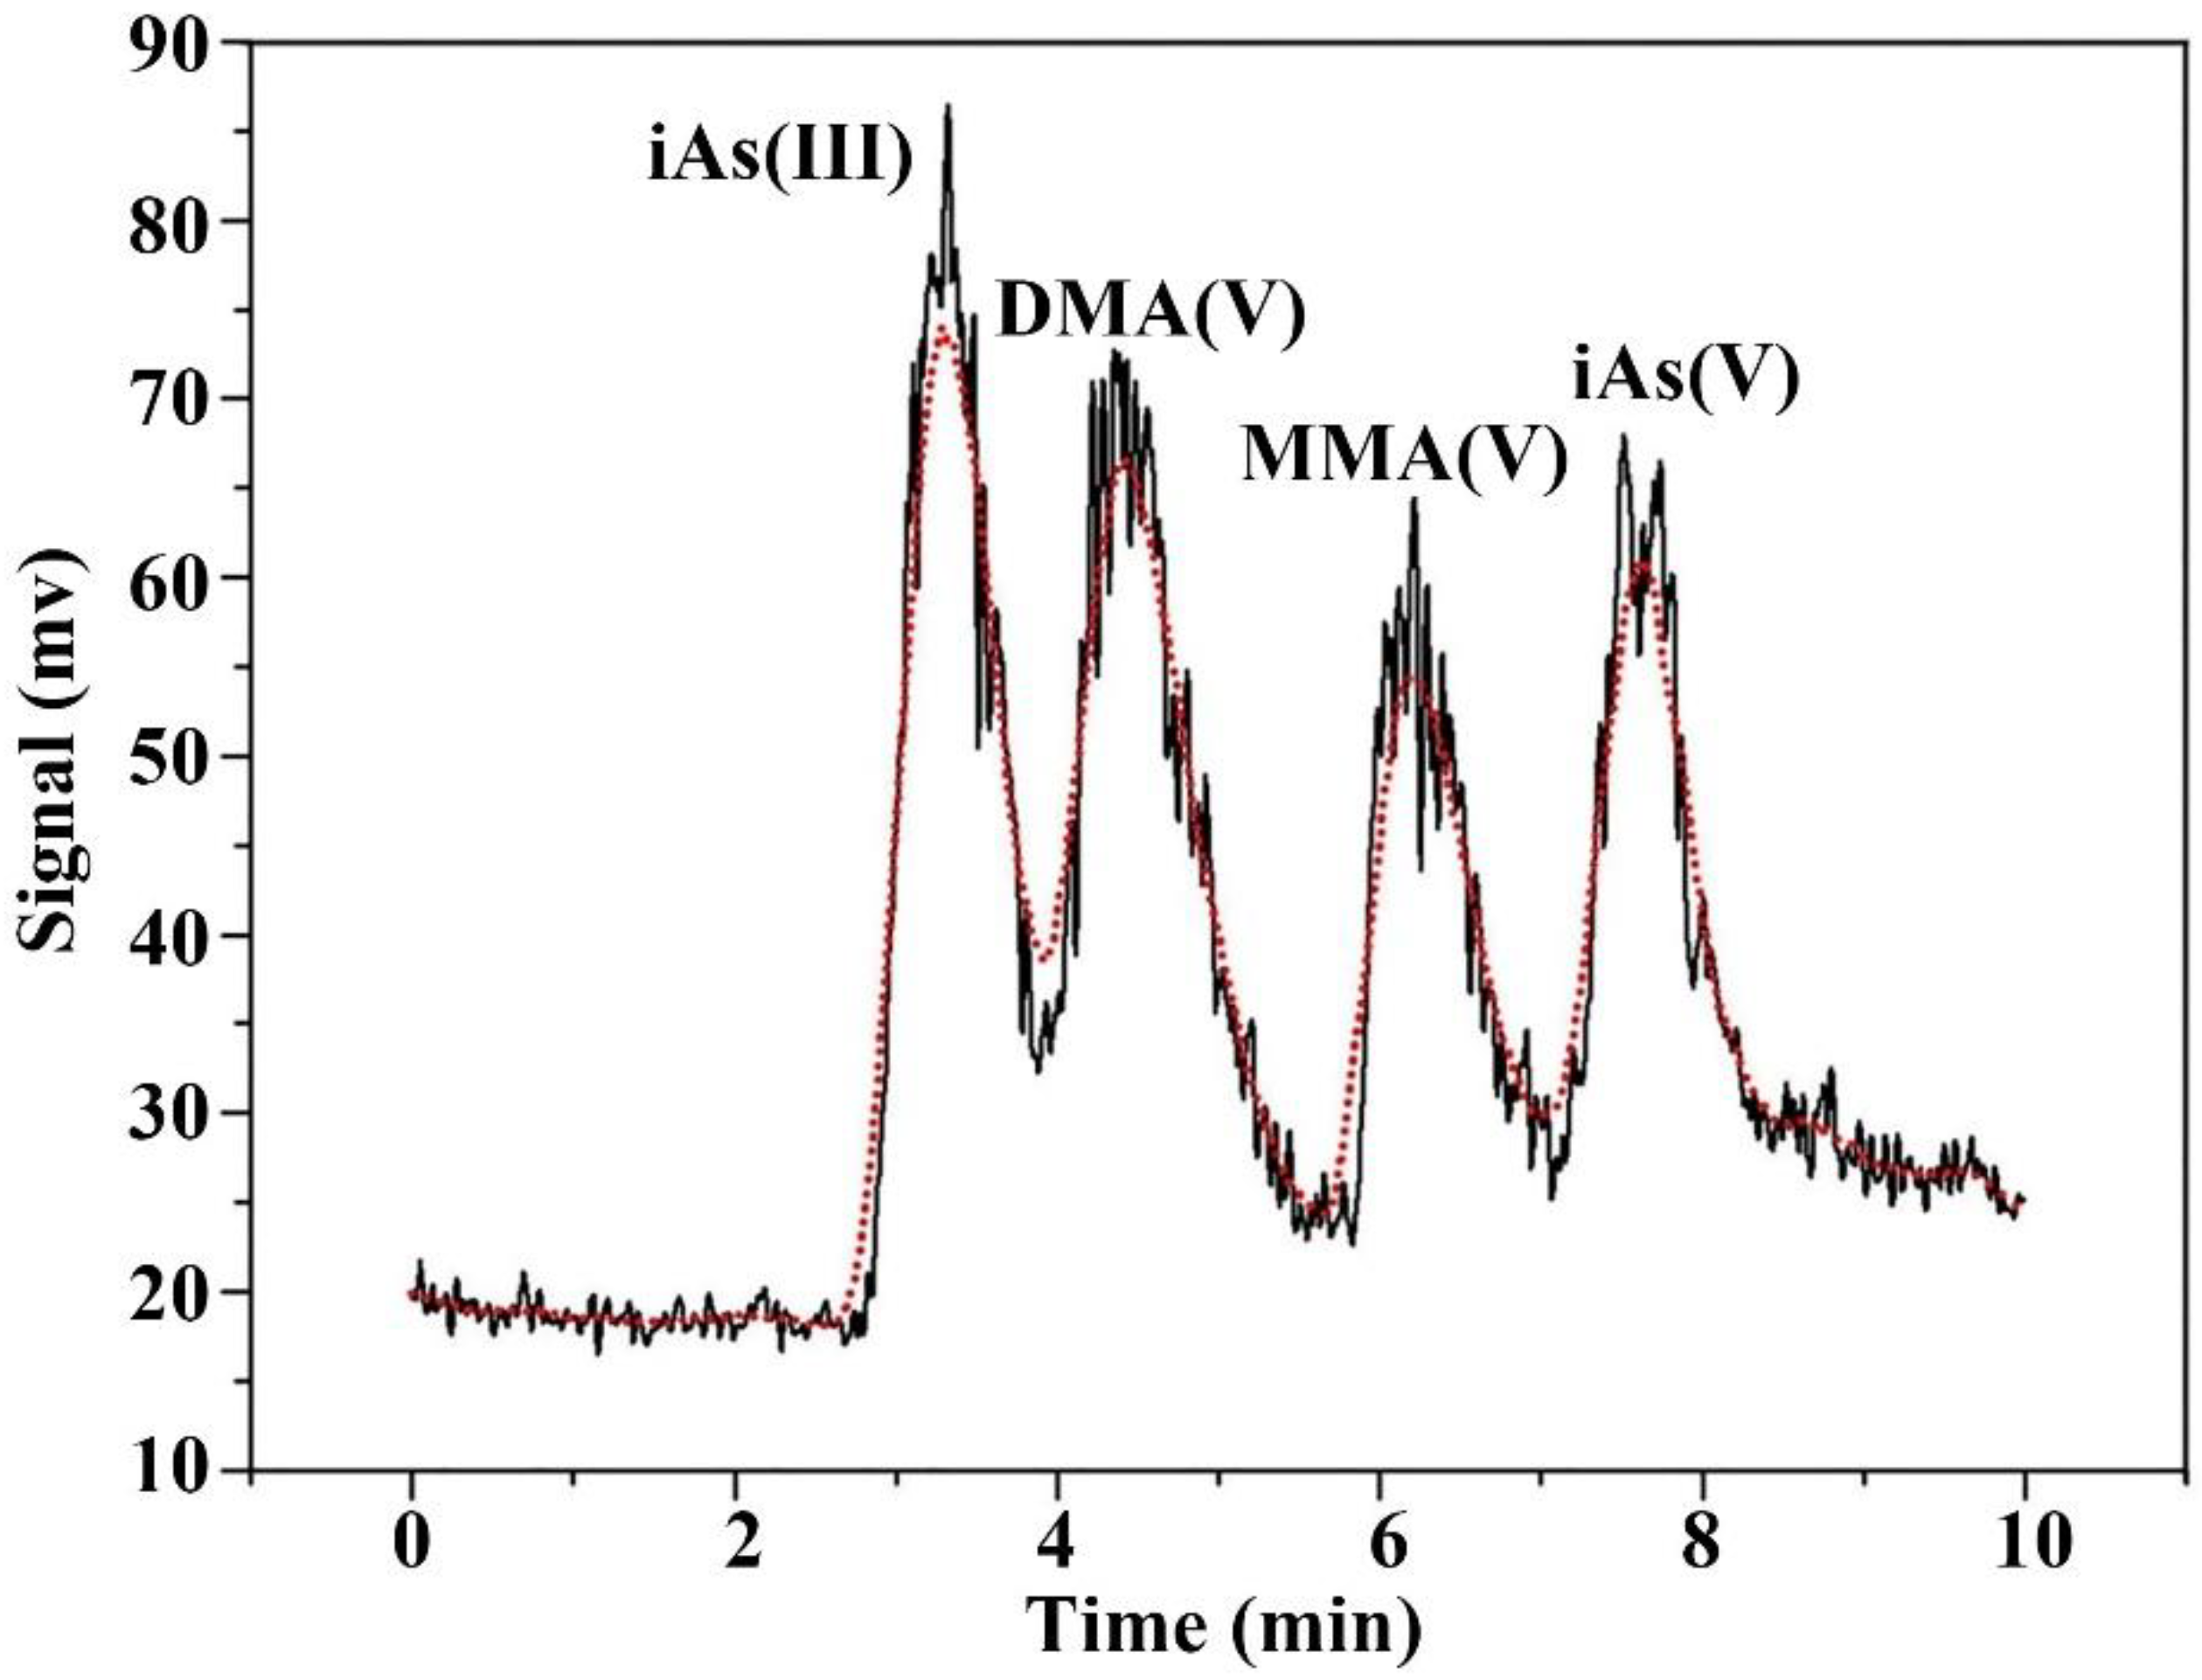
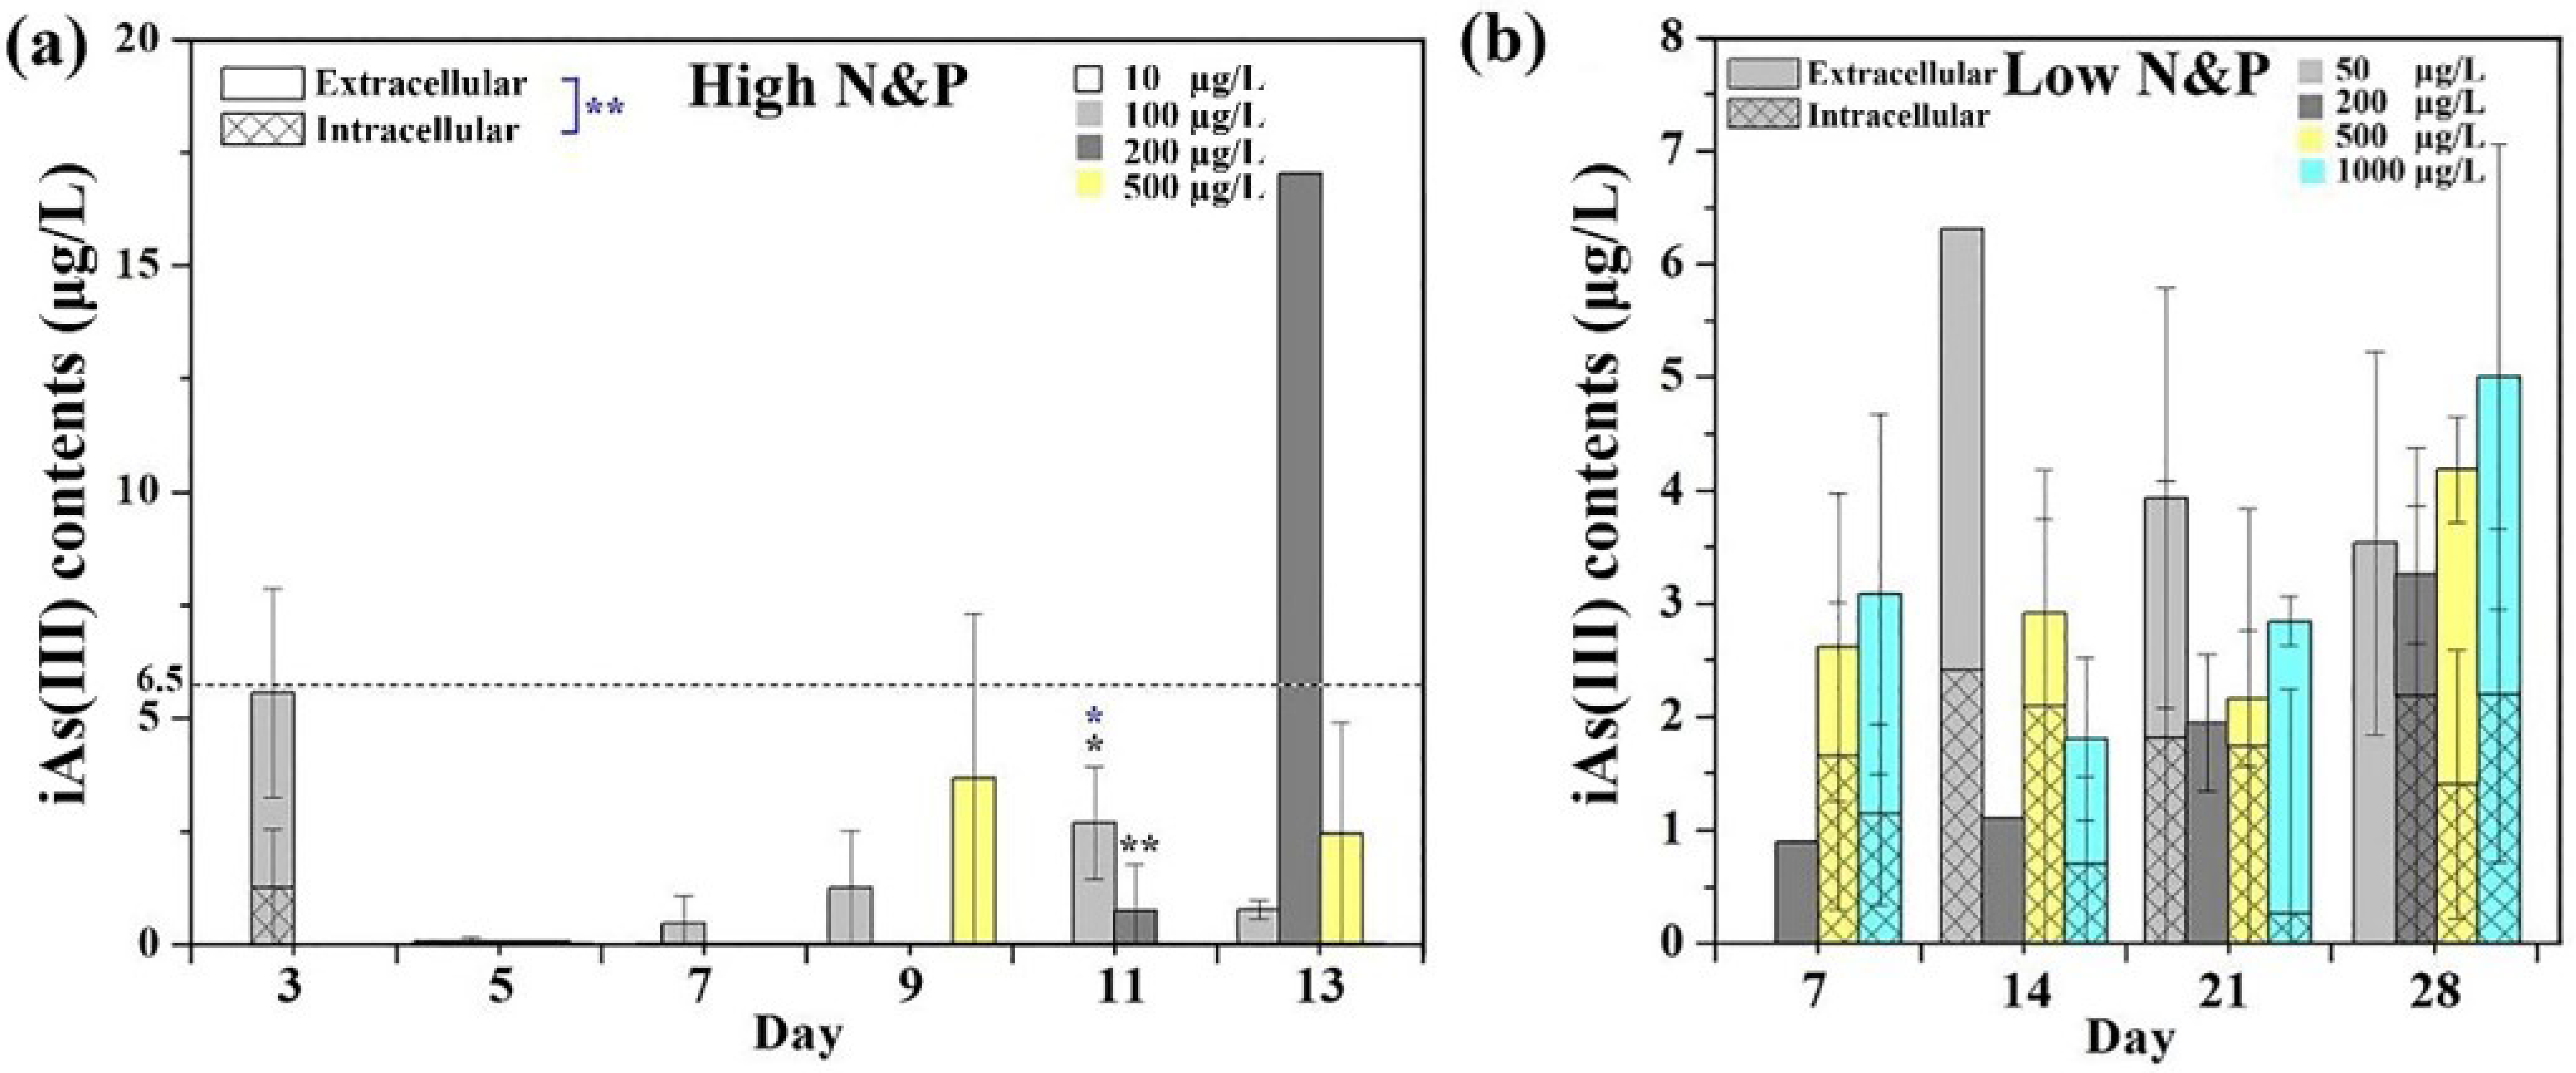
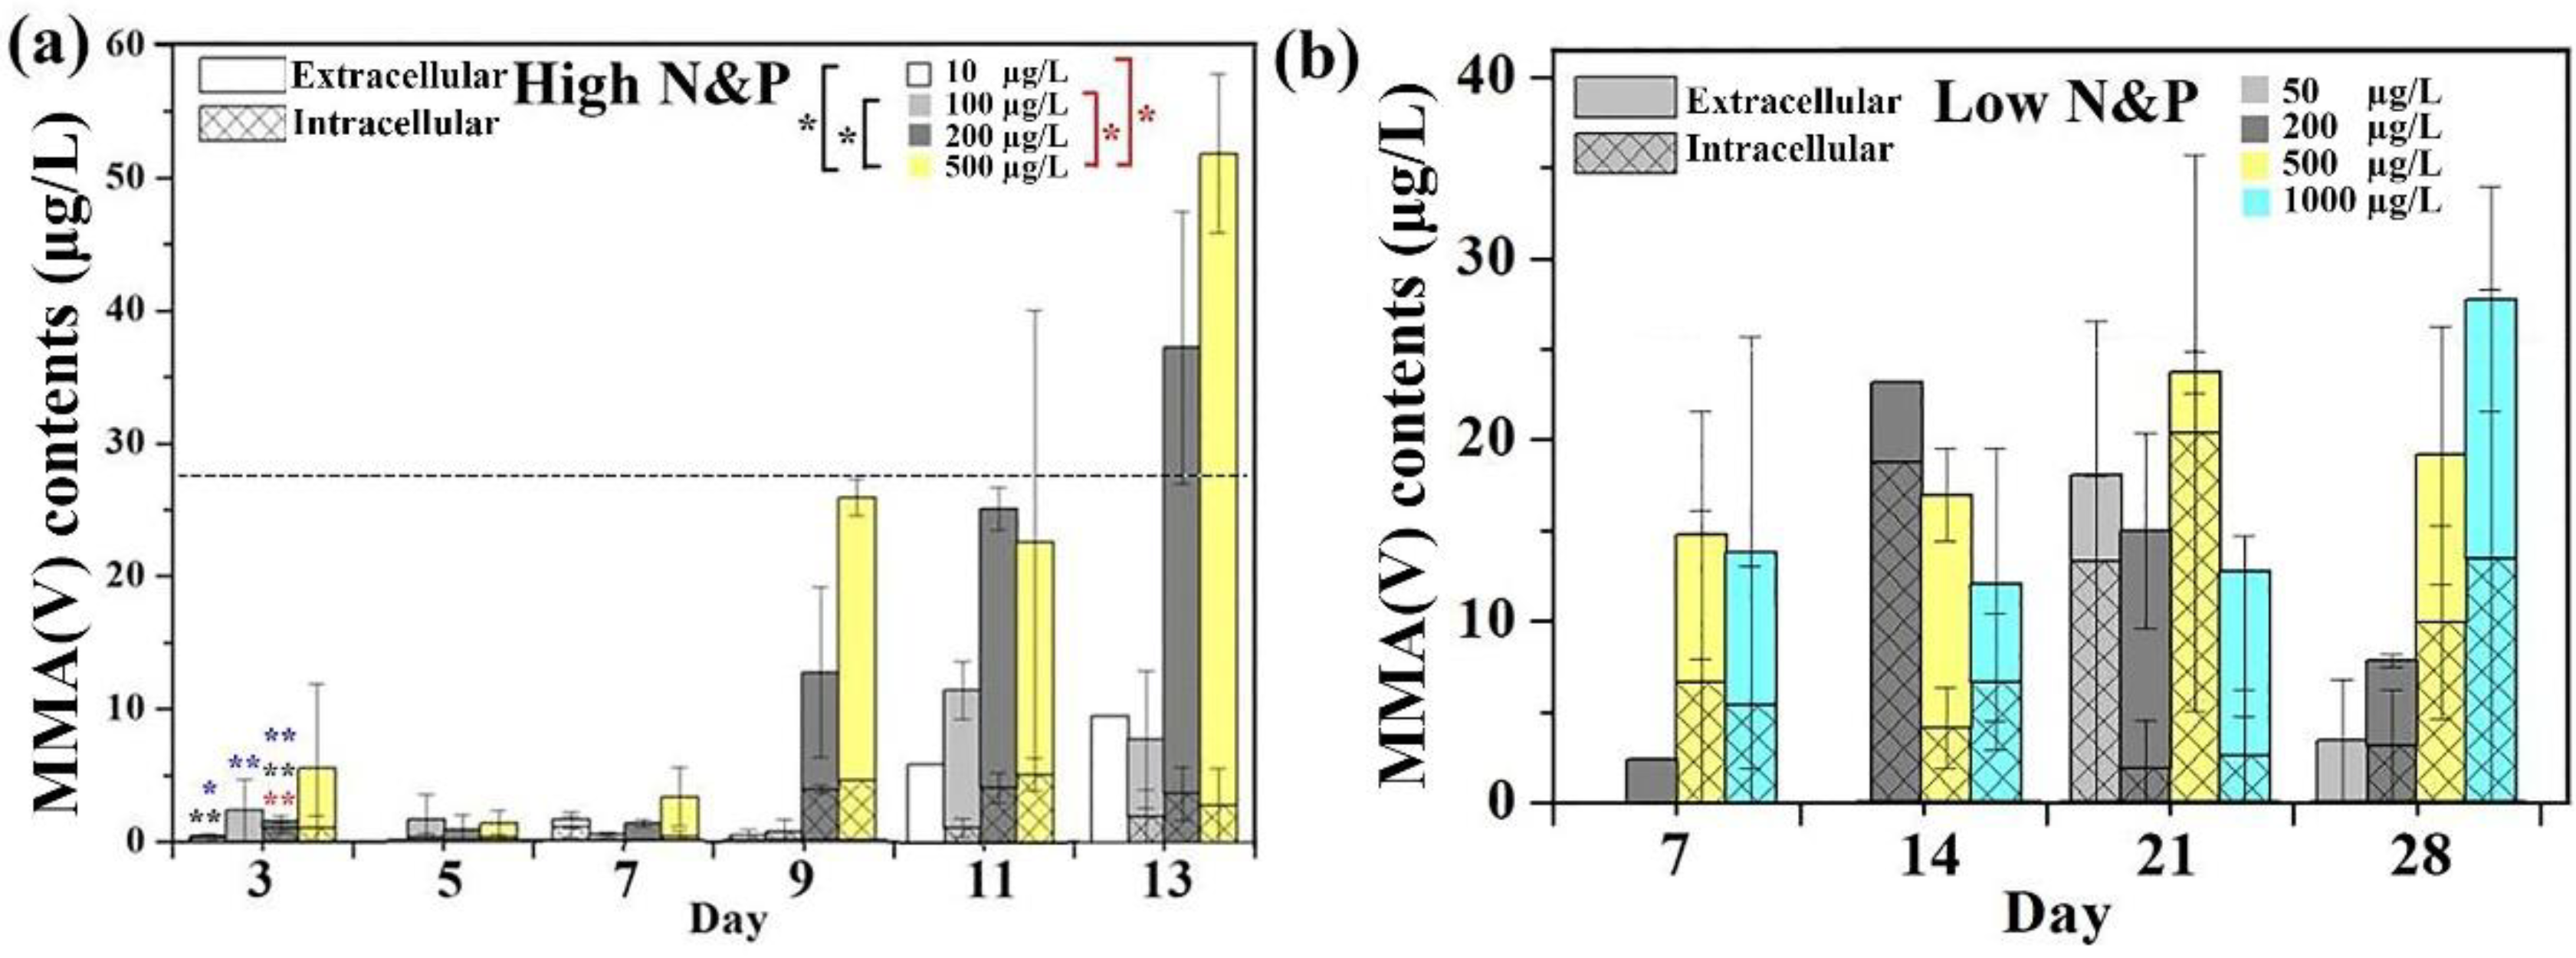
3.3. Intracellular and Extracellular Arsenic Species and Concentrations

Intracellular iAs(V) concentrations were far less than that of extracellular ones in all the exposed iAs(V) concentrations in both the high and low nutrient sets (Figure S3). Intracellular iAs(V) concentrations differed significantly in all the iAs(V) groups in the high nutrient set with the exception of the 10 and 100 µg/L groups (Figure S3a); however, their evident distinction was only shown between the 1000 and 50 or 200 or 500 μg/L groups in the low nutrient set (Figure S3b). The bioaccumulation of iAs(V) in Microcystis showed significant variations during the incubation time of the different iAs(V) groups in the high nutrient set, with the exception of the 100 µg/L group (Figure S3a). Additionally, significant variations were found in the 500 and 1000 iAs(V) groups in the low nutrient set, with the exception of the 50 and 200 µg/L groups (Figure S3b).
The iAs(III) concentrations was low in both nutrient sets (Figure 5). The highest iAs(III) concentration was shown and reached up to 17.0 µg/L in the 200 µg/L group in the high nutrient set on day 13, and the remaining groups were all below 5.7 µg/L (Figure 5a). Intracellular iAs(III) was found only in the 100 µg/L group on incubation day three. A significant difference between the intracellular and extracellular iAs(III) concentrations existed among all the iAs(V) groups (Figure 5a). Moreover, evident variations of extracellular iAs(III) concentrations were shown during the incubation time in the 100 and 200 µg/L groups, respectively. The iAs(III) concentrations were below 6.3 µg/L in all the iAs(V) groups in the low nutrient set (Figure 5b). iAs(III) was almost detected intracellularly and extracellularly in each iAs(V) group at each sampling incubation day. No evident variation with incubation time was shown between the intracellular and extracellular iAs(III) concentrations among all the iAs(V) groups (Figure 5b). In addition, no evident variations of intracellular and extracellular iAs(III) concentrations were shown during the incubation time in all the iAs(V) groups.
Low MMA(V) contents were formed in the initial incubation time of seven days; however, an evident increase in MMA(V) was formed from day nine, and the highest MMA(V) concentrations were shown on day 13, reaching up to 51.9 µg/L in the 500 µg/L group in the high nutrient set (Figure 6a). The extracellular MMA(V) contributed the majority of the total MMA(V) concentrations, while the intracellular MMA(V) remained at low concentrations below 5.1 µg/L. The extracellular and intracellular MMA(V) concentrations, in total, displayed an increasing trend with rising iAs(V) groups and also incubation time. An evident difference was found for both of the intracellular and extracellular MMA(V) variations during the incubation time between the 500 and 10 or 100 µg/L groups (Figure 6a). In the low nutrient set, the MMA(V) concentrations remained at relatively steady levels from day 7 to day 28 and all were below 27.7 µg/L (Figure 6b). An increase in the intracellular MMA(V) contents was formed compared to that of the high nutrient set, which was comparable to the extracellular MMA(V) concentrations. The intracellular and extracellular MMA(V) concentrations showed no significant variations with incubation time, respectively, among any of the iAs(V) groups (Figure 6b).
In the high nutrient set, the DMA(V) contents displayed a contrast pattern compared to the MMA(V) concentrations. High DMA(V) concentrations were formed within seven days, while they were relatively low from day nine, with the exception of the 500 µg/L iAs(V) group on day 11 and day 13 (Figure 7a). In addition, extracellular DMA(V) contributed the majority of the total DMA(V) concentrations, and intracellular DMA(V) remained at low concentrations below 1.5 μg/L. The intracellular and extracellular DMA(V) concentrations exhibited evident differences during the incubation time, respectively, both between the 500 and 10 or 100 or 200 µg/L groups (Figure 7a). In the low nutrient set, the DMA(V) concentrations remained at relatively stable levels and were all below 13.9 µg/L (Figure 7b). The intracellular DMA(V) contents were elevated, which was comparable to the extracellular DMA(V) concentrations. Intracellular and extracellular DMA(V) concentrations, respectively, showed no significant variations with the incubation time in in any comparison among the four iAs(V) groups, with the exception of that between the 50 and 1000 µg/L groups. In addition, the intracellular and extracellular DMA(V) variations, respectively, displayed variations during the incubation time that were not significant (Figure 7b).

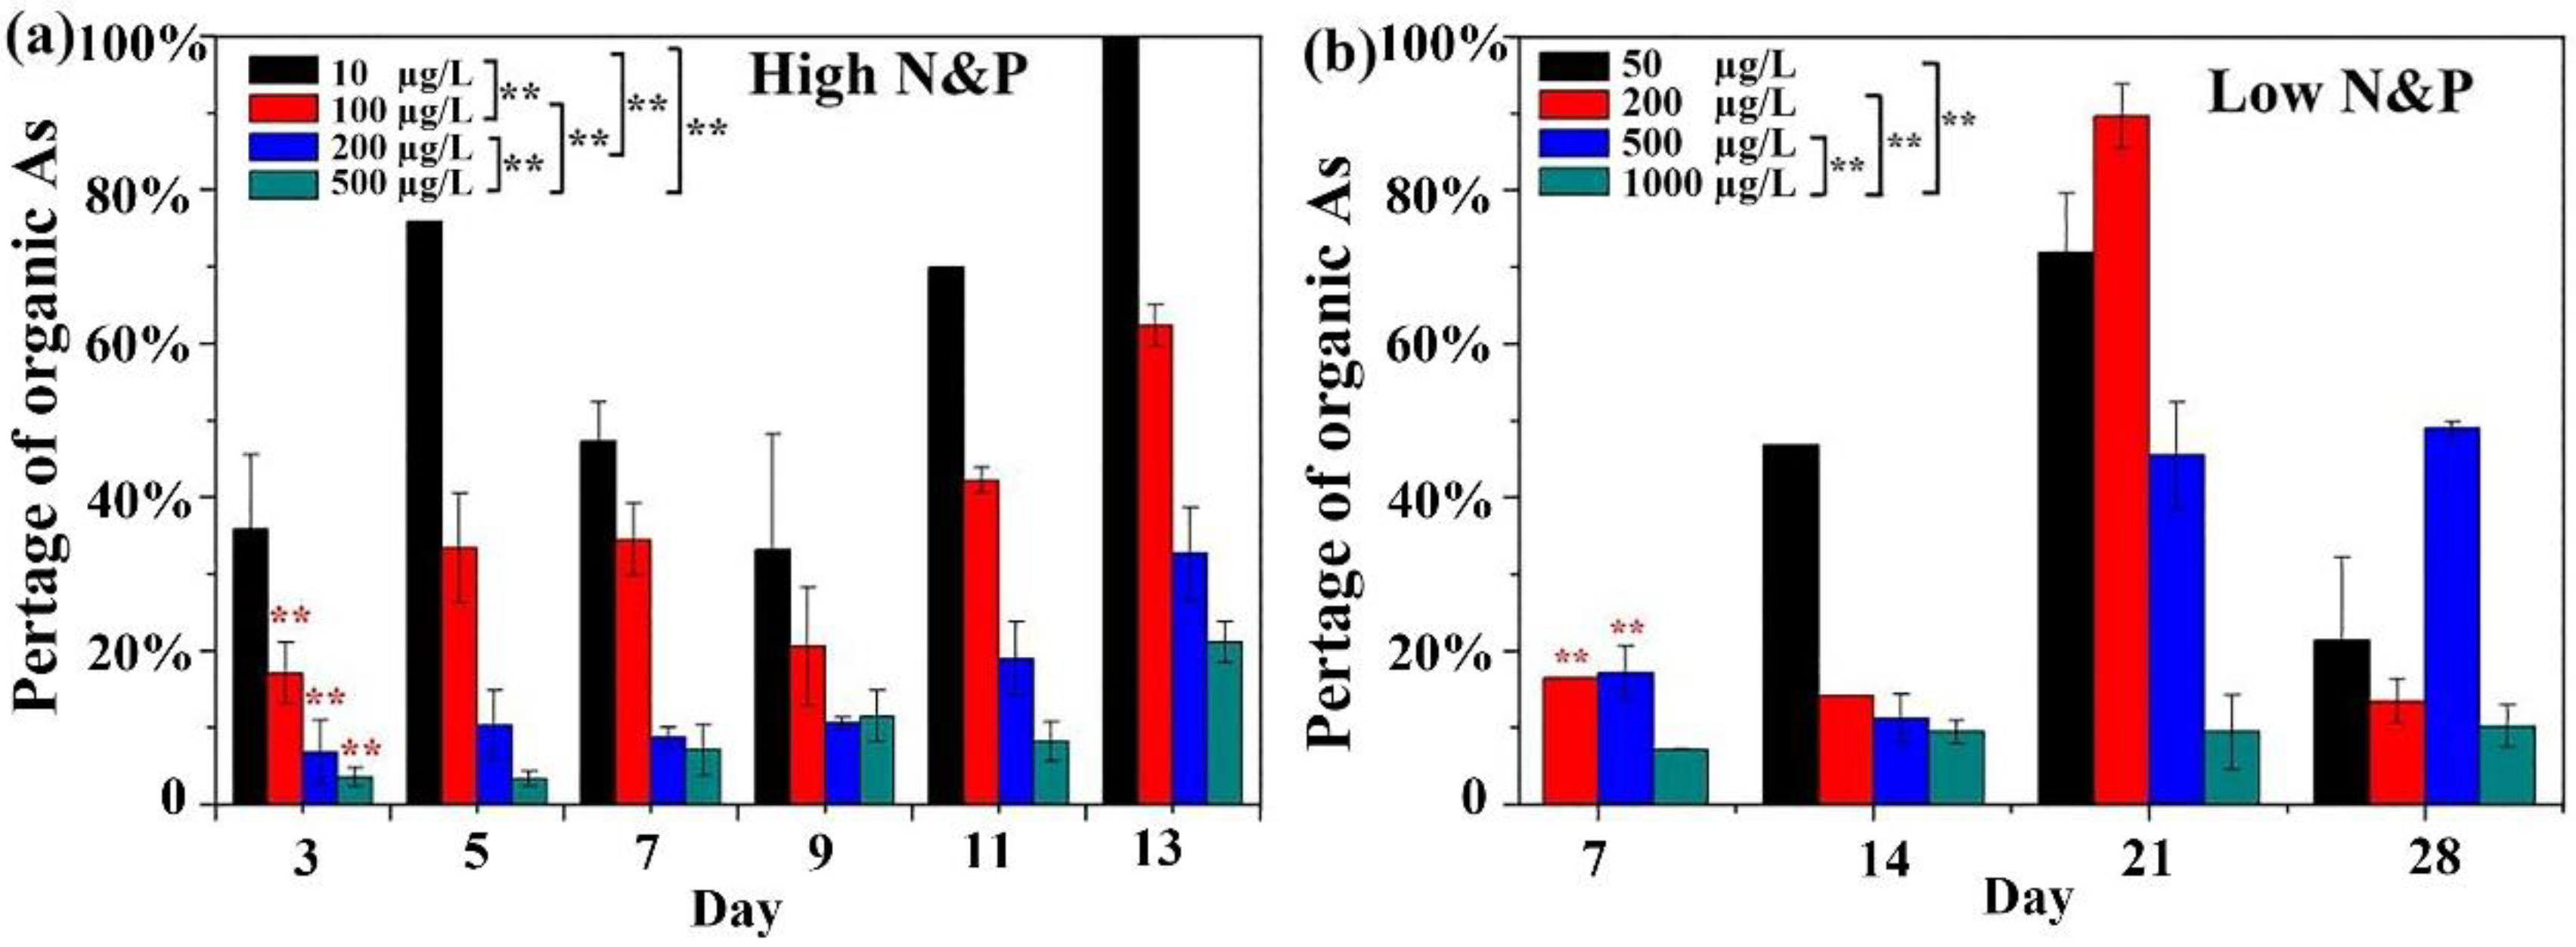
3.4. Arsenic Methylation

Two organic arsenicals (MMA(V) and DMA(V)) were determined in the study. The unfound arsenic compounds were the other undetected organic arsenicals in the study. The detected MMA(V) and DMA(V) and undetected organic arsenicals were combined as organic arsenicals in the study to investigate arsenic methylation by M. wesenbergii under different N and P regimes.
In the high nutrient set, a decrease in the proportion of methylated arsenicals was shown with increasing iAs(V) concentrations (Figure 8a). The proportion of organic arsenicals showed significant variations with incubation time among all the iAs(V) groups except between the 100 and 200 µg/L iAs(V) groups (Figure 8a). Similarly, organic arsenicals exhibited a significant trend of increased concentrations in the 100, 200, and 500 µg/L groups during incubation time, respectively (Figure 8a). In the low nutrient group, a decrease in the proportion of methylated arsenicals was shown with increasing iAs(V) concentrations, with the two anomalies of the 200 μg/L group on day 21 and the 500 µg/L group on day 28 (Figure 8b). The proportion of organic arsenicals showed significant variations with incubation time between the 1000 and 50 or 200 or 500 µg/L groups (Figure 8b). In addition, significant variations were also shown in the 200 and 500 µg/L groups during the incubation time, respectively (Figure 8b).

4. Discussion

M. wesenbergii was both inhibited in the presence of iAs(V) in the high and low nutrient sets, and more inhibition was shown with increasing iAs(V) concentrations (Figure 1). In addition, the inhibition effect of 1 µM arsenate on Microcystis aeruginosa was lower than that of 10 µM arsenate [16]. The arsenic exerted oxidative stress by generating reactive oxygen species (ROS) that could damage proteins, lipids, and nucleic acids [26,27]. In addition, the function of ATP was also inhibited by uncoupling phosphorylation as iAs(V) was a chemical analogue of phosphate [28]. The toxicity of iAs(V) on M. aeruginosa was alleviated by an increase in phosphate exposure in the medium, as a competition between arsenate and phosphate for cellular uptake existed [16]. However, M. wesenbergii growth was more inhibited in the high nutrient set than that in the low nutrient set in our study (Figure 1). This could be explained by the extremely high N and P concentrations in BG11 medium exhibiting an adverse effect on M. wesenbergii growth. The same result was obtained for the N and P nutrients (N = 250 mg/L, P = 5.44 mg/L) supplied in BG11 medium inhibiting Microcystis flos-aquae growth, while the relatively low N and P concentrations were beneficial for its growth [29].
Nitrate was first converted to ammonium before being incorporated into organic compounds in algae and was reduced in two successive steps by being catalyzed by nitrate reductase (NR) and nitrite reductase (NiR), respectively [30]. M. aeruginosa showed significant increases in NR activities with increasing high nitrate concentrations, while the NiR activity increases were much less than that of NR activities [31], leading to the accumulation of intracellular nitrite. Nitrite suppressed algal growth as it could inhibit the process of photosynthesis, change the intracellular pH, and damage algae cell membranes [32,33]. Phosphorus (P) was recognized as the principal nutrient limiting algal growth and bloom formation [34]. In addition, excessive P concentrations inhibited algal growth. The cell multiplication of M. aeruginosa was restrained when p > 0.445 mg/L [35], and excessive nutrients surpassing the thresholds for Microcystis optimal growth resulted in an early saturation of Microcystis cell density and a decrease in the specific growth rate of the late growing period (Figure 1). Moreover, a high P concentration over 5.4 mg/L may inhibit the excretion of extracellular polysaccharide of Microcystis cells, further restricting the growth of Microcystis colonies [29].
The percentage of arsenic contents bioaccumulated in M. wesenbergii cells decreased with the elevated iAs(V) concentrations exposed in the medium in both the high and low nutrient sets (Figure 4a,c). A similar result was found as the bioconcentration factor was decreased a hundred-fold by Chlorella vulgaris (Chlorophyta) with the increase in iAs(V) from 0 to 1000 mg/L [36]. A higher intracellular arsenic concentration was found in the low nutrient set than in the high nutrient set (Figure 4b,d). The increase in phosphate showed a competition with arsenate for cellular uptake, leading to a decreased uptake of arsenate in Synechocystis, M. aeruginosa, Chlorella, and Monoraphidium (Chlorophyta) [16,18,37]. In addition, intracellular As(V) accumulation decreased with the N concentration increasing from 4 to 20 mg/L [38]. Moreover, arsenic uptake in the 100, 200, and 500 µg/L iAs(v) groups remained unaffected in the high nutrient set, while significant variations existed in intracellular arsenic concentrations among the 50, 200, 500, and 1000 µg/L iAs(v) groups in the low nutrient set (Figure 4a,c). The result suggested that the bioconcentration of arsenic in M. wesenbergii was more affected in the low nutrient set than that in the high nutrient set, and nutrient concentrations played a crucial role in the arsenic uptake by cyanobacteria.
The most dominant arsenical accumulated in M. wesenbergii cells was iAs(V) under both the high and low nutrient sets (Figure S3), which was reported to contribute 81–84% of total intracellular arsenicals in Synechocystis, Microcystis, and Nostoc [11]. A much higher iAs(V) concentration was found in the low nutrient set (10.38–41.59 µg/L in the 200 µg/L group and 4.21–28.29 µg/L in the 500 µg/L group) than that in the high nutrient set (4.35–11.67 µg/L in the 200 µg/L group and 5.05–16.12 µg/L in the 500 µg/L groups) as phosphate could inhibit the iAs(V) uptake [16]. Some cyanobacterial genera could reduce iAs(V) to iAs(III) via arsenate reductase gene arsC, including Synechocystis, Anabaena, Nostoc, and Microcystis [12,13,16,19]. No intracellular iAs(III) was found in the high nutrient set (Figure 5a), indicating that iAs(III) could be immediately excreted out of cells once they were reduced from iAs(V). However, intracellular iAs(III) was shown in each iAs(V) group during each incubation day in the low nutrient set (Figure 5b). The phosphate was a strong competitive inhibitor of iAs(V) reduction and might influence the synthesis or complete binding sites of arsenate reductases [39,40]. In addition to the inhibition of iAs(V) reduction, iAs(III) oxidation was more effective with the elevated P levels in Synechocystis [18]. These could result in higher iAs(III) contents in the low nutrient set in our study. Moreover, high intracellular iAs(III) concentrations could be comparable to the extracellular level, and the iAs(III) content remained unaffected and showed no significant variations between each of the two exposed iAs(V) groups with incubation time (Figure 5b). A much higher iAs(III) concentration remained in M. wesenbergii cells in the low nutrient set, which indicated that it was blocked from being excreted out of the cells.
It was detected that M. wesenbergii could also methylate inorganic arsenicals for MMA(V) and DMA(V) (Figure 6 and Figure 7). iAs(III) methylation was catalyzed by iAs(III) S-adenosylmethionine methyltransferase (ArsM) and has been detected in some cyanobacterial genera, including Nostoc, Spirulina, Synechosystis, and Anabaena [2,3,5,12,13,21]. The arsenate was non-specifically bound to arsenate reductase; thus, arsenate reduction and its subsequent methylation biotransformation processes might also be obstructed by its chemical analogue phosphate [40]. The methylated arsenicals were termed as a combination of detected MMA(V), DMA(V), and undetected arsenicals in the study. Organic arsenicals decreased when exposed to increasing iAs(V) concentrations on each incubation day, while their concentrations increased with incubation time at any of the iAs(V) groups in the high nutrient set (Figure 8a). A similar pattern was exhibited with some exceptions in the low nutrient set (Figure 8b). Much higher organoarsenical compounds were found in the low nutrient set compared with those in the high nutrient set. This might be explained by the fact that iAs(V) uptake in the low nutrient set could facilitate the biotransformation and methylation of organic arsenicals. Moreover, DMA(V) was produced at slow growth rates, and iAs(III) was produced at fast growth rates [41]. The specific growth rate in the low nutrient set was much higher than that in the high nutrient set, and higher iAs(III) content produced in the low nutrient set could also contribute to higher organoarsenicals concentrations.
The MMA(V) content was higher in the high nutrient set than that in the low nutrient set apart from the fact that the MMA(V) content was relatively low for seven days, then there was a sharp increase to ten times higher concentrations on day nine and continued it to increase until day 13 in the high nutrient set (Figure 6a). The intracellular MMA(V) content was relatively low in the high nutrient set (Figure 6a), while it was greatly increased, and the concentration reached the same level as the extracellular level in the low nutrient set (Figure 6b). The similar result was also observed in the DMA(V) pattern (Figure 7). The intracellular, extracellular, and total MMA(V) and DMA(V) contents, respectively, showed no significant variations with incubation time in each iAs(V) group in the low nutrient set; contrarily, a reverse pattern was found in the high nutrient set. The much higher intracellular MMA(V) and DMA(V) concentrations found in the low nutrient set suggested that the excretion of these two methylated arsenicals was inhibited. Hellweger [42] proposed that the reduction of iAs(V) to iAs(III) was rapid but methylation was slower, whereas arsenic metabolism was co-regulated with phosphate when screening the genome sequence in soil bacterium Agrobacterium tumefaciens [43]. iAs(V) reduction was inhibited and iAs(III) oxidation was promoted with increasing phosphate concentrations [17,18]. These regulations could explain why the iAs(III) content found was much lower than MMA(V) and DMA(V) in both the high and low nutrient sets; additionally, the high iAs(III) contents resulted in much higher organoarsenicals concentrations in the low nutrient set.
Accompanied with Microcystis blooms, secondary metabolites that endanger public health such as microcystin were always produced [44]. The content of microcystin was reported to be enhanced in the presence of iAs(V) and iAs(III) [45]. In addition, the content of microcystin could be co-regulated by nutrients and arsenicals. Under the normal phosphate conditions (1.0 μM), total microcystin yields followed an inverted U-shape pattern in a gradient of iAs(V) concentrations (10−8, 10−7, 10−6, 10−5, 10−4 M) that were lower in the high iAs(V) concentrations than that in the absence of arsenate, whereas under the phosphate starvation, total toxin yields were not affected by arsenate [46]. How the content of microcystin responds to excessive nutrients and arsenate should be further explored, to have complete knowledge of the complex processes among the nutrients, microcystin, and arsenicals.

5. Conclusions

The far higher N and P nutrient concentrations in BG11 medium exhibited an inhibition of M. wesenbergii growth; furthermore, inhibition increased with elevated iAs(V) concentrations. The concentrations of N and P nutrients did affect arsenic accumulation, speciation, and concentrations, as shown in the study. Higher arsenic concentrations were accumulated in the cells in the low nutrient set than those in the high nutrient set; furthermore, arsenicals’ accumulation in M. wesenbergii increased with increasing iAs(V) concentrations but decreased in the percentage of total arsenicals. The same result was found for organoarsenicals, indicating that bioaccumulation and biotransformation showed the same response pattern with increasing nutrient concentrations (N and P investigated in the study) and ambient iAs(V) concentrations. The biotransformation of arsenic in cyanobacteria carried out under BG11 medium contained far higher nutrients compared with that in natural freshwaters systems. This might not reflect the actual bioaccumulation and biotransformation of arsenic in phytoplankton in natural freshwaters, as it was shown in the study that these processes could be affected by nutrient concentrations. Further investigations should mimic the natural environment, and deep discoveries of N, P, and the other regulators that affect arsenic biogeochemical cycles in cyanobacteria need to be performed to understand whole arsenic biogeochemical processes well.

Supplementary Materials

The following supporting information can be downloaded at: https://www.mdpi.com/article/10.3390/w14020245/s1, Figure S1: Photograph of Microcystis wesenbergii FACHB 908, provided from Institute of Hydrobiology, Chinese Academy of Sciences; Figure S2: Instrumental scheme of coupled HPLC-HG-AFS; Figure S3: The intracellular and extracellular iAs(V) concentrations varied with incubation time that was exposed with different iAs(V) concentrations under the high (a) and low (b) nutrient sets; Table S1: Revised experimental condition for the HPLC-HG-AFS shown by Roldán et al. (2016).

Author Contributions

Z.X., methodology, investigation, formal analysis; X.L., conceptualization, methodology, formal analysis, writing—original draft, writing—reviewing and editing, funding acquisition; S.H., conceptualization, writing—reviewing and editing. All authors have read and agreed to the published version of the manuscript.

Funding

This work was supported by the National Natural Science Foundation of China (No. 31700404).

Institutional Review Board Statement

Not applicable.

Informed Consent Statement

Not applicable.

Data Availability Statement

Data are available on-demand from the corresponding author.

Conflicts of Interest

The authors declare no conflict of interest.

References

  1. Francesconi, K.A. Current perspectives in arsenic environmental and biological research. Environ. Chem. 2005, 2, 141–145. [Google Scholar] [CrossRef]
  2. Guo, Y.; Xue, X.; Yan, Y.; Zhu, Y.; Yang, G.; Ye, J. Arsenic methylation by an arsenite S-adenosylmethionine methyltransferase from Spirulina platensis. J. Environ. Sci. 2016, 49, 162–168. [Google Scholar] [CrossRef] [PubMed]
  3. Xue, X.M.; Yan, Y.; Xiong, C.; Raber, G.; Francesconi, K.; Pan, T.; Ye, J.; Zhu, Y.G. Arsenic biotransformation by a cyanobacterium Nostoc sp. PCC 7120. Environ. Pollut. 2017, 228, 111–117. [Google Scholar] [CrossRef]
  4. Sharma, V.K.; Sohn, M. Aquatic arsenic: Toxicity, speciation, transformations, and remediation. Environ. Intern. 2009, 35, 743–759. [Google Scholar] [CrossRef]
  5. Raber, G.; Raml, R.; Goessler, W.; Francesconi, K.A. Quantitative speciation of arsenic compounds when using organic solvent gradients in HPLC-ICPMS. J. Anal. Atom. Spectrom. 2010, 25, 570–576. [Google Scholar] [CrossRef]
  6. Yoshinaga, M.; Cai, Y.; Rosen, B.P. Demethylation of methylarsonic acid by a microbial community. Environ. Microbiol. 2011, 13, 1205–1215. [Google Scholar] [CrossRef] [Green Version]
  7. Yan, Y.; Xue, X.M.; Guo, Y.Q.; Zhu, Y.G.; Ye, J. Co-expression of Cyanobacterial genes for arsenic methylation and demethylation in Escherichia coli offers insights into arsenic resistance. Front. Microbiol. 2017, 8, 60. [Google Scholar] [CrossRef]
  8. Wang, P.P.; Sun, G.X.; Zhu, Y.G. Identification and characterization of arsenite methyltransferase from an archaeon, Methanosarcina acetivorans C2A. Environ. Sci. Technol. 2014, 48, 12706–12713. [Google Scholar] [CrossRef]
  9. Huber, V.; Wagner, C.; Gerten, D.; Adrian, R. To bloom or not to bloom: Contrasting responses of cyanobacteria to recent heat waves explained by critical thresholds of abiotic drivers. Oecologia 2012, 169, 245–256. [Google Scholar] [CrossRef]
  10. O’Neil, J.M.; Davis, T.W.; Burford, M.A.; Gobler, C.J. The rise of harmful cyanobacteria blooms: The potential roles of eutrophication and climate change. Harmful Algae 2012, 14, 313–334. [Google Scholar] [CrossRef]
  11. Yin, X.; Chen, J.; Qin, J.; Sun, G.; Rosen, B.; Zhu, Y. Biotransformation and volatilization of arsenic by three photosynthetic cyanobacteria. Plant Physiol. 2011, 156, 1631–1638. [Google Scholar] [CrossRef]
  12. Pandey, S.; Rai, R.; Rai, L.C. Proteomics combines morphological, physiological and biochemical attributes to unravel the survival strategy of Anabaena sp. PCC7120 under arsenic stress. J. Proteom. 2012, 75, 921–937. [Google Scholar] [CrossRef]
  13. Yan, Y.; Ye, J.; Xue, X.M.; Zhu, Y.G. Arsenic demethylation by a C·As lyase in cyanobacterium Nostoc sp. PCC 7120. Environ. Sci. Technol. 2015, 49, 14350–14358. [Google Scholar] [CrossRef]
  14. Chen, J.; Rosen, B.P. Organoarsenical biotransformations by Shewanella putrefaciens. Environ. Sci. Technol. 2016, 50, 7956–7963. [Google Scholar] [CrossRef] [Green Version]
  15. Chen, J.; Bhattacharjee, H.; Rosen, B.P. ArsH is an organoarsenical oxidase that confers resistance to trivalent forms of the herbicide monosodium methylarsenate and the poultry growth promoter roxarsone. Mol. Microbiol. 2015, 96, 1042–1052. [Google Scholar] [CrossRef] [Green Version]
  16. Guo, P.; Gong, Y.; Wang, C.; Liu, X.; Liu, J. Arsenic speciation and effect of arsenate inhibition in a Microcystis aeruginosa culture medium under different phosphate regimes. Environ. Toxicol. Chem. 2011, 30, 1754–1759. [Google Scholar] [CrossRef]
  17. Markley, C.T.; Herbert, B.E. Modeling phosphate influence on arsenate reduction kinetics by a freshwater cyanobacterium. Environ. Model. Assess. 2010, 15, 361–368. [Google Scholar] [CrossRef]
  18. Zhang, S.; Rensing, C.; Zhu, Y.G. Cyanobacteria-mediated arsenic redox dynamics is regulated by phosphate in aquatic environments. Environ. Sci. Technol. 2013, 48, 994–1000. [Google Scholar] [CrossRef]
  19. López-Maury, L.; Florencio, F.J.; Reyes, J.C. Arsenic sensing and resistance system in the cyanobacterium Synechocystis sp. strain PCC 6803. J. Bacteriol. 2003, 185, 5363–5371. [Google Scholar] [CrossRef] [PubMed] [Green Version]
  20. Miyashita, S.I.; Fujiwara, S.; Tsuzuki, M.; Kaise, T. Cyanobacteria produce arsenosugars. Environ. Chem. 2012, 9, 474–484. [Google Scholar] [CrossRef] [Green Version]
  21. Xue, X.M.; Raber, G.; Foster, S.; Chen, S.C.; Francesconi, K.A.; Zhu, Y.G. Biosynthesis of arsenolipids by the cyanobacterium Synechocystis sp. PCC 6803. Environ. Chem. 2014, 11, 506–513. [Google Scholar] [CrossRef] [Green Version]
  22. Stanier, R.Y.; Kunisawa, R.; Mandel, M.; Cohen-Bazire, G. Purification and properties of unicellular blue-green algae (order Chroococcales). Bacteriol. Rev. 1971, 35, 171. [Google Scholar] [CrossRef]
  23. García-Salgado, S.; Quijano, M.A.; Bonilla, M.M. Arsenic speciation in edible alga samples by microwave-assisted extraction and high performance liquid chromatography coupled to atomic fluorescence spectrometry. Anal. Chim. Acta 2012, 714, 38–46. [Google Scholar] [CrossRef] [PubMed] [Green Version]
  24. Gómez-Ariza, J.L.; Sánchez-Rodas, D.; Giráldez, I.; Morales, E. A comparison between ICP-MS and AFS detection for arsenic speciation in environmental samples. Talanta 2000, 51, 257–268. [Google Scholar] [CrossRef]
  25. Roldán, N.; Salinas-Parra, N.; Gonzalez, A.A.; Cifuentes-Araneda, F.; Arias, H.; Bravo, M.; Quiroz, W. Implementation of an analytical method for the determination of inorganic arsenic species in occupationally exposed human urine samples and its toxic effects on epithelial cells of renal collecting tubule. J. Chil. Chem. Soc. 2016, 61, 3214–3218. [Google Scholar] [CrossRef] [Green Version]
  26. Shi, H.; Shi, X.; Liu, K.J. Oxidative mechanism of arsenic toxicity and carcinogenesis. Mol. Cell. Biochem. 2004, 255, 67–78. [Google Scholar] [CrossRef]
  27. Requejo, R.; Tena, M. Proteome analysis of maize roots reveals that oxidative stress is a main contributing factor to plant arsenic toxicity. Phytochemistry 2005, 66, 1519–1528. [Google Scholar] [CrossRef]
  28. Requejo, R.; Tena, M. Maize response to acute arsenic toxicity as revealed by proteome analysis of plant shoots. Proteomics 2006, 6, 156–162. [Google Scholar] [CrossRef]
  29. Xu, P.; Yang, G.J.; Zhou, J.; Qin, B.Q.; Zhang, G.S.; Zou, H.; Hu, X.Q. Effect of nitrogen and phosphorus concentration on colony growth of Microcystis flos-aquae in Lake Taihu. J. Lake Sci. 2014, 26, 213. [Google Scholar]
  30. Chen, W.; Zhang, Q.; Dai, S. Effects of nitrate on intracellular nitrite and growth of Microcystis aeruginosa. J. Appl. Phycol. 2009, 21, 701–706. [Google Scholar] [CrossRef]
  31. Sivasankar, S.; Oaks, A. Nitrate assimilation in higher plants: The effect of metabolites and light. Plant Physiol. Biochem. 1996, 34, 609–620. [Google Scholar]
  32. Spiller, H.; Boger, P. Photosynthetic nitrite reduction by dithioerythritol and the effect of nitrite on electron transport in isolated chloroplasts. Photochem. Photobiol. 1977, 26, 397–402. [Google Scholar] [CrossRef]
  33. Almeida, J.S.; Júlio, S.M.; Reis, M.A.M.; Carrondo, M.J.T. Nitrite inhibition of denitrification by Pseudomonas fluorescens. Biotechnol. Bioeng. 1995, 46, 194–201. [Google Scholar] [CrossRef]
  34. McCormick, P.V.; O’Dell, M.B.; Shuford, R.B.E., III; Backus, J.G.; Kennedy, W.C. Periphyton responses to experimental phosphorus enrichment in a subtropical wetland. Aquat. Bot. 2001, 71, 119–139. [Google Scholar] [CrossRef]
  35. Yi, W.L.; Jin, X.C.; Chu, Z.S.; Hu, X.Z.; Ma, Z.Y.; Wang, G.D.; Zhang, S.Y. Effect of different P mass concentrations on growth and P-in-cell of Microcystis aeruginosa. Res. Environ. Sci. 2004, 17, 58–61. [Google Scholar]
  36. Murray, L.A.; Raab, A.; Marr, I.L.; Feldmann, J. Biotransformation of arsenate to arsenosugars by Chlorella vulgaris. Appl. Organomet. Chem. 2003, 17, 669–674. [Google Scholar] [CrossRef]
  37. Levy, J.L.; Stauber, J.L.; Adams, M.S.; Maher, W.A.; Kirby, J.K.; Jolley, D.F. Toxicity, biotransformation, and mode of action of arsenic in two freshwater microalgae (Chlorella sp. and Monoraphidium arcuatum). Environ. Toxicol. Chem. 2005, 24, 2630–2639. [Google Scholar] [CrossRef]
  38. Che, F.; Du, M.; Yan, C. Arsenate biotransformation by Microcystis aeruginosa under different nitrogen and phosphorus levels. J. Environ. Sci. 2018, 66, 41–49. [Google Scholar] [CrossRef]
  39. Slaughter, D.C.; Macur, R.E.; Inskeep, W.P. Inhibition of microbial arsenate reduction by phosphate. Microbiol. Res. 2012, 167, 151–156. [Google Scholar] [CrossRef]
  40. Wang, N.X.; Li, Y.; Deng, X.H.; Miao, A.J.; Ji, R.; Yang, L.Y. Toxicity and bioaccumulation kinetics of arsenate in two freshwater green algae under different phosphate regimes. Water Res. 2013, 47, 2497–2506. [Google Scholar] [CrossRef]
  41. Hellweger, F.L.; Lall, U. Modeling the effect of algal dynamics on arsenic speciation in Lake Biwa. Environ. Sci. Technol. 2004, 38, 6716–6723. [Google Scholar] [CrossRef] [PubMed]
  42. Hellweger, F.L. Greedy algae reduce arsenate. Limnol. Oceanogr. 2003, 48, 2275–2288. [Google Scholar] [CrossRef] [Green Version]
  43. Kang, Y.S.; Heinemann, J.; Bothner, B.; Rensing, C.; Mcdermott, T.R. Integrated co-regulation of bacterial arsenic and phosphorus metabolisms. Environ. Microbiol. 2012, 14, 3097–3109. [Google Scholar] [CrossRef]
  44. De Figueiredo, D.R.; Azeiteiro, U.M.; Esteves, S.M.; Gonçalves, F.J.; Pereira, M.J. Microcystin-producing blooms—A serious global public health issue. Ecotoxicol. Environ. Saf. 2004, 59, 151–163. [Google Scholar] [CrossRef] [PubMed]
  45. Gong, Y.; Ao, H.Y.; Liu, B.B.; Wen, S.; Wang, Z.; Hu, D.J.; Zhang, X.Z.; Song, L.R.; Liu, J.T. Effects of inorganic arsenic on growth and microcystin production of a Microcystis strain isolated from an algal bloom in Dianchi Lake, China. Chin. Sci. Bull. 2011, 56, 2337–2342. [Google Scholar] [CrossRef] [Green Version]
  46. Gong, Y.; Chou, H.N.; Tu, C.D.; Liu, X.; Liu, J.; Song, L. Effects of arsenate on the growth and microcystin production of Microcystis aeruginosa isolated from Taiwan as influenced by extracellular phosphate. J. Appl. Phycol. 2009, 21, 225–231. [Google Scholar] [CrossRef] [Green Version]
Figure 1. M. wesenbergii cell density varied with incubation time that was exposed with different iAs(V) concentrations in the high nutrient set in BG11 medium (N = 250 mg/L, P = 7.13 mg/L) (a) and adjusted low nutrient set (N = 1.5 mg/L, P = 0.3 mg/L) (b). The specific growth rate is imbedded. Note: Microcystis cell density with incubation time was compared between each of two groups of ambient iAs(V) concentrations. Significance levels below 0.05 (*) and 0.01 (**) are denoted in the figure.
Water 14 00245 g001
Figure 2. The chromatographic separation of four arsenic standards (iAs(III), iAs(V), MMA(V), and DMA(V)) at 100 μg/L. Red dotted line represented the noise reduction curve measured by the embedded SAMS software.
Water 14 00245 g002
Figure 3. The percentage of detected intracellular and extracellular As contents, and undetected intracellular and extracellular As content in the total added iAs(V) concentration varied with incubation time that exposed different ambient iAs(V) concentrations in the high (a) and the low (b) nutrient sets. The variant pattern of total detected intracellular and extracellular arsenic contents with rising iAs(V) concentrations was connected by red lines for each incubation day.
Water 14 00245 g003
Figure 4. The percentage of detected intracellular As content in the total added iAs(V) concentration, and their concentration (mg/L) varied with incubation time that exposed different iAs(V) concentrations in the high (a,b) and low (c,d) nutrient sets. Note: The percentage of detected intracellular As contents, and their concentrations with incubation time were compared between each of two groups of ambient iAs(V) concentrations. Significance levels below 0.01 (**) are denoted in the figure.
Water 14 00245 g004
Figure 5. The intracellular and extracellular iAs(III) concentrations varied with incubation time that exposed different iAs(V) concentrations in the high (a) and low (b) nutrient sets. Note: No significant variations of intracellular and extracellular iAs(III) concentrations during incubation time, respectively, between each of two groups of ambient iAs(V) concentrations; blue * indicates significant variations between intracellular and extracellular iAs(III) concentrations in four groups of ambient iAs(V) concentrations. Black and blue * on column bars indicate significant variations of extracellular and total iAs(III) concentration with incubation time for each group of ambient iAs(V) concentrations; no significance was found for intracellular iAs(III) concentration. Significance levels below 0.05 (*) and 0.01 (**) are denoted in the figure. Line indicates value as the largest intracellular and extracellular iAs(III) concentration in the low nutrient set.
Water 14 00245 g005
Figure 6. The intracellular and extracellular MMA(V) concentrations varied with incubation time that exposed different iAs(V) concentrations in the high (a) and low (b) nutrient sets. Note: Red and black * on the legend indicate significant variations of intracellular and extracellular MMA(V) concentrations with incubation time, respectively, between each of two groups of ambient iAs(V) concentrations; no significant variations between intracellular and extracellular MMA(V) concentrations were found in four groups of ambient iAs(V) concentrations. Red, black, and blue * on column bars indicate significant variations of intracellular, extracellular, and total MMA(V) concentration with incubation time for each group of ambient iAs(V) concentration. Significance levels below 0.05 (*) and 0.01 (**) are denoted in the figure. Line indicates value as the largest intracellular and extracellular MMA(V) concentration in the low nutrient set.
Water 14 00245 g006
Figure 7. The intracellular and extracellular DMA(V) concentrations varied with incubation time that exposed different iAs(V) concentrations in the high (a) and low (b) nutrient sets. Note: Red and black * on the legend indicate significant variations of intracellular and extracellular DMA(V) concentrations with incubation time, respectively, between each of two groups of ambient iAs(V) concentrations; blue * indicates significant variations between intracellular and extracellular DMA(V) concentrations in four groups of ambient iAs(V) concentrations. Red, black, and blue * on column bars indicate significant variations of intracellular, extracellular, and total DMA(V) concentration with incubation time. Significance levels below 0.05 (*) and 0.01 (**) are denoted in the figure.
Water 14 00245 g007
Figure 8. The percentage of total organic As contents in the total added iAs(V) concentration varied with incubation time that exposed different iAs(V) concentrations in the high (a) and low (b) nutrient sets. The organic As contained the detected MMA(V), DMA(V), and undetected As in the study. Note: Black * on the legend indicates significant variations of percentage of organic As concentration with incubation time between each of two groups of ambient iAs(V) concentrations. Red * on column bars indicates significant variations of percentage of organic As concentration with incubation time for each group of ambient iAs(V) concentration. Significance levels below 0.01 (**) are denoted in the figure.
Water 14 00245 g008
Publisher’s Note: MDPI stays neutral with regard to jurisdictional claims in published maps and institutional affiliations.

