Article

Ge/Si Ratio of River Water in the Yarlung Tsangpo: Implications for Hydrothermal Input and Chemical Weathering

1
Key Laboratory of Cenozoic Geology and Environment, Institute of Geology and Geophysics, Chinese Academy of Sciences, Beijing 100029, China
2
CAS Center for Excellence in Life and Paleoenvironment, Beijing 100044, China
3
University of Chinese Academy of Sciences, Beijing 100049, China
*
Author to whom correspondence should be addressed.
These authors contributed equally to this work.
Water 2022, 14(2), 181; https://doi.org/10.3390/w14020181
Submission received: 5 December 2021 / Revised: 2 January 2022 / Accepted: 6 January 2022 / Published: 10 January 2022

Abstract

:
Germanium/Silicon (Ge/Si) ratio is a common proxy for primary mineral dissolution and secondary clay formation yet could be affected by hydrothermal and anthropogenic activities. To decipher the main controls of riverine Ge/Si ratios and evaluate the validity of the Ge/Si ratio as a weathering proxy in the Tibetan Plateau, a detailed study was presented on Ge/Si ratios in the Yarlung Tsangpo River, southern Tibetan Plateau. River water and hydrothermal water were collected across different climatic and tectonic zones, with altitudes ranging from 800 m to 5000 m. The correlations between TDS (total dissolved solids) and the Ge/Si ratio and Si and Ge concentrations of river water, combined with the spatial and temporal variations of the Ge/Si ratio, indicate that the contribution of hydrothermal water significantly affects the Ge/Si ratio of the Yarlung Tsangpo River water, especially in the upper and middle reaches. Based on the mass balance calculation, a significant amount of Ge (11–88%) has been lost during its transportation from hydrothermal water to the river system; these could result from the incorporation of Ge on/into clays, iron hydroxide, and sulfate mineral. In comparison, due to the hydrothermal input, the average Ge/Si ratio in the Yarlung Tsangpo River is a magnitude order higher than the majority of rivers over the world. Therefore, evaluation of the contribution of hydrothermal sources should be considered when using the Ge/Si ratio to trace silicate weathering in rivers around the Tibetan Plateau.

1. Introduction

Chemical weathering regulates atmospheric CO2 and the Earth’s habitability on a long-term scale [1,2]. Since Raymo and Ruddiman proposed the role of tectonic uplift on silicate weathering and global climate cooling during the Cenozoic era [3], the Tibetan Plateau has received considerable attention [4,5,6,7,8,9]. Given that rivers integrate dissolved and solid weathering products, river geochemistry studies could shed light on weathering processes and fluxes at the basin/global scale [5,10,11,12,13,14,15].
Ge/Si ratios have been widely used as a silicate weathering tracer [16,17,18,19,20,21,22,23]. Ge is a trace element in silicate minerals, with similar geochemical properties to Si [24]. The redistribution of Ge and Si during mineral dissolution and secondary clay formation could result in variations in the Ge/Si ratio in river water and soil [17]. Generally, Ge is more enriched in secondary clays than Si [17,18,25,26,27,28,29]; thus, the Ge/Si ratio of river water is lower than that of soil and silicate rock [16].
For rivers on the Tibetan Plateau, the controls of the Ge/Si ratio in river water are much more complex and could be affected by multiple factors such as silicate weathering, hydrothermal water discharge, sulfide weathering, and fly coal ash [30,31]. Previous studies have reported the Ge/Si ratio in river water on the Tibetan Plateau, generally higher than the global average [23,30,31]. The elevated riverine Ge/Si ratio in the three river regions (Yangtze, Salween, and Mekong) is due to high hydrothermal activity, while in the Huang He and Hong Rivers, it may reflect the weathering of sulfide and coal-bearing minerals [23,31]. The Narayani River rises in the Great Himalaya Range in Nepal, where the Ge/Si ratio of river water is increased due to the input of the Ge-enriched hydrothermal water. Hydrothermal activities are prevailing on the southern Tibetan Plateau, forming a 2000 km long hydrothermal belt [32]. However, the proportion of hydrothermal Ge in river water and the controls and degrees of geochemical processes on the dissolved Ge/Si ratio variation at the basin scale in the southern Tibetan Plateau remains unclear.
In this study, river water and hydrothermal water samples were systematically collected in the Yarlung Tsangpo River, southern Tibetan Plateau. The Ge/Si ratios in the Yarlung Tsangpo River water show a very high level. The spatial and temporal variation of the Ge/Si ratio and the main controls of Ge/Si ratios in the Yarlung Tsangpo River water are discussed to evaluate the influence of hydrothermal input on the riverine Ge/Si ratio. Combing the literature data, the validity of the dissolved Ge/Si ratio as a silicate weathering proxy is evaluated.

2. Materials and Methods

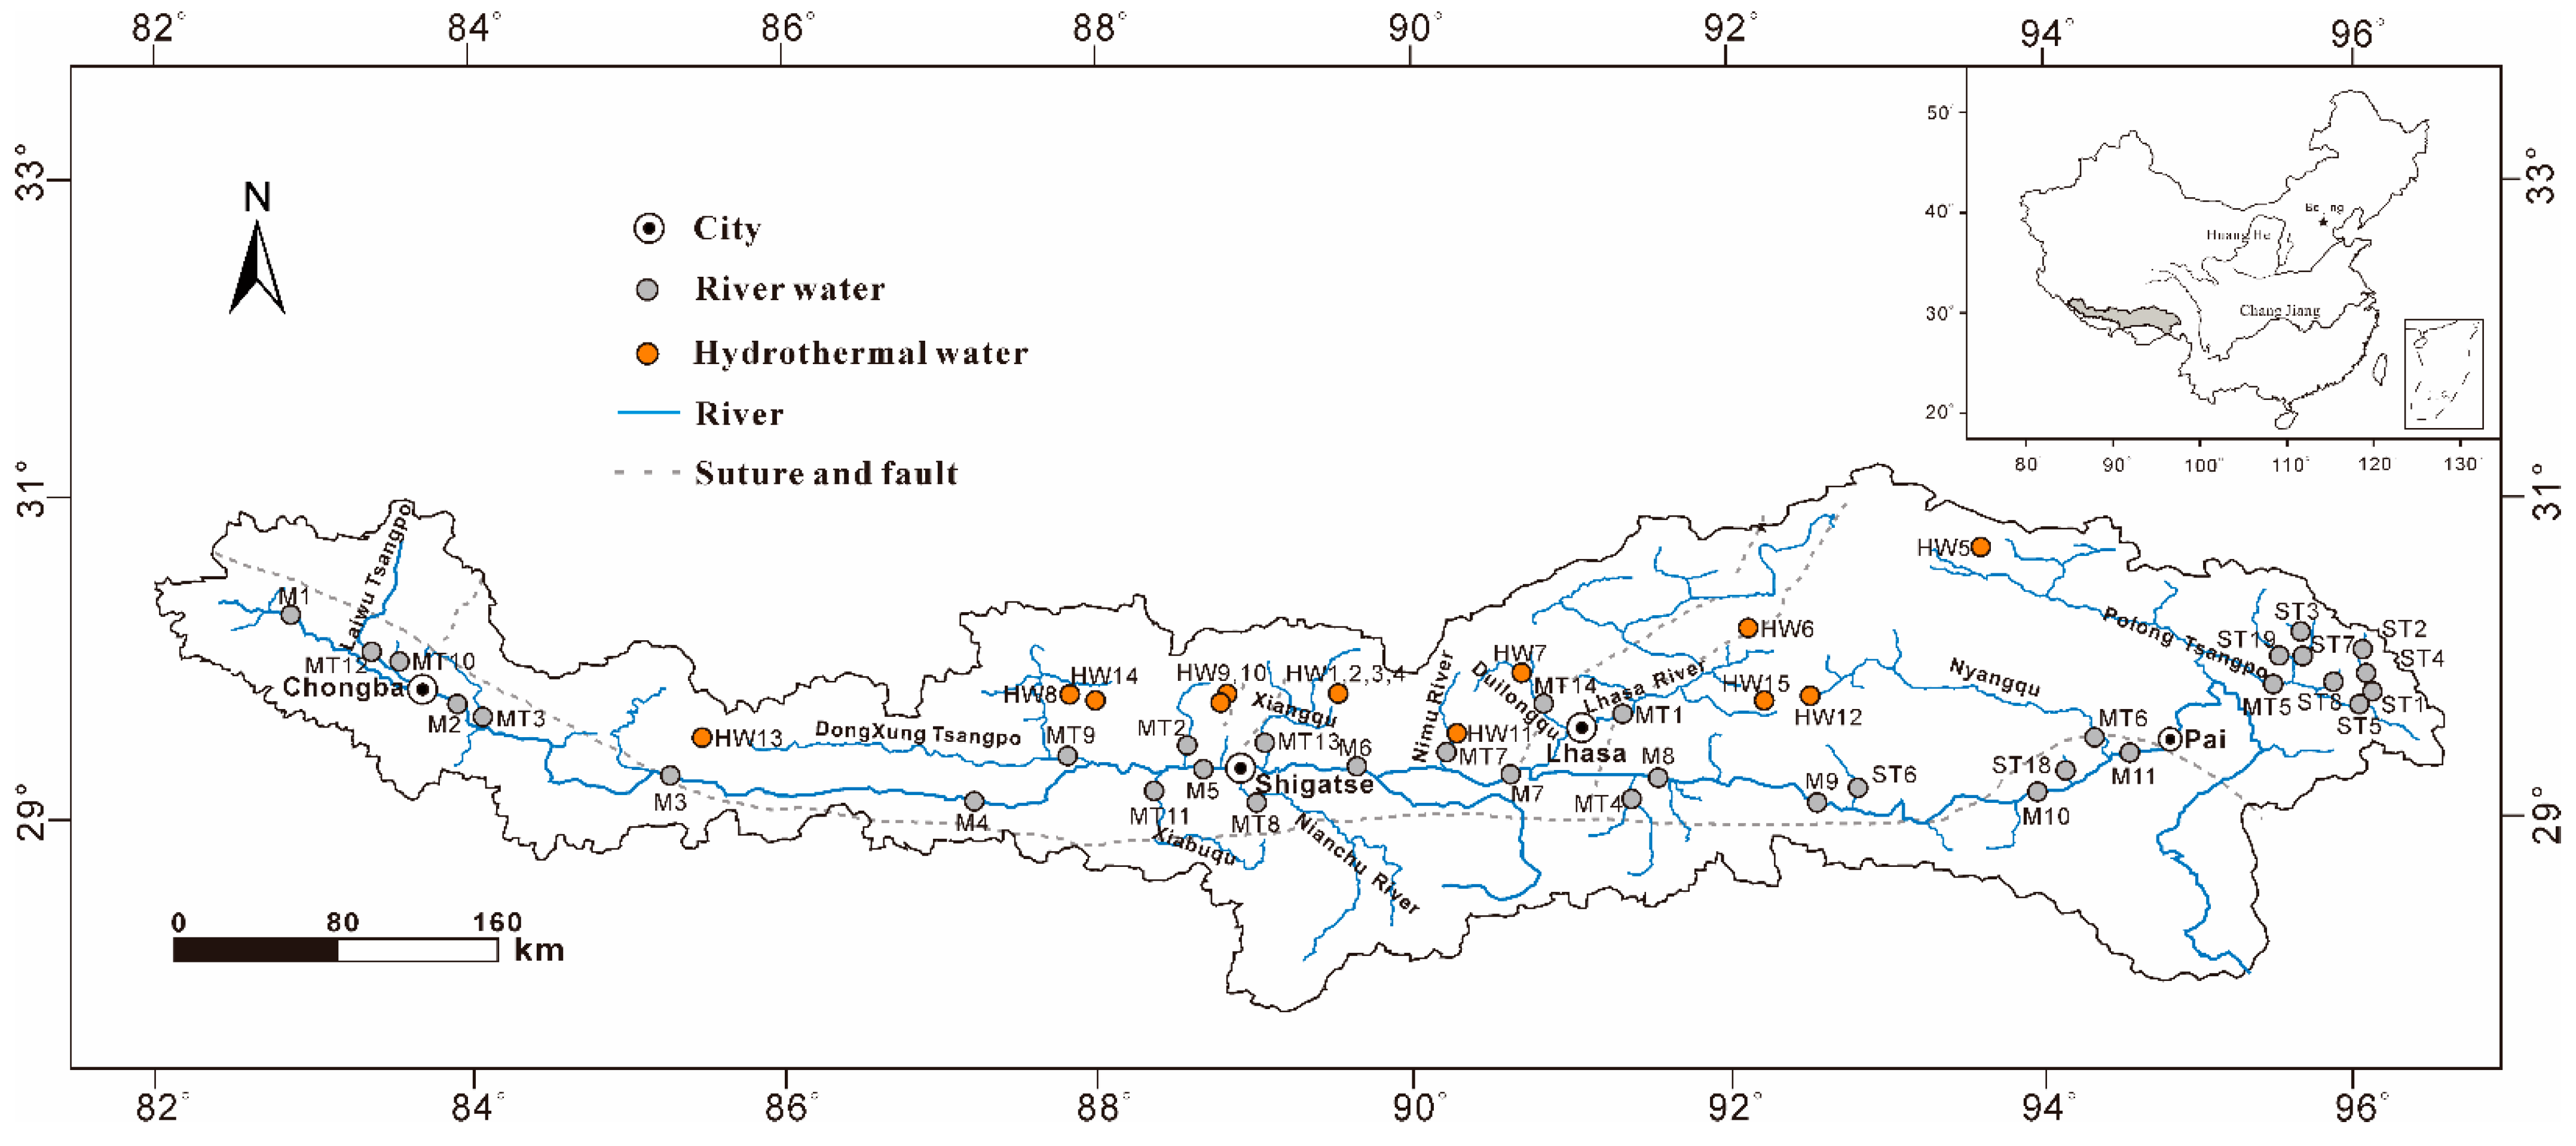
2.1. General Settings

The Yarlung Tsangpo River is located in the southern part of Qinghai-Tibetan Plateau, with an average elevation above 4000 m. It originates from the Jemayangzong Glacier at the northern foothills of the Himalayas and traverses Tibet from west to east. At the Eastern Himalayan Syntaxis, the river changes the direction to the south, forming one of the world’s largest canyons, the Yarlung Tsangpo Grand Canyon. The Yarlung Tsangpo River drains an area of 239,228 km2, accounting for 20% of the total area and about 40.8% of the total river outflow in Tibet [33].
The strong “curtain effect” by the Himalayas prevents the wet moisture from the Indian Ocean. The upper reaches of the Yarlung Tsangpo River are subject to the plateau’s semi-arid climate, and the middle reaches of the Yarlung Tsangpo River are characterized by a temperate climate. The warm and humid airflow from the Indian Ocean is transported through the lower reaches, forming a humid subtropical climate there. The rainfall mainly occurs from June to September, accounting for 65–80% of the annual precipitation [34]. Rainwater, glacial meltwater, and groundwater are the main sources of river water.
The Yarlung Tsangpo Suture Zone separates two distinct tectonic areas in the Yarlung Tsangpo River Basin, which are the Himalayan Block in the south and the Lhasa Block in the north (Figure 1). The northern boundary of the Yarlung Tsangpo Suture Zone is the Gangdise belt, a large and complex rock body consisting of granite, granodiorite, and quartz diorite. The geochemical compositions of the granite rocks in the Gangdise belt are as follows: SiO2 (56.04–77.01%), TiO2 (0.06–1.40%), Al2O3 (12.00–24.13%), FeO (0.41–7.45%), MnO (0.01–0.18%), MgO (0.08–4.69%), CaO (0.54–8.50%), Na2O (2.28–4.79%), K2O (0.39–6.52%), and P2O5 (0.01–0.27%) [35]. A 2000 km length ophiolite belt, which includes ultramafic mafic rocks, diabase, gabbro, quartz schist, marble, and exotic gneiss blocks, is located on the southern side of the Yarlung Tsangpo Suture Zone. The geochemical compositions of the ophiolitic rocks are as follows: SiO2 (45.10–57.32%), TiO2 (0.13–4.41%), Al2O3 (2.88–18.51%), FeO (1.32–13.25%), MnO (0.052–0.28%), MgO (4.58–21.66%), CaO (3.60–23.27%), Na2O (0.10–4.22%), K2O (0.045–7.42%), and P2O5 (0.006–0.879%) [36]. Due to continental collision between the South Asian Plate and the Eurasian Plate, there is an active Tethys Himalayan hydrothermal zone along the Yarlung Tsangpo Suture Zone. This hydrothermal zone possesses the most intensive hydrothermal activities in China and accounts for 80% of the hydrothermal resource in Tibet [37].

2.2. Sampling and Data Measurement

The mainstream and tributary river waters and hydrothermal waters were collected in the Yarlung Tsangpo River in the high-flow period, 2018. Moreover, weekly samples were collected for the Xiangqu River, a tributary in the middle reach of the main channel. The longitude and latitude, as well as the elevation of the sampling site, were recorded by GPS (GARMIN-RINO 650). The water temperature and pH were measured in the field by a portable EC/pH meter (YSI 6600). River water samples were collected at about 5 to 10 cm below the water surface. Water samples were filtered on-site immediately with 0.22 μm Millipore cellulose acetate membranes. Filtered samples were stored in a high-density polyethylene bottle for Cl, SO42− and dissolved Si concentration measurement. These containers were pre-cleaned with HNO3 and ultrapure water (18.2 MΩ). An aliquot of samples was pre-acidified with HNO3 to pH < 2 for Ge concentration determination.
The dissolved silicon concentration was determined using a molybdate-blue method by spectrophotometry. The measurement uncertainty of spectrophotometry was evaluated. The lab-made silicon standard solution with a known concentration was used (n = 50). After the same experimental procedure as the water sample, the measurement uncertainty was within 0.61%. Germanium concentration was measured by Perkin Elmer inductively coupled plasma mass spectrometry (model Elan DRC-e) with an uncertainty of less than 5%. The sample solution was introduced by a PFA MicroFlow nebulizer and a cyclonic spray chamber (PC3 Peltier Chiller) with a gas flow of 0.78 L min−1. The readings and replicate numbers were 1 and 3, respectively. The direct analysis of trace Ge in river samples by ICP-MS is still a challenging task because major isotopes of 70Ge (20.51%), 72Ge (27.4%), and 74Ge (36.56%) are all subject to severe polyatomic interferences. Because 72Ge+ was only subject to polyatomic interferences, 72Ge+ was chosen as the test target. By using CH4 as the reaction gas in the dynamic reaction cell (DRC), the significant interferences, including polyatomic ions 36Ar2+, 56Fe16O+, 40Ar32S+, 40Ar16O2+, and 55Mn16OH+ on 72Ge+ determination could be successfully reduced [38]. Reproducibility (RSD) was generally less than 5% based on repeated analyses. For river water with a relatively low Ge concentration, samples were concentrated 100 times to match the detection limit. In parallel to the sample treatment procedure, all the reagent and procedural blanks were determined. Each calibration curve was evaluated by the analysis of quality control (QC) standards before, during, and after the analysis of each sample group. The chloride and sulfate concentrations were determined by Dionex Ion Chromatography (model ICS-1500) with uncertainty within 8%. All sample analysis in this study was completed in the Hydrochemistry and Environmental Laboratory at the Institute of Geology and Geophysics, Chinese Academic of Sciences.

3. Results

Data in this study are presented in Table 1 and Table S1. The river water is weakly alkaline, and the pH values range from 7.25 to 9.01 (n = 45). The total dissolved solids (TDS) of river water range from 14 to 233 mg/L, Cl concentration of river water range from 46 to 1392 µmol/L, showing a decreasing trend from upstream to downstream. The ranges of Si and Ge concentration of river water are between 17 and 284 µmol/L and 0.1 × 10⁻³ and 4.6 × 10⁻³ µmol/L.
For hydrothermal waters, the TDS shows a large variation from 322 to >2000 mg/L, significantly higher than that of river water. The pH value of hydrothermal water ranges from 6.99 to 8.72, and the temperature varies from 43 to 90 °C. The Si concentration ranges from 598 to 2943 µmol/L, with an average value of 1399 µmol/L, which is ~13 times higher than that of river water.
Spatially, the Ge/Si ratios of river water range from 0.1 to 31.6 µmol/mol (n = 45) (Ge/Si are in 10−6 atom ratios hereinafter), the average value is at 7.8, an order of magnitude higher than the global average (0.6 ± 0.06, [16]). The Ge/Si value of mainstream water ranges from 2.9 to 17.1 (n = 11). The Ge/Si ratios present significant spatial variation in the Yarlung Tsangpo River Basin. In the upper and middle reaches, the river water presents a relatively high level of Ge/Si ratio (average at 13.2 and 8.8, respectively). The maximum Ge/Si value (Ge/Si = 31.60) appears in the Duilongqu (MT14), where the Yambajan Geothermal Field is located. The downstream river waters present relatively low Ge/Si ratios (average at 4.2). The lowest Ge/Si ratio is in Niequ (ST6, Ge/Si = 0.7); this might be because the river water of Niequ is mainly supplied by glacier meltwater and rainwater.
Hydrothermal waters in the Yarlung Tsangpo River Basin are enriched in Ge and Si, which span a large range of 99 to 533 × 10−3 μmol/L and 598 to 2943 µmol/L, respectively. Accordingly, there is a large range of Ge/Si ratio of 124 to 308 (average at 182) in hydrothermal water, which is 23 times higher than the average value of river water.

4. Discussion

4.1. Different Sources of Ge Affecting Ge/Si Ratios in the River

Dissolved Ge in the river is generally derived from fly ash generated from coal combustion, weathering of silicate minerals and sulfide, and hydrothermal water. Coal is an important raw material for Ge [39]. Germanium is easily hydrolyzed and generally exists in the form of Ge(OH)4 in fluid, thus preferentially enriched in river water compared with other trace elements such as Cu and Zn derived from fly ash [31]. Rivers that drain industrial areas present relatively high Ge/Si ratios resulting from coal combustion [40]. However, the anthropogenic source is considered to be negligible in the Yarlung Tsangpo River Basin because the economic structure here is mainly composed of agriculture, animal husbandry, and tourism. A large number of residents still use straw and air-dried cow dung as their energy source [41].
Silicate weathering dominates the dissolved Ge and Si in large rivers such as the Mackenzie River [23] and the Amazon River [42]. The formation of secondary minerals during silicate weathering would lead to redistribution of Ge and Si in soil and river water [26]. Since Ge preferentially incorporates into secondary minerals compared with Si, the Ge/Si ratio of river water would be lower than that of bedrock [20,25]. In addition, the weathering of plagioclase (Ge/Si of ~1.5) to kaolinite (Ge/Si of 4.8–6.1) results in a decrease in the riverine Ge/Si ratio, and kaolinite weathering will lead to an increase in dissolved Ge/Si ratio in the solution [19,20,25]. In the Yarlung Tsangpo River, the water shows an extremely high Ge/Si ratio (average at 7.8), which is significantly higher than that of plagioclase and kaolinite.
Sulfide weathering has been considered as a possible process affecting the Ge/Si ratio in many large rivers such as the Copper River [18], the Red River [7], and the Yellow River [9,31]. In the Yarlung Tsangpo River, there is a strong relationship between dissolved Cl and SO42− in the mainstream (except for samples in the source areas M1 and M2, Figure 2), which suggests that SO42− is mainly derived from hydrothermal spring or evaporite dissolution, rather than sulfide mineral oxidation.
The hydrothermal water samples collected in this river basin have extremely high Si and Ge concentrations and Ge/Si ratios, which might be the result of water–rock interactions during the upwelling of hydrothermal fluids. As shown in Figure 3, Ge, Si, and the temperature of hydrothermal water are positively correlated. Germanium is more enriched than silicon due to the precipitation of quartz during the cooling process of hydrothermal water. Therefore, temperature is the vital factor affecting Ge and Si in hydrothermal waters [43,44].

4.2. Ge/Si Ratios in the Yarlung Tsangpo River

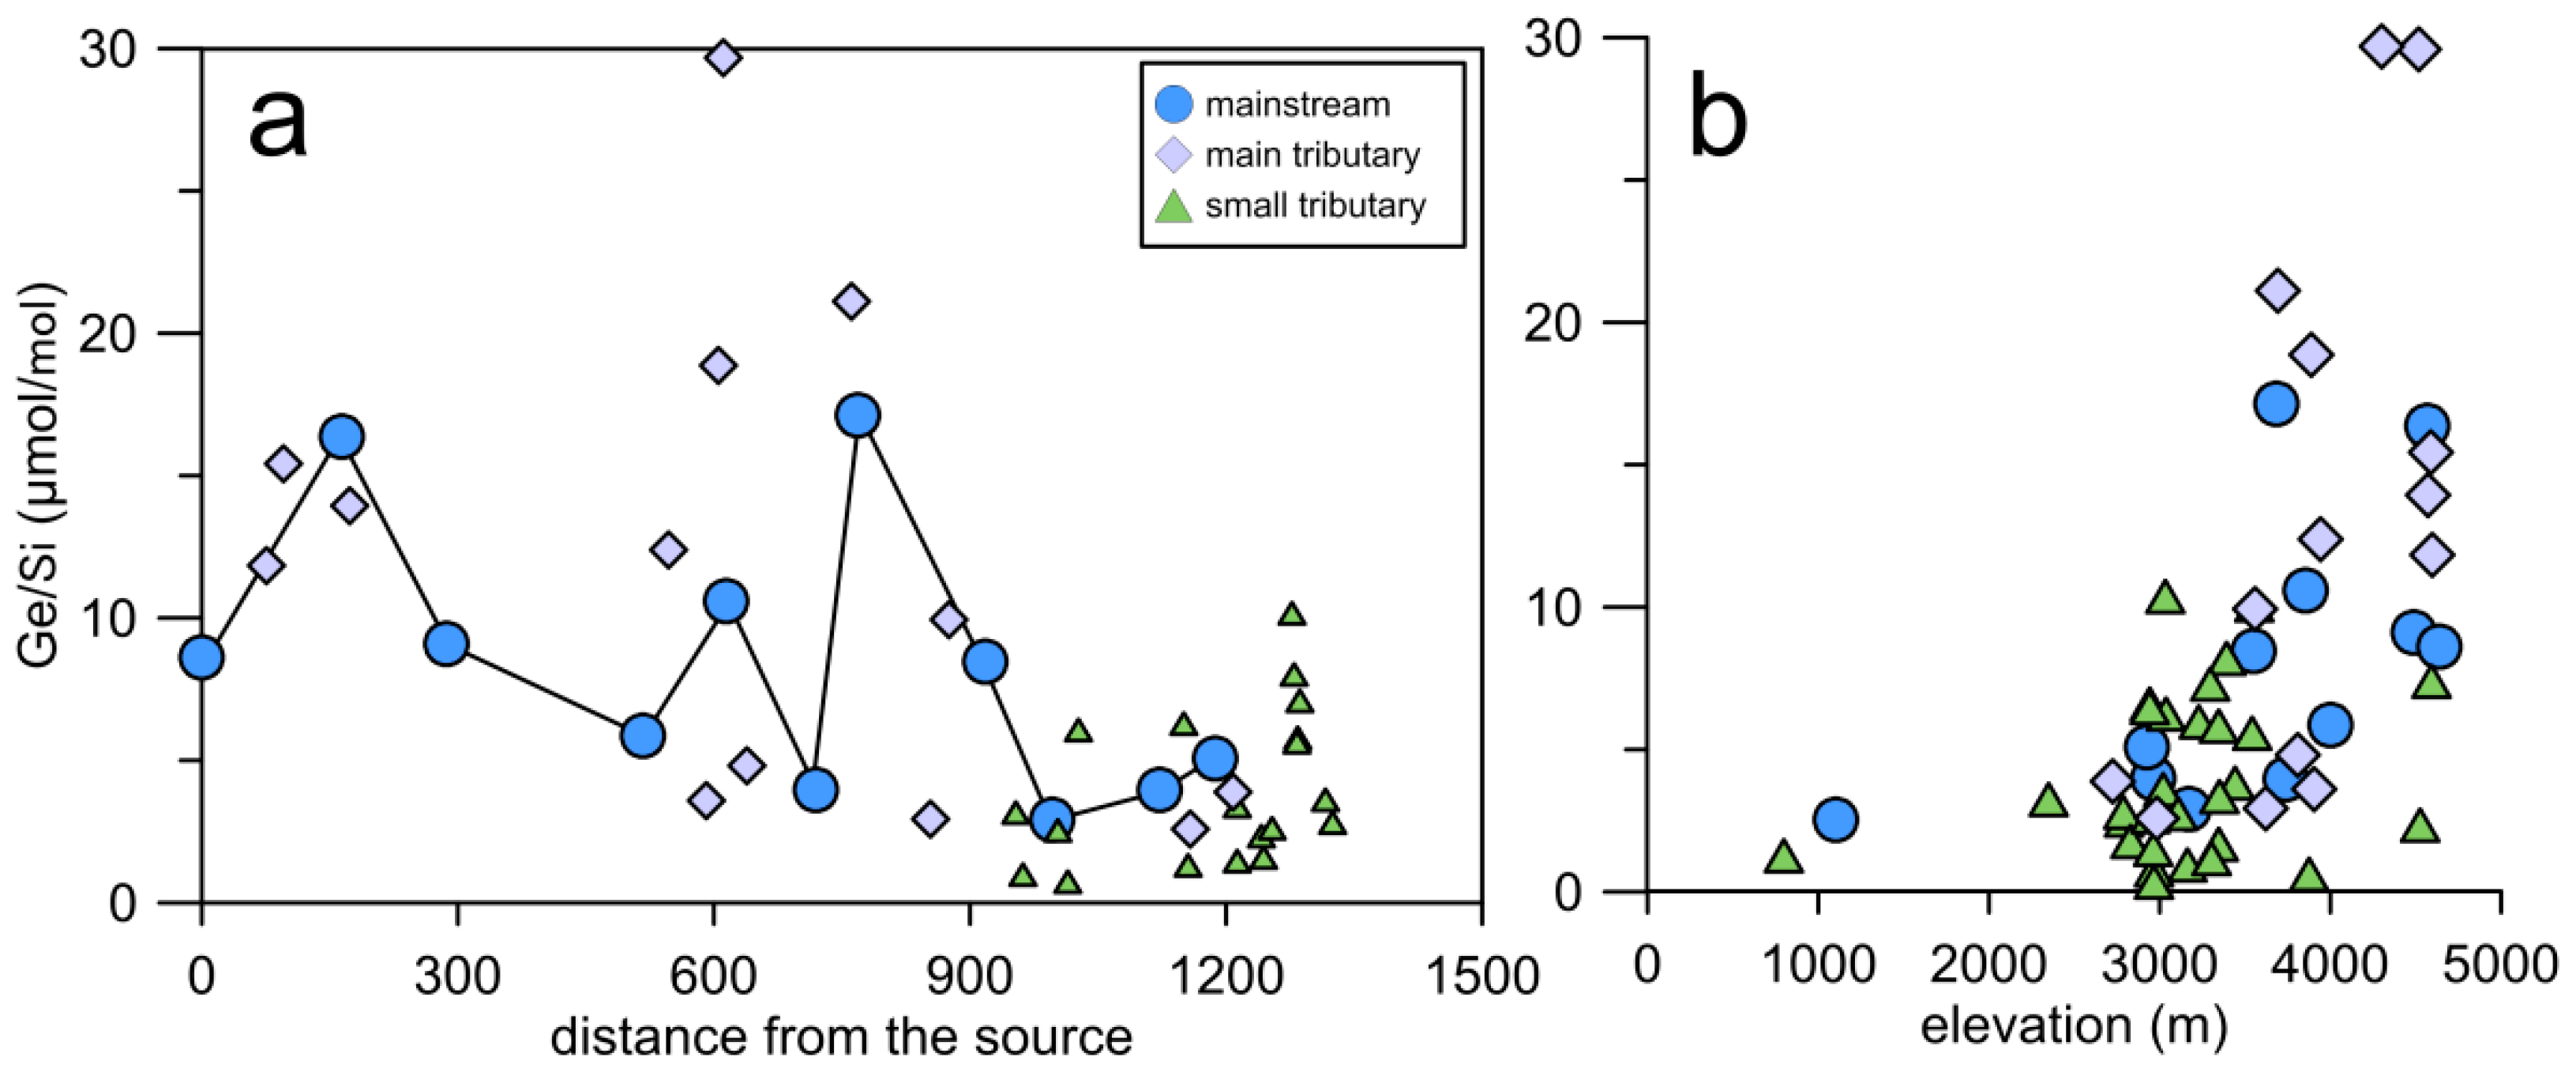
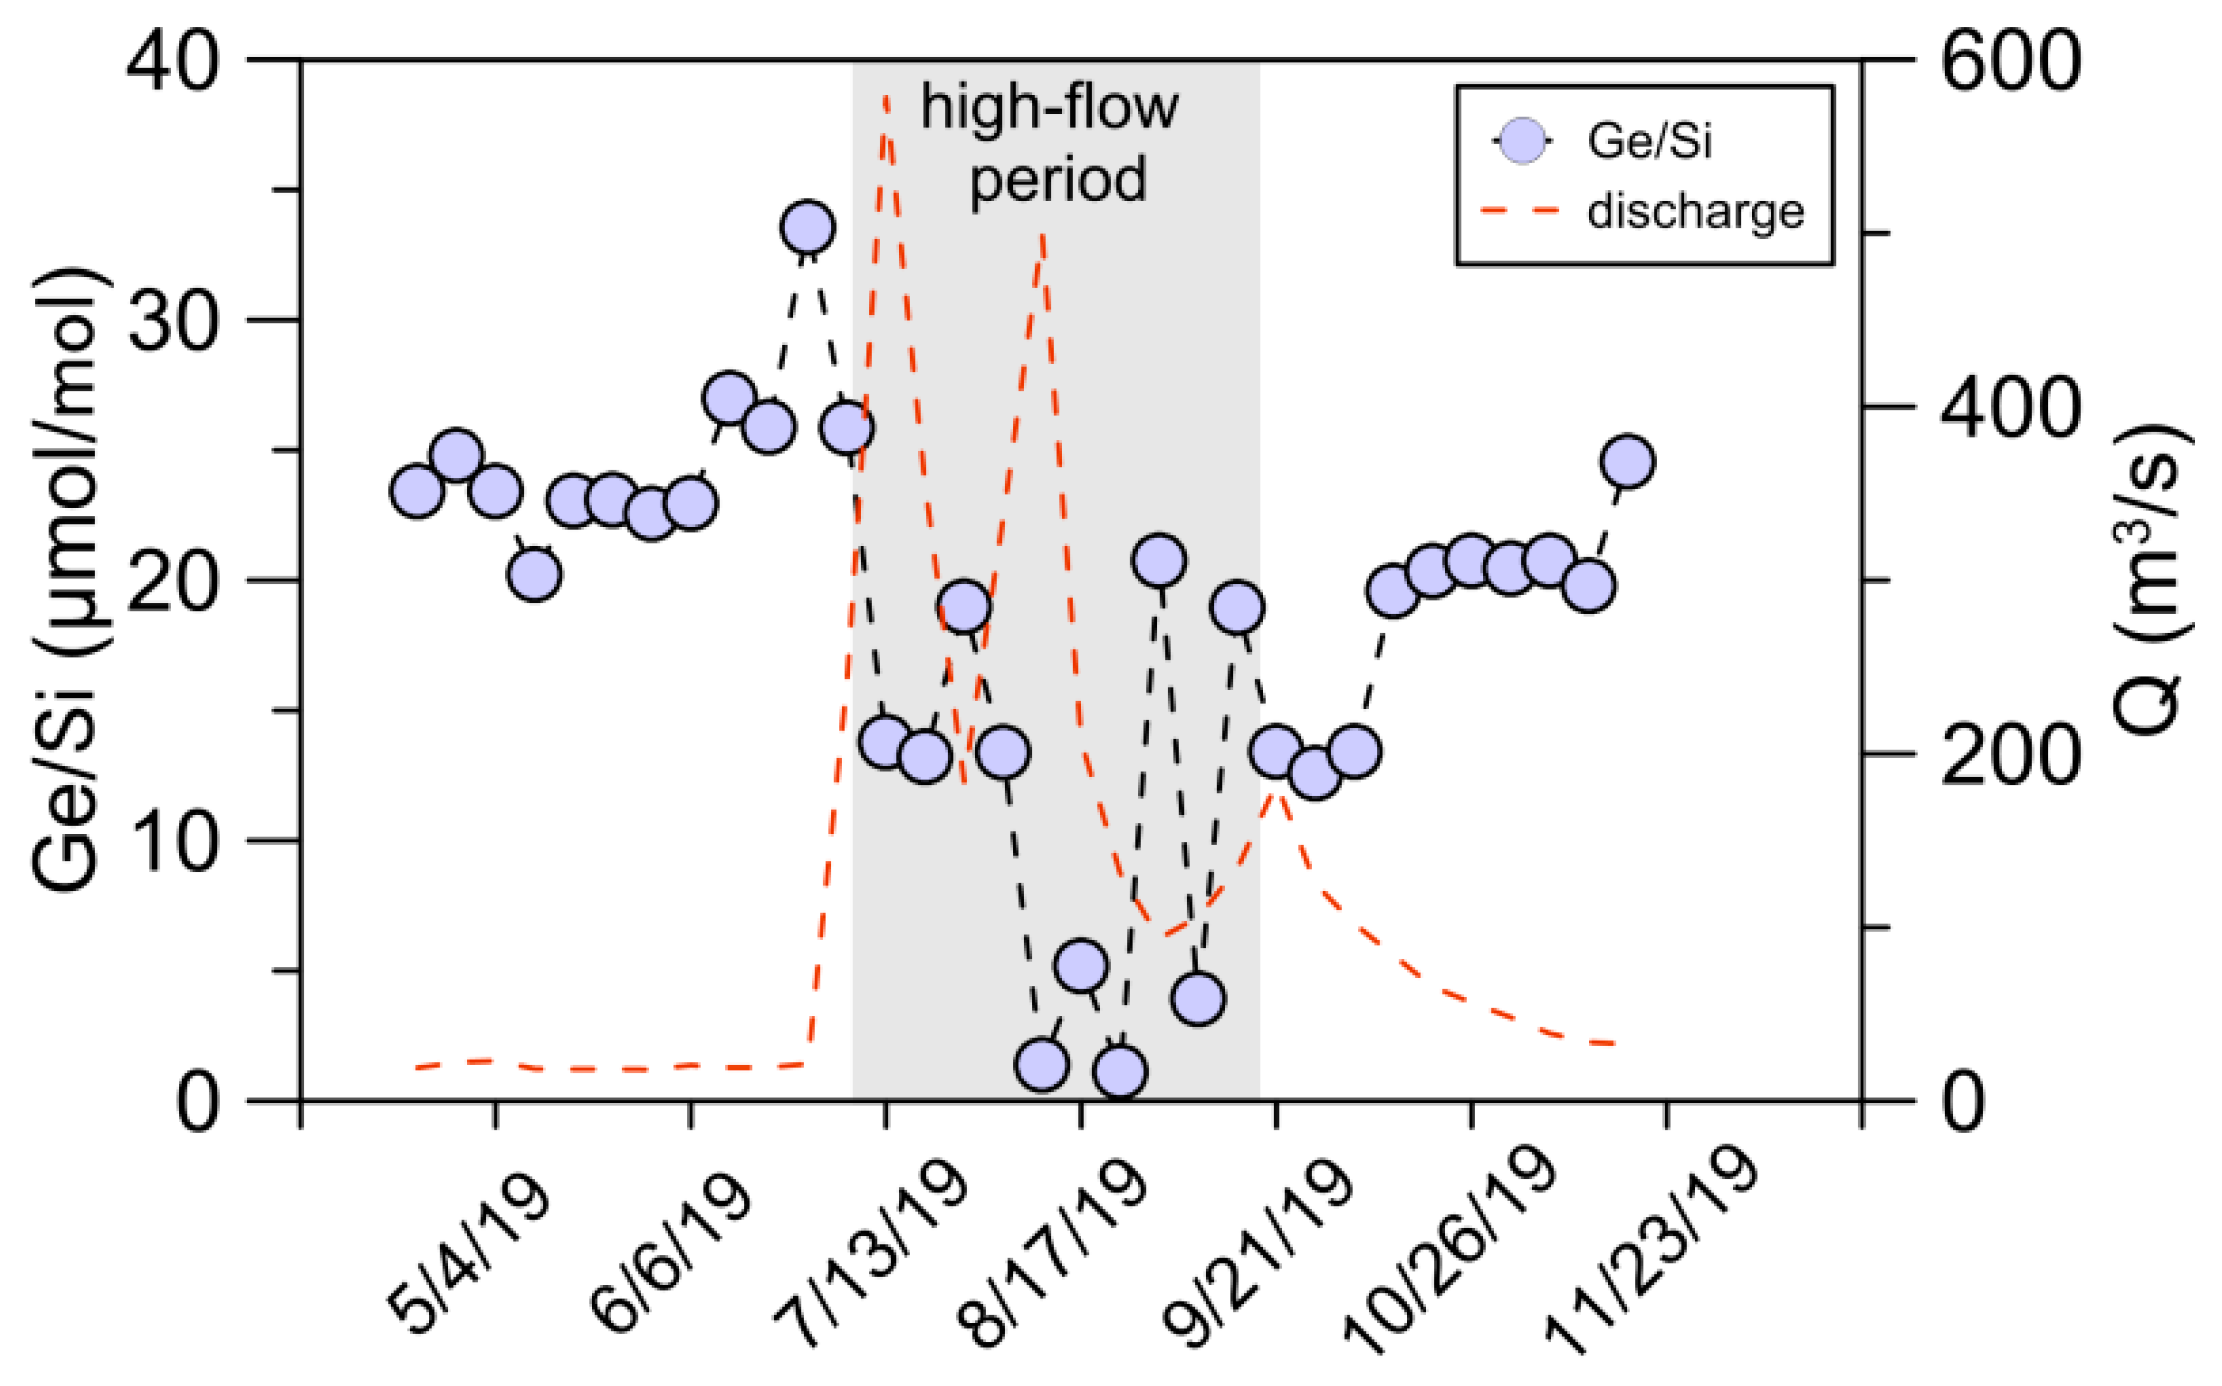
4.2.1. Spatial and Temporal Variations of Riverine Ge/Si Ratio

The Ge/Si ratios of river water in the Yarlung Tsangpo show large variations, roughly decrease from upstream to downstream, and show a positive relation with elevation (Figure 4). The correlations between Ge and Si concentrations and the TDS and Ge/Si ratio of river water suggest that the Ge and Si contents of some river waters are significantly affected by the contribution of hydrothermal water (Figure 5), such as samples MT7, MT13, and MT14, with the highest Ge/Si ratio, the corresponding river flow through the fault zone where hot springs are widely distributed. The river waters with a low Ge/Si ratio are generally small tributaries in the lower reaches of the Yarlung Tsangpo (Figure 4a). Even so, the Ge/Si ratios of these small tributaries (0.1–10.2, average at 3.8) are still far above the world average. One possible explanation is hydrothermal water input. However, the Cl content in these rivers is relatively low, similar to river ST15, the Ge/Si ratio can reach up to 10.2, while the Cl concentration is 66 μmol/L, significantly lower than that in mainstreams, and thus the influence of the input of hydrothermal water is limited. Another potential reason accounting for the relatively high Ge/Si ratios could be sulfide weathering because of the high sulfate concentration (44–1043 µmol/L, average at 276 µmol/L) of river waters. The terrain in these river basins is steep, with some glacier-covered, and erosion is intense; this promotes the sulfide weathering process. As shown in Figure 6, the Ge/Si ratios of the mainstream and the main tributaries of the Yarlung Tsangpo River are affected by hydrothermal water input, while the controls of the Ge/Si ratio of small tributaries downstream are complicated. Besides sulfide weathering, weathering of minerals such as biotite could also affect the dissolved Ge signals in the river water under glacier cover. In Figure 6, there are four rivers located below the global river line, and a strong correlation (R2 = 0.98) between Ge/Si ratios and K+/Na+ ratios are observed in these four samples. Considering biotite is rich in K and Ge (Ge content is 3–4 times higher than the upper continental crust) [25,45], and glacial erosion could lead to exposure of fresh minerals such as biotite, one of the most vulnerable silicate minerals to weathering, though accounting for a small proportion of silicate rocks [18].
The tributary Xiangqu is characterized by the distribution of geothermal springs around its source area. The Ge/Si ratio of weekly time series river water samples in the Xiangqu show an obvious relationship with river discharge. As discharge increases, the Ge/Si ratio of river water decreases (Figure 7). In rivers affected by hydrothermal inputs, such as the mainstream of the Yarlung Tsangpo River, Xiangqu, and Nepali rivers [30], a low Ge/Si ratio of river water is observed at the high-flow period. This suggests the dilution of the hydrothermal water input during the high-flow period. However, in the silicate weathering controlled system, the trend is the opposite. The Ge/Si of river water is generally positively related to river water discharge (Figure 8). The water–rock reaction may be relatively strong in the whole basin, and the clay weathering process, which can produce high Ge/Si ratio fluids, is more obvious during the high-flow season. This is consistent with previous observations [16,20,21].

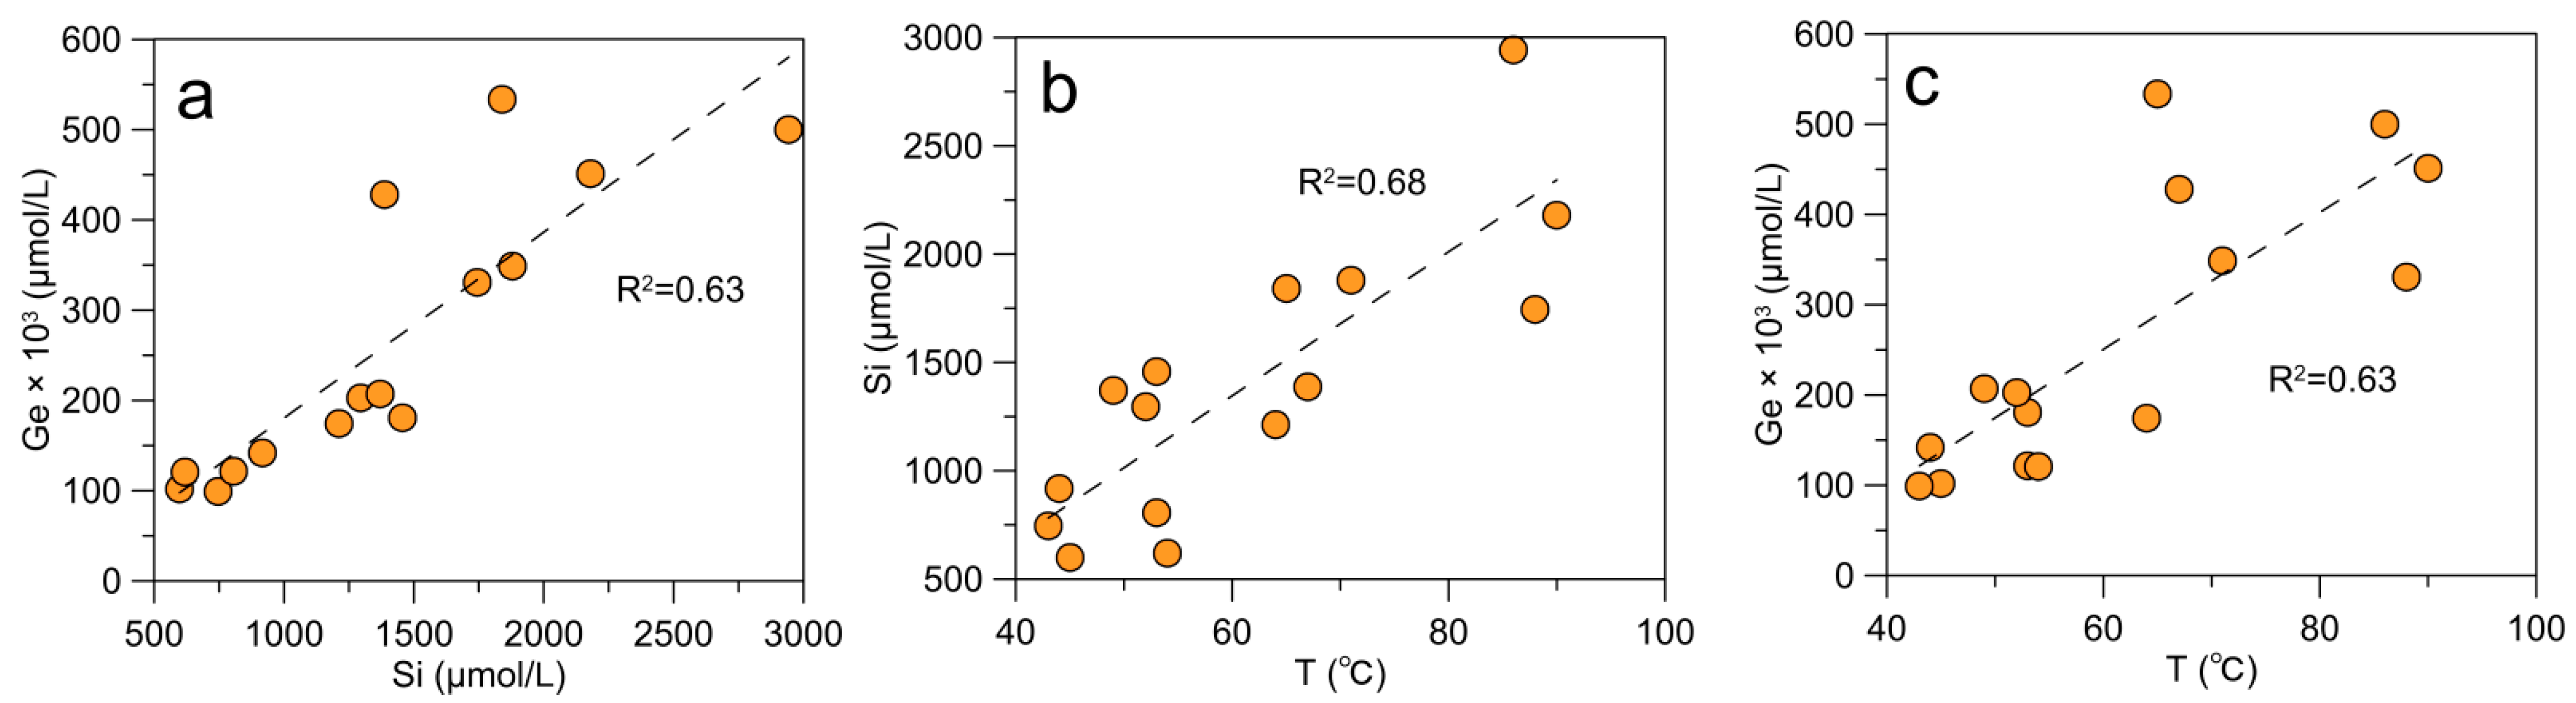
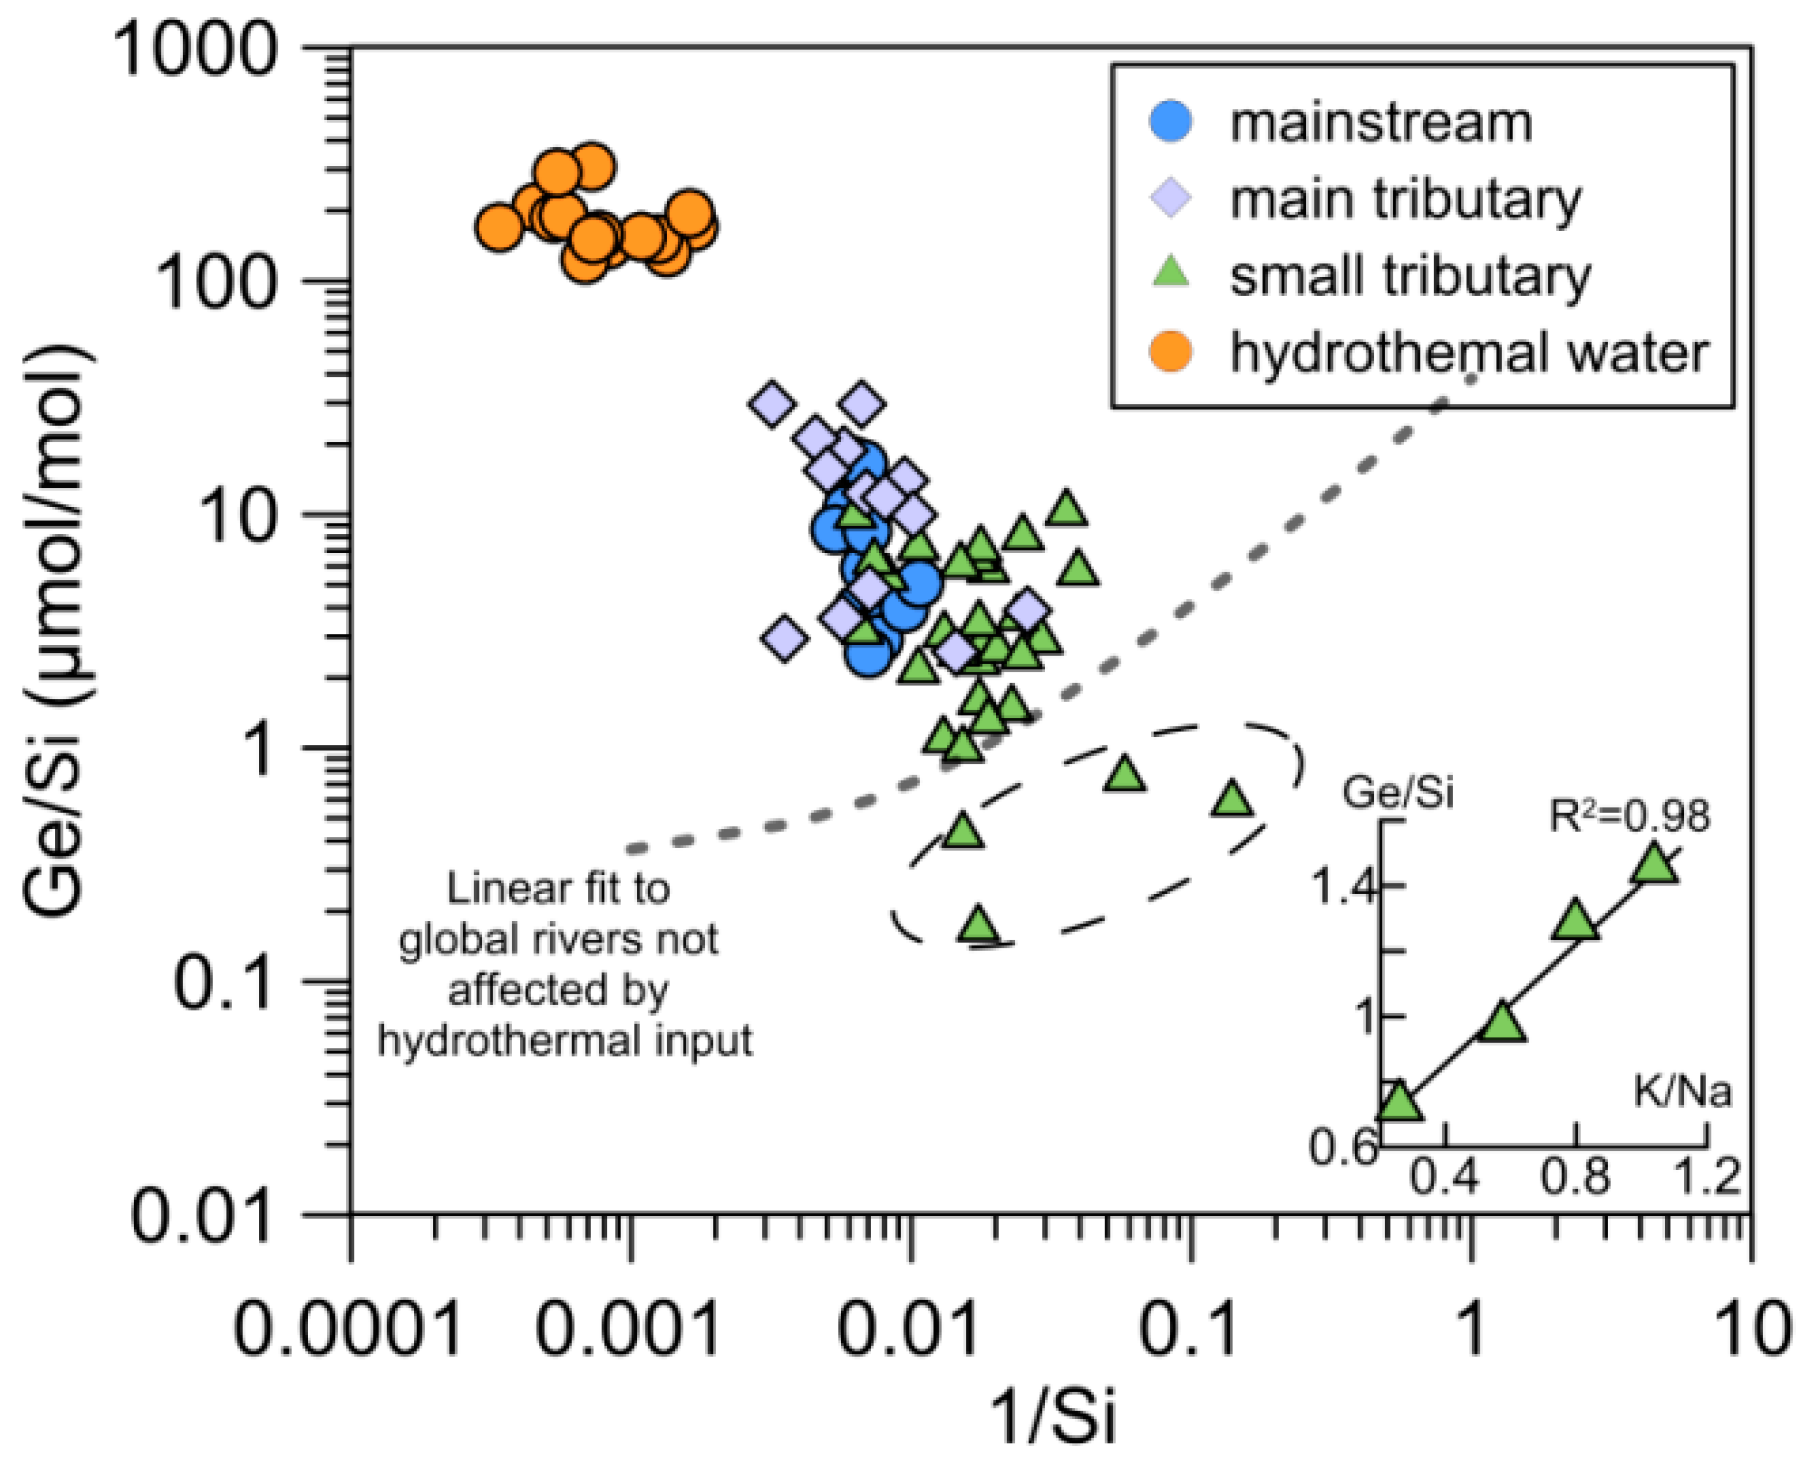
4.2.2. Ge and Si in Rivers Supplied by Hydrothermal Water

Chloride was considered to be conservative during the mixing process of hydrothermal spring and river water and, thus, supposed as an effective tracer of hydrothermal input of Ge and Si in the Yarlung Tsangpo River [43]. Assuming the Cl concentration of river water is the weighted sum of rainfall and hydrothermal contribution, a mean value of rainwater in southeastern Tibet is 6.7 μmol/L [47], and an evapotranspiration factor of 2, the Cl originating from rainfall is 13.4 μmol/L. Riverine Ge and Si derived from hydrothermal water can be calculated according to the following equations:
[Cl]hydr = [Cl]riv − [Cl]atm
[Ge]hydr = [Cl]hydr × (Ge/Cl)hydr
[Si]hydr = [Cl]hydr × (Si/Cl)hydr
where (Ge/Cl)hydr and (Si/Cl)hydr represent the average ratio of hydrothermal waters in each sub-basin in the Yarlung Tsangpo River. [Ge]hydr and [Si]hydr represent riverine Ge and Si derived from hydrothermal waters. Potential uncertainties for calculating [Ge]hydr and [Si]hydr are dominantly from the value of (Ge/Cl)hydr and (Si/Cl)hydr in sub-basins due to the limited numbers of hydrothermal samples. The Xiangqu, Nimu River, Lhasa River, and Duilongqu were selected in this calculation because hydrothermal springs were collected in these basins. We calculated that 4–98% of Si is from hydrothermal water (Table S2). The calculation also shows an unexpected result that [Ge]hydr is much higher than dissolved Ge in the river water. This disparity suggests that a significant amount of Ge has been lost during its transportation from spring to river. A potential Ge-enriched component is clays [16,25,30]. Moreover, hydrothermal water could contain high contents of sulfide and iron—when it comes to the surface, the sulfur is deposited as sulfate, and iron deposited as Fe-oxyhydroxide, which are also enriched in Ge [39]. Thus, there should be two possible explanations for significant Ge depletion: absorbed on clays in soils and sediments and deposited in sulfate and Fe-oxyhydroxides. It is also estimated that at least 11–88% of Ge incorporates into the solid phase in these river basins (Table S2). This is similar to the result that 70–90% of Ge in seafloor hydrothermal water hosts in solid during Fe-oxyhydroxides precipitation [48]. Such a proportion of Ge incorporated into solid is much more than clay sequestration during silicate weathering [28]. Nevertheless, the Ge/Si ratio of rivers on the Tibetan Plateau is ~10 times higher than that of the global average; thus, the Tibetan Plateau tectonism during the Cenozoic, which could enhance hydrothermal activity, might increase the Ge/Si ratio of the continental rivers and seawater.

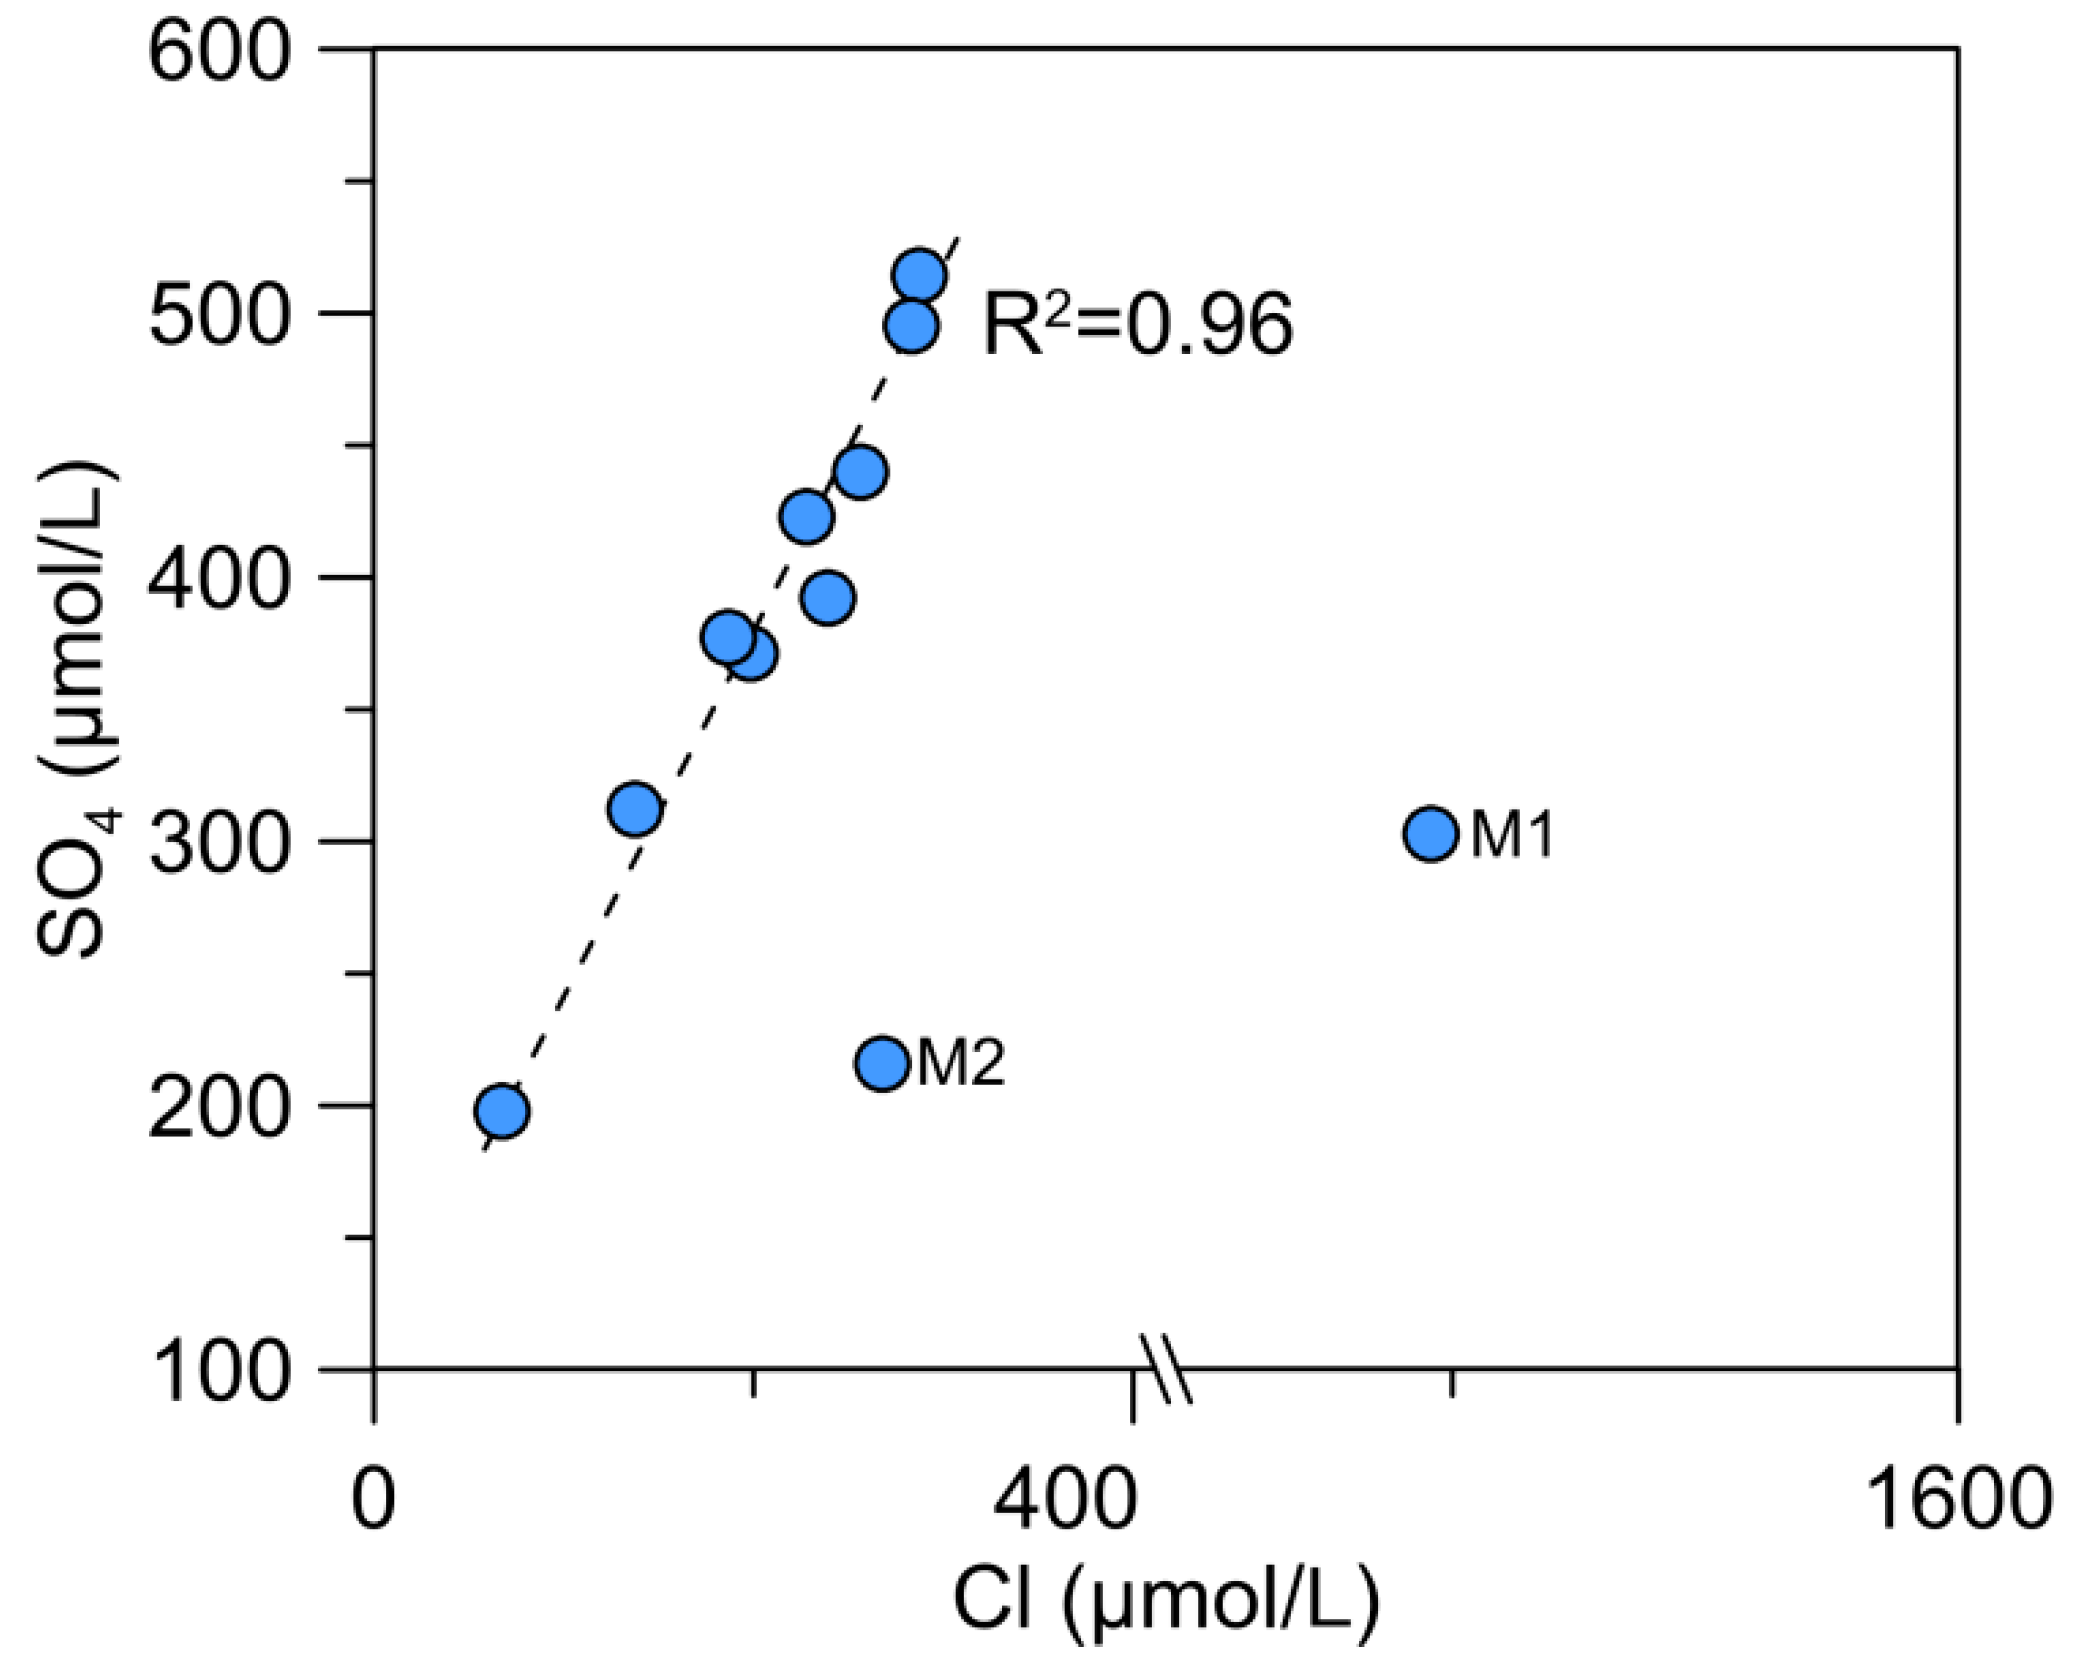
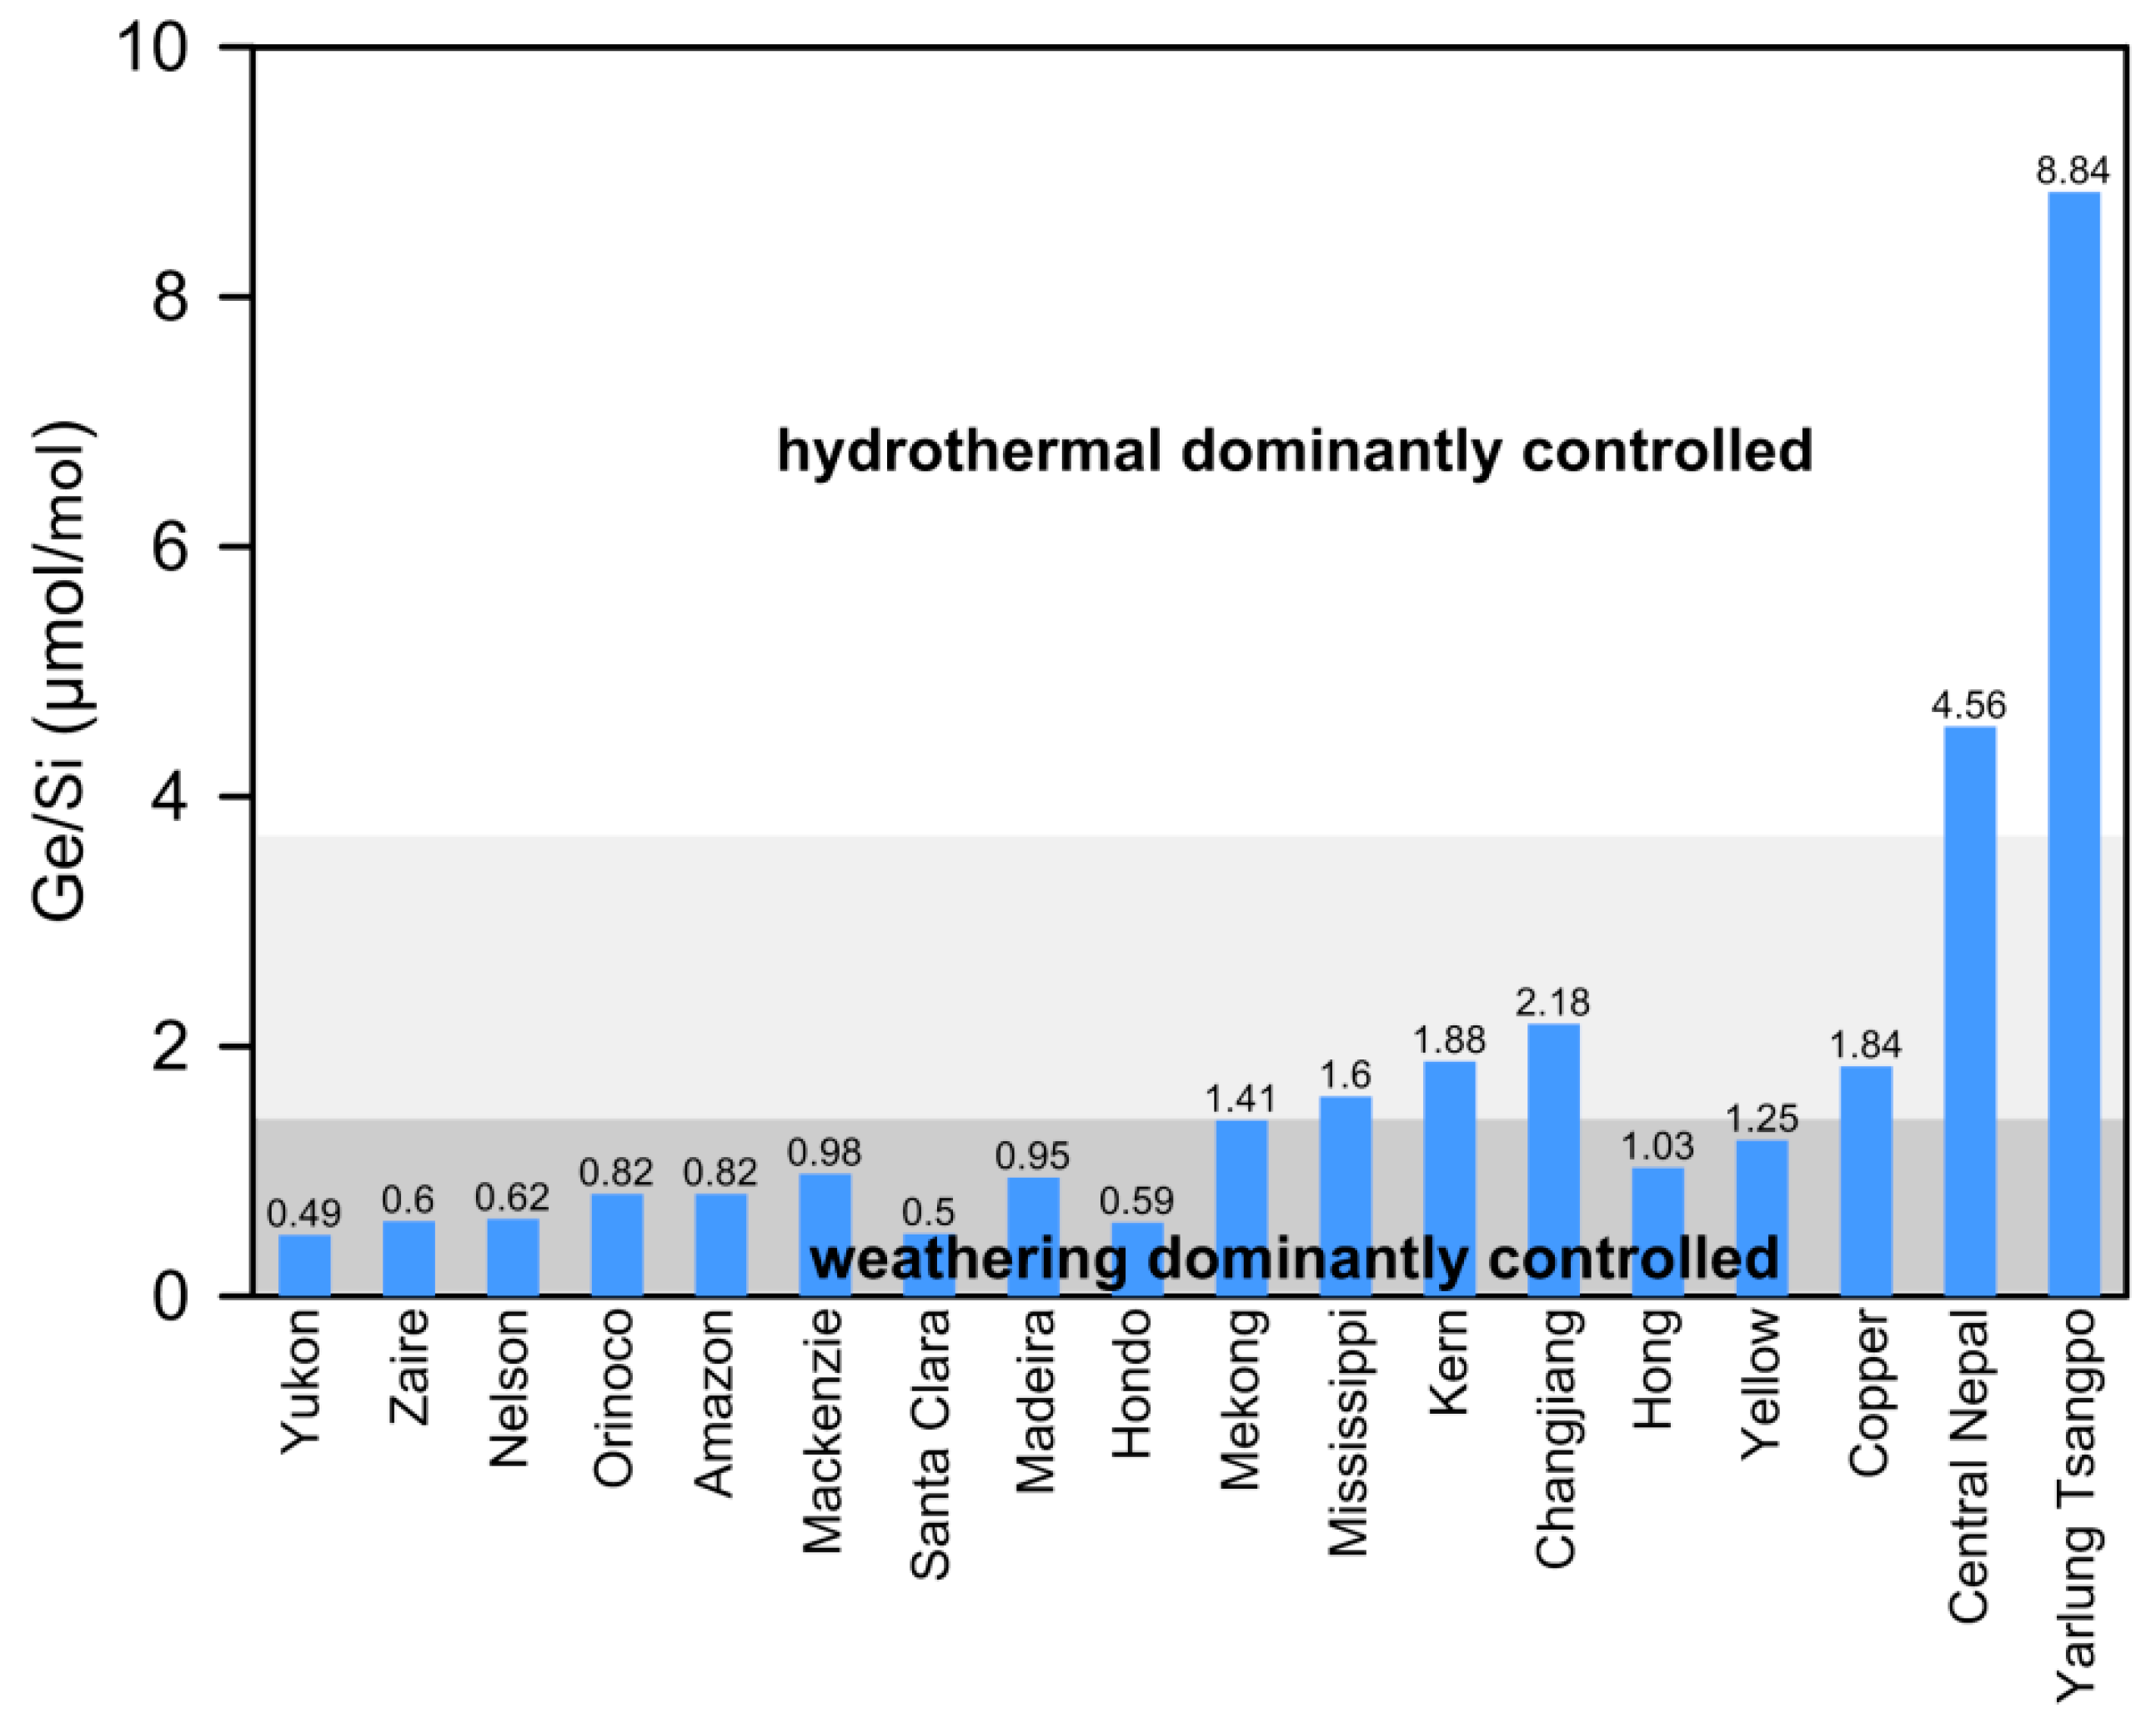
4.3. Using Ge/Si Ratio to Trace Geochemical Processes

The Ge/Si ratios of large rivers in the different climatic and geological backgrounds are mainly controlled by weathering processes, hydrothermal input, and anthropogenic activity such as coal combustion [25,31,42]. Compared with other large rivers in the world, the Yarlung Tsangpo River waters present the highest average Ge/Si ratio.
As Figure 9 shows, the average value of Ge/Si ratios in rivers such as the Amazon River, Mackenzie River, Yukong River, and the Orinoco River are close to the world average (Ge/Si = 0.6 ± 0.06). These rivers drain regions without obvious input from hydrothermal and industrial activity, and the Ge/Si ratios are mainly controlled by silicate weathering processes [7,9,16,23,42]. River water in the eastern Qinghai-Tibet Plateau (Salween, Mekong, and the upstream of Yangtze) show relatively high Ge/Si values (average at ~5.59, [31]). It is similar to Ge/Si in the Yarlung Tsangpo River, where hydrothermal water discharge dominates the riverine Ge/Si ratio.
Compiling these results, a simplified category can be made for riverine Ge/Si ratios (Figure 9). Two characteristic Ge/Si values were chosen as the division standard, which is 1.5 (average value of primary silicate rock) and 3.75 (average Ge/Si ratio of secondary aluminosilicate clays) [25,40]. Generally, for river water, the Ge/Si ratio is lower than ~1.5, and the Ge/Si ratios of river water reflect the degree of silicate weathering. For rivers, the Ge/Si ratio is higher than ~3.75, and the hydrothermal effect should be regarded as the dominant control. Additionally, the impact of sulfide weathering on the dissolved Ge/Si ratios should be considered for a basin with a relatively high sulfate concentration. The controlling factors of river waters in this range need to be discussed in terms of the distribution of hydrothermal waters and sulfide minerals weathering. In addition, the controlling factors of dissolved Ge/Si ratio are complicated in rivers with Ge/Si ratios ranging from ~1.5 to ~3.75. It might be the combined effect of silicate weathering and hydrothermal input and possibly involve anthropogenic activities. For instance, Mississippi River water is apparently affected by urban and industrial input, which increased the Ge concentration of river water to 266 × 10−3 μmol/L, and the Ge/Si ratio is 1.60 [23]. Changjiang River water is influenced by extensive irrigation and rice cultivation, which could cause a decrease in Si concentration in the river water; the Ge/Si ratio in the Changjiang River is 2.18 [49].

5. Conclusions

The spatial and temporal variations of Ge/Si ratios indicate a significant hydrothermal water impact on the riverine Ge/Si ratios in the river basin. According to the mass balance equation, the calculated riverine Ge sourced from hydrothermal waters is much higher than measured Ge in the river water. This indicates that a large amount of Ge has been depleted in the river system. The absorption of Ge on clays or deposition in sulfate and Fe-oxyhydroxide minerals could be a plausible explanation for such significant Ge depletion. The Ge/Si ratios of the Yarlung Tsangpo River water evidently reflect the discharge of hydrothermal water, which indicates that the hydrothermal water contribution should be carefully considered when using the Ge/Si ratio to trace silicate weathering in the Yarlung Tsangpo River Basin.

Supplementary Materials

The following are available online at https://www.mdpi.com/article/10.3390/w14020181/s1, Table S1: time series variations in Ge/Si ratio of river water in Xiangqu and the mainstream of the Yarlung Tsangpo River, Table S2: calculation of Gehydr, Sihydr, and Gelost.

Author Contributions

Conceptualization, Y.W. and Z.X.; methodology, Y.W., T.Z., Z.X. and J.Z.; software, Y.W.; validation, Y.W., T.Z. and Z.X.; formal analysis, Y.W. and T.Z.; investigation, Y.W., T.Z., Z.X. and H.S.; resources, Z.X.; data curation, Y.W., T.Z., Z.X., H.S. and J.Z.; writing—original draft preparation, Y.W., T.Z. and Z.X.; writing—review and editing, Y.W., T.Z., Z.X., H.S. and J.Z.; visualization, Y.W., T.Z., Z.X., H.S. and J.Z.; supervision, Z.X.; project administration, Z.X.; funding acquisition, Z.X. All authors have read and agreed to the published version of the manuscript.

Funding

This research was financially supported by the National Natural Science Foundation of China (Grant Nos. 91747202, 41730857, 42003015), the “Strategic Priority Research Program” of the Chinese Academy of Sciences (Grant No. XDB26000000) and the National Key Research and Development Program of China (Grant No. 2020YFA0607700).

Institutional Review Board Statement

Not applicable.

Informed Consent Statement

Not applicable.

Data Availability Statement

The data presented in this study are available on request from the corresponding author.

Conflicts of Interest

The authors declare no conflict of interest.

References

  1. Berner, R.A.; Lasaga, A.C.; Garrels, R.M. The carbonate-silicate geochemical cycle and its effect on atmospheric carbon dioxide over the past 100 million years. Am. J. Sci. 1983, 283, 641–683. [Google Scholar] [CrossRef]
  2. Walker, J.C.G.; Hays, P.B.; Kasting, J.F. A negative feedback mechanism for the long-term stabilization of Earth’s surface temperature. J. Geophys. Res. Ocean. 1981, 86, 9776–9782. [Google Scholar] [CrossRef]
  3. Raymo, M.E.; Ruddiman, W.F. Tectonic forcing of late Cenozoic climate. Nature 1992, 359, 117–122. [Google Scholar] [CrossRef]
  4. France-Lanord, C.; Derry, L.A. Organic carbon burial forcing of the carbon cycle from Himalayan erosion. Nature 1997, 390, 65–67. [Google Scholar] [CrossRef]
  5. Gaillardet, J.; Dupré, B.; Louvat, P.; Allègre, C.J. Global silicate weathering and CO2 consumption rates deduced from the chemistry of large rivers. Chem. Geol. 1999, 159, 3–30. [Google Scholar] [CrossRef]
  6. Hren, M.T.; Chamberlain, C.P.; Hilley, G.E.; Blisniuk, P.M.; Bookhagen, B. Major ion chemistry of the Yarlung Tsangpo–Brahmaputra river: Chemical weathering, erosion, and CO2 consumption in the southern Tibetan plateau and eastern syntaxis of the Himalaya. Geochim. Cosmochim. Acta 2007, 71, 2907–2935. [Google Scholar] [CrossRef] [Green Version]
  7. Moon, S.; Huh, Y.; Qin, J.; van Pho, N. Chemical weathering in the Hong (Red) River basin: Rates of silicate weathering and their controlling factors. Geochim. Cosmochim. Acta 2007, 71, 1411–1430. [Google Scholar] [CrossRef]
  8. Noh, H.; Huh, Y.; Qin, J.; Ellis, A. Chemical weathering in the Three Rivers region of Eastern Tibet. Geochim. Cosmochim. Acta 2009, 73, 1857–1877. [Google Scholar] [CrossRef]
  9. Wu, L.; Huh, Y.; Qin, J.; Du, G.; van Der Lee, S. Chemical weathering in the Upper Huang He (Yellow River) draining the eastern Qinghai-Tibet Plateau. Geochim. Cosmochim. Acta 2005, 69, 5279–5294. [Google Scholar] [CrossRef]
  10. Huh, Y. Chemical weathering and climate—A global experiment: A review. Geosci. J. 2003, 7, 277–288. [Google Scholar] [CrossRef]
  11. Struyf, E.; Smis, A.; Van Damme, S.; Meire, P.; Conley, D.J. The Global Biogeochemical Silicon Cycle. Silicon 2009, 1, 207–213. [Google Scholar] [CrossRef]
  12. Han, G.; Liu, C.-Q. Water geochemistry controlled by carbonate dissolution: A study of the river waters draining karst-dominated terrain, Guizhou Province, China. Chem. Geol. 2004, 204, 1–21. [Google Scholar] [CrossRef]
  13. El Mrissani, S.; Haida, S.; Probst, J.-L.; Probst, A. Multi-Indices Assessment of Origin and Controlling Factors of Trace Metals in River Sediments from a Semi-Arid Carbonated Basin (the Sebou Basin, Morocco). Water 2021, 13, 3203. [Google Scholar] [CrossRef]
  14. Alexakis, D. Diagnosis of stream sediment quality and assessment of toxic element contamination sources in East Attica, Greece. Environ. Earth Sci. 2011, 63, 1369–1383. [Google Scholar] [CrossRef]
  15. Papadopoulou-Vrynioti, K.; Alexakis, D.; Bathrellos, G.D.; Skilodimou, H.D.; Vryniotis, D.; Vassiliades, E.; Gamvroula, D. Distribution of trace elements in stream sediments of Arta plain (western Hellas): The influence of geomorphological parameters. J. Geochem. Explor. 2013, 134, 17–26. [Google Scholar] [CrossRef]
  16. Mortlock, R.A.; Frohlich, P.N. Continental weathering of germanium: GeSi in the global river discharge. Geochim. Cosmochim. Acta 1987, 51, 2075–2082. [Google Scholar] [CrossRef]
  17. Froelich, P.N.; Blanc, V.; Mortlock, R.A.; Chillrud, S.N.; Dunstan, W.; Udomkit, A.; Peng, T.-H. River Fluxes of Dissolved Silica to the Ocean Were Higher during Glacials: Ge/Si In Diatoms, Rivers, and Oceans. Paleoceanogr. Paleoclimatol. 1992, 7, 739–767. [Google Scholar] [CrossRef]
  18. Anders, A.M.; Sletten, R.S.; Derry, L.A.; Hallet, B. Germanium/silicon ratios in the Copper River Basin, Alaska: Weathering and partitioning in periglacial versus glacial environments. J. Geophys. Res. Earth. Surf. 2003, 108. [Google Scholar] [CrossRef]
  19. Derry, L.A.; Pett-Ridge, J.C.; Kurtz, A.C.; Troester, J.W. Ge/Si and 87Sr/86Sr tracers of weathering reactions and hydrologic pathways in a tropical granitoid system. J. Geochem. Explor. 2006, 88, 271–274. [Google Scholar] [CrossRef]
  20. Lugolobi, F.; Kurtz, A.C.; Derry, L.A. Germanium–silicon fractionation in a tropical, granitic weathering environment. Geochim. Cosmochim. Acta 2010, 74, 1294–1308. [Google Scholar] [CrossRef]
  21. Kurtz, A.C.; Lugolobi, F.; Salvucci, G. Germanium-silicon as a flow path tracer: Application to the Rio Icacos watershed. Water Resour. Res. 2011, 47, W06516. [Google Scholar] [CrossRef]
  22. Meek, K.; Derry, L.; Sparks, J.; Cathles, L. 87Sr/86Sr, Ca/Sr, and Ge/Si ratios as tracers of solute sources and biogeochemical cycling at a temperate forested shale catchment, central Pennsylvania, USA. Chem. Geol. 2016, 445, 84–102. [Google Scholar] [CrossRef]
  23. Baronas, J.J.; Torres, M.A.; West, A.J.; Rouxel, O.; Georg, B.; Bouchez, J.; Gaillardet, J.; Hammond, D.E. Ge and Si isotope signatures in rivers: A quantitative multi-proxy approach. Earth Planet. Sci. Lett. 2018, 503, 194–215. [Google Scholar] [CrossRef] [Green Version]
  24. Goldschmidt, V.M. Concerning the crystallo-chemical and geochemical behaviour of Germanium. Naturwissenschaften 1926, 14, 295–297. [Google Scholar] [CrossRef]
  25. Kurtz, A.C.; Derry, L.A.; Chadwick, O.A. Germanium-silicon fractionation in the weathering environment. Geochim. Cosmochim. Acta 2002, 66, 1525–1537. [Google Scholar] [CrossRef]
  26. Scribner, A.M.; Kurtz, A.C.; Chadwick, O.A. Germanium sequestration by soil: Targeting the roles of secondary clays and Fe-oxyhydroxides. Earth Planet. Sci. Lett. 2006, 243, 760–770. [Google Scholar] [CrossRef]
  27. Opfergelt, S.; Cardinal, D.; André, L.; Delvigne, C.; Bremond, L.; Delvaux, B. Variations of δ30Si and Ge/Si with weathering and biogenic input in tropical basaltic ash soils under monoculture. Geochim. Cosmochim. Acta 2010, 74, 225–240. [Google Scholar] [CrossRef]
  28. Qi, H.-W.; Hu, R.-Z.; Jiang, K.; Zhou, T.; Liu, Y.-F.; Xiong, Y.-W. Germanium isotopes and Ge/Si fractionation under extreme tropical weathering of basalts from the Hainan Island, South China. Geochim. Cosmochim. Acta 2019, 253, 249–266. [Google Scholar] [CrossRef]
  29. Perez-Fodich, A.; Derry, L.A. A model for germanium-silicon equilibrium fractionation in kaolinite. Geochim. Cosmochim. Acta 2020, 288, 199–213. [Google Scholar] [CrossRef]
  30. Evans, M.J.; Derry, L.A.; France-Lanord, C. Geothermal fluxes of alkalinity in the Narayani river system of central Nepal. Geochem. Geophys. Geosyst. 2004, 5, Q08011. [Google Scholar] [CrossRef]
  31. Han, Y.; Huh, Y.; Derry, L. Ge/Si ratios indicating hydrothermal and sulfide weathering input to rivers of the Eastern Tibetan Plateau and Mt. Baekdu. Chem. Geol. 2015, 410, 40–52. [Google Scholar] [CrossRef] [Green Version]
  32. Zhang, M.; Guo, Z.; Zhang, L.; Sun, Y.; Cheng, Z. Geochemical constraints on origin of hydrothermal volatiles from southern Tibet and the Himalayas: Understanding the degassing systems in the India-Asia continental subduction zone. Chem. Geol. 2017, 469, 19–33. [Google Scholar] [CrossRef]
  33. Liu, T.-C. Hydrological features of the Yarlung Tsangpo River. Acta Geogr. Sin. 1999, 54, 157–164, (In Chinese with English Abstract). [Google Scholar]
  34. Huang, X.; Sillanpää, M.; Gjessing, E.T.; Peräniemi, S.; Vogt, R.D. Water quality in the southern Tibetan Plateau: Chemical evaluation of the Yarlung Tsangpo (Brahmaputra). River Res. Appl. 2011, 27, 113–121. [Google Scholar] [CrossRef]
  35. Chen, T. Geochemistry of the Qushui Intrusive of Gangdese in Tibet and Its Implications for Magma Mixing. Master’s Thesis, China University of Geosciences, Beijing, China, 2006. (In Chinese). [Google Scholar]
  36. Geng, Q.; Pan, G.; Zheng, L.; Sun, Z.; Ou, C.; Dong, H. Petrological characteristics and original settings of the Yarlung Tsangpo ophiolitic mélange in Namche Barwa, SE Tibet. Sci. Geol. Sin. 2004, 39, 388–406. [Google Scholar]
  37. Tan, H.; Zhang, Y.; Zhang, W.; Kong, N.; Zhang, Q.; Huang, J. Understanding the circulation of geothermal waters in the Tibetan Plateau using oxygen and hydrogen stable isotopes. Appl. Geochem. 2014, 51, 23–32. [Google Scholar] [CrossRef]
  38. Zhang, J.; Wang, X.; Dong, Y.; Xu, Z. Direct determination of trace germanium in river samples by CH4-Ar mixed gas plasma DRC-ICP-MS. Int. J. Mass Spectrom. 2017, 421, 184–188. [Google Scholar] [CrossRef]
  39. Bernstein, L.R. Germanium geochemistry and mineralogy. Geochim. Cosmochim. Acta 1985, 49, 2409–2422. [Google Scholar] [CrossRef]
  40. Froelich, P.N.; Hambrick, G.A.; Andreae, M.O.; Mortlock, R.A.; Edmond, J.M. The geochemistry of inorganic germanium in natural waters. J. Geophys. Res. Ocean. 1985, 90, 1133–1141. [Google Scholar] [CrossRef]
  41. Guo, C.; Peng, O. On the Relationship between the Specialty Set-Up of Secondary Vocational Education and Regional Industrial Structure in Tibet. Can. Soc. Sci. 2015, 11, 244–248. [Google Scholar]
  42. Baronas, J.J.; Hammond, D.E.; McManus, J.; Wheat, C.G.; Siebert, C. A global Ge isotope budget. Geochim. Cosmochim. Acta 2017, 203, 265–283. [Google Scholar] [CrossRef] [Green Version]
  43. Evans, M.J.; Derry, L.A. Quartz control of high germanium/silicon ratios in geothermal waters. Geology 2002, 30, 1019–1022. [Google Scholar] [CrossRef]
  44. Pokrovski, G.S.; Roux, J.; Hazemann, J.-L.; Testemale, D. An X-ray absorption spectroscopy study of argutite solubility and aqueous Ge(IV) speciation in hydrothermal fluids to 500 °C and 400 bar. Chem. Geol. 2005, 217, 127–145. [Google Scholar] [CrossRef] [Green Version]
  45. Burton, J.D.; Culkin, F.; Riley, J.P. The abundances of gallium and germanium in terrestrial materials. Geochim. Cosmochim. Acta 1959, 16, 151–180. [Google Scholar] [CrossRef]
  46. Aguirre, A.A.; Derry, L.A.; Mills, T.J.; Anderson, S.P. Colloidal transport in the Gordon Gulch catchment of the Boulder Creek CZO and its effect on C-Q relationships for silicon. Water Resour. Res. 2017, 53, 2368–2383. [Google Scholar] [CrossRef]
  47. Liu, B.; Kang, S.; Sun, J.; Zhang, Y.; Xu, R.; Wang, Y.; Liu, Y.; Cong, Z. Wet precipitation chemistry at a high-altitude site (3326 m a.s.l.) in the southeastern Tibetan Plateau. Environ. Sci. Pollut. Res. 2013, 20, 5013–5027. [Google Scholar] [CrossRef] [PubMed]
  48. Escoube, R.; Rouxel, O.J.; Edwards, K.; Glazer, B.; Donard, O.F.X. Coupled Ge/Si and Ge isotope ratios as geochemical tracers of seafloor hydrothermal systems: Case studies at Loihi Seamount and East Pacific Rise 9°50′N. Geochim. Cosmochim. Acta 2015, 167, 93–112. [Google Scholar] [CrossRef] [Green Version]
  49. Ding, T.; Wan, D.; Wang, C.; Zhang, F. Silicon isotope compositions of dissolved silicon and suspended matter in the Yangtze River, China. Geochim. Cosmochim. Acta 2004, 68, 205–216. [Google Scholar] [CrossRef]
Figure 1. Sketch map of the study area and sampling sites.
Water 14 00181 g001
Figure 2. The relationship between Cl and SO42− in mainstream waters.
Water 14 00181 g002
Figure 3. Correlations between dissolved Si and Ge (a), water temperature and Si (b), and water temperature and Ge (c) in hydrothermal waters.
Water 14 00181 g003
Figure 4. Spatial variations in Ge/Si ratio of the Yarlung Tsangpo River. (a) Relations between Ge/Si ratio and distance from the source; (b) Relations between Ge/Si ratio and elevation.
Water 14 00181 g004
Figure 5. Relations between Si and Ge (a) and TDS and Ge/Si ratio (b) of river water.
Water 14 00181 g005
Figure 6. The relation between Si and Ge/Si in river water. The line for global clean rivers is from [17]. Adapted with permission from ref [17]. Copyright 1992 John Wiley and Sons.
Water 14 00181 g006
Figure 7. Ge/Si ratio variation in time series river water samples in Xiangqu.
Water 14 00181 g007
Figure 8. The plot of discharge versus Ge/Si ratio in silicate weathering- and hydrothermal input-controlled rivers. Data of Boulder Creek streams is from [46]. Adapted with permission from ref [46]. Copyright 2017 John Wiley and Sons.
Water 14 00181 g008
Figure 9. Ge/Si ratio histogram of the Yarlung Tsangpo River and other typical basins. Data of Zaire River, Yukong River, Orinoco River, and Nelson River are from [16]. Data of Amazon River, Mackenzie River, Mekong River, Mississippi River, Changjiang River, Kern River, Santa Clara River, Madeira River, and Hondo River are from [23]. Data of Hong River is from [7]. Data on the Yellow River is from [9]. Data of Copper River is from [18]. Data of Central Nepal Rivers is from [30].
Water 14 00181 g009
Table 1. Chemical compositions of river and hydrothermal water in the Yarlung Tsangpo.
SampleAltitudepHTTDSGeSiGe/SiClSO42−
(m)(°C)(mg/L)(10−3 μmol/L)(μmol/L)(10−6 mol/mol)(μmol/L)(μmol/L)
Mainstreams
M736858.54131662.816317.1256440
M637388.64171560.61544.0228423
M538568.56201561.816910.6239392
M440018.65141600.91475.9288514
M344898.51131461.31459.1283495
M245678.7471212.414816.4268216
M146378.05101961.61878.61392303
M835528.56181171.21448.5198371
M931718.63171150.41312.9187377
M1029648.35191110.41064.0137312
M1129267.8315650.5945.167198
Main tributaries
MT136218.54141350.82842.9200
MT238908.32131053.317518.9127
MT345707.96131431.510613.9419
MT435589.01102331.0999.9172
MT527268.4110660.2393.965
MT629828.2213250.2702.655
MT736948.11171074.621921.1170
MT838078.39141700.71414.8200
MT939438.18201121.814512.4235
MT1045958.0261051.512411.8216
MT1139038.14241150.61773.6209
MT1245878.60101113.119915.4151
MT1343008.51101584.515029.7343
MT1437457.25151294.614531.6606
Small tributaries
ST132298.306540.3535.8201650
ST234448.0810270.2423.65844
ST327908.029510.1572.358174
ST433908.209560.3408.064124
ST530388.2912620.2552.866111
ST631647.9010380.0170.767124
ST733468.069400.1441.546102
ST827887.8510330.1502.65768
ST930208.339260.2573.45962
ST1031108.54101250.2682.665878
ST1133508.18131810.51493.21361043
ST1232978.2581090.4577.147245
ST1330367.559920.4676.158728
ST1428308.384670.1571.665179
ST1530327.9011750.32810.266196
ST1629617.6214310.1531.363103
ST1733457.989430.1255.65791
ST1829427.5914140.91366.34745
ST1933038.0711540.1651.047209
Hydrothermal water
HW145818.7245>200010259817011,099
HW245968.6843>20009974613313,797
HW345808.625315531218061517537
HW445767.9864189917412121444930
HW540607.2167>2000428138730826,169
HW644357.09448381429171553506
HW745118.015493212161819513,873
HW846218.7190>2000451218020715,819
HW945917.5471116034918801853914
HW1045568.0488109033117431902994
HW1138988.635332218114571241491
HW1243738.675286120312951575314
HW1350108.628690050029431704527
HW1439277.02651567533184029015,640
HW1542756.9949112420713701515669
Publisher’s Note: MDPI stays neutral with regard to jurisdictional claims in published maps and institutional affiliations.

